Thermal Imaging for the Archaeological Investigation of Historic Buildings

Department of History, University of Nottingham, Nottingham NG7 2RD, UK
Remote Sens. 2018, 10(9), 1401; https://doi.org/10.3390/rs10091401
Submission received: 2 August 2018
/
Revised: 23 August 2018
/
Accepted: 27 August 2018
/
Published: 3 September 2018
(This article belongs to the Special Issue Advances in Remote Sensing for Archaeological Heritage)
Abstract
:A significant problem in understanding the archaeology of standing buildings relates to the proscription to uncover features and structures within plastered and rendered walls due to the susceptibility and historic importance of such structures. Infrared thermography offers a method of visualization that is nondestructive and capable of revealing various types of archaeological anomaly that has been demonstrated on a small scale in the past. A passive infrared thermal camera is used to examine several historic buildings that are known or suspected to contain hidden archaeological information; the technique is also presented on complex, exposed historic building fabric. The results confirm that it is possible to detect various types of man-made anomaly and to differentiate building materials. In consequence, the use of passive thermal infrared imaging is shown to be a valuable tool in the examination and recording of historic buildings and structures.
1. Introduction
The purpose of this paper is to present an overview of thermal infrared imaging in a current context for the elucidation of discrete and hidden archaeological features in historic buildings and structures; new case studies are presented to illustrate the methodology and value of this technique.
Ground-based remote sensing (GBRS) techniques have been developed since the 1980s as a series of tools to assist with the non-destructive recording of historic buildings both for research and during essential recording. The advantages of remote and non-destructive examination of buildings are twofold: data may be obtained without damage to the historic fabric, and information may be collected that no other technique is capable of extracting.
The toolkit comprises a range of methods including, most commonly, multispectral imaging, laser scanning and laser surface profiling, surface saturation illumination, ultraviolet fluorescence, and thermal imaging [1,2,3,4]. Many of these techniques, and developments of them, are still under research and are therefore comparatively new in a built heritage context, although thermal imaging was first introduced for archaeological buildings research in the 1970s [5,6] but is, however, comparatively rarely used other than for conservation purposes and condition inspection [7,8,9,10].
Some work was undertaken in the 1990s using thermal imaging for archaeological data extraction [11], but little has been published. The technology available until relatively recently in the early 21st century was unwieldy, expensive, and offered comparatively poor spatial and radiometric resolution. In the past ten years the development of lightweight, medium and high spatial resolution, portable colour thermal imaging cameras has enabled the development of this methodology in archaeology and conservation.
Thermal radiation plays an important role in thermodynamics because it is through thermal radiation that two bodies, not in contact with each other, can exchange heat. An object radiates an amount of energy due to the vibration of the molecular covalent bonds of the substance from which it is composed. Energy is emitted in the form of discrete quanta, or photons. Each photon has energy Eph equal to its frequency fph multiplied the Planck’s constant h and as energy is inversely proportional to the wavelength λ, with a velocity c in a given medium, we are given:
The magnitude of emitted radiation depends on the temperature and on the characteristics of the emitting surface. In reality, the electromagnetic energy detected by an infrared imaging camera Et includes the total energy emitted by the object Eo and the reflected energy coming from the surroundings Er plus the energy emitted by the atmosphere Ea [12]:
where ε is defined as the emissivity—the ability of a surface to radiate infrared radiation calculated using a ratio of surface radiative ability, at set temperature, and the radiative ability of a blackbody under the same environmental conditions—and τ is transmittance, the ratio of the transmitted light to the incident light, in respect of infrared radiation. However, these values are not easily measured. Depending on the surface characteristics and the composition below the surface, the energy striking an object can be absorbed, reflected, or transmitted [13,14,15,16]. In practice, when examining the walls of historic buildings for archaeological features located below the surface, it is normally a combination of absorbed and transmitted energy that is of key interest; however, the reflection component is important when studying exposed wall surfaces in order to differentiate between contrasting types of building material.
For thermal imaging systems, measurements are performed within limited spectral ranges, typically in the region of 7–14 µm which has low atmospheric absorption. Although the ideal value of emissivity is taken with reference to a blackbody radiator, in practice it is normally possible to treat historic building targets as greybodies (where the monochromatic emissivity of the body is independent of wavelength; monochromatic emissivity being defined as the ratio of the monochromatic emissive power of the body to the monochromatic emissive power of a blackbody at the same wavelength and temperature) despite typical emissivity values for historic building materials (plaster, stone, and timber) having high emissivity values, >0.8 [17]. The result is termed “apparent emissivity”, εapp, which is defined by adding an apparent emissivity increment caused by the non-isothermal surface into the true emissivity which may be independent of viewing angle and wavelength thus:
In an infrared image, for a flat pixel composed of N homogeneous subelements k, where T0 is the reference temperature that is independent of viewing direction and wavelength, ΔTk is the temperature difference between the temperature of the subelement k and the reference temperature T0. θ and φ are the viewing zenith and angle, respectively. αk is the relative area of a subelement k where the sum of all αk is unity, and thus εk(θ, φ) is the emissivity for each subelement k [18].
This is of considerable significance as undertaking thermography, or indeed any other ground-based remote sensing method, in historic buildings is far from the near ideal conditions afforded by a laboratory. Targets are typically out of easy access and have a complexity of environmental inputs, thus being able to effectively disregard viewing direction is of appreciable advantage.
In order to determine accurately the apparent emittance Eap of building targets and backgrounds it is necessary to determine the conduction of heat within the target and the heat exchange in the surface atmospheric boundary layer: to quantitatively evaluate the behaviour of ΔEap in a given situation, the following must be understood:
- the physical processes involved in creating a radiation contrast
- the parameterization of these processes
- the analysis of sensitivity within the system
Several heat and mass transfer mechanisms are at work when making thermographic observations, the most important of which are:
- absorbed long and short wave irradiance
- convective heat exchange
- target emittance
- latent heat exchange by condensation/evaporation
- internal heat sources and/or sinks
- heat conduction in the target
Thus, the key issue is the magnitude of these effects relative to the thermal emission signal [19]. The thermodynamic response of a target wall and especially surface temperature change, is determined by the physical properties of the construction material and its surface characteristics. This latter point is especially important when examining plastered or rendered walls to determine if features concealed by the surface material may be detected. Values of properties for common historic building materials are given in Table 1.
In thick, mass built, historic walls the internal or innermost boundary is often at constant temperature or constant moisture content and has only a small direct influence on the surface temperature. In addition to conduction of heat through the wall fabric, heat is also transported by moisture and vapour movement, and the transfer of heat and moisture (rain, condensation, and evaporation) from and to the surface through the atmospheric-surface boundary layer is the other important transport mechanism. The net heat and moisture flow in the surface-atmospheric boundary layer is found from the heat-balance and moisture-balance equations, respectively, but in practice this cannot easily be measured. Thus, quantitative analysis of the transport coefficients becomes prohibitive, for example when considering historic rubble filled walls with inner and outer skins of coursed rubble stone, and where the outer (or visible) surface is coated with plaster and limewash, the whole target may be considered to be a semiporous system where the transport of water and water vapour, associated with a transfer of latent heat, must be considered as a quantitative factor. If the magnitude of the indirect effect is very small relative to the surface temperature, normally the case in detecting archaeological features (i.e., man-made), then a more practical approach is to use a thermal inertia model, or Delta-T metric [21]. Maldague [22] gives a contrast function called the Standard Contrast (Cs), given by equation (4),
where Cs(t) is the ‘Standard Contrast’, Ti(t) is the temperature of the anomaly at time t, Ti(t0) is the temperature of the anomaly at time t0, Ts(t) is the temperature of the anomaly free area at time t, Ts(t0) is the temperature of the anomaly free area at time t0, and t0 is the start time (beginning of the cycle). An anomaly is defined in this context as a man-made feature within the building structure which may include: former openings, alterations in construction, structural supports, hidden decoration, and so forth.
The Delta-T metric—the temperature of the region incorporating anomalies minus that of the anomaly free region—is then given by Equation (5) [23],
where C(t) is the ‘Running Temperature Contrast’, Td(t) is the temperature of the anomalous area at time t, Tnd(t) is the temperature of the anomaly free area at time t, and T(t) is the sample excess temperature (evolution of the sample temperature during heating phase).
Furthermore, when considering heat transport in historic buildings, there are multiple external thermal radiation issues to consider: solar radiation, both direct and diffuse; artificial heating systems within buildings such as radiators, overhead heaters, underfloor heating systems, and so forth; and cooling effects resulting from inefficient insulation—almost universal in premodern structures and highly complex to classify [24,25,26,27].
Historic walls, unlike modern buildings, do not have an exact predictable internal structure and normally contain random voids which inhibit moisture flow and hence heat transport. For these reasons, along with large unknowns and variables in respect of moisture content, quantitative interpretation of thermography in the elucidation of hidden archaeological evidence is fraught with difficulty. However, quite often the qualitative nature in the visualization of the imagery allows effective interpretation to be performed. Figure 1 shows the east wall of the 18th century mausoleum extension to Averham church, Nottinghamshire, UK with both undefined archaeological anomalies and evaporative cooling due to moisture retention.
The principal aim of thermographic examination of historic buildings in this context is to reveal archaeological anomalies, either hidden below surface coverings or within complex building fabric, which are either indiscernible or not readily apparent to the unaided eye. These anomalies may be discrete features, building fabric changes, or both. It is one method amongst several that may be utilised for this purpose, and there is considerable advantage in combining thermal imaging with other remote sensing techniques.
2. Materials and Methods
For the present work, a FLIR E8 thermal imaging camera was employed. The instrument is robust and lightweight and can thus be used to great effect in the field. The camera uses an uncooled microbolometer sensor measuring between 7.5 and 13 µm with an infrared spatial resolution of 320 × 240 px. Various interactive imaging options are available, including merging with a visible image captured by an integral conventional digital camera.
All imagery in this work was captured passively, without any artificial heating, and thus records the infrared signatures derived wholly from prevailing environmental conditions. However, care was taken not to acquire imagery that was clearly being irradiated either by solar thermal energy or by local artificial sources.
For practical purposes the resulting imagery requires digital processing in order to extract the maximum amount of useful information. In this research images are treated as remote sensing data and are processed using a wide range of mathematical tools in similar manner as for aerial thermal infrared and related forms of remote imagery. Usefully, the image may be extracted into csv format and imported into MATLAB and ImageJ for analysis. The proprietary software FLIR Tools and the open-source tool ThermoVision [28] are also employed for initial image appraisal and Delta-T metric calculations; these are especially useful as they allow for direct import of FLIR file format without the need for image conversion or to extract a raw data file.
In practical terms, for local preprocessing, the data array is imported into the relevant software as a 32 bit (float) image and, due to its inherently low spatial resolution, resized using standard image interpolation methods or, when several images have been captured, by using super resolution. The resulting image has therefore a greater number of pixels on which to perform further mathematical analysis, though no improved signal resolution, the purpose being the up-sampling of the signal for improved graphical representation [29]; Bicubic and B-spline methods have been determined to yield the most feature-preserving results [30,31,32].
In order to preserve the temperature data, the image is next processed using a dynamic look-up table (LUT) that assigns varying colour values to specific temperature ranges. The result is a visually enhanced representation that retains accurate qualitative thermal measurement.
The imagery is further analysed using visual enhancement filters and statistical clustering techniques. The two most commonly employed are Wallis filtration that yields an adaptive histogram equalization, and clustering as a means of identifying homogeneity among patterns in the same cluster and heterogeneity of patterns in different clusters in order to discover specific regions of interest based on sets of temperature range values. Other researchers have used different approaches to visualization in the analysis of thermal infrared imagery for conservation such as Danese et al. who constructed a self-organizing map (SOM), a neural network that preserves topology and similarity patterns [33,34].
The Wallis filtration acts to enhance the radiometric properties of the imagery by means of dynamic contrast enhancement, utilizing the Gauss smoothing operator in the calculation of mean and variance of local grey value [35], its function is given by Equations (6)–(8):
where
where:
and:
where r1 is a multiplicative parameter and r0 is an additive parameter. If r1 > 1, the transformation becomes a high pass filter, and if r1 < 1, the transformation is a low pass filter. mg expresses the grey scale mean of image in a discrete area of a pixel. sg can be called the AC component of image signal, which means the grey scale variance of an image in a certain area of a pixel. g(x, y) and f(x, y) are the original image and the filtered image mf is a target value of grey scale mean, and it must be a median of the dynamic image range. sf is a target value of grey scale variance, and it determines the contrast of image. c is a contrast expansion constant of image, c∈[0,1] it should increase with the window increasing in the process. b is an image intensity coefficient [36,37]
Clustering [38,39] is normally undertaken as unsupervised and for initial appraisal based on the k-means clustering algorithm, a region based, group distance approach which uses a centroid of distribution as the base of the cluster; this is particularly useful for thermographic data in archaeological survey which normally has a large number of environmental variables, and when in setting up a recognition system, the characteristics of targets, and in particular their most important parameters, may well be unknown, and it is useful to gain some insight into the nature of the data through a hybrid qualitative–quantitative visualization. The usefulness of k-means analysis has been demonstrated in defect identification using thermography [40]. Complete details of the k-means algorithm are given by MacQueen [41] and by Hartigan [42] but in essence where cj is the centroid of cluster j with 1 ≤ j ≤ K:
If pattern yi is assigned to cluster j, then we set I(yi, cj) = 1, otherwise we set I( yi, cj ) = 0. The purpose of k-means is to minimize the sum of all distances between cluster centers c1, …, cK and patterns y1, … yN, which is given by [43]:
This basic analysis of the data may be followed by further, specialist image analysis according to the potential features revealed in the imagery.
For the calculation of quantitative coefficients based on the materials under observation and thermal and environmental outputs the open-source mathematical simulation software Modelica is utilised [44,45]. The Buildings and Building Systems libraries provide the ability to construct heat flow models and to predict values of thermal resistance, thermal transmittance, heat flow, and incoming and outgoing radiosity.
The historic buildings selected for study are largely based on a pre-existing model which has been rigorously studied, comprising historic churches, with a select number of secular buildings, in the county of Nottinghamshire, U.K. [1]. This model has, in the past decade, been expanded to encompass a major research project in the same region that is seeking to complete intensive research into every historic church within the same county [46]. Some archaeological findings from thermographic surveys have already been integrated with this project [47,48].
3. Survey Results
Four examples of thermal infrared imaging survey are presented here to reflect the differing types of archaeological anomaly that occur in historic buildings and which may be detected by this technique. The examples also illustrate the complex nature of the targets and the varying environmental factors at play.
3.1. Winkburn, Church of St John of Jerusalem, Nottinghamshire, U.K.
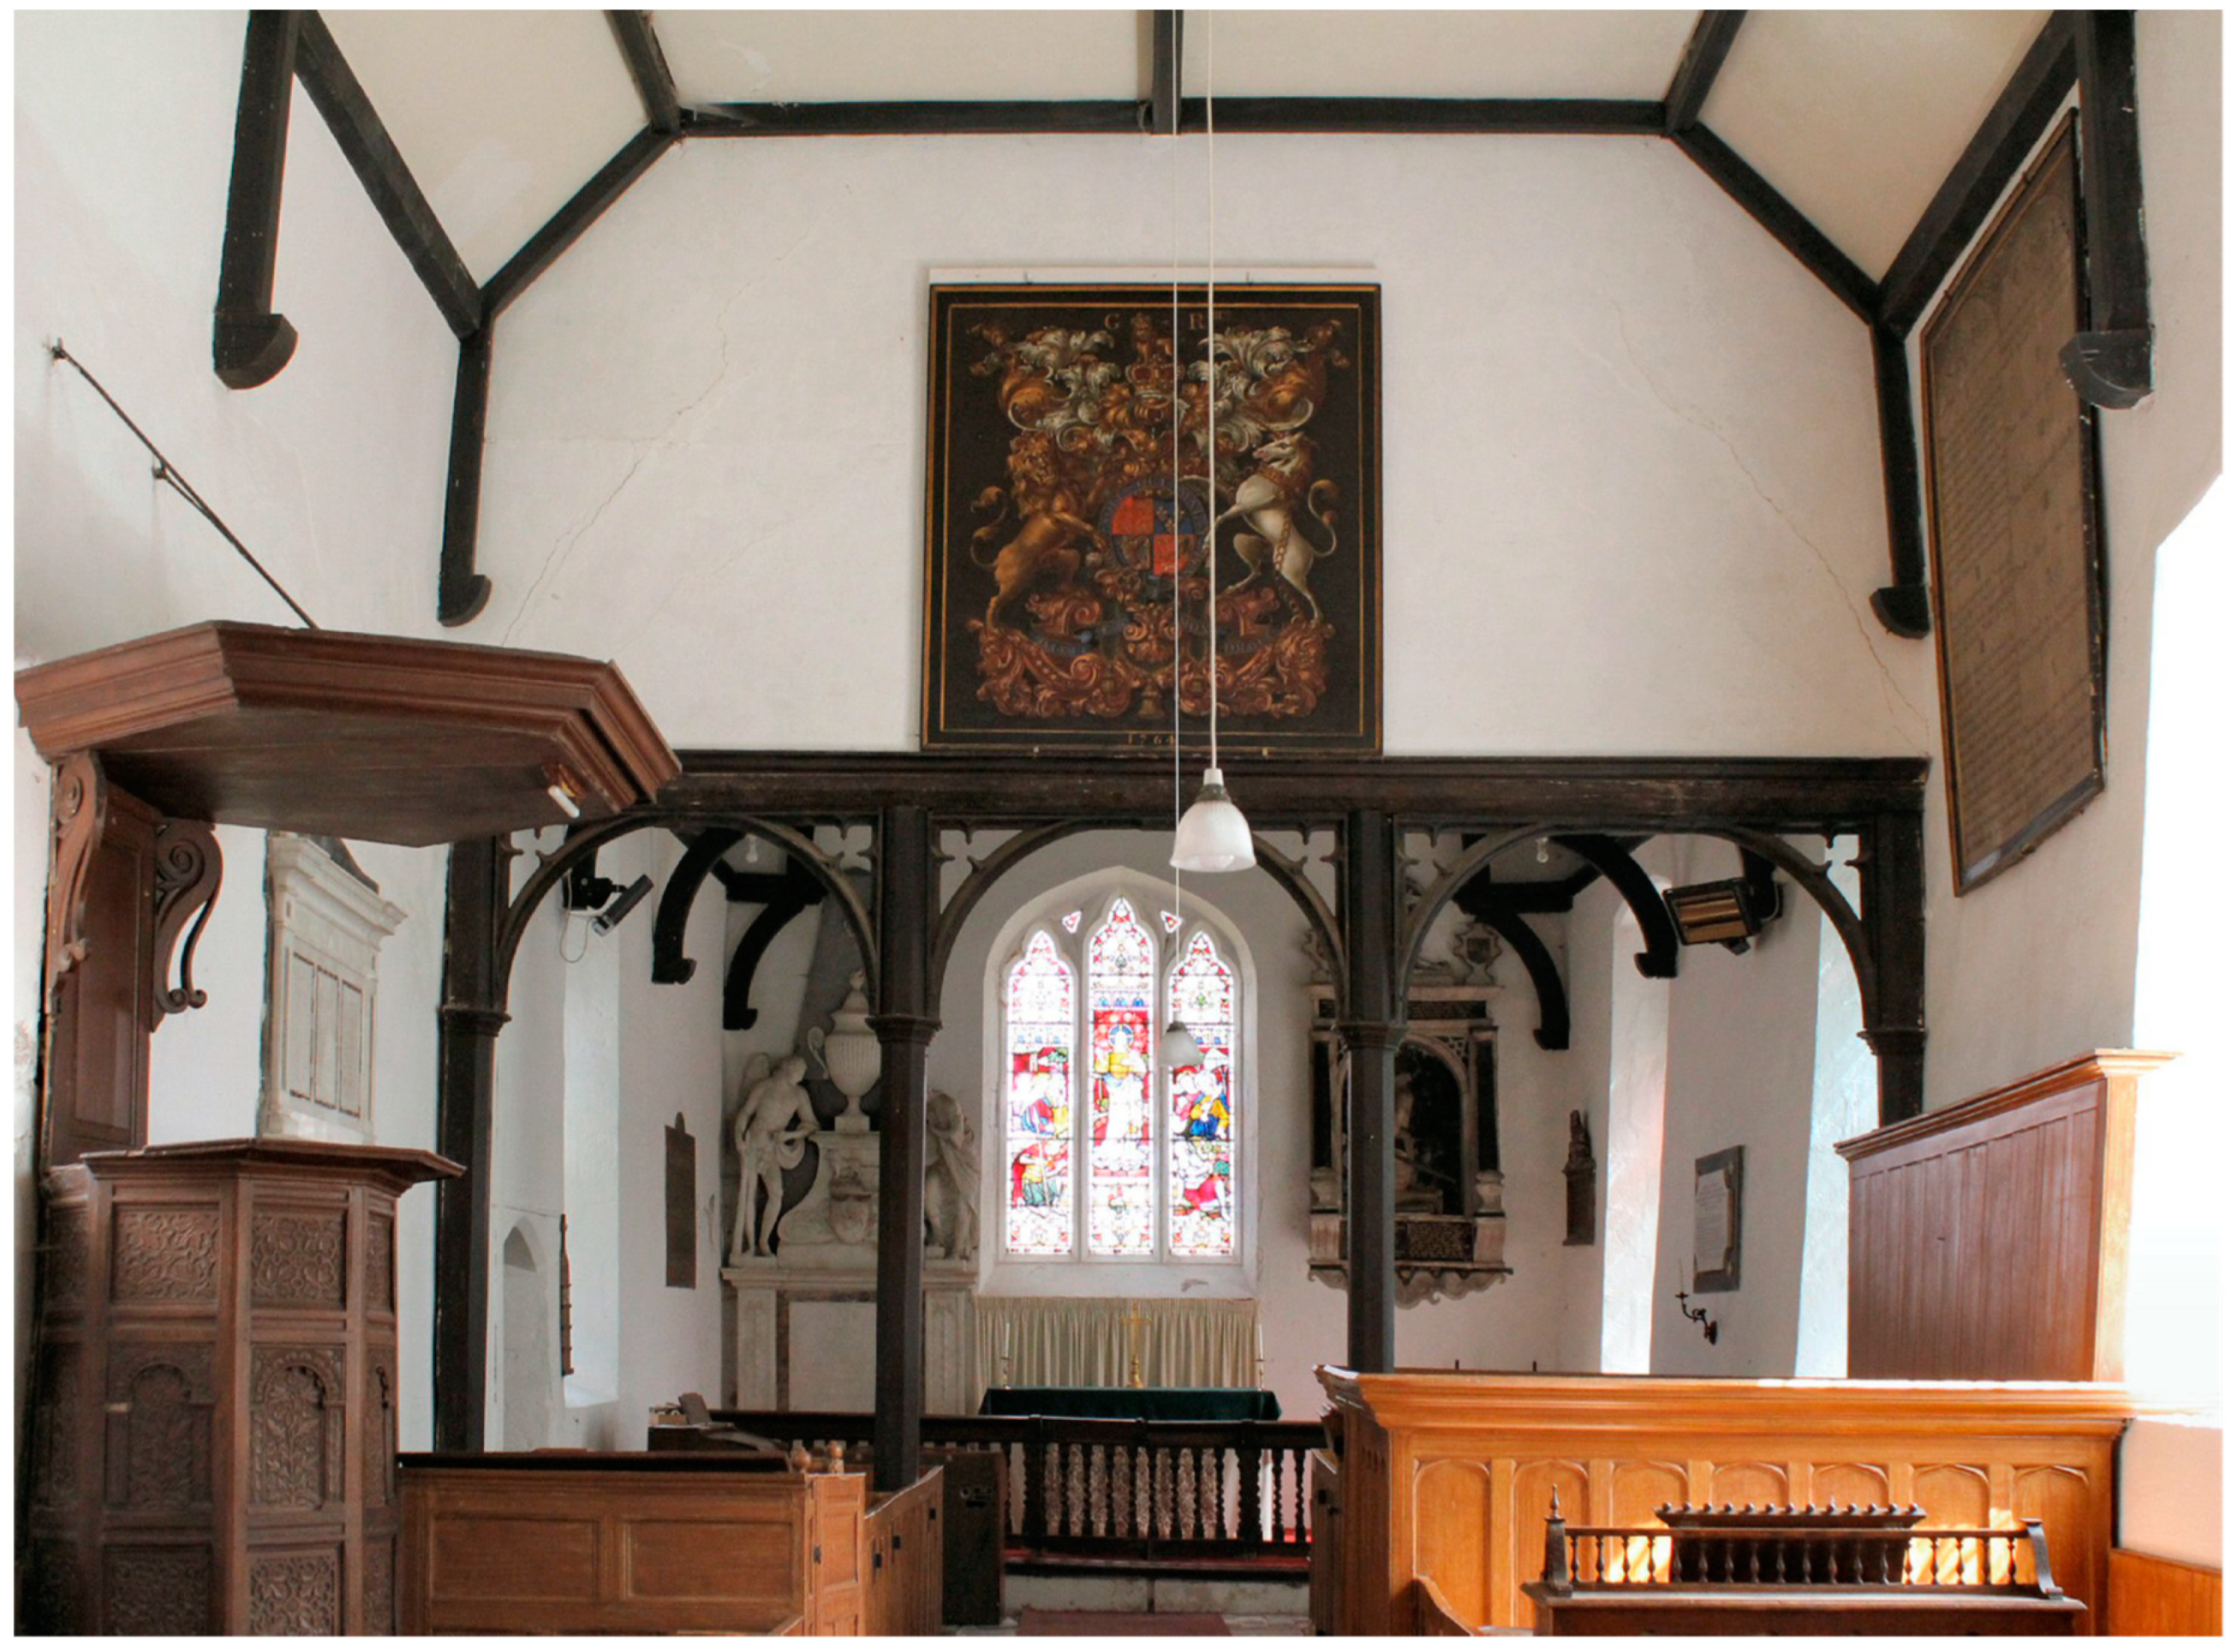
The historic church at Winkburn comprises nave with south porch, chancel, and west tower. The body of the building appears to be all of mid 12th century date, though with later alterations in the 14th, 15th, and 18th centuries, however, unusually it escaped a severe 19th century restoration which normally occurred in buildings of this type. Also unusual is the fact that there is no dividing arch between the nave and the chancel; the interior fittings are of the 17th and 18th century and it is hypothesised that the arch was removed in the 17th century when the building was evidently refitted internally. In place of the dividing arch a wood and plaster screen has been installed (Figure 2).
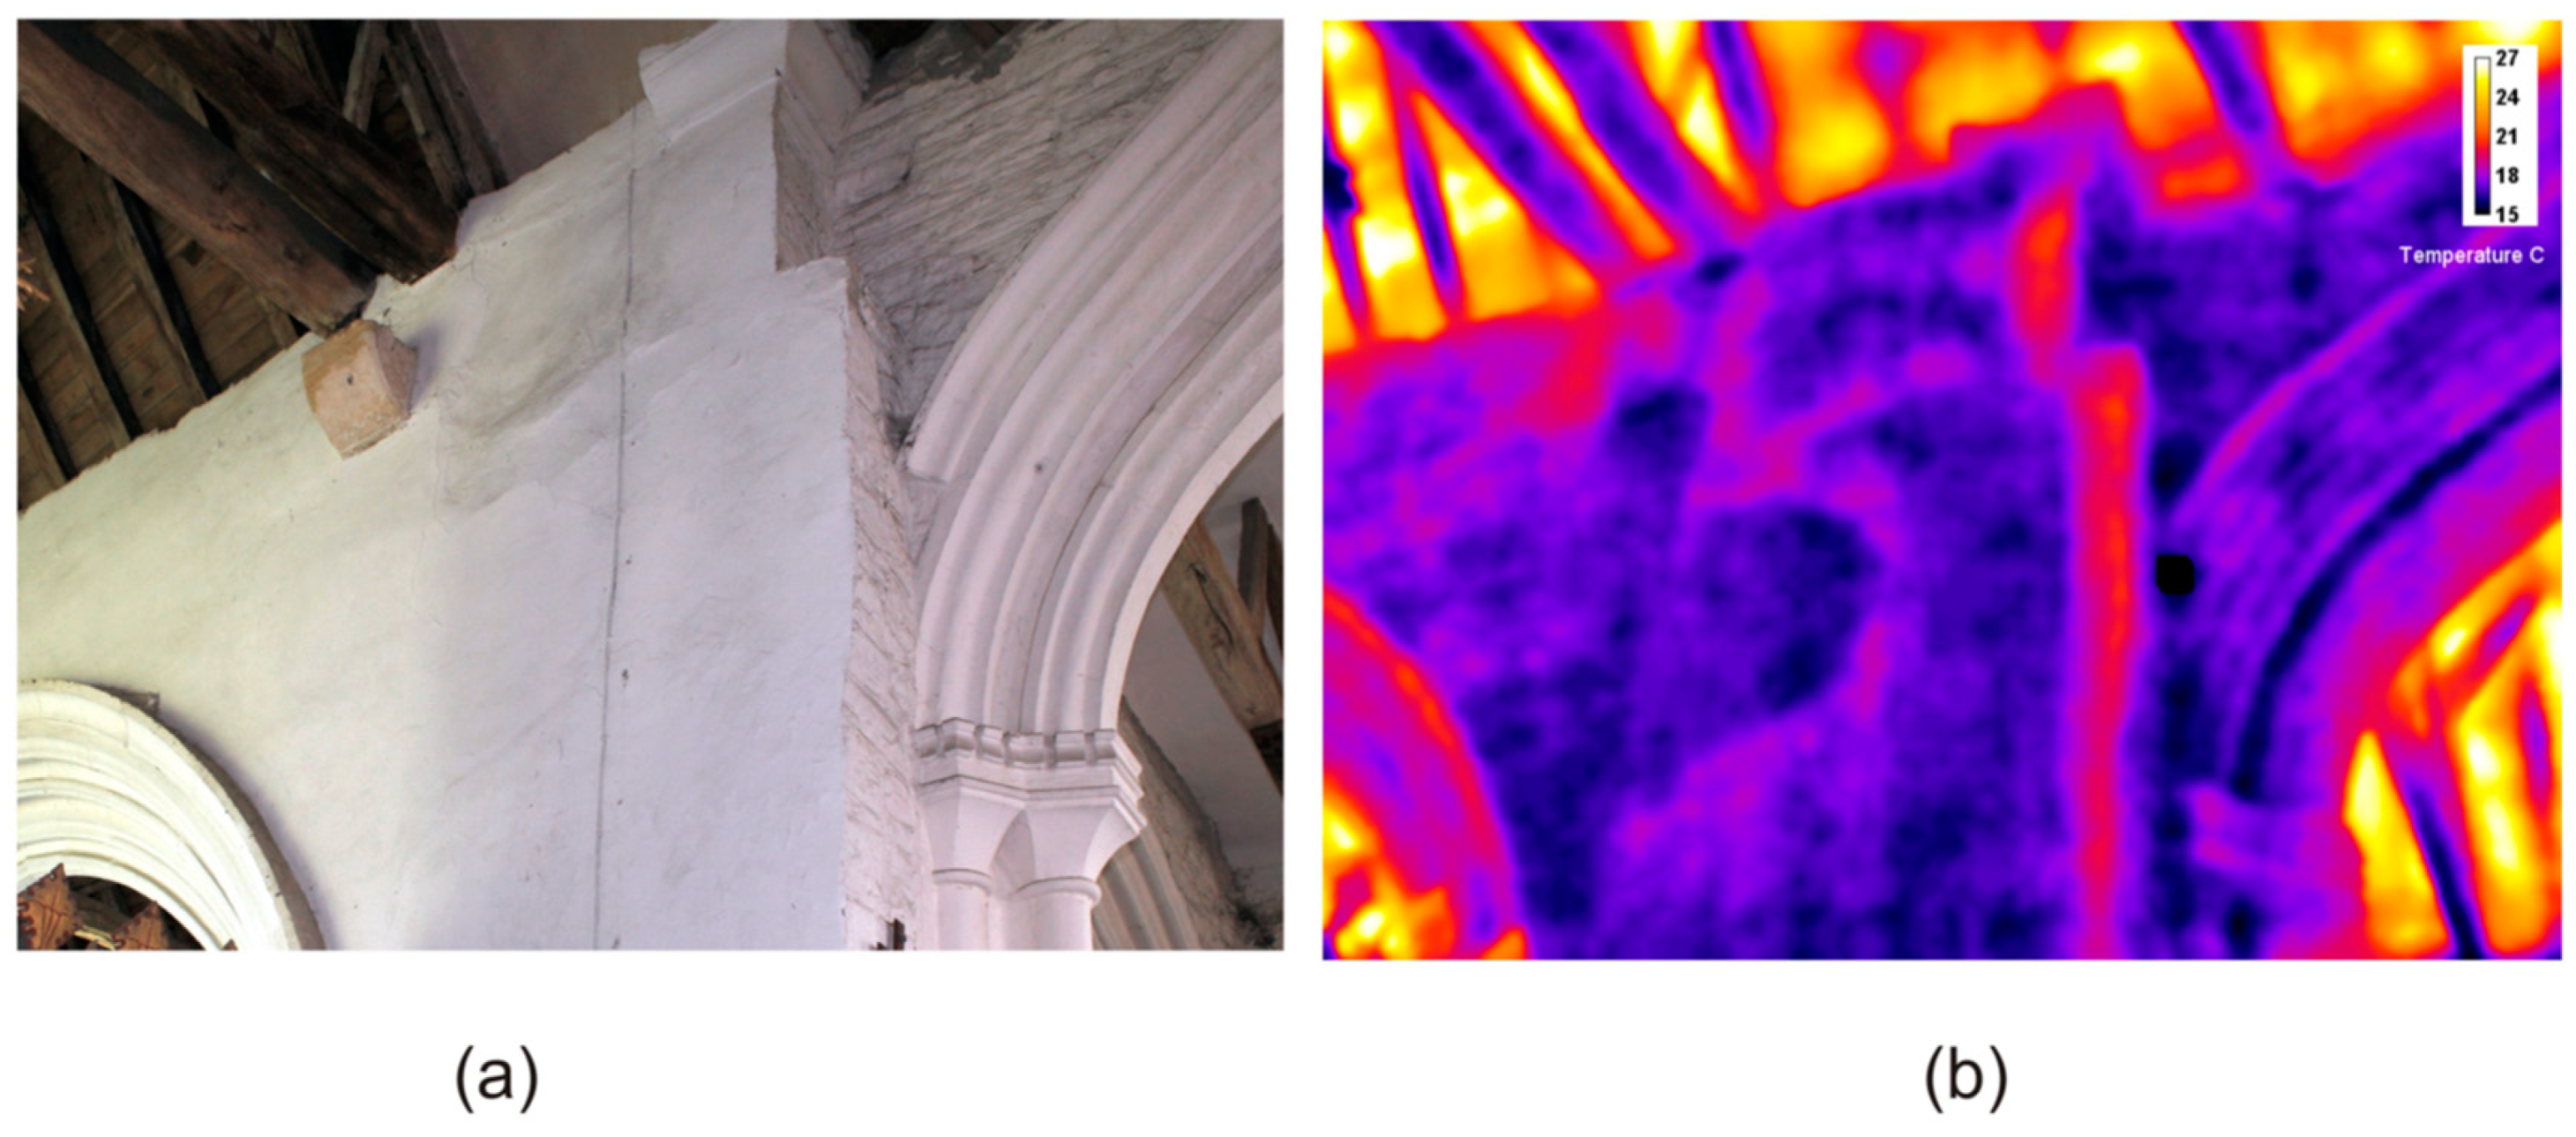
The east and west faces of the screen were examined thermographically to determine if the internal structure could be discerned. Four separate surveys were made under differing conditions of atmospheric temperature, humidity, and time of day, and the results are uniformly consistent. Figure 3 shows the east side of the screen where the buried internal support structure of the plaster screen is very clearly discernible in the thermal image and it conjectured that this is a wooden “former” that was created to hold the smooth plaster upper part of the screen in place; its style indicates a date in the 17th or early 18th century. The west side of the screen is partially obscured by a coat-of-arms but the internal support structure was also visible on the observable areas of this elevation in the thermal infrared.
This is an extremely valuable process as the screen is of considerable cultural heritage value and cannot be physically damaged in order to determine the interior composition. Not only does it reveal the structure for archaeological purposes but it also informs conservators how best to approach any stabilization or cleaning work required in the future.
3.2. Holme-by-Newark, Church of St Giles, Nottinghamshire U.K.
The church of Holme-by-Newark is a complex mix of periods from the 13th to the 18th centuries [49] (Figure 4). The division between nave and chancel also has no arch but has clearly been heavily restored with considerable work undertaken in AD 1932. On the south side of the area where the arch must once have been is evidence of a former rood loft, a common feature in medieval churches which often comprised a narrow stair leading to a small gallery or platform between nave and chancel that was used in the medieval liturgy [50]. The evidence is slight, taking the form of an irregular projection from the wall, capped by a carved, square stone.
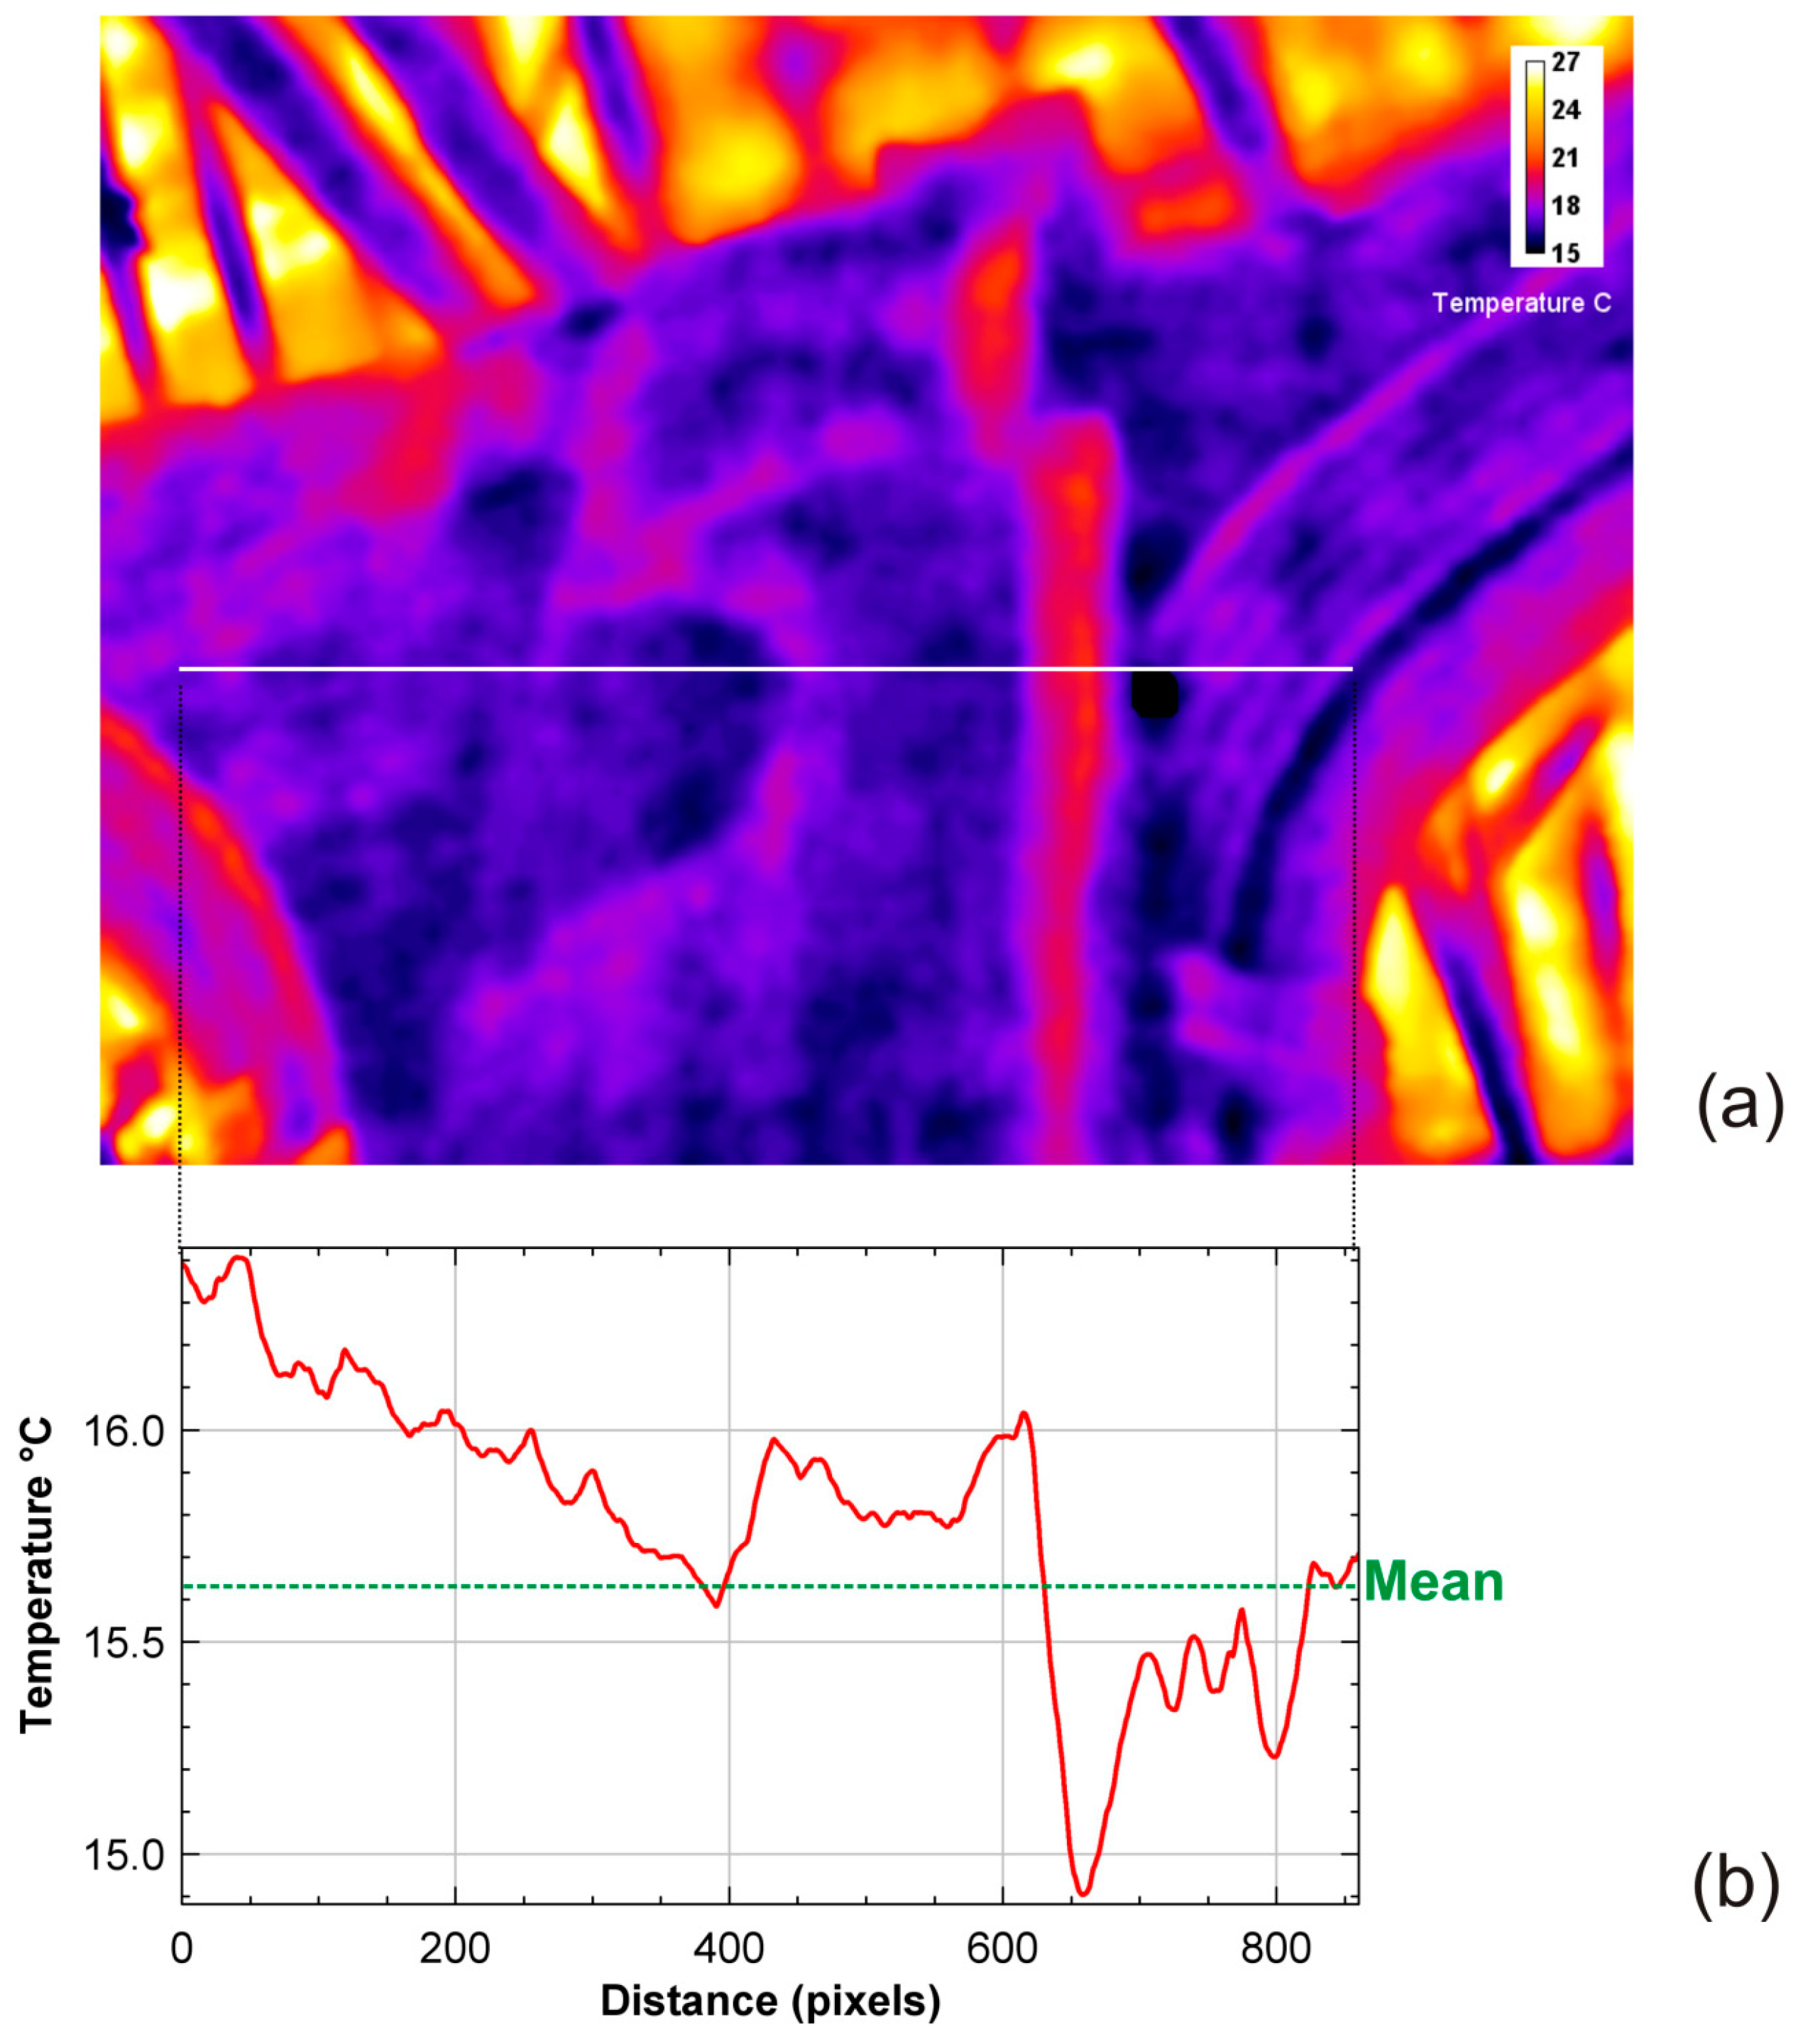
The wall was examined with thermal imaging to ascertain if any further evidence or either the stair or loft could be elucidated. The results presented here are from a single survey. Figure 5 shows the upper area of the junction wall. A complex of anomalies, not apparent under normal visual conditions, is evident. Figure 6 illustrates a linear plot across the centre of the image revealing the variation in temperature within and between the revealed features. There are striking differences between the mean background at 15.62 °C and the lowest and highest thermal zones. The lower temperature anomalies are probably due to voids within the wall matrix which allow more efficient dissipation of thermal energy, however Holman [51] observes that the problem of contact-resistance due to void spaces is highly complex due to the widely varied nature of the actual surface conditions encountered. Nevertheless, the qualitative interpretation may indicate the presence of a blocked stair and upper doorway in this region if voids are present.
3.3. The Saracens Head Inn, Southwell, Nottinghamshire, U.K.
The late medieval coaching inn, now called the Saracens Head, is a part timber framed construction dating from the late 15th century through to the modern era. It has been the subject of several historic building studies [52,53] and currently forms part of a community archaeology group analysis. As part of this latest survey, thermographic imaging was carried out on a section of half-timber and plaster wall forming a bridge linking the north and centre ranges of the inn. Some timber is visible to the eye but it was unclear as to the true extent of timbering beneath the plaster.
Figure 7 shows the west face of the bridge. The extent of the concealed timberwork is strikingly evident in the thermal image, along with some horizontal laths around the central window and to the right of the image. The survey was undertaken on a cool winter day with external atmospheric temperature averaging 10.6 °C and internal heating switched on inside the building (averaging > 20 °C) which has helped facilitate the contrast. The average apparent thermal emission from the areas of timber is 5.4 °C based on 10 samples.
Prior to this analysis the bridge was thought only to contain minimal timbers, around the small window visible in Figure 7a part of which are evident in the interior. However, it is now clear that the whole structure is timber framed in similar manner to other parts of the medieval building.
3.4. Kelham, Church of St Wilfrid, Nottinghamshire, U.K.
The church of Kelham is largely a rebuilding of the late medieval period, c. AD 1475–1500 with typical Perpendicular style architecture [54]. However, the lower north wall of the chancel appears to have survived from an earlier period, stylistically 13th century. Previously this wall had been covered by vegetation, the remnants of which are still visible, but it has now largely been cleared allowing a detailed visual survey.
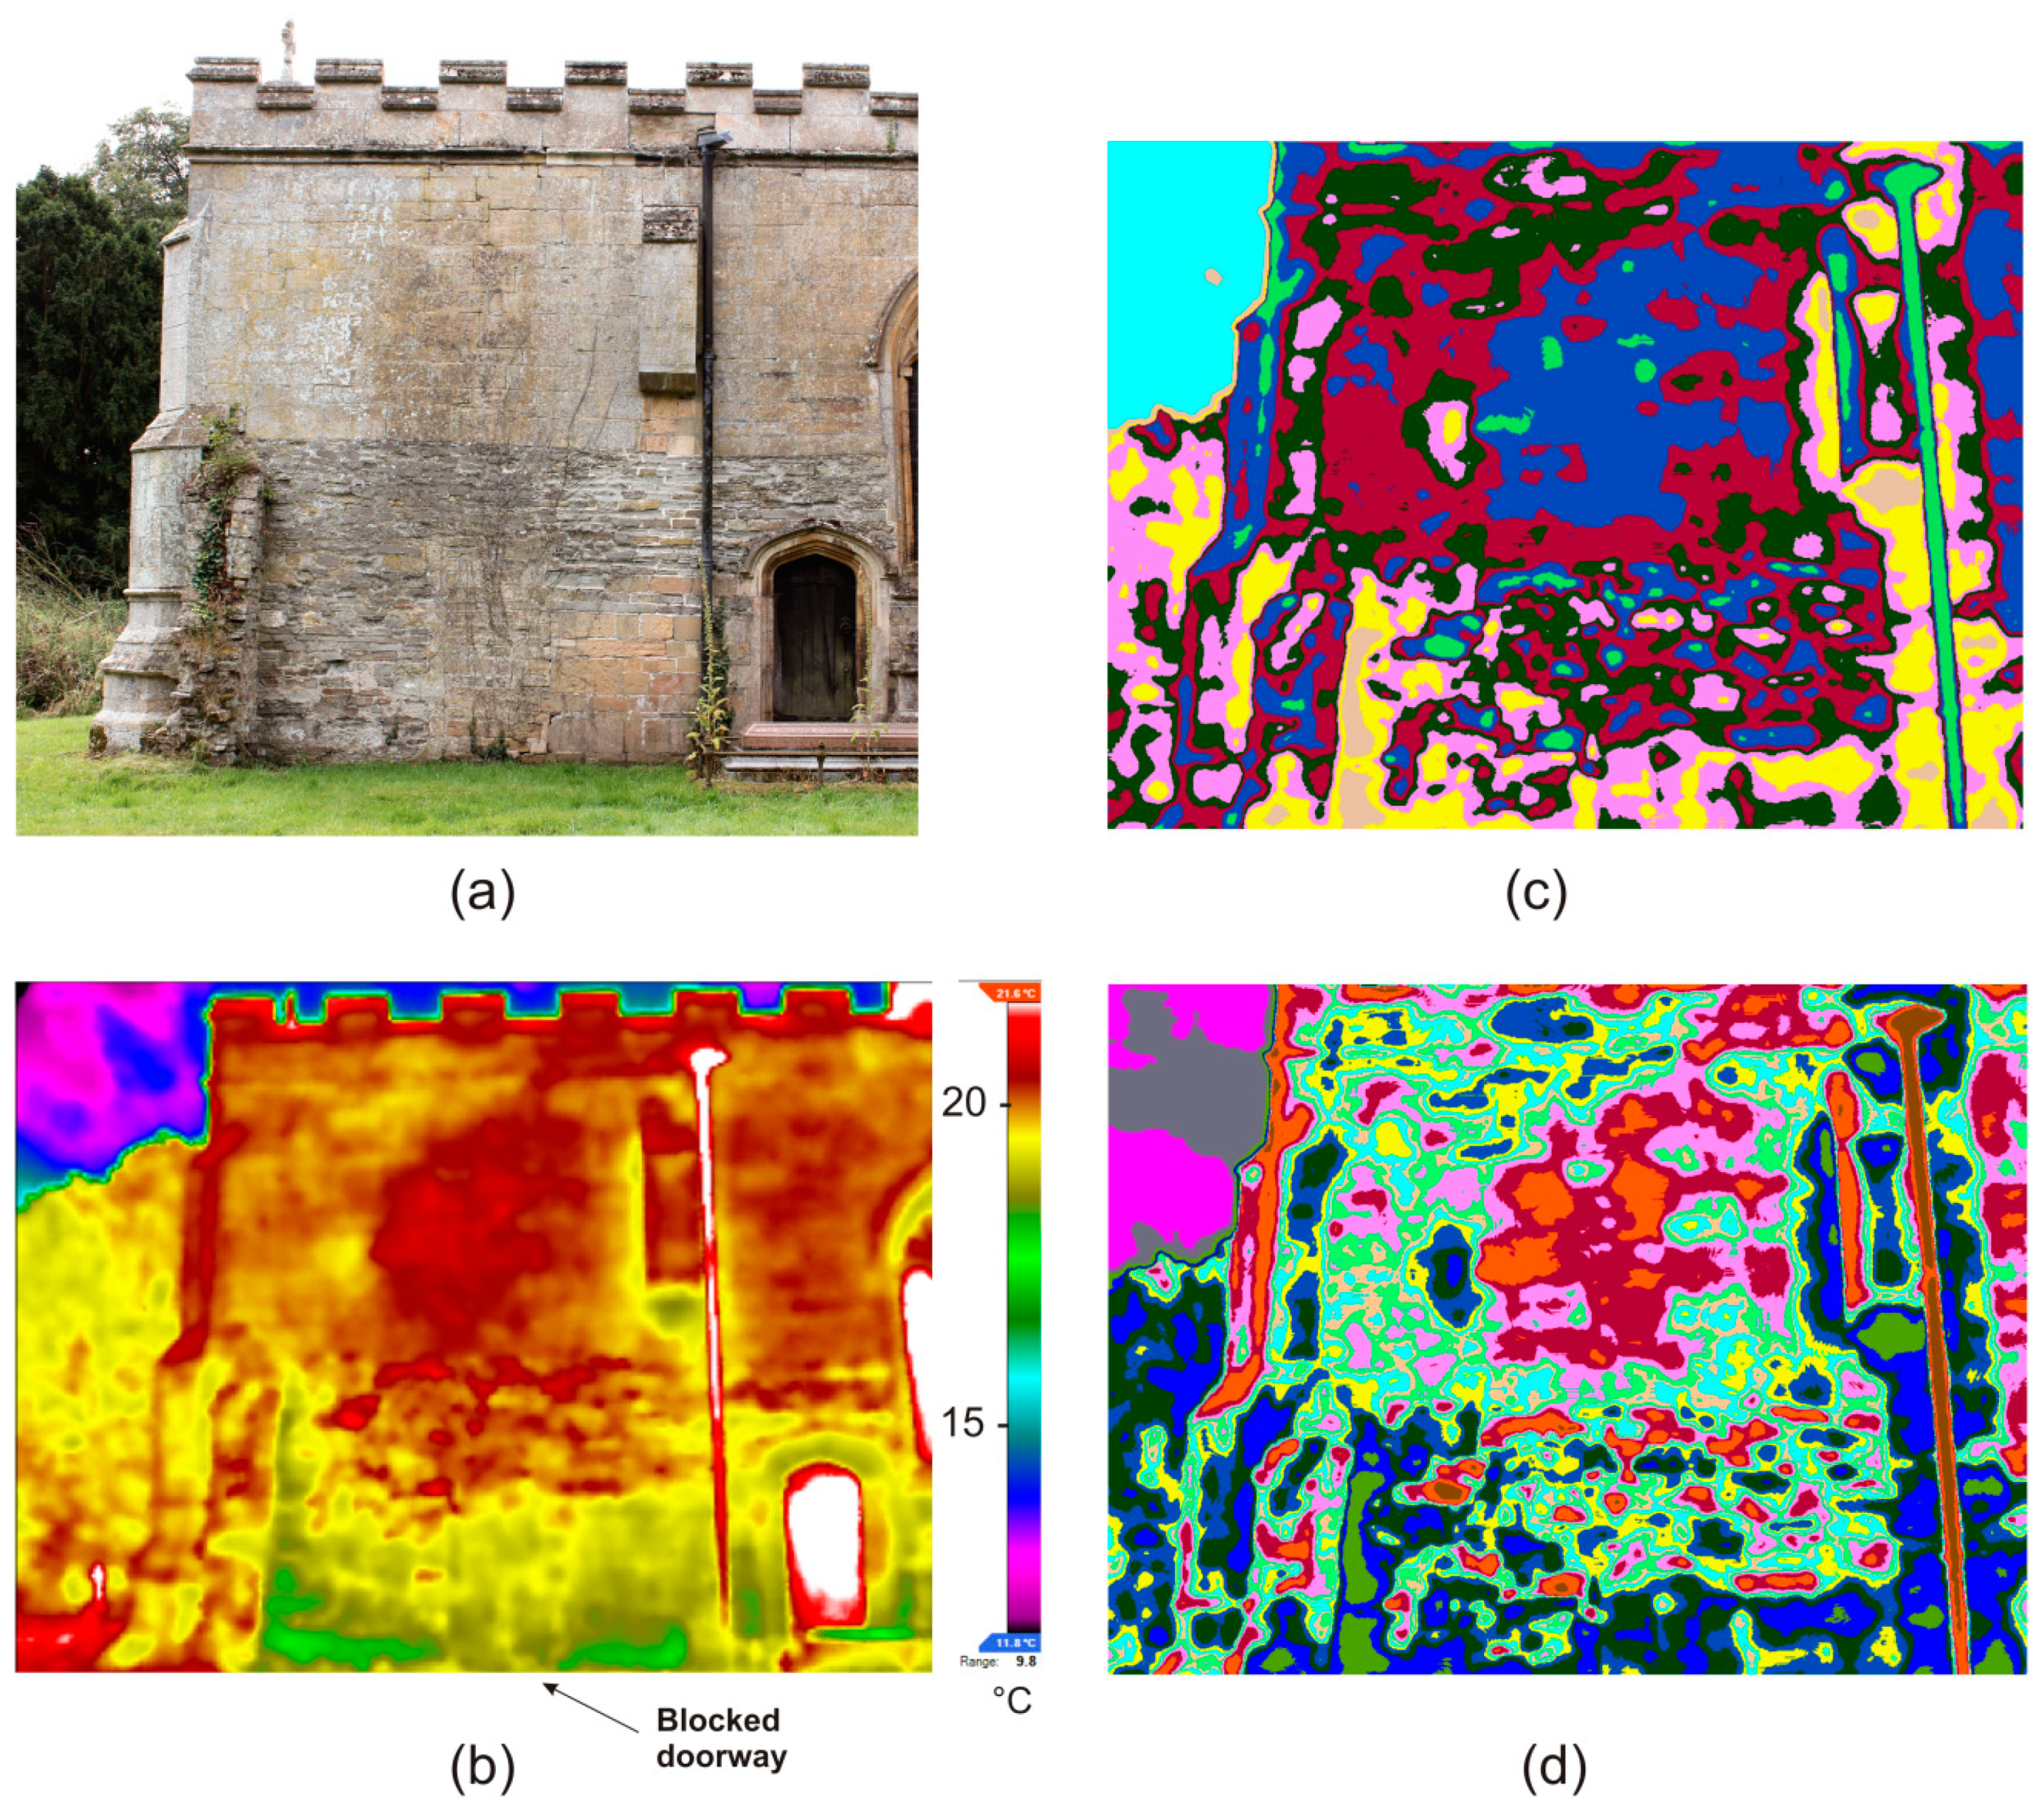
In addition to multispectral imaging, thermal infrared was employed to determine if anomalous areas of stonework and differing types of geology would be delineated. The results are revealed in Figure 8 which shows the infrared signatures across the exposed stone wall and two levels of statistical image clustering. The apparent thermal range is 17.6 °C to 22.1 °C over the whole target, and a mean temperature of 19.6 °C; the ambient atmospheric temperature was measured at 20.8 °C with relative humidity 46%. Emissivity was set in the instrument at 0.95 which is the value given for limestone, the material that makes up the majority of the target wall.
It is immediately evident that the thermal infrared is showing significant differences in combined reflection and emission, as shown in Figure 8b, some of the differences may be accounted for by the presence of sandstone which has a slightly lower emissivity of 0.93 [16,55], furthermore, weathering appears to affect emissivity values in natural stone [56,57], however, even within the majority limestone areas there are clear differences. Further analysis using k-means clustering illustrates the complexity in the thermal image from this target. One archaeological anomaly is revealed very clearly in Figure 8b, a blocked doorway, partly visible to the eye in the centre of the main wall, illustrated by an arrow, whilst other, small anomalous regions are probably the result of slight differences in colour that result in lower or higher absorption of solar radiation; though it is to be noted that the target is on the north side of the building and receives no direct sunlight.
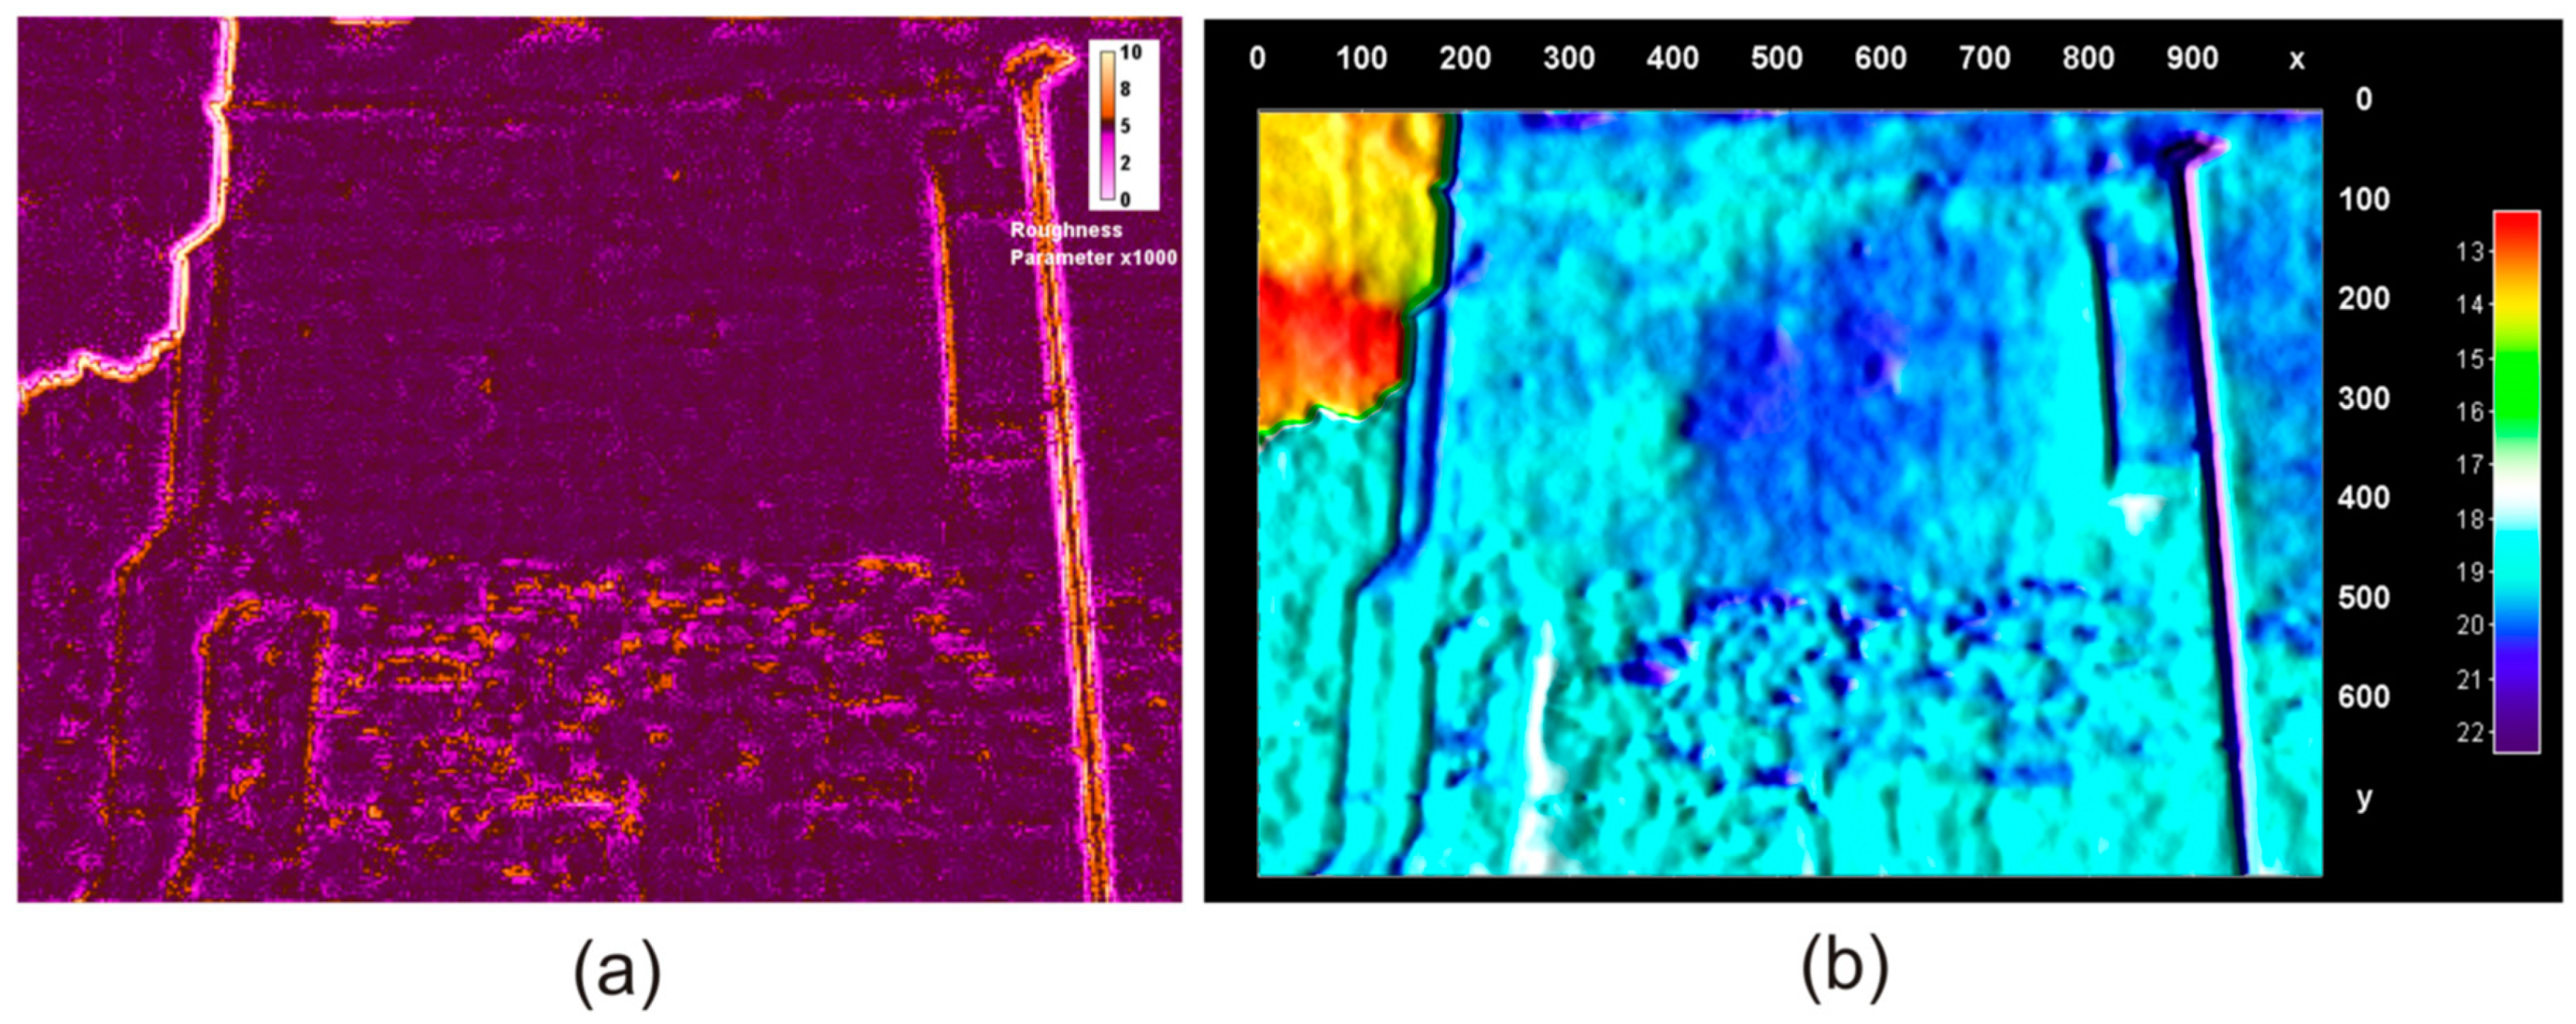
Analysis using thermal values to yield surface roughness parameters is shown in Figure 9. Calculation is undertaken using the ImageJ plugin SurfCharJ [58] which is based on several developed routines for surface assessment [59,60], and provides global and local roughness analysis, gradient analysis, domain segmentation, surface levelling, and directional analysis. The visualization yields a model of ‘thermal surface topography’. The analytical method is derived from using a height function z (x, y) such that at a given point (x0, y0, z0) z may be represented by a Taylor series expansion [61] yielding the following function for height data h as shown by Equation (11),
This operation is then applied for every point on the image grid by convolution in a 3 × 3 kernel.
Figure 9a illustrates the relatively even thermal roughness field in the upper portion of the target compared to the lower (earlier) region; this is echoed to a lesser extent, but is still discernible, in the 3D thermal projection in Figure 9b. One leading hypothesis for the amount of thermal variation, after discarding the noise effects caused by former vegetation growth, is that this is created by physical surface roughness resulting in scattering and shading effects that have been demonstrated elsewhere [62]; however, this in itself is highly significant in the interpretation of the structural archaeology as it indicates regions and anomalies which relate to specific building phases and alterations.
4. Discussion
4.1. The Nature of the Archaeology
Hidden archaeological evidence in historic buildings presents a special problem for the investigator. Unlike below-ground excavation where anomalies can effectively be ground-truthed through destructive methodology, historic buildings are both subject to special legislative protection and also to professional considerations to conserve intact historic fabric [63]. Many remote, nondestructive methods have been developed to assist in this process [1,64] and are capable of yielding information on concealed archaeological anomalies within standing building fabric in a like manner to the way geophysics is used to survey below ground archaeology [65,66,67].
The types of anomaly encountered in standing buildings differ considerably from those found below ground. Whereas the latter is frequently concerned with buried wall, ditches, pits, magnetic features such as kilns and hearths, and other evidence of occupation by man, buildings contain more discrete evidence such as the remains of former doorways, windows, stairs, and other openings, as well as features relating to construction such as putlog holes (for scaffolding), building breaks, and even wholesale alterations in the building layout, many of which are not evident to the naked eye. It is often simply not physically possible to examine a building without compromising both historic fabric and structural integrity, and most of the historic structures under investigation are still in regular use either for the purpose for which they were designed or some later function.
4.2. Discussion of Sample Results
The four examples presented in this study represent a cross section of conditions typically encountered in historic building survey, especially with reference to places of worship. Each of the instances reveals archaeological information that was previously unknown and which could not be discovered by physically intrusive methods due to the historic significance of the buildings.
In example 3.1 the plaster screen conceals a timber framework that might be hypothesised to exist due to the size of the construction and the obvious requirement for support. However, the design and nature of the framework is entirely concealed visually by the plaster medium. The thickness of the plaster and the framework cannot be determined without causing physical damage, however, the screen is a total of 159 mm in width and the assumption is made that the plaster surface on either face must be in the broad region of 20–30 mm in thickness in order to be self-supporting on the frame.
Thermal infrared examination reveals the inner structure due to a combination of differing heat conduction between plaster and timber, different emissivity values, scattering due to surface roughness, and a composite mix of spectral absorption, spectral reflectance, and transmissivity. It is assumed for practical calculations that the heat flow is essentially linear and results, taken from an individual survey, in a mean thermal difference of 1.07 °C between the plaster and the concealed framework, which underscores the requirement for a sensing instrument with appropriately high sensitivity. In practice the heat flow is likely to be nonlinear due to complex environmental and structural conditions as in reality historic building fabric is very far from the ideal model. Boundary layer equations for heat conduction are therefore also nonlinear and, with the exception of a few special cases [68], cannot be solved analytically [22,69]. However, the Delta-T metric is easily computed and the qualitative, visual image in this case has revealed considerable archaeological information based on geometry and position and the simple fact that the framework has been revealed.
Example 3.2 illustrates a different problem whereby an evidently complex section of built fabric is suspected to conceal archaeological features relating to former use but which use is now not visually evident. A section of internal wall was examined using thermography which has revealed a series of complex anomalies that are hypothesised to arise from a concealed, blocked stairway and egress point. This illustrates the complexity of some type of resultant thermal imagery where both quantitatively and qualitatively no immediate solution is apparent. However, there are very clear features that present with lower or higher thermal emission/reflection from the mean background. In this instance the background was recorded at 15.62 °C, the highest values in the target were 16.5 °C and the lowest 14.80 °C with a std. dev. of 0.26 °C. The plaster thickness is unknown and cannot be measured without damage.
Example 3.3 is a straightforward application of thermal imaging to reveal hidden internal timber framing in a plaster and mortar matrix bridge that is inaccessible under normal circumstances so that physical measurements and invasive investigation cannot be made.
Because of the instance of timber framing elsewhere in the building, the age of the structure, and the obvious engineering requirement to hold the bridge in place, the result is not unexpected. However, the extent of the timberwork was not apparent and has been revealed with considerable clarity. As in Example 3.1, the explanation for the visualization of the timbers is due to a combination of thermal factors, probably more straightforwardly, mainly due to differing heat conduction in this instance. One of the primary factors is differential specific heat capacity: for typical oak timber and for historic lime plaster [70]. Consequently, as timber loses or gains heat slower than the surrounding plaster matrix under identical conditions, this causes the specific heat capacity of the timber material to increase. Likewise, timber is more likely to retain moisture than the surrounding matrix; water has which is considerably higher than either building material. This results in areas with high moisture content to appear warmer or cooler than the surrounding structure and the combination results in measurable thermal contrast, although this is compounded by water content detection in porous materials being more related to the evaporation rate of the surfaces and the presence of soluble salts than to the absorption capability of the materials alone [71,72].
Example 3.4 shows the use of infrared imaging on an area of exposed historic building fabric having some degree of complexity in both period and method of construction. Whilst areas of former vegetation produce some noise, the effects of the exposed building fabric are evident in the imagery. In the upper area of yellow ashlar stone a region of higher thermal values is evident in the centre which corresponds with a slightly darker yellow stone, although the projecting buttress also has the same high values, possibly due to angular reflection. There are similar, though less pronounced, variations in other areas of the upper wall. This indicates probable thermal reflection differences between materials of different geological nature, even though these differences may be slight. The upper wall comprises mainly Jurassic sandstone with some laminated sandstone and Rhaetic conglomerate. However, the central portion, where thermal value is paradoxically highest also has open joints which would normally be expected to produce lower values due to moisture absorption and consequential evaporative cooling; the conclusion is that the effect of the material property differences is greater than any cooling due to water.
The lower portion of the wall comprises 13th century fashion coursed rubble containing Cotham, Lower Lias, and Middle Jurassic oolitic limestones, Trent Valley Mudstone, and some calcareous Jurassic sandstone blocks. The upper portion of this area has high thermal values, possibly in part associated with the former vegetation growth which is still visible here, the lower extremities have low values due to capillary moisture retention and evaporative cooling. The central portion displays some discrete differences in thermal values most notably revealing the outline of a blocked doorway in the middle of the scene (indicated by an arrow in Figure 8b).
Analysis demonstrates that thermal value generally increases from Jurassic sandstone to oolitic limestone then laminated sandstone. The CP value of sandstone is ~700–920 J/kgK, and for limestone ~810–930 J/kgK, so this factor should not produce any significant difference between the materials based on thermal properties alone. However, the heat conductivity λ does vary significantly, sandstone being 2.9 J m−1 s−1 K−1 and limestone 2.15 J m−1 s−1 K−1, some mudstone is also present in the target which has λ= 1.78 J m−1 s−1 K−1 [73,74]. The deposition of particulate material on the surface of the stone does yield a measurable thermal variation from the clean material and therefore differing pore size in the stone may result in this effect; particulate deposition results in increased absorption of radiant energy which in turn raises surface temperature and accentuates the rate of surface temperature change [75]. It has also been demonstrated that localised cracks, invisible to the naked eye in sandstone, can display elevated temperature [76].
Therefore, a combined effect of heat conductivity and pore size is most probably the reason for the variation in thermal values, coupled with a low level of moisture retention effect. This is nevertheless valuable information for archaeological interpretation as it yields indicators of building phases and alterations some of which are not visually apparent to the unaided eye. Further research using a wider group of examples and materials is clearly called for.
5. Conclusions
The technique of thermal infrared imaging in revealing archaeological features and anomalies not visible to the unaided eye clearly demonstrates the value of the procedure as an aid to research investigations. This work builds on previous experiments into the use of this methodology [2,5,6,11] using a modern, portable, medium resolution thermal camera.
Whilst the quantitative evaluation of the data has been shown to have complex parameters that make accurate calculations problematic, mainly due to the intricacy of environmental conditions associated with historic structures, the qualitative, visual imagery that results from thermography frequently yields sufficient information in order to create valid hypotheses relating to the archaeology of the areas under examination. Image processing, using specialised software algorithms, greatly improves the value of extracted information and provides the potential for the separation of subtle features, for example when examining rendered or plastered walls, buried timberwork, artificial voids, changes in type of fabric, blocked openings, and so forth. Limited work on exposed historic building stonework has shown it is possible to differentiate areas of tenuous changes in chemistry and topography.
Thermography would be an extremely valuable routine tool in the survey and recording of historic building structures, to be used alongside other remote sensing and traditional surveying methods.
Funding
This research received no external funding.
Acknowledgments
The author wishes to thank the PCCs and other administrative officials of the churches involved in this work for their kind cooperation and permission to undertake thermal analysis, and also to the Southwell Community Archaeology group and the Southwell and Nottingham Church History Project research team for their assistance. Thanks are due to Danny Donoghue for his helpful feedback on this paper, to Robert Howard for his support on dating evidence, and to Alan Brandon, formerly of the British Geological Survey, for his analysis of building stones and materials.
Conflicts of Interest
The author declares no conflicts of interest.
References
- Brooke, C.J. Ground-Based Remote Sensing of Buildings and Archaeological Sites: Ten Years Research to Operation. Archaeol. Prospect. 1994, 1, 105–119. [Google Scholar] [CrossRef]
- Brooke, C.J. The Application of High Resolution Photographic Remote Sensing and Digital Image Processing in the Archaeological Examination of Historic Buildings. RSS 96: Remote Sensing Science and Industry. In Proceedings of the 22nd Annual Conference of the Remote Sensing Society, Durham, UK, 11–14 September 1996; pp. 667–675. [Google Scholar]
- Liang, H. Advances in Multispectral and Hyperspectral Imaging for Archaeology and Art Conservation. Appl. Phys. 2012, 106, 309–323. [Google Scholar] [CrossRef]
- Cosentino, A. Identification of pigments by multispectral imaging; a flowchart method. Herit. Sci. 2014, 2. [Google Scholar] [CrossRef]
- Cramer, J. Thermografische Undersuchung verputzter Fachwerkbauten. Dtsch. Kunst Denkmalpfl. 1977, 35, 165–177. [Google Scholar]
- Cramer, J. Thermografie in der Bauforschung. Archaol. Naturwissenschaft 1981, 2, 44–54. [Google Scholar]
- Spodek, J.; Rosina, E. Application of Infrared Thermography to Historic Building Investigation. J. Archit. Conserv. 2009, 15, 65–81. [Google Scholar] [CrossRef]
- Lehmann, B.; Wakili, K.G.; Frank, T.; Collado, B.V.; Tanner, C. Effects of individual climatic parameters on the infrared thermography of buildings. Appl. Energy 2013, 110, 29–43. [Google Scholar] [CrossRef]
- Hess, M.; Vanoni, D.; Petrovic, V.; Kuester, F. High-resolution thermal imaging methodology for non-destructive evaluation of historic structures. Infrared Phys. Technol. 2015, 73, 219–225. [Google Scholar] [CrossRef] [Green Version]
- Moropoulou, A.; Avdelidis, N.; Karoglou, M.; Delegou, E.; Alexakis, E.; Keramidas, V. Multispectral Applications of Infrared Thermography in the Diagnosis and Protection of Built Cultural Heritage. Appl. Sci. 2018, 8, 284. [Google Scholar] [CrossRef]
- McAvoy, F.; Demaus, R. Infra-Red Thermography in Building Survey and Secording: An Application at Prior’s Hall, Widdington, Essex; English Heritage: London, UK, 1998. [Google Scholar]
- Fokaides, P.A.; Kalogirou, S.A. Application of infrared thermography for the determination of the overall heat transfer coefficient (U-Value) in building envelopes. Appl. Energy 2011, 88, 4358–4365. [Google Scholar] [CrossRef]
- Fuchs, H.U. The Dynamics of Heat: A Unified Approach to Thermodynamics and Heat Transfer, 2nd ed.; Springer: New York, NY, USA, 2010; ISBN 978-1-4419-7603-1. [Google Scholar]
- Meola, C. (Ed.) Infrared Thermography Recent Advances and Future Trends; Bentham Science; Bentham Science: Bentham, UK, 2012. [Google Scholar]
- Sekerka, R. Thermal Physics: Thermodynamics and Statistical Mechanics for Scientists and Engineers; Elsevier: Amsterdam, The Netherlands, 2015; ISBN 978-0-12-803304-3. [Google Scholar]
- Kakaç, S.; Yener, T.; Naveira-Cotta, C.P. Heat Conduction, 5th ed.; Taylor & Francis: Boca Raton, FL, USA, 2018; ISBN 978-1-138-94384-1. [Google Scholar]
- Avdelidisa, N.P.; Moropoulou, A. Emissivity considerations in building thermography. Energy Build. 2003, 35, 663–667. [Google Scholar] [CrossRef]
- Tang, H.J.; Li, Z.L. Quantitative Remote Sensing in Thermal Infrared: Theory and Applications; Springer: Heidelberg, Germany, 2014; ISBN 978-3-642-42026-9. [Google Scholar]
- Karwa, R. Heat and Mass Transfer; Springer: Singapore, 2017; ISBN 978-981-10-1556-4. [Google Scholar]
- Bergman, T.L.; Lavine, A.S.; Incropera, F.P.; Dewitt, D.P. Fundamentals of Heat and Mass Transfer, 8th ed.; Wiley: New York, NY, USA, 2017; ISBN 978-1-119-32042-5. [Google Scholar]
- Bauer, E.; Pavón, E.; Barreira, E.; Kraus, E. Analysis of building facade defects using infrared thermography: Laboratory studies. J. Build. Eng. 2016, 6, 93–104. [Google Scholar] [CrossRef]
- Maldague, P.X. Theory and Practice of Infrared Technology for Non-destructive Evaluation; Wiley: New York, NY, USA, 2001; ISBN 978-0-471-18190-3. [Google Scholar]
- Vavilov, V. Noise-limited thermal/infrared non-destructive testing. NDT&E Int. 2014, 61, 16–23. [Google Scholar] [CrossRef]
- Jacobs, P.A. Thermal Infrared Characterization of Ground Targets and Backgrounds, 2nd ed.; SPIE: Bellingham, WA, USA, 2006; ISBN 0-8194-6082-6. [Google Scholar]
- Çengel, Y.A.; Ghajar, A.J. Heat and Mass Transfer Fundamentals and Applications, 5th ed.; McGraw Hill: New York, NY, USA, 2015; ISBN 978-0-07-339818-1. [Google Scholar]
- Casas-Vázquez, J.; Jou, D.; Rubi, J.M. Recent Developments in Nonequilibrium Thermodynamics: Fluids and Related Topics. In Proceedings of the Meeting Held at Bellaterra School of Thermodynamics, Autonomous University of Barcelona, Sant Feliu De Guíxols, Catalonia, Spain, 16–20 September 1985. [Google Scholar]
- Baehr, H.D.; Stephan, K. Heat and Mass Transfer, 3rd ed.; Springer: Berlin, Germany, 2011; ISBN 978-3-64-220021-2. [Google Scholar]
- Thermografie. Available online: http://joe-c.de/pages/projekte/thermografie.php (accessed on 7 July 2018).
- Burger, W.; Burge, M.J. Digital Image Processing: An Algorithmic Introduction Using Java, 2nd ed.; Springer: London, UK, 2016; ISBN 978-1-4471-6683-2. [Google Scholar]
- Vaseghi, S.V. Advanced Digital Signal Processing and Noise Reduction, 2nd ed.; Wiley: Chichester, UK, 2000; ISBN 0-471-62692-9. [Google Scholar]
- Christensen, O. Functions, Spaces and Expansions Mathematical Tools in Physics and Engineering; Birkhäuser: Boston, UK, 2010; ISBN 978-0-8176-4979-1. [Google Scholar]
- Radke, R.J. Computer Vision for Visual Effects; Cambridge University Press: Cambridge, UK, 2013; ISBN 978-0-521-76687-6. [Google Scholar]
- Danese, M.; Demšar, U.; Masini, N.; Charlton, M. Investigating material decay of historic buildings using Visual Analytics with multi-temporal infrared thermographic data. Archaeometry 2010, 52, 482–501. [Google Scholar] [CrossRef]
- Danese, M.; Sileo, M.; Masini, N. Geophysical Methods and Spatial Information for the Analysis of Decaying Frescoes. Surv. Geophys. 2018, 1–18. [Google Scholar] [CrossRef]
- Tan, D. Image Enhancement Based on Adaptive Median Filter and Wallis Filter. In Proceedings of the 4th National Conference on Electrical, Electronics and Computer Engineering (NCEECE 2015), Xi’an, China, 12–13 December 2015; pp. 767–772. [Google Scholar] [CrossRef]
- Beyerer, J.; León, F.P.; Frese, C. Machine Vision Automated Visual Inspection: Theory, Practice and Applications; Springer-Verlag: Berlin, Germany, 2016; ISBN 978-3-662-47793-9. [Google Scholar]
- Lu, W.; Yue, X.; Zhao, Y.; Han, C. A SAR Image Registration Method Based on Sift Algorithm. The International Archives of the Photogrammetry, Remote Sensing and Spatial Information Sciences, Wuhan, China, 18–22 September 2017; pp. 623–627. [Google Scholar] [CrossRef]
- Davies, E.R. Computer and Machine Vision: Theory, Algorithms, Practicalities, 4th ed.; Academic Press: Oxford, UK, 2012; ISBN 978-0-12-386908-1. [Google Scholar]
- Krig, S. Apress. Available online: https://www.apress.com/la/book/9781430259299 (accessed on 3 September 2018).
- Huang, X.; Yin, C.; Dadras, S. Cheng, Y.H.; Bai, L.B Adaptive rapid defect identification in ECPT based on K-means and automatic segmentation algorithm. J. Ambient Intell. Hum. Comput. 2018, 1–18. [Google Scholar] [CrossRef]
- MacQueen, J. Some Methods for classification and Analysis of Multivariate Observations. In The 5th Berkeley Symposium on Mathematical Statistics and Probability; University of California Press: Berkeley, CA, USA, 1967; pp. 281–297. [Google Scholar]
- Hartigan, J.A. Clustering Algorithms; John Wiley: New York, NY, USA, 1975; ISBN 0-471-35645-X. [Google Scholar]
- Kramer, O. Dimensionality Reduction with Unsupervised Nearest Neighbors; Springer: Heidelberg, Germany, 2013; ISBN 978-3-642-38651-0. [Google Scholar]
- Streblow, R.; Müller, D.; Gores, I.; Bendfeldt, P. Thermisches Komfortmodell für inhomogene Umgebungsbedingungen. Bauphysik 2009, 31, 38–41. [Google Scholar] [CrossRef]
- Fritzson, P. Principles of Object-Orientated Modeling and Simulation with Modelica 3.3, 2nd ed.; Wiley: New York, NY, USA, 2014; ISBN 9781118859124. [Google Scholar]
- The Southwell and Nottingham Church History Project. Available online: http://southwellchurches.nottingham.ac.uk/_main/hindex.php (accessed on 9 July 2018).
- Kinoulton St Luke: Archaeology. Available online: http://southwellchurches.history.nottingham.ac.uk/kinoulton/harchlgy.php (accessed on 9 July 2018).
- Gringley-on-the-Hill St Peter and St Paul: Archaeology. Available online: http://southwellchurches.nottingham.ac.uk/gringley-on-the-hill/harchlgy.php (accessed on 9 July 2018).
- Holme St Giles: Archaeology. Available online: http://southwellchurches.nottingham.ac.uk/holme/harchlgy.php (accessed on 17 July 2018).
- Huitson, T. Stairway to Heaven the Functions of Medieval Upper Spaces; Oxbow: Oxford, UK, 2014; ISBN 978-1842176658. [Google Scholar]
- Holman, J.P. Heat Transfer, 10th ed.; McGraw-Hill: New York, NY, USA, 2010; ISBN 978-07-352936-3. [Google Scholar]
- Howard, R. Tree Ring Dates, List 29 (9a-c). Vernac. Archit. 1989, 20, 39–49. [Google Scholar] [CrossRef]
- Hurford, M.; King, C. The Pre-1750 Houses of Southwell; Southwell Archaeology/University of Nottingham: Southwell, UK, 2014. [Google Scholar]
- Kelham St Wilfrid. Available online: http://southwellchurches.nottingham.ac.uk/kelham/hintro.php (accessed on 21 July 2018).
- Minkina, W.; Dudzik, S. Infrared Thermography Errors and Uncertainties; Wiley: Chichester, UK, 2009; ISBN 978-0-470-74718-6. [Google Scholar]
- Black, M.; Riley, T.R.; Ferrier, G.; Fleming, A.H.; Fretwell, P.T. Automated lithological mapping using airborne hyperspectral thermal infrared data: A case study from Anchorage Island, Antarctica. Remote Sens. Environ. 2016, 176, 225–241. [Google Scholar] [CrossRef] [Green Version]
- Raneri, S. Complex Pore Geometries in Natural Building Stones: An Experimental and Theoretical Approach for the Modeling of Porosity Changes in Natural, Degraded and Treated Calcarenites. Ph.D. Thesis, University of Catania, Sicily, Italy, 2015. [Google Scholar]
- Chinga, G.; Gregersen, Ø.; Dougherty, B. Paper Surface Characterisation by Laser Profilometry and Image Analysis. Microsc. Anal. 2003, 96, 21–23. [Google Scholar]
- Chinga, G.; Johnsen, P.O.; Dougherty, R.; Berli, E.L.; Walter, J. Quantification of the 3D microstructure of SC surfaces. J. Microsc. 2007, 227, 254–265. [Google Scholar] [CrossRef] [PubMed] [Green Version]
- Piselli, A.; Basso, M.; Simonato, M.; Furlanetto, R.; Cigada, A.; De Nardo, L.; Del Curto, B. Effect of wear from cleaning operations on sintered ceramic surfaces: Correlation of surface properties data with touch perception and digital image processing. Wear 2017, 390, 355–366. [Google Scholar] [CrossRef]
- Hairer, E.; Nørsett, S.P.; Wanner, G. Solving Ordinary Differential Equations I Nonstiff Problems, 2nd ed.; Springer: Berlin, Germany, 2008; ISBN 978-3-540-56670-0. [Google Scholar]
- Osterloo, M.M.; Hamilton, V.E.; Anderson, F.S. A laboratory study of the effects of roughness on the thermal infrared spectra of rock surfaces. Icarus 2012, 220, 404–426. [Google Scholar] [CrossRef]
- Wood, J. (Ed.) Buildings Archaeology Applications in Practice; Oxbow: Oxford, UK, 1994; ISBN 0 946897 75 1. [Google Scholar]
- Moropoulou, A.; Labropoulos, K.C.; Delegou, E.T.; Karoglou, M.; Bakolas, A. Non-destructive techniques as a tool for the protection of built cultural heritage. Constr. Build. Mater. 2013, 48, 1222–1239. [Google Scholar] [CrossRef]
- Gaffney, C.; Gater, J. Revealing the Buried Past Geophysics for Archaeologists; Tempus: Stroud, UK, 2003; ISBN 0 7524 2556 0. [Google Scholar]
- Everett, M.E. Near-Surface Applied Geophysics; CUP: Cambridge, UK, 2013; ISBN 978-1-107-01877-8. [Google Scholar]
- Filzwieser, R.; Olesen, L.H.; Neubauer, W.; Trinks, I.; Mauritsen, E.S.; Schneidhofer, P.; Nau, E.; Gabler, M. Large-scale geophysical archaeological prospection pilot study at Viking Age and medieval sites in West Jutland, Denmark. Archaeol. Prospect. 2017, 24, 373–394. [Google Scholar] [CrossRef]
- Kaviany, M. Essentials of Heat Transfer Principals, Materials, and Applications; CUP: Cambridge, UK, 2011; ISBN 978-1-107-01240-0. [Google Scholar]
- Lappa, M. Thermal Convection: Patterns, Evolution and Stability; Wiley: Chichester, UK, 2010; ISBN 978-0-470-69994-2. [Google Scholar]
- Pavlíková, M.; Pernicová, R.; Pavlík, Z. Thermophysical Properties of Hydrophobised Lime Plaster—Experimental Analysis of Moisture Effect. In AIP Conference Proceeding; AIP: Boston, MA, USA, 2016. [Google Scholar]
- Ludwig, N.; Redaelli, V.; Rosina, E.; Augelli, F. Moisture detection in wood and plaster by IR thermography. Infrared Phys. Technol. 2004, 46, 161–166. [Google Scholar] [CrossRef]
- Delgado, J. (Ed.) Recent Developments in Building Diagnosis Techniques; Springer: Singapore, 2016; ISBN 978-981-10-0465-0. [Google Scholar]
- Eppelbaum, L.; Kutasov, I.; Pilchin, A. Applied Geothermics, Lecture Notes in Earth System Sciences; Springer-Verlag: Berlin, Germany, 2014; ISBN 978-3-642-34022-2. [Google Scholar]
- Ohlsson, K.E.A.; Olofsson, T. Quantitative infrared thermography imaging of the density of heat flow rate through a building element surface. Appl. Energy 2014, 134, 499–505. [Google Scholar] [CrossRef]
- Warke, P.A.; Smith, J.; Magee, W. Thermal Response Characteristics of Stone: Implications for Weathering of Soiled Surfaces in Urban Environments. Earth Surf. Processes Landf. 1996, 21, 295–306. [Google Scholar] [CrossRef]
- Antony, S.J.; Olugbenga, A.; Ozerkan, N.; Marumoame, O.; Okeke, G. Sensing Temperature and Stress Distributions on Rock Samples under Mechanical Loading. In Proceedings of the 15th Biennial ASCE Conference on Engineering, Science, Construction, and Operations in Challenging Environments, Orland, FL, USA, 11–15 April 2016; pp. 797–804, ISBN 978-0-7844-7997-1. [Google Scholar]
Figure 1.
Averham church, Nottinghamshire, U.K. showing the east side of the mausoleum: (a) the control image as seen by the unaided eye; (b) a thermal image showing potential archaeological anomalies as well as moisture movement in the render covering; (c) the temperature distribution in the thermal image; (d,e) linear temperature plots across the target illustrating thermal variations; the lower values in (e) indicate rising damp in the render.
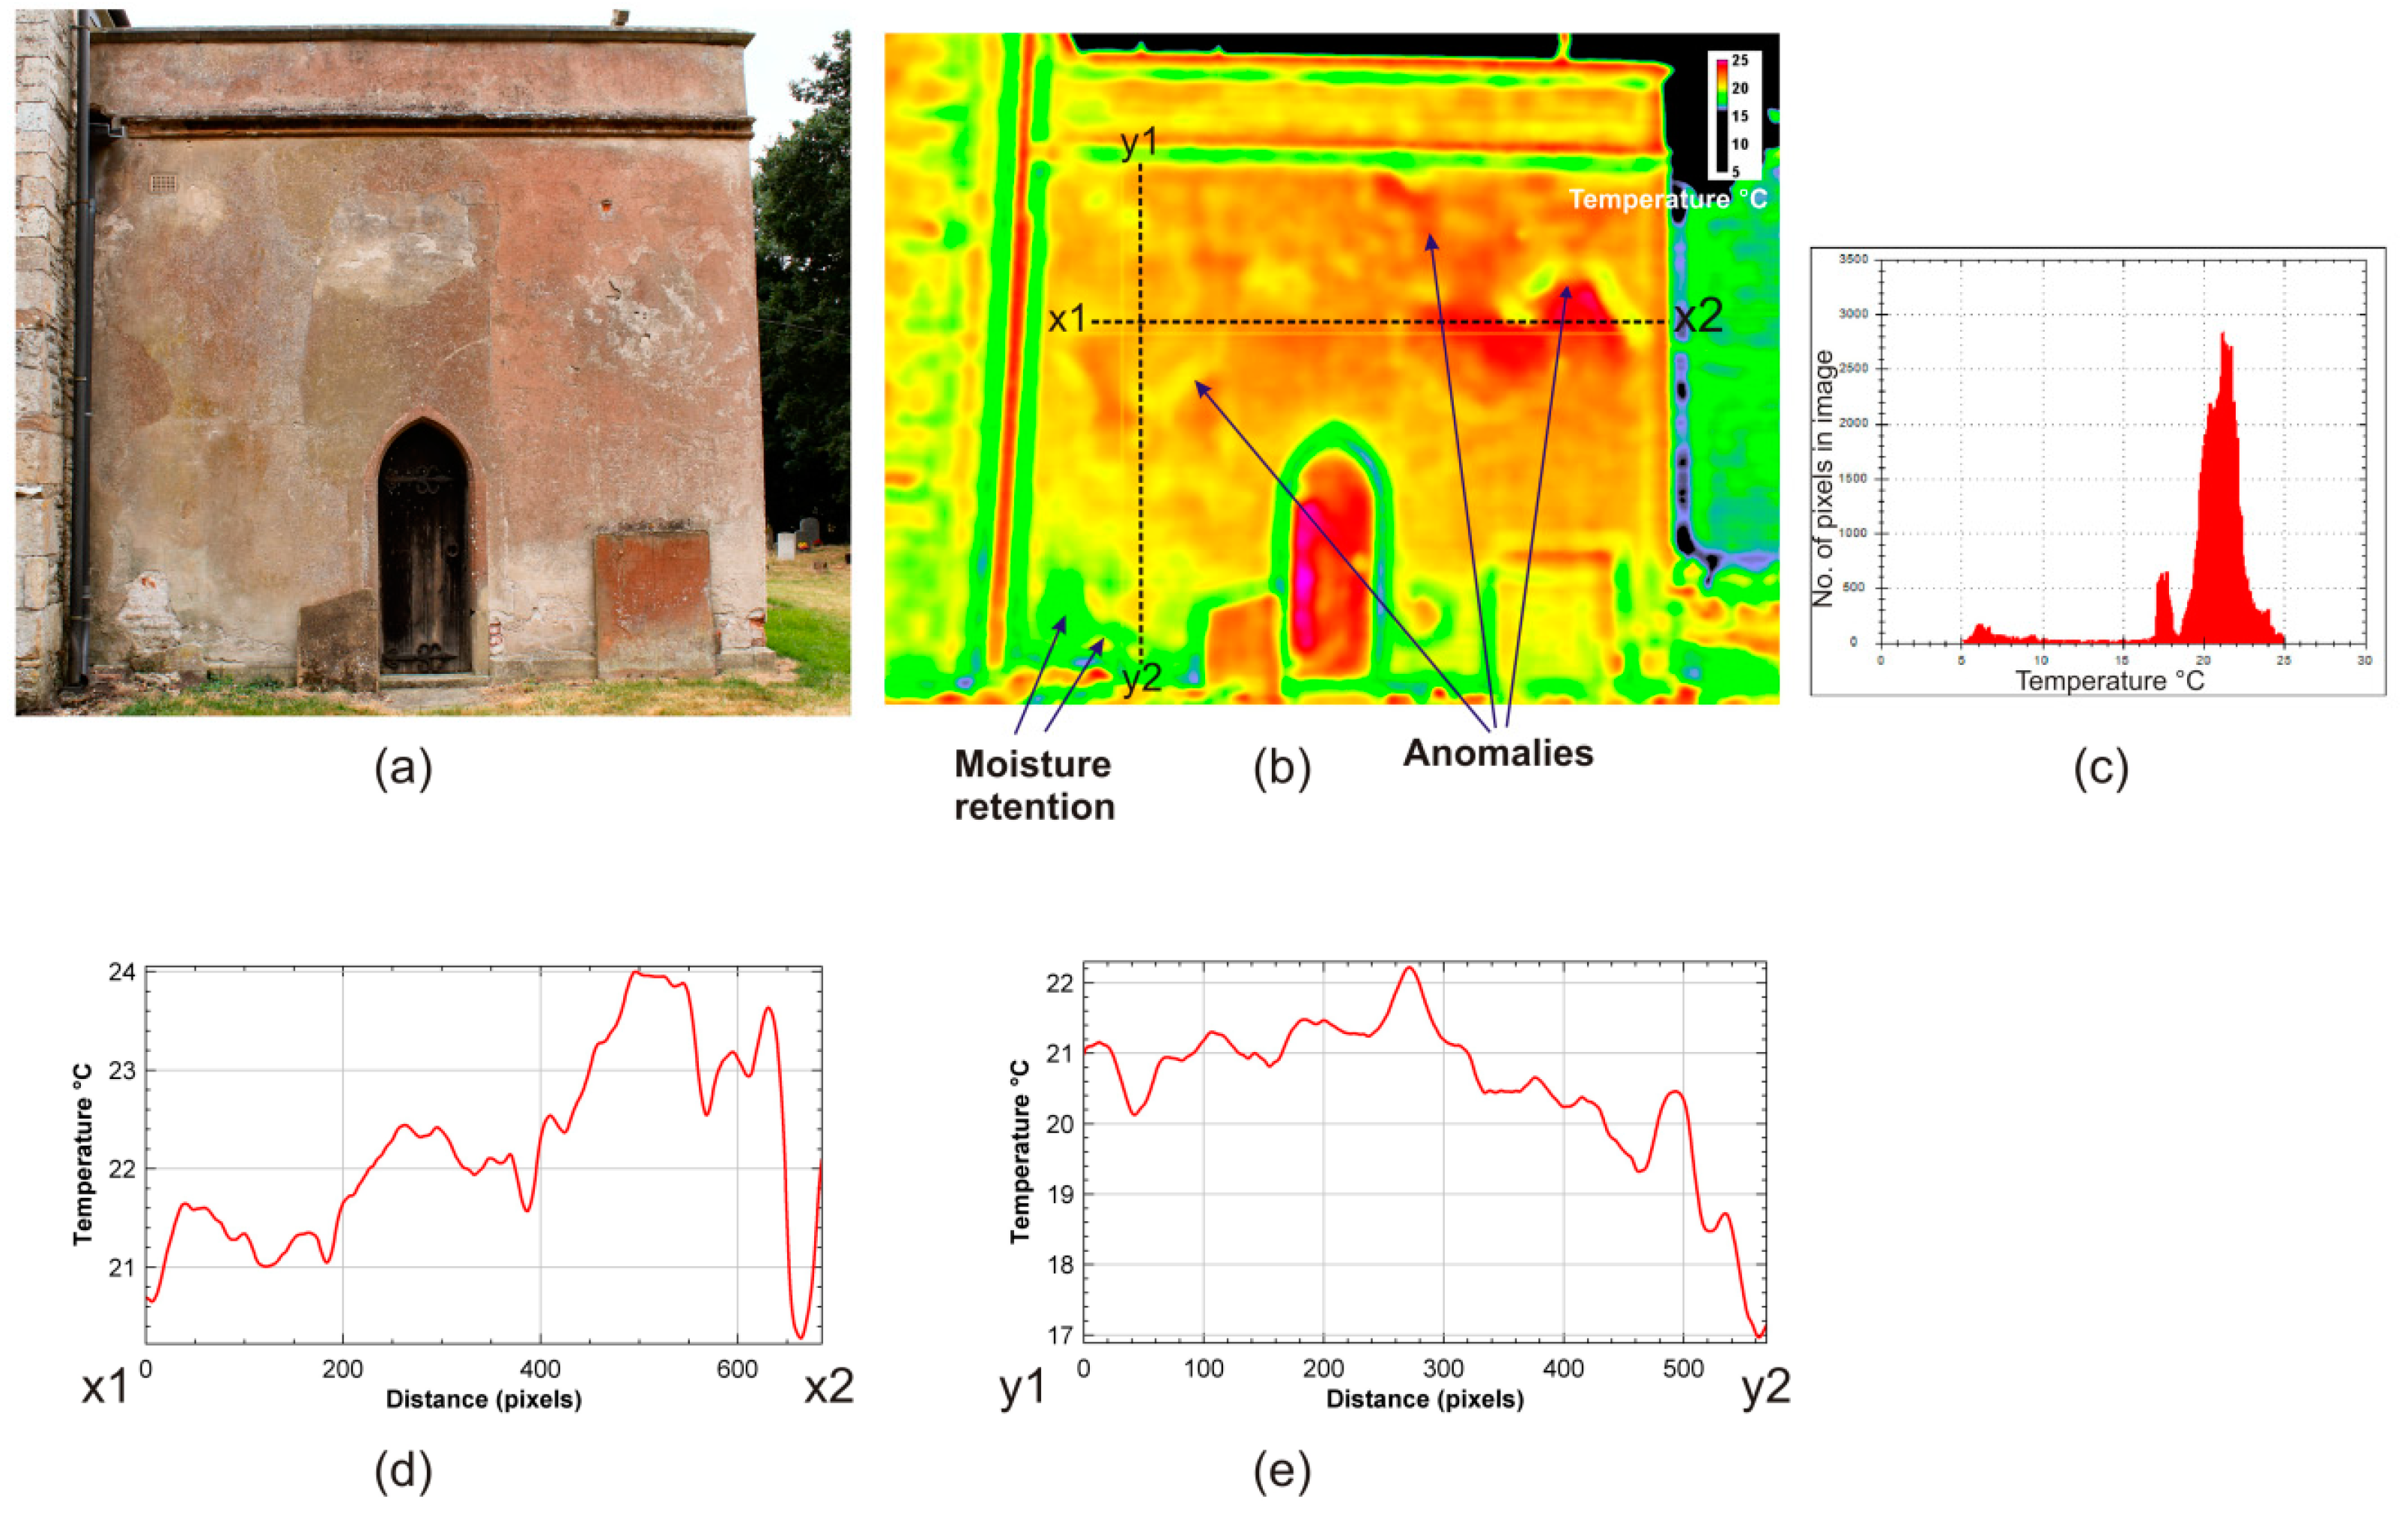
Figure 2.
Winkburn church, Nottinghamshire, U.K. Interior of the building showing a 17th century wood and plaster screen between the nave and the chancel.
Figure 2.
Winkburn church, Nottinghamshire, U.K. Interior of the building showing a 17th century wood and plaster screen between the nave and the chancel.

Figure 3.
Winkburn church, Nottinghamshire, U.K., the east side of the chancel screen, (a) under normal lighting (daylight), as seen by the unaided eye, and (b) in the thermal infrared with low level Wallis filtration applied.
Figure 3.
Winkburn church, Nottinghamshire, U.K., the east side of the chancel screen, (a) under normal lighting (daylight), as seen by the unaided eye, and (b) in the thermal infrared with low level Wallis filtration applied.
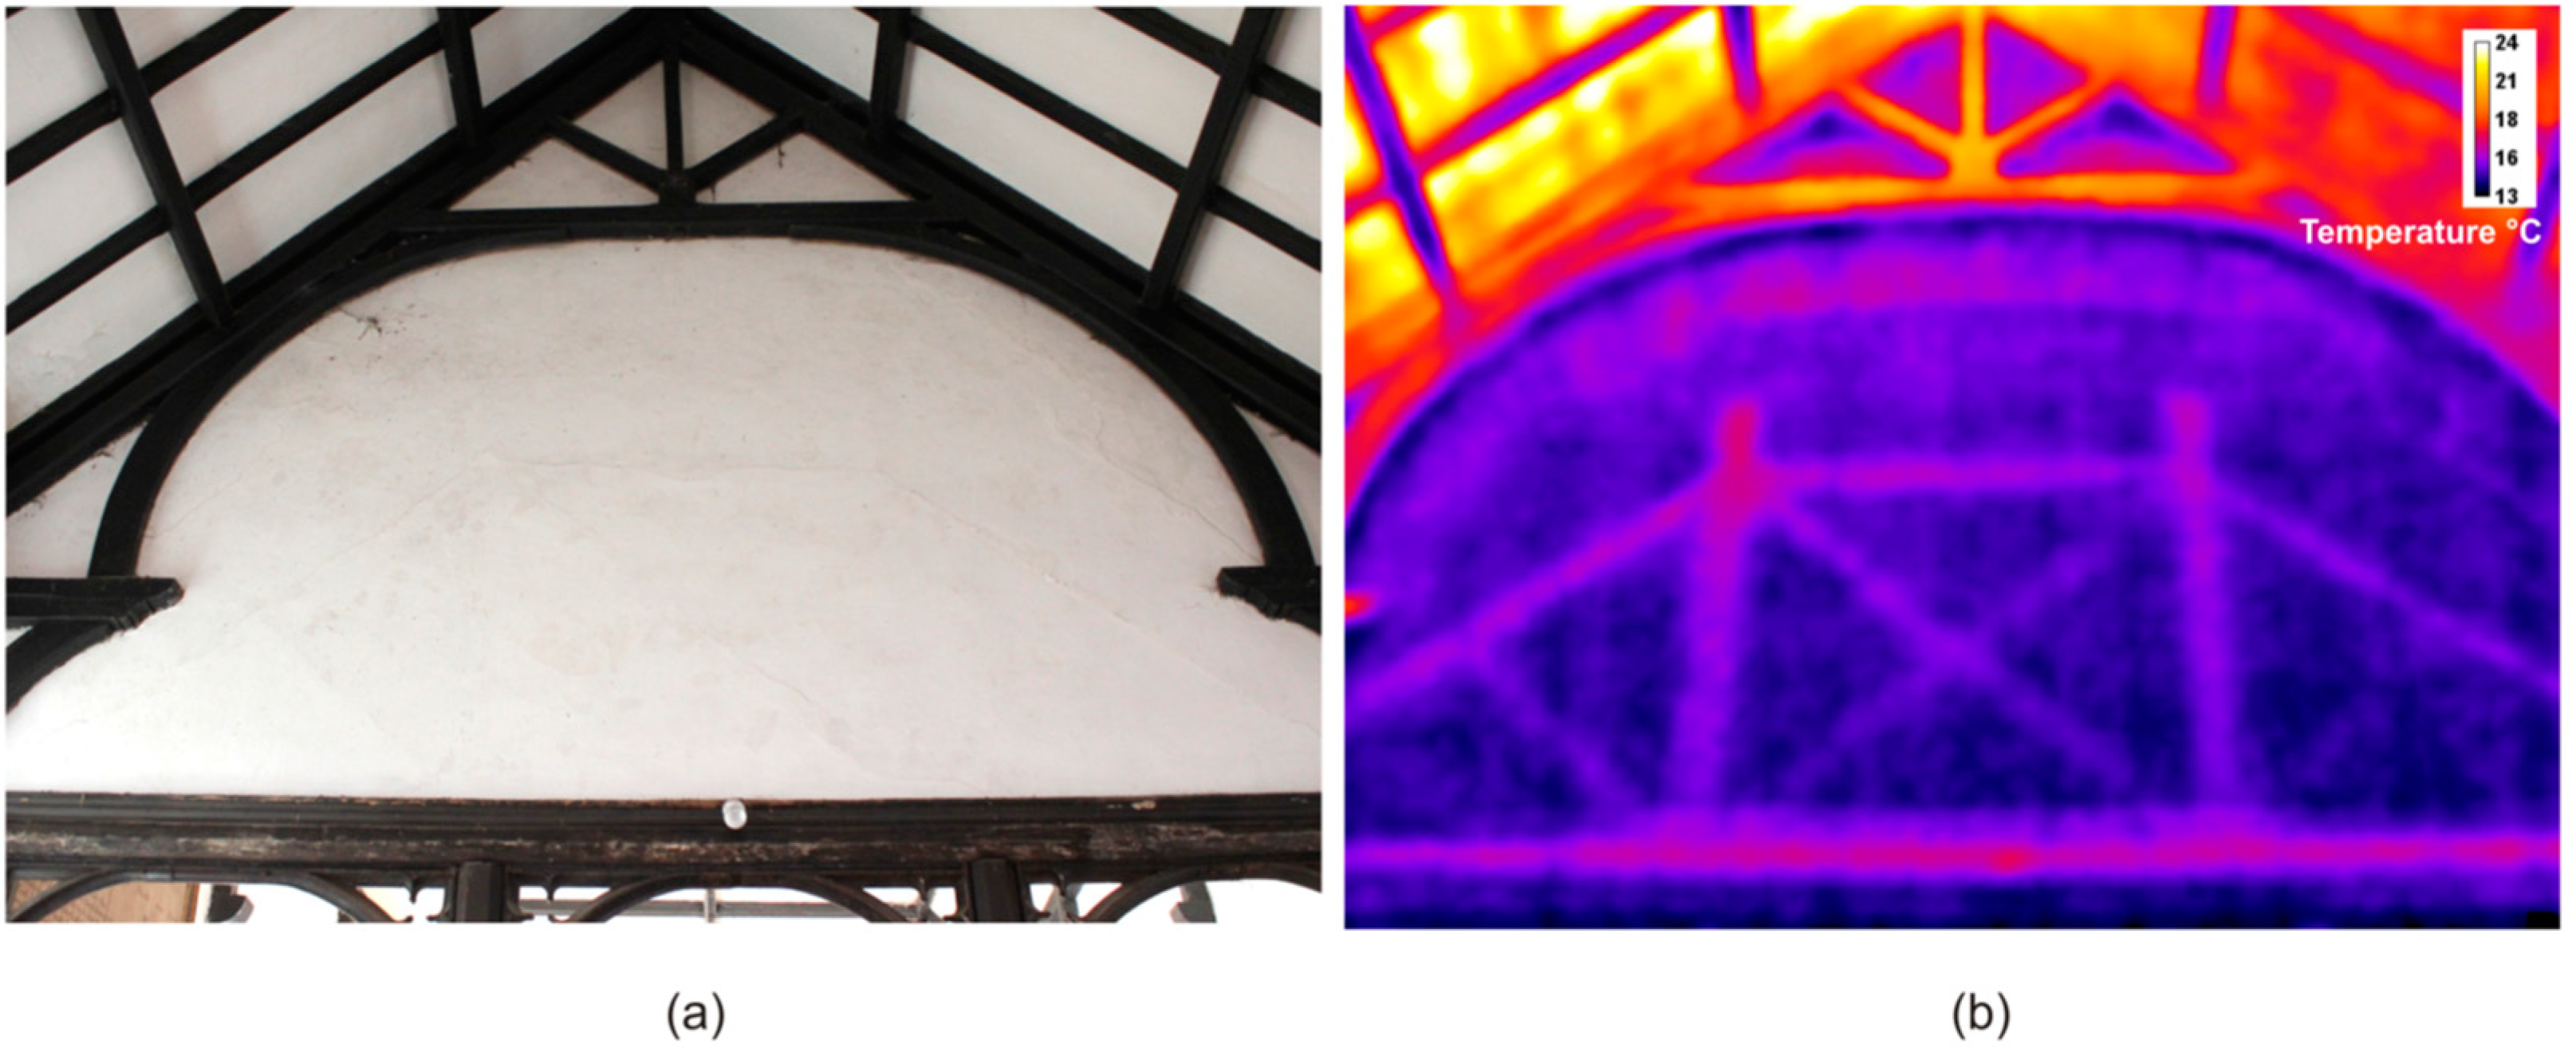
Figure 4.
Holme-by-Newark church, Nottinghamshire, U.K. (a) the exterior; (b) interior of the nave showing the nave/chancel junction.
Figure 4.
Holme-by-Newark church, Nottinghamshire, U.K. (a) the exterior; (b) interior of the nave showing the nave/chancel junction.
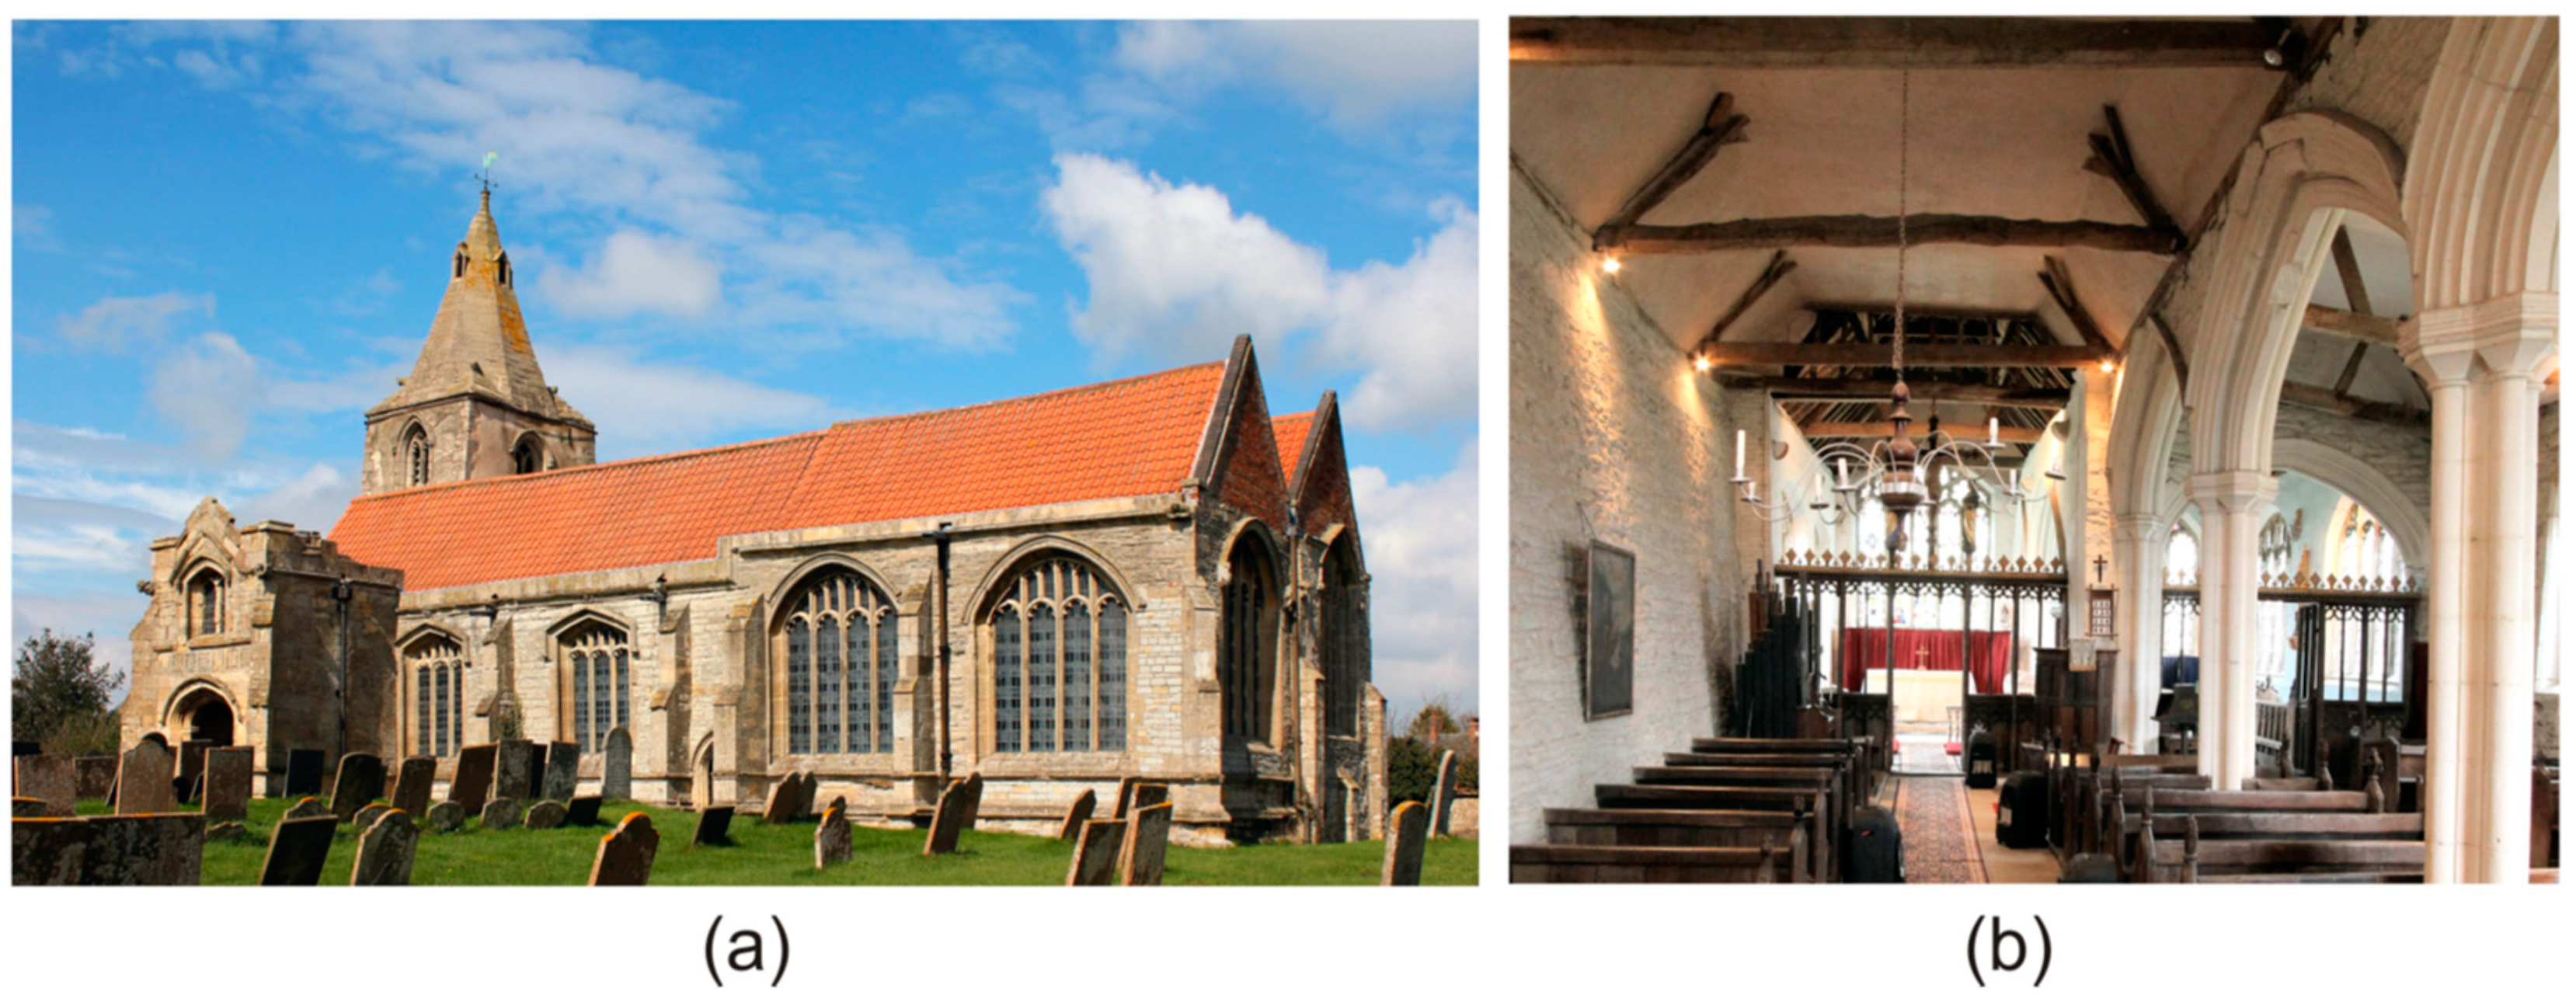
Figure 5.
Holme-by-Newark church, Nottinghamshire, U.K. showing the nave/chancel junction on the south side: (a) under normal lighting (daylight), as seen by the unaided eye, and (b) in the thermal infrared with low level Wallis filtration applied and a custom LUT.
Figure 5.
Holme-by-Newark church, Nottinghamshire, U.K. showing the nave/chancel junction on the south side: (a) under normal lighting (daylight), as seen by the unaided eye, and (b) in the thermal infrared with low level Wallis filtration applied and a custom LUT.

Figure 6.
Holme-by-Newark church, Nottinghamshire, U.K. (a) thermal infrared image with linear plot line; (b) plot of temperature variation from the mean background.
Figure 6.
Holme-by-Newark church, Nottinghamshire, U.K. (a) thermal infrared image with linear plot line; (b) plot of temperature variation from the mean background.

Figure 7.
The Saracens Head Inn, Southwell, Nottinghamshire, U.K. (a) under normal lighting (daylight), as seen by the unaided eye; (b) in the thermal infrared with a custom LUT applied; and (c) a linear temperature plot across the centre of the target showing the signature of the buried timbers.
Figure 7.
The Saracens Head Inn, Southwell, Nottinghamshire, U.K. (a) under normal lighting (daylight), as seen by the unaided eye; (b) in the thermal infrared with a custom LUT applied; and (c) a linear temperature plot across the centre of the target showing the signature of the buried timbers.
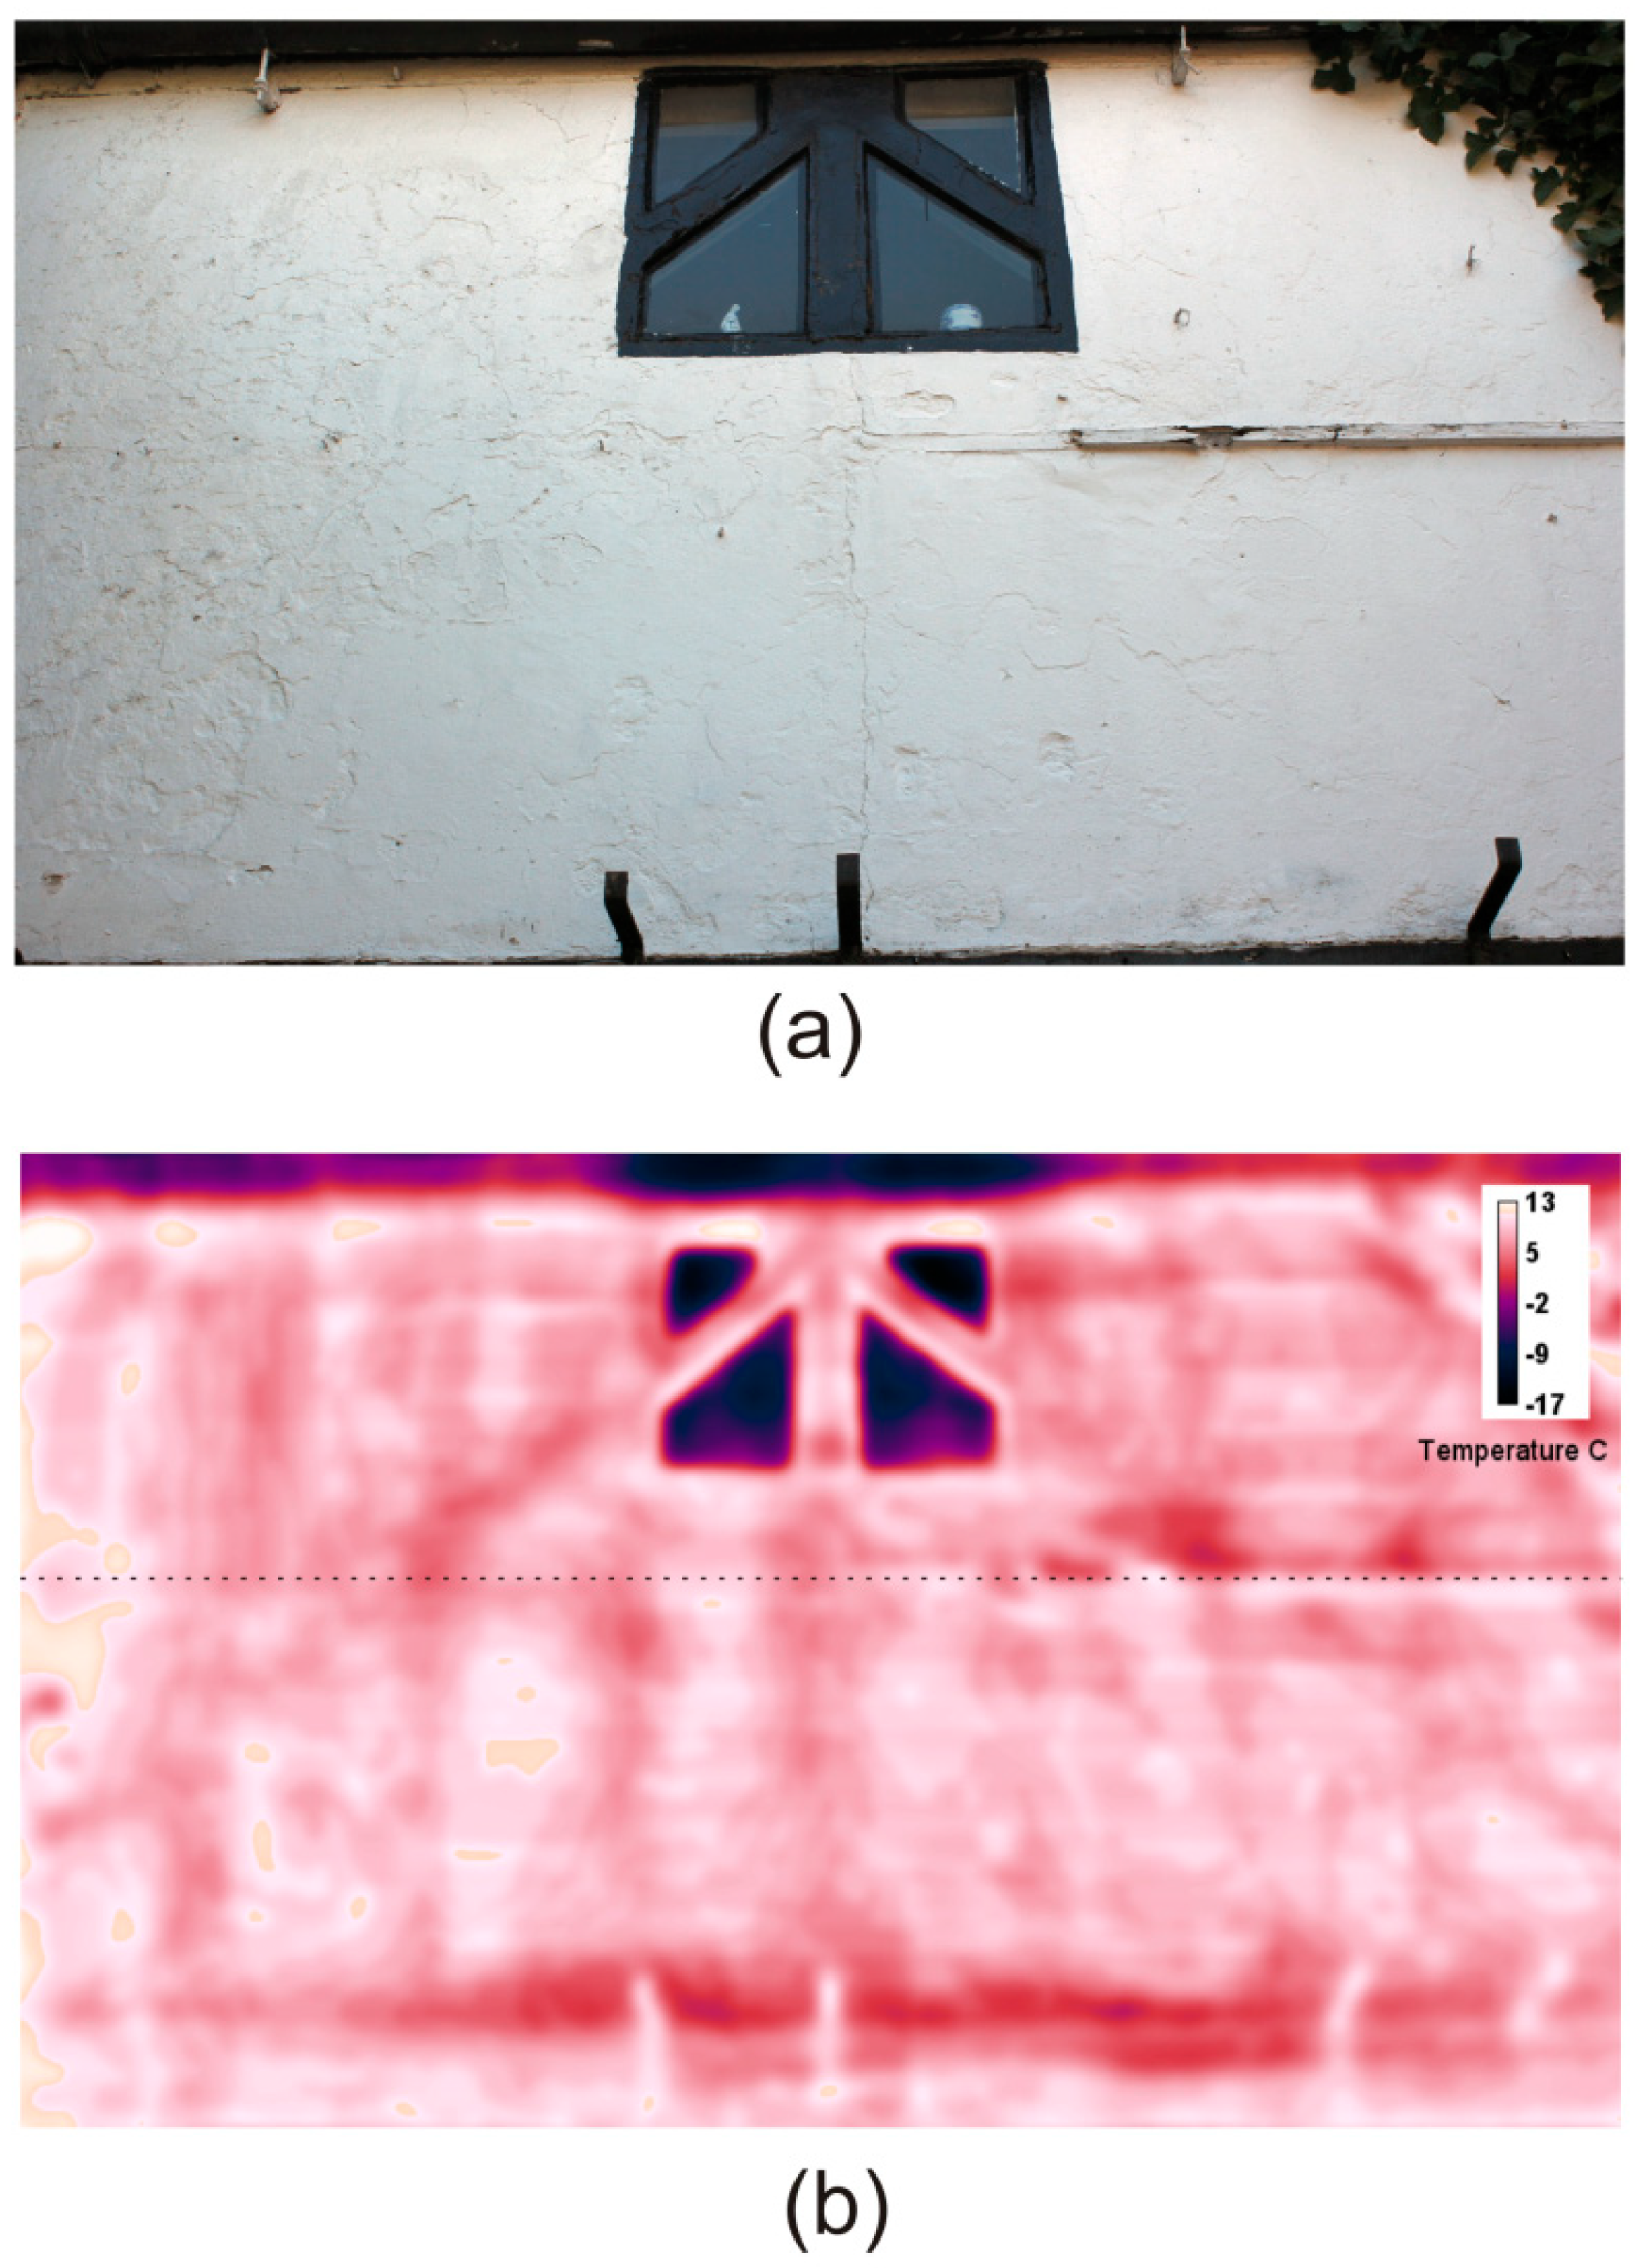
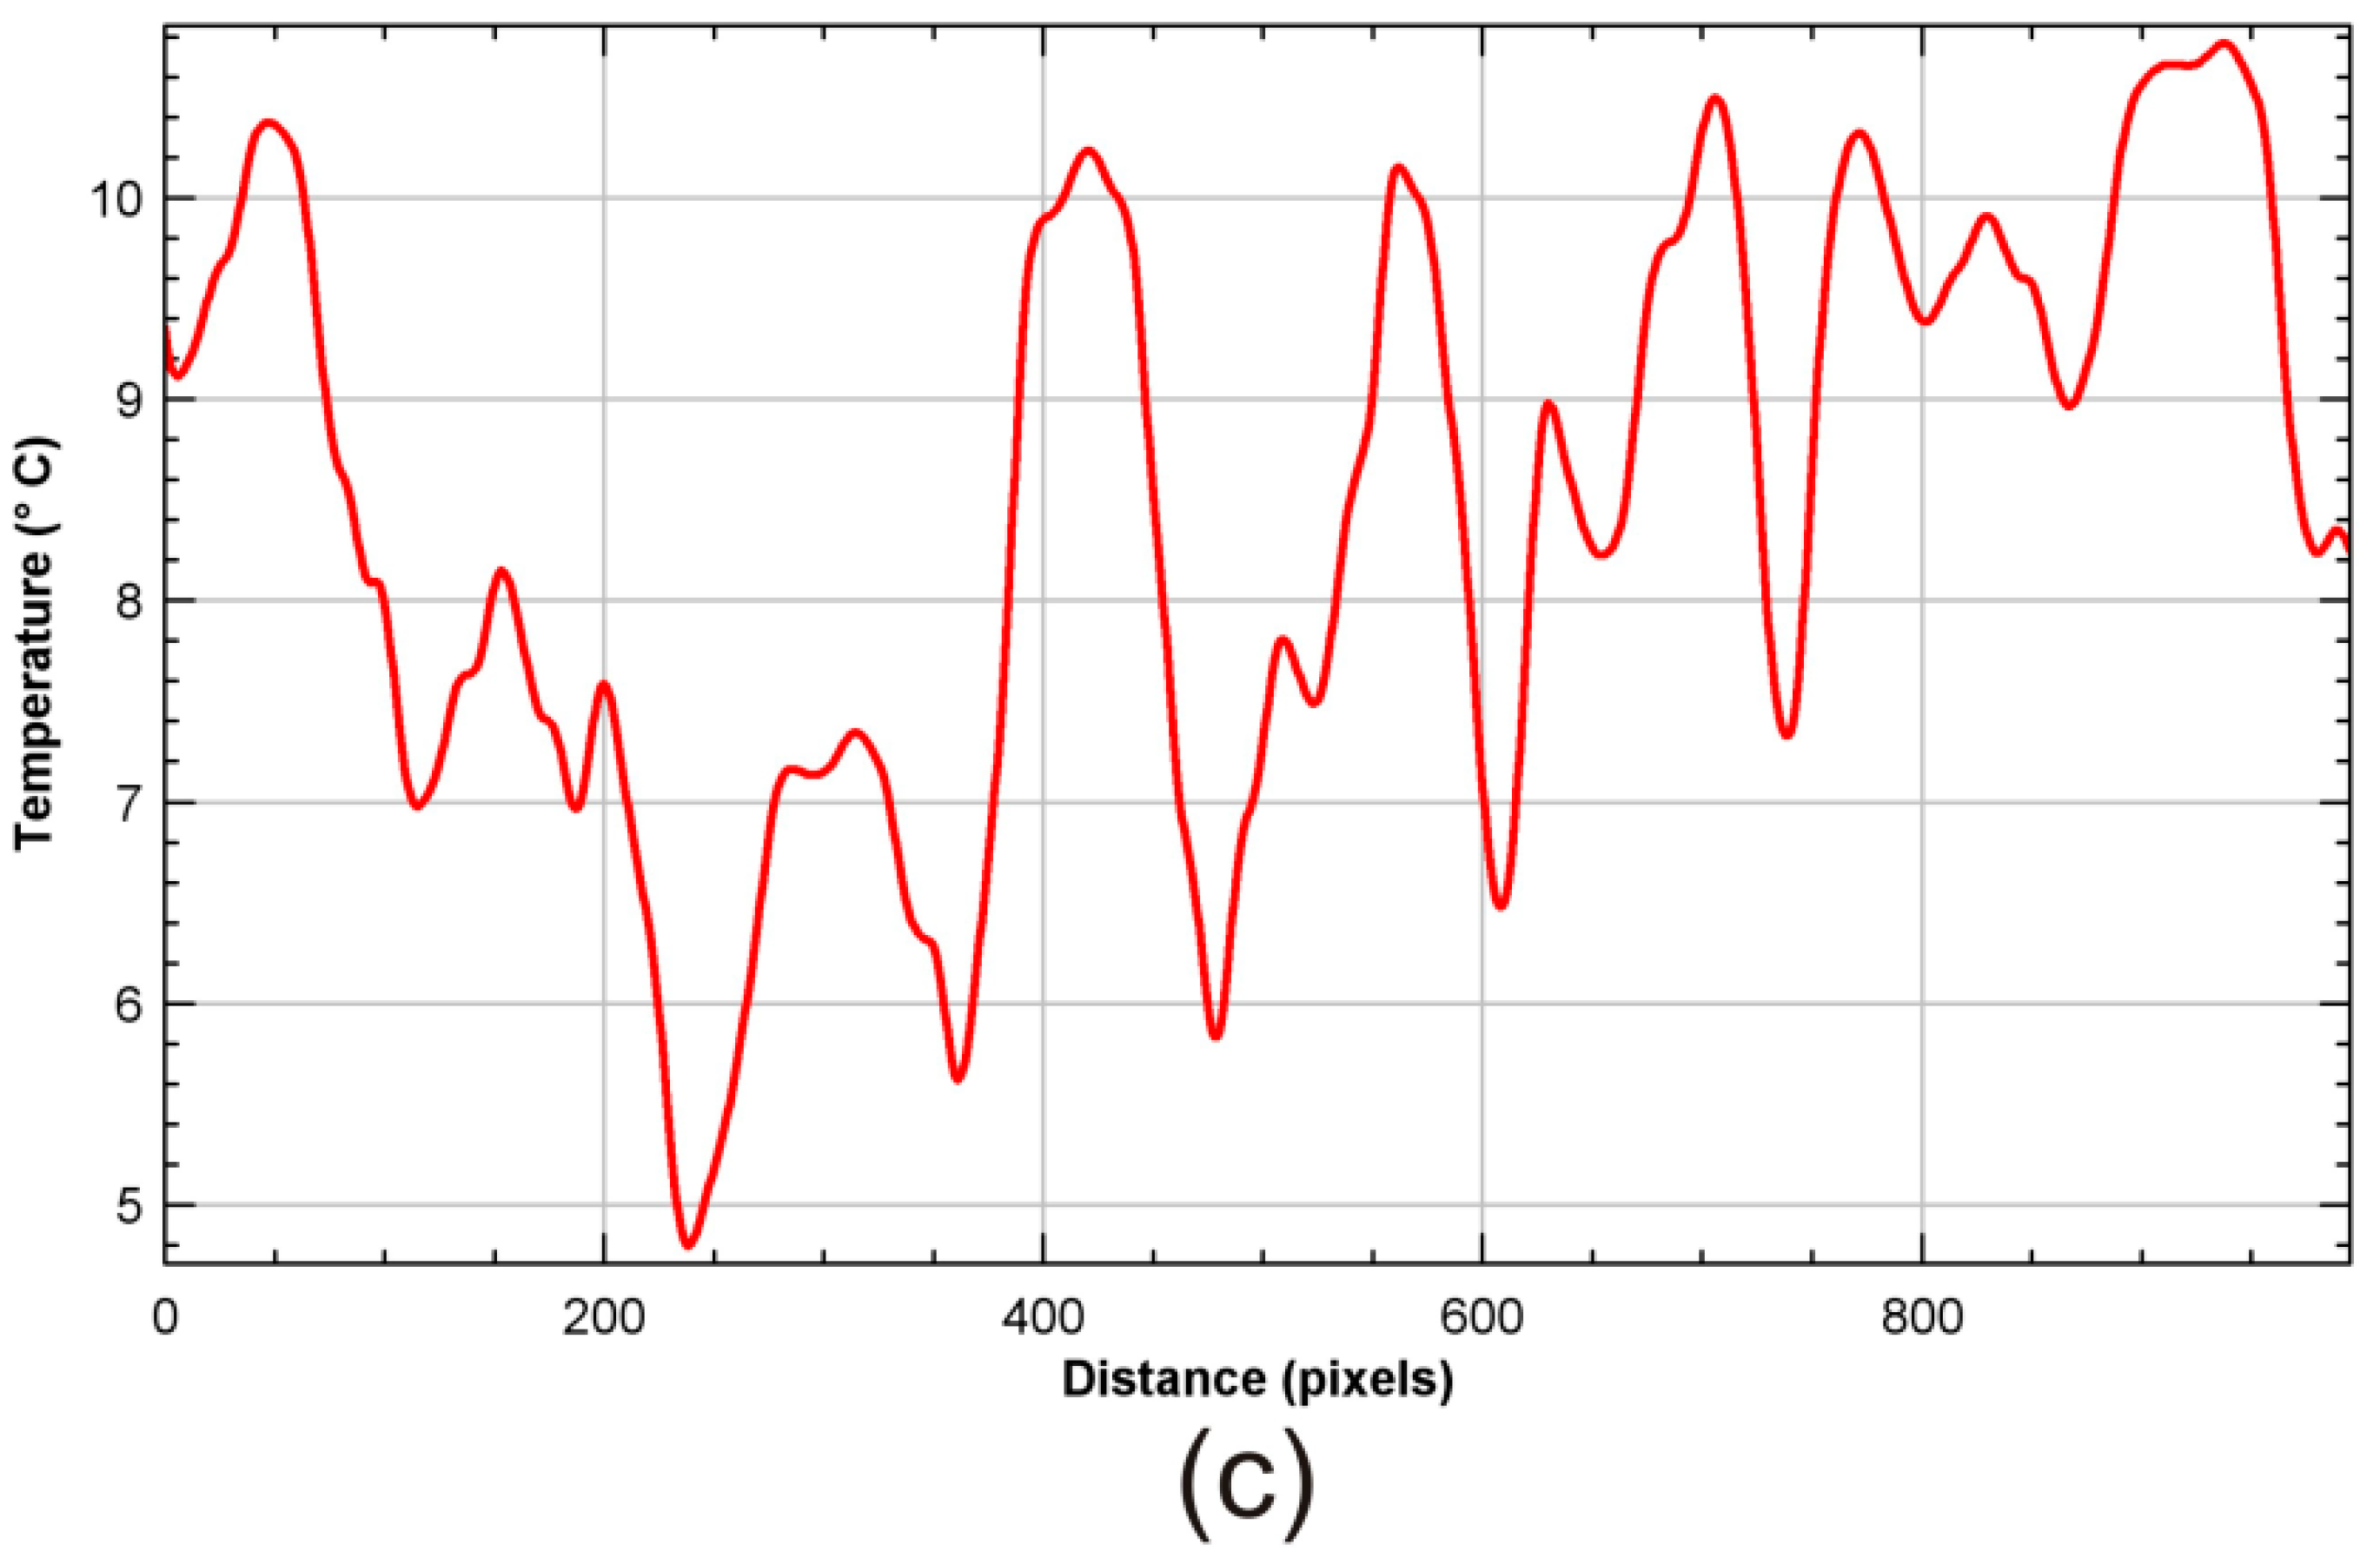
Figure 8.
Kelham church, Nottinghamshire, U.K., the exterior north wall of the chancel (a) under normal diffuse daylight conditions, as seen by the unaided eye; (b) in the thermal infrared with high-contrast LUT applied; (c) k-means clustering of the thermal image with eight clusters, and (d) k-means clustering of the thermal image with 16 clusters.

Figure 9.
Kelham church, Nottinghamshire, U.K., the exterior north wall of the chancel: (a) surface thermal roughness using a Gaussian filter; (b) 3D plot of thermal values for comparison.
Figure 9.
Kelham church, Nottinghamshire, U.K., the exterior north wall of the chancel: (a) surface thermal roughness using a Gaussian filter; (b) 3D plot of thermal values for comparison.


Table 1.
Properties for commonly encountered historic building materials [20].
Table 1.
Properties for commonly encountered historic building materials [20].
| Material | Emissivity ε | Specific Heat Capacity Cp J/kgK | Thermal Conductivity λ J m−1 s−1 K−1 |
|---|---|---|---|
| Lime plaster | 0.90–0.91 | 910–1060 | 0.66 |
| Gypsum plaster | 0.86–0.90 | 950–1085 | 0.17 |
| Red brick | 0.92–0.93 | 960 | 0.72 |
| Oak timber | 0.80–0.95 | 2380 | 0.16 |
| Pine timber | 0.80–0.95 | 1380 | 0.12 |
| Limestone | 0.95–0.99 | 810–930 | 2.15 |
| Sandstone | 0.70–0.93 | 700–920 | 2.90 |
© 2018 by the author. Licensee MDPI, Basel, Switzerland. This article is an open access article distributed under the terms and conditions of the Creative Commons Attribution (CC BY) license (http://creativecommons.org/licenses/by/4.0/).
Share and Cite
MDPI and ACS Style
Brooke, C. Thermal Imaging for the Archaeological Investigation of Historic Buildings. Remote Sens. 2018, 10, 1401. https://doi.org/10.3390/rs10091401
AMA Style
Brooke C. Thermal Imaging for the Archaeological Investigation of Historic Buildings. Remote Sensing. 2018; 10(9):1401. https://doi.org/10.3390/rs10091401
Chicago/Turabian StyleBrooke, Christopher. 2018. "Thermal Imaging for the Archaeological Investigation of Historic Buildings" Remote Sensing 10, no. 9: 1401. https://doi.org/10.3390/rs10091401
Note that from the first issue of 2016, this journal uses article numbers instead of page numbers. See further details here.