1. Introduction
Ulaanbaatar, Mongolia (UB) is the coldest capital city, and has some of the worst air pollution in the world. In winter, concentrations of fine particulate matter (particles with aerodynamic diameter ≤2.5 μm;
) frequently exceed 500 μg/m
3, which is over 20 times the World Health Organization (WHO) guideline value that limits 24 h concentrations to 25 μg/m
3 [
1]. In a report by the World Bank, it was estimated that up to one third of the mortality in greater UB could be prevented by lowering local ambient air pollution levels to 10 μg/m
3, the WHO annual guideline [
2]. The primary source of air pollution in the UB area comes from burning coal and biomass for heating and cooking in the outskirt Ger settlements during the harsh, cold winter [
3]. Approximately 60% of UB households are located in the Ger district, and in winter these households account for up to 70% of the
emissions [
2]. Three coal-fired power plants within the city limits are also an important source of particulates, contributing approximately 27% of the annual
emissions [
3]. Air quality is worsened by the geographic position of UB, which is in a valley surrounded by mountains, and by its extreme winter weather, which is affected by the mid-continental Siberian anticyclone that causes a wintertime temperature inversion that effectively traps pollutants within the breathing level of the city’s population. Although the total population of the country is small (3.2 million), according to the National Statistical Office of Mongolia, nearly half of Mongolians live in the greater capital city area and are affected by extremely high levels of air pollution during the wintertime months (October–March) [
4].
There have been a few efforts by researchers to measure and characterize air pollution in Mongolia. An emissions inventory was developed to estimate the contributions of household and industrial sources of the major particulate (
,
) and gaseous (
,
, CO) pollutants [
3]. Chemical speciation of coarse and fine particulate matter from a two-day per week sampling campaign at the University of Mongolia in 2004–2008 showed that the dominant source of
was coal combustion, with sulfur and black carbon being the largest components of the particle mass [
5]. In another short-term seasonal sampling campaign in 2008 [
6],
analyzed for chemical speciation was significantly higher in carbon (elemental and organic) and sulfate in the winter, compared to the summer. Hasenkopf et al. [
7] imaged particles from a site located 600 m from the Ger district from June 2012 to March 2013 using transmission electron microscopy and ice nucleation coupled with microscopy to determine their shape (spherical, fractal, irregular) and type (mineral dust, soot, sulfate/organic). They found the collected samples primarily consisted of spherical particles with sulfate/organic composition and that, in winter months, when the concentrations of PM increased, so did their sulfur content. Furthermore, spherical particles were most generally related to PM with aerodynamic diameter ≤2.5 μm, and over the study period 99% of the particles sampled were smaller than 10 μm in diameter.
Despite the magnitude and severity of the air pollution problem in UB, this issue has garnered little attention outside of Mongolia. There have been very few health effects studies with adequate exposure assessment because of scarce resources and inadequate coverage of monitoring stations. Ground measurements of air pollutants in the region are sparse, with only three
monitoring sites providing inconsistent data, and one primary weather station. Harnessing satellite observations of aerosol optical depth (AOD) to provide air pollution estimates in regions where ground-level monitoring is severely lacking has been instrumental in global studies [
8,
9]. The two most common polar-orbiting satellite instruments providing AOD, the Moderate Resolution Imaging Spectroradiometer (MODIS) and Multi-angle Imaging SpectroRadiometer (MISR) onboard the NASA Terra Earth Observing System (EOS) satellite, launched in 1999, have been used in global estimation of
. One limitation of aerosol remote sensing is the difficulty in discerning the contribution of aerosol atmospheric scattering from bright surface reflectance, such as desert or snow. In Mongolia, where long winters come with snow cover for 4–6 months of the year, this is a major issue. MISR is regarded as providing one of the most reliable satellite based aerosol products over land [
10], and with its nine camera angles it has been shown to reliably retrieve particle optical and microphysical properties over bright surfaces [
11,
12] more effectively than other instruments [
13]. MISR also has the capability of distinguishing AOD by its component-particle optical properties covering ranges of “small”, “medium”, and “large” nonabsorbing, absorbing, spherical, and randomly oriented nonspherical types [
12,
14]. These properties have been used to develop the current 74 MISR aerosol mixtures [
12,
14], which are related to particle composition, and are a key factor in the performance of the AOD retrieval [
15].
In this paper we evaluate the new 4.4 km MISR Version 23 (V23) global aerosol product in its ability to estimate air pollution concentrations over Ulaanbaatar, Mongolia. In our evaluation, we first compare MISR and AERONET AOD observed at the only location in Mongolia, Dalanzadgad, which is 300 km southwest of UB. We then apply several machine learning methods to AOD retrieved from the complete set of 74 MISR mixtures to determine the best performing method of estimating ground-level , , and concentrations.
2. Materials and Methods
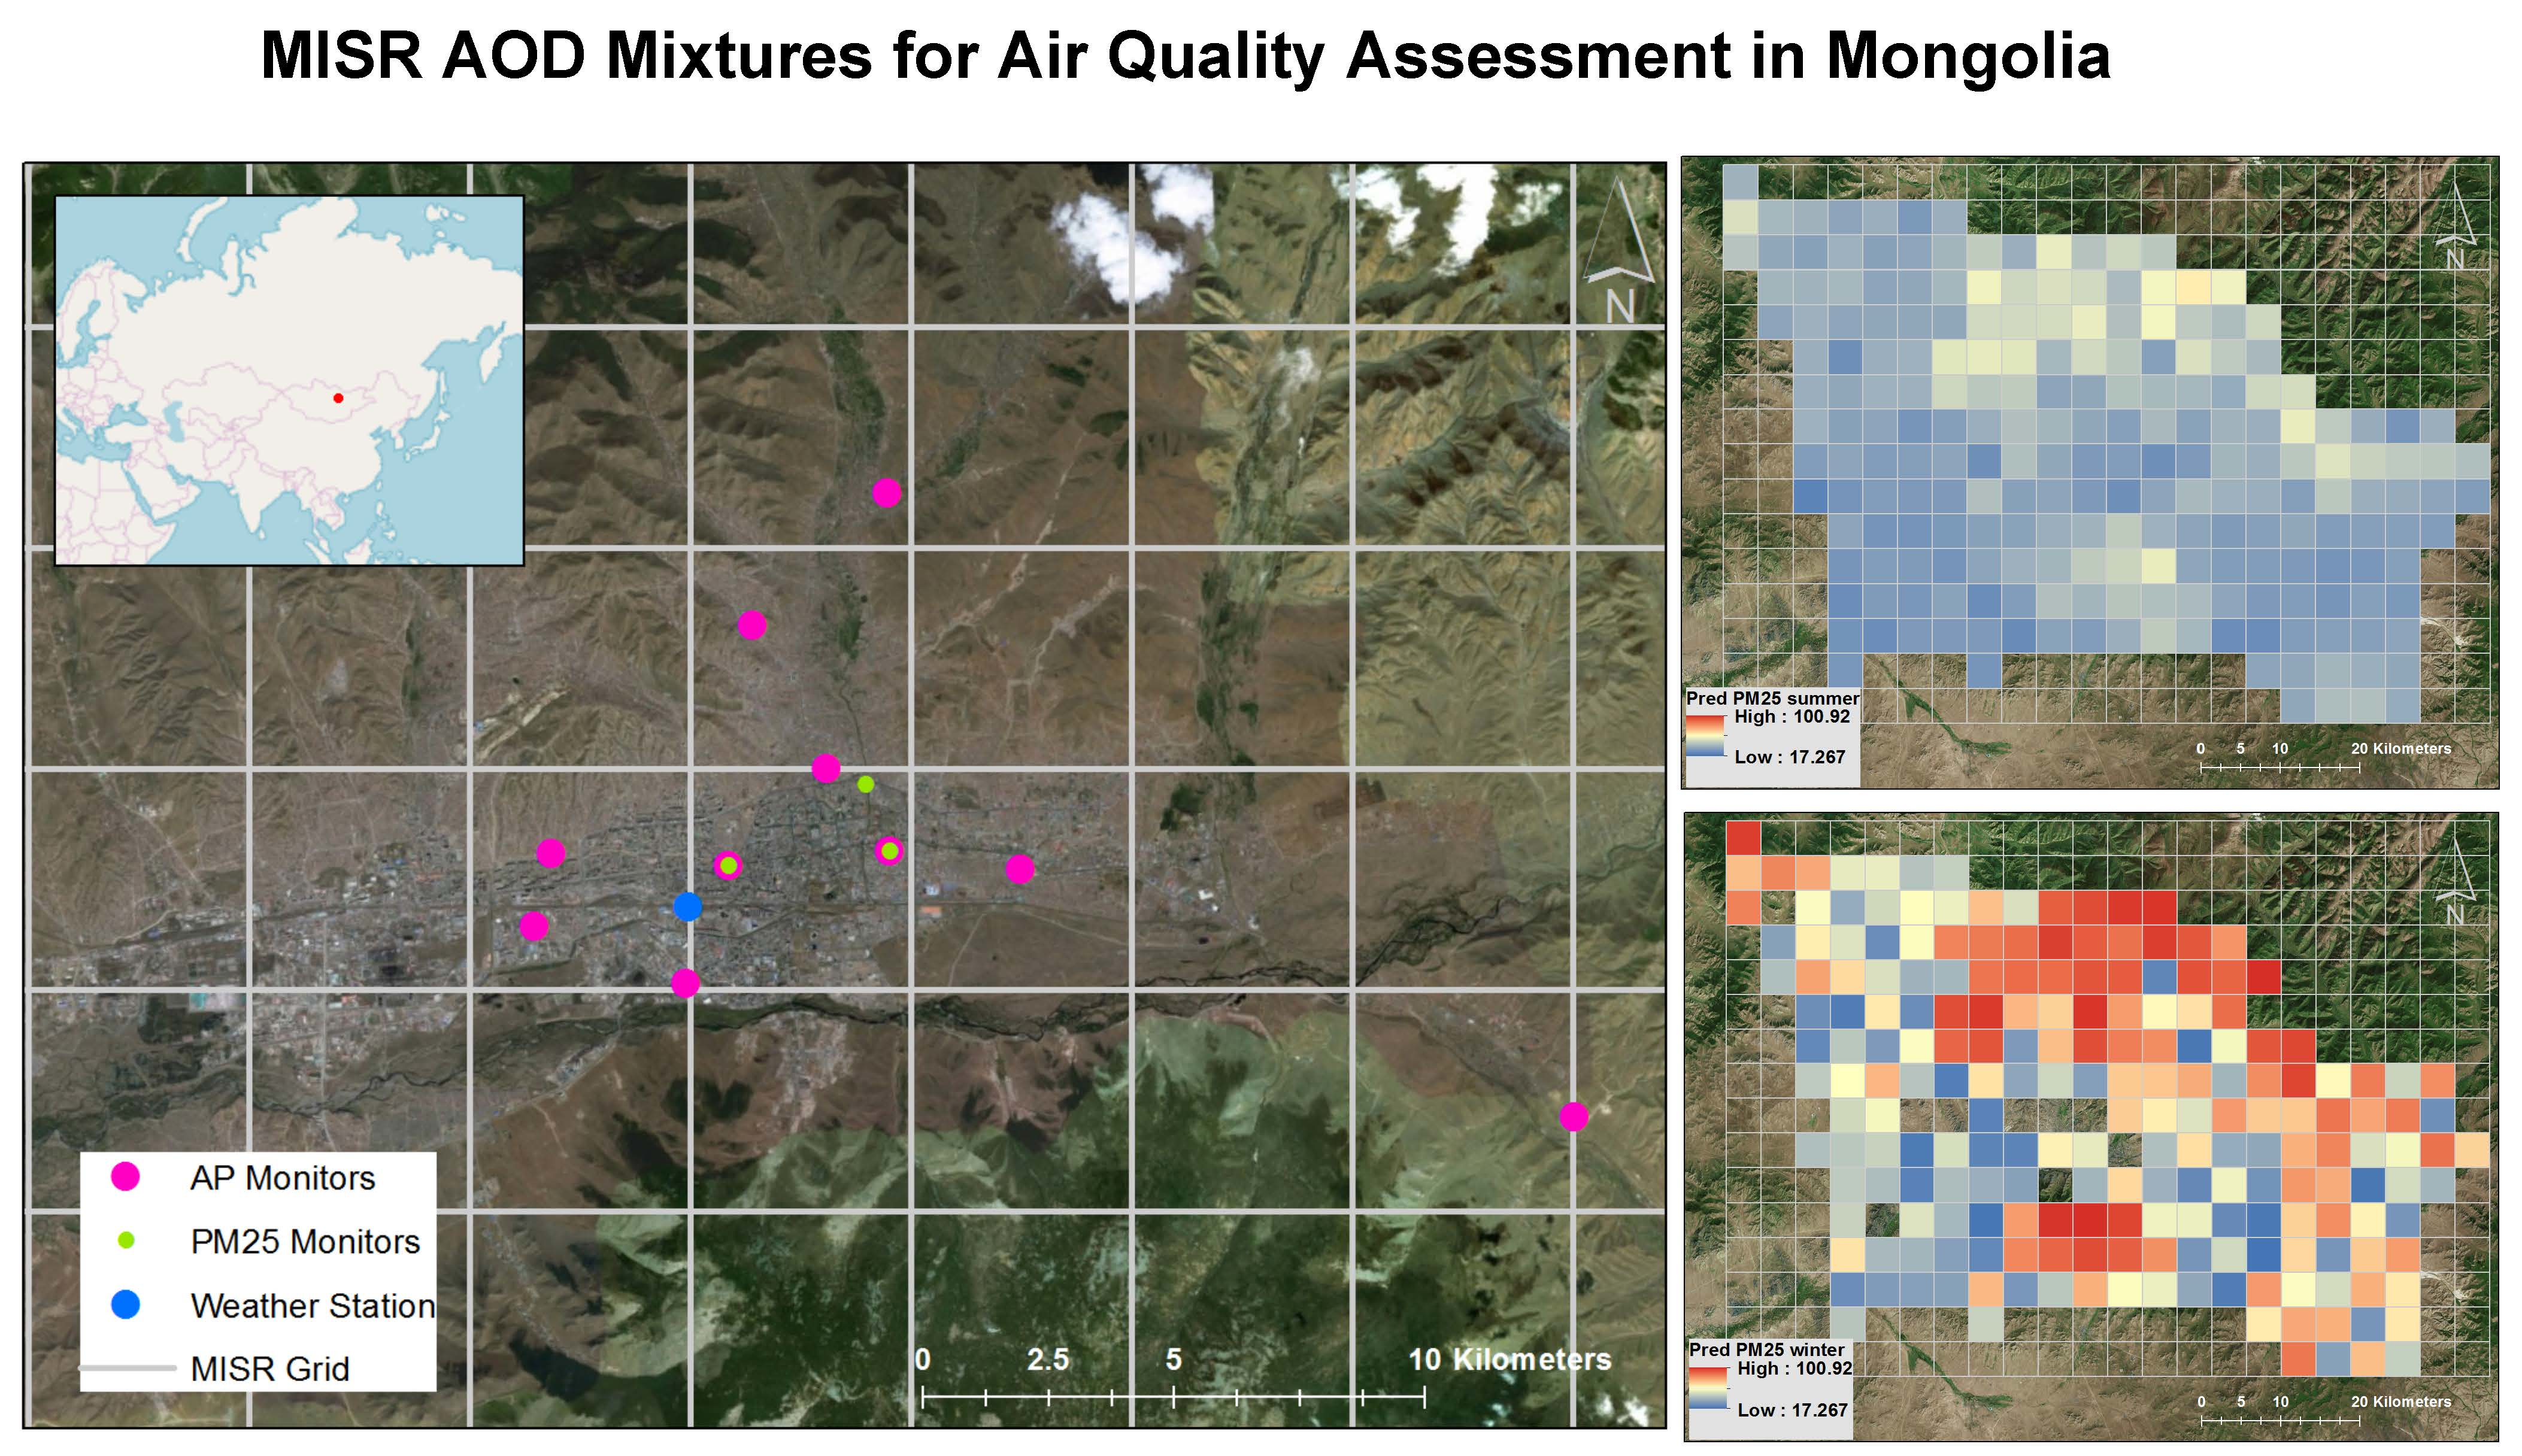
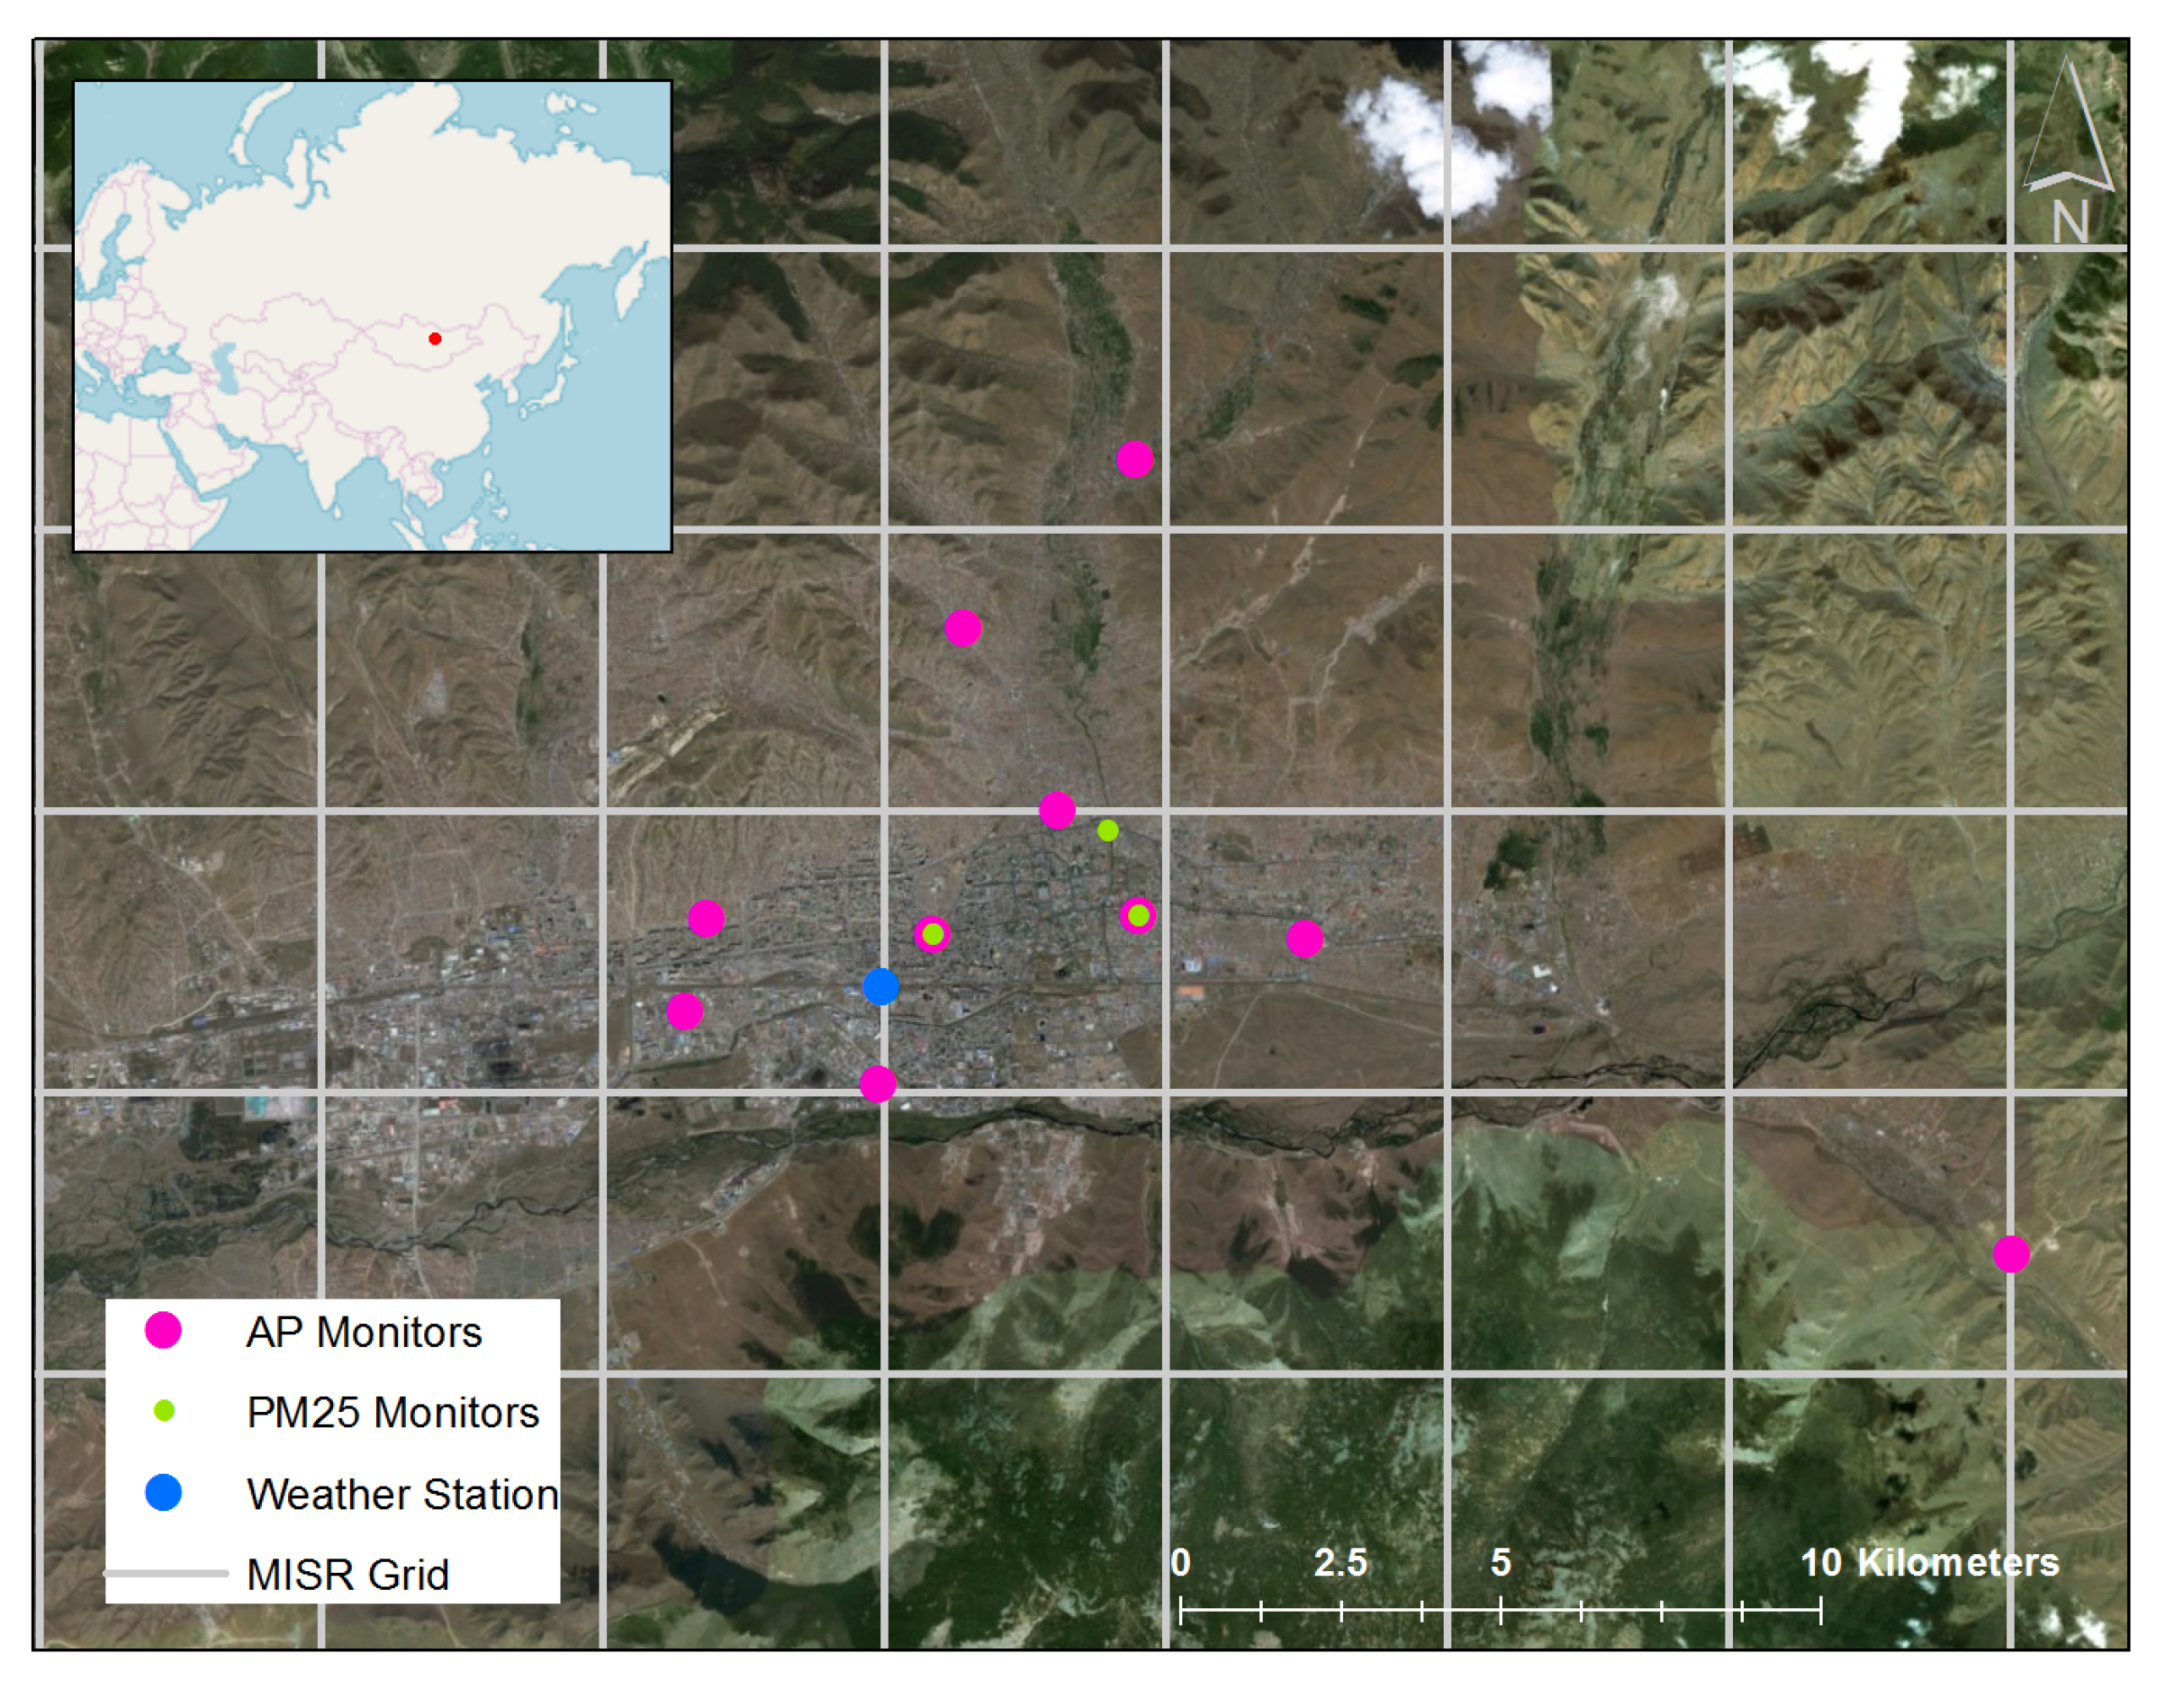
Ulaanbaatar is located at approximately 1300 m above sea level 47.920°N, 106.920°E, along the Tuul River in a valley at the foot of Bogd Khan Mountain (
Figure 1). Due to its high elevation, relatively northerly latitude, and distance from the Pacific Ocean, UB experiences an extreme continental climate with long winters and short summers. Mongolian winters are cold and clear, and in UB specifically, winter is typically characterized by clear skies, weak synoptic winds, and a temperature inversion under the influence of a Siberian high pressure anticyclone [
16]. Summer (June through August) is warm and dry, with highs between 20–25 °C, low humidity, and average monthly precipitation of approximately 60 mm. In this study we examine data from January 2011 through December 2016. During this period, there was snow cover in UB between 90% to 100% of the days in the months of November through February, and there was some snow in all other months with the exception of June, July, and August [
17].
2.1. Air Pollution Monitoring Data
There are 10 air pollution monitoring stations in UB operated by the Mongolia National Agency for Meteorology and Environmental Monitoring (NAMEM) (
Figure 1). All 10 monitoring stations have been measuring sulfur dioxide (
), nitrogen dioxide (
), carbon monoxide (CO), and ozone (
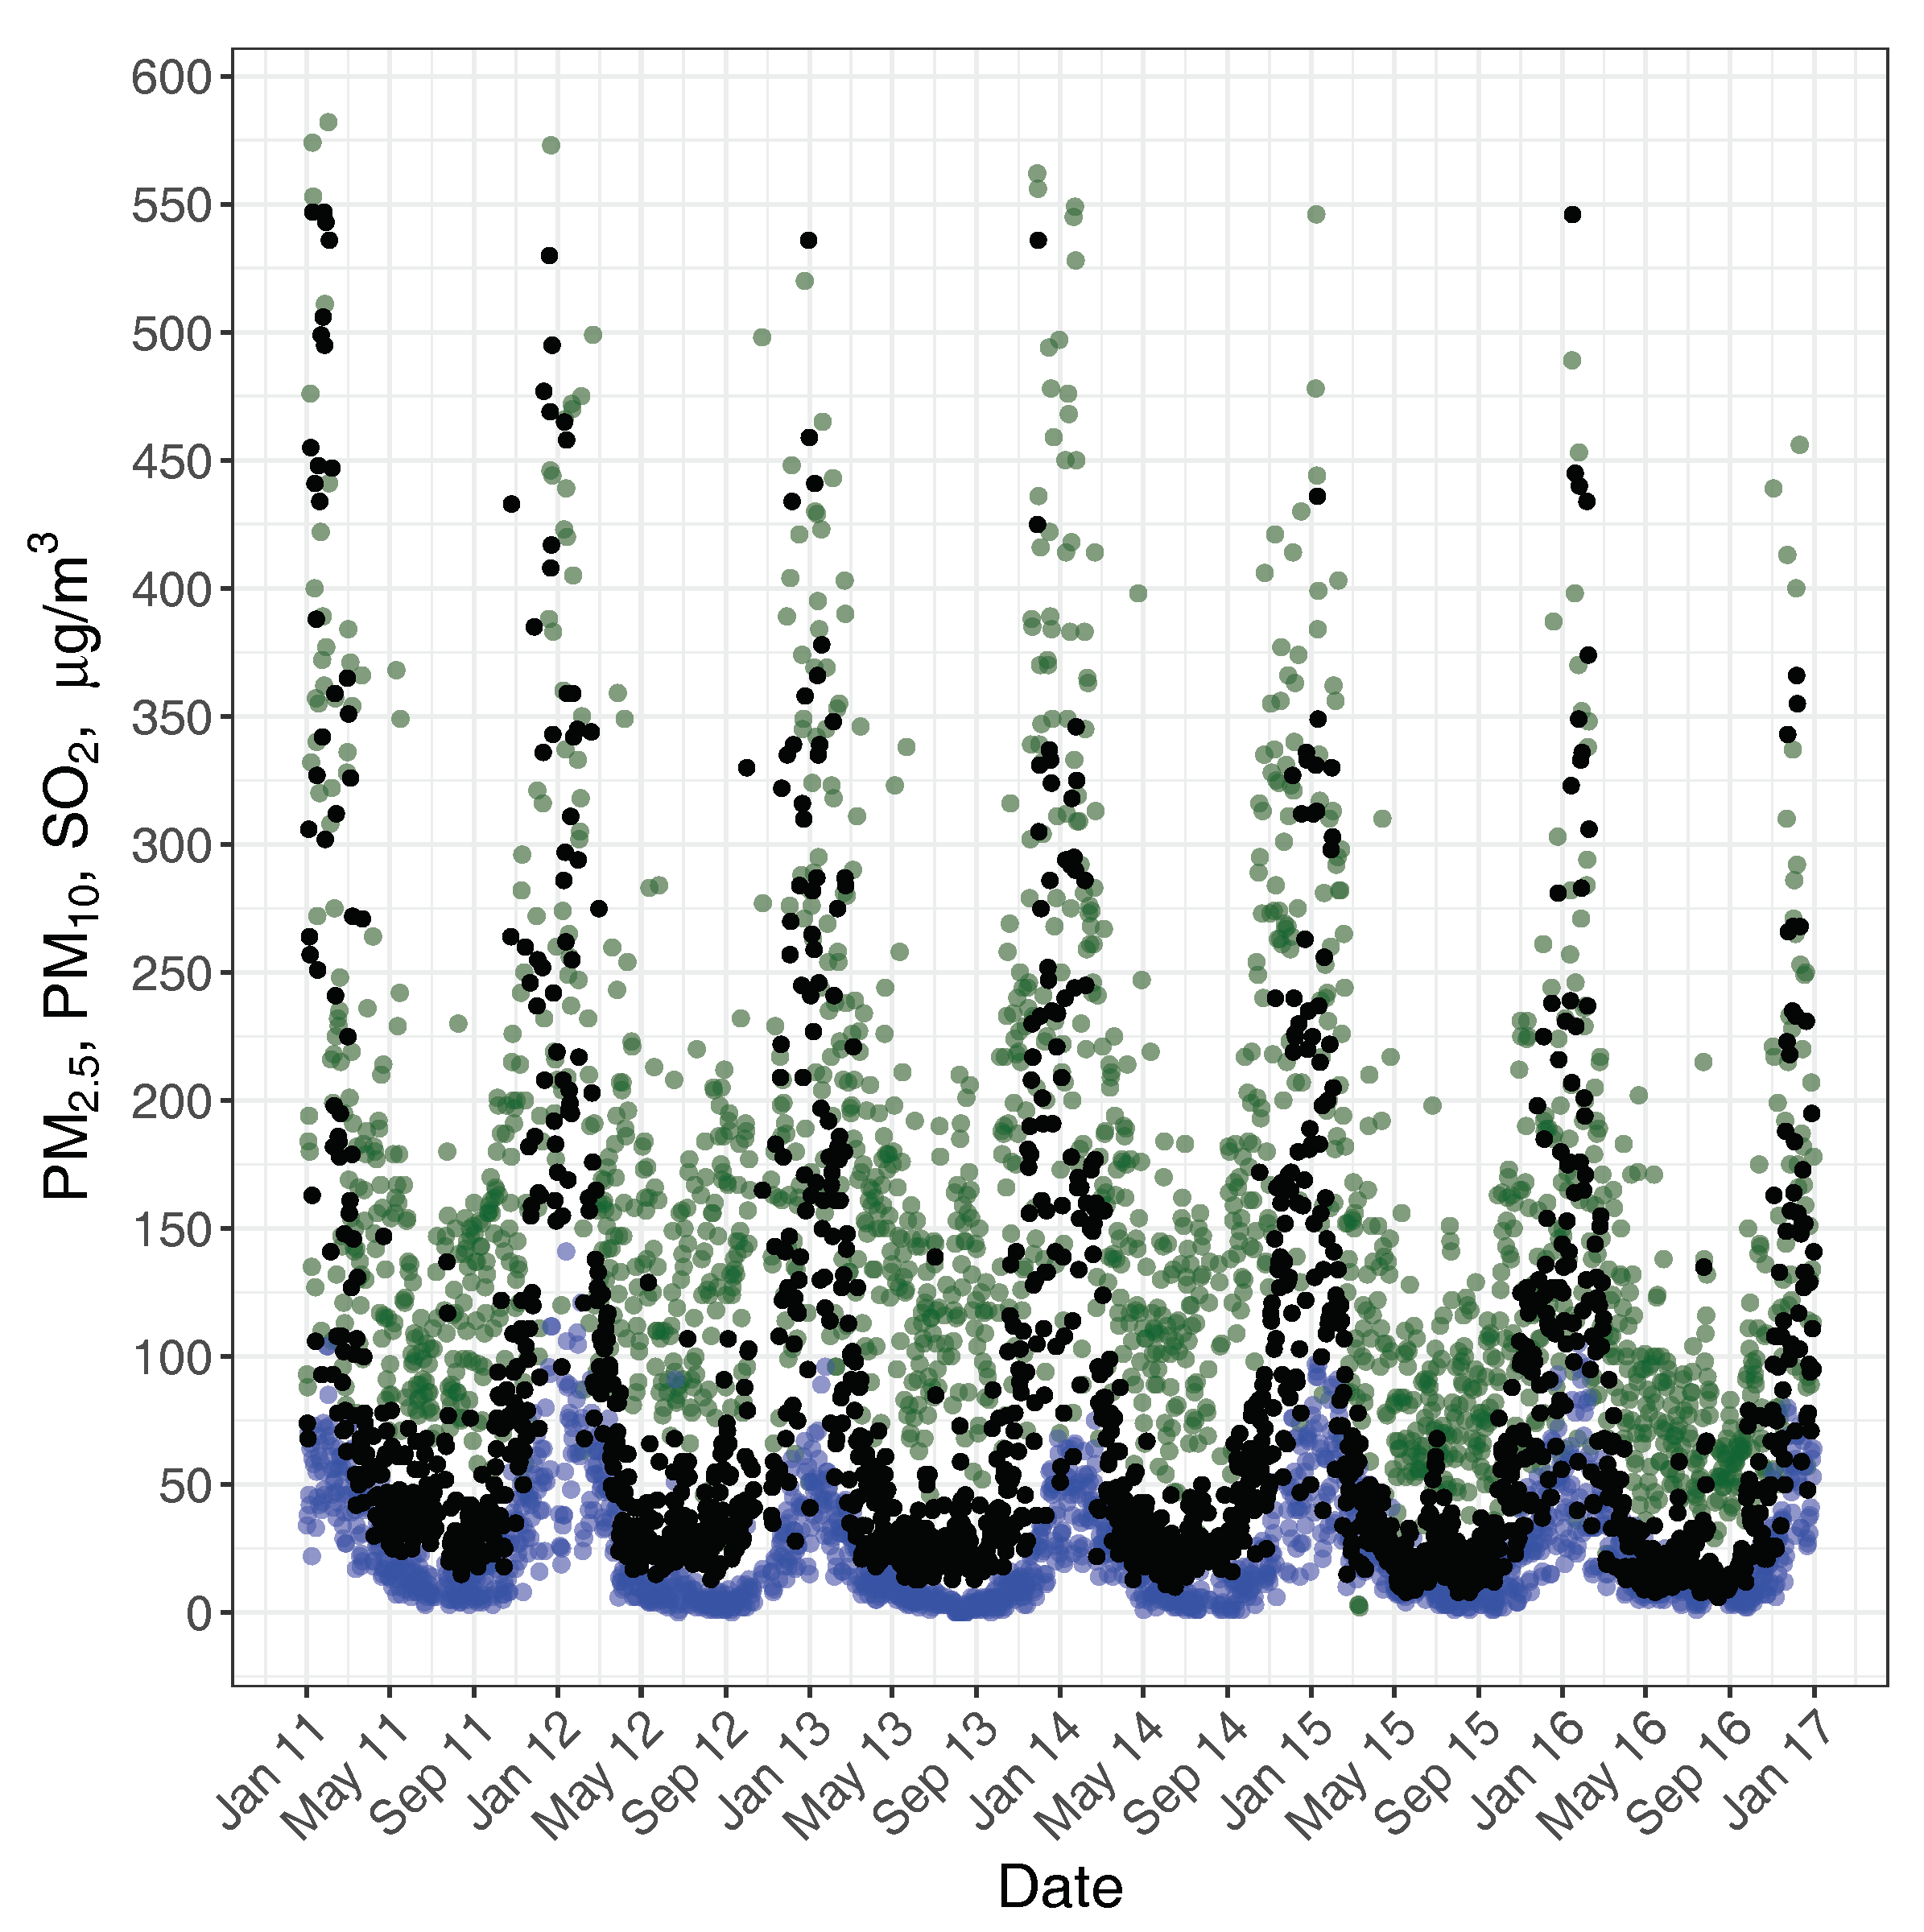
) since 2011. Of the 10 sites, 8 measure
and only 2 measure
mass concentrations using tapered element oscillating microbalances (
Figure 2). In October 2015 the U.S. Embassy in UB started measuring
using a United States Environmental Protection Agency (EPA)-certified Met One BAM-1020, which is a stepwise, semi-continuous Beta Attenuation mass measurement method. We focus on estimating
,
, and
from AODs from the 74 MISR aerosol mixtures. Since AOD is a measure of total column aerosol, it is most clearly associated with ground-level PM. However, given the contribution of sulfur-rich coal burning in the area and the oxidation process of
to
(sulfate) [
18], we also investigate
as a good proxy for
sulfate particles.
2.2. MISR AOD and AOD Mixtures
The MISR instrument onboard the NASA Terra Satellite has been collecting data from nine different camera angles and four spectral bands since early 2000. Its configuration is such that it has local overpass approximately every five days around 12:00 LT (04:00 UTC). The previous Level 2 (swath-based) version of the MISR aerosol product, Version 22 (V22), was reported on a spatial grid at 17.6 km resolution. The entire MISR mission, going back to March 2000, has been reprocessed with the new version of the algorithm, V23, which is now reported on a spatial grid with 4.4 km resolution [
19]. Additional improvements to the algorithm have been made, especially for retrievals over water [
20]. Besides total column AOD, the V23 aerosol product includes component-particle optical properties covering ranges of “small”, “medium”, and “large” nonabsorbing, absorbing, spherical, and randomly oriented nonspherical, which are the same types used in the V22 MISR aerosol product. Detailed information about the particle models and the proportions of these components that make up the 74 mixtures can be found in Kahn and Gaitley [
14]. Mixtures designated with numbers from 1 to 30 are made up of spherical, non-absorbing components. Mixtures with numbers in the range from 31 to 50 contain spherical, absorbing components, while mixture numbers from 51 to 74 contain nonspherical, dust analogues. The MISR particle properties have been analyzed globally, and they provide robust aerosol-type classification for distinguishing aerosol mass types including polluted, smoky, maritime, and dusty conditions [
12,
14]. In this study we only considered V23 aerosol retrievals that reported a successful AOD for the complete set of 74 mixtures, matching pixels from available MISR overpasses to the nearest air pollution monitor reporting
,
or
.
The V23 product is provided as Network Common Data Form 4 (NetCDF4) with total AOD reported in the NetCDF4 group “4.4_KM_PRODUCTS” at a wavelength of 550 nm (mid-visible) in the variable “Aerosol_Optical_Depth”. The AOD at 550 nm for each of the 74 aerosol mixtures is reported in the “AUXILIARY” subgroup in the variable “Aerosol_Optical_Depth_Per_Mixture”. We further examined the variable “Aerosol_Optical_Depth_Raw”, contained in the same subgroup. Like the “Aerosol_Optical_Depth_Per_Mixture” variable, this field is reported for a wider range of conditions than the preferred AOD variable, primarily due to stricter cloud screening applied to the “Aerosol_Optical_Depth" variable. In particular, we found that an “Aerosol_Optical_Depth_Raw” retrieval could be reported where the “Aerosol_Retrieval_Screening_Flags” variable was set to “Near Cloud” while the “Aerosol_Optical_Depth” did not contain a valid retrieval. In the following, AOD will refer to the “Aerosol_Optical_Depth” variable, while AOD_raw will refer to “Aerosol_Optical_Depth_Raw” when discussing MISR V23 aerosol retrievals.
2.3. MISR Validation with AERONET at Dalanzadgad
The Aerosol Robotic Network (AERONET) instrument network of ground-based sun photometers derive AOD at a number of visible and near-infrared wavelengths from direct sun observations and serves as the primary standard for validating satellite aerosol products [
21]. As MISR V23 AOD retrievals have not been formally validated over Mongolia, we conducted a comparison of both AOD and AOD_raw with AOD measured by AERONET at the only site in Mongolia—Dalanzadgad. Dalanzadgad is approximately 300 km south of UB and has similar climatology as UB. However, Dalanzadgad does not experience the inversion layer and therefore has much lower pollution levels than those seen in the capital.
We temporally matched AERONET and MISR within a 15 min time window of the Terra satellite overpass, and took the closest spatial match (within 4.4 km) to the AERONET site for MISR observations in three paths (131, 132, and 133). We used the latest version of the AERONET processing, Version 3, Level 2.0 “AllPoints” data obtained from
https://aeronet.gsfc.nasa.gov/, and conducted the validation for the entire MISR mission starting from the year 2000. To compare to the MISR V23 AODs reported at 550 nm, we interpolated (in log–log space) the available AERONET spectral AODs using a second order polynomial fit [
22]. Expected error envelopes around the 1-to-1 line were constructed using the greater of 0.05 or 0.2 × AOD following Kahn et al. [
12].
2.4. Air Pollution Prediction Using Machine Learning Methods
Seasonally stratified principal component analyses (PCA) were used as an exploratory tool to better understand which combinations of the 74 MISR mixtures explained the highest proportion of boreal winter (October–March) and boreal summer (April–September) variance in the observed AOD. For exploratory PCA, all complete sets of 74 mixtures over the UB region in the 2011–2016 time range were examined. In these analyses, the retrievals were not required to be spatially and temporally matched with air pollution observations. Heatmaps were constructed to visualize the mixture correlations and groupings.
To estimate ground-level
,
, and
concentrations from the satellite retrievals, several machine learning methods were applied to the high-dimensional set of AODs from the 74 MISR mixtures. We compared K-nearest neighbors (KNN), Least Absolute Shrinkage and Selection Operator (LASSO), Gradient Boosting (GB), Random Forests (RF), and Support Vector Machines (SVM), all within a regression setting [
23]. A brief description of each method is provided in
Table 1.
For each machine learning method, we repeated the tuning–training–prediction process 50 times with different random seeds to avoid spurious results. In each of the 50 iterations, we first randomly split the data into a 70% training and a 30% test set. We then tuned for the method-specific parameter(s) using five-fold cross-validation (due to sample size constraints) on the training set, with cross-validation as the measure of performance. After tuning, we trained the models on the training set and predicted on the test set using test as the final measure of performance.
3. Results
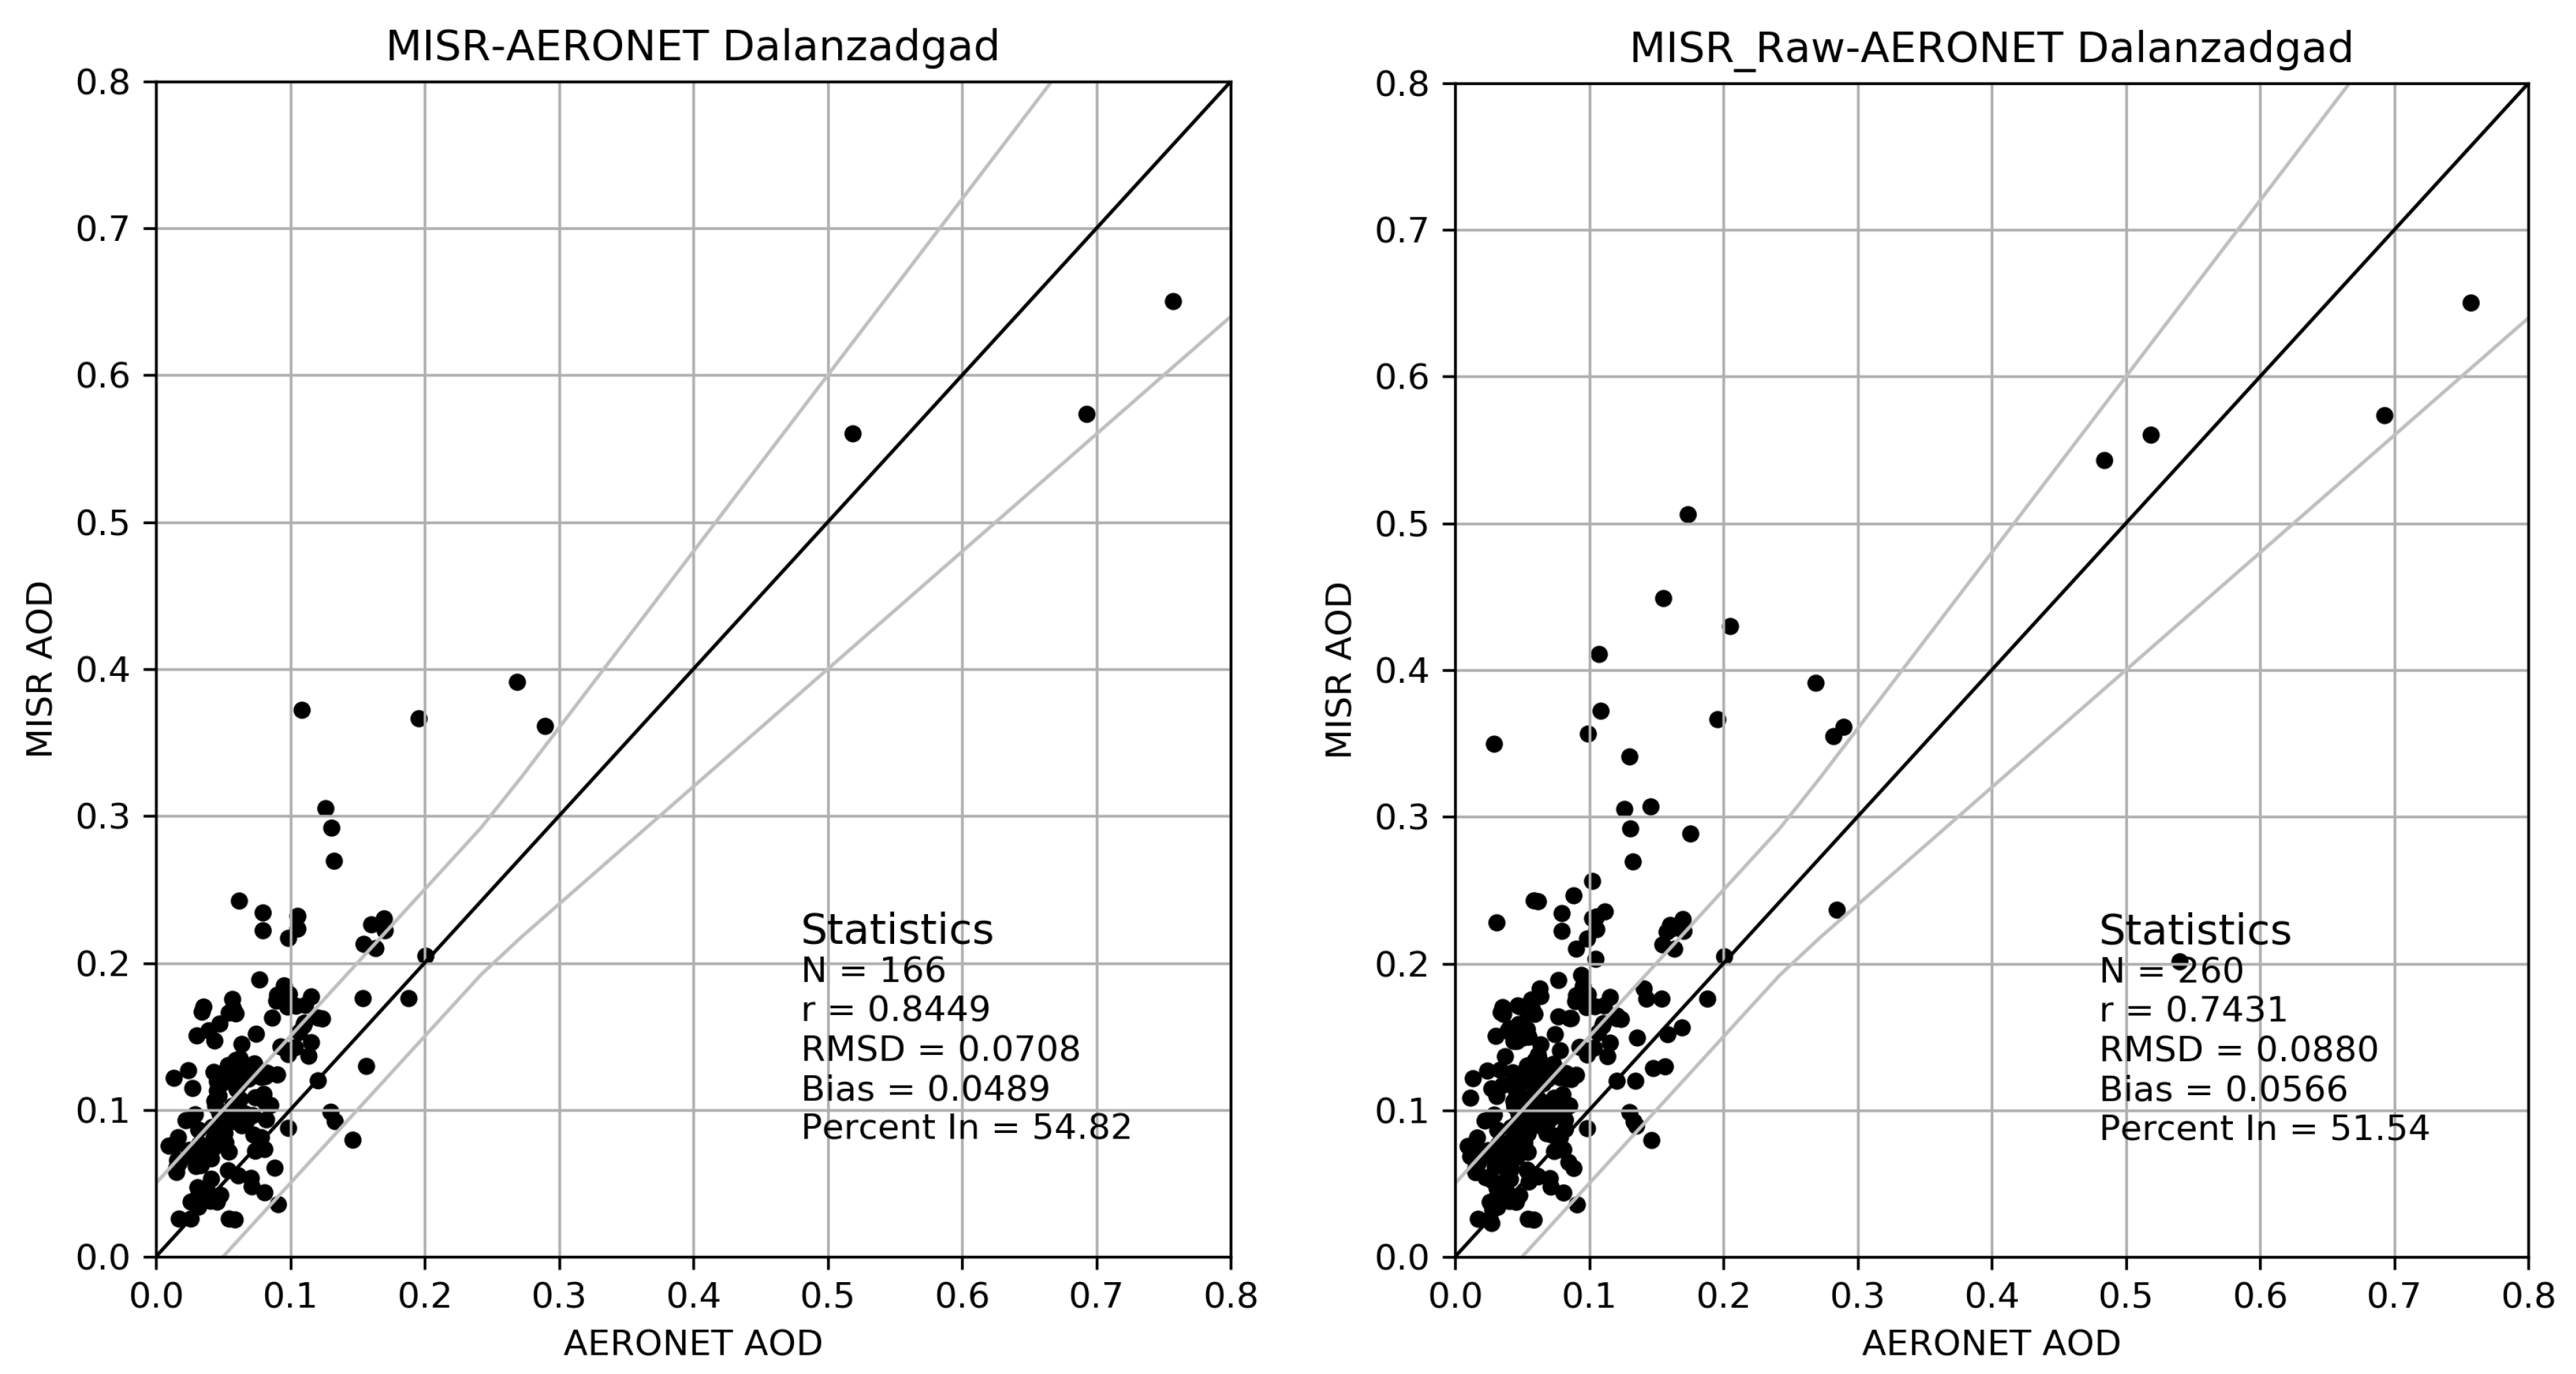
The results of the validation of the MISR V23 AOD and AOD_raw retrievals against AOD interpolated to 550 nm from the Dalanzadgad AERONET site are shown in
Figure 3. For the validation, there were 57% more AOD_raw (
N = 260) than AOD observations (
N = 166) due to the application of stricter cloud screening to the reported AOD results. The tradeoff for more data is that the correlation with AERONET is lower (r = 0.7502 vs. 0.8505), and the root-mean-square deviation (RMSD) is higher (RMSD = 0.0877 vs. 0.0712). The modest under-performance of AOD_raw is further evident in the percentage of retrievals that fall within the expected error (EE) envelopes. Approximately 52% of the AOD_raw and 55% of AOD retrievals are within the greater of 0.05 or 0.2 × AERONET AOD. Finally, the AOD_raw retrievals have a slightly larger bias (0.0566) relative to AERONET than the more strictly cloud-screened AOD (0.0489). Overall, both types of V23 MISR AOD retrievals show good performance relative to AERONET for the Dalanzadgad site. By way of comparison, Kahn et al. [
12] in their validation of the V22 MISR AOD for this site found similar performance relative to AERONET (
N = 86, r = 0.825, bias = 0.055, and 59.30% of the retrievals within the EE envelope). While there is clear evidence in the V23 results of an AOD overestimation at small to moderate values of AERONET AOD (
Figure 3), at the largest values the retrievals are within the EE envelope. However, the sample size at large AOD values is too small to reveal whether there is a general underestimation at high AOD values, as was the case for the V22 MISR AOD retrievals [
12].
Results from the principal component analyses of the 74 mixtures indicate that the first three components explain approximately 95% of the variability in AOD (
Table 2). To help visualize the differences in mixture categories the spherical, non-absorbing mixtures (1–30) are shown in normal text; the spherical, absorbing mixtures (31–50) are in
bold; and the nonspherical mixtures (51–74) are shown in
italics. Note that the top 10 mixtures are listed in numerical order within each principal component (PC) and mixtures can contribute to multiple PCs, but typically with very different weights. Although there is a significant difference in sample size when the data were stratified, the top 10 mixture combinations in the first PC are remarkably similar across seasons and the percentage of the variance explained is nearly identical. The major distinction is that a greater percentage of the variability in boreal winter (∼7%) is explained by small, spherical, non-absorbing particles. These particles do not appear in the boreal summer PC, and are likely attributable to sulfates, which are dominant in the winter. Another important difference is the larger proportion of variability (∼4%) explained in the boreal summer by medium and large non-spherical dust particles (mixtures 65–74), likely attributable to transported dust from the Gobi Desert.
Approximately 75% of the matches between MISR and the air pollution stations had minimum distances greater than 10 km (
Table 3). As expected, the number of matched data points was larger for
and
due to a larger number of ground-based monitors (10 and 8, respectively) than
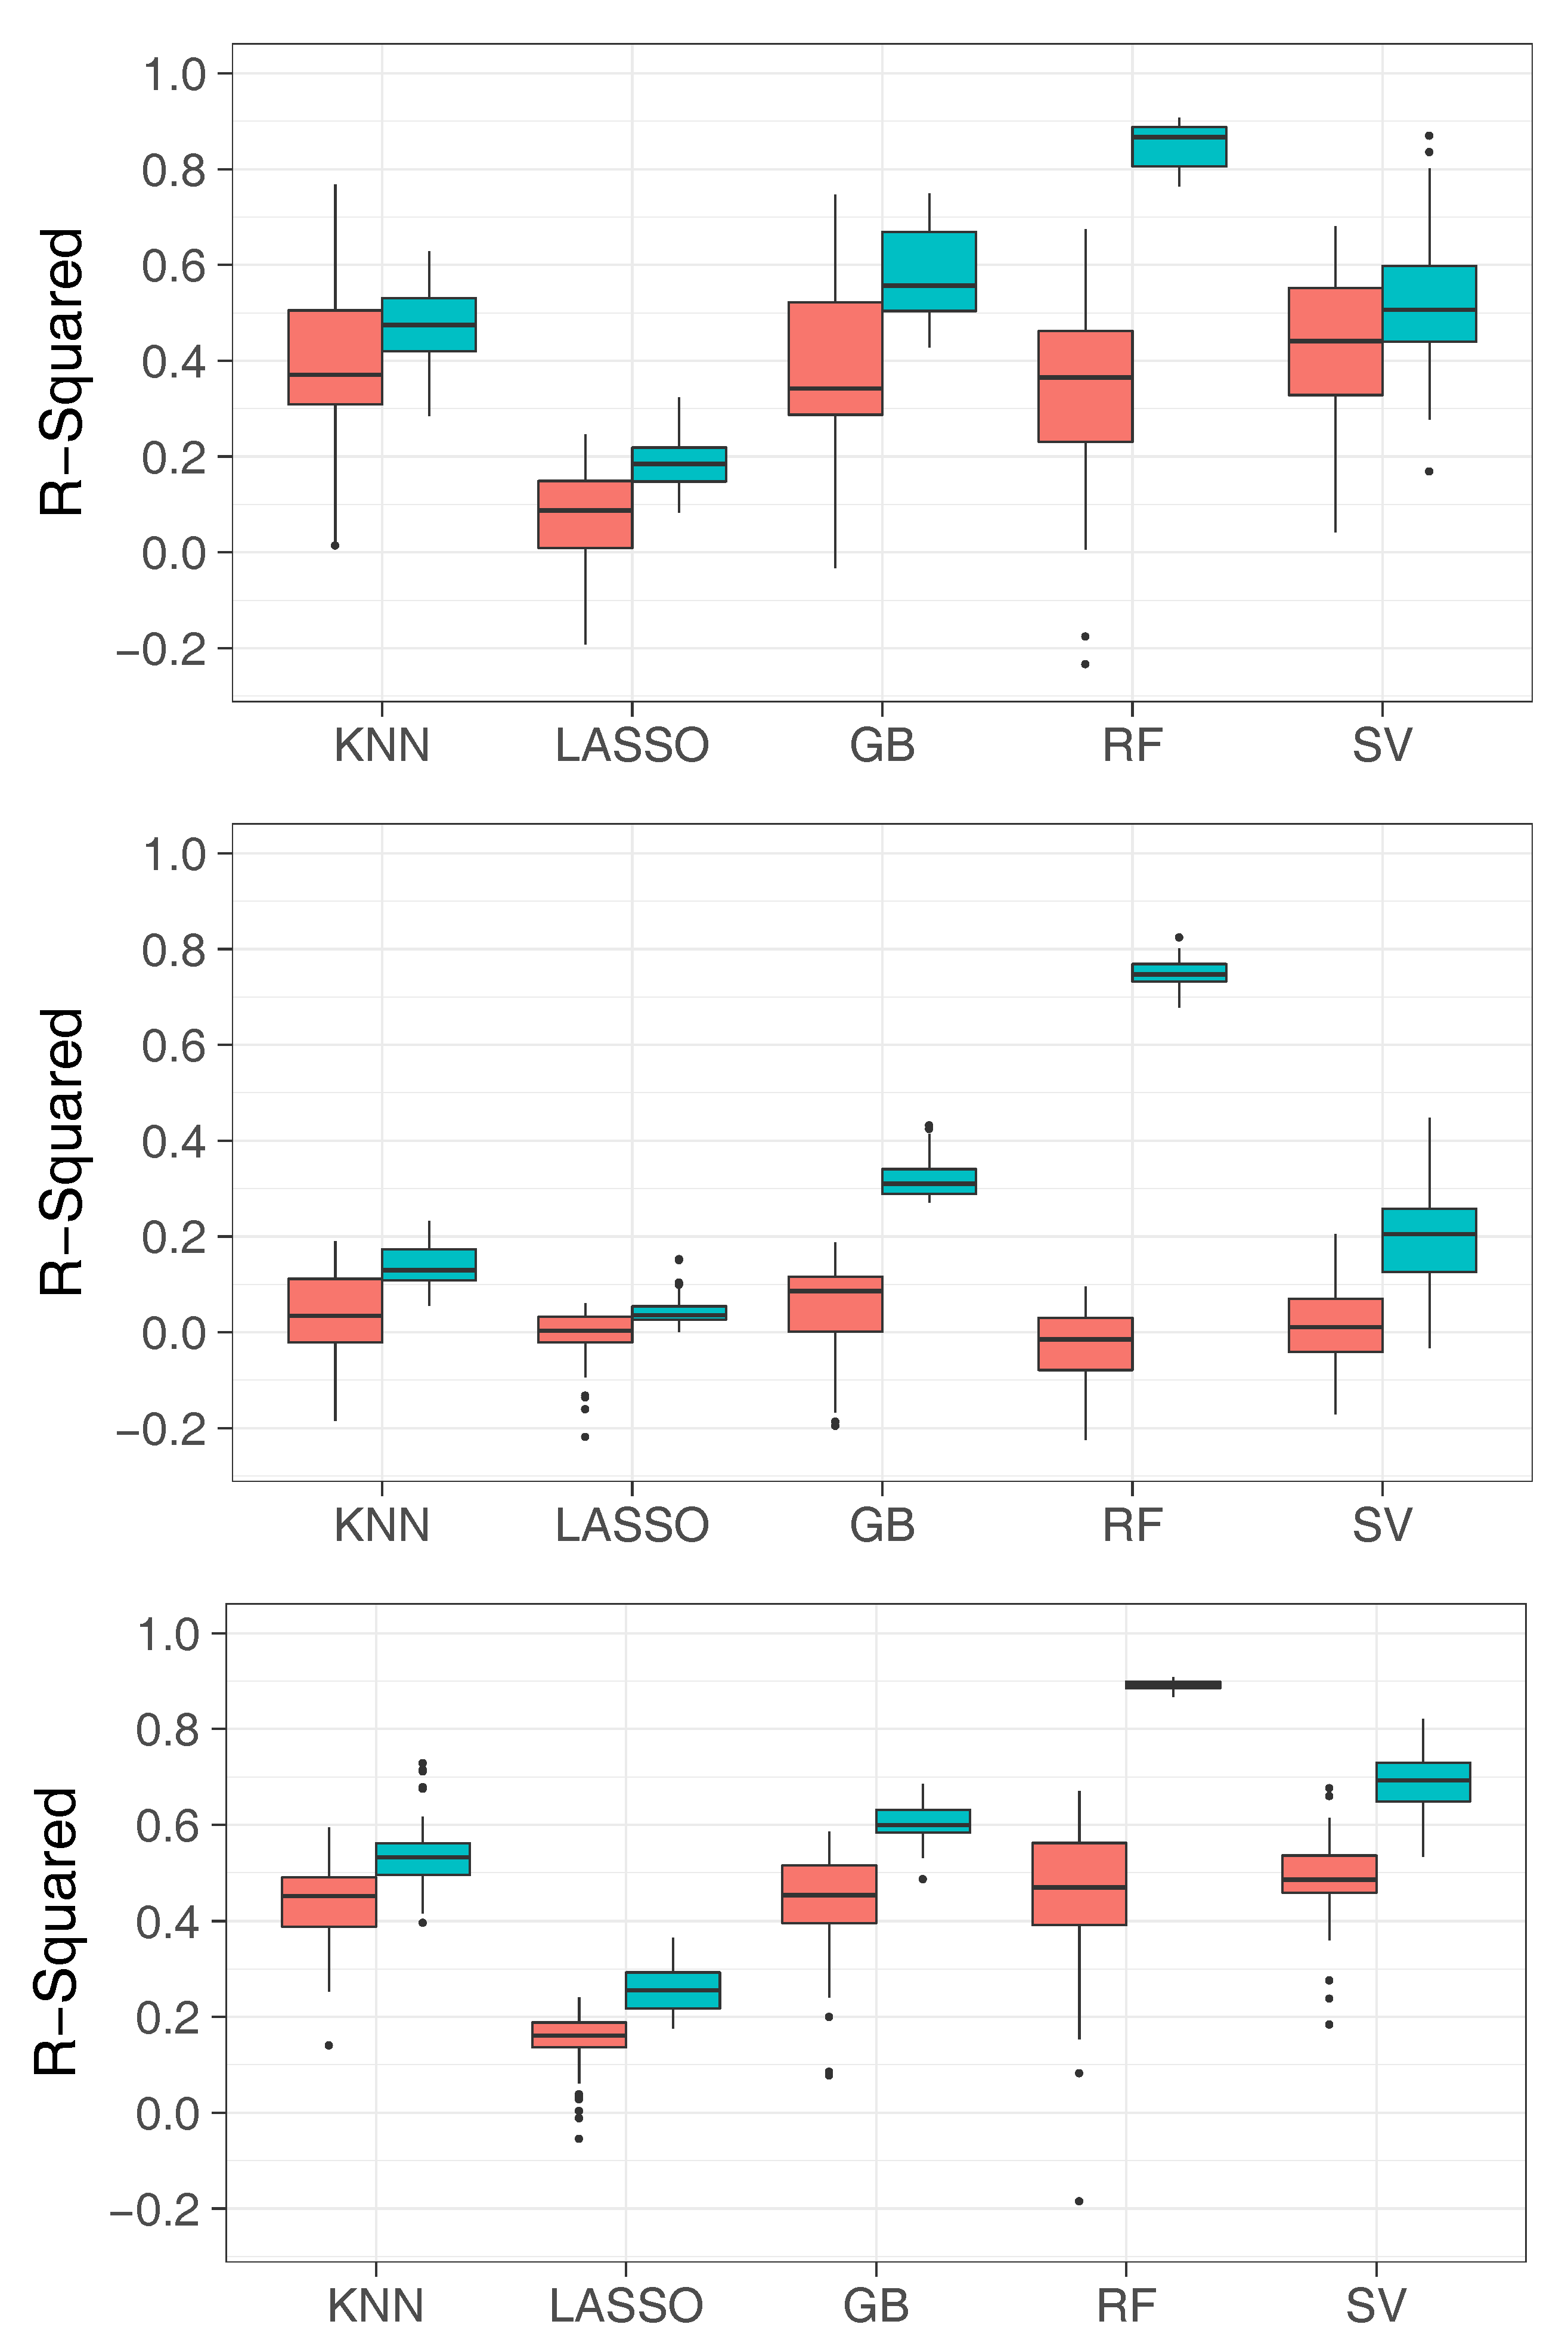
monitors (2–3). The performance of each prediction method is assessed by its median test
(
Table 3). Except for
, the MISR ground monitor matches <10 km show larger test
, indicating improved model performance with spatial refinement. Boxplots of the 50 iterations of each training and test on the <10 km matched data (
Appendix Figure A1) show greater variability for
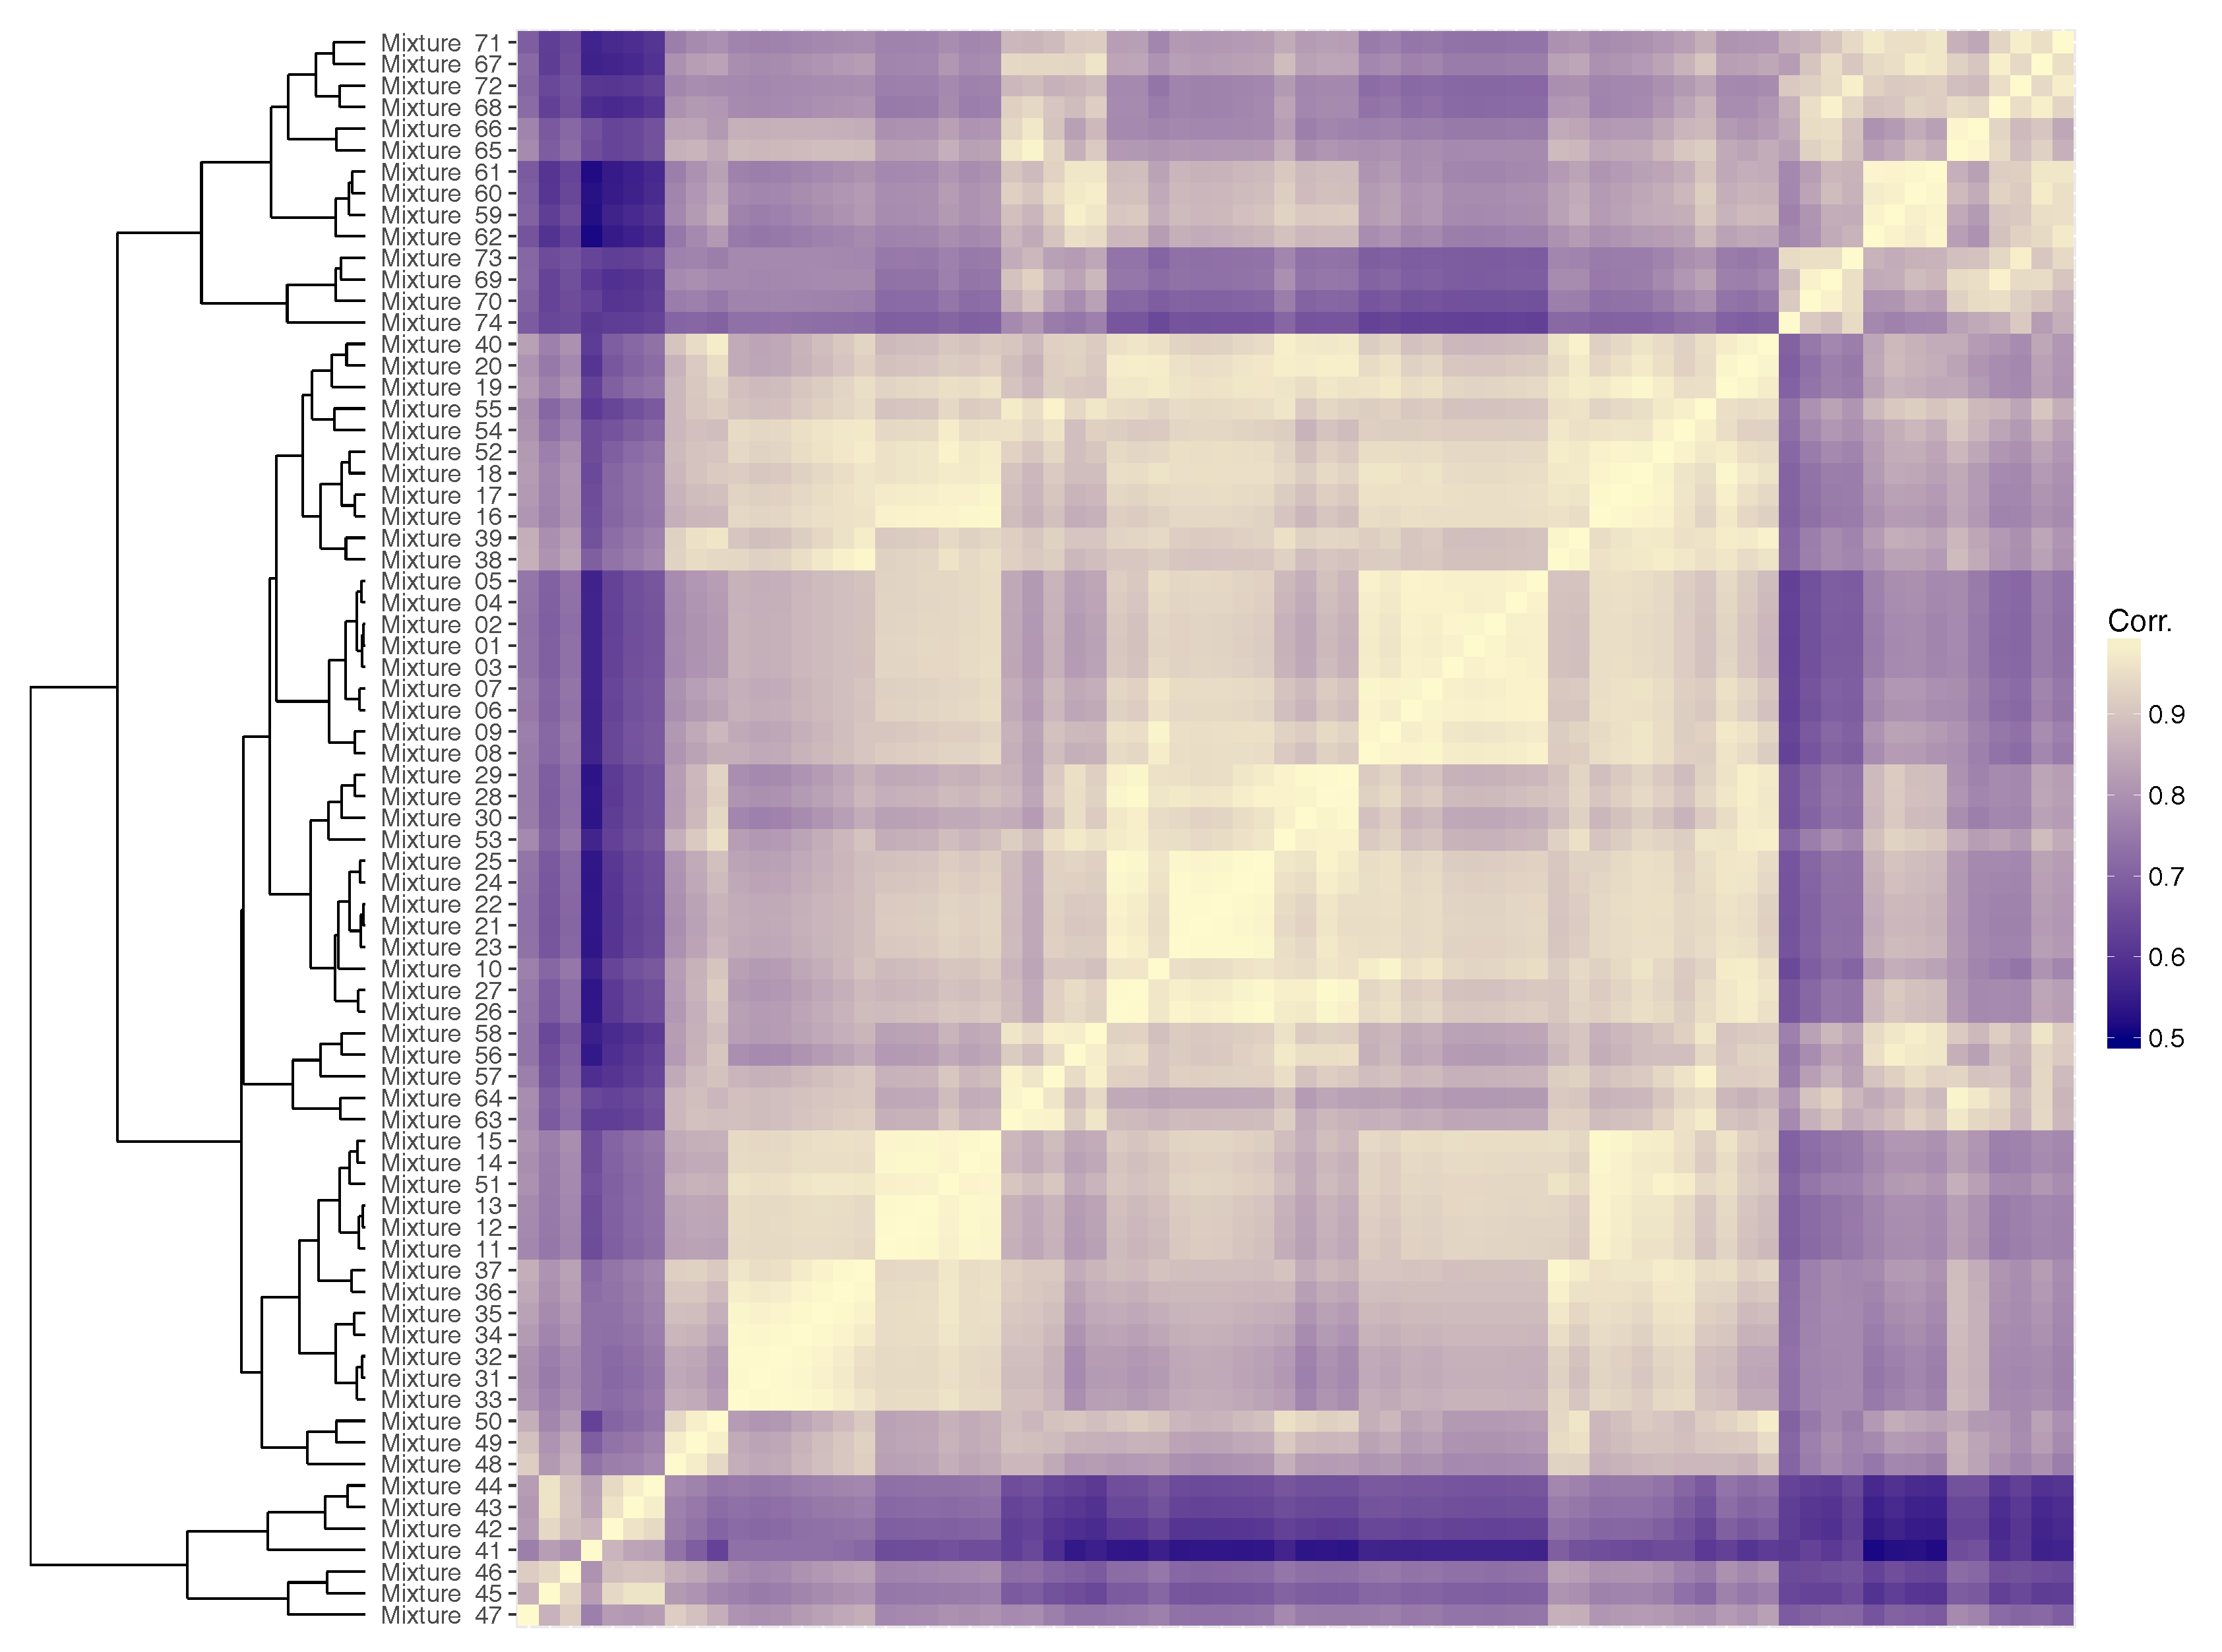
, which is not surprising given the smaller sample size. Support Vector Machine regression consistently performed best for all three pollutants. Notably, LASSO, a method that emphasizes feature selection, performed poorly, while ensemble tree-based methods GB and RF, and those that do not prioritize feature selection, KNN and SVM, all performed markedly better. Methods that harness correlation patterns between mixtures such as KNN, GB, RF, and SVM, are therefore preferred for these data. This is further illustrated with a correlation heatmap, constructed by a hierarchical clustering tree (
Figure 4), which shows that correlations between mixtures are positive and high, ranging from 0.57 to 1. The groupings arranged as expected in that: (1) mixtures tend to be more correlated with other mixtures within the same particle size and absorption “families” (i.e., 1–10, 11–20, 21–30, 31–40, 41–50, 51–74); and (2) while the most strongly absorbing mixtures 41–47 are highly correlated with one another, they are markedly less correlated with other mixtures. It is also notable that the heatmap groupings closely follow the components found by PCA (
Table 2).
Focusing on
and the best performing regression model, SVM, we generated predicted values 1000 times using the 70–30% training/test split approach. We compared these predictions to the
measured at the monitors in the test sample to corroborate the performance of the SVM regression (
Figure 5). The linear association between observed and predicted values indicates moderate overall underprediction by the model (Bias = −1.793), but follows the 1-to-1 line remarkably closely, and shows high correlation (r = 0.731). Model performance was assessed for the SVM trained and tested on all data due to sample size constraints. However,
under-predictions are larger at the highest observed concentrations (>150 μg/m
3), which all occurred in the winter. Similarly, a relatively high RMSD (30.521) is a result of the wide range in observed concentrations, which were between 5 and 250 μg/m
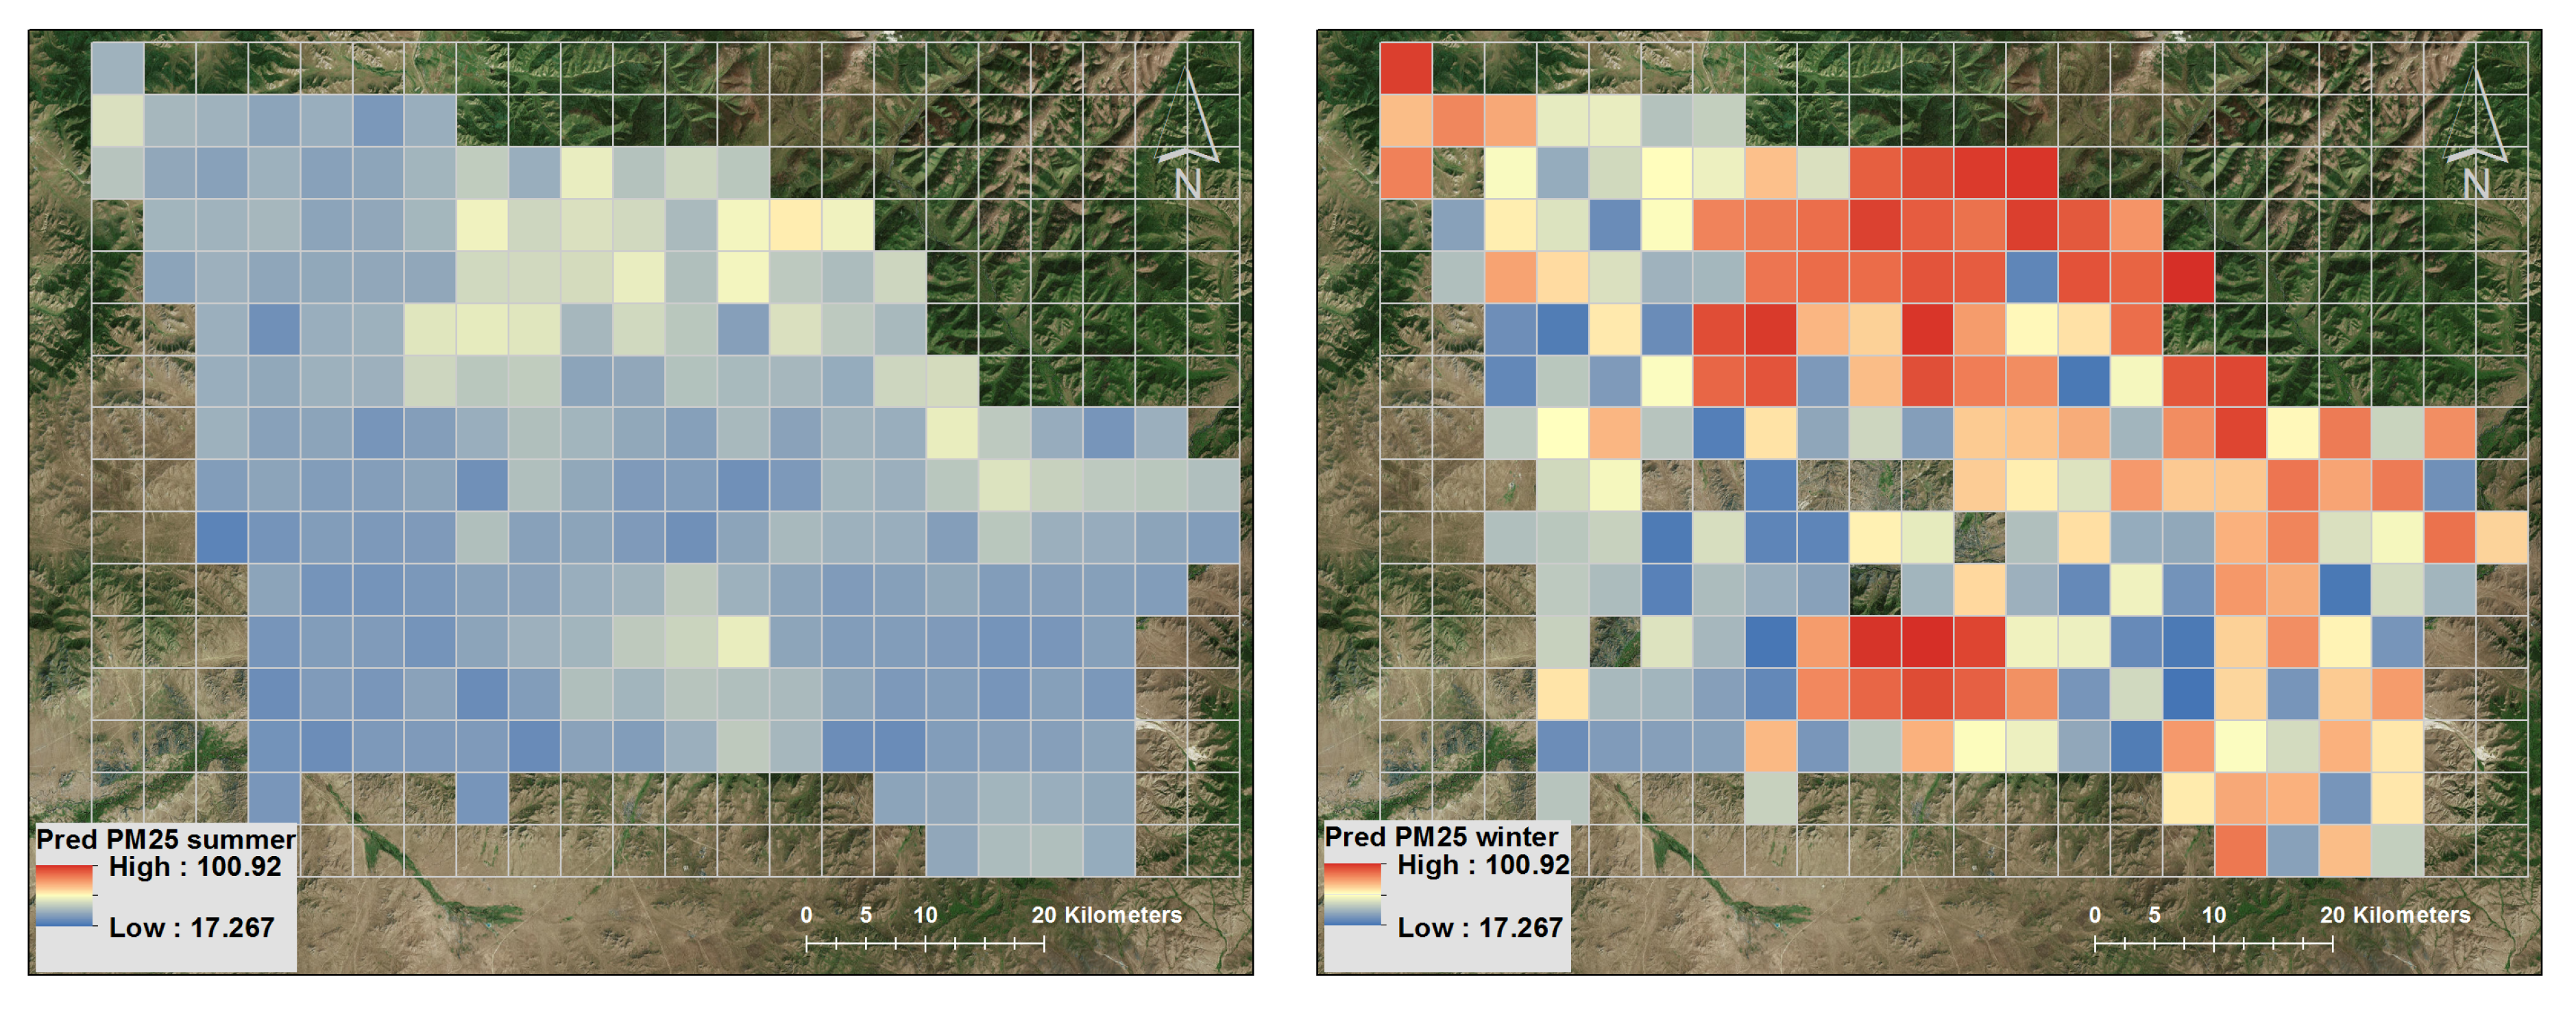
3. We applied the validated model to convert each available MISR retrieval of AOD from the 74 mixtures to
for the time range from 2011 to 2016 over the UB region. Maps of the average seasonal estimates (
Figure 6) show the contrast in estimated concentrations, with average predicted
concentrations peaking at 100 μg/m
3 in boreal winter (October–March) compared to 35 μg/m
3 in summer (April–September). Spatially, we see a clear pattern with higher wintertime concentrations in the Ger district on the north side of the region. Notably, the other hotspot of elevated concentrations occurs just south of the city center, where the three coal-fired power plants are located.
Overall, compared to using the MISR AOD alone, there is a marked improvement in the sample sizes when AOD from the complete sets of 74 mixtures were used. This is because the AODs for the mixtures are reported with less strict cloud screening than the AOD, similar to AOD_raw. Of the 808 MISR overpasses in the 2011–2016 period over the UB region, an additional 142 days are covered by using the AODs from the 74 mixtures (
Appendix Figure A2). When matched with the air pollution monitors, we similarly find a decrease in sample size by using AOD alone, with only 51% to 56% of the sample sizes shown in
Table 3 available for analysis. For illustration, using this reduced sample we find the linear association between AOD matched within 10 km of each of the available air pollution monitors is much weaker than what we show above using machine learning methods on the AODs from the 74 mixtures. The
for the linear associations between AOD and
,
, and
are 0.024, 0.011, and 0.012, respectively.
4. Discussion
Harnessing the unique capabilities of the MISR satellite instrument to distinguish component aerosol particle properties into 74 mixtures, we can generate reliable predictions of
and
over Ulaanbaatar, Mongolia, a region where there is a severe air pollution problem yet very little ground-level monitoring. Support Vector Machine regression had the best performance, but other machine learning methods including KNN, Random Forests, and Gradient Boosting performed nearly as well. Particularly promising is the ability of the AODs from the set of 74 MISR mixtures to perform so well without including additional adjustments, such as meteorology, even at higher observed concentrations and during winter when there were fewer retrievals due to persistent cloudiness and snow cover. In previous studies over the U.S., far more data were available to develop spatiotemporal models (with the inclusion of additional meteorology and land use variables) to convert fractionated 4.4 km MISR AOD to
and
[
24] and particle sulfates, nitrates, and carbon [
25]. The results of these studies are comparable to those shown here. Franklin et al. [
24] observed cross-validated model performance with CV-R
2 = 0.51 for
and CV-R
2 = 0.44 for
. While the machine learning methods presented here did not reach this level of performance for predicting
, our observed ability to predict
with far fewer ground monitors and no adjustments for meteorology is encouraging. The poor performance in predicting
is likely in part due to its spatial variability, which can be on the order of less than 1 km for coarse particles [
26]. Due to data availability, we matched MISR observations with ground monitoring concentrations that were within 10 km, likely too large a spatial scale to detect associations with
. Meng et al. [
25] found that fractionated MISR AOD used in conjunction with meteorology and land use information was able to explain 66% of the variability in sulfate
in central and southern California. While we did not have access to particle sulfate concentrations in UB, we assumed gaseous
was a reliable proxy, and found that the MISR mixtures have similar predictive performance.
Paciorek and Liu [
27] conducted a comparison of statistical models containing AOD and other parameters including land use, meteorology, emissions factors, and regional temporal variability, and found almost no improvement in long term (monthly to annual) average
estimates from the models that included satellite observations versus those that did not. However, they noted that this is mostly due to the availability of high quality data in the U.S., and that in developing countries with higher pollution levels and less reliable ground monitoring and emissions data, spatially and temporally variable satellite observations can provide more information to the model. In addition, the relative magnitude of errors caused by uncorrected spatial variability in surface reflectance would be smaller at higher pollution levels. In this study, we find that AODs from the 74 MISR mixtures are in fact able to contribute significantly to the explanatory power to estimate
(and
) without the inclusion of other parameters. This promising result suggests that generating external geographic and meteorological data to include in AOD-PM estimation models is not necessarily critical when there is sufficient information on particle size and type. For global studies where these external data may also be limited, relying on satellite information alone is highly desirable.
This study is one of the first applications of the new V23 MISR aerosol product [
19,
20]. Our validation of AOD and AOD_raw with AOD from the Dalanzadgad AERONET site included far more observations, yet the results are nearly identical to those found in Kahn et al. [
12]. In another MISR/AERONET comparison focused on desert sites including Dalanzadgad [
28], no systematic biases or trends were found, demonstrating MISR’s ability to retrieve AOD over bright surfaces. We extended our analysis to include another new product, AOD_raw, which enabled us to increase the sample size by 58%, adding some data in winter when there was consistent snow cover and few AOD retrievals. The validation of AOD_raw with AERONET shows good correlation (r = 0.750) and only slightly fewer observations within the EE (52%). In a similar manner, using the 74 MISR mixtures also increased the sample size relative to the standard AOD by more than 50%. Similar to AOD_raw, cloud screening is relaxed for retrieving mixtures. The only other reason for incomplete sets of AODs from the full set of mixtures is the exclusion of individual mixtures when the retrieval algorithm fails for some reason. However, it is important to note that these conclusions are only strictly applicable to MISR aerosol retrievals in Mongolia. In other regions the performance of the algorithm is likely to be different, and caution is urged when working with the less strictly cloud-screened AOD_raw and AOD by mixture variables in the MISR V23 Aerosol Product.
There are some limitations to relying solely on satellite aerosol observations for estimating air pollution. Although we improved data coverage with the use of MISR AOD_raw and the 74 mixtures, there was still a lack of retrievals in winter. While the multi-angle views of MISR eliminate surface reflectance effects more effectively than single-view instruments, and perform well over bright desert surfaces such as the Sahara [
13], there are no instruments capable of producing a valid aerosol retrieval when viewing extremely bright snow and ice covered surfaces [
29]. If daily or near daily air pollution estimates are needed under such conditions, supplementing satellite-derived AOD with other information, such as output from a chemical transport model, would help fill these gaps. Inclusion of these additional data may also help with the under-prediction of
concentrations. This is important future work that, in combination with what we have shown in this study, will enhance air pollution studies in Mongolia and other countries with poor air quality.

 ,
, 


