Drivers of Landscape Changes in Coastal Ecosystems on the Yukon-Kuskokwim Delta, Alaska


1
Alaska Ecoscience, Fairbanks, AK 99709, USA
2
ABR, Inc.—Environmental Research & Services, Fairbanks, AK 99708, USA
*
Author to whom correspondence should be addressed.
Remote Sens. 2018, 10(8), 1280; https://doi.org/10.3390/rs10081280
Submission received: 1 June 2018
/
Revised: 15 July 2018
/
Accepted: 3 August 2018
/
Published: 14 August 2018
(This article belongs to the Special Issue Remote Sensing of Dynamic Permafrost Regions)
Abstract
:The Yukon-Kuskokwim Delta (YKD) is the largest delta in western North America and its productive coastal ecosystems support globally significant populations of breeding birds and a large indigenous population. To quantify past landscape changes as a guide to assessing future climate impacts to the YKD and how indigenous society may adapt to change, we photo-interpreted ecotypes at 600 points within 12 grids in a 2118 km2 area along the central YKD coast using a time-series of air photos from 1948–1955 and 1980 and satellite images from 2007–2008 (IKONOS) and 2013–2016 (WorldView). We found that ecotype classes changed 16.2% (342 km2) overall during the ~62 years. Ecotypes changed 6.0% during 1953–1980, 7.2% during 1980–2007 and 3.8% during 2007–2015. Lowland Moist Birch-Ericaceous Low Scrub (−5.0%) and Coastal Saline Flat Barrens (−2.3%) showed the greatest decreases in area, while Lowland Water Sedge Meadow (+1.7%) and Lacustrine Marestail Marsh (+1.3%) showed the largest increases. Dominant processes affecting change were permafrost degradation (5.3%), channel erosion (3.0%), channel deposition (2.2%), vegetation colonization (2.3%) and lake drainage (1.5%), while sedimentation, water-level fluctuations, permafrost aggradation and shoreline paludification each affected <0.5% of the area. Rates of change increased dramatically in the late interval for permafrost degradation (from 0.06 to 0.26%/year) and vegetation colonization (from 0.03 to 0.16%/year), while there was a small decrease in channel deposition (from 0.05 to 0.0%/year) due largely to barren mudflats being colonized by vegetation. In contrast, rates of channel erosion remained fairly constant. The increased permafrost degradation coincided with increasing storm frequency and air temperatures. We attribute increased permafrost degradation and vegetation colonization during the recent interval mostly to the effects of a large storm in 2005, which caused extensive salt-kill of vegetation along the margins of permafrost plateaus and burial of vegetation on active tidal flats by mud that was later recolonized. Due to the combination of extremely flat terrain, sea-level rise, sea-ice reduction that facilitates more storm flooding and accelerating permafrost degradation, we believe the YKD is the most vulnerable region in the Arctic to climate warming.
1. Introduction
The Yukon-Kuskokwim Delta (YKD) is the largest riverine delta in western North America and one of the most important breeding areas for migratory water birds in the world, with the highest population densities occurring in the central portion [1]. The region also has a large indigenous population because of the important subsistence resources in the surrounding Yukon Delta National Wildlife Refuge (YDNWR), with ~25,000 Yup’ik people in 35 villages, 17 of which are situated along the coast. The potential loss or alteration of habitat from sea-level rise, increased storm surges and permafrost degradation is a large concern to management of the YDNWR and to local communities. Of particular concern is the broad tidally influenced zone of the YKD (~30,000 km2) that is characterized by an extremely low elevational gradient of ~2 m within 10 km of the coast and is projected to be affected by increased flooding, salinization and thermokarst [2,3]. How fast ecosystems are changing in response to climate change, and what geomorphic and ecological processes are contributing to the changing landscape, are fundamental questions that need to be addressed to predict and adapt to future changes. Furthermore, to the need to understand complex changes in diverse ecosystems, and the processes driving change across heterogeneous landscapes, requires developing high-resolution spatial methodologies to adequately detect changes and trends at a level relevant to land managers and policy makers.
Deltaic landscapes are highly dynamic environments due to tidal fluctuations and storm surges, erosion and deposition along channels and shorelines, changing topography and hydrology, sedimentation, varying salinity from riverine and marine flooding and vegetation succession [4]. Tidal fluctuations and storm surges help to control vegetation distribution by affecting water levels, sedimentation and salinity [5]. Sedimentation and erosion affect surface elevations, contribute nutrients and can physically bury or disturb the surface. Salinity affects the osmotic potential of soil and is an important control over vegetation distribution [2,6]. The YKD differs from most of the world’s deltas, however, by having permafrost, which has heaved up the surface in irregularly distributed low plateaus across the coastal margin [3].
Detection of landscape change over long periods has long relied on retrospective analysis of historical air photos and more recent high-resolution satellite imagery; this approach usually relies on manual photo-interpretation because of the highly variable spectral qualities and spatial resolutions of the imagery. In northern ecosystems, photo-interpreted time-series have been used to quantify areal changes in waterbodies [7], thermokarst lakes and shore fens [8], shrub expansion [9,10], boreal and tundra ecotypes [11,12], coastal ecotypes [13] and permafrost degradation [11,14,15,16].
To quantify past landscape changes as a guide to assessing future climate impacts to the YKD, we photo-interpreted changes evident on a time-series of historical imagery that includes four time periods from the 1950s to the 2010s. Specific objectives of the study were to:
- compile and georectify a time-series of historical air photos (1950’s and 1980’s), IKONOS satellite imagery (2007–2008) and Worldview satellite imagery (2013–2016) for 12 widely distributed sites;
- manually interpret ecosystem types (ecotypes) at systematic grid points within each site for the four time periods;
- quantify patterns and rates of change, and assign geomorphic and ecological drivers of the change; and
- evaluate the influence of storm flooding and climate warming as regional drivers of change.
2. Materials and Methods
2.1. Study Area
Mapping of landscape-level ecosystems (subsections) by Jorgenson and Roth [17] differentiated coastal and coastal plain physiographies on the central coast of the YKD that are sensitive to coastal processes. The coastal phyiosgraphy includes both active tidal flats and inactive tidal flats surficial deposits, while the coastal plain is dominated by abandoned floodplain deposits. These landscapes differ in their dominant contemporary geomorphic processes and have varying topography, sediment textures, flooding regimes, salinities and vegetation [2].
The active tidal flats represent very young surfaces that are regularly inundated by diurnal and lunar tides. Active flats are intricately patterned due to micro-topographic variation associated with tidal channels, better drained levees adjacent to the channels and basins (pans) formed by impoundment of water behind the levees.
Inactive tidal flats similarly comprise channels, levees and basins but are older, slightly inland and subject to infrequent flooding [3]. Due to age and reduced salinity, organic layers have accumulated in the soils, resulting in distinctive organic layers interbedded with mineral horizons caused by sedimentation from large storm events. After large floods, the basins behind levees can become increasingly saline as water is lost due to evapotranspiration, while salt-intolerant vegetation, such as crowberry (Empetrum nigrum) and peat mosses (Sphagnum) can expand when there is a long interval between coastal flood events.
The lower coastal plain is dominated by abandoned floodplain deposits that are greatly affected by permafrost development under the cold climate of western Alaska. Permafrost aggradation under much of the coastal plain has caused the surface to be heaved up 1–2 m, forming extensive permafrost plateaus [2]. Because permafrost is associated with the elevated surfaces, permafrost distribution can be reliably mapped with LiDAR-derived digital elevation models [18]. The rise in elevation has eliminated storm flooding and sedimentation and allowed dwarf birch (Betula nana) and ericaceous shrubs (e.g., Vaccinium vitis-idaea), lichens (e.g., Cladina) and thick Sphagnum mats to develop. Freshwater lakes are prevalent in this landscape, most of which have become surrounded by permafrost plateaus. Ponds in permafrost environments, however, are susceptible to tapping and draining by migrating channels [19]. Over broader areas, the permafrost is sensitive to thawing from climate warming, which causes the surface to collapse to levels susceptible to flooding.
2.2. Image Compilation and Georectification
IKONOS satellite imagery (1-m resolution with panchromatic and multispectral bands) taken of the YKD central coast on 27 August 2007 and 28 July 2008 was acquired by the U.S. Fish and Wildlife Service and ortho-mosaicked into four blocks that served as the basis for co-registering all other imagery. To improve the horizontal accuracy of the images, ground-control points were established by the U.S. Geological Survey (USGS) Alaska Science Center during September 2008 by acquiring differential GPS coordinates for distinctive geomorphic features (e.g., tidal gut intersections, pond margins). The images were georectified to the ground control points by Aero-Metric, Inc. (Anchorage, AK) with a resulting horizontal accuracy of ~2 m.
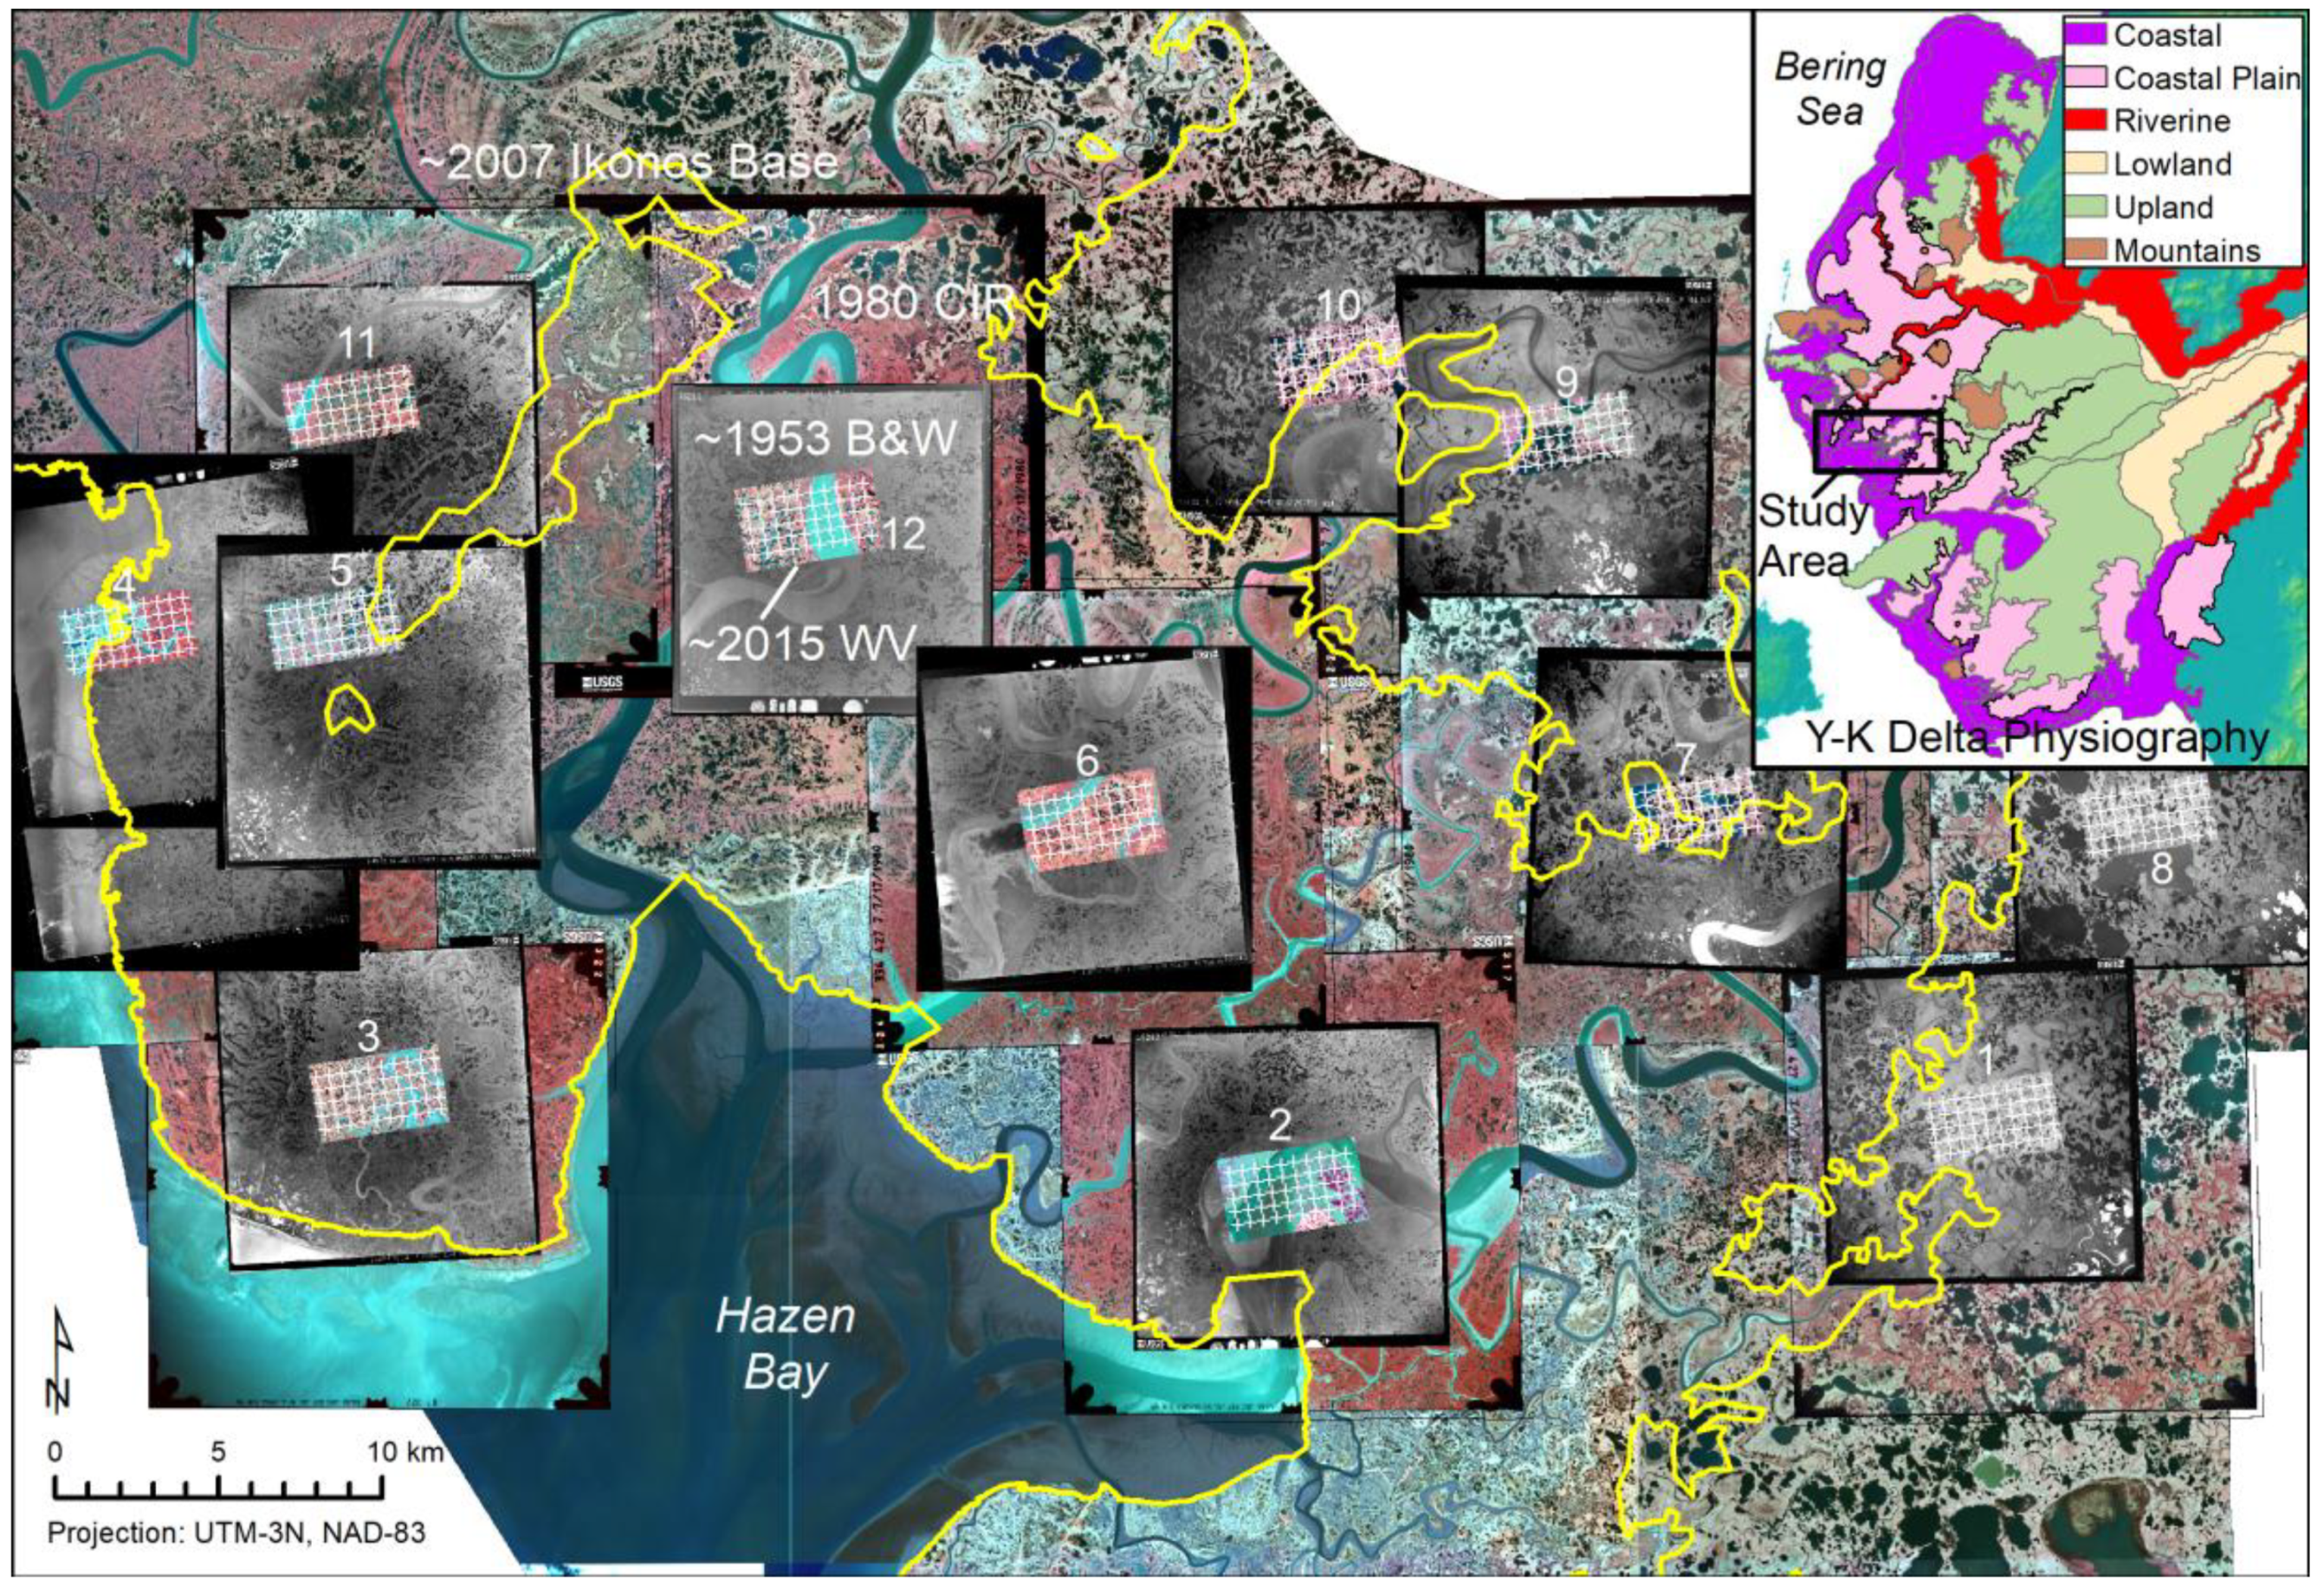
Representative sites for analyzing landscape change were selected by a two-step process. First, we reviewed the availability of 1950s and 1980s aerial photographs and overlaid the center points of the air photos to identify pairs with closely overlapping centers. This was done so that the change detection would target the centers of overlapping photos, where view-angle distortion would be minimal and image co-registration would be most accurate. Seventeen 1950 and 1980 air photo pairs with closely (<1500 m) overlapping centers were identified within the study area. From these, 12 pairs were selected that were broadly distributed across the study area, which generally corresponds to the ecotype mapping area of Jorgenson and Roth (2010) [17]. The 2118 km2 study area was substantially smaller than the area covered by the IKONOS ortho-mosaic because 1980 air photos were not available for the northern portion of the area covered by the IKONOS imagery.
Historical air photos were acquired from the USGS (https://earthexplorer.usgs.gov/) and included panchromatic air photos (1-m scanned resolution) from 1948, 1951, 1952 and 1955; and color-infrared (CIR) air photos (1-m resolution) from July 1980 (Figure 1, Table A1). Imagery for the most recent period comprised WorldView-1, -2 and -3 scenes (0.4–0.6 m resolution) acquired during 2013–2016 in midsummer. The 1980 CIR air photos were orthorectified to the IKONOS imagery using a camera model and Digital Elevation Model (DEM) using ERDAS Imagine (Hexagon Geospatial, Inc.; Norcross, GA, USA) software. The panchromatic photos were georectified using a 2nd order polynomial transformation. The Worldview scenes were clipped to the areas of interest and georectified to the IKONOS using a 1st or 2nd order polynomial transformation. Distribution of the overlaid imagery is shown in Figure A1.
2.3. Photo-Interpretation of Ecotypes
We modified the ecological land classification developed by Jorgenson [2] for the study area, which incorporates geomorphic and vegetation characteristics in the classification (Table 1 and Table A2). The classification distinguishes ecotypes according to physiography, chemistry (salinity), soil moisture, dominant plant species and vegetation structure. When a transition between ecotypes was detected for an observation interval, we attributed the change to one or more categories of geomorphic or ecological processes (Table 1 and Table A3). Examples of ground reference points of ecotypes used during photo-interpretation are provided in Figure A2.
A grid system was created for photo-interpreting change using a point-sampling technique to determine the ecotype present at each point. This approach is efficient at estimating the percent area of each ecotype and requires only a fraction of the effort entailed in mapping polygons. A 5 × 10 grid with 400-m spacing was established in the center of each ~1950s air photo. Each grid, was treated as the sample unit for analysis. Each grid point had a series of attributes including Grid; Point; Ecotype55, Ecotype80, Ecotype88 (entered when photos were present), Ecotype08 and Ecotype15; Ecosubsect (landscape), Change55–80, Change80–08, Change08–15 and Change51–15. Photo-interpretation of ecotypes was based on differences in tone, texture, pattern, size, shape and spatial context and on the field experience of the interpreter (M.T.J.). The interpretation was aided by visual reference to photo-characteristics at 67 vegetation plots and 139 hydrology-sedimentation stations with vegetation information in the study area [3].
2.4. Analysis of Patterns and Rates of Change
We quantified ecotype abundance by period (simplified to average for period 1953, 1980, 2007, 2015) and rates of change drivers by interval (1953–1980, 1980–2007, 2007–2015). The point data first were summarized as abundance (% area) by sampling grid. We then calculated change rates by driver by first calculating the percent frequency of each driver by grid and then calculating rates by dividing by the length of each time interval for each grid. We then calculated means and 95% confidence limits across the grids. To test for significance of changes over time, we used a repeated measures ANOVA using the grid as the subject variable and year as a fixed within factor variable and tested at the 0.05 Probability level and assessed Power at Alpha = 0.05.
2.5. Regional Drivers
Data on storm surge flooding was obtained from the National Oceanic and Atmospheric Administration (https://www.ncdc.noaa.gov/stormevents/). The data were summarized to present the daily maximum water levels (higher high water, HH) and a tally of the number of storms with water levels >2 m above mean sea level. Mean daily air temperature for Nome—the nearest long-term weather station on the Bering Sea coast (~370 km north of study area)—were obtained from the National Climatic Data Center (https://www.ncdc.noaa.gov/). Mean annual air temperature (MAAT) was calculated from the average daily temperatures and the average of the MAATs were calculated for the three observation intervals.
3. Results
3.1. Image Compilation and Georectification
Georectification of the 2007 and 2008 IKONOS satellite images (average year 2007) to a set of 49 ground control points by Aero-Metric, Inc. created a base map with ~2-m horizontal accuracy that provided control for georectification of the other imagery. Georectification of 14 B&W air photos from 1948 to 1955 (ave. 1953), 11 CIR air photos from 1980 and clipped portions of 12 Worldview images from 2013 to 2016 (ave. 2015), resulted in root mean square (RMS) errors of 0.01–1.67 m, 0.01–0.69 m and 0.12–1.24 m, respectively.
3.2. Ecotype Changes
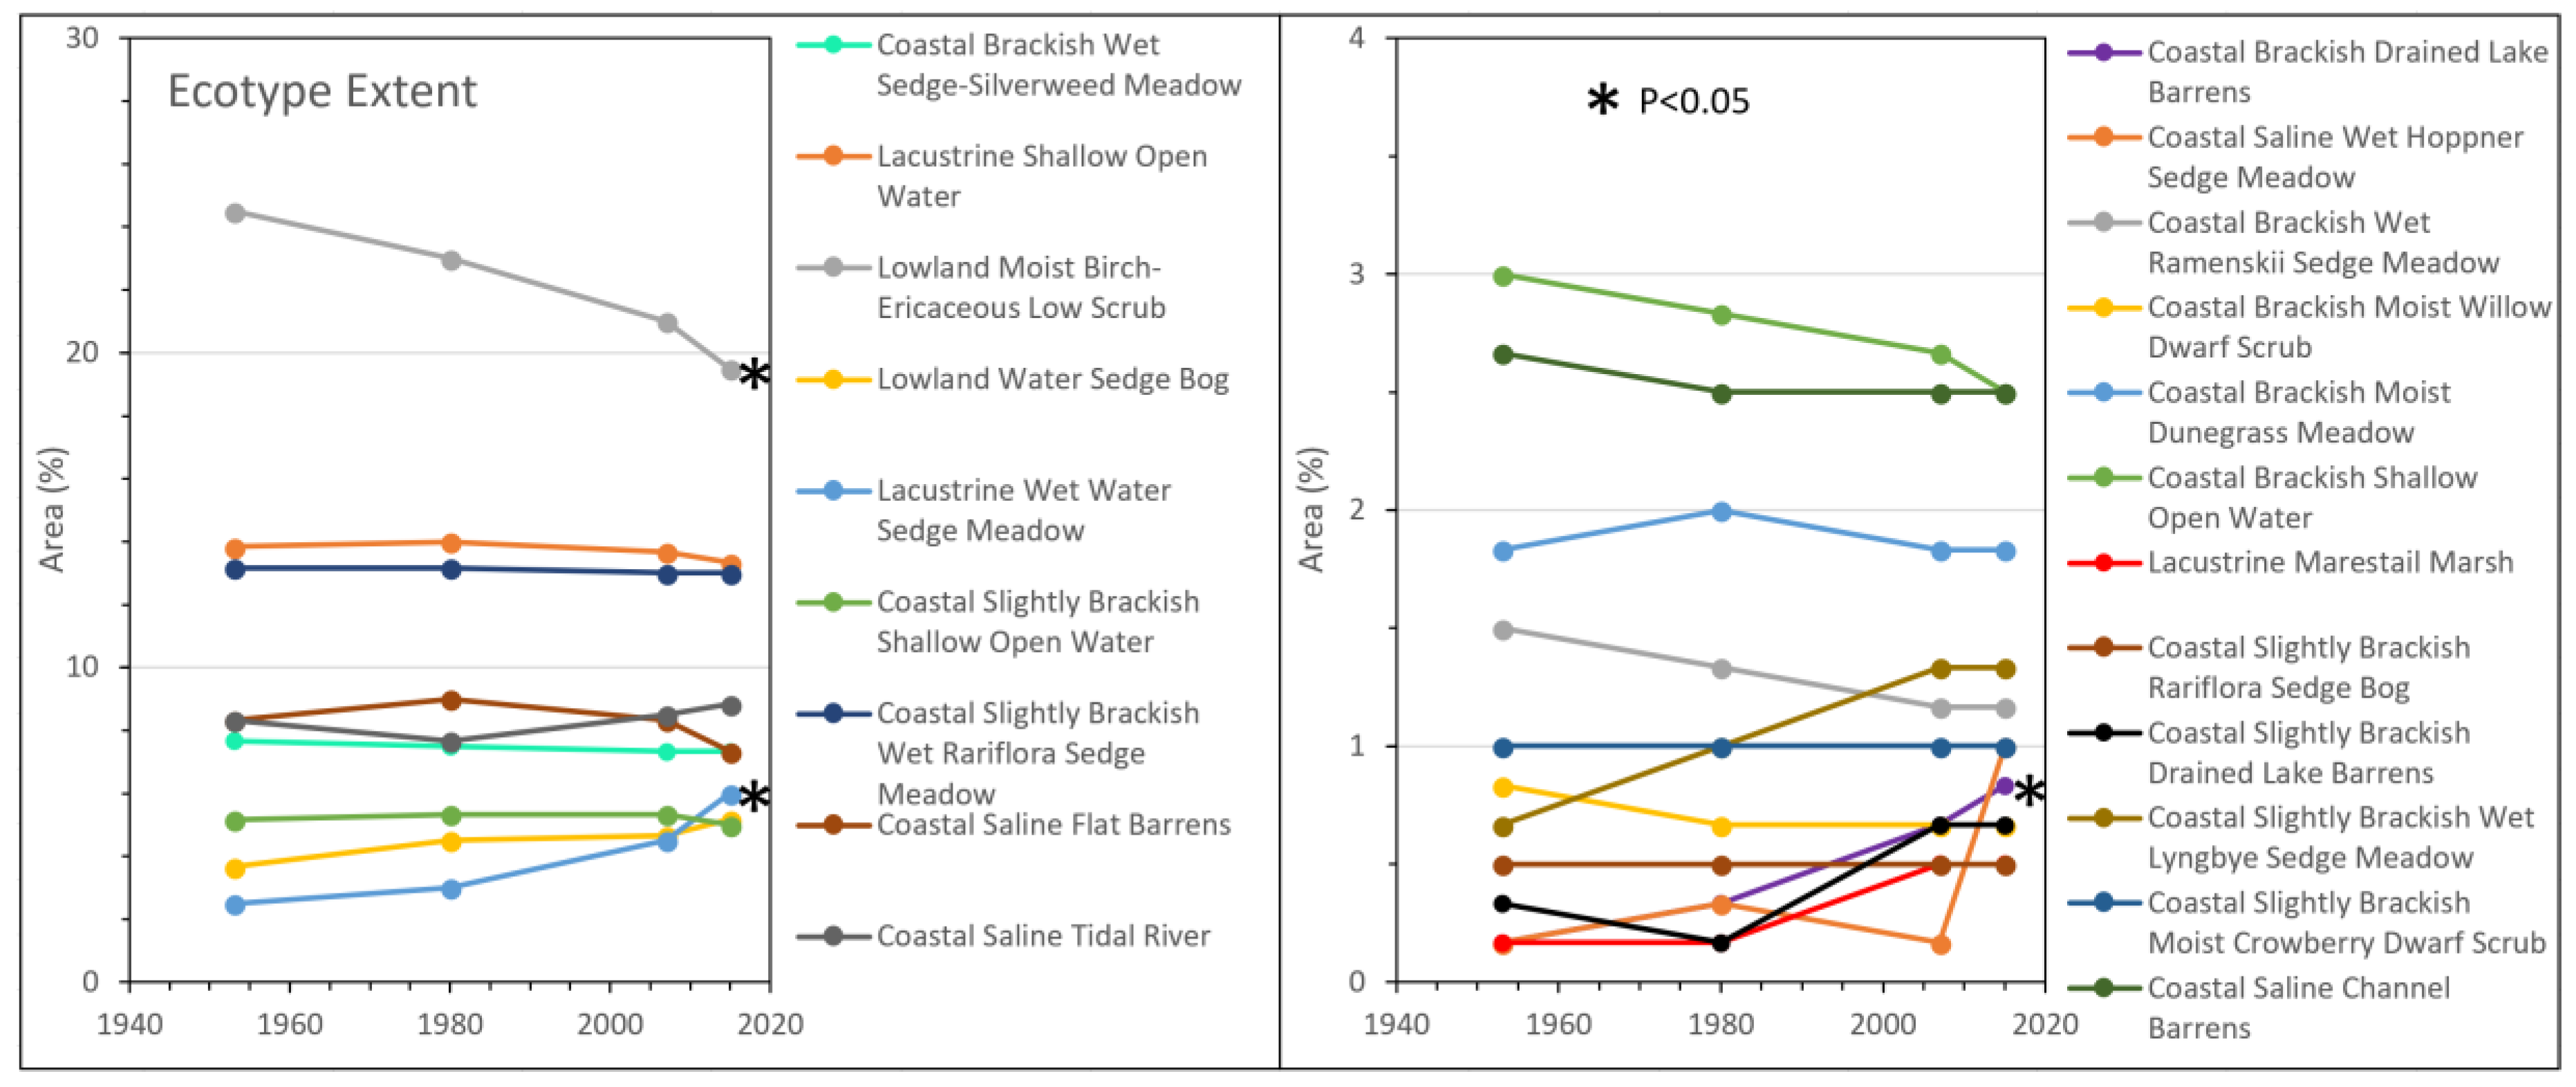
Photo-interpretation of changes evident on air photos and high-resolution satellite images from four periods (~1953, 1980, ~2007, ~2015) at 12 sampling grids revealed that ecotypes changed 6.0% ± 1.5% (95% CI, n = 12) between ~1953 and 1980, 7.2% ± 2.5% between 1980 and ~2007 and 3.8% ± 2.3% between ~2007 and ~2015 (Figure 2). The cumulative change over 62 years (1953–2015) was 16.2% ± 5.6%, equivalent to 342 km2 (16.1%) of the 2118 km2 study area. At a few points, change occurred during all three intervals; thus, the change over the entire period was slightly less than if the separate intervals were added together. Change varied considerably across the landscape: seven grids had near average changes of 10–18%, two grids had large changes (32–40%) and three grids had little change (4–8%).
When considering changes among ecotypes, only three ecotypes showed significant (p < 0.05) changes (Figure 2, Table A3). Lowland Moist Birch-Ericaceous Low Scrub decreased from 24.5% area to 19.5% based on changes detected in 7 grids. Lacustrine Wet Water Sedge Meadow increased from 2.7% to 6.3% based on changes detected in 6 grids and Coastal Brackish Drained Lake Barrens increased from 0.2% to 0.8% based on changes detected in 4 grids. Nine ecotypes showed minor bi-directional fluctuations.
3.3. Landscape Drivers and Rates of Change
The changes in ecotypes were attributed to nine geomorphic and ecological processes. Examples of the changes evident on the time-series of imagery are presented in Figure 3, Figure 4 and Figure 5 and representative ground photographs are presented in Figure 6.
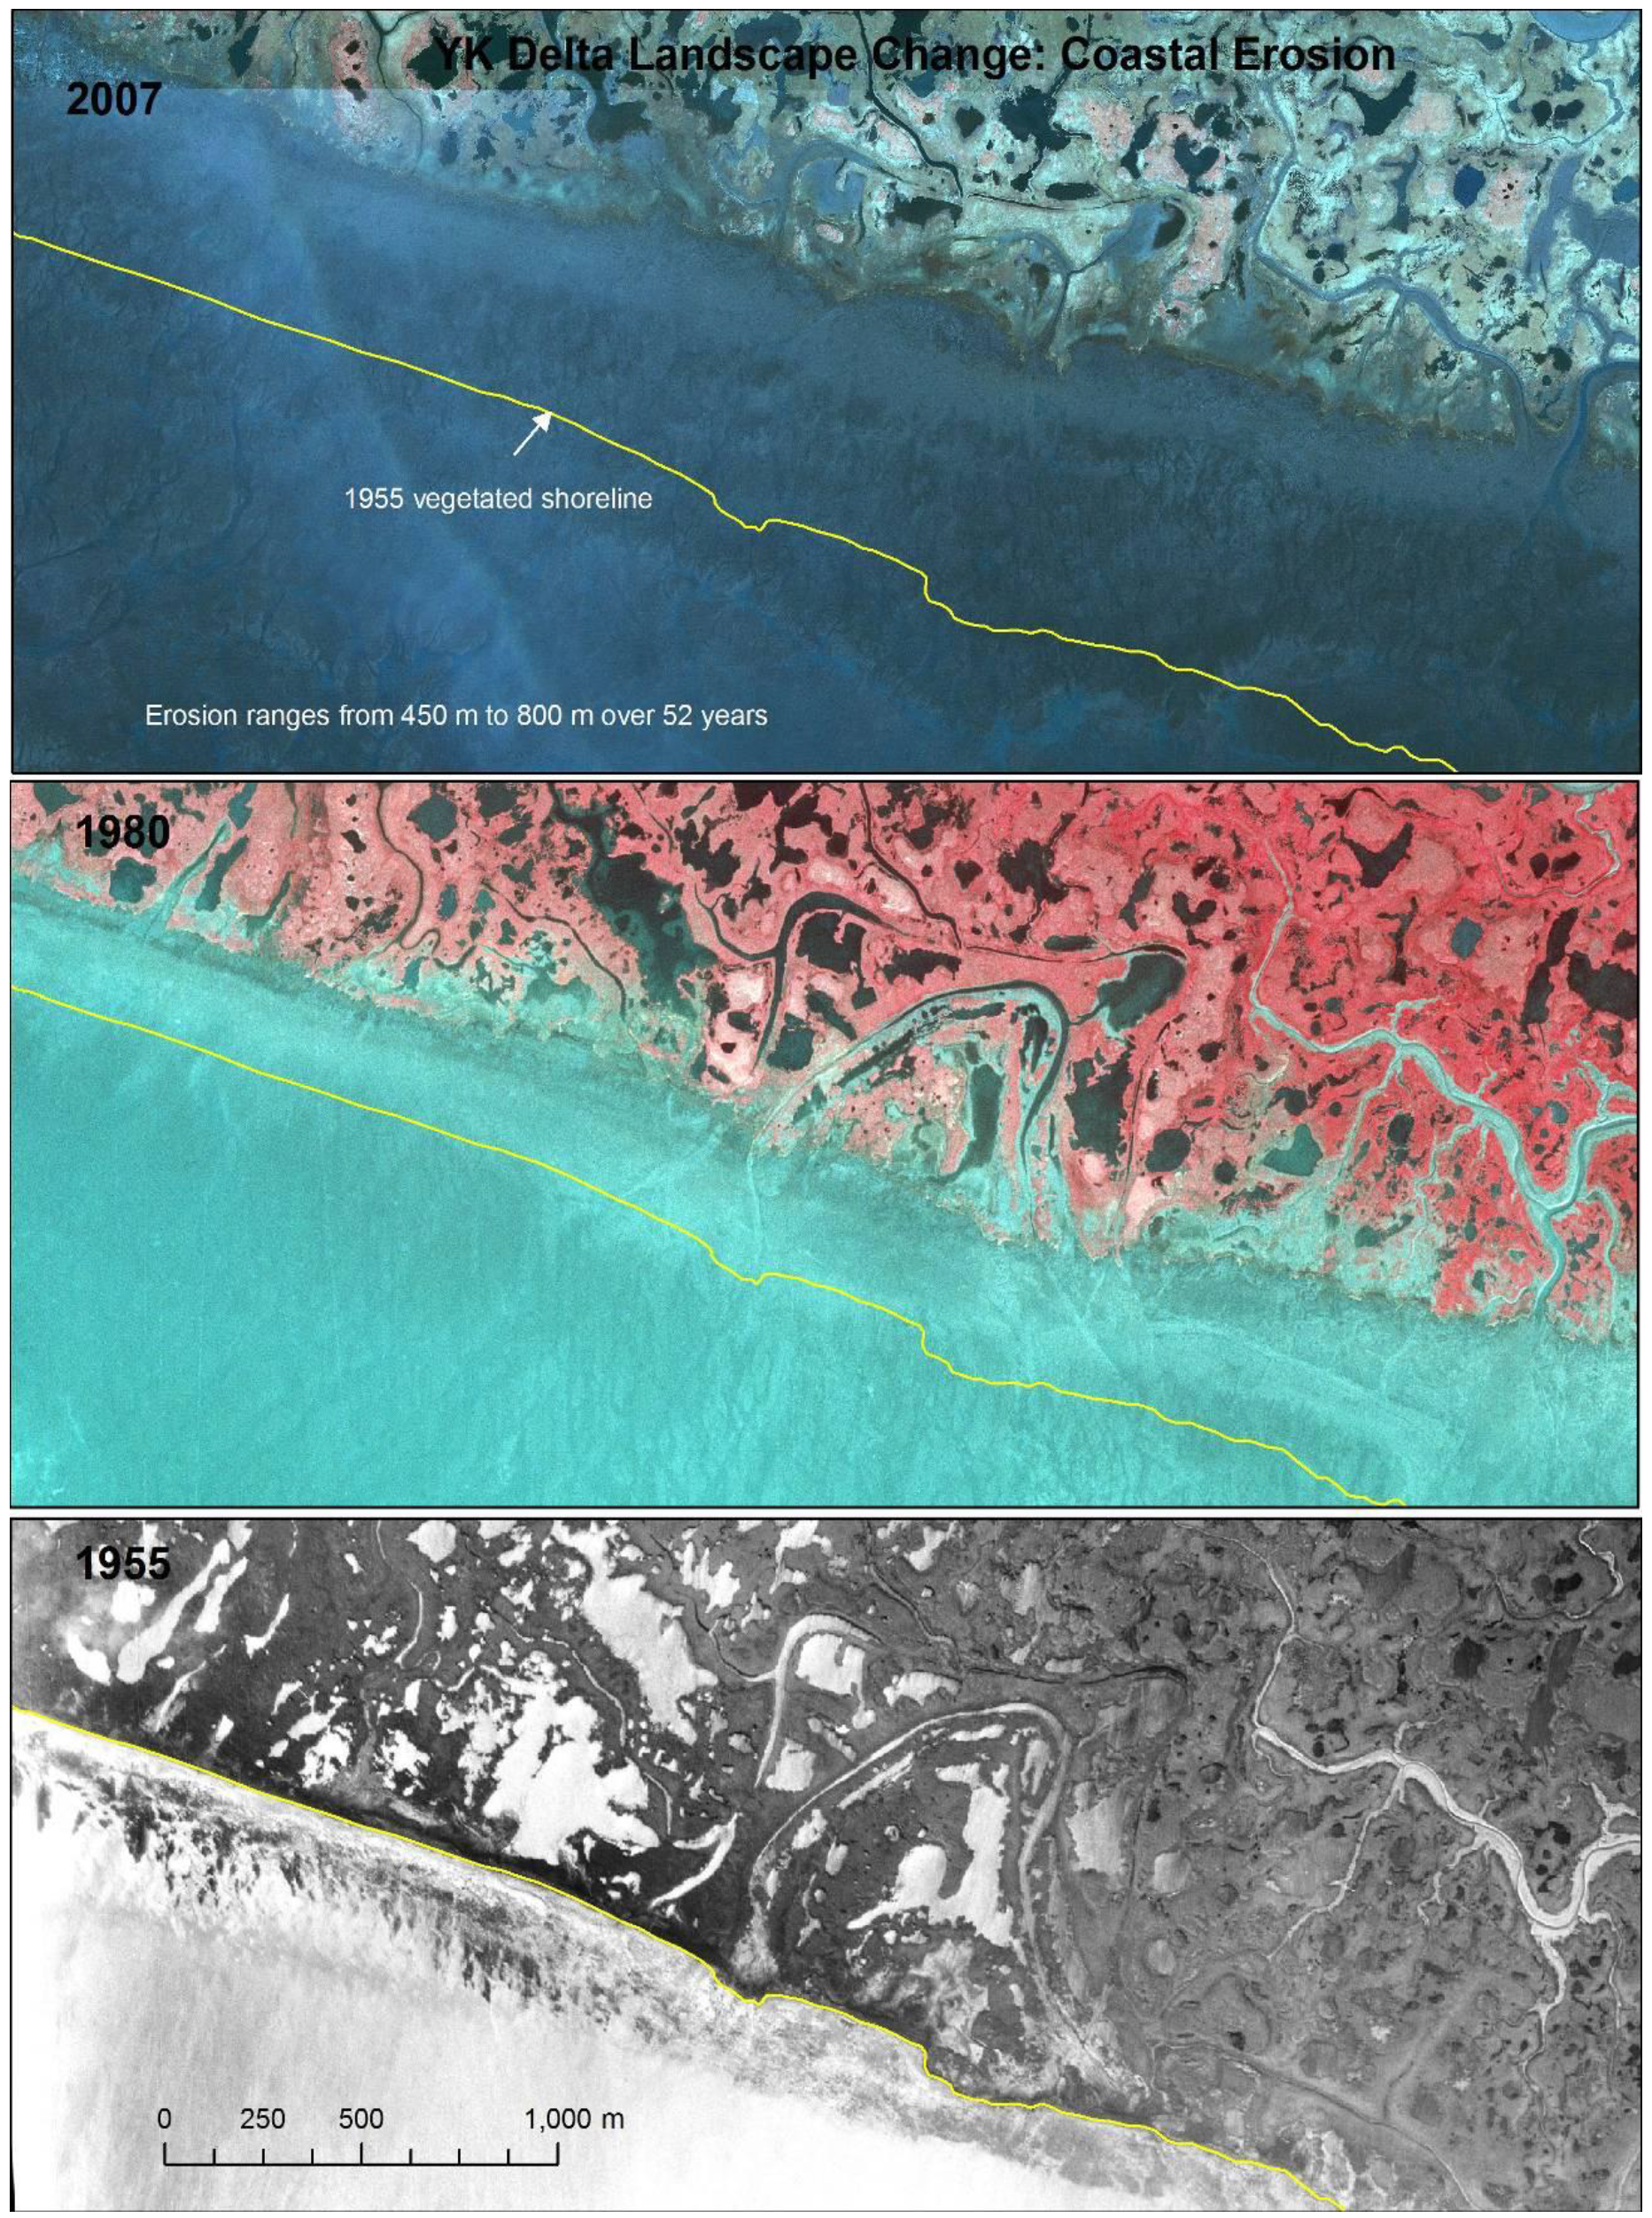
The dominant processes affecting change between 1953 and 2015 were permafrost degradation (5.3 ± 2.2% of area, 95% CI, n = 12), channel erosion (3.0% ± 2.5%), channel deposition (2.2% ± 2.2%), vegetation colonization (2.3% ± 1.8%) and lake drainage (1.5% ± 1.0%). Sedimentation, water-level fluctuations, permafrost aggradation and vegetation paludification each affected <0.5% of the study area. When comparing differences among periods, these processes together affected 6.0% of area during 1953–1980, 7.2% during 1980–2007 and 3.8% during 2007–2015. Channel erosion, channel deposition and sedimentation were more common near the coast on active tidal floodplain deposits, whereas permafrost degradation and lake drainage were more common inland on abandoned floodplain deposits (Figure 7). Vegetation colonization was common throughout the study area, typically in association with river channel migration and lake drainage. Coastal erosion along tidal margins was not encountered by the grid sampling but was clearly an important driver along the outer delta margin outside of the sampling grids, where along one segment, the coast eroded 450 to 800 m over a 52-year interval at rates ranging from 8.7 to 15.4 m/year (Figure 8).
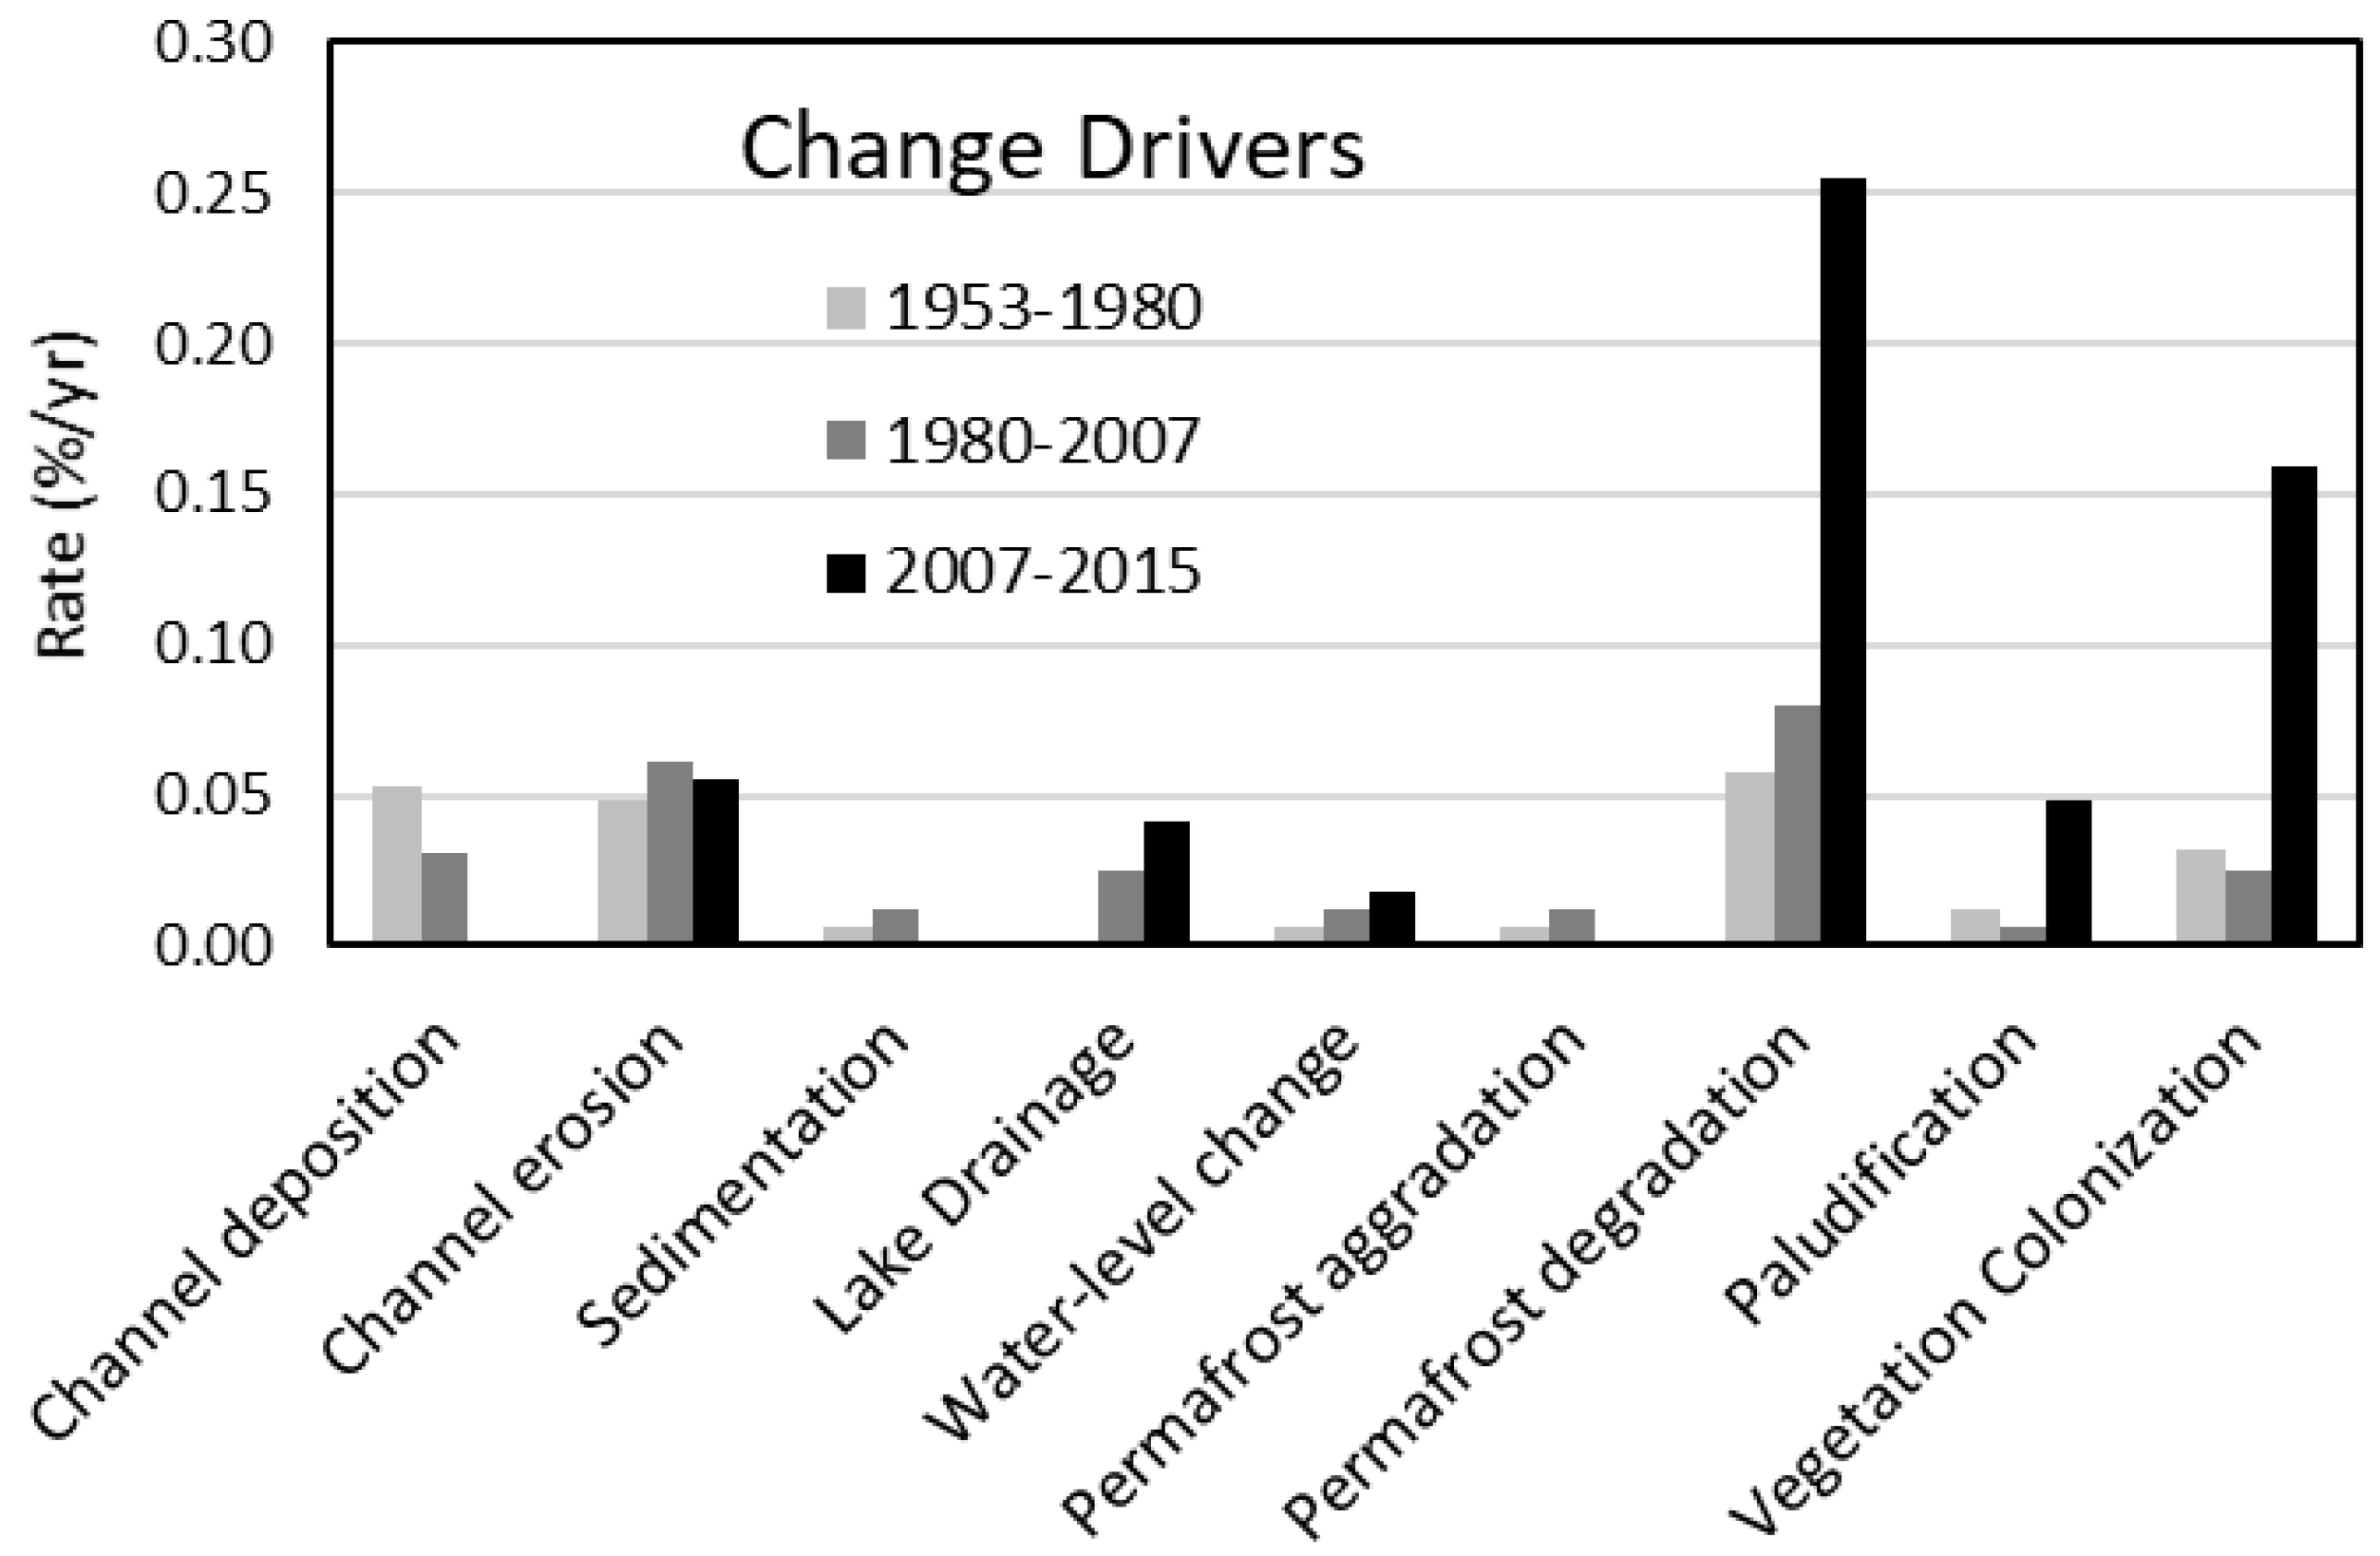
The overall rate of change was 0.26%/year and was dominated by permafrost degradation (0.09%/year), channel erosion (0.05%/year) and channel deposition (0.04%/year), when calculated on an annual basis incorporating the number of years for the change interval specific for each grid. Overall rates of change were similar between the early (0.22 ± 0.10%/year) and middle (0.27 ± 0.16%/year) intervals and doubled during the recent (0.58 ± 0.70%/year) interval.
When comparing changes in rates among intervals caused by the various geomorphic and ecological drivers, there were no significant changes in rates for any driver due to mixed trends among grids (Figure 9, Table A4); where rates went up in some grids while down in others over time. While large increases in rates between the early and recent intervals were found for permafrost degradation (from 0.06 to 0.26%/year) and vegetation colonization (from 0.03 to 0.16%/year) and to a lesser extent for vegetation paludification (from 0.01 to 0.05%/year), rates were highly variable among grids and means were often affected by a large change in only one grid. A moderate decrease in rates was found for channel deposition (from 0.05 to 0.00%/year), mostly due to more barren mudflats being colonized by vegetation than water being converted to mudflats, but again the mean was affected by a large change in one grid. We attributed this in large part to the heavy sedimentation from the 2005 storm that buried substantial area before the 2007 photo-interpretation period and vegetation recovery during the subsequent decade before the ~2013 period. We attributed the lack of significant trends to the highly spatial variability in disturbance processes that affect different areas (grids) and different times.
3.4. Regional Drivers
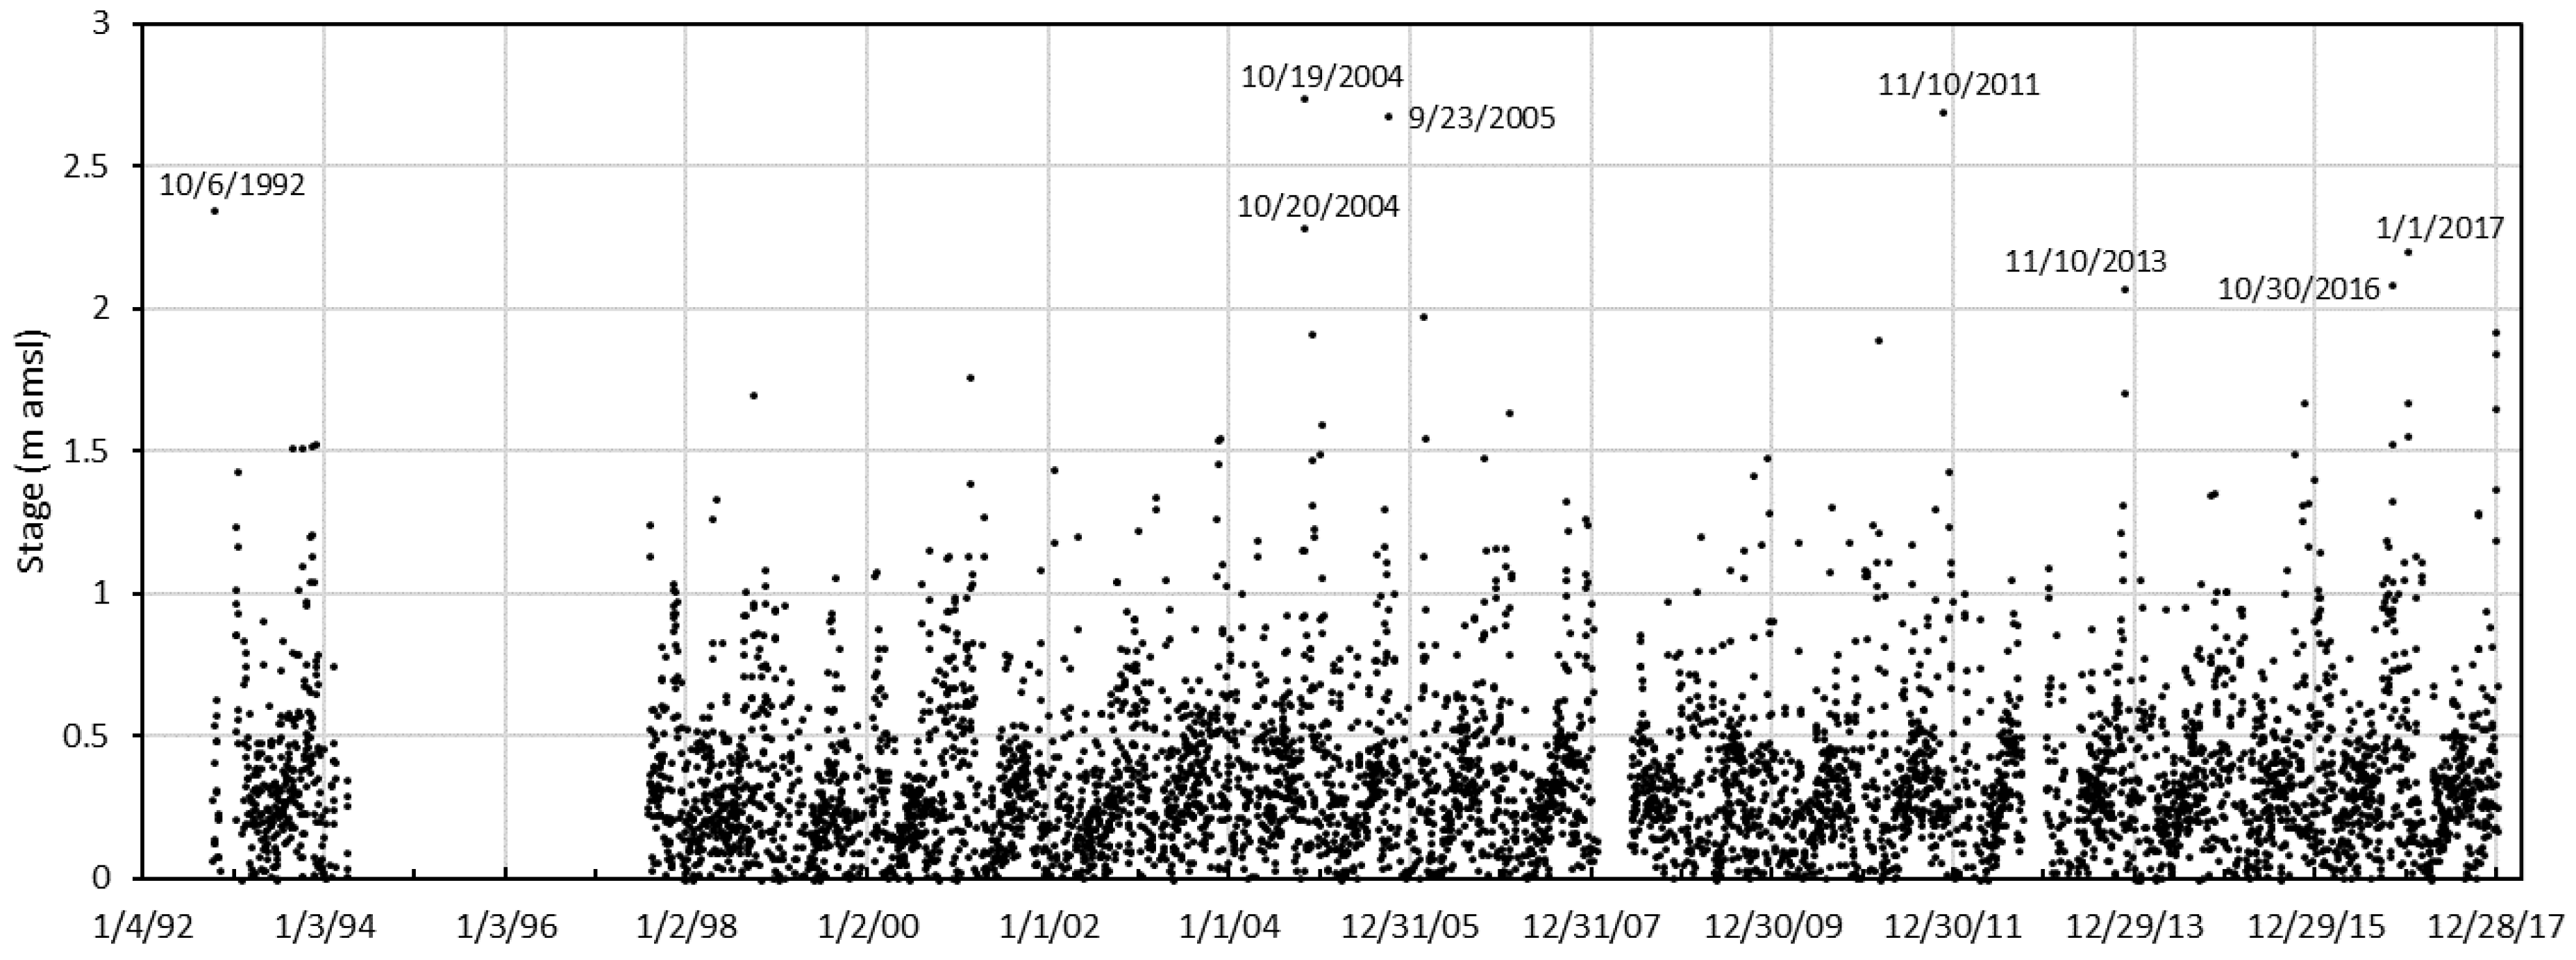
The changes in ecotypes on the YKD and the types of change associated with geomorphic and ecological processes, are directly or indirectly related to sea-level rise and changes in storm frequency and to climate warming. Tide gauge data from Nome, ~370 km north of the study area, show that there were seven storms with peak water levels >2 m above mean sea level between 1992 and 2017, although there are some gaps in the data record (Figure 10). During this observation period, there was one large storm during the 8 years of observation between 1992 and 2003 compared to 6 large storms during the 13 years between 2004 and 2017. In addition to these more recent storms, other large storms occurred in 1913, 1945, 1946, 1960, 1974, 1978 and 1982 [20]. Our field observations indicate that the September 2005 storm, which occurred before ground freeze-up, caused substantial salt-kill and sediment burial of vegetation, whereas the November 2011 storm, which occurred when surface soils were frozen and snow was on the ground, caused negligible salt-kill. The 2005 storm flooding extended up to 30 km inland [20]. Dau and Lensink [21] also noted that the large storms in 1974 and 1978 caused substantial vegetation damage due to heavy sedimentation along the outer delta habitats.
Permafrost is sensitive to thawing associated with a warming climate. Climate data from Nome revealed that the long-term (1908–2017) average for mean annual air temperature (MAAT) was −3.0 °C and that MAATs have increased 1.5 °C during the last century (Figure 11). Temperatures were particularly warm during 1936–1943, 1978–1983, 2000–2007 and 2014–2017. Over the three intervals of the change analysis, MAATs averaged −3.6 °C during 1953–1980, −2.4 °C during 1980–2007 and −2.4 °C during 2007–2015. The rate of permafrost degradation during the three periods was 0.06%, 0.08% and 0.26%, respectively, indicating the increased rate of permafrost degradation coincided with the increased MAAT of 1.2 °C. We attribute much of the large increase in permafrost degradation, however, to seawater flooding during the large 2005 storm. For example, we observed numerous locations in the field in 2007 where the margins of permafrost plateaus had collapsed due to salt-kill of vegetation (Figure 6, photo F).
4. Discussion
4.1. Implications for YKD Ecosystems
The overall rate of change on the YKD of 16% from ~1953 to 2015 was similar to changes in other coastal regions of Alaska. A similar image analysis for coastal ecosystems along western Cook Inlet without permafrost by Jorgenson et al. [13] found that 20.5% of the landscape changed from 1948–1957 to 2000–2005, mostly due to shoreline erosion (3.9%), channel deposition (1.8%), sedimentation (2.4%), early succession of pioneering vegetation on mudflats and beach ridges (4.1%) and late succession of Sitka Spruce forests on beach ridges (3.4%). In the permafrost-dominated environment of the Colville River Delta in northern Alaska, Jorgenson et al. [22] found that 8.2% of the area changed from 1955 to 1992, mostly due to bank and mid-channel erosion (2.3%), channel deposition (2.6%), lake drainage (1.8%) and lake-level fluctuation (0.9%). These studies reveal that deltas are highly dynamic ecosystems because of their location at the interface of the land and sea and that large storms and dynamic changes associated with channel erosion and deposition are normal geomorphic processes in deltaic environments. The YKD, however, is unusual in its location along the southern margin of the permafrost zone and its accelerating loss of permafrost.
Large storms can accelerate erosion and have the capability of mobilizing sediments from the seabed and redistributing them during flooding [23,24]. According to an analysis of newspaper records of storms at Nome by Mason et al. [25], the most frequent and intense storms hit during 1900–1913, 1936–1946, 1974–1976 and in 1992 and storm surges were infrequent during 1916–1928 and 1947–1959. While there has not been a statistical trend of increasing storm events in the Bering Sea region from 1948/49 to 2008 [26], we found 6 large storms during 2004–2017 compared to 1 during 1992–2003. Driftwood associated with these storms are good markers of storm magnitude [27] and driftlines are evident within the study area as far inland as 37 km [20]. The September 2005 storm (see boundaries in Figure A1), in particular, had large effects due to heavy sediment deposition along channel margins and salt-kill of vegetation along the margins of the permafrost plateaus that led to widespread permafrost degradation, both of which were evident in the air photo analysis and from field observations.
While our high-resolution sampling approach was not targeted toward quantifying the effects of coastal erosion and our one grid situated across the coastal margin did not detect coastal erosion, coastal erosion and deposition have broad impacts across the coastal margin of the YKD. Macander et al. [28] used a time-series of MSS and Landsat imagery from 1972 to 2013 to quantify water and land changes associated with coastal erosion and accretion, as well as lake drainage and surface wetting across the coastal margins of western Alaska, including the YKD. They classified change types for individual pixels, as well as summarized area changes within ~90 km2 hexagonal grid cells. In their analysis, the magnitude of change from coastal erosion or accretion ranged from 0.01 to 4.11% of area across the individual grid cells, and averaged 0.02% within the 181,479 km2 area along the outer coast of the entire YKD. For the area, we highlighted at Hazen Bay in Figure 8 as an example of high coastal erosion along the coastal, they found it had unusually high coastal erosion (4.11% of area) in contrast to other areas along the YKD coast where change was generally <1% of area. When comparing their Landsat-derived changes with our point-sampling approach, Macander et al. [28] found 0.25% of our study area (2118 km2) was affected by coastal erosion. This region has been understudied by Arctic wide [29] and global coastal erosion studies [30].
Permafrost degradation on the YKD appears to be accelerating due to a combination of storm flooding and increasing air temperatures. We attribute the abrupt increase since 2007 mostly to extensive salt damage to vegetation along the margins of the permafrost plateaus; living vegetation plays a critical role in maintaining permafrost thermal regime through canopy-shading of the ground surface, albedo effects (e.g., by bright, highly reflective lichen mats) and by reducing surface wetness through evapotranspiration. However, we have also detected an increase in thermokarst features in the central portions of the plateaus that were not subject to saltwater flooding and therefore must have been more closely linked with increasing temperatures. Both numerical modeling of permafrost dynamics by Jafarov et al. [31] and satellite spatial modeling by Pastick et al. [32] indicate that most permafrost will be eliminated from the YKD by 2050. Our detection of an accelerating trend in permafrost degradation is consistent with the modeling results. Studies of ice-wedge degradation in northern Alaska using air photo analysis [15,16] have also found accelerating permafrost degradation. Yet, establishing a causal link between the increased rates of change and climate warming is complicated by the complex interactions among biophysical components of the landscape and numerous positive and negative feedbacks that affect ecological changes [33]. Two factors that are increasing the rates of permafrost degradation on the YKD are the effects of storm surges and salt-killed vegetation that increases degradation along the margins and water-filled thermokarst pits that leads to fragmentation of the plateaus. Remote sensing using time-series analysis of air photo and satellite imagery [11,15,16] and LiDAR [18,34,35] are both effective means of analyzing localized trends in permafrost degradation, while region-wide assessment of permafrost degradation using satellite imagery remains problematic [36].
The amount of change detected by the image analysis was similar to that observed in the field; at 101 intensive plots, we observed 13 (13%) that changed from 1994–1997 to 2015–2016 due to channel erosion (5%), sedimentation (4%), thermokarst (2%), vegetation colonization (1%) and grazing (1%). The field plots detected more sedimentation and less thermokarst than the remote sensing, which we attributed to more plots being located near the coast (more sedimentation, less thermokarst) and most plots being located away from ecotones (patch margins) where changes (sedimentation, thermokarst) occurred more frequently.
4.2. Sources of Uncertainty and Limitations
There are several sources of uncertainty and limitations to our study, including the photo-interpretation approach and its accuracy, the coarse time intervals, high spatial and temporal variability in the data, our ability to draw regional inferences from our study and qualitative ability to link changes from landscape drivers to regional forces, such as air temperatures changes, sea level rise and storm history.
There are both advantages and limitations to photo-interpretation for detecting landscape change using retrospective remote sensing. The approach can extend the analysis period back to the 1940s and 1950s by using early panchromatic photographs, deal with highly variable image quality, interpret multiple landscape characteristics (e.g., surficial geology, vegetation and canopy structure evident from shadows) and analyze change at high-resolution (~1 m), which is better for detecting small-scale changes, such as thermokarst. The approach, however, is reliant on the experience and skill of the interpreter, with some types of change distinctly evident, while others are subtle and related to vegetation shifts associated with succession or long-term climate change. An important factor aiding the photo-interpretation process was the high accuracy of the image co-registration (RMS 0.01–1.67 m), which ensured that changes in ecotypes were due to true changes and not just to misalignment of the time-series images.
While it was not possible to perform a formal ground-based accuracy assessment of the photo-interpretation, we benefitted from a network of 304 ground plots and 20 years of field experience monitoring change in the area. In addition, most of the change we quantified, such as permafrost degradation (change from plateau to water) and channel erosion (land to water), entailed straightforward changes in surface properties that were readily detectable on all image types. We suspect, however, that subtle changes, such as salt-killed meadows, sedimentation and transitions among meadow types, were underestimated. Tracking such changes generally requires intensive, long-term field-based measurements. Emerging technologies, such as hyperspectral systems, LiDAR, Synthetic Aperture Radar (SAR) and very-high-resolution imaging by Unmanned Aerial Systems (UAS), however, offer a way forward for monitoring subtle changes in vegetation composition and structure using remote sensing.
The broad time intervals inherent in the sparse archive of historical imagery limited our ability to detect some types of change, depending on type of driver. For example, for pulse disturbances, such as large storm events and salinization, we think coastal vegetation can recovery from heavy sedimentation or salinization within 5 to 10 years, so that flooding events are unlikely to be detected over the ~20-year intervals of the earlier intervals. In contrast, press disturbances, such as coastal erosion and permafrost degradation, are fairly linear in their long-time effects so that changes are easily detected over both short and long intervals. The availability of near annual high-resolution imagery should help reduce this uncertainty in the future.
Assessing changes in diverse ecosystems in response to a wide array of drivers across heterogeneous landscape remains a difficult challenge because of the high variability inherent in such datasets. In our study area, we found different ecotypes responded to different drivers in different areas at different times (Figure 7). Thus, parametric analyses performed poorly because much of the data were not normally distributed, while nonparametric analyses involving ranked observations also performed poorly because of the high frequency of zeros in the data matrix that led to medians frequently being zero, even though large changes occurred in some grid cells. Given these bad options, we opted for a repeated measures ANOVA to partition variability within grid cells even though tests for normality were poor. Using this approach, we found a few of the common ecotypes (1 of 3 with normal distributions) had statistically significant changes over time but no significant changes were found for change drivers because of their irregular spatial distribution and highly variable rates over time.
We express caution about how well inferences can be drawn from our limited study area to the broader YKD. First, our study area focused on only a small portion of the YKD that mostly encompassed coastal and coastal plain physiography along the outer coast (Figure 1), while much of the YKD ecoregion has upland and riverine physiography for which our results do not apply. Second, our results show that ecotypes and change drivers were highly variable across grids and our experience in the region indicates that ecological landscapes across the region can be quite different [17]. That said, the drivers on landscape change associated with sea level rise, permafrost degradation, as well as other drivers, are active across the region so that our results provide an assessment that is roughly applicable across the coastal and coastal plain portions of the delta (Figure 1). Additional sampling across the broader YKD region would help resolve this uncertainty.
Finally, relating rates of landscape change associated with regional drivers, such as air temperatures and storm flooding is problematic. First, there is a mismatch between the temporal scale of the hourly (aggregated to annual) temperature data and the four periods of imagery used to detect change. This provides an insufficient temporal record to quantitatively analyze dose-response and time-series relationships. Second, the lack of long-term records of sea level and the magnitude and frequency of storm flooding in the study area impeded our ability to assess effects from individual storms. Third, ecological responses and feedbacks to disturbance and consequent recovery, are too complicated and inadequately understood to allow reliable dose-response analyses. Instead, we highlight specific events, such as the 2005 storm flooding for which we have extensive ground observations and general trends supported by regional permafrost thermal modeling, to broadly infer relationships among coastal dynamics, permafrost degradation, sea level rise and climate warming. In the future, ongoing intensive field monitoring and better availability of high-resolution imagery should improve our ability to assess the effects of biophysical drivers on landscape change.
5. Conclusions
Photo-interpretation and point-sampling of high-resolution imagery is an effective approach for assessing changes in diverse ecosystems responding to a wide array of drivers across heterogeneous landscapes. Photo-interpretation of landscape change evident on air photos from 1948–1955 and 1980, IKONOS satellite images from 2007–2008 and WorldView satellite images from 2013–2016 found that ecotypes changed 16.2% (342 km2) in the 2118 km2 area along the central coast of the YKD during the ~62-year time span. Assessing change trends is challenging, however, because different ecotypes respond to differing drivers in different areas at different times, with some drivers, such as sedimentation and salinization having short-term effects, while others, such as channel erosion and permafrost degradation having long-term effects. The increasing availability of high-resolution imagery should help resolve monitoring of ecosystem responses to both pulse and press disturbance drivers.
The dominant processes affecting change were permafrost degradation, channel erosion, channel deposition, vegetation colonization of mudflats and lake drainage, while sedimentation, water-level fluctuations, permafrost aggradation and shoreline paludification affected little area. Rates of change increased dramatically for permafrost degradation and vegetation colonization of mudflats, while there was a large decrease in channel deposition associated with more barren mudflats being colonized by vegetation than water converted to mudflats. In contrast, rates of channel erosion remained fairly constant. The increased rate of permafrost degradation over the three time intervals came at a time of increased storm frequency and increasing air temperatures. We attribute the large increase in permafrost degradation during the recent interval to the extensive salt-kill of vegetation along the margins of the permafrost plateaus from the large 2005 storm. Sedimentation from the 2005 storm buried substantial areas with thick mud and vegetation has rapidly colonized some of these areas. Due to the combination of very low ground elevations, projected increase in sea-level and reduced sea-ice and accelerated permafrost degradation and collapse of permafrost plateaus, we believe the YKD is the most vulnerable region in the Arctic to climate warming.
Author Contributions
M.T.J. designed the study, performed the photo-interpretation, analyzed the data and wrote the report. G.V.F. contributed to the fieldwork and writing. D.D. performed imagery geo-rectification.
Funding
This research was initially funded by the U.S. Fish and Wildlife Service, with addition funding by the NASA ABoVE grant number [NNH16CP09C].
Acknowledgments
This research was support by the U.S. Fish and Wildlife Service, Anchorage, Alaska, under their wetland status and trends program and the NASA’s Arctic-Boreal Vulnerability Experiment (ABoVE). The scanned air photos were provided by the U.S. Geological Survey, the IKONOS imagery was provided by the USFWS and the 2013–2016 Digital Globe imagery was provided under the terms of the NextView license.
Conflicts of Interest
The authors declare no conflict of interest.
Appendix A

Table A1.
List of images and dates used for analyzing landscape change on the YK Delta.
| Grid | Period | Date | Image File and RMS Georectification Error | |
|---|---|---|---|---|
| 1 | 1948–1955 | 22 June 1951 | yukondelta_1951_june22_poly2_08_92_rms0pt0051.img | |
| 2 | 1948–1955 | 2 September 1955 | yukondelta_1955_sept2_poly2_121_282_rms0pt0042.img | |
| 3 | 1948–1955 | 2 September 1955 | yukondelta_1955_sept2_poly2_121_205_rms0pt0042.img | |
| 4 | 1948–1955 | 2 September 1955 | YKDelta_Tut_1955-09-02_ABHM071_123_15542_poly2_rms0pt61.img | |
| 5 | 1948–1955 | 2 September 1955 | YKDelta_Tut_1955-09-02_ABHM070_121_15202_poly2_rms1pt67.img | |
| 6 | 1948–1955 | 2 September 1955 | YKDelta_Tut_1955-09-02_ABHM070_121_15268_poly2_rms0pt91.img | |
| 7 | 1948–1955 | 20 June 1952 | yukondelta_1952_june20_poly2_12_905_rms0pt0040.img | |
| 8 | 1948–1955 | 25 June 1951 | yukondelta_1951_june25_poly2_19_63_rms0pt0048.img | |
| 9 | 1948–1955 | 22 June 1951 | yukondelta_1951_june22_poly2_08_208_rms0pt0050.img | |
| 10 | 1948–1955 | 25 June 1951 | yukondelta_1951_june25_poly2_25_89_rms0pt0053.img | |
| 11 | 1948–1955 | 2 September 1955 | yukondelta_1955_sept2_poly2_121_500_rms0pt0047.img | |
| 12 | 1948–1955 | 24 August 1948 | YKDelta_Aphrewn_1948-8-24_3GRD14021_089_rms1-2.img | |
| 1 | 1980 | 17 July 1980 | yukondelta_jul17_1980_frame313_cam_rms0pt0032.img | |
| 2 | 1980 | 17 July 1980 | yukondelta_jul_1980_frame317_cam_rms0pt0029_zdem.img | |
| 3 | 1980 | 17 July 1980 | yukondelta_jul_1980_frame322_cam_rms0pt0025_zdem.img | |
| 4 | 1980 | 17 July 1980 | yukondelta_jul17_1980_frame329_cam_rms0pt0018_zdem.img | |
| 5 | 1980 | 17 July 1980 | yukondelta_jul17_1980_frame329_cam_rms0pt0018_zdem.img | |
| 6 | 1980 | 17 July 1980 | yukondelta_jul17_1980_frame334_cam_rms0pt0031_zdem.img | |
| 7 | 1980 | 17 July 1980 | yukondelta_jul17_1980_frame337_cam_rms0pt0021.img | |
| 8 | 1980 | 17 July 1980 | yukondelta_jul17_1980_frame340_cam_rms0pt0098.img | |
| 9 | 1980 | 17 July 1980 | yukondelta_jul17_1980_frame340_cam_rms0pt0034.img | |
| 10 | 1980 | 17 July 1980 | yukondelta_jul17_1980_frame221_poly2_rms0pt0039.img | |
| 11 | 1980 | 17 July 1980 | yukondelta_jul17_1980_frame216_poly2_rms0pt0019.img | |
| 12 | 1980 | 17 July 1980 | YKDE Aphrewn 1980-07-17 AB642700070ROLL_218_rms0-5.img | |
| 6 | 1988 | 29 June 1988 | YDNWR_177_6-29-88_poly2_rms0pt69.img | |
| 4 | 1988 | 29 June 1988 | YDNWR_fr085_6-29-88_poly2_rms0pt51.img | |
| 5 | 1988 | 29 June 1988 | YDNWR_fr137_6-29-88_poly2_rms0pt3.img | |
| 1 | 2007–2008 | 2007–2008 | yk_delta_IKONOS_0-3, Mosaic from 27 August 2007 and 28 July 2008 | |
| 2 | 2007–2008 | 2007–2008 | yk_delta_IKONOS_0-3, Mosaic from 27 August 2007 and 28 July 2008 | |
| 3 | 2007–2008 | 2007–2008 | yk_delta_IKONOS_0-3, Mosaic from 27 August 2007 and 28 July 2008 | |
| 4 | 2007–2008 | 2007–2008 | yk_delta_IKONOS_0-3, Mosaic from 27 August 2007 and 28 July 2008 | |
| 5 | 2007–2008 | 2007–2008 | yk_delta_IKONOS_0-3, Mosaic from 27 August 2007 and 28 July 2008 | |
| 6 | 2007–2008 | 2007–2008 | yk_delta_IKONOS_0-3, Mosaic from 27 August 2007 and 28 July 2008 | |
| 7 | 2007–2008 | 2007–2008 | yk_delta_IKONOS_0-3, Mosaic from 27 August 2007 and 28 July 2008 | |
| 8 | 2007–2008 | 2007–2008 | yk_delta_IKONOS_0-3, Mosaic from 27 August 2007 and 28 July 2008 | |
| 9 | 2007–2008 | 2007–2008 | yk_delta_IKONOS_0-3, Mosaic from 27 August 2007 and 28 July 2008 | |
| 10 | 2007–2008 | 2007–2008 | yk_delta_IKONOS_0-3, Mosaic from 27 August 2007 and 28 July 2008 | |
| 11 | 2007–2008 | 2007–2008 | yk_delta_IKONOS_0-3, Mosaic from 27 August 2007 and 28 July 2008 | |
| 12 | 2007–2008 | 2007–2008 | yk_delta_IKONOS_0-3, Mosaic from 27 August 2007 and 28 July 2008 | |
| 1 | 2013–2016 | 19 June 2015 | yk_block01_WV01_20150619233817_poly2_rms1pt24m_10pts.tif | |
| 2 | 2013–2016 | 11 17 July 2013 | yk_block02_WV02_20130711224204_poly3_rms0pt14.tif | |
| 3 | 2013–2016 | 19 June 2015 | yk_block03_WV02_20150619222633_poly1_rms0.pt57.tif | |
| 4 | 2013–2016 | 31 August 2016 | yk_block04_WV03_20160831231034_poly2_rms0pt34.tif | |
| 5 | 2013–2016 | 31 August 2016 | 2016 | yk_block05_WV03_20160831231034_poly1_rms0pt66.tif |
| 6 | 2013–2016 | 19 June 2015 | 2015 | yk_block06_WV02_20150619222620_poly1_rms0pt58.tif |
| 7 | 2013–2016 | 13 June 2015 | 2015 | yk_block07_WV02_20150613224910_poly1_rms0pt28.tif |
| 8 | 2013–2016 | 19 June 2015 | 2015 | yk_block08_WV01_20150619233817_poly1_rms0pt57.tif |
| 9 | 2013–2016 | 11 17 July 2013 | 2013 | yk_block09_WV02_20130711224202_poly2_rms1pt05.tif |
| 10 | 2013–2016 | 11 17 July 2013 | 2013 | yk_block10_WV02_20130711224202_poly2_rms0pt51.tif |
| 11 | 2013–2016 | 31 August 2016 | 2016 | yk_block11_WV03_20160831231034_poly2_rms0pt32.tif |
| 12 | 2013–2016 | 19 June 2015 | 2015 | yk_block12_WV02_20150619222619_poly1_rms1pt11.tif |
Table A2.
Classification and description of ecosystem types on the Yukon-Kuskokwim Delta.
| Ecotype | Description |
|---|---|
| Marine Nearshore Water (MNW) | Marine water in shallow nearshore water. |
| Coastal Saline Tidal River (STR) | Saline (S, >16,000 µS/cm) rivers and channels under tidal influence and with substantial freshwater input from upstream tributaries |
| Coastal Saline Tidal Pond (STP) | Saline shallow ponds that are subject to frequent tidal inundation and ponds are adjacent or within the tidal flats. Vegetation is absent |
| Coast. Saline Channel Barrens (SCB) | Bottoms of channels exposed at low water and barren, saturated, saline (S), muddy sediments along the sloping margins of tidal channels and rivers. |
| Coastal Saline Flat Barrens (BDL) | Barren, saturated to imperfectly drained, saline muddy sediments on flats that are affected by frequent inundation at high tides. |
| Slightly Brackish Drained Lake (KDL) | Barren, saturated, muddy sediments in slightly brackish ponds that recently have been drained or tapped by channel migration |
| Coastal Saline Wet Hoppner Sedge Meadow (SHM) | Margins of tidal flats with soils that frequently are flooded, saturated, brackish (8000–16,000 µS/cm) and lacking organics. Occasionally on pond margins. Vegetation is dominated by Carex subspathaceae and Puccinellia phryganodes. |
| Coastal Brackish Wet Ramenskii Sedge Meadow (BRM) | Margins of tidal flats and sloughs similar to above and to a lesser extent along pond margins. Vegetation is dominated by robust, nearly monospecific stands of Carex ramenskii. |
| Coastal Brackish Wet Ramenskii Sedge Meadow (BRM) | Flats and basins on active-floodplains along the outer coast with soils that have interbedded fine sediments from frequent sedimentation. Soils are saturated, neutral in pH, mesohaline and lack organics and permafrost. Vegetation is dominated by C. ramenskii and Argentina (=Potentilla) egedii and Stellaria humijusa, Poa eminens and Calamagrostis deschampsioides are common. |
| Coastal Brackish Moist Dunegrass Meadow (BDM) | Lower portions of levees along tidal channels where tidal inundation and sedimentation are frequent. Soils are loamy, moist, well-drained, mesohaline and lack organics and permafrost. Vegetation is dominated by A. egedii, Leymus mollis (dunegrass) and Ligusticum scoticum and frequently includes Triglochin palustris, C. deschampsioides and P. eminens. |
| Coastal Brackish Moist Willow Dwarf Scrub (BWS) | Higher levees along tidal channels where inundation and sedimentation are frequent. Soils are silt to sandy, moist, well-drained, brackish and lack organics and permafrost. Vegetation is dominated Salix ovalifolia, Deschampsia caespitosa, Carex glareosa and C. deschampsioides, often with Festuca rubra and T. palustris. |
| Coastal Br. Shallow Open Water (BSOW) | Brackish shallow ponds that are subject to inundation during storms. Vegetation is absent. |
| Coastal Slightly Brackish Pendent Grass Marsh (KPE) | Margins of tidal rivers with slightly brackish (K, 800–8000 µS/cm), muddy soils supporting vegetation dominated by the grass Arctophila fulva, although vegetation intergrades with H. tetraphylla and Carex lyngbyei. |
| Coastal Slightly Brackish Wet Lyngbye Sedge Meadow (KLM) | Margins of inland, slightly brackish (K) tidal channels with soils that are frequently flooded, saturated, slightly brackish, loamy and lacking organics. Vegetation is dominated by the robust growth of Carex lyngbyei but often intergrades with Hippuris tetraphylla and Arctophila fulva. |
| Coastal Slightly Brackish Wet Mackenzie Sedge Meadow (KMM) | Pond margins and depressions on inactive floodplains where sedimentation is infrequent. Soils have interbedded organics and silts, are saturated and slightly brackish and lack permafrost. The vegetation is dominated by Carex mackenziei, S. humijusa and C. ramenskii. |
| Coastal Slightly Brackish Wet Dupontia Graminoid Meadow (KDM) | Similar to above, except the vegetation is dominated by Carex ramenskii, Dupontia fisheri and Calamagrostis deschampsioides. |
| Coastal Slightly Brackish Wet Sedge-Crowberry Meadow (KRM) | Basins (flats) on inactive floodplains where inundation and sedimentation are infrequent as indicated by interbedded organics and silty loam layers near the surface. Soils are saturated, slightly brackish and neutral to slightly acidic and permafrost is absent. Vegetation is dominated by Carex rariflora, Empetrum nigrum and Salix fuscescens and usually includes C. deschampsioides and Dendranthema (=Chrysanthemum) arcticum but lacks Sphagnum spp. |
| Coastal Slightly Brackish Rariflora Sedge Bog (KRB) | Basins (flats) and old levees on inactive floodplains where inundation and sedimentation are infrequent. Soils are saturated, slightly brackish and slightly acidic and permafrost is absent. Vegetation is dominated by C. rariflora, S.fuscescens, E. nigrum and S. squarrosum and usually includes C. deschampsioides and Sonionia uncinata but lacks C. ramenskii. |
| Coastal Slightly Brackish Moist Bluejoint Grass Meadow (KBM) | Old levees and margins of pennafrost plateaus where flooding and sedimentation are infrequent. Soils are saturated, slightly brackish and slightly acidic. Shallow summer thaw depths indicate that pennafrost fonnation is incipient. Vegetation is dominated by Calamagrostis canadensis and usually includes C. rariflora, S. fuscescens, E. nigrum, Ligusticum scoticum and C. ramenskii. |
| Coastal Slightly Brackish Moist Crowberry Dwarf Scrub (KCS) | Old levees and permafrost mounds on inactive floodplains where inundation and sedimentation are infrequent. Soils are moderately well-drained, slightly brackish and strongly acidic. The shallow active layer is underlain by thin (−0.5–2 m) permafrost. Vegetation is dominated by Empetrum nigrum, S. fuscescens, Petasites frigidus, C. rariflora and the moss Sonionia uncinata. |
| Slightly Br. Shallow Open Water (BOW) | Slightly brackish shallow ponds on inactive floodplains that are subject to inundation during storms. Vegetation is absent. |
| Coastal Slightly Brackish Marestail Marsh (KME) | Slightly brackish shallow ponds with emergent vegetation dominated by Hippurus tetraphylla. Submerged vegetation includes Potamogeton filifonnis and Myriophyllum spicatum. |
| Coastal Slightly Brackish Lyngbye Sedge Marsh (KLE) | Slightly brackish shallow ponds with the emergent sedge Carex lyngbyei. Other common plants include C. rostrata, P. filiformis and H. tetraphylla. |
| Lacustrine Shallow Open Water (POW) | Lacustrine (palustrine), fresh (<800 µS/cm), shallow ponds on abandoned floodplains. Ponds generally are larger and rounder than coastal ponds due to impoundment by permafrost development in adjacent plateaus. |
| Lacustrine Marestail Marsh (PME) | Lacustrine, fresh, shallow ponds on abandoned floodplains. Emergent vegetation is dominated by H. tetraphylla and the submergent plant Sparganium hyperboreum. |
| Lacustrine Water Sedge Meadow (PSM) | Lacustrine basins and depressions on abandoned floodplains with thick organic accumulations, indicating flooding and sedimentation are rare. Soils are saturated, fresh and acidic; permafrost is absent. Vegetation is dominated by Carex aquatilis (water sedge) and includes C. rariflora, Eriophorum russeolum and S. fuscescens. |
| Lowland Water Sedge Bog (LSB) | Lowland bogs with thick organic soils supporting vegetation is dominated by Carex aquatilis and Sphagnum spp. and includes Comarum (=Potentilla) palustris, C. rariflora, C. lyngbyei, S. fuscescens and E. nigrum. |
| Lowland Moist Birch-Ericaceous Low Scrub (LBS) | Lowland plateaus on abandoned floodplains with thick organics. Soils are well drained near the surface, fresh, strongly acidic and permafrost is well developed. Vegetation is dominated by Betula nana (dwarf birch), E. nigrum, Ledum palustre, Rubus chamaemorus, Cladina rangiferina, Sphagnum spp. and Dicranum spp. |
| Lowland Moist Tussock Meadow (LTM) | Lowland plateaus on abandoned floodplains inland from the coast. Soils are well drained near the surface, fresh, strongly acidic and permafrost is well developed. Vegetation is dominated by Eriophorum vaginatum tussocks, Betula nana, E. nigrum, Ledum palustre, Rubus chamaemorus, Cladina rangiferina and Sphagnum spp. |
Table A3.
Description of geomorphic and biological drivers of landscape change.
| Driver | Description |
|---|---|
| Coastal erosion | Erosion of barren or vegetation land along outer coasts facing the ocean by ocean waves and currents resulting in the transition of land to water. Does not include changes along tidal channels in deltas. |
| Coastal deposition | Deposition of water-born sediments along the coastal resulting in transition from water to land. Typically it involves deposition or mud, sand, or gravel. It does not include changes along tidal channels. |
| Channel migration-erosion | Erosion of barren or vegetated land along rivers and tidal channels resulting in the transition from barren or vegetated land to water. |
| Channel migration-deposition | Deposition of water-born sediments along rivers and tidal channels resulting in transition from water to land. |
| Sedimentation | Heavy deposition of overbank sediments sufficient to bury vegetation resulting in the transition from vegetated land to barren land. Does not include minor sedimentation where vegetation cover is persistent. |
| Lake Drainage | Catastrophic drainage of most, or all, of a waterbody resulting in the transition from water to barren or partially vegetated land. This does not include minor water-level fluctuations that affect only the margin of a waterbody. |
| Water-level change | Minor water-level changes that affect the margins of a waterbody resulting in the transition from water to land or land to water. Often this is associated with seasonal or annual water-level fluctuations and can be influenced image date. |
| Permafrost aggradation | The heaving of the land surface due to the aggradation of ground ice during permafrost formation evident as mound or plateau formation. Vegetation usually show a distinct transition from bog or wet meadow vegetation to scrub or forest vegetation. Formation of ice-poor permafrost that does not cause distinctive heaving is not detectable on imagery. |
| Permafrost degradation | The collapse of the land surface due to thawing of permafrost. It is mostly evident from the thawing of ice-rich permafrost and resulting thaw settlement. The collapse results in the transition from land to water (thaw lake), or in a distinct transition from scrub or forest vegetation to barren land or to bog or wet meadow vegetation. |
| Paludification | The colonization of vegetation and accumulation of peat in waterbodies, resulting in the transition of water to land. Typically, this involves the transition from open water to bog or wet meadow vegetation along shorelines. It does not include the colonization of water by aquatic vegetation |
| Vegetation colonization | The colonization of barren land by vegetation through primary succession resulting in the transition from barren soil to a partially or entirely vegetated surface. Typically, this occurs on disturbed surfaces. |
Table A4.
Results of repeated measures ANOVA testing significance of ecotype changes across years.
| Class | Grids Changed | Trend | F-Ratio | P | Power (Alpha = 0.05) | Covariance Matrix Circularity |
|---|---|---|---|---|---|---|
| Ecotype | ||||||
| Coastal Brackish Drained Lake Barrens | 4 | Up | 3.4 | 0.028 | 0.720 | Okay |
| Coastal Brackish Moist Dunegrass Meadow | 2 | Bi-directional | 0.4 | 0.749 | 0.122 | Okay |
| Coastal Brackish Shallow Open Water | 3 | Down | 2.2 | 0.107 | 0.508 | Okay |
| Coastal Brackish Wet Ramenskii Sedge Meadow | 3 | Bi-directional | 0.6 | 0.603 | 0.166 | Okay |
| Coastal Br. Wet Ramenskii Sedge-Silverweed M. | 2 | Down | 1.7 | 0.195 | 0.394 | Okay |
| Coastal Brackish Moist Willow Dwarf Scrub | 1 | Down | 1 | 0.405 | 0.247 | Okay |
| Coastal Slightly Br. Moist Crowberry Dwarf Scrub | 0 | No change | ||||
| Coastal Slightly Brackish Drained Lake Barrens | 3 | Bi-directional | 1.7 | 0.191 | 0.398 | Okay |
| Coastal Slightly Br. Wet Lyngbye Sedge Meadow | 2 | Up | 1.5 | 0.225 | 0.366 | Okay |
| Coastal Slightly Brackish Shallow Open Water | 3 | Bi-directional | 1.3 | 0.308 | 0.302 | Okay |
| Coastal Slightly Brackish Rariflora Sedge Bog | 0 | No change | ||||
| Coastal Slightly Br. Wet Rariflora Sedge Meadow | 1 | Down | 1 | 0.405 | 0.247 | Okay |
| Lowland Moist Birch-Ericaceous Low Scrub | 7 | Down | 5.9 | 0.002 | 0.931 | Violated |
| Lowland Water Sedge Bog | 6 | Up | 2.6 | 0.071 | 0.580 | Okay |
| Lacustrine Marestail Marsh | 2 | Up | 2.2 | 0.107 | 0.508 | Okay |
| Lacustrine Shallow Open Water | 6 | Bi-directional | 0.5 | 0.662 | 0.147 | Violated |
| Lacustrine Wet Water Sedge Meadow | 6 | Up | 5.8 | 0.003 | 0.923 | Violated |
| Coastal Saline Channel Barrens | 7 | Bi-directional | 0 | 0.996 | 0.053 | Okay |
| Coastal Saline Flat Barrens | 3 | Bi-directional | 0.7 | 0.590 | 0.171 | Violated |
| Coastal Saline Wet Hoppner Sedge Meadow | 3 | Bi-directional | 0.8 | 0.494 | 0.207 | Violated |
| Coastal Saline Tidal River | 8 | Bi-directional | 0.8 | 0.531 | 0.192 | Violated |
| Change Driver | ||||||
| Channel migration-deposition | 5 | Mixed | 2.06 | 0.151 | 0.378 | Violated |
| Channel migration-erosion | 6 | Mixed | 0.05 | 0.949 | 0.057 | Violated |
| Sedimentation | 2 | Mixed | 2.2 | 0.135 | 0.401 | Okay |
| Lake Drainage | 5 | Mixed | 0.88 | 0.430 | 0.181 | Violated |
| Water-level change | 3 | Mixed | 0.23 | 0.794 | 0.082 | Violated |
| Permafrost aggradation | 3 | Mixed | 1.05 | 0.366 | 0.210 | Violated |
| Permafrost degradation | 7 | Mixed | 1.84 | 0.181 | 0.342 | Violated |
| Paludification | 4 | Mixed | 1.4 | 0.267 | 0.268 | Violated |
| Vegetation colonization | 8 | Mixed | 0.85 | 0.442 | 0.177 | Violated |
Figure A1.
Sampling points (white crosshairs) within 12 grids located near the centers of historical air photos used for analyzing landscape change along the central coast of the YKD. The inset shows the coastal ecological subsections of the YKD and the study area boundaries. The imagery time-series included the 2007–2008 IKONOS ortho-mosaic and the overlapping 1948–1955 panchromatic (B&W) and 1980 CIR air photos and the clipped 2013–2016 WorldView (WV) satellite images. The yellow line denotes the boundary of the 23 September 2005 storm flooding (from [20]).

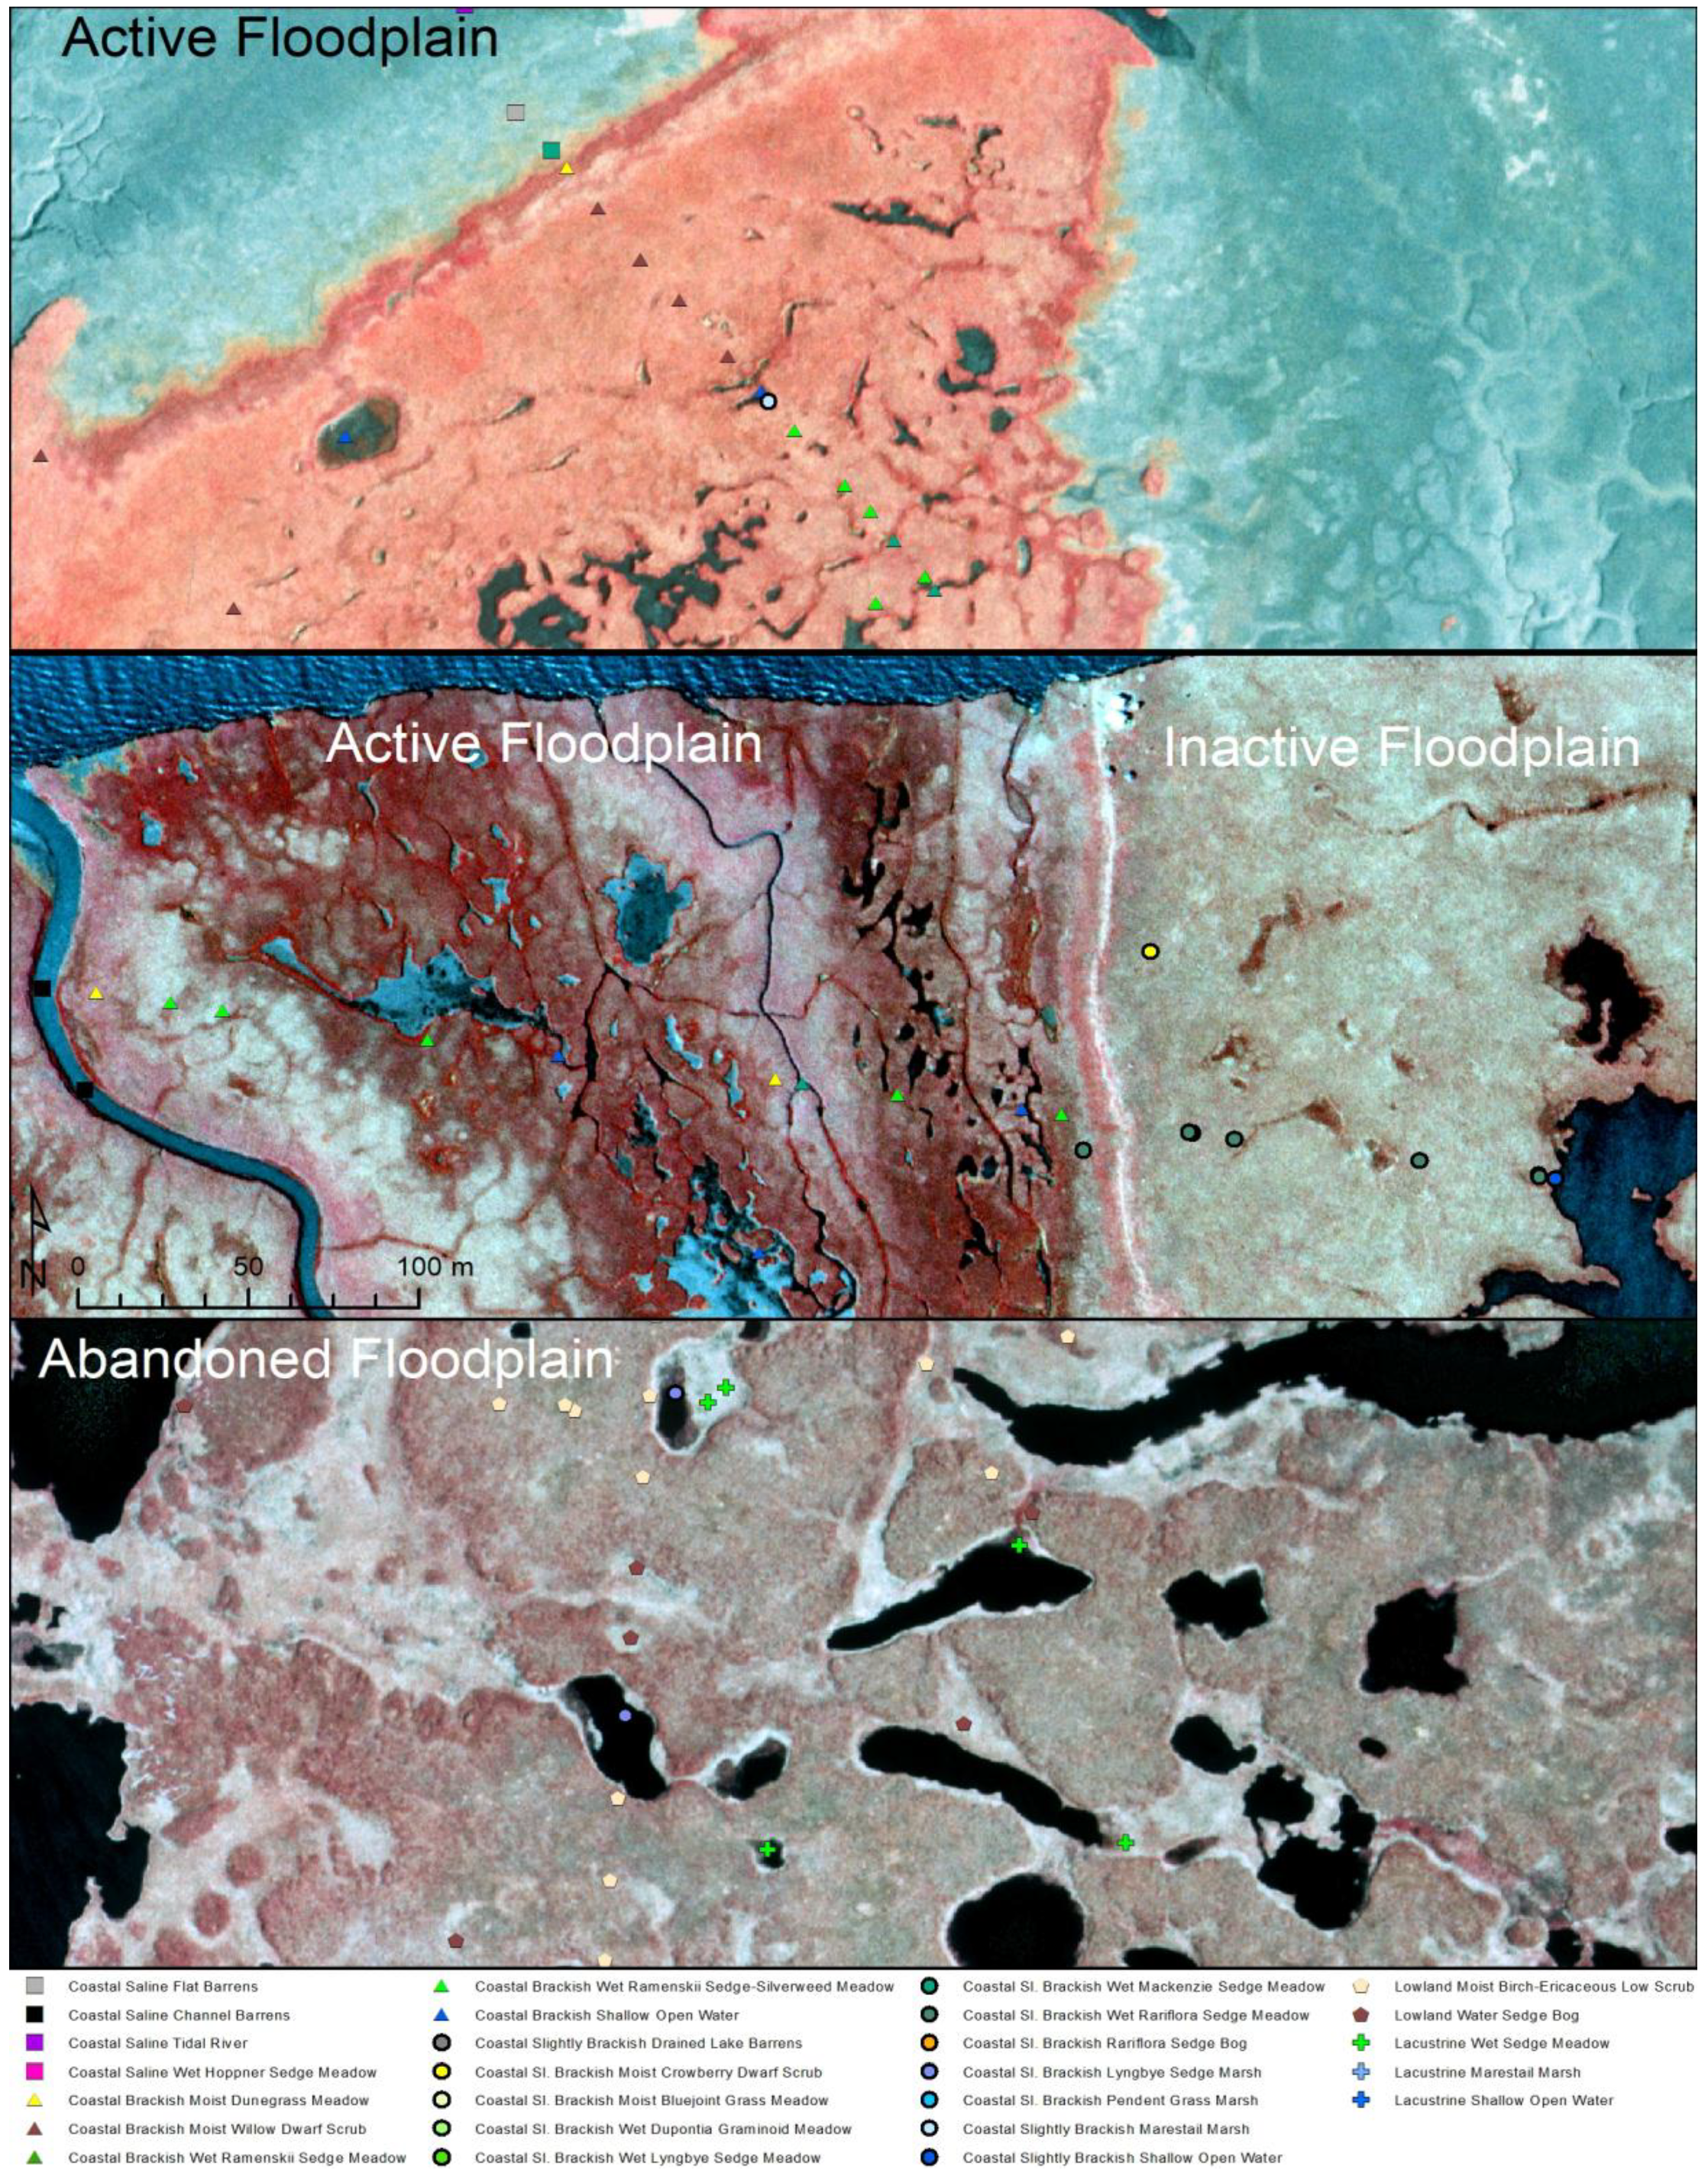
Figure A2.
Examples of ecotypes evident on aerial photography as determined at ground reference plots situated on active, inactive and abandoned floodplain deposits.
Figure A2.
Examples of ecotypes evident on aerial photography as determined at ground reference plots situated on active, inactive and abandoned floodplain deposits.

References
- Gill, R.E.J.; Handel, C.M. The importance of subarctic intertidal habitats to shorebirds: A study of the central Yukon-Kuskokwim Delta, Alaska. Condor 1990, 92, 709–725. [Google Scholar] [CrossRef]
- Jorgenson, M.T. Hierarchical organization of ecosystems at multiple spatial scales on the Yukon-Kuskokwim Delta, Alaska, U.S.A. Arct. Antarct. Alp. Res. 2000, 32, 221–239. [Google Scholar] [CrossRef]
- Jorgenson, T.; Ely, C. Topography and flooding of coastal ecosystems on the Yukon-Kuskokwim Delta, Alaska: Implications for sea-level rise. J. Coast. Res. 2001, 124–136. [Google Scholar]
- Bird, C.F. Coastal Geomorphology: An Introduction; John Wiley & Sons: West Sussex, UK, 2000; 322p, ISBN 978-0-471-89977-8. [Google Scholar]
- Day, J.W.; Hall, C.A.S.; Kemp, W.M.; Yáñez-Arancibia, A. Estuarine Ecology; John Wiley & Sons: Hoboken, NJ, USA, 1989; 558p, ISBN 978-0-471-06263-9. [Google Scholar]
- Vince, S.W.; Snow, A.A. Plant zonation in an Alaskan salt marsh: I. Distribution, abundance, and environmental factors. J. Ecol. 1984, 72, 651–667. [Google Scholar] [CrossRef]
- Riordan, B.; Verbyla, D.; McGuire, A.D. Shrinking ponds in subarctic Alaska based on 1950–2002 remotely sensed images. J. Geophys. Res. Biogeosci. 2006, 111. [Google Scholar] [CrossRef]
- Jorgenson, M.T.; Kanevskiy, M.; Shur, Y.; Osterkamp, T.; Fortier, D.; Cater, T.; Miller, P. Thermokarst lake and shore fen development in boreal Alaska. In Proceedings of the 10th International Conference on Permafrost, Salekhard, Russia, 25–29 June 2012; The Northern Publisher: Salekhard, Russia, 2012; pp. 179–184, ISBN 978-5-905911-01-9. [Google Scholar]
- Tape, K.; Sturm, M.; Racine, C. The evidence for shrub expansion in northern Alaska and the Pan-Arctic. Glob. Chang. Biol. 2006, 12, 686–702. [Google Scholar] [CrossRef]
- Frost, G.V.; Epstein, H.E. Tall shrub and tree expansion in Siberian tundra ecotones since the 1960s. Glob. Chang. Biol. 2014, 20, 1264–1277. [Google Scholar] [CrossRef] [PubMed]
- Jorgenson, M.T.; Racine, C.H.; Walters, J.C.; Osterkamp, T.E. Permafrost degradation and ecological changes associated with a warming climate in central Alaska. Clim. Chang. 2001, 48, 551–579. [Google Scholar] [CrossRef]
- Swanson, D.K. Three Decades of Landscape Change in Alaska’s Arctic National Parks: Analysis of Aerial Photographs c. 1980–2010; Natural Resource Technical Report NPS/ARCN/NRTR—2013/668; U.S. Department of the Interior, National Park Service: Fort Collins, CO, USA, 2013; 42p. Available online: https://www.sciencebase.gov/catalog/item/5771b8e2e4b07657d1a6d812 (accessed on 14 July 2018).
- Jorgenson, M.T.; Frost, G.V.; Miller, A.; Spencer, P.; Shephard, M.; Mangipane, B.; Moore, C.; Lindsay, C. Monitoring Coastal Salt Marshes in the Lake Clark and Katmai National Parklands of the Southwest Alaska Network; Natural Resource Technical Report NPS/SWAN/NRTR—2010/338; Department of the Interior, National Park Service: Fort Collins, CO, USA, 2010; 49p. Available online: https://irma.nps.gov/DataStore/DownloadFile/418627 (accessed on 14 July 2018).
- Thie, J. Distribution and thawing of permafrost in the southern part of the discontinuous permafrost zone in Manitoba. Arctic 1974, 27, 189–200. [Google Scholar] [CrossRef]
- Jorgenson, M.T.; Shur, Y.L.; Pullman, E.R. Abrupt increase in permafrost degradation in Arctic Alaska. Geophys. Res. Lett. 2006, 33. [Google Scholar] [CrossRef] [Green Version]
- Jorgenson, M.T.; Kanevskiy, M.; Shur, Y.; Moskalenko, N.; Brown, D.R.N.; Wickland, K.; Striegl, R.; Koch, J. Role of ground ice dynamics and ecological feedbacks in recent ice wedge degradation and stabilization. J. Geophys. Res. Earth Surf. 2015, 120. [Google Scholar] [CrossRef]
- Jorgenson, M.T.; Roth, J.E. Landscape Classification and Mapping for the Yukon-Kuskokwim Delta, Alaska; ABR, Inc.—Environmental Research & Services: Fairbanks, AK, USA, 2010; p. 24. [Google Scholar]
- Whitley, M.A.; Frost, G.V.; Jorgenson, M.T.; Macander, M.J.; Maio, C.V.; Winder, S.G. Assessment of LiDAR and spectral techniques for high-resolution mapping of sporadic permafrost on the Yukon-Kuskokwim Delta, Alaska. Remote Sens. 2018, 10, 258. [Google Scholar] [CrossRef]
- Walker, H.J. Lake tapping in the Colville River Delta. In Proceedings of the 3rd International Conference on Permafrost, Edmonton, AB, Canada, 10–13 July 1978; National Research Council of Canada: Edmonton, Alberta, 1978; Volume 1, pp. 233–238, ISBN 0-660-1735-0. [Google Scholar]
- Terenzi, J.; Jorgenson, M.T.; Ely, C.R. Storm-surge flooding on the Yukon-Kuskokwim Delta, Alaska. Arctic 2014, 67, 360–374. [Google Scholar] [CrossRef]
- Dau, C.P.; King, J.G.; Lensink, C.J. Effects of Storm Surge Erosion on Waterfowl Habitats at the Kashunuk River, Yukon-Kuskokwim Delta, Alaska; U.S. Fish and Wildlife Service: Anchorage, AK, USA, 2011; p. 32.
- Jorgenson, M.T.; Aldrich, J.W.; Pullman, E.R.; Ray, S.; Smith, M.D.; Shur, Y.L. Geomorphology and Hydrology of the Colville River Delta, Alaska, 1995; ABR, Inc.—Environmental Research & Services: Fairbanks, AK, USA, 1996. [Google Scholar]
- Nelson, C.H. Modern shallow-water graded sand layers from storm surges, Bering Shelf: A mimic of Bouma sequences and turbidite systems. J. Sediment. Res. 1982, 52, 537–545. [Google Scholar] [CrossRef]
- Johnson, W.R.; Kowalik, Z. Modeling of storm surges in the Bering Sea and Norton Sound. J. Geophys. Res. 1986, 91, 5119–5128. [Google Scholar] [CrossRef]
- Mason, O.K.; Salmon, D.K.; Ludwig, S.L. The periodicity of storm surges in the Bering Sea from 1898 to 1993, based on newspaper accounts. Clim. Chang. 1996, 34, 109–123. [Google Scholar] [CrossRef]
- Mesquita, M.S.; Atkinson, D.E.; Hodges, K.I. Characteristics and variability of storm tracks in the north Pacific, Bering Sea, and Alaska. J. Clim. 2010, 23, 294–311. [Google Scholar] [CrossRef]
- Sallenger, A.H. Measurements of Debris-Line Elevation and Beach Profiles Following a Major Storm: Northern Bering Sea Coast of Alaska; Open-File Report 83-394; U.S. Geological Survey: Denver, CO, USA, 1983; 10p.
- Macander, M.J.; Swingley, C.S.; Spencer, S.R. Extensive Mapping of Bering Sea and Gulf of Alaska Coastal Change by Landsat Time-Series Analysis, 1972–2013; Final Report; ABR, Inc.—Enviromental Research & Services: Fairbanks, AK, USA; U.S. Fish and Wildlife Service: Anchorage, AK, USA, 2014; p. 69.
- Lantuit, H.; Overduin, P.P.; Couture, N.J.; Wetterich, S.; Aré, F.; Atkinson, D.; Brown, J.; Cherkashov, G.; Drozdov, D.; Forbes, D.L. The arctic coastal dynamics database: A new classification scheme and statistics on arctic permafrost coastlines. Estuaries Coasts 2012, 35, 383–400. [Google Scholar] [CrossRef]
- Luijendijk, A.; Hagenaars, G.; Ranasinghe, R.; Baart, F.; Donchyts, G.; Aarninkhof, S. The state of the world’s beaches. Sci. Rep. 2018, 8, 6641. [Google Scholar] [CrossRef] [PubMed]
- Jafarov, E.E.; Marchenko, S.S.; Romanovsky, V.E. Numerical modeling of permafrost dynamics in Alaska using a high spatial resolution dataset. Cryosphere 2012, 6, 613–624. [Google Scholar] [CrossRef] [Green Version]
- Pastick, N.J.; Jorgenson, M.T.; Wylie, B.K.; Nield, S.J.; Johnson, K.D.; Finley, A.O. Distribution of near-surface permafrost in Alaska: Estimates of present and future conditions. Remote Sens. Environ. 2015, 168, 301–315. [Google Scholar] [CrossRef] [Green Version]
- Jorgenson, M.T.; Romanovsky, V.; Harden, J.; Shur, Y.; O’Donnell, J.; Schuur, E.A.G.; Kanevskiy, M.; Marchenko, S. Resilience and vulnerability of permafrost to climate change. Can. J. For. Res. 2010, 40, 1219–1236. [Google Scholar] [CrossRef]
- Jones, B.M.; Stoker, J.M.; Gibbs, A.E.; Grosse, G.; Romanovsky, V.E.; Douglas, T.A.; Kinsman, N.E.M.; Richmond, B.M. Quantifying landscape change in an arctic coastal lowland using repeat airborne LiDAR. Environ. Res. Lett. 2013, 8. [Google Scholar] [CrossRef]
- Jones, B.M.; Grosse, G.; Arp, C.D.; Miller, E.; Liu, L.; Hayes, D.J.; Larsen, C.F. Recent Arctic tundra fire initiates widespread thermokarst development. Sci. Rep. 2015, 5. [Google Scholar] [CrossRef] [PubMed] [Green Version]
- Trofaier, A.M.; Westermann, S.; Bartsch, A. Progress in space-borne studies of permafrost for climate science: Towards a multi-ecv approach. Remote Sens. Environ. 2017, 203, 55–70. [Google Scholar] [CrossRef]
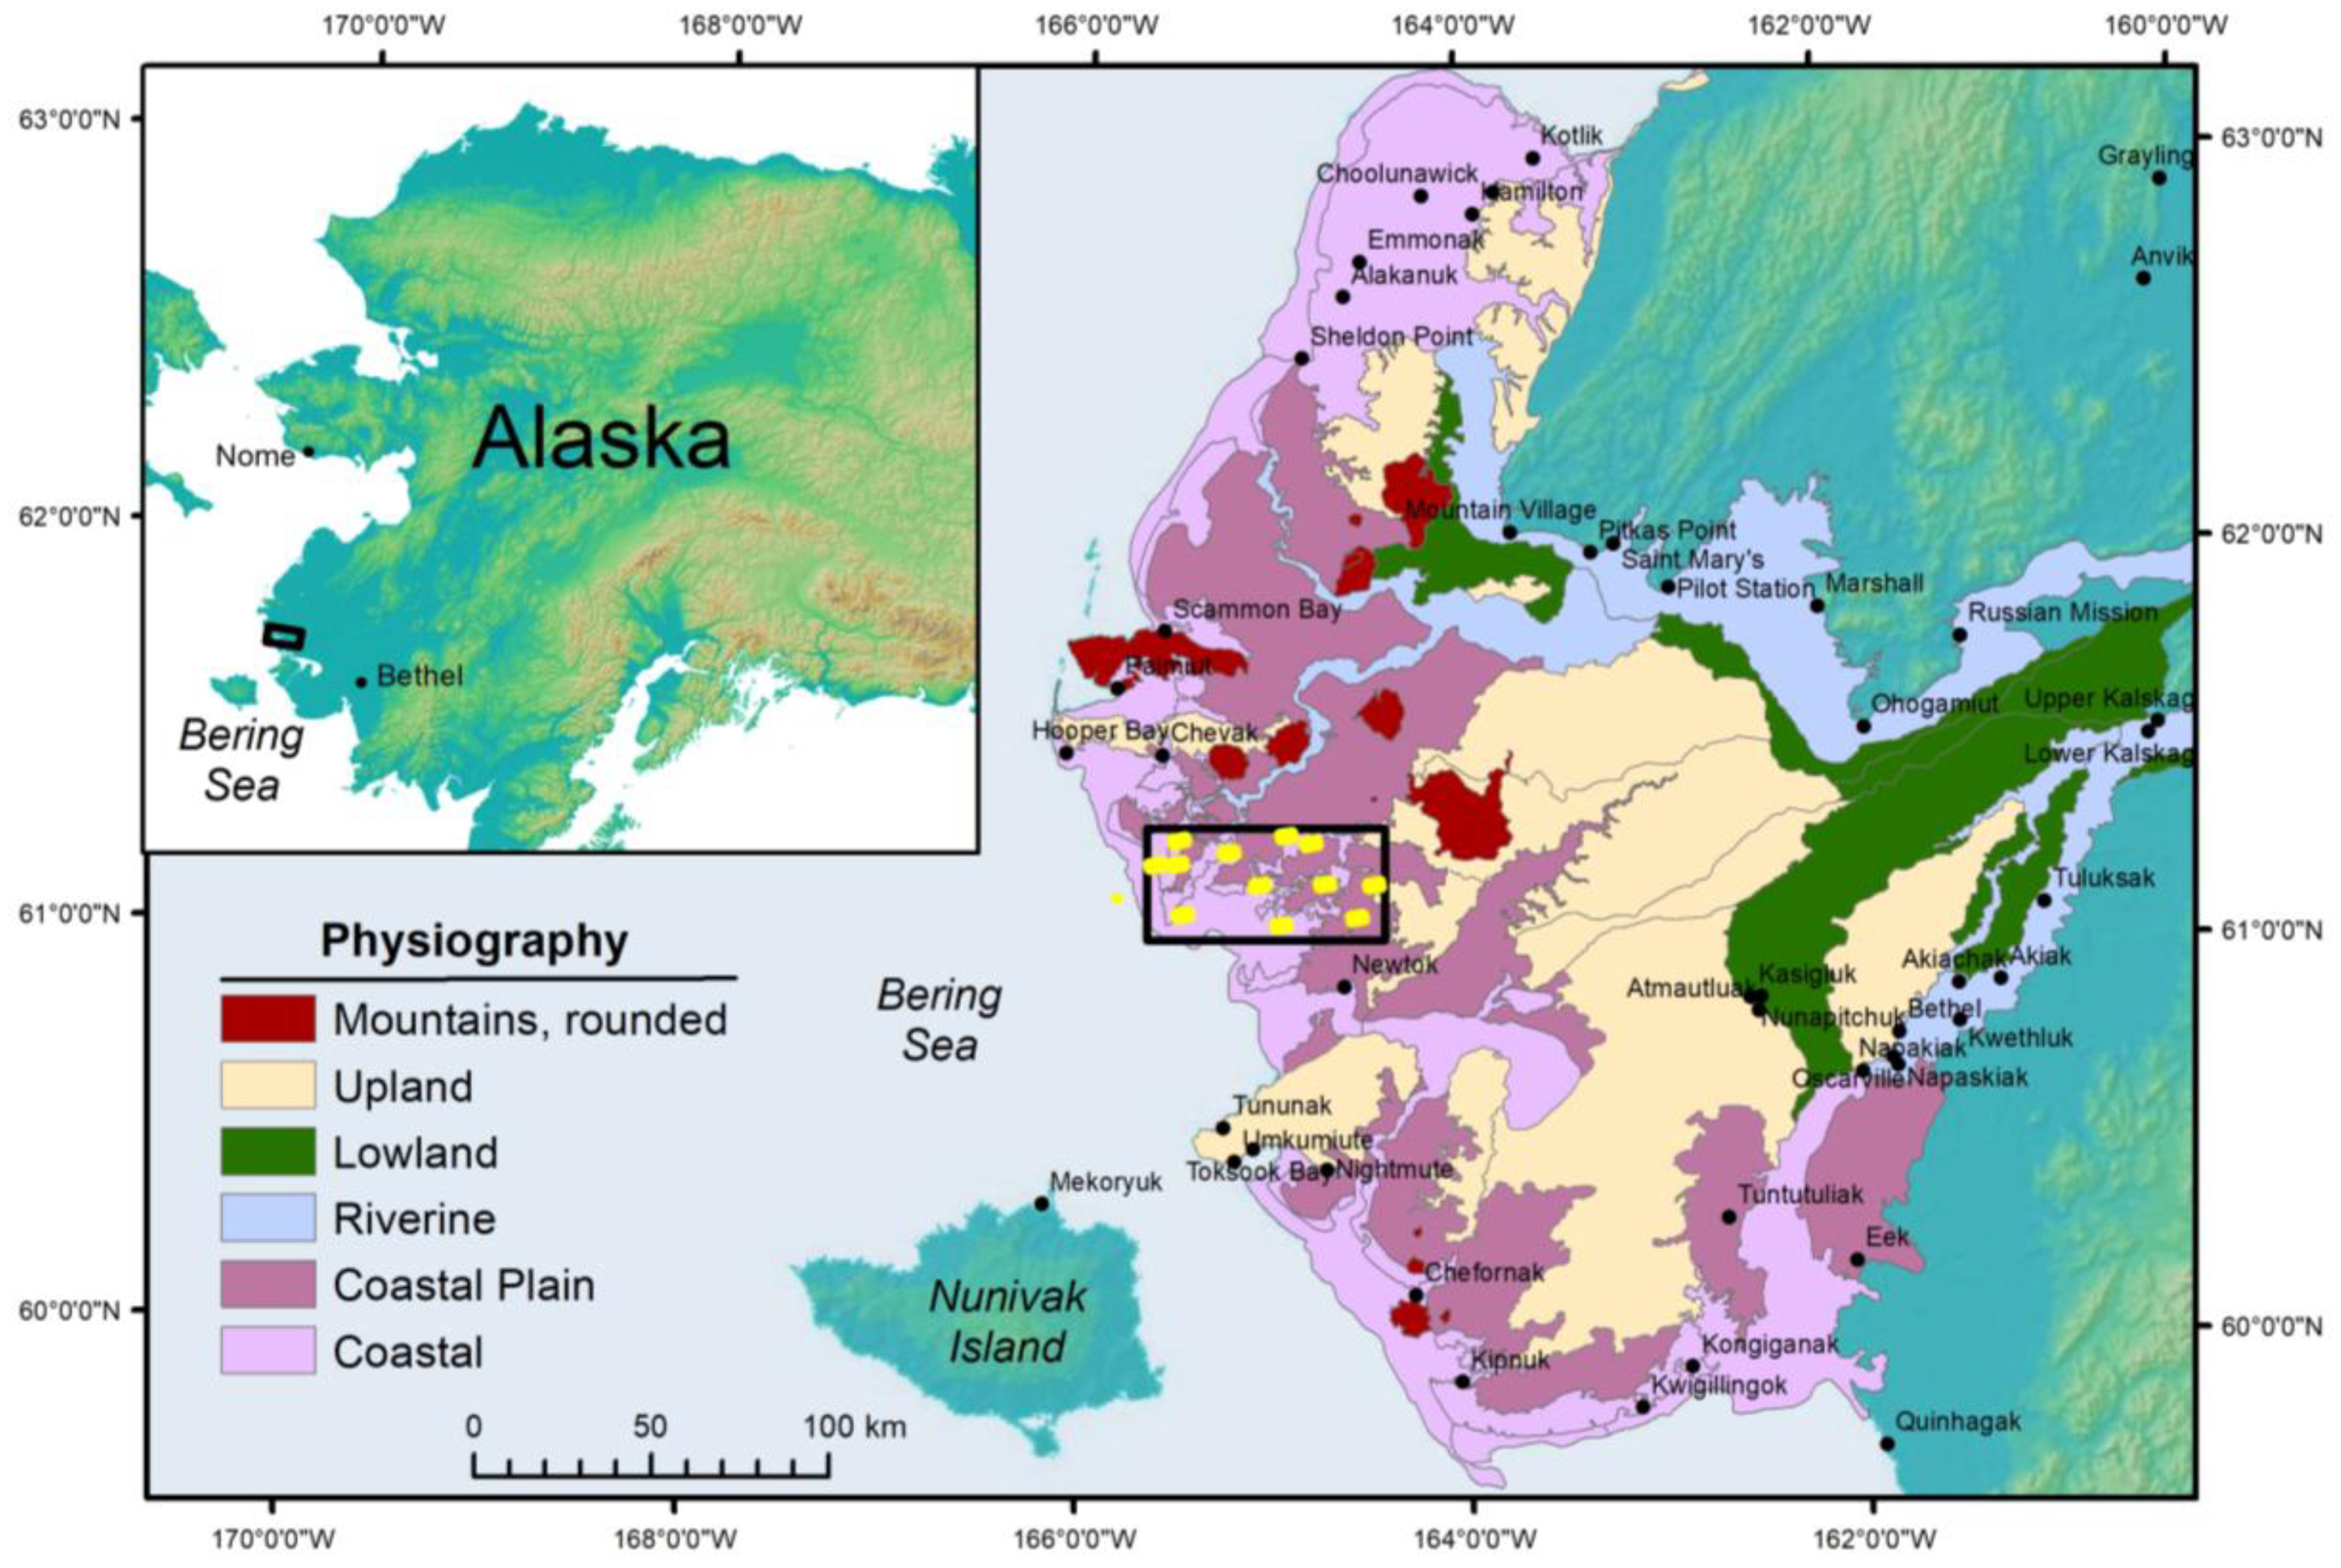
Figure 1.
Location of the study area along the central coast of the Yukon-Kuskokwim Delta. The physiography of the ecological landscapes of the YKD ecoregion are shown. The sampling grids within the study area are shown in yellow.
Figure 1.
Location of the study area along the central coast of the Yukon-Kuskokwim Delta. The physiography of the ecological landscapes of the YKD ecoregion are shown. The sampling grids within the study area are shown in yellow.

Figure 2.
Changes in areal extent of ecotypes on the central coast of the Yukon-Kuskokwim Delta, evident in high-resolution imagery from ~1953, 1980, ~2007 and ~2015. Note difference in scales between left and right charts. Significant (p < 0.05) changes noted with *.
Figure 2.
Changes in areal extent of ecotypes on the central coast of the Yukon-Kuskokwim Delta, evident in high-resolution imagery from ~1953, 1980, ~2007 and ~2015. Note difference in scales between left and right charts. Significant (p < 0.05) changes noted with *.

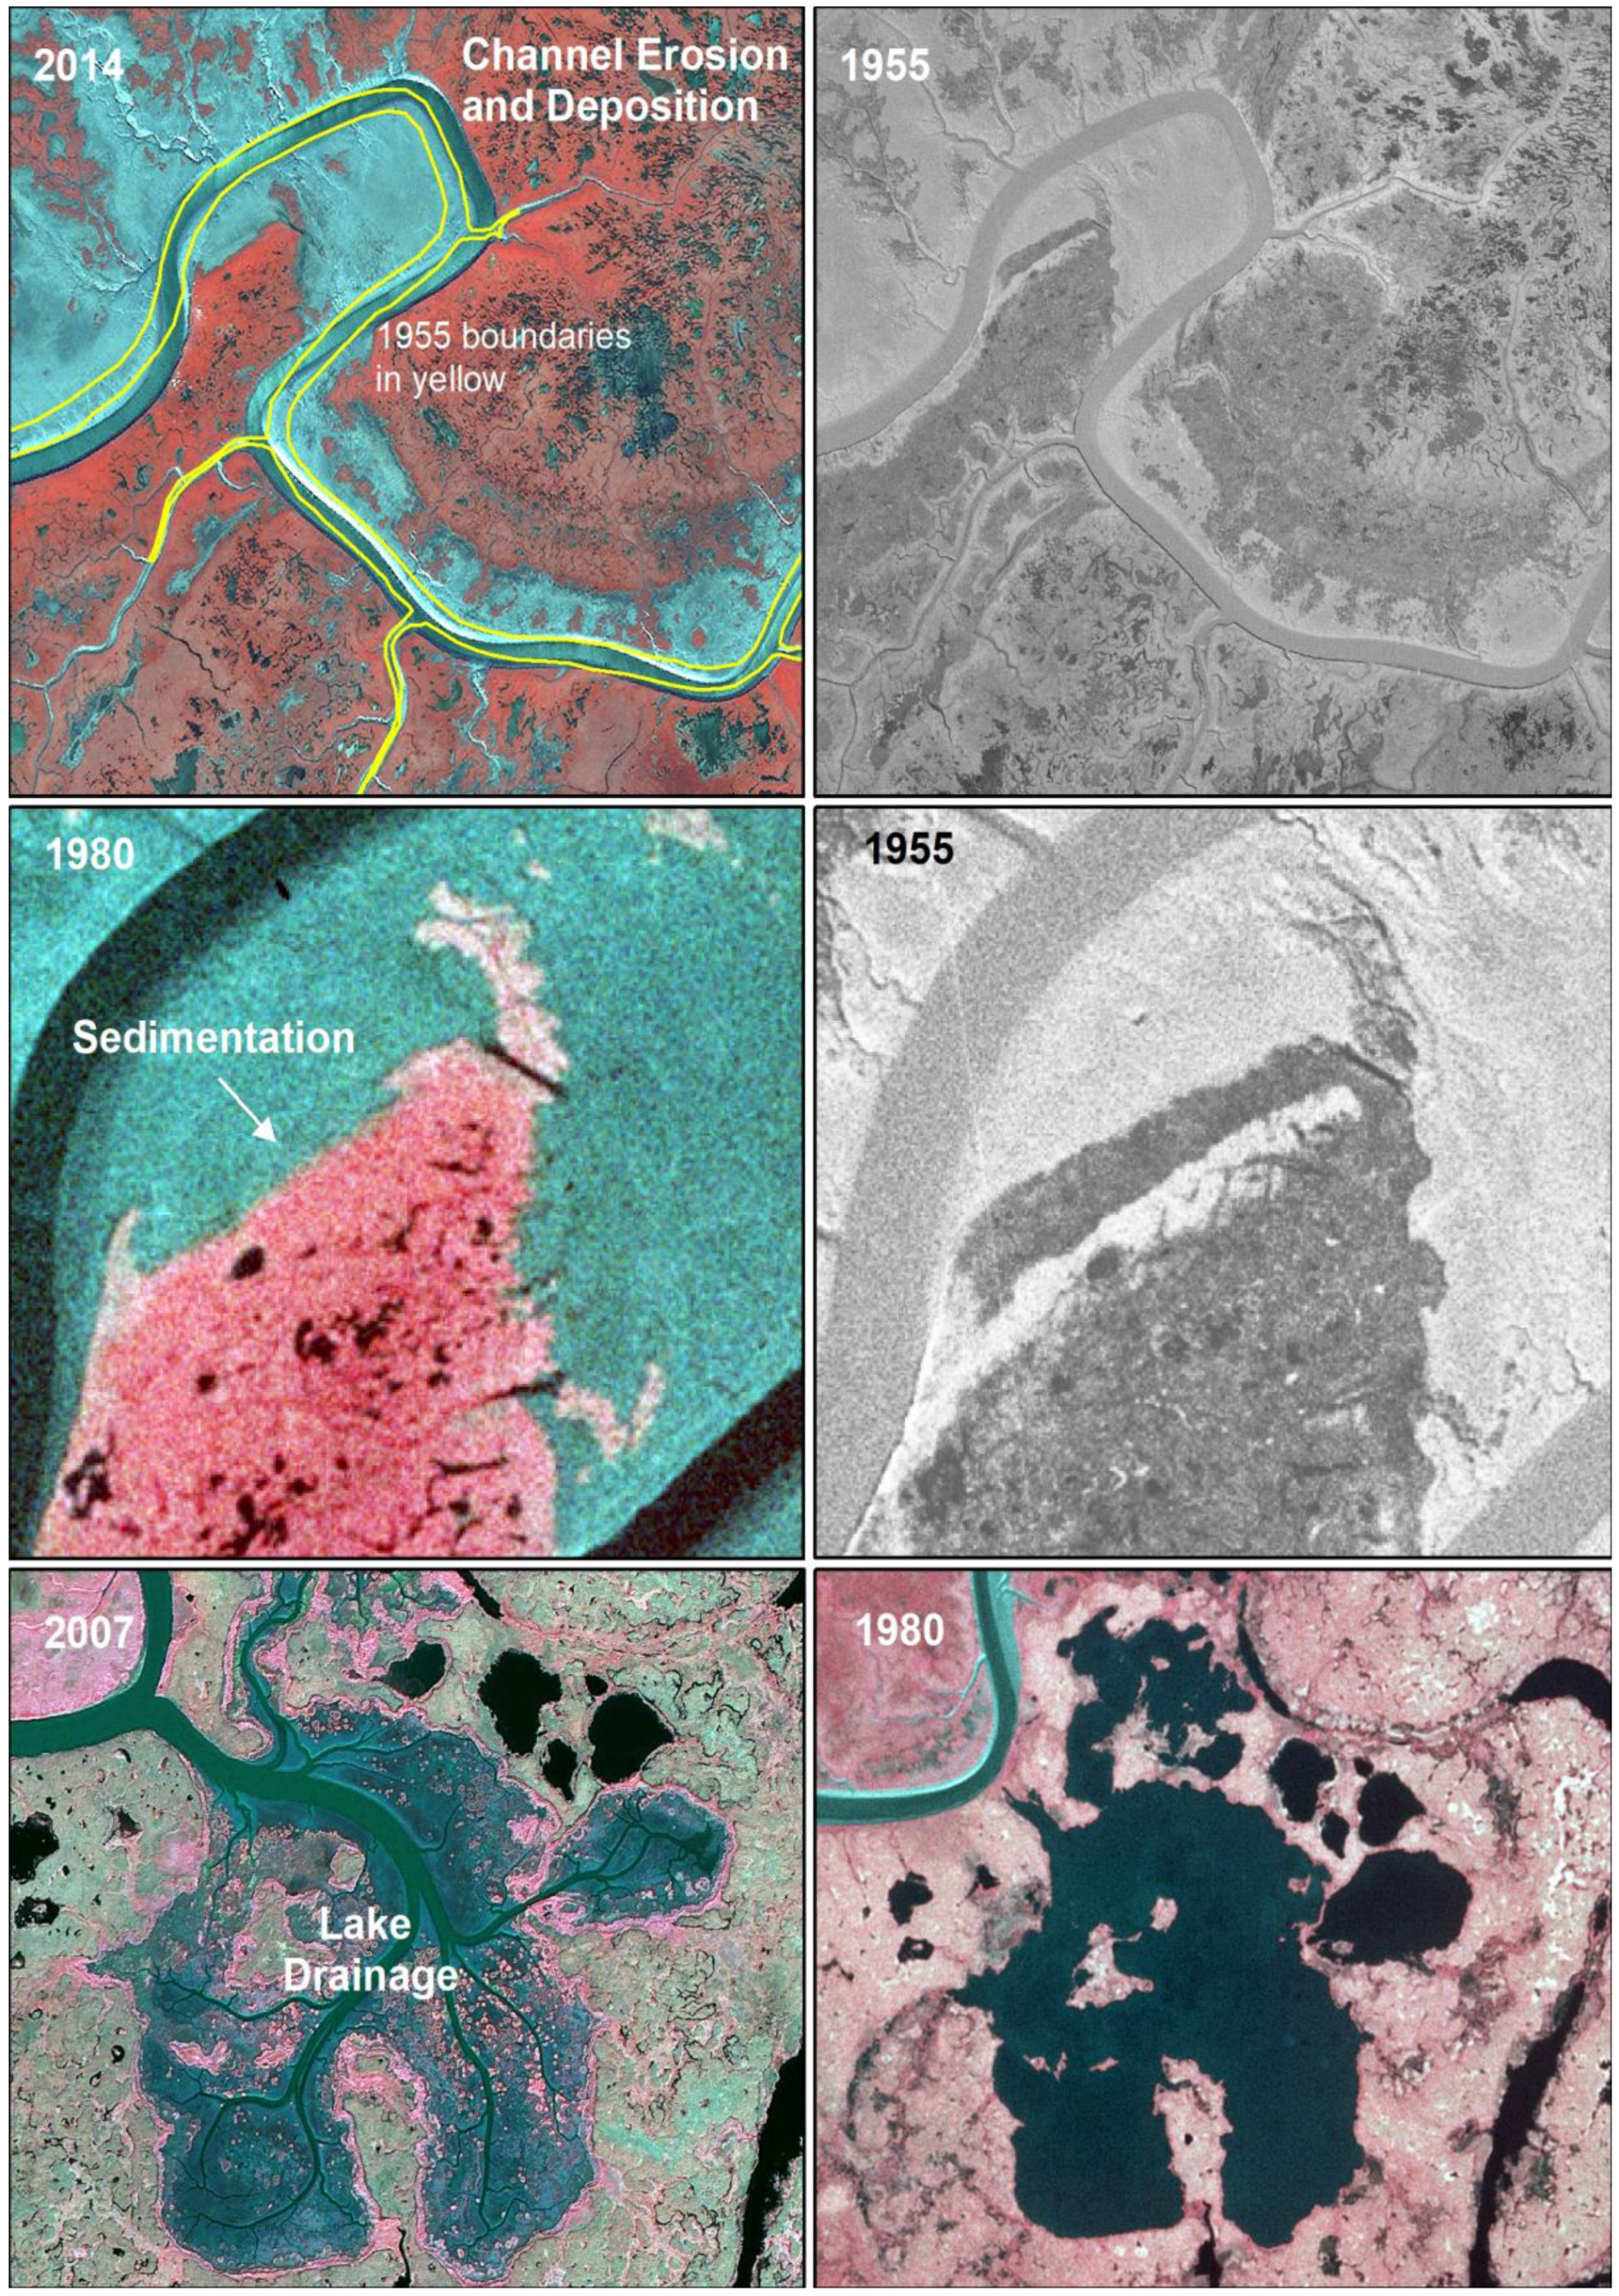
Figure 3.
Examples of landscape changes due to channel erosion and deposition, burial of vegetation by sedimentation and lake drainage evident on imagery from 1955, 1980, 2007 and 2014 along the central coast of the Yukon-Kuskokwim Delta. 2014 imagery © Digital Globe, NextView License.
Figure 3.
Examples of landscape changes due to channel erosion and deposition, burial of vegetation by sedimentation and lake drainage evident on imagery from 1955, 1980, 2007 and 2014 along the central coast of the Yukon-Kuskokwim Delta. 2014 imagery © Digital Globe, NextView License.

Figure 4.
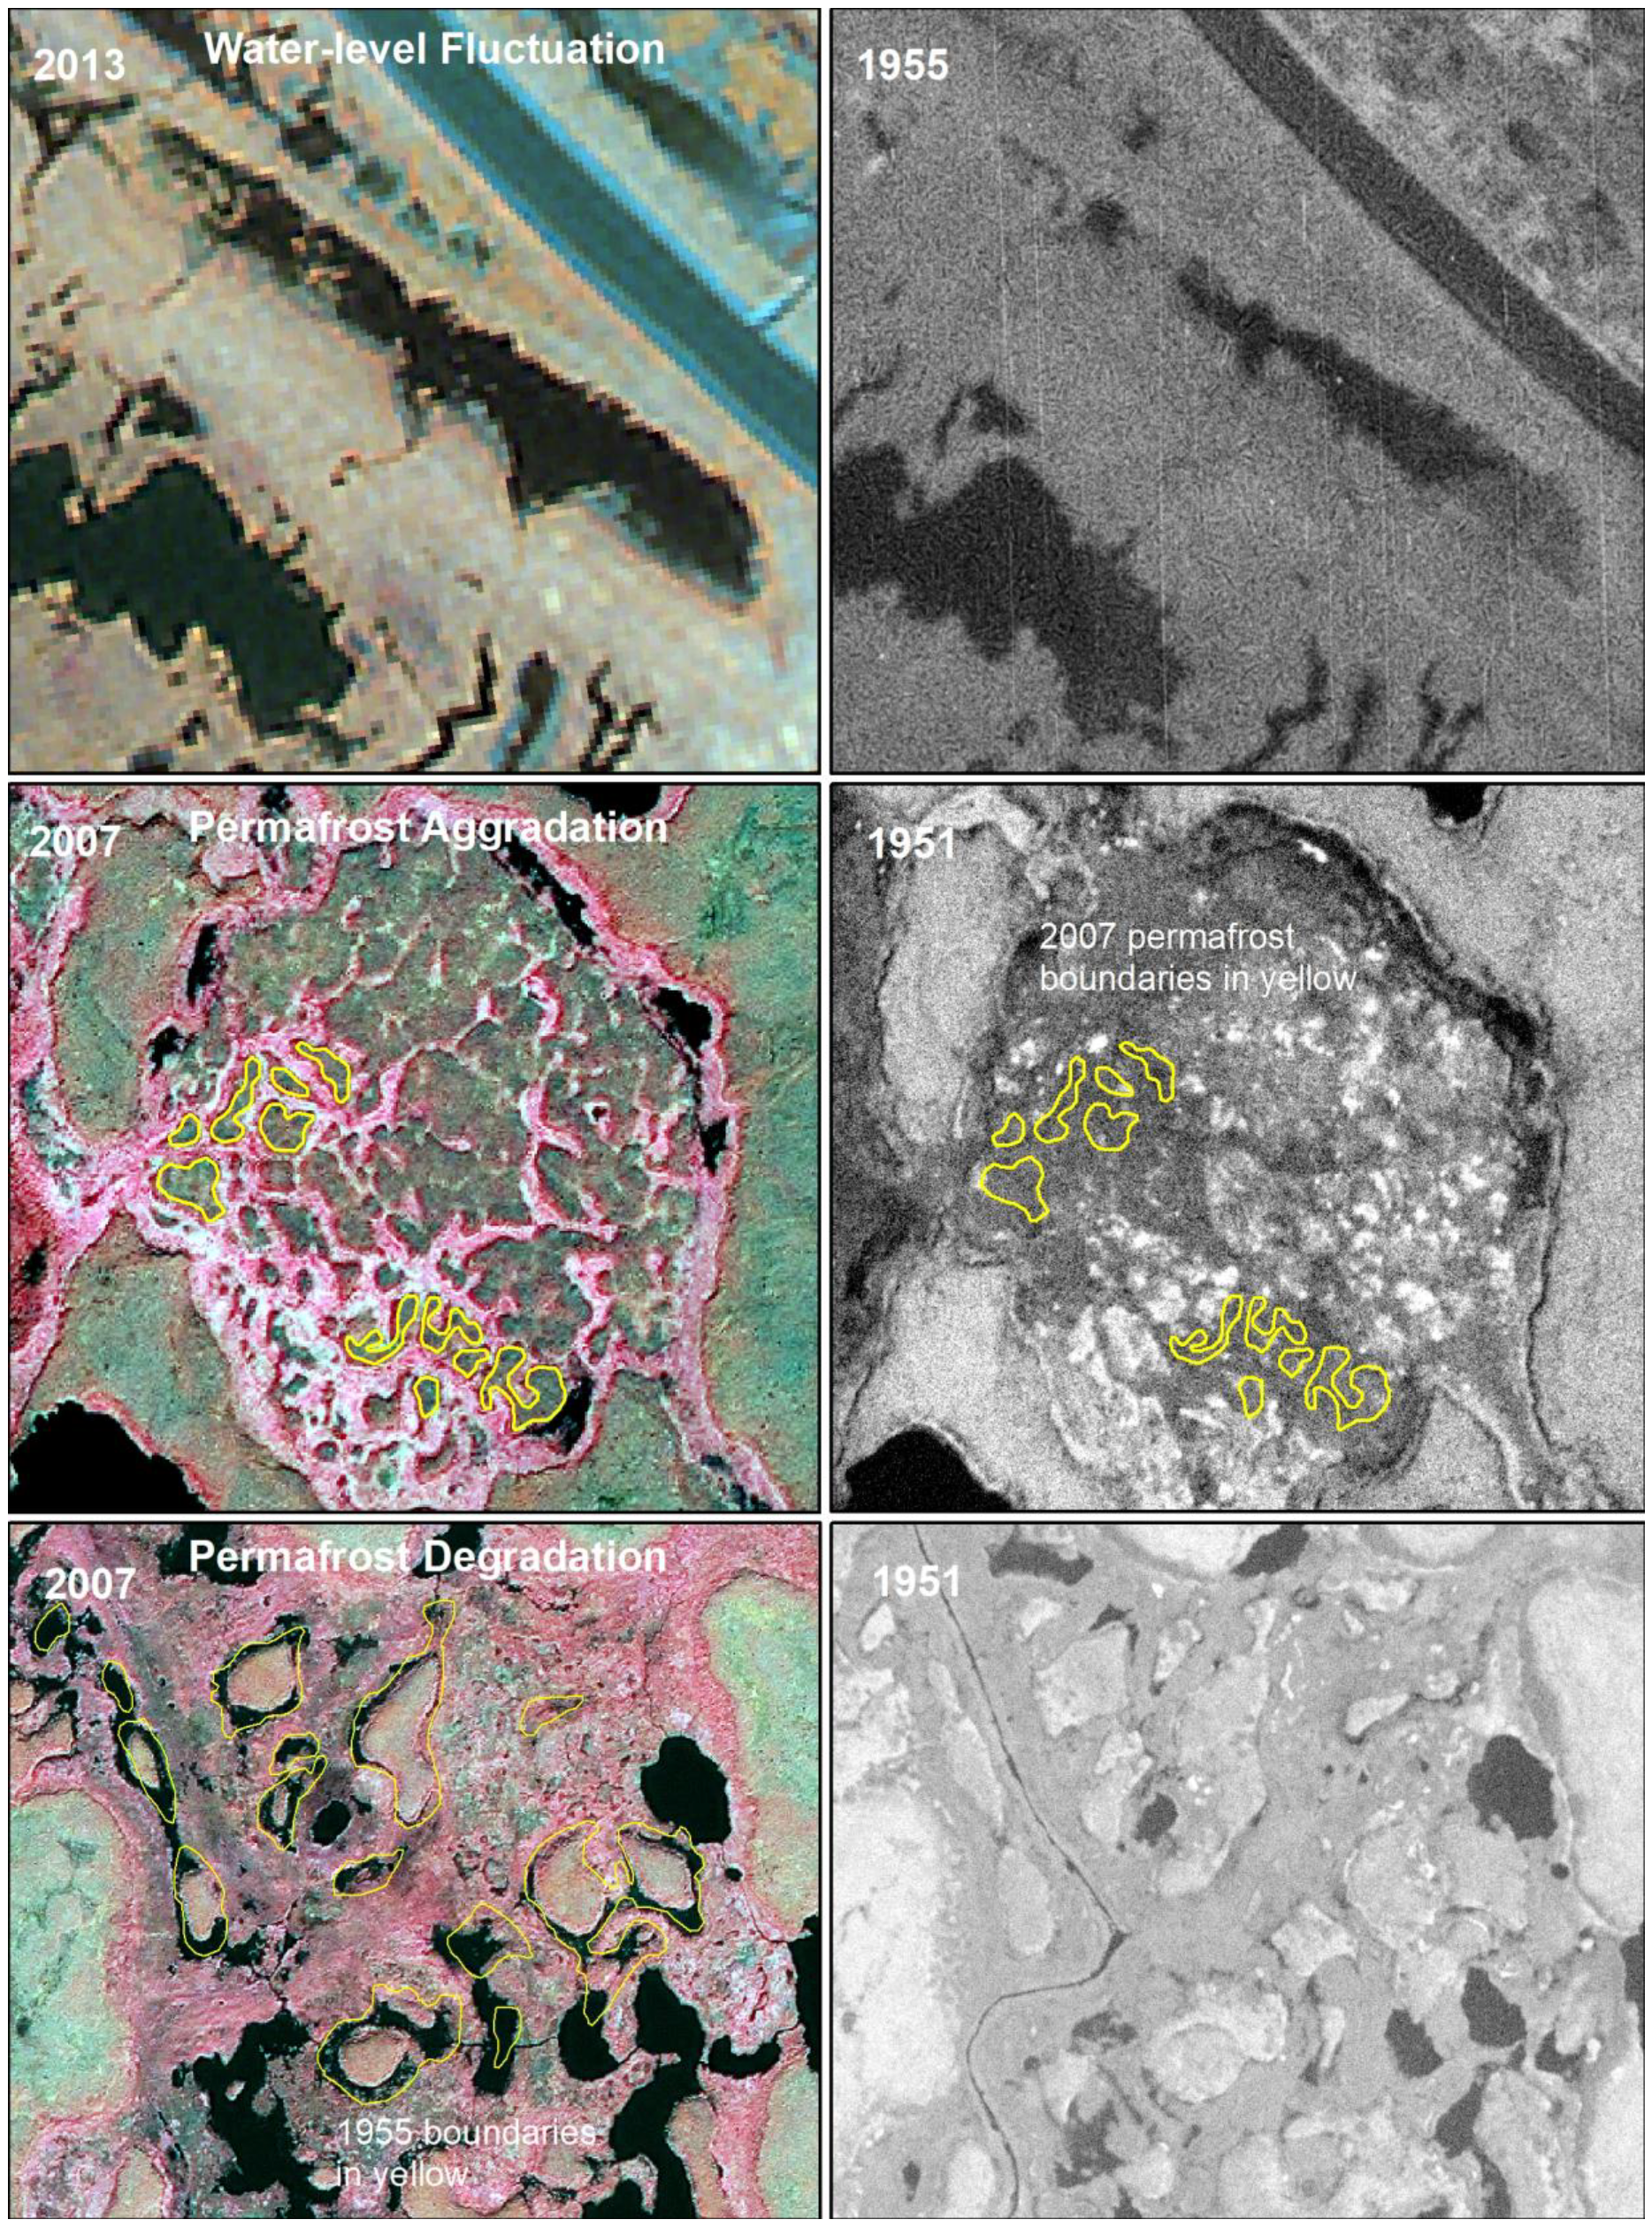
Examples of landscape changes due to water-level fluctuation (or lack of), permafrost aggradation and permafrost degradation evident on imagery from 1951–1955, 1980, 2007 and 2013 along the central coast of the Yukon-Kuskokwim Delta. 2013 imagery © Digital Globe, NextView License.
Figure 4.
Examples of landscape changes due to water-level fluctuation (or lack of), permafrost aggradation and permafrost degradation evident on imagery from 1951–1955, 1980, 2007 and 2013 along the central coast of the Yukon-Kuskokwim Delta. 2013 imagery © Digital Globe, NextView License.

Figure 5.
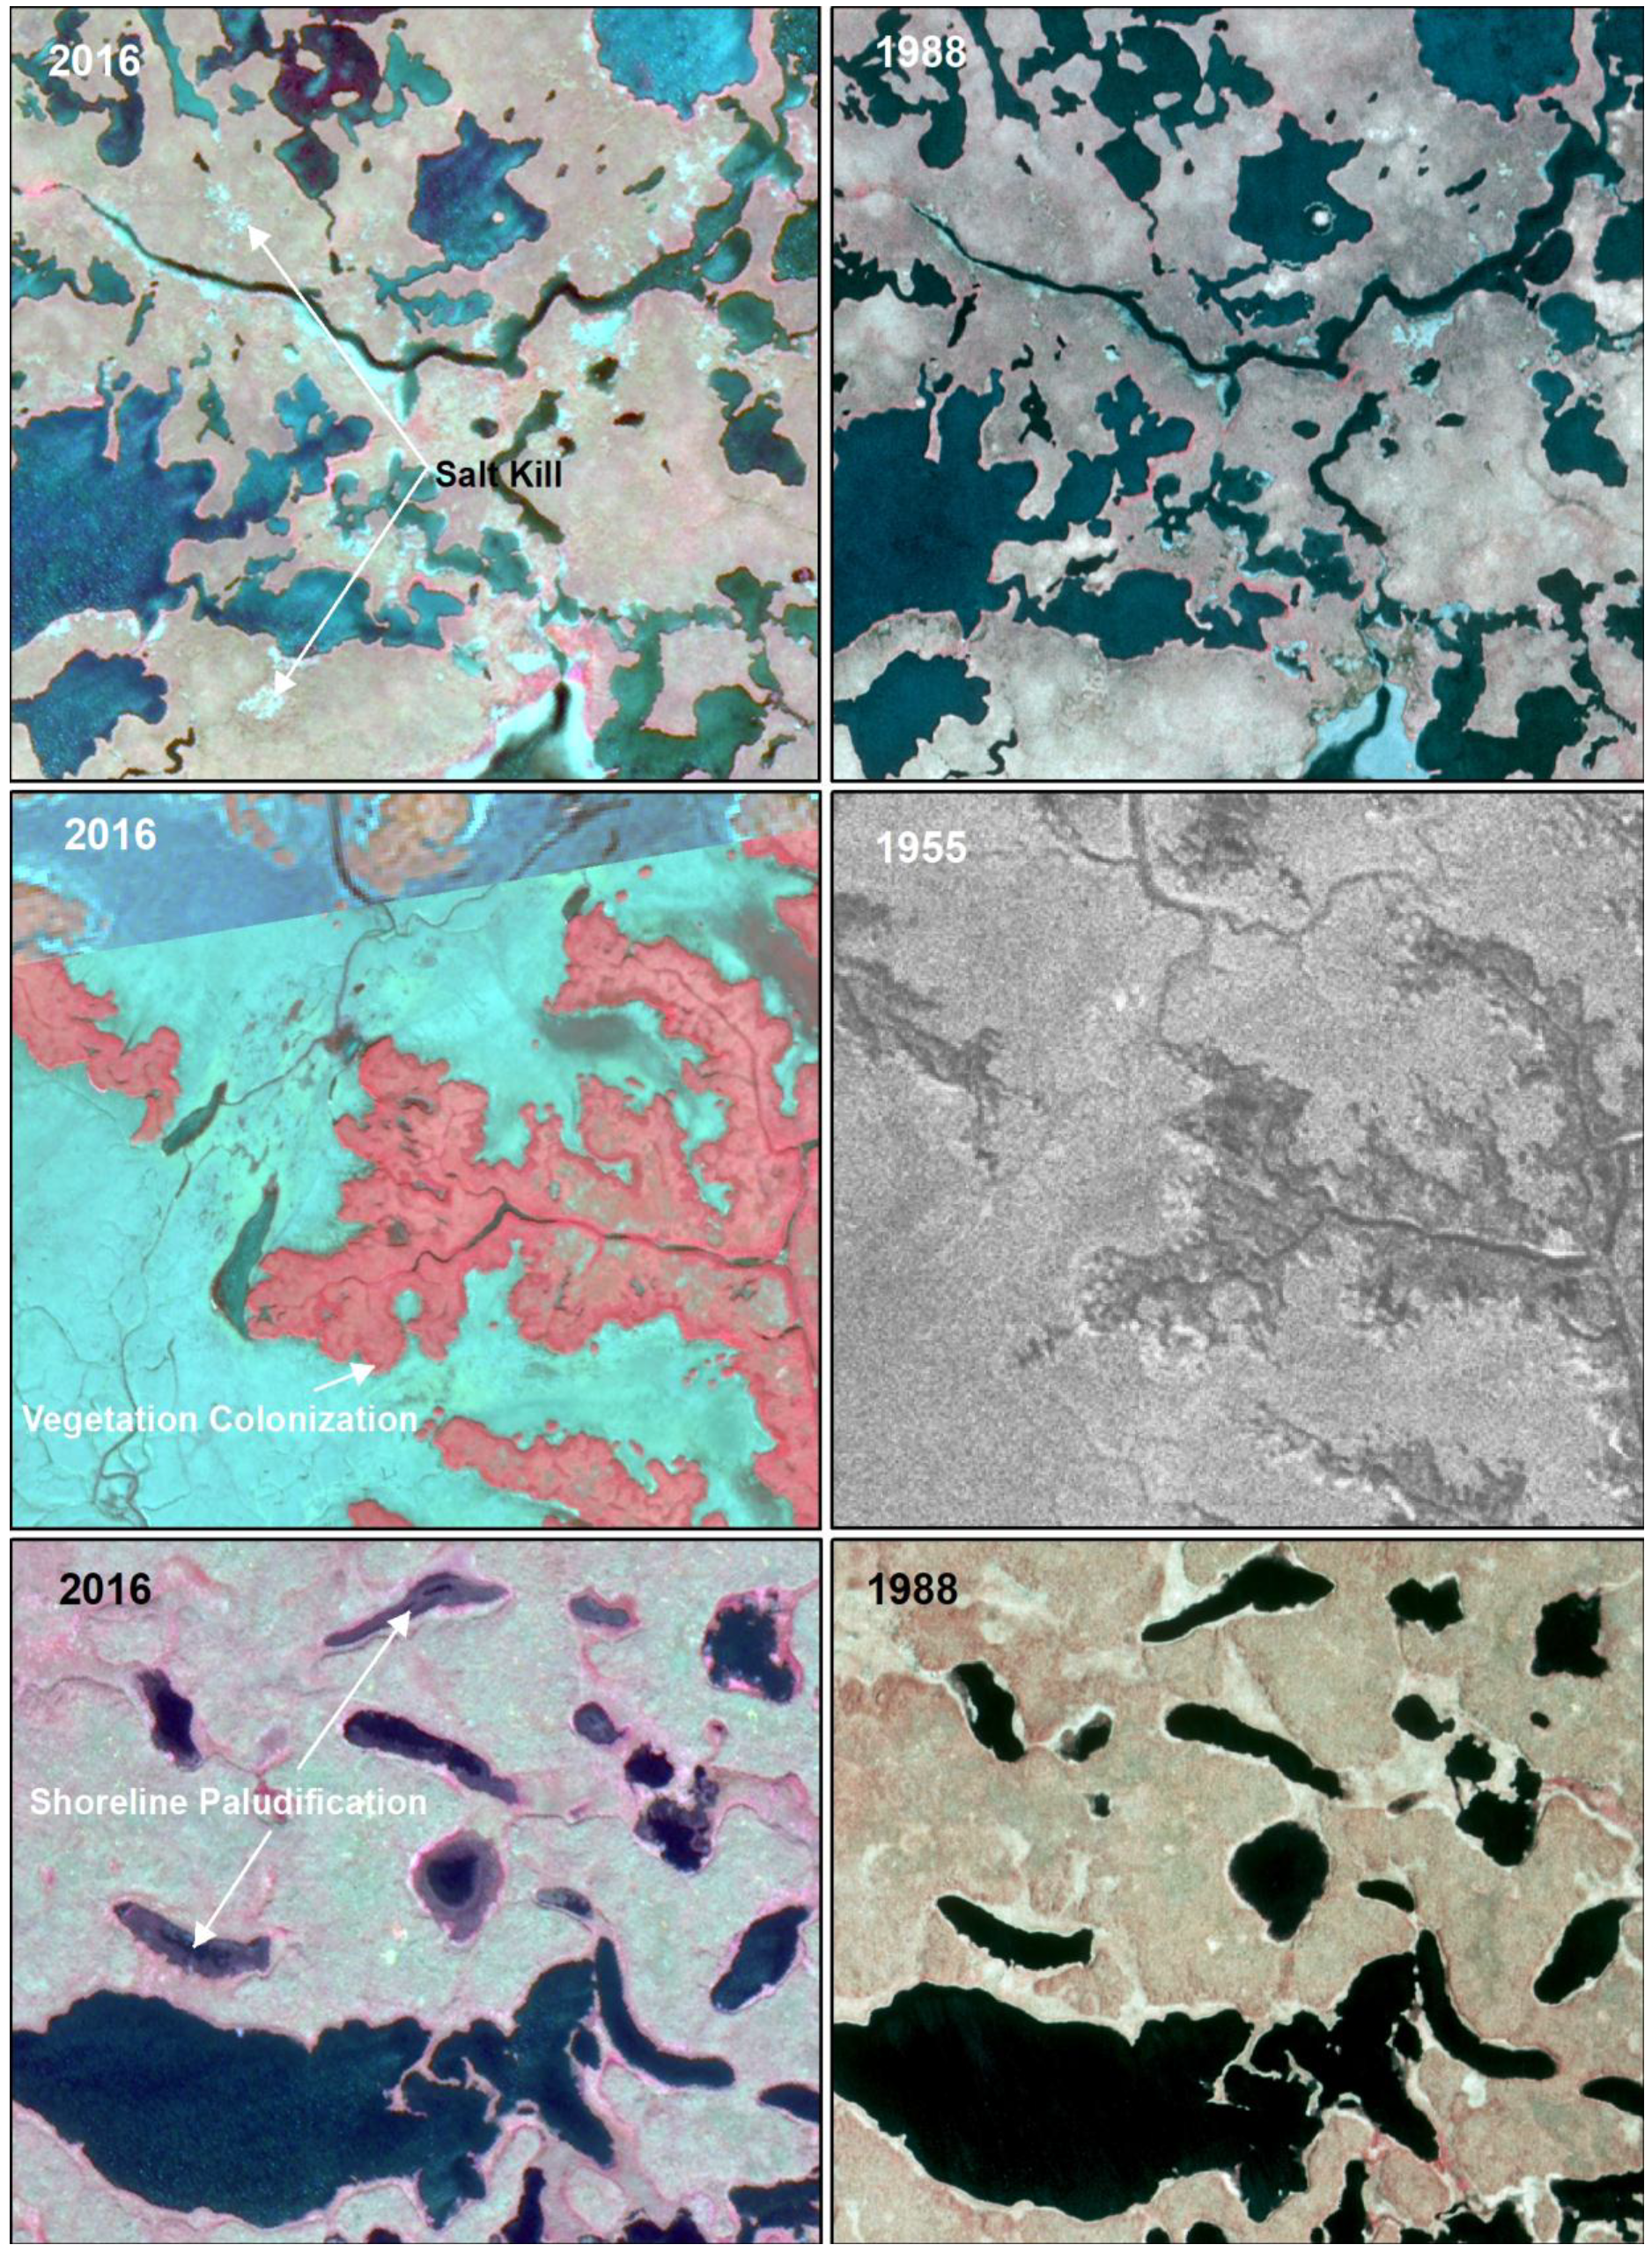
Examples of landscape change due to salt-kill from storm surges, vegetation colonization of tidal flats and shoreline paludification evident on imagery from 1955, 1988 and 2016 along the central coast of the Yukon-Kuskokwim Delta. 2016 imagery © Digital Globe, NextView License.
Figure 5.
Examples of landscape change due to salt-kill from storm surges, vegetation colonization of tidal flats and shoreline paludification evident on imagery from 1955, 1988 and 2016 along the central coast of the Yukon-Kuskokwim Delta. 2016 imagery © Digital Globe, NextView License.

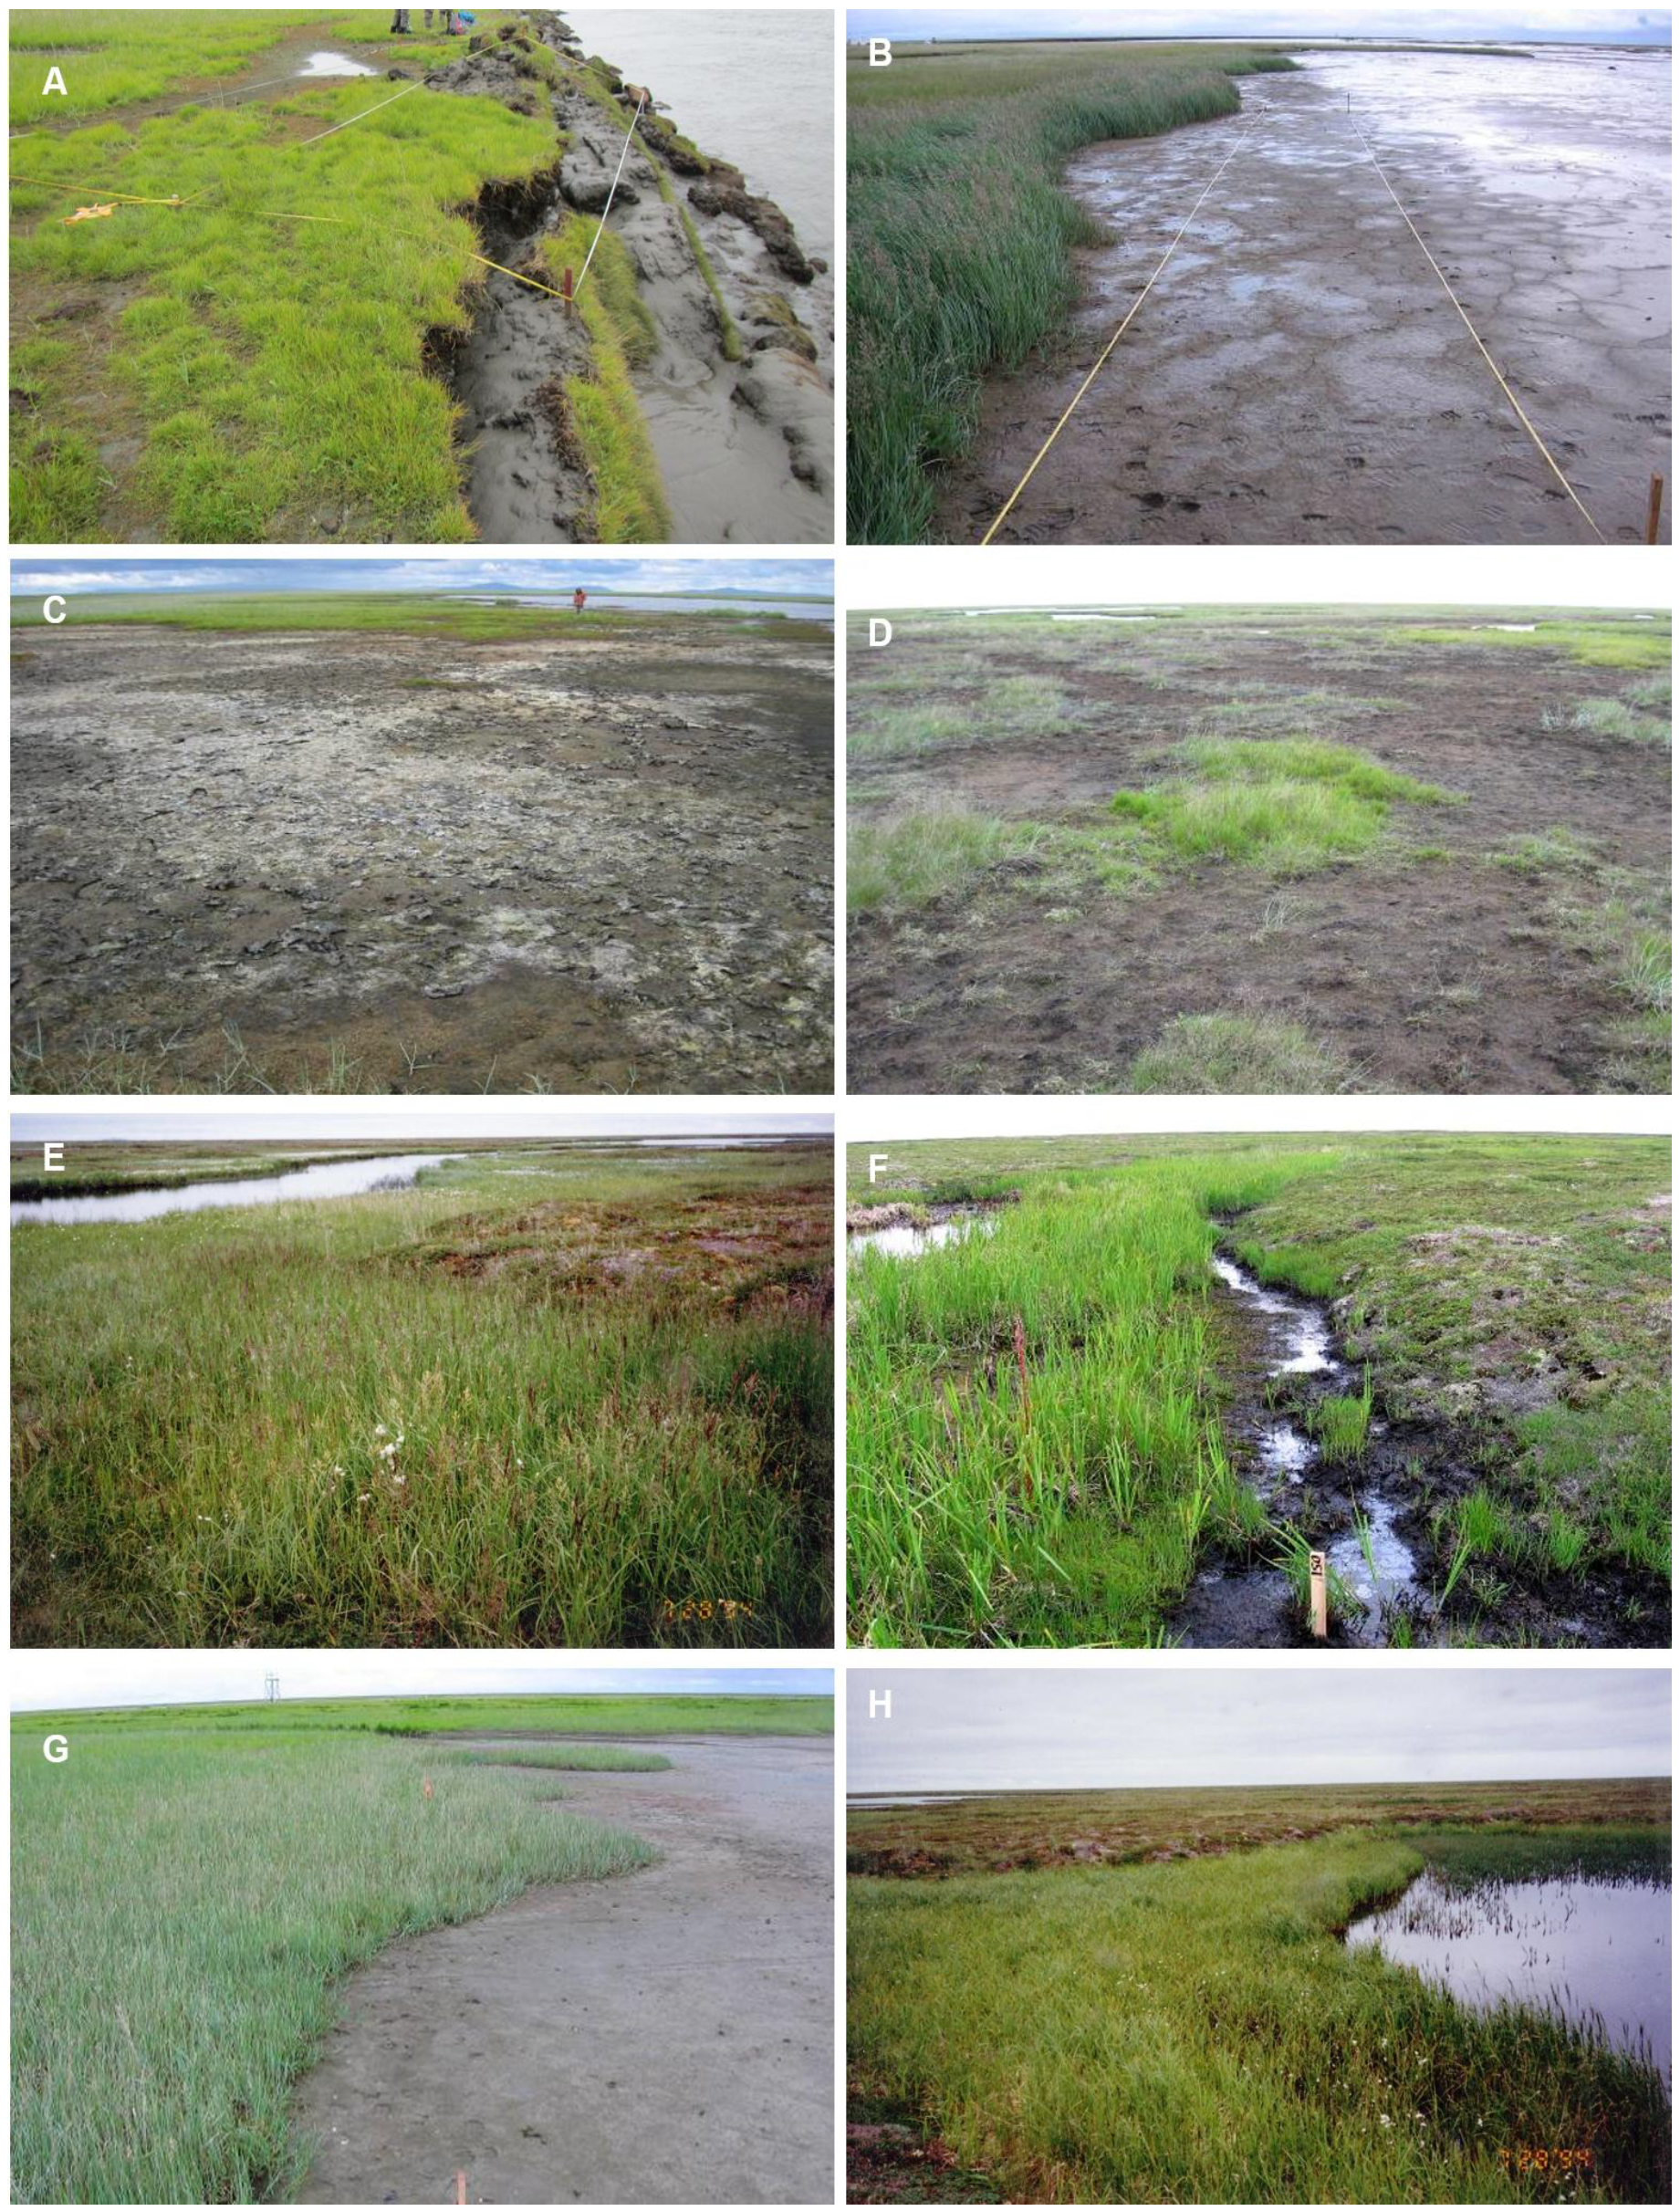
Figure 6.
Field-based examples of geomorphic and ecological processes affecting landscape change, including: (A) channel erosion; (B) sedimentation from 2005 storm surge; (C) pond margin drying from water-level fluctuation; (D) salt-killed tundra from 2005 storm; (E) plateau created by permafrost aggradation; (F) permafrost degradation after salt-kill of vegetation from 2005 storm; (G) vegetation colonization of tidal flat; and (H) paludification of pond margin.

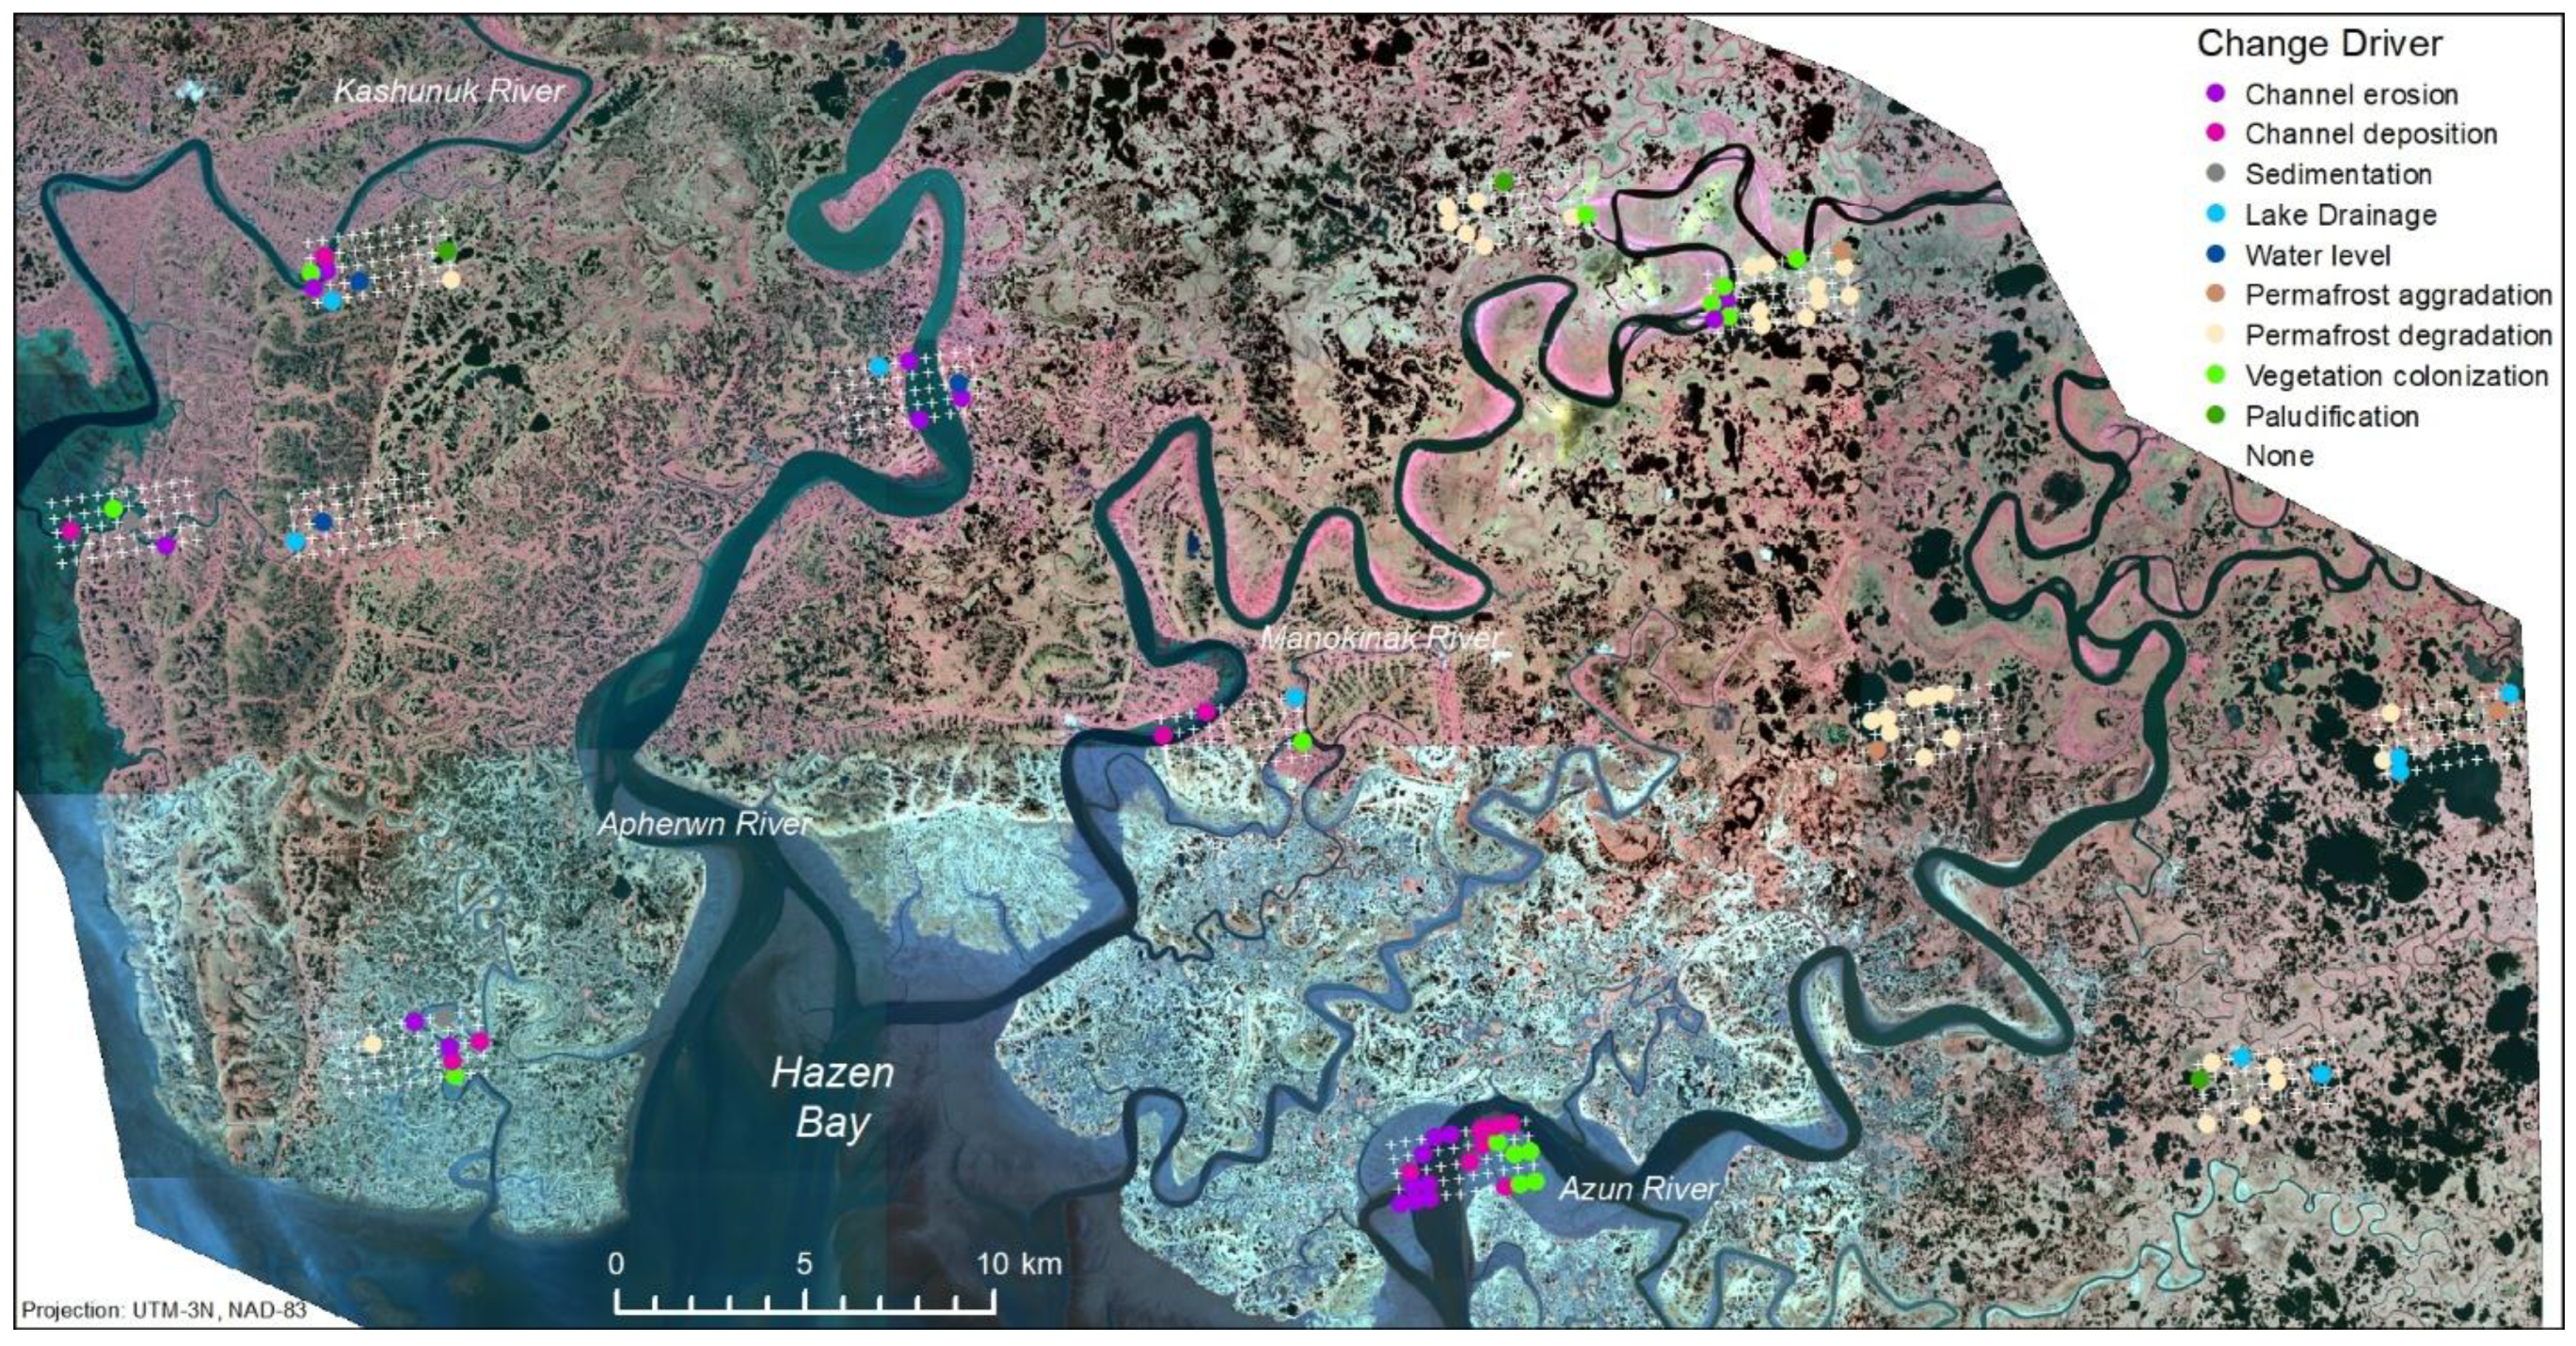
Figure 7.
Distribution of points where landscape change was detected along the central coast of the Yukon-Kuskokwim Delta.
Figure 7.
Distribution of points where landscape change was detected along the central coast of the Yukon-Kuskokwim Delta.

Figure 8.
Example of coastal erosion evident on imagery from 1955, 1980 and 2007 along the central outer coast of the Yukon-Kuskokwim Delta. Coastal erosion was not detected within the sampling grids but there were obvious “hotspots” of erosion evident outside of the grids.
Figure 8.
Example of coastal erosion evident on imagery from 1955, 1980 and 2007 along the central outer coast of the Yukon-Kuskokwim Delta. Coastal erosion was not detected within the sampling grids but there were obvious “hotspots” of erosion evident outside of the grids.

Figure 9.
Areal extent of change based on the type of change evident on imagery from ~1953, 1980, ~2007 and ~2015 along the central coast of the Yukon-Kuskokwim Delta.
Figure 9.
Areal extent of change based on the type of change evident on imagery from ~1953, 1980, ~2007 and ~2015 along the central coast of the Yukon-Kuskokwim Delta.

Figure 10.
Magnitude of large storms (>2 m) as indicated by maximum daily water levels recorded by a NOAA tide gauge at Nome, Alaska.
Figure 10.
Magnitude of large storms (>2 m) as indicated by maximum daily water levels recorded by a NOAA tide gauge at Nome, Alaska.

Figure 11.
Mean annual air temperatures from 1908 to 2017 at Nome, Alaska (NOAA data).

Table 1.
List of ecotypes and change drivers.
| Code | Ecotype | Code | Ecotype |
|---|---|---|---|
| BDL | Coastal Brackish Drained Lake Barrens | MNW | Marine Nearshore Water |
| BKM | Coastal Brackish-killed Wet Meadow | PME | Lacustrine Marestail Marsh |
| BKS | Coastal Brackish-killed Dwarf Scrub | POW | Lacustrine Shallow Open Water |
| BOW | Coastal Brackish Shallow Open Water | PSM | Lacustrine Wet Water Sedge Meadow |
| BRM | Coastal Brackish Wet Ramenskii Sedge Meadow | SCB | Coastal Saline Channel Barrens |
| BSM | Coastal Brackish Wet Ramenskii Sedge-Silverweed Meadow | SDM | Coastal Saline Moist Dunegrass Meadow |
| BTM | Coastal Brackish Thermokarst Moat | SFB | Coastal Saline Flat Barrens |
| BWS | Coastal Brackish Moist Willow Dwarf Scrub | SHM | Coastal Saline Wet Hoppner Sedge Meadow |
| KBM | Coastal Slightly Brackish Moist Bluejoint Grass Meadow | STP | Coastal Saline Tidal Pond |
| KCS | Coastal Slightly Brackish Moist Crowberry Dwarf Scrub | STR | Coastal Saline Tidal River |
| KDL | Coastal Slightly Brackish Drained Lake Barrens | ||
| KDM | Coastal Slightly Brackish Wet Dupontia Graminoid Meadow | ||
| KLE | Coastal Slightly Brackish Lyngbye Sedge Marsh | Change Driver | |
| KLM | Coastal Slightly Brackish Wet Lyngbye Sedge Meadow | CE | Channel erosion |
| KME | Coastal Slightly Brackish Marestail Marsh | CD | Channel deposition |
| KMM | Coastal Slightly Brackish Wet Mackenzie Sedge Meadow | SD | Sedimentation |
| KOW | Coastal Slightly Brackish Shallow Open Water | DL | Drained Lake |
| KPE | Coastal Slightly Brackish Pendent Grass Marsh | WL | Water-level change |
| KRB | Coastal Slightly Brackish Rariflora Sedge Bog | PA | Permafrost aggradation |
| KRM | Coastal Slightly Brackish Wet Rariflora Sedge Meadow | PC | Permafrost degradation |
| LBS | Lowland Moist Birch-Ericaceous Low Scrub | VC | Vegetation colonization |
| LSB | Lowland Water Sedge Bog | VP | Vegetation paludification |
| LTM | Lowland Moist Tussock Meadow | N | None |
© 2018 by the authors. Licensee MDPI, Basel, Switzerland. This article is an open access article distributed under the terms and conditions of the Creative Commons Attribution (CC BY) license (http://creativecommons.org/licenses/by/4.0/).
Share and Cite
MDPI and ACS Style
Jorgenson, M.T.; Frost, G.V.; Dissing, D. Drivers of Landscape Changes in Coastal Ecosystems on the Yukon-Kuskokwim Delta, Alaska. Remote Sens. 2018, 10, 1280. https://doi.org/10.3390/rs10081280
AMA Style
Jorgenson MT, Frost GV, Dissing D. Drivers of Landscape Changes in Coastal Ecosystems on the Yukon-Kuskokwim Delta, Alaska. Remote Sensing. 2018; 10(8):1280. https://doi.org/10.3390/rs10081280
Chicago/Turabian StyleJorgenson, M. Torre, Gerald V. Frost, and Dorte Dissing. 2018. "Drivers of Landscape Changes in Coastal Ecosystems on the Yukon-Kuskokwim Delta, Alaska" Remote Sensing 10, no. 8: 1280. https://doi.org/10.3390/rs10081280
Note that from the first issue of 2016, this journal uses article numbers instead of page numbers. See further details here.