Article

Distinguishing between Hazardous Flooding and Non-Hazardous Agronomic Inundation in Irrigated Rice Fields: A Case Study from West Java

1
Faculty of Geo-Information Science and Earth Observation (ITC), University of Twente, 7514 AE Enschede, The Netherlands
2
Faculty of Geography, Universitas Gadjah Mada, Yogyakarta 55281, Indonesia
*
Author to whom correspondence should be addressed.
Remote Sens. 2018, 10(7), 1003; https://doi.org/10.3390/rs10071003
Submission received: 21 April 2018 / Revised: 19 June 2018 / Accepted: 20 June 2018 / Published: 24 June 2018
(This article belongs to the Section Remote Sensing in Agriculture and Vegetation)

Abstract

:
An accurate flood detection method is essential for obtaining areas of irrigated rice fields affected by flooding. This paper aims to distinguish between rice fields with flooding and rice fields with agronomic inundation using MODerate resolution Imaging Spectroradiometer (MODIS) 8 day 500 m spatial resolution (MOD09A1) imageries over irrigated rice fields with complex cropping patterns in West Java. Over the past decade, Enhanced Vegetation Index (EVI) ≤ 0.1 derived from moderate resolution remote sensing imageries has been used for detecting flooding in irrigated rice fields. Without additional farming information, this paper argues that EVI ≤ 0.1 cannot estimate flood areas correctly, given the existence of both hazardous flooding and non-hazardous agronomic inundation in irrigated rice fields. Adding a threshold of 40-day duration representing land preparation and transplanting activities enables EVI ≤ 0.1 to distinguish between agronomic inundation and flooding in irrigated rice fields. The difference in the Start of Season (SOS) between the wet planting season 2013/2014 and long-term average (2000–2015) shows that the Overall Accuracy (OA) and F1 scores are 75.96% and 81.74%, respectively. The confusion matrix using the respondents’ reports shows OA of 80.5% and Kappa of 60.16%. The quality of flood maps is partly influenced by environmental processes, human decisions, and mixed pixels.

1. Introduction

1.1. Background

A robust flood detection method is crucial for deriving accurate information about flood hazards and designing effective strategies to reduce potential impacts of flood disasters [1,2,3]. Several studies have documented applications of spectral indices for detecting surface water in rice fields using remote sensing imageries [4,5,6]. Spectral indices are a single band or combination of bands that can distinguish target objects as a consequence of specific physical differences captured in spectral behavior. Water indices, such as NDWI (Normalized Difference Water Index) [7,8,9] or MLSWI (Modified Land Surface Water Index) [10], are commonly used as tools to detect water bodies on the earth’s surface. Also, vegetation indices, such as the Normalized Difference Vegetation Index (NDVI) and Enhanced Vegetation Index (EVI), are frequently used to detect surface water in rice fields [11,12]. Similar to NDVI, EVI is highly correlated with variations in the canopy background [13,14]. EVI minimizes the saturation and soil noise problems of NDVI by incorporating the blue spectral band and is thus more sensitive to high biomass and differences in the canopy than NDVI [15,16,17]. However, the requirement of the blue band seems to limit the range of sensors that can be used for generating EVI. Studies have been conducted on constructing EVI with two bands, using only red and near-infrared wavelengths, to respond to this limitation [18].
Recently, researchers have been increasingly using NDVI or EVI as a tool for detecting spatiotemporal flooding on the earth’s surface, including in irrigated rice fields [4,5,6,12,19]. Sakamoto et al. [4] detected flooding with time-series 8-day 500-m spatial resolution MODerate resolution Imaging Spectroradiometer (MODIS) imageries (MOD09A1) within the Cambodia and Vietnamese Mekong Delta. They suggested using EVI ≤ 0.1 (coefficient of determination or R2: 0.77–0.97). Next, investigating flood-affected rice fields in the Chao Phraya River delta in Thailand using MOD09A1, Son et al. [5] also suggested that flooded areas can be detected with EVI < 0.1 (Overall Accuracy: 84.1–97.9%; Kappa coefficient: 0.62–0.82). Following Sakamoto et al. [4], Islam et al. [6] applied EVI ≤ 0.1 derived from MOD09A1 imageries for mapping flood events in Bangladesh (R2: 0.96). Martinis et al. [19], who designed a fully automatic multi-scale flood monitoring system, also used MODIS-derived EVI ≤ 0.1 for delineating flooded areas (R2: 0.56–0.91). The thresholds designated were derived from the observation of temporal profiles of ‘pure’ pixels from different land uses or specific objects of interest. The use of EVI ≤ 0.1 (or other values) for identifying flooding in rice fields is thus based on the assumption that the critical value of 0.1 is the condition where hazardous flooding is detected by remote sensors [20]. It is worth noticing that the use of a fixed threshold may lead to an over-estimation or under-estimation of flood-affected areas because the coarse resolution satellite imageries are influenced by mixed pixels [20]. Sanyal and Lu [21] mentioned that the dynamics in the albedo of water bodies and bare soil are determined by the concentration of sediment in flooding and high soil moisture content. Thus, threshold values used for delineating between land and surface water might differ during monsoon seasons from dry season values. Several approaches have been proposed to overcome the issue, such as selecting locally-adapted thresholds [20,22,23,24], calibrating a general threshold for different locations [25], or implementing iterative and adaptive water extraction mechanisms for obtaining surface water areas [26].
Two types of surface water can be identified in irrigated rice fields. It is possible that both non-hazardous irrigation water and hazardous flooding can be present at the same time using vast irrigated rice fields with complex cropping patterns as the unit analysis. On the one side, surface water refers to deliberate inundation or non-hazardous surface water, which is part of cropping practices [27,28,29,30]. In typical growing conditions, irrigated rice fields are identical to long-duration surface water inundation during growing periods [31]. Soils in irrigated rice fields are frequently submerged or continuously saturated in varying degrees. From the birds-eye point of view, irrigated rice fields are alternately covered with a mixture of vegetation and water throughout wet and dry planting seasons. Rice plants predominantly envelop fields during fallow (e.g., stubbles), vegetative, generative, and harvest phases, while non-hazardous irrigation water mainly covers rice fields during land preparation and transplanting periods. Periods of dry bare soil without vegetation cover are rarely seen in irrigated rice fields, except after long fallow periods due to extreme water deficit events. On the other side, surface water refers to a physical event or hazardous surface water that is likely to cause crop damage, harvest failures, or disruptions in farming practices [32,33,34]. The present study argues that an attempt to distinguish between hazardous flooding and non-hazardous agronomic inundation using time-series remote sensing imageries is needed to provide inputs for detecting hazardous flooding in irrigated rice fields. A clear distinction between surface water due to farming practices or a natural hazard is necessary to limit the detection of ‘false positives.’ Without sufficient information on surface water dynamics, misinterpretations may arise if remotely-sensed spectral indices (vegetation or water indices) with a hard threshold (0.1 or other values) are directly used to detect flood-affected rice fields. In this study, any deliberate inundation or non-hazardous surface water to support farming activities (e.g., tillage, rice transplanting) is referred to as agronomic inundation, while any non-deliberate inundation or hazardous surface water in rice fields that potentially disrupts agricultural practices and causes crop damage is called flooding.
The objective of this study is to develop a method to distinguish between rice fields with hazardous flooding and rice fields with non-hazardous agronomic inundation using time-series remote sensing imageries and additional ground information. By doing so, the method can provide one of the inputs for improving hazardous flooding detection in irrigated rice fields. The study area is irrigated rice fields in West Java, a main rice production area of Indonesia. Firstly, we use the time-series EVI (2000–2015) derived from MOD09A1 for identifying rice field areas. The long-term average EVI was also generated and used as ‘normal’ rice field conditions per pixel. Next, we test the applicability of EVI ≤ 0.1 in distinguishing between flooding and agronomic inundation in the study area and, if possible, give improved criteria for flood detection in irrigated rice fields. Then, we use the duration of land preparation and transplanting activities as an additional parameter to EVI ≤ 0.1 to develop the method for discriminating the two types of surface water. The duration and other information on farming practices were obtained through interviews with 85 respondents (e.g., farmers, extension officers, and water managers) [35]. We compare EVI profiles between non-flooded and known flooded rice fields (e.g., swampland rice fields and river dike failure event) to link the ground observation and remote sensing imageries. The proposed method is tested by comparing wet planting seasons between 2013/2014 (a year with known flooding) and 2014/2015 (a dry year) in terms of flood extent and temporal evolution. An important assumption is that hazardous flooding is all surface water that is not ‘normal’ according to common farming practices. Next, we map flood affected rice field areas in wet planting seasons 2013/2014 and 2014/2015 using the proposed method. Finally, as an example, the quality of the flood map during the wet planting season 2013/2014 derived from the proposed method was assessed using accuracy assessment methods.

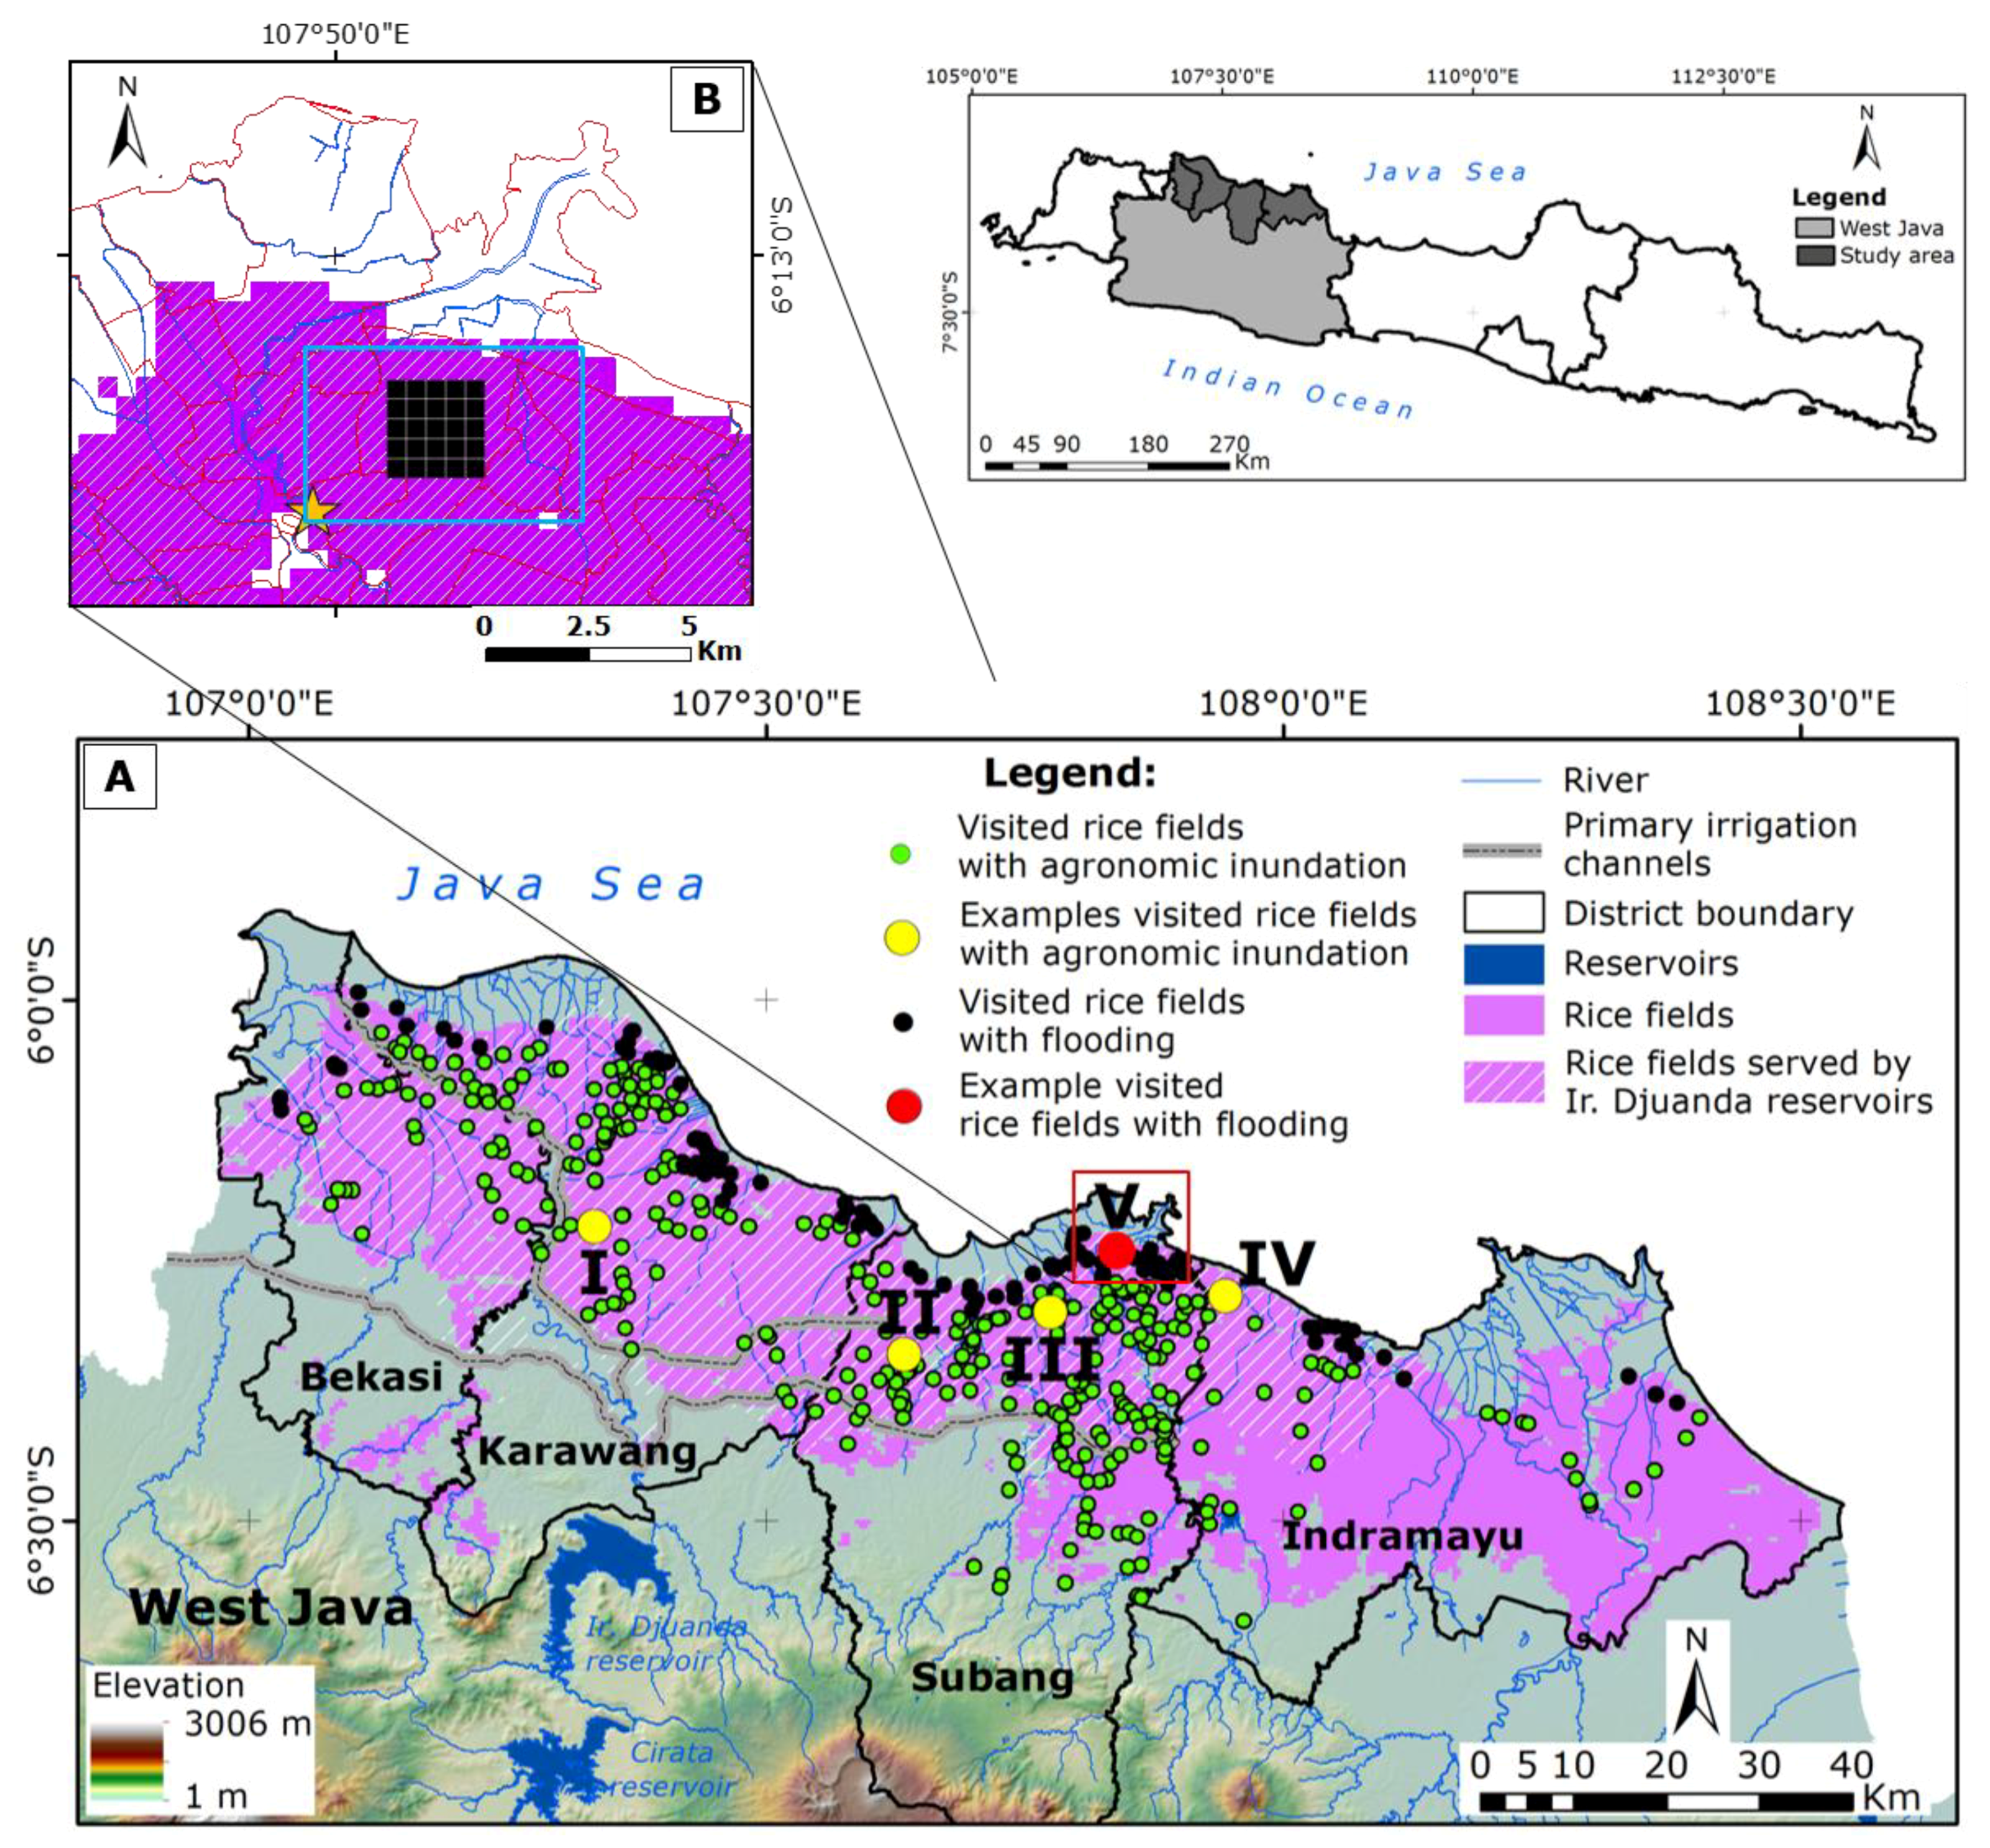
1.2. Study Area and Flooding Event 2014

The study area is an intensive rice production area in West Java, Indonesia, that depends on irrigation systems (Figure 1). West Java has humid tropical climate and experiences two seasons: wet and dry seasons that start from October to March and from April to September, respectively. Farmers mainly adopt a double-cropping pattern (rice-rice-fallow) with the periods of wet and dry planting seasons conform to wet and dry seasons. Although the average annual rainfall reaches up to 2000 mm, the majority of rainfall is distributed mainly in the middle and southern parts of the province from December to March [36,37].
Irrigation systems are required to help maintain stable rice production throughout years. The Ir. Djuanda reservoir serves the most extensive irrigation system (approximately 240,000 ha) in the study area, managed by a state company Perusahaan Umum Jasa Tirta (PJT) II. An official cropping calendar is created by the ministry of agriculture to regulate irrigation schedules for rice fields under Ir. Djuanda command area. The implementation of a double-rice cropping cycle and irrigation schedules result in complex cropping patterns, with south–north and west–east gradients of planting dates [38]. It is possible at any moment of the year to find all rice growth phases, from land preparation to harvesting, in the study area. However, closely knit farmer communities adjust their schedules based on logic and perceived socioeconomic and environmental factors, increasing the variabilities of rice growth stages. On the other hand, rice fields that are not under Ir. Djuanda command area use water from local sources to irrigate rice fields (e.g., reservoirs, rivers, wells). Although these rice fields are not entitled to follow any official cropping calendar, the national agricultural office suggests seasonal cropping schedules.
An extreme flooding event with varying depth and duration occurred in January 2014, afflicting irrigated rice fields in the study area. During the adverse event, rice fields near coastal areas were mostly flooded, while those that located in the southern part of the study area pursued regular rice cultivation. The effects of the flooding event varied depending on rice field growing stages. The impacts include destroyed fields, damaged rice crops, and delays in planting dates, among others. Swampland (deep and semi-deep) rice fields located in the northern regions of the study area suffered the most during this adverse event. These rice fields are frequently flooded during wet planting seasons. They have bowl-shaped topography, low-lying areas, and are associated with inadequate drainage channels. Thus, flood duration was longer than other rice fields because surface run-off (e.g., rainfall, irrigation water, river discharge) accumulates in these rice fields. Also, strong river flow caused a dike failure in Cipunagara river in Pamanukan sub-district on 18 January 2014, allowing river water to submerge adjacent swampland rice fields. Stakeholders needed to reconstruct the river levees and rice field embankments before starting rice cultivation. Rice fields with flooding (dike failure and swampland) are represented by the red dot (V) in Figure 1A or black rectangle in Figure 1B. Furthermore, during the extreme flooding in January 2014, information on affected villages is present; however, data on spatial and temporal flood evolution are not available.

2. Materials and Methods

2.1. Remote Sensing Data Pre-Processing

The Terra satellite carrying the MODIS sensor was launched in December 1999. The Level 3 atmospherically corrected 8-day 500 m spatial resolution MODIS imageries (MOD09A1) from 2000 (DOY 49) to 2015 (DOY 255) were used for this study. MOD09A1 data were stacked to produce a time-series dataset. The study area, including Karawang, Subang, Bekasi, and Indramayu districts, was derived from the dataset. The default sinusoidal projection was retained to avoid the misalignment of pixels during the data pre-processing. A time-series Enhanced Vegetation Index (EVI) dataset was derived from the time-series MOD09A1 using the following formula [4,5,16]:
EVI = 2.5 × NIR RED NIR + 6 × RED 7.5 × BLUE + 1
where NIR, RED, BLUE are the near-infrared (841–875 nm), red (621–670 nm), and blue (459–479 nm) bands, respectively. The EVI dataset was de-noised using the Adaptive Savitzky-Golay filter focusing on the upper envelope to smooth and enable the observation of spectral profiles [12,39,40]. The filter has been used for estimating MOD09A1-based rice phenology metrics in West Java with RMSEs of 9.21, 9.29, and 9.69 days for the Start of Season, heading stage, and End of Season, respectively [38]. Low and high EVI values represent a scarce and dense vegetation cover, respectively. Low positive or even negative EVI values also signify free-standing water (e.g., rivers, lakes, floods).
From the dataset, the time-series EVI from 2000 (DOY 49) to 2014 (DOY 153) was analyzed using the Iterative Self-Organizing DATA (ISODATA) unsupervised classification to generate rice field areas [41,42]. The unsupervised classification is selected because of the lack of information about the spatial distribution of land uses in the study area. The complete procedures of pre-processing and analysis to derive the rice field areas were elaborated in Sianturi et al. [38]. The rice field area is used as a mask during the whole analysis.
This study uses EVI, one of the vegetation indices, to distinguish between hazardous flooding and non-hazardous agronomic inundation in irrigated rice fields. Prior to its applicability to distinguish between hazardous flooding and non-hazardous agronomic inundation in irrigated rice fields, a question about the effectiveness of EVI to delineate between surface water and non-surface water in irrigated rice fields may arise. A variation of NDWI (RED and SWIR) was generated from MOD09A1 as reference data to assess the applicability of MODIS EVI in delineating between surface water and non-surface water [9,43]. The formula for deriving NDWI is as follows:
NDWI = RED SWIR RED + SWIR
EVI is also derived from Landsat 5 Thematic Mapper (TM) Level 1TP imageries to assess the ability of MODIS EVI ≤ 0.1 in discriminating between surface water and land. The Landsat 5 TM data have been geometrically corrected and radiometrically calibrated to enable time-series comparisons. The digital number pixels were converted to reflectance values. The cloud pixels were removed using the quality assessment band.

2.2. Fieldwork

The fieldwork was divided into two phases. In the first phase (October–November 2014), farmers, extension officers, and water managers (n = 85) were interviewed to obtain information about the cropping calendar, irrigation management, reasons for initiating cropping seasons, variations of surface water in irrigated rice fields, and natural hazards (flood or water-deficit events) [35]. The green dots in Figure 1A show rice fields with agronomic inundation visited during the fieldwork. The examples of variations in cropping schedules and surface water duration during land preparation and transplanting activities in rice fields with agronomic inundation are represented by yellow dots (I–IV).
In the second phase (January–February 2015), the fieldwork, the focus was on rice fields experiencing flooding: swampland rice fields and rice fields affected by dike failures. As previously mentioned, recurrent flood events occur mainly in the swampland rice field during wet planting seasons, in part, due to its bowl-shaped topography. High tide occurrences frequently prolong flood duration in these rice fields. In January 2014, swampland rice fields located throughout the northern part of the study area were severely flooded. It is worth mentioning that other types of flooding, such as flash flood or tidal flood intrusion, did not occur during the flooding period.
Rice fields in villages, Pamanukan Sebrang (Pamanukan sub-district), Bobos, Pangarengan (Legonkulon sub-district), and Rancadaka (Pusakanagara sub-district) in Subang district (see Figure 1B) were selected as locations to obtain inputs to develop a method for distinguishing between agronomic inundation and flooding in irrigated rice fields. Two reasons were used to select these hazardous flooding areas.
  • Direct evidence (dike breach): Rice fields in these villages were affected by flooding due to a dike failure on 18 January 2014. The same rice fields did not experience any flood events from January to February 2015. Farmers and extension officers mentioned a stark contrast between low and high rainfall intensities during 2014/2015 and 2013/2014 wet seasons, respectively.
  • Physical conditions: These are swampland rice fields. Often, farmers who own swampland rice fields resort to coping with the risk of flooding by delaying the wet planting season until the end of February. The strategy is performed because it is almost impossible for farmers to drain ponding water from irrigated rice fields to hasten the start of rice cultivation during flooding periods. In other words, the start of wet planting seasons in these irrigated rice fields is partly controlled by physical conditions (e.g., rainfall, topography).
Table 1 compares conditions between rice fields with flooding and rice fields with agronomic inundation in the selected locations from 17 January to 26 February in wet planting seasons 2013/2014 and 2014/2015. The conditions were obtained through interviews with farmers. Rice fields were flooded from DOY 17 to DOY 57 in 2014. On the contrary, similar rice fields did not experience any flood event during the same period in 2015.

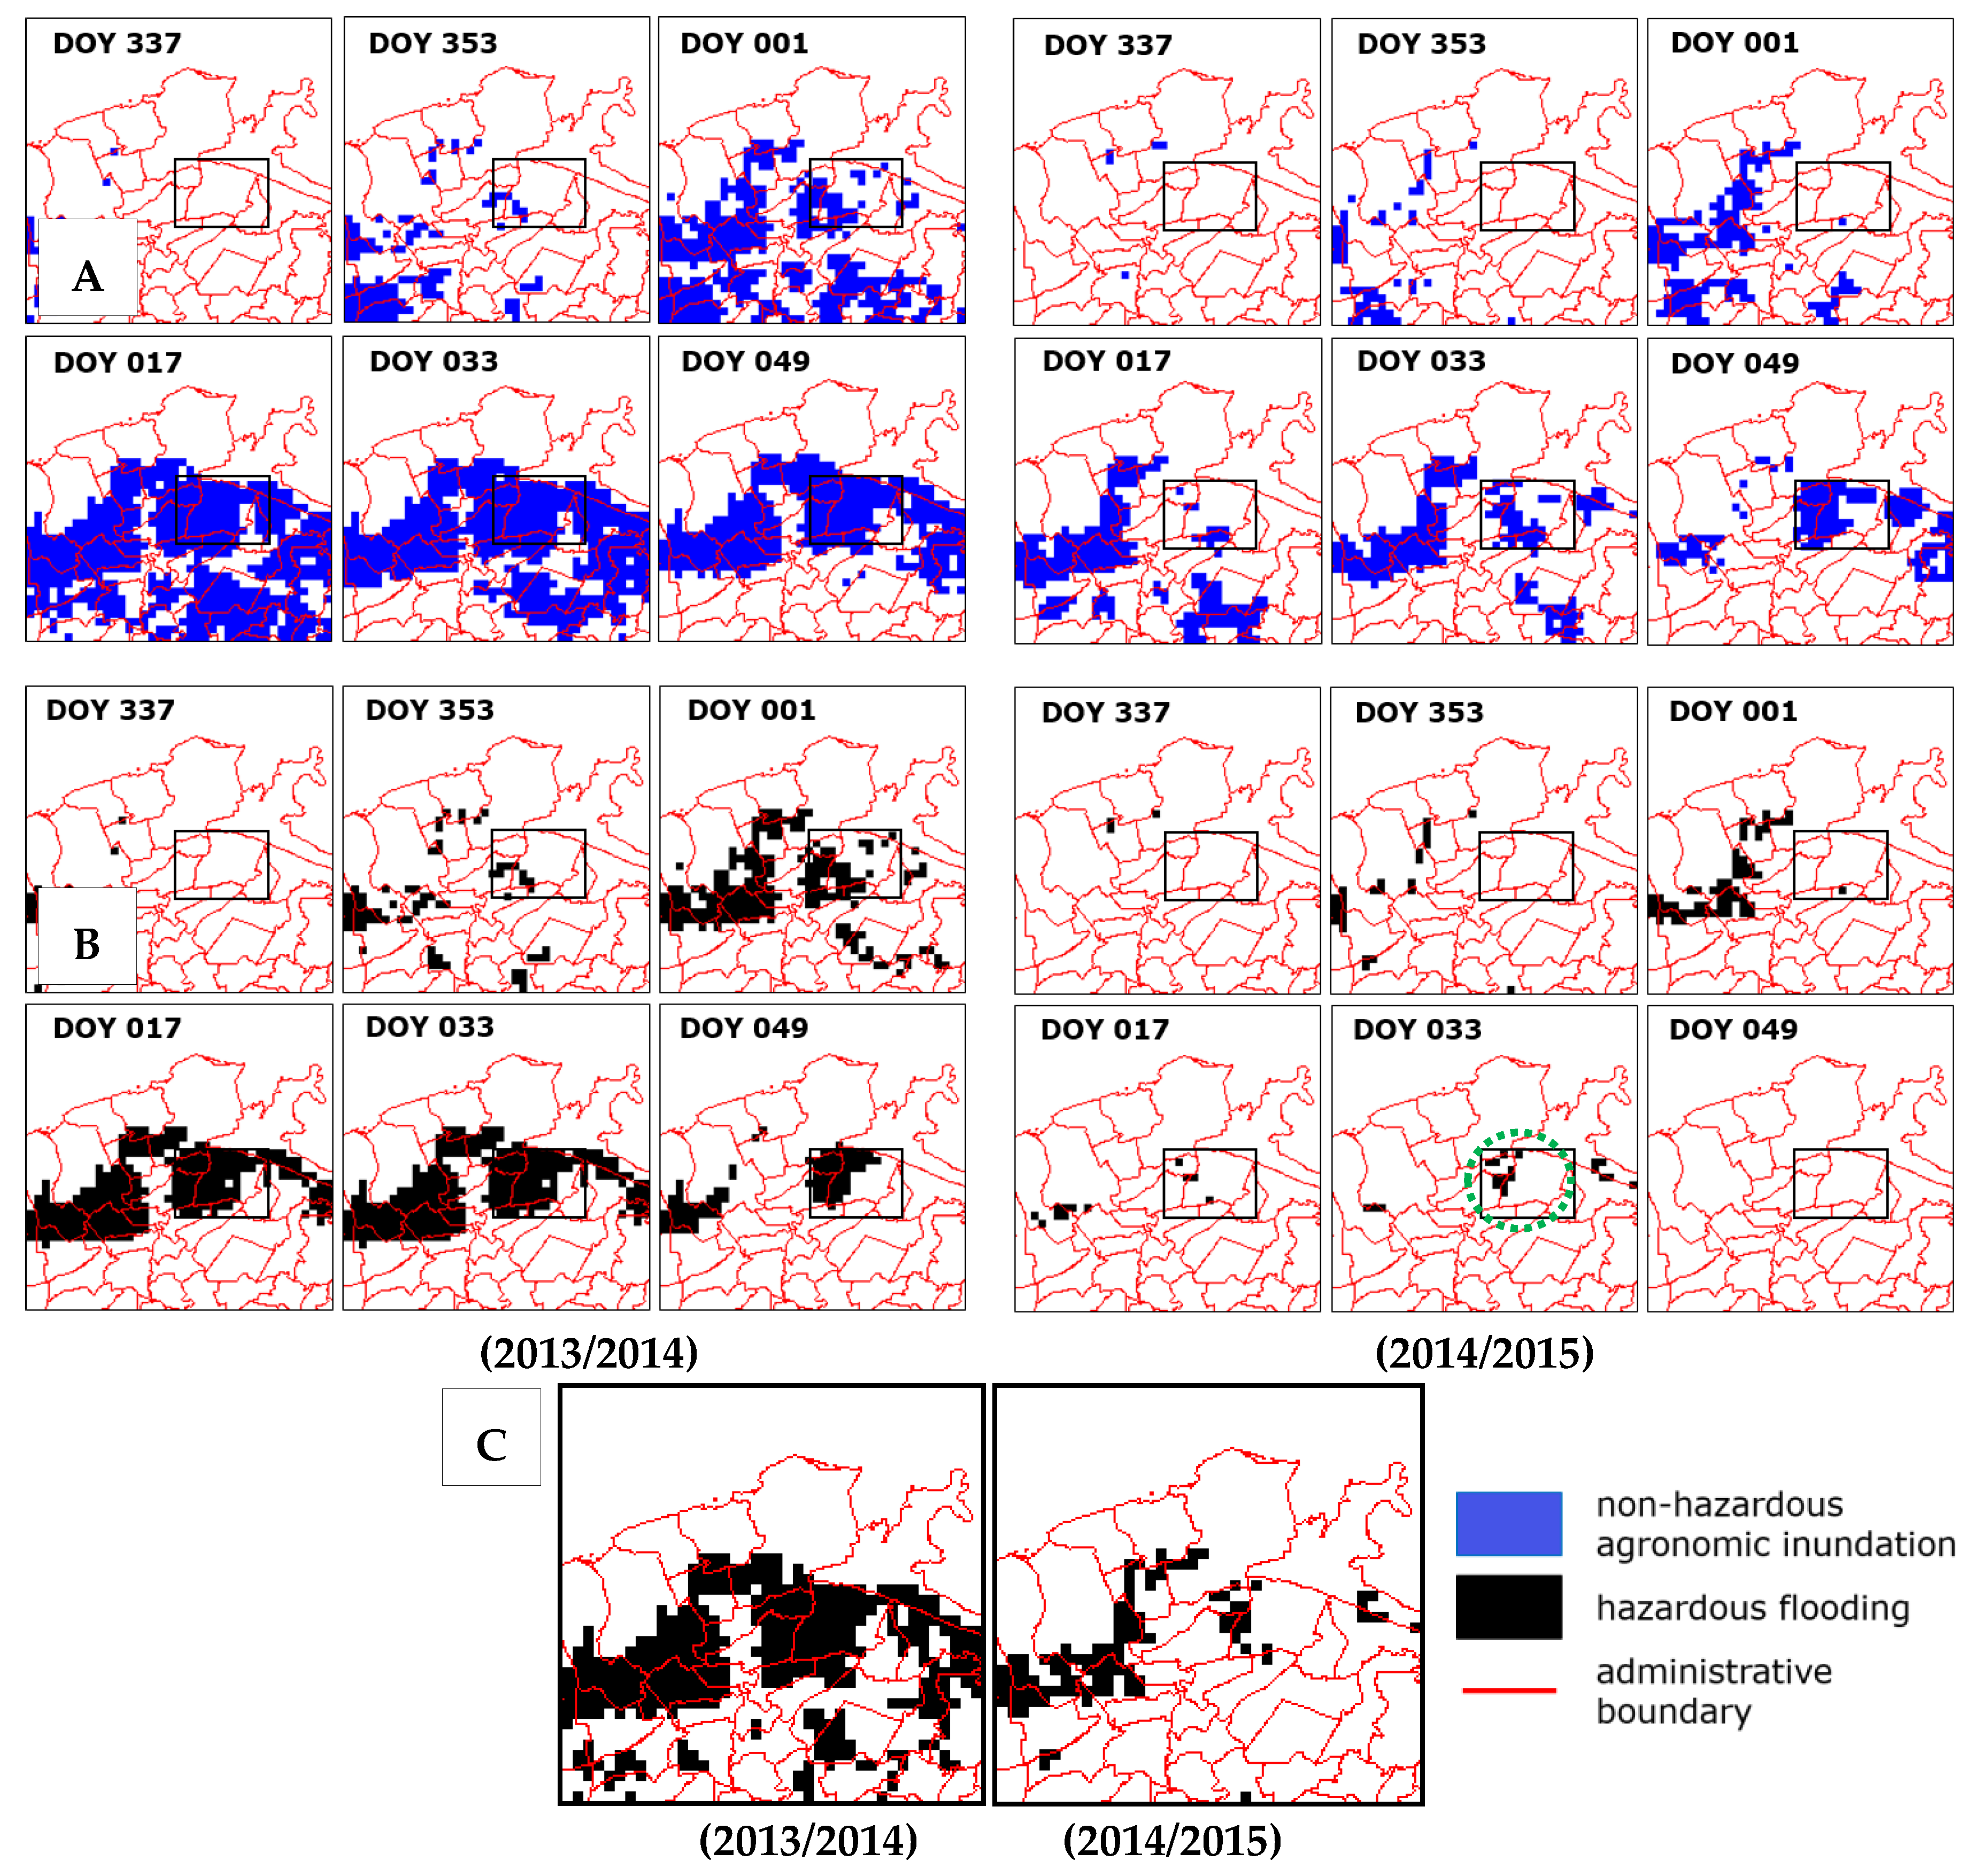
2.3. Distinguishing between Flooding and Agronomic Inundation

Firstly, the time-series EVI ≤ 0.1 is tested for detecting hazardous surface water in the study area. Periods when flood events were recorded during the wet planting season from DOY 337 (2013) to DOY 49 (2014) and the periods when no flood events were reported during the dry planting season from DOY 137 (2014) to DOY 217 (2014) were used as test periods. Periods in between, from DOY 49 (2014) to DOY 137 (2014), are mixed conditions where flooding was still present in swampland rice fields.
Secondly, the duration of land preparation and transplanting activities was added as an additional parameter to EVI ≤ 0.1 to distinguish between hazardous flooding and non-hazardous agronomic inundation in the study area. Depending on soil conditions, farmers may require a week (this could be more or less) for saturating dry rice fields before being plowed. Farmers in the study area need around 25 days for maturing rice seedlings in a nursery bed. Until seven days after transplanting, irrigation water still dominantly covers rice fields. In total, the duration of 40 days (this could be less or more) is needed for land preparation, including maturing rice seedlings, and rice transplanting activities. Most farmers employ farm laborers for transplanting rice fields. The use of transplanting machines is not common in the study area. In practice, tillage and transplanting processes may take longer due to various reasons, including the irregularity in the irrigation distribution, low rainfall intensity, lack of labor farmers, or planting delay to ensure a synchronize planting and distribute the risk of rat attacks [35].

2.4. Accuracy Assessment

Two accuracy assessments were performed. First, the ability of MODIS EVI ≤ 0.1 in discriminating between surface water and non-surface water was tested. The surface water areas derived from MODIS EVI ≤ 0.1 were compared with those of MODIS NDWI ≥ 0.1 and Landsat 5 TM EVI ≤ 0.1. The selection of Landsat 5 TM imageries was limited to dry planting seasons due to frequent massive cloud cover during wet seasons. Imageries with land cloud covering less than 10% were selected. The surface water extent was compared for each sub-district in the study area. Table 2 lists Landsat 5 TM imageries used to assess surface water areas generated from MODIS EVI ≤ 0.1.
Second, assessing the ability of our proposed method (EVI ≤ 0.1 with additional land preparation and transplanting duration) in distinguishing between hazardous flooding and non-hazardous agronomic inundation directly was challenging. As previously mentioned, it is not possible to validate the flood extent using higher resolution imageries because of frequent massive cloud cover during wet seasons. The assessments were performed with two data sources. Firstly, respondents’ reports (e.g., farmers, extension officers, and water managers) on flood locations were used to validate the flood map of the wet planting season 2013/2014 using a confusion matrix [44]. Rice fields where extreme flooding events occurred were visited during the fieldwork. Flood locations were pointed out by farmers, water managers, or extension officers and recorded using GPS (Global Positioning System). Secondly, the duration of rice maturing in seedling beds before being transplanted, approximately 25 days, is selected as the parameter to assess flood maps. Flood impacts comprise crop damage and social unrest, among others. However, this study can only detect flood impacts on delays in planting dates and affected areas using remote sensing imageries. Disruptions in planting dates can be considered as problematic in irrigated rice fields regulated with planting schedules. In the study area setting, delays in planting dates may result in irregularity in irrigation management and asynchronous cropping schedules, among others [35]. This study assumes that farmers suffer from delays in planting dates from flood events during the wet planting season 2013/2014. The 25-day duration also allows farmers to cope with flooding, for example by purchasing matured rice plants or replanting rice seedlings. In this respect, an evaluation matrix based on the Start of Season (SOS) is developed for accuracy assessment, as shown in Table 3. The SOS is one of the phenology metrics and is considered as the moment when farmers transplant rice fields. The SOS criteria follow the work of Sianturi et al. [38]. The SOS is defined as the period when the EVI value reaches 0.1 during growing phases. The growing phase is the period from the minimum to peak value (heading stage). If the lowest EVI value throughout cropping seasons is higher than 0.1 (e.g., due to mixed pixels), the minimum value is selected as the SOS. Also, if two or more EVI values (0.1 or minimum) are the same, the last DOY is selected as the SOS. The DOY for the SOS is analyzed manually according to the conditions above to ensure the quality of DOYs. As an example, this study focuses only on evaluating the flooding event in the wet planting season 2013/2014.
The assessment criteria for hazardous flooding using the SOS is as follows. A flood pixel is considered as True Positive when the difference in the SOS between flooded rice fields during the wet planting season 2013/2014 and long-term average (2000–2015) is >25 days. For example, if the planting date in the wet planting season 2013/2014 is DOY 75 (possibly delayed due to the flooding event) while the ‘normal’ long-term average planting date is DOY 45, then the pixel is labeled as flooded rice fields. The agronomic inundation pixels are considered as True Negative if the difference in the SOS between rice fields with agronomic inundation during the wet planting season 2013/2014 and long-term average is ≤25 days.
Table 3 shows methods used to assess the estimated flood maps derived using our proposed method (EVI ≤ 0.1 with additional tillage and transplanting duration), including the precision (positive predictive value), recall (sensitivity), specificity, false positive rate, false negative rate, negative predictive value, Overall Accuracy (OA) [44,45,46], and F1 score [47,48]. The precision measures the quality of positive findings among all identified positive results while the recall is a measure of completeness of the results among possible identified positive results. The absence of type I (no false positive) and type II (no false negative) errors correspond to maximum precision and recall scores, respectively. Results with high specificity values will accurately detect rice fields with agronomic inundation from all possible rice fields with agronomic inundation pixels. A false positive rate (type I error) estimates the likelihood of rice fields with agronomic inundation pixels that are incorrectly identified as rice fields with flooding. On the contrary, a false negative rate (type II error) measures the likelihood of rice fields with flooding that are incorrectly identified as rice fields with agronomic inundation. In contrast to the precision, the negative predictive value is the proportion of true negative among all identified negative results. OA is the total number of correctly classified pixels divided by all test pixels. OA is useful in symmetric datasets where the number of false positives and false negatives is relatively similar. An F1 score is the harmonic average of precision and recall, where 1 (or 100%) and 0 (or 0%) are the best and worst values, respectively. A higher F1 score indicates a high predictive power of a classification procedure. Unlike the OA, the F1 score works best if the data have an uneven class distribution. Pixels for the accuracy assessment were randomly selected from rice fields with flooding and rice fields with agronomic inundation in 2013/2014 and 2014/2015.

3. Results

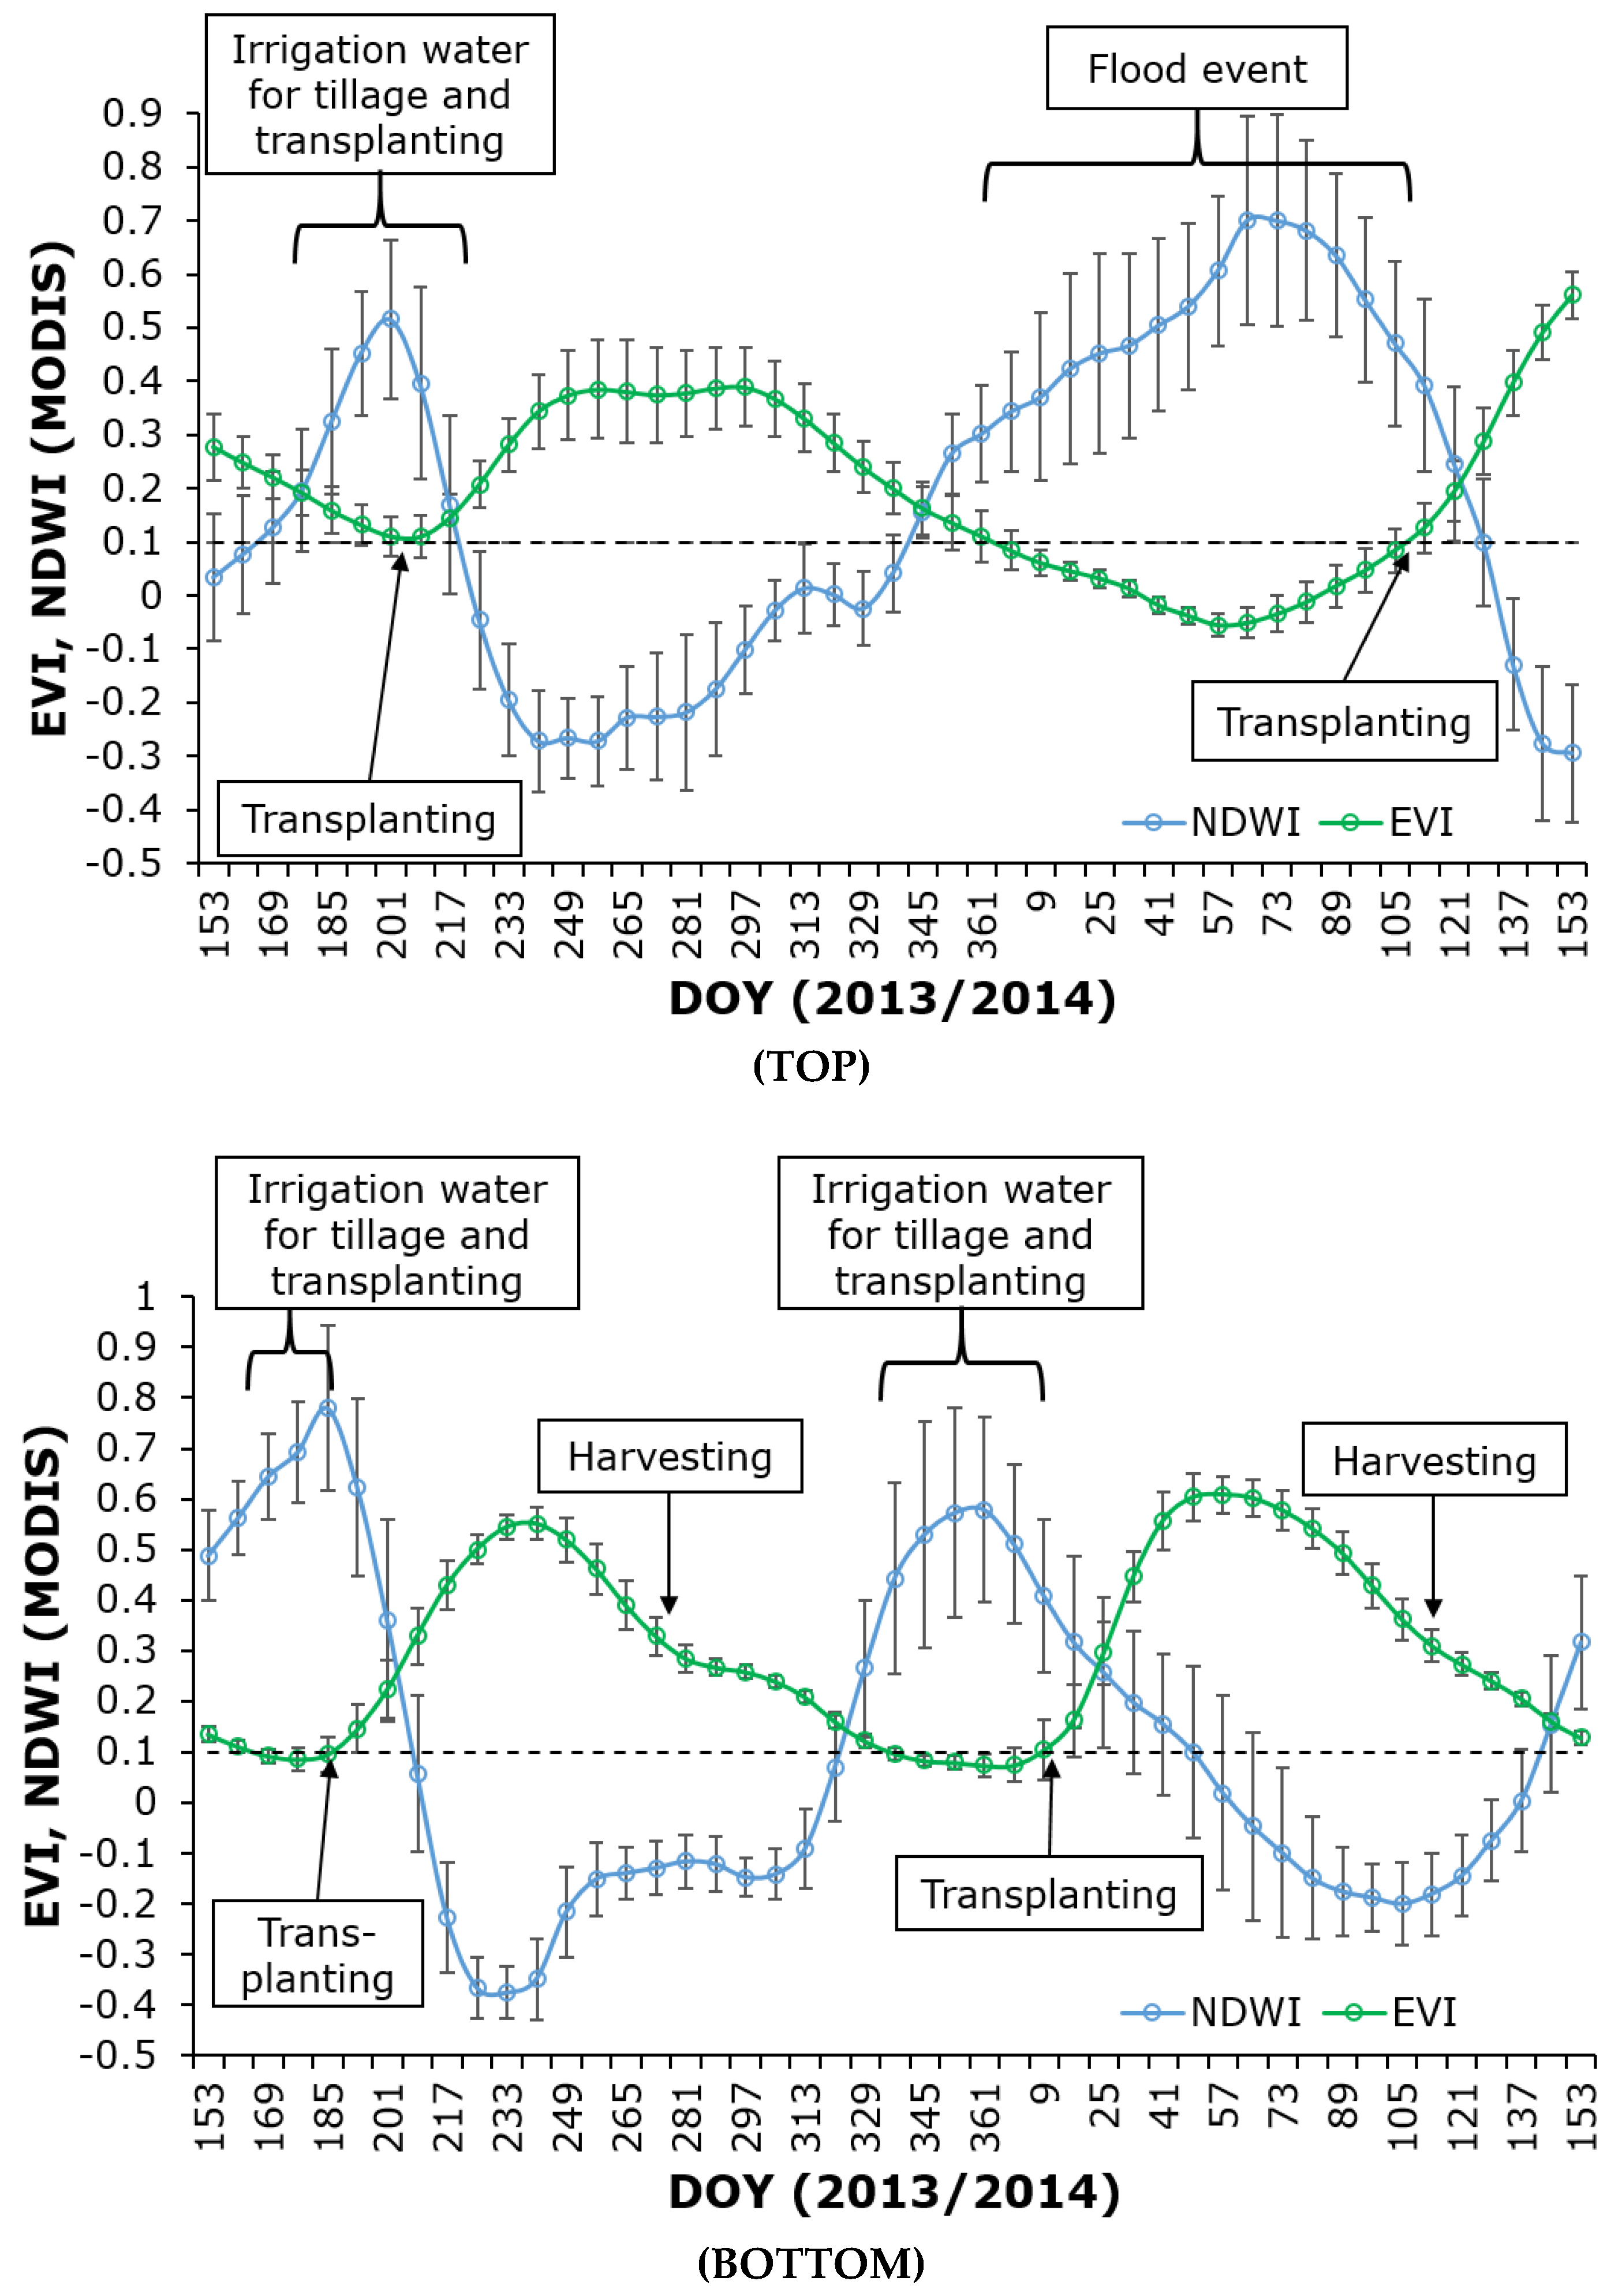
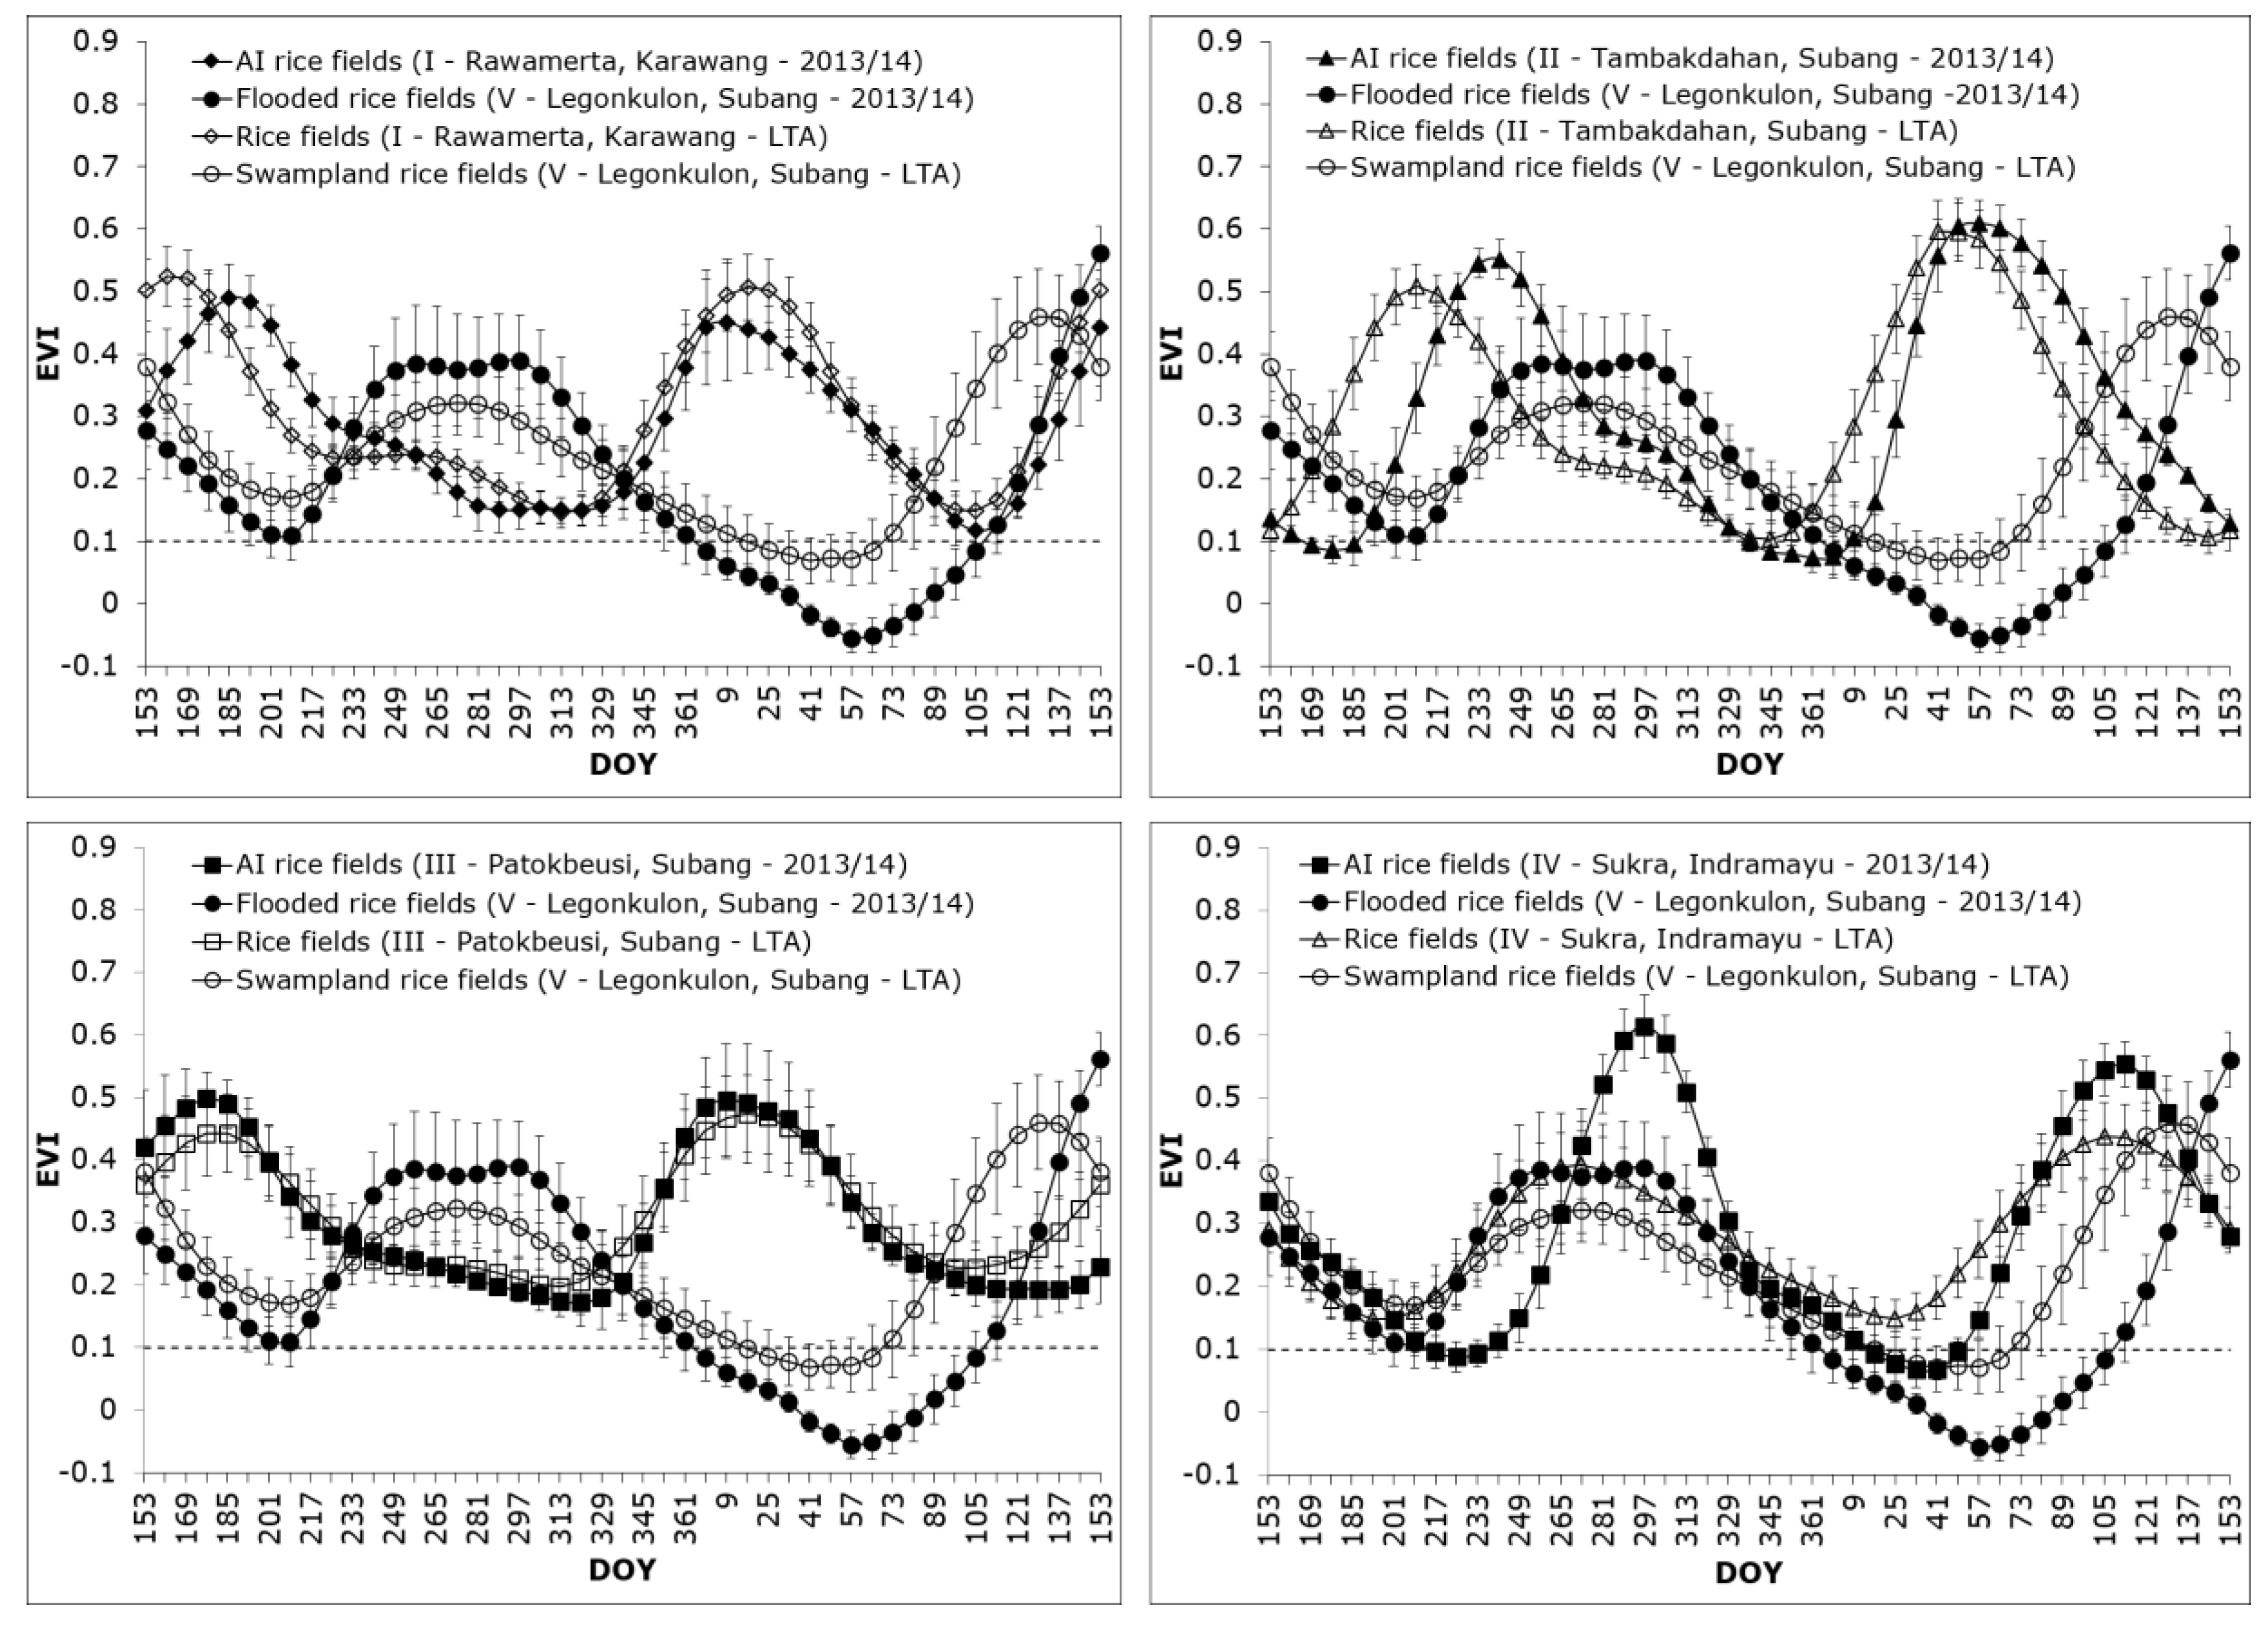
3.1. EVI ≤ 0.1 for Distinguishing between Flooding and Agronomic Inundation

Figure 2 shows time-series surface water maps detected using EVI ≤ 0.1 during the wet planting season 2013/2014 and dry planting season 2014. Surface water detected during the wet planting season 2013/2014 includes both rice fields with flooding and with agronomic inundation. On the contrary, surface water detected during the dry planting season 2014 was rice fields with agronomic inundation as no flood events were reported by farmers, extension officers, and water managers. This finding provides evidence that EVI ≤ 0.1 is not able to discriminate between hazardous flooding and non-hazardous agronomic inundation in irrigated rice fields in the study area. This finding is not in line with studies mentioning that EVI ≤ 0.1 can be used to detect spatiotemporal flooding on the land surface, including in irrigated rice fields [4,5,6,19,49]. A plausible explanation may be related to differences in the irrigation management and farming practices.
Figure 3 shows coefficients of determination between MODIS EVI ≤ 0.1 and MODIS NDWI ≥ 0.1 (R2 = 0.61) and between MODIS EVI ≤ 0.1 and Landsat 5 TM EVI ≤ 0.1 (R2 = 0.34) in discriminating between surface water and non-surface water in the study area. It can be seen that EVI ≤ 0.1 underestimates surface water areas, and is inferior compared to NDWI ≥ 0.1 in delineating between surface water and non-surface water in irrigated rice fields. EVI accentuates the vegetation or non-vegetation condition to indicate the absence or presence of surface water. NDWI emphasizes the water or non-water condition in irrigated rice fields.
Furthermore, surface water in irrigated rice fields is not always detectable using time-series EVI ≤ 0.1 derived from moderate resolution imageries, revealing the influence of mixed pixels resulting from environmental conditions and human decisions. Firstly, farmers in different villages may have dissimilarities in decisions related to cropping schedules. Farmers with access to irrigation water and good drainage conditions have more flexibility in managing planting dates compared to those located at the tail end of irrigation channels. For the former, surface water excess in rice fields can be well-managed, reducing the risk of flooding. These farmers may also perform a triple rice-cropping pattern without fallow periods. Secondly, it is related to variations in farmers’ coping mechanisms for environmental conditions. Farmers with lack of access to irrigation water during dry planting seasons may perform quick rice cultivation after wet season harvest, skipping the fallow period. These conditions cause some rice fields to almost always be covered by rice plants or stubble. Thirdly, the relative elevation of rice fields and drainage conditions may cause differences in the duration of water in irrigated rice fields. These conditions may result in varying degree of mixed pixels, influencing EVI profiles detected by remote sensing imageries.
In relation to the research aim, the use of MODIS EVI ≤ 0.1 is preferable because the blue spectral band of EVI reduces soil noise problems [15,16,17]. Additionally, rice plants predominantly cover irrigated rice fields throughout planting seasons, except during land preparation and transplanting periods. Furthermore, data, including the duration of land preparation and transplanting activities (around 40 days) and planting dates, are needed as additional parameters to discriminate between hazardous flooding and non-hazardous agronomic inundation. This ground information cannot be easily detected from the MODIS NDWI profile despite its ability in discriminating between surface water and non-surface water. On the contrary, EVI profiles can demonstrate the necessary ground information consistently, as seen in Figure 4.

3.2. EVI40 for Distinguishing Flooding and Agronomic Inundation

The duration of land preparation and transplanting activities was incorporated to develop a method to distinguish between hazardous flooding and non-hazardous agronomic inundation in irrigated rice fields. Table 4 shows the duration of flooding and agronomic inundation in irrigated rice fields derived from EVI profiles from 2000/2001 to 2014/2015. The duration is the difference between transplanting dates and the date when non-hazardous agronomic inundation or hazardous flooding first detected. In the last 15 years, rice fields with agronomic inundation experience 21 ± 9 to 30 ± 9 days of non-hazardous agronomic inundation during land preparation and transplanting activities. EVI ≤ 0.1 less than 40 days (n or number of pixels = 1287) consistently represents rice fields with agronomic inundation. This result is likely due to the similarity of farming practices (tillage, seedling preparation, transplanting) in the study area. On the other hand, rice fields with flooding (swampland rice fields and flooded rice fields due to dike failure) exhibit EVI ≤ 0.1 longer than 40 days (hereafter referred to as EVI40). Rice fields with flooding were submerged from 83 ± 22 to 95 ± 20 days during the wet planting season 2013/2014.
Figure 5 shows EVI profiles derived from 5 × 5 adjacent rice pixels in 2013/2014 and long-term average (LTA) 2000–2015. There may be a concern that a MODIS pixel (±500 m), not the least 5 × 5 pixels, may be too coarse to capture the small parcel of irrigated rice fields. However, it is argued that the use of 5 × 5 pixels is still applicable in the study area due to the physical connections of rice fields. Rice fields located adjacent to other rice fields may form vast irrigated rice field areas with relatively similar cropping calendars and farming practices. The differences in surface water dynamics and cropping schedules are greater with the increase in distance between rice fields. Five EVI profiles are purposefully selected to clarify the differences in surface water duration (1 EVI profile for flooding and 4 EVI profiles for agronomic inundation). For the latter, the selection of 4 EVI profiles is also to indicate variations in cropping schedules in the study area. Similar to Table 4, Figure 5 consistently shows that the duration of flooding detected using the time-series EVI ≤ 0.1 is longer than that of agronomic inundation. Flooding duration due to the dike failure in January 2014 was longer than that of long-term average (2000–2015) ponding swampland rice fields.

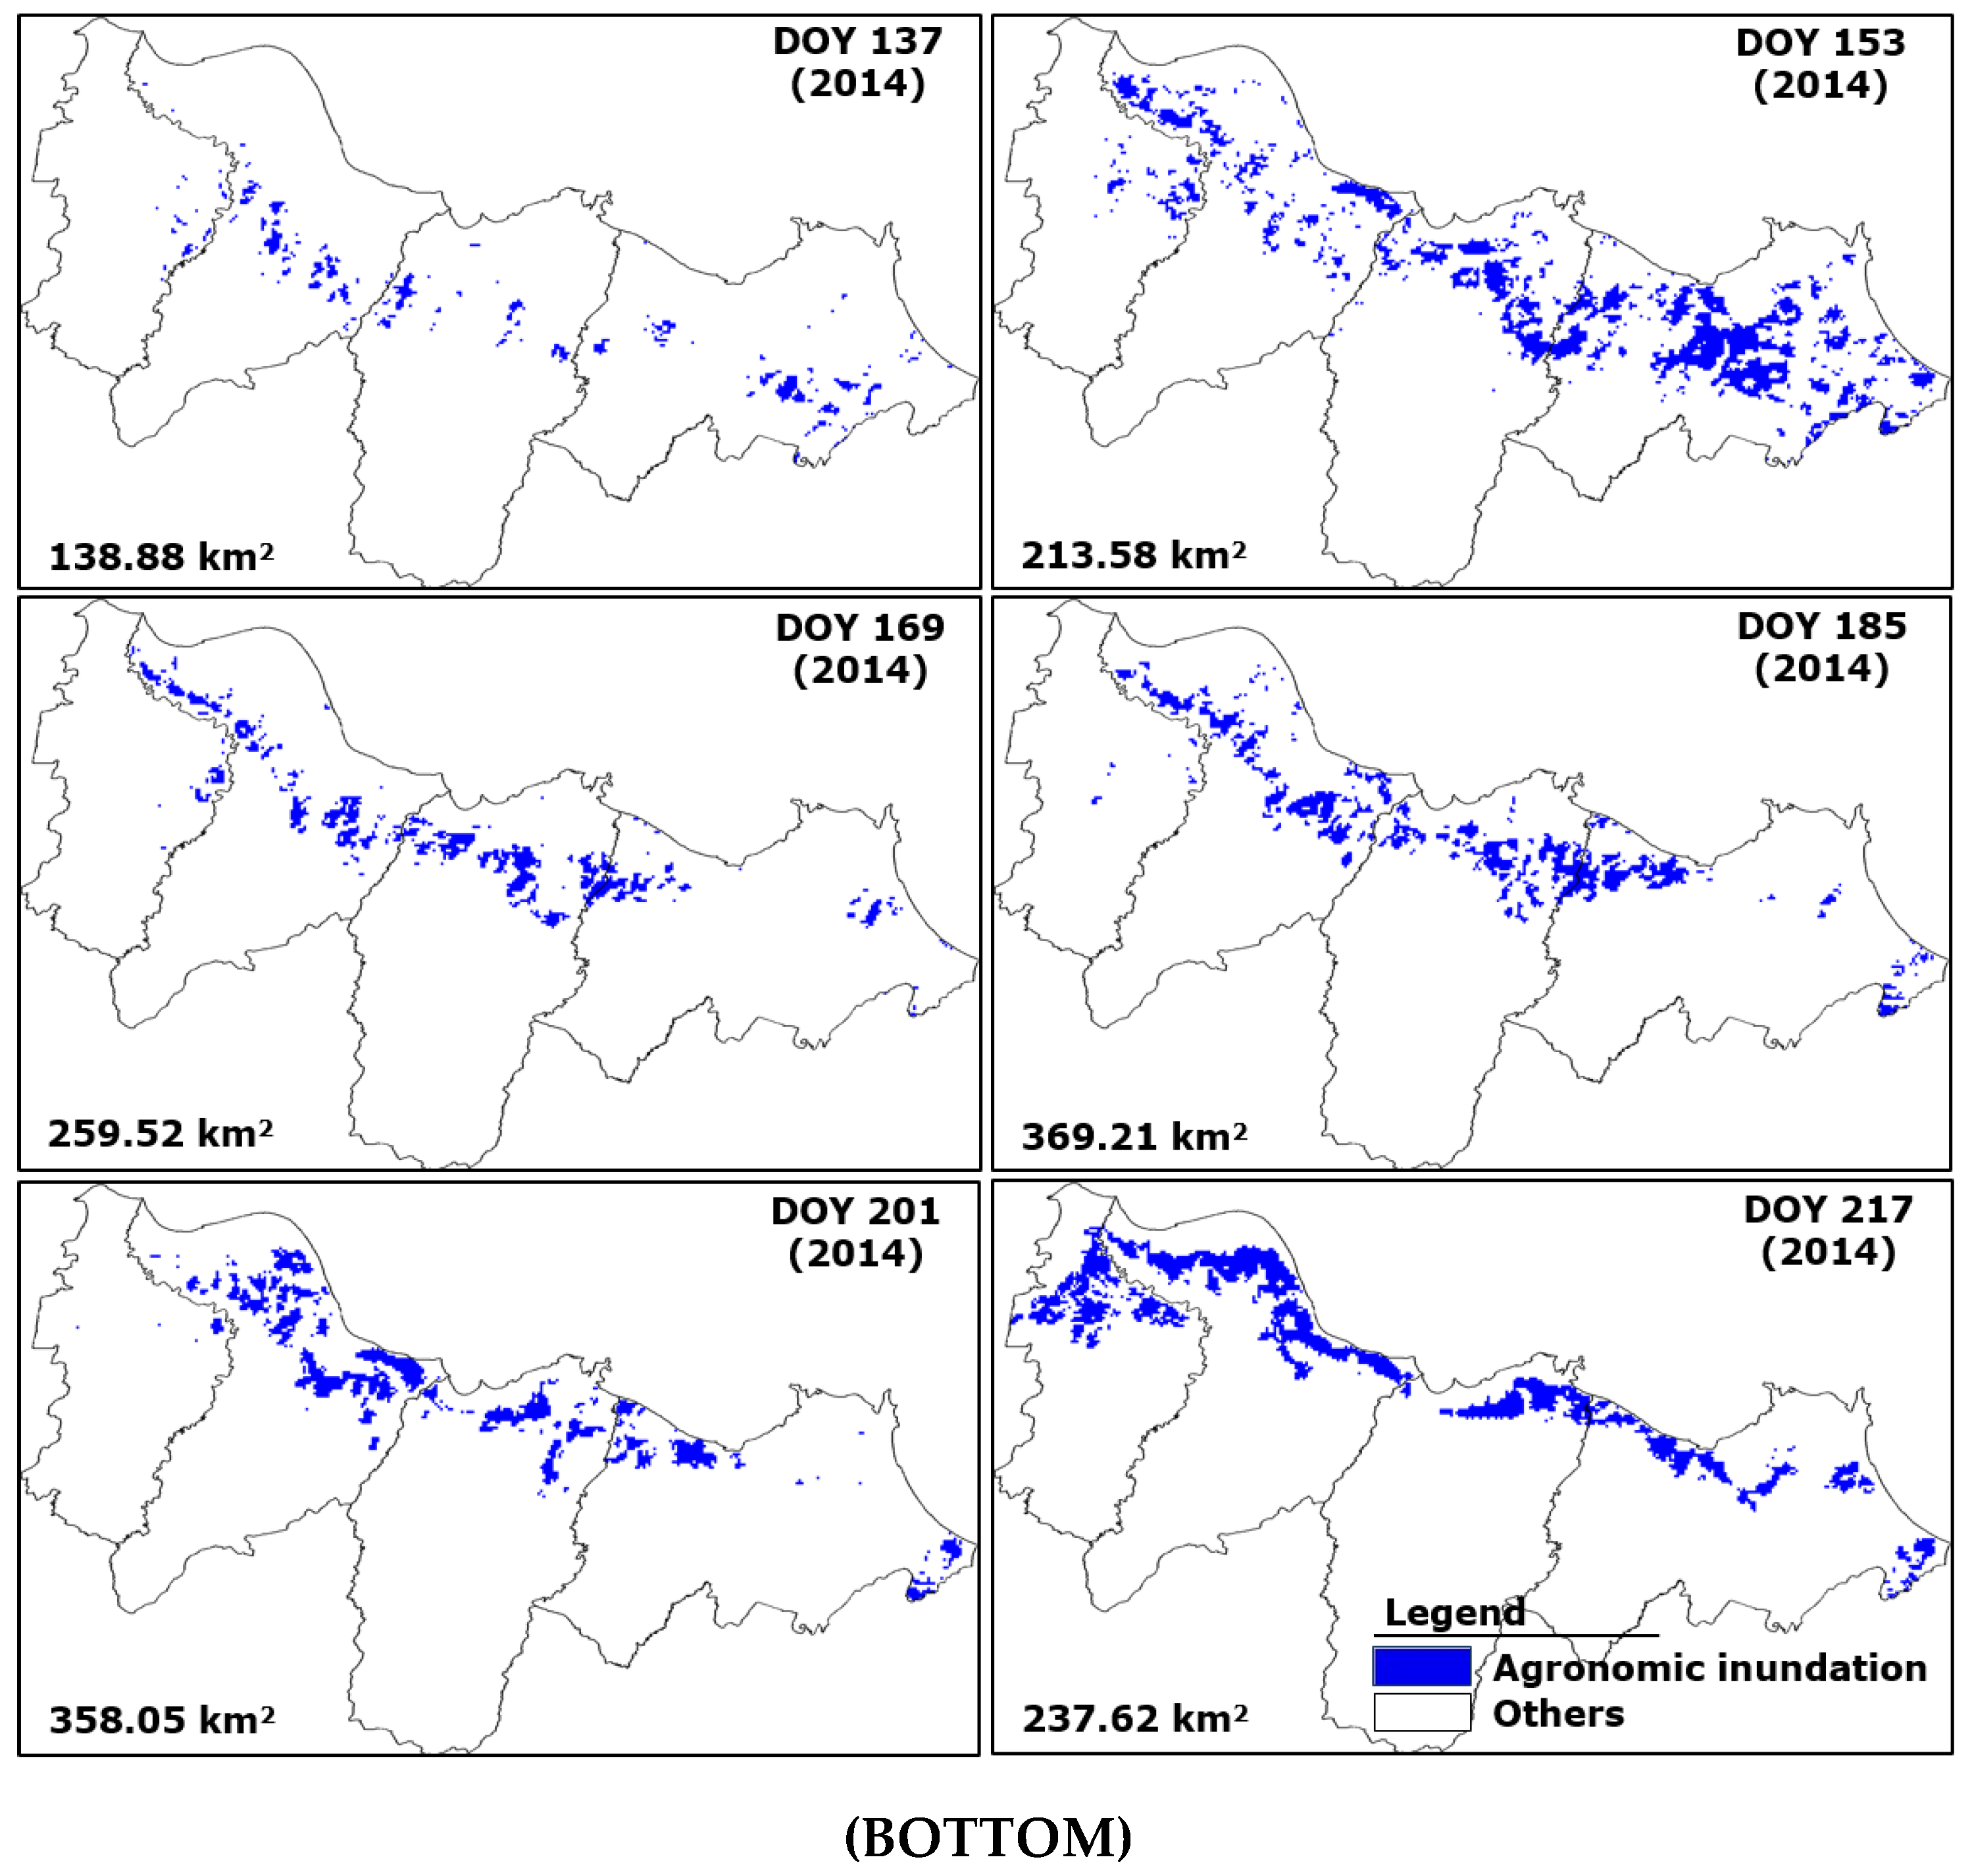
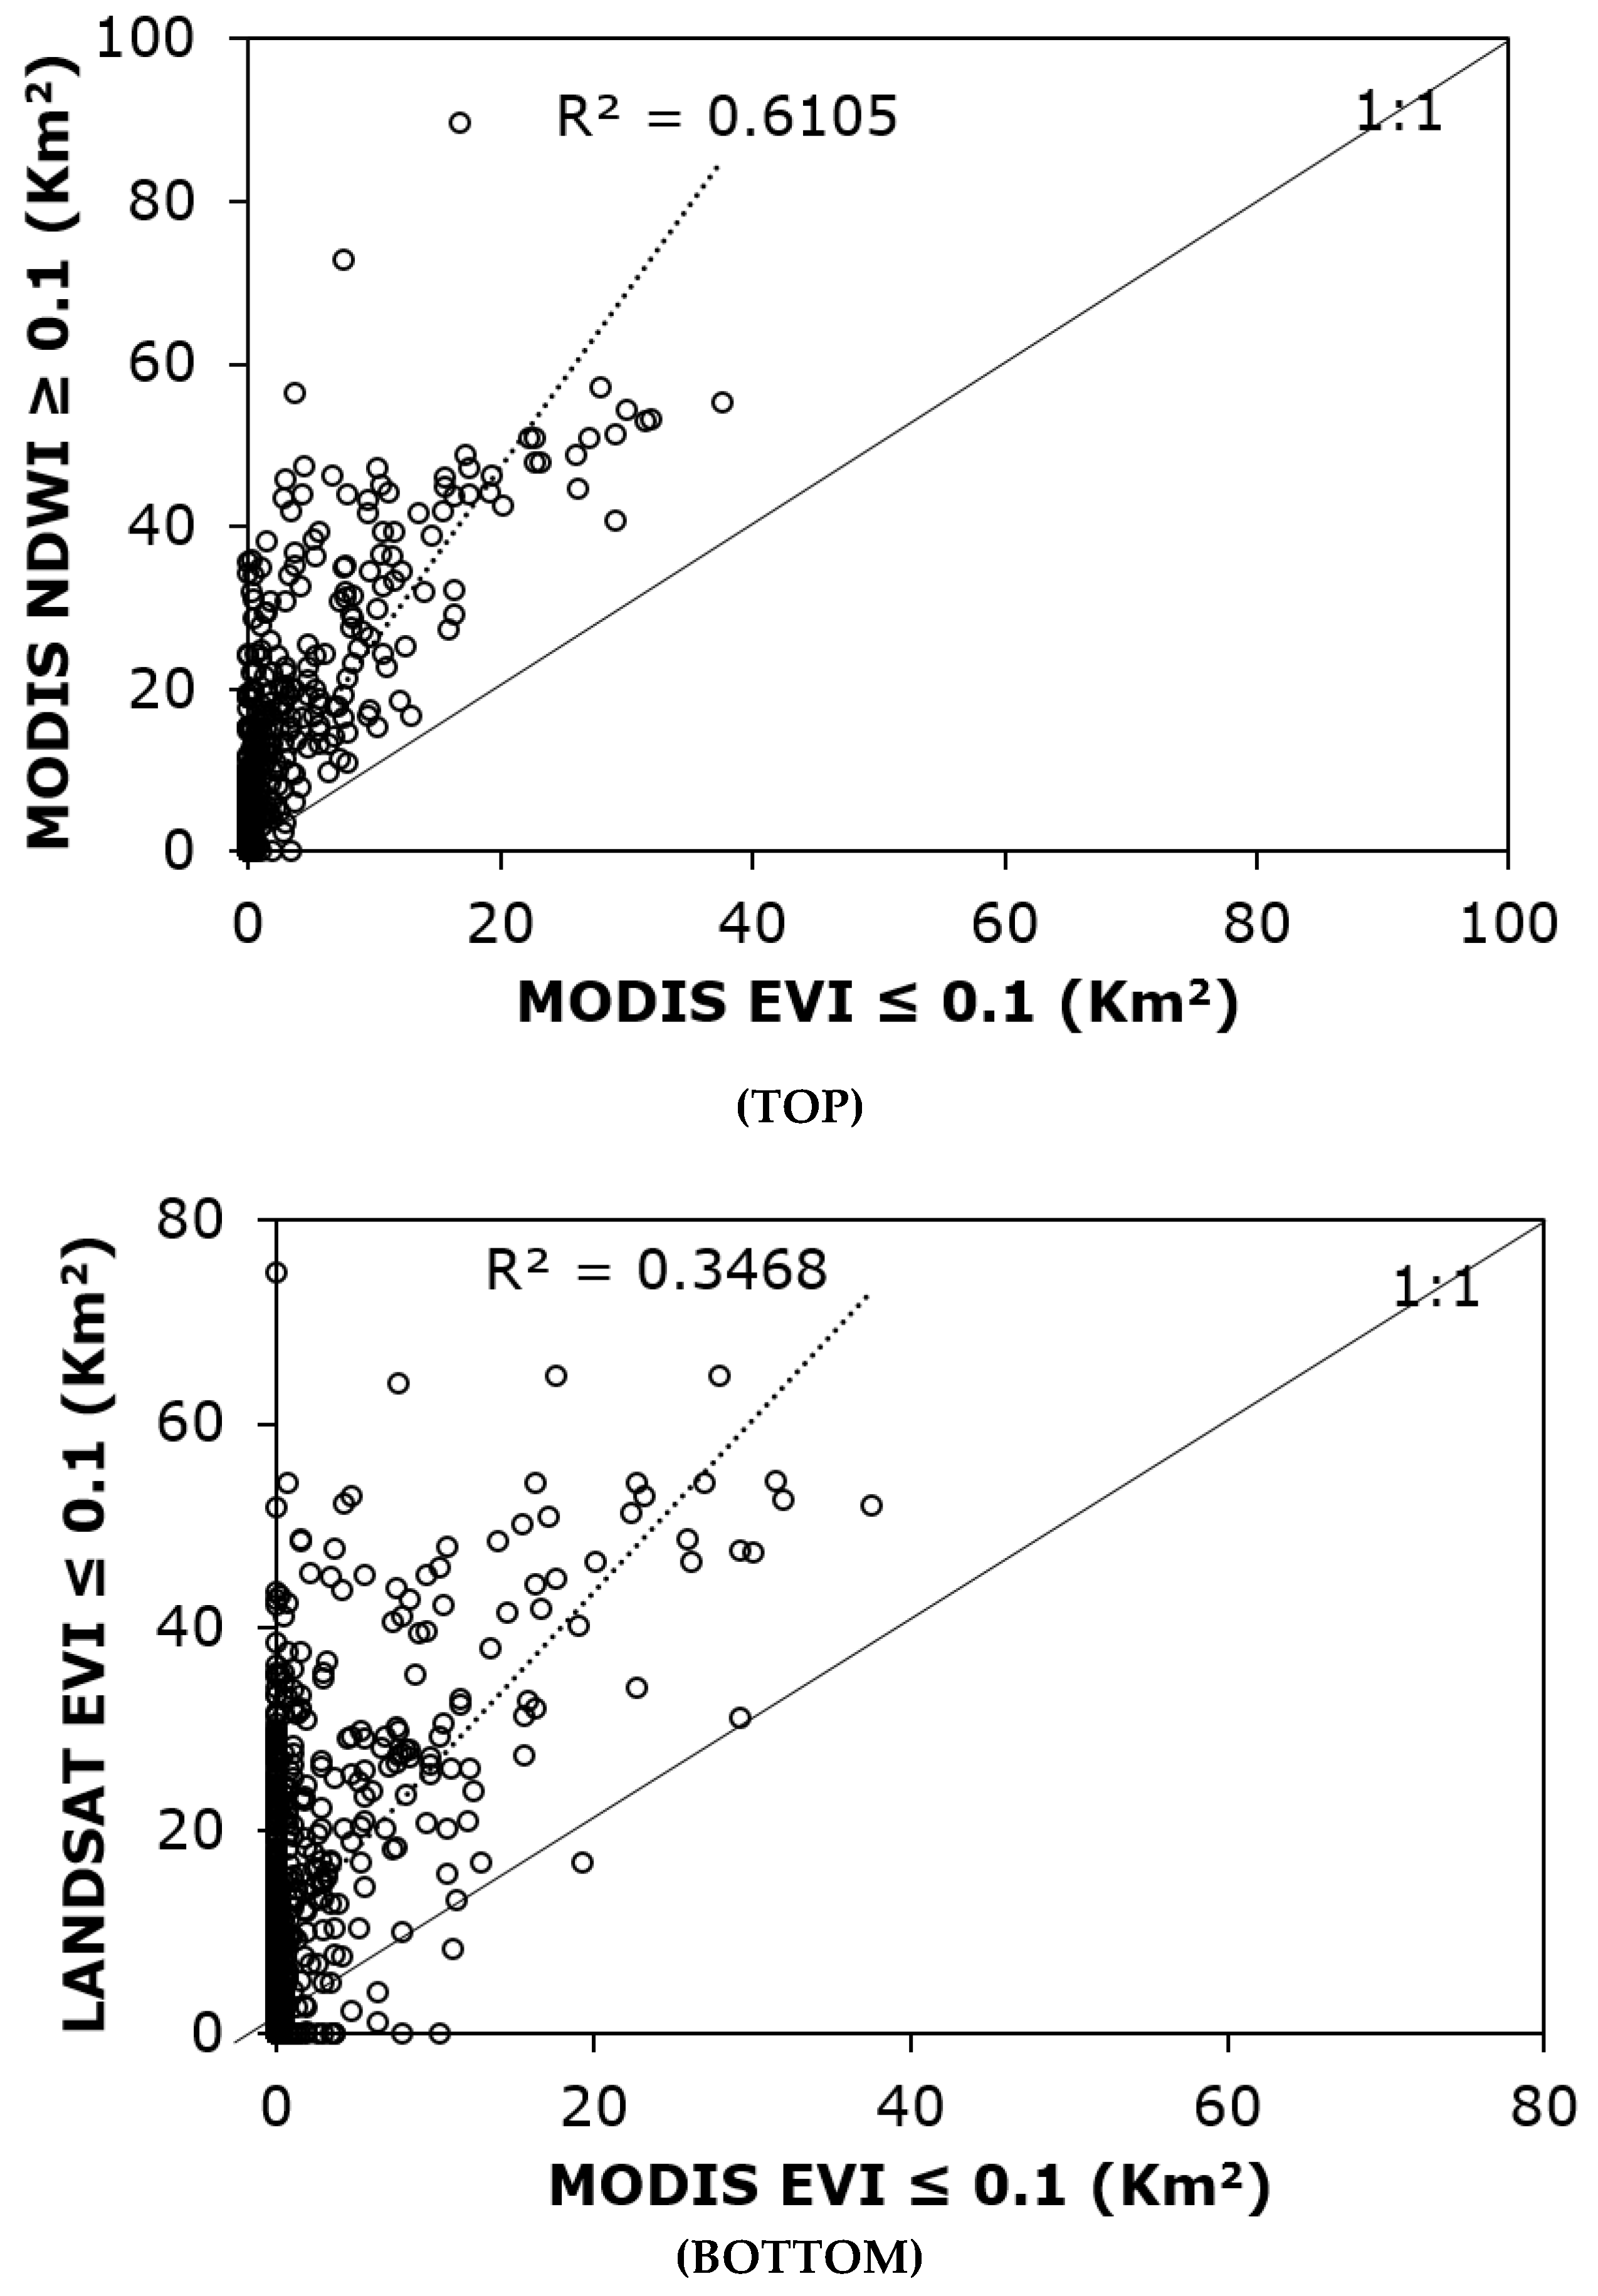
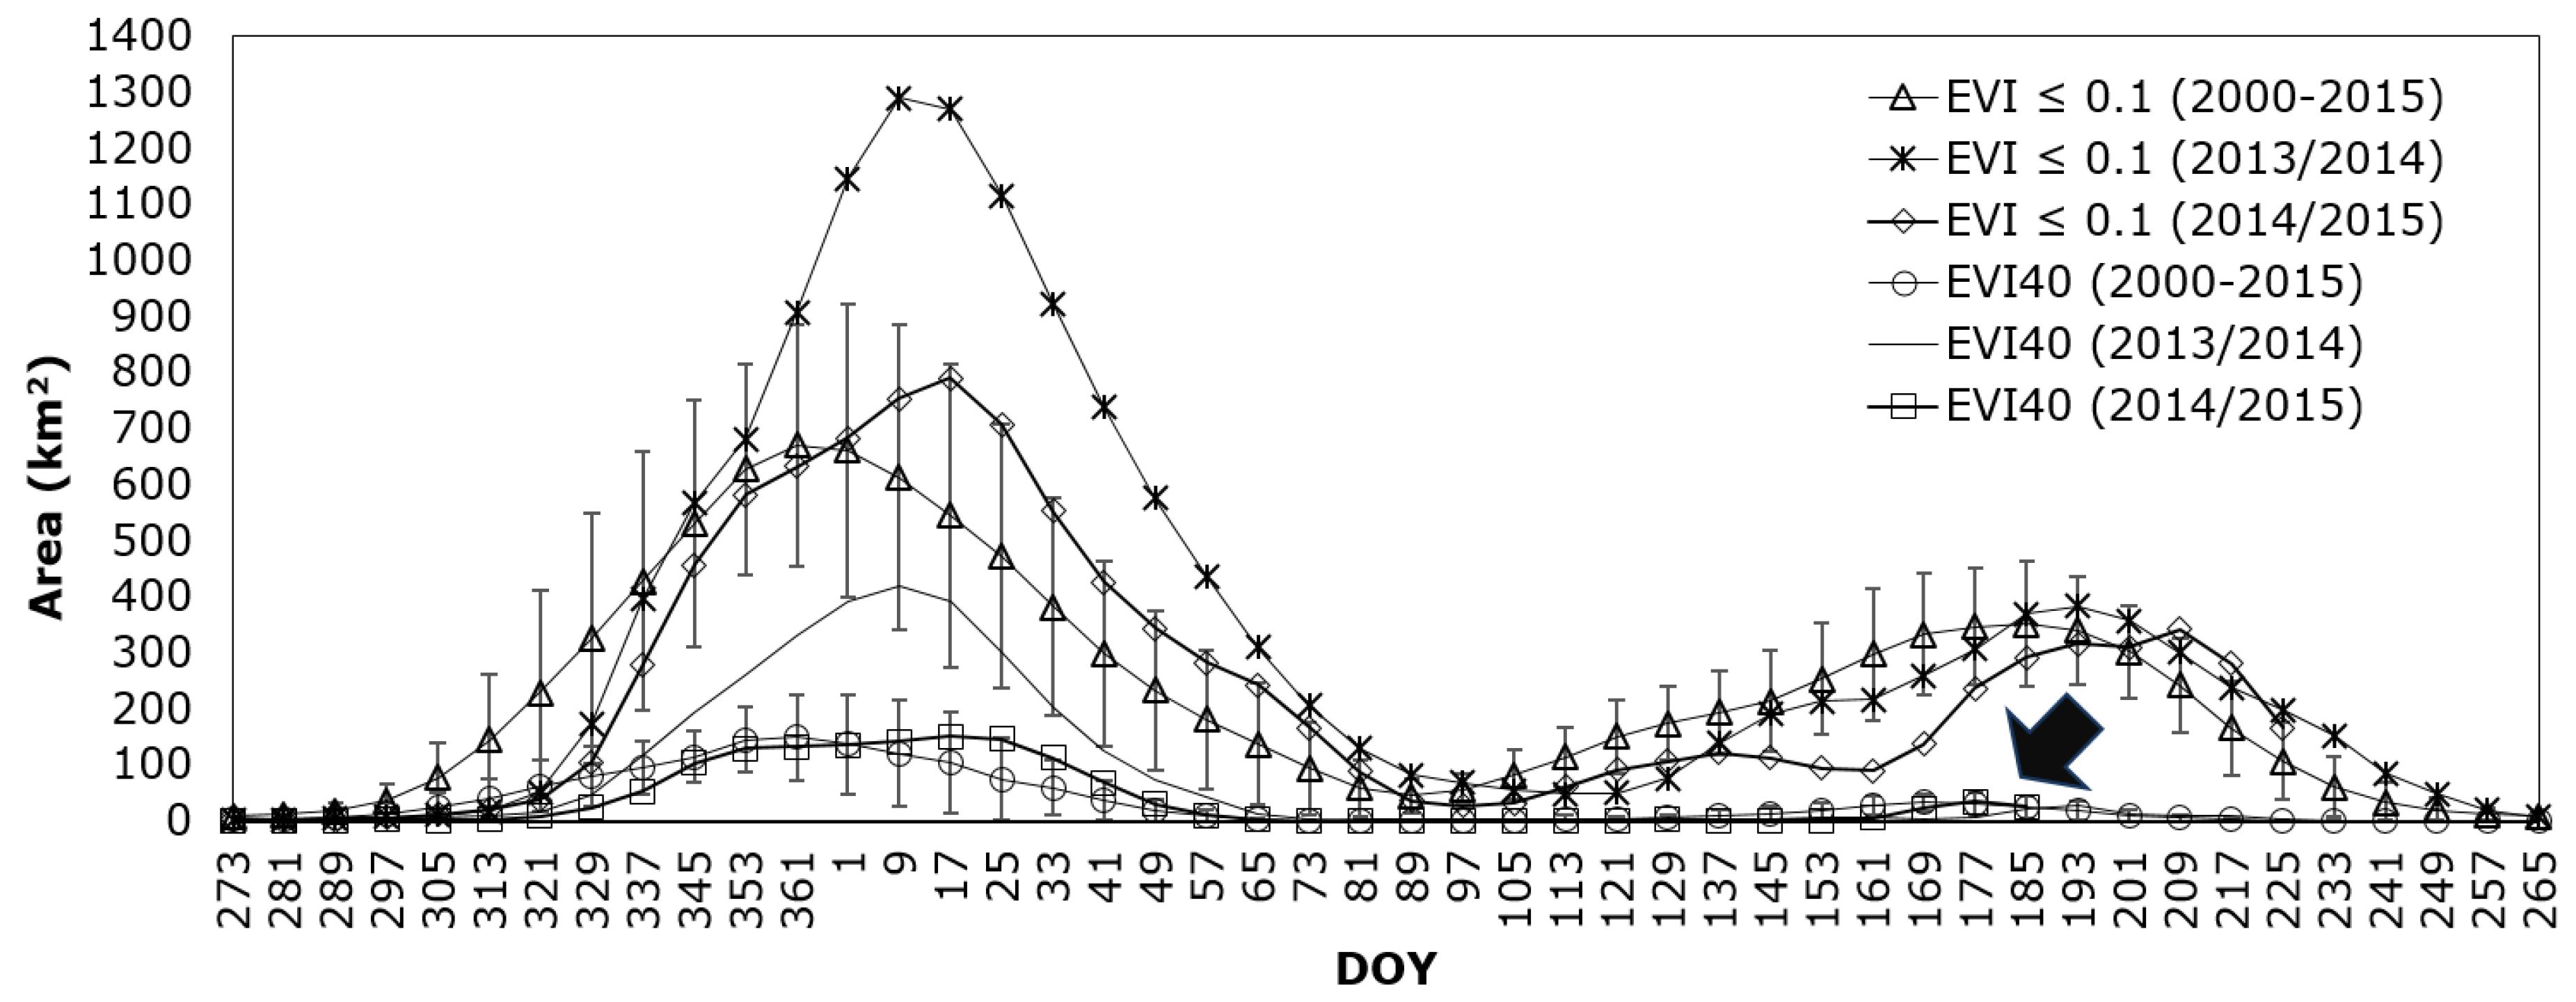
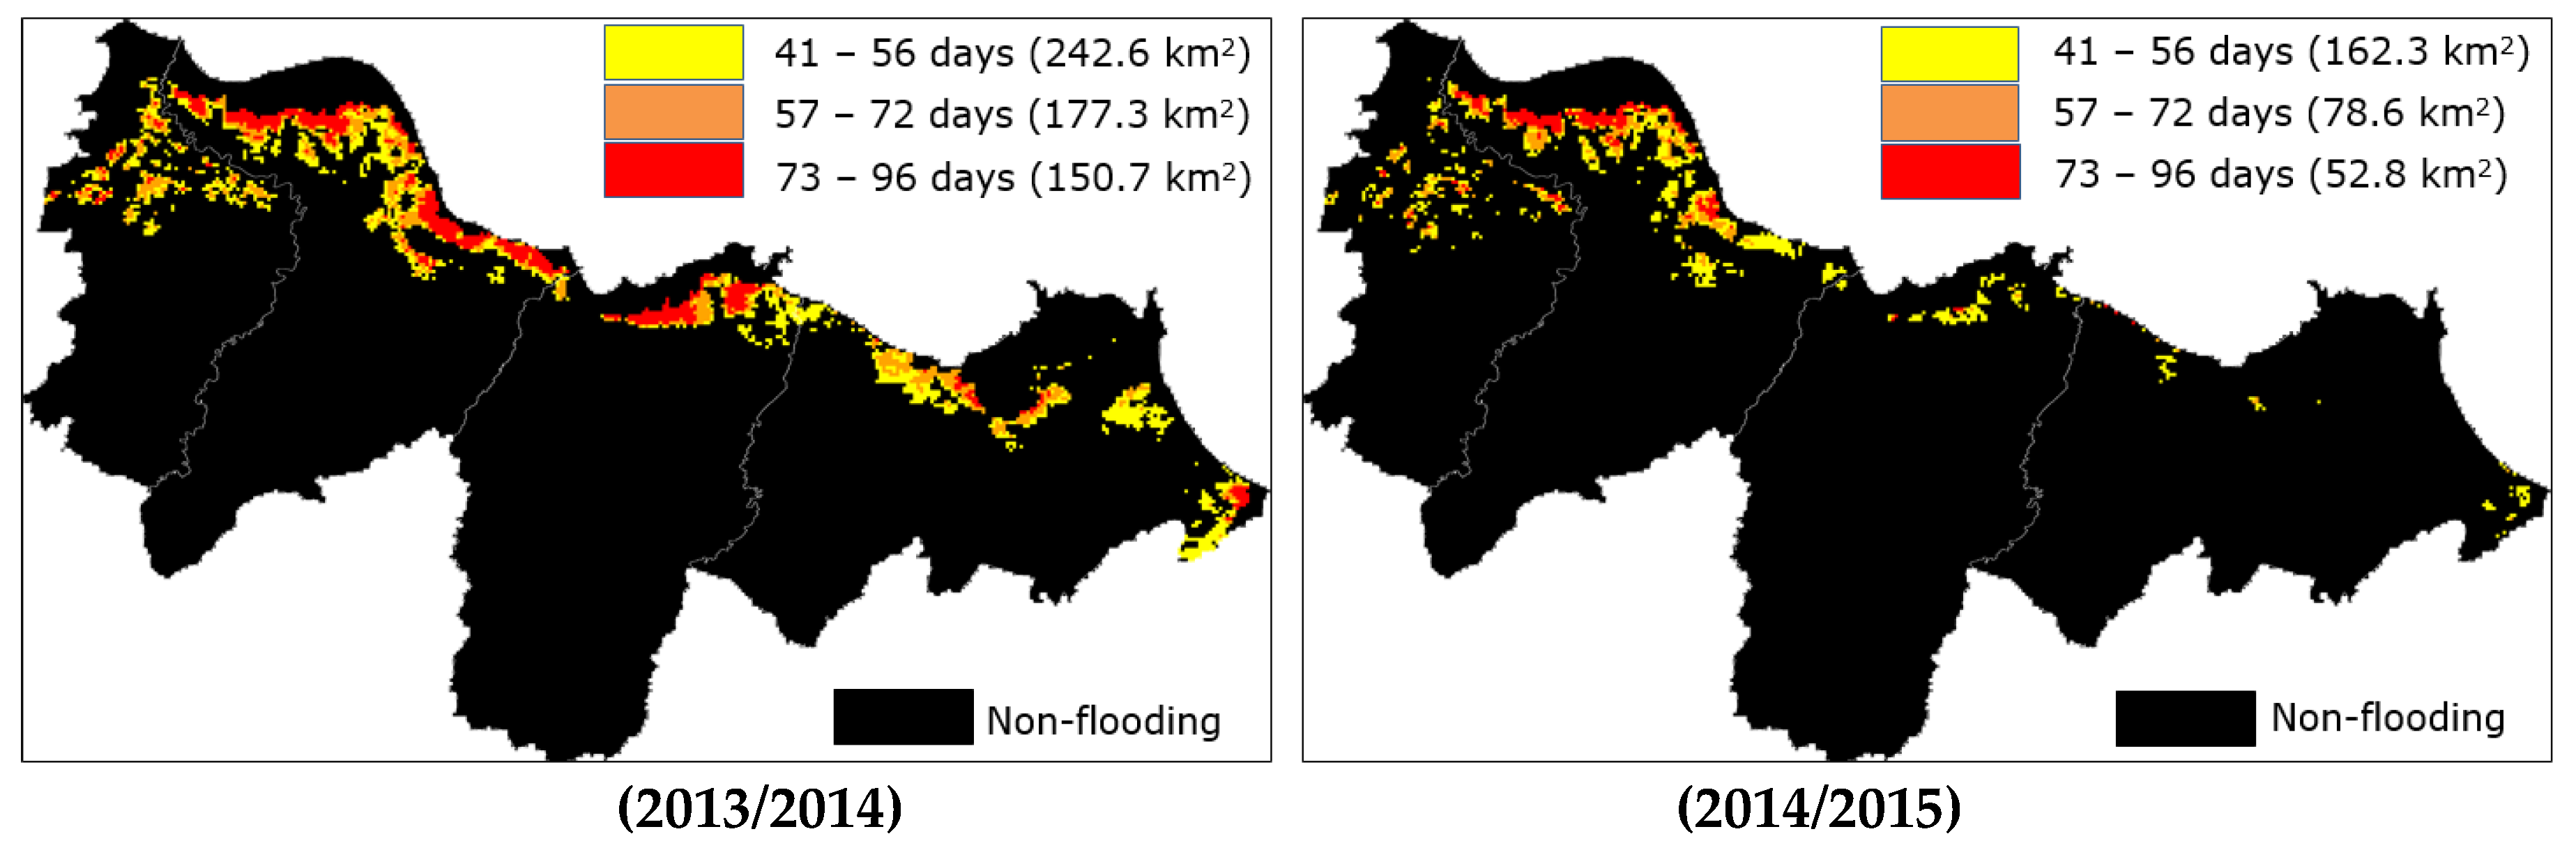
3.3. Comparisons of Surface Water Areas

Figure 6 illustrates time series of surface water maps produced using EVI ≤ 0.1 (Figure 6A) and of flood maps generated from EVI40 (Figure 6B) during DOY 337-49 in wet planting seasons 2013/2014 and 2014/2015 in the focus area (see Figure 1B). Figure 6A demonstrates that EVI ≤ 0.1 cannot distinguish between hazardous flooding and non-hazardous agronomic inundation in rice fields. On the contrary, Figure 6B can show that flooding occurred at the beginning of January (DOY 1) 2014 in the focus area. EVI40 can distinguish between the two surface water types by eliminating the areas of rice fields with agronomic inundation. This finding provides input for detecting rice fields with flooding. Furthermore, Figure 6C exhibits the areas of rice fields with flooding detected using EVI40 aggregated from DOY 337 to 129 in 2013/2014 and 2014/2015. EVI40 exposes the areas of rice fields affected by flooding during the wet planting season 2013/2014. It can be seen that flooding occurred in swampland rice fields during the wet planting season 2014/2015. A plausible reason is the accumulation of surface runoff in swampland rice fields. Additionally, caution should be taken while interpreting the classification results of EVI40. The field observation around DOY 033 in 2015 exposed that flooding in the rice fields (Figure 6B, green circle) was river water deliberately channeled to rice fields to support tillage and an early start of the wet cropping season. This finding suggests that there are situations, mainly influenced by human activities, where the threshold of 40 days is inaccurate.
Figure 7 displays time series of surface water areas detected using EVI ≤ 0.1 and of flooded rice fields identified using EVI40 during 2013/2014, 2014/2015, and long-term average. Compared to those of 2014/2015 and long-term average (2000–2015), EVI ≤ 0.1 and EVI40 detect more extensive areas of surface water (DOY 1–89, t-test: p < 0.05) and flooding (DOY 1–89, t-test: p < 0.05) in 2013/2014, respectively. It is likely that the extreme flood event in January 2014 increased the areas of flooded rice fields during the wet planting season 2013/2014. The duration and extent of flooding are partly influenced by irrigation management, cropping schedules, weather variabilities, and drainage infrastructures. The areas of surface water are the largest in the beginning of January and July for wet and dry planting seasons, respectively. On the contrary, the areas of surface water (DOY 1–89, t-test: p > 0.05) detected using EVI ≤ 0.1 and of flooding (DOY 1–89, t-test: p > 0.05) identified using the EVI40 in the wet planting season 2014/2015 are relatively similar to those of the long-term average (2000–2015).
Furthermore, Figure 7 demonstrates that the areas of surface water detected using the EVI ≤ 0.1 are lesser in dry planting seasons compared to those in wet planting seasons. Several plausible explanations are present for this condition. Firstly, water availability (irrigation water, rainfall, river discharge) and access to irrigation water for irrigating rice fields are higher during wet planting seasons compared to those of dry planting seasons, indicating that not all farmers can perform double-rice cropping pattern in the study area. Secondly, it may partly be related to differences in the land preparation method after fallow between dry and wet planting seasons. After long dry season fallow, rice fields require a massive amount of water and longer inundation duration to fill cracks in the soil before starting wet planting seasons. On the contrary, farmers may directly perform land preparation for dry planting seasons, approximately after one-month fallow. Thirdly, some farmers in the Indramayu district may perform quick dry planting seasons directly after the first harvest to take advantages of soil moisture and intermittent rainfall at the end of wet seasons. These reasons cause variations in soil, water, and vegetation conditions between two seasons, influencing the strength and persistence of signal captured by remotely-sensed data.
It is also worth noticing that Figure 7 shows that small areas of rice fields with agronomic inundation are incorrectly detected as rice fields with flooding (False Positive) using EVI40 during the dry planting season 2014 (black arrow). Several possible reasons exist for the False Positives. Firstly, the misclassification pixels may be related to the dynamics of tidal flood intrusion in irrigated rice fields. The saltwater intrusion in rice fields through river channels is more likely to occur during dry planting seasons because river discharge that pushes the intrusion of sea tide to river channels downstream is limited. The distinction between fresh and sea water in irrigated rice fields is out of the scope of this study. Secondly, the misclassification may be influenced by mixed pixels. The locations of the misclassified pixels mostly are near coastal areas and are adjacent to fish ponds (not shown). It is likely that the reflectance values are influenced by the variations of surface water in fish ponds. Thirdly, misclassified flood pixels may be associated with variations in ponding surface runoff in swampland rice fields. In practice, however, the existence of irrigation water in swampland rice fields is temporary and can be regarded as negligible provided the considerable need for water to support farming practices during dry planting seasons.
Figure 8 shows maps of flood duration produced using EVI40 during DOY 1–89 in wet planting seasons 2013/2014 and 2014/2015. The period of DOY 1–89 is purposefully selected to avoid ‘grey periods’ when surface water that submerges swampland rice fields before or after flooding events can be considered either hazardous or non-hazardous. The elaborations are as follows. Firstly, prior information on the spatial and temporal evolution of hazardous flooding is inadequate. Although Figure 7 demonstrates that the increase in flood area started from the beginning of December 2013 (DOY 337), most farmers agreed that flooding started at the beginning of January 2014 (thus DOY 1 is selected). On the one hand, ponding water during fallow periods can be regarded as hazardous if flooding disrupts cropping schedules. On the other hand, flood events may be considered non-hazardous as some farmers may be accustomed to flooding occurrences within acceptable duration and depth. Secondly, farmers suffered from the flood event mentioned various wet season planting dates. The delays partly regulated by the differences in the flood duration. For example, farmers located at the tail end of irrigation channels in Legonkulon sub-districts (see Figure 1B) reported that the start of the wet planting season was from the middle of March to the beginning of April 2014 (DOY 89).
Figure 8 shows that areas of flooded rice fields in 2013/2014 are more extensive than those in 2014/2015 (t-test: p < 0.05, from 2013 DOY 337 to 2014 DOY 89, see also Figure 7). Rice fields with the most extended flood duration are located mostly in swampland rice fields in the northern part of the study area. It is worth repeating that these rice fields have relatively low elevation and are associated with inadequate drainage systems, causing difficulties for ponded surface runoff to drain. Additionally, flooding that occurs during wet planting seasons can be exacerbated by the high tide that slows the flood retreat or brings sea water into rice fields. Furthermore, total flooded rice field areas in 2014/2015 and long-term average are relatively similar (see Figure 7). However, the extent and duration of flooding in 2014/2015 may not represent those of long-term average (2000–2015). The reasons are related to the spatial and temporal variations of surface water, drainage conditions, and weather variabilities.

3.4. Accuracy Assessment

Table 5 and Table 6 show the confusion matrix and error matrix of flood maps produced using EVI40 during DOY 1–89 in the wet planting season 2013/2014, respectively. Using respondents reports on flood locations, Table 5 shows that the OA is 80.5% and Kappa is 60.16%. Furthermore, the comparison of planting dates between the wet planting season 2013/2014 and long-term average (2000–2015) shows that the OA and F1 scores are 75.96% and 81.74%, respectively. The OA and F1 scores are partly related to the influences of the natural environment (e.g., geographic location), human decisions (e.g., irrigation management and inadequate drainage systems), and mixed pixels. The likelihood of accurately detecting flooding in rice fields is relatively high, with True Positive Rate 82.49–83.30%. It can thus be inferred that flooding water mostly originates from ponding surface water. The ability of the test to correctly identified agronomic inundation within rice fields with agronomic inundation is 63.72–78.71%. Furthermore, the False Positive Rate suggests that the likelihood that rice fields with agronomic inundation are incorrectly detected as rice fields with flooding is 21.29–36.28%. The True Negative and False Positive Rates may be related to farmers’ behavior in managing irrigation water. The likelihood of rice fields with flooding that are incorrectly detected as rice fields with agronomic inundation (False Negative Rate) is 16.7–17.51%. A plausible explanation may be the coping capacity of farmers. Some farmers can mobilize resources to reduce the flood impact on planting dates [35]. Another reason might be due to mixed pixel problems associated with moderate spatial resolution of MOD09A1. Finally, the likelihood of detections that are actually flooding or agronomic inundation given the positive and negative results are 71.2–81% (Positive Predictive Value) and 65.99–88.2% (Negative Predictive Value), respectively.

4. Discussion

A robust flood detection method is critical for monitoring flood-affected irrigated rice fields. Previous studies have frequently been using EVI ≤ 0.1 derived from time-series MODIS 8-day 500-m spatial resolution (MOD09A1) to detect hazardous spatiotemporal flooding in irrigated rice fields [4,5,6]. This study aims to distinguish between hazardous flooding and non-hazardous flooding. In doing so, this study tests the applicability of the EVI to detect hazardous flooding in irrigated rice fields with complex cropping patterns in West Java, Indonesia. However, the study finds that it is crucial to determine the nature of surface water before using the EVI or, possibly, any spectral indices to directly detect flood-affected areas in irrigated rice fields with complex cropping patterns. Ancillary information is required to support the remotely-sensed data to enable the discrimination between hazardous and non-hazardous surface water in the irrigated rice fields. Without sufficient information such as surface water dynamics, flood extent, or rice growing stages, the direct use of the EVI to detect hazardous flooding in irrigated rice fields may result in overestimations or underestimations and misinterpretations of flood-affected irrigated rice field areas. Thus, the detection of hazardous flooding using remote sensing imageries in irrigated rice fields with complex cropping patterns, where agronomic inundation and flooding may be detected at the same time, should not be started with the selection of spectral indices or optimization of thresholds to reduce false positives or negatives. Such procedures should be taken into consideration if the nature of surface water in irrigated rice fields is known.
Several limitations of the study are also identified. Firstly, the long-term average EVI is sensitive to outlier values resulting from various environmental and socioeconomic factors. For example, frequent extreme wet years and changes in irrigation management policies may influence the identification of SOSs from long-term average EVI profiles. However, the use of long-term average time series as a reference for ‘normal’ farming practices is justified provided that farmers, extension officers, and water managers may have different perceptions on normal cropping schedules. Secondly, this study used an unsupervised clustering method to generate rice field areas. Although the analysis incorporates long-term variabilities, the spatial extent of rice fields is not changing during the analysis. Further studies that incorporate changes in rice cultivation areas during wet and dry planting seasons may improve the results. Thirdly, the additional 40-day threshold is determined based on the duration of land preparation and transplanting activities. Procedures for and duration of land preparation and transplanting activities are relatively the same while differences in irrigation management settings may exist in many rice-producing regions in Asia. Thus, the method is transferable to other rice-producing regions; however, fieldwork to obtain ground data about surface water dynamics to calibrate EVI40 may be required before the method can be applied to distinguish between hazardous flooding and non-hazardous agronomic inundation in other irrigated rice fields. Fourthly, flood locations used to validate the flood map were obtained from respondents’ reports. The data collection was performed from October 2014 to February 2015. While some farmers provided reliable data on the extreme flood event, it is possible that personal bias influenced responses from some farmers. Finally, this study uses time-series moderate spatial resolution imageries to derive flood areas. The use of higher spatial resolution imageries is expected to increase the study result. Despite the limitations, EVI40 has successfully distinguished rice fields with flooding from rice fields with agronomic inundation in irrigated rice fields in West Java.

5. Conclusions

Detecting hazardous flooding in irrigated rice fields with complex cropping patterns is not straightforward. The spatial and temporal dynamics, such as surface water, rice growing stages, and farming practices, in the rice fields need to be taken into account. This study has successfully proposed a relatively simple method to distinguish between hazardous flooding and non-hazardous agronomic inundation using time-series MOD09A1 in irrigated rice fields with complex cropping patterns. In contrary to previous studies, this study found that the sole use of EVI ≤ 0.1 is insufficient to distinguish between hazardous flooding and non-hazardous agronomic inundation in the rice fields, such as those in northern districts of West Java, Indonesia. EVI ≤ 0.1 detects both non-hazardous agronomic inundation and hazardous flooding at the same time during wet planting seasons. Furthermore, a new threshold called EVI40 has been developed, which is an extension of EVI ≤ 0.1 with an additional 40-day duration allocated for land preparation and transplanting activities. This study has demonstrated that EVI40 could overcome the overestimation of flood areas suffered by EVI ≤ 0.1 by reducing the detection of rice fields with agronomic inundation areas. The flooded areas are mostly detected in swampland rice fields in the northern regions of the study area, which is in line with the interviews with stakeholders and delays in the start of rainy planting seasons. The results of this study has provided an input for improving flood detection in irrigated rice fields with complex cropping patterns and can be used by agricultural or disaster risk management institutions for investigating flood prone irrigated rice fields in other rice-producing regions.

Author Contributions

R.S.S. processed the data and wrote the paper. V.G.J., J.E., and J.S. contributed important considerations, discussion and research ideas.

Funding

This research was funded by Beasiswa Pendidikan Indonesia Lembaga Pengelola Dana Pendidikan (BPI LPDP).

Acknowledgments

We thank extension officers, water managers, and farmers in irrigated rice fields served by Ir. Djuanda reservoir in West Java for supporting this study. We thank anonymous reviewers for their valuable insights to improve the quality of the paper.

Conflicts of Interest

The authors declare no conflict of interest.

References

  1. Smith, L.C. Satellite remote sensing of river inundation area, stage, and discharge: A review. Hydrol. Process 1997, 11, 1427–1439. [Google Scholar] [CrossRef]
  2. Plate, E.J. Flood risk and flood management. J. Hydrol. 2002, 267, 2–11. [Google Scholar] [CrossRef]
  3. Klijn, F.; Kreibich, H.; de Moel, H.; Penning-Rowsell, E. Adaptive flood risk management planning based on a comprehensive flood risk conceptualisation. Mitig. Adapt. Strateg. Glob. Chang. 2015, 20, 845–864. [Google Scholar] [CrossRef]
  4. Sakamoto, T.; Van Nguyen, N.; Kotera, A.; Ohno, H.; Ishitsuka, N.; Yokozawa, M. Detecting temporal changes in the extent of annual flooding within the cambodia and the vietnamese mekong delta from MODIS time-series imagery. Remote Sens. Environ. 2007, 109, 295–313. [Google Scholar] [CrossRef]
  5. Son, N.T.; Chena, C.F.; Chen, C.R.; Chang, L.Y. Satellite-based investigation of flood-affected rice cultivation areas in Chao Phraya River Delta, Thailand. ISPRS J. Photogramm. Remote Sens. 2013, 86, 77–88. [Google Scholar] [CrossRef]
  6. Islam, A.S.; Bala, S.K.; Haque, M.A. Flood Inundation map of Bangladesh using MODIS time-series images. J. Flood Risk Manag. 2010, 3, 210–222. [Google Scholar] [CrossRef]
  7. Gao, B.-C. NDWI—A normalized difference water index for remote sensing of vegetation liquid water from space. Remote Sens. Environ. 1996, 58, 257–266. [Google Scholar] [CrossRef]
  8. McFeeters, S.K. The use of the normalized difference water index (NDWI) in the delineation of open water features. Int. J. Remote Sens. 1996, 17, 1425–1432. [Google Scholar] [CrossRef]
  9. Rogers, A.S.; Kearney, M.S. Reducing signature variability in unmixing coastal marsh thematic mapper scenes using spectral indices. Int. J. Remote Sens. 2004, 25, 2317–2335. [Google Scholar] [CrossRef]
  10. Kwak, Y.; Park, J.; Fukami, K. Estimating floodwater from MODIS time series and SRTM DEM data. Artif. Life Robot. 2014, 19, 95–102. [Google Scholar] [CrossRef]
  11. Xiao, X.; Boles, S.; Frolking, S.; Li, C.; Babu, J.Y.; Salas, W.; Moore, B., III. Mapping paddy rice agriculture in south and southeast Asia using multi-temporal MODIS images. Remote Sens. Environ. 2006, 100, 95–113. [Google Scholar] [CrossRef]
  12. Nguyen, T.T.H.; De Bie, C.A.J.M.; Ali, A.; Smaling, E.M.A.; Chu, T.H. Mapping the irrigated rice cropping patterns of the Mekong delta, Vietnam, through hyper-temporal SPOT NDVI image analysis. Int. J. Remote Sens. 2011, 33, 415–434. [Google Scholar] [CrossRef]
  13. Rouse, J.W.; Hass, R.H.; Schell, J.A.; Deering, D.W. Monitoring vegetation systems in the Great Plains with ERTS. In Proceedings of the 3rd Earth Resources Technology Satellite-1 Symposium, Washington, DC, USA, 10–14 December 1973; pp. 309–317. [Google Scholar]
  14. Gao, X.; Huete, A.R.; Ni, W.; Miura, T. Optical–biophysical relationships of vegetation spectra without background contamination. Remote Sens. Environ. 2000, 74, 609–620. [Google Scholar] [CrossRef]
  15. Huete, A.R.; Liu, H.Q.; Batchily, K.; Leeuwen, W.V. A comparison of vegetation indices over a global set of TM images for EOS-MODIS. Remote Sens. Environ. 1997, 59, 440–451. [Google Scholar] [CrossRef]
  16. Huete, A.; Didan, K.; Miura, T.; Rodriguez, E.P.; Gao, X.; Ferreira, L.G. Overview of the radiometric and biophysical performance of the MODIS vegetation indices. Remote Sens. Environ. 2002, 83, 195–213. [Google Scholar] [CrossRef]
  17. Miura, T.; Huete, A.R.; Yoshioka, H.; Holben, B.N. An error and sensitivity analysis of atmospheric resistant vegetation indices derived from dark target-based atmospheric correction. Remote Sens. Environ. 2001, 78, 284–298. [Google Scholar] [CrossRef]
  18. Jiang, Z.; Huete, A.R.; Didan, K.; Miura, T. Development of a two-band enhanced vegetation index without a blue band. Remote Sens. Environ. 2008, 112, 3833–3845. [Google Scholar] [CrossRef]
  19. Martinis, S.; Twele, A.; Strobl, C.; Kersten, J.; Stein, E. A multi-scale flood monitoring system based on fully automatic MODIS and TerraSAR-X processing chains. Remote Sens. 2013, 5, 5598–5619. [Google Scholar] [CrossRef] [Green Version]
  20. Ji, L.; Zhang, L.; Wylie, B. Analysis of dynamic thresholds for the normalized difference water index. J. Am. Soc. Photogramm. Remote Sens. 2009, 75, 1307–1317. [Google Scholar] [CrossRef]
  21. Sanyal, J.; Lu, X.X. Application of remote sensing in flood management with special reference to Monsoon Asia: A review. Nat. Hazards 2004, 33, 283–301. [Google Scholar] [CrossRef]
  22. Xiao, X.; Boles, S.; Liu, J.; Zhuang, D.; Frolking, S.; Li, C.; Salas, W.; Moore, B., III. Mapping paddy rice agriculture in southern China using multi-temporal MODIS images. Remote Sens. Environ. 2005, 95, 480–492. [Google Scholar] [CrossRef]
  23. Peng, D.; Huete, A.R.; Huang, J.; Wang, F.; Sun, H. Detection and estimation of mixed paddy rice cropping patterns with MODIS data. Int. J. Appl. Earth Obs. Geoinf. 2011, 13, 13–23. [Google Scholar] [CrossRef]
  24. Powell, S.J.; Jakeman, A.; Croke, B. Can NDVI response indicate the effective flood extent in macrophyte dominated floodplain wetlands? Ecol. Indic. 2014, 45, 486–493. [Google Scholar] [CrossRef]
  25. Boschetti, M.; Nutini, F.; Manfron, G.; Brivio, P.A.; Nelson, A. Comparative analysis of normalised difference spectral indices derived from MODIS for detecting surface water in flooded rice cropping systems. PLoS ONE 2014, 9, e88741. [Google Scholar] [CrossRef] [PubMed]
  26. Qiao, C.; Luo, J.; Sheng, Y.; Shen, Z.; Zhu, Z.; Ming, D. An adaptive water extraction method from remote sensing image based on NDWI. J. Indian Soc. Remote Sens. 2012, 40, 421–433. [Google Scholar] [CrossRef]
  27. Xiao, X.; Boles, S.; Frolking, S.; Salas, W.; Moore, B.; Li, C.; He, L.; Zhao, R. Observation of flooding and rice transplanting of paddy rice fields at the site to landscape scales in China using vegetation sensor data. Int. J. Remote Sens. 2002, 23, 3009–3022. [Google Scholar] [CrossRef]
  28. Massey, J.H.; Walker, T.W.; Anders, M.M.; Smith, M.C.; Avila, L.A. Farmer adaptation of intermittent flooding using multiple-inlet rice irrigation in Mississippi. Agric. Water Manag. 2014, 146, 297–304. [Google Scholar] [CrossRef]
  29. Qin, Y.; Xiao, X.; Dong, J.; Zhou, Y.; Zhu, Z.; Zhang, G.; Du, G.; Jin, C.; Kou, W.; Wang, J.; et al. Mapping paddy rice planting area in cold temperate climate region through analysis of time series Landsat 8 (OLI), Landsat 7 (ETM+) and MODIS imagery. ISPRS J. Photogramm. Remote Sens. 2015, 105, 220–233. [Google Scholar] [CrossRef] [PubMed] [Green Version]
  30. Dong, J.; Xiao, X.; Menarguez, M.A.; Zhang, G.; Qin, Y.; Thau, D.; Biradar, C.; Moore, B., III. Mapping paddy rice planting area in Northeastern Asia with Landsat 8 images, phenology-based algorithm and google earth engine. Remote Sens. Environ. 2016, 185, 142–154. [Google Scholar] [CrossRef] [PubMed]
  31. Datta, S.K.D. Principles and Practices of Rice Production; John Wiley & Sons: New York, NY, USA, 1981. [Google Scholar]
  32. Chau, V.N.; Holland, J.; Cassells, S.; Tuohy, M. Using GIS to map impacts upon agriculture from extreme floods in Vietnam. Appl. Geogr. 2013, 41, 65–74. [Google Scholar] [CrossRef]
  33. Mandal, R. Flood, cropping pattern choice and returns in agriculture: A study of Assam plains, India. Econ. Anal. Policy 2014, 44, 333–344. [Google Scholar] [CrossRef]
  34. Coomes, O.T.; Lapointe, M.; Templeton, M.; List, G. Amazon River flow regime and flood recessional agriculture: Flood stage reversals and risk of annual crop loss. J. Hydrol. 2016, 539, 214–222. [Google Scholar] [CrossRef]
  35. Sianturi, R.; Jetten, V. Towards understanding vulnerability: Investigating disruptions in cropping schedules in irrigated rice fields in west java. Int. J. Disaster Risk Reduct. 2018, 28, 335–349. [Google Scholar] [CrossRef]
  36. Qian, J.-H.; Robertson, A.W.; Moron, V. Interactions among ENSO, the monsoon, and diurnal cycle in rainfall variability over Java, Indonesia. J. Atmos. Sci. 2010, 67, 3509–3524. [Google Scholar] [CrossRef]
  37. Nuryanto, D.E.; Pawitan, H.; Hidayat, R.; Aldrian, E. Heavy rainfall distributions over java sea in wet season. Procedia Environ. Sci. 2016, 33, 178–186. [Google Scholar] [CrossRef]
  38. Sianturi, R.; Jetten, V.G.; Sartohadi, J. Mapping cropping patterns in irrigated rice fields in west java: Towards mapping vulnerability to flooding using time-series MODIS imageries. Int. J. Appl. Earth Obs. Geoinf. 2018, 66, 1–13. [Google Scholar] [CrossRef]
  39. Ali, A.; de Bie, C.A.J.M.; Skidmore, A.K. Detecting long-duration cloud contamination in hyper-temporal ndvi imagery. Int. J. Appl. Earth Obs. Geoinf. 2013, 24, 22–31. [Google Scholar] [CrossRef]
  40. Ali, A.; de Bie, C.A.J.M.; Skidmore, A.K.; Scarrott, R.G.; Lymberakis, P. Mapping the heterogeneity of natural and semi-natural landscapes. Int. J. Appl. Earth Obs. Geoinf. 2014, 26, 176–183. [Google Scholar] [CrossRef]
  41. Khan, M.R.; de Bie, C.A.J.M.; van Keulen, H.; Smaling, E.M.A.; Real, R. Disaggregating and mapping crop statistics using hypertemporal remote sensing. Int. J. Appl. Earth Obs. Geoinf. 2010, 12, 36–46. [Google Scholar] [CrossRef]
  42. Bie, C.A.J.M.D.; Nguyen, T.T.H.; Ali, A.; Scarrott, R.; Skidmore, A.K. Lahma: A landscape heterogeneity mapping method using hyper-temporal dataset. Int. J. Geogr. Inf. Sci. 2012, 26, 2177–2192. [Google Scholar] [CrossRef]
  43. Memon, A.A.; Muhammad, S.; Rahman, S.; Haq, M. Flood monitoring and damage assessment using water indices: A case study of pakistan flood-2012. Egypt. J. Remote Sens. Space Sci. 2015, 18, 99–106. [Google Scholar] [CrossRef]
  44. Campbell, J.B.; Wynne, R.H. Introduction to Remote Sensing, 5th ed.; The Guilford Press: New York, NY, USA, 2011. [Google Scholar]
  45. Congalton, R.G. A review of assessing the accuracy of classifications of remotely sensed data. Remote Sens. Environ. 1991, 37, 35–46. [Google Scholar] [CrossRef]
  46. Foody, G.M. Status of land cover classification accuracy assessment. Remote Sens. Environ. 2002, 80, 185–201. [Google Scholar] [CrossRef]
  47. Li, W.; Guo, Q. A new accuracy assessment method for one-class remote sensing classification. IEEE Trans. Geosci. Remote Sens. 2014, 52, 4621–4632. [Google Scholar]
  48. Powers, D.M.W. Evaluation: From precision, recall and f-measure to roc, informedness, markedness & correlation. J. Mach. Learn. Technol. 2011, 2, 37–63. [Google Scholar]
  49. Yan, Y.-E.; Ouyang, Z.-T.; Guo, H.-Q.; Jin, S.-S.; Zhao, B. Detecting the spatiotemporal changes of tidal flood in the estuarine wetland by using MODIS time series data. J. Hydrol. 2010, 384, 156–163. [Google Scholar] [CrossRef]
Figure 1. (A) Study areas: Irrigated rice fields (purple) in Bekasi, Karawang, Subang, and Indramayu districts (black line). Green and black dots represent visited rice fields with agronomic inundation and flooding, respectively. Yellow dots (I–IV) and a red dot (V) represent examples of rice fields with agronomic inundation and flooding, respectively. Yellow dots and the red dot in Figure 1A correspond to Figure 5; (B) Blue rectangle represents swampland rice fields affected by the dike failure on 18 January 2014. Yellow star marks the location of the dike failure (inset). Conditions in the black rectangle in Figure 1B are explained in Table 1.
Remotesensing 10 01003 g001
Figure 2. Time series of surface water maps generated using EVI ≤ 0.1 in irrigated rice fields in West Java. (Top) wet planting season: DOY 337 (2013)–49 (2014). Surface water comprises both hazardous flooding and non-hazardous agronomic inundation. (Bottom) dry planting seasons DOY 137–217 (2014). Value at the left corner of each figure is the surface water area in km2. Rice field areas presented in Figure 1 is used as a mask.
Remotesensing 10 01003 g002aRemotesensing 10 01003 g002b
Figure 3. Coefficient of determination (R2) between (Top) MODIS EVI ≤ 0.1 and MODIS NDWI (Normalized Difference Water Index) ≥ 0.1 (R2 = 0.61) and between (Bottom) MODIS EVI ≤ 0.1 and Landsat 5 TM EVI ≤ 0.1 (R2 = 0.34) in distinguishing surface water and non-surface water.
Remotesensing 10 01003 g003
Figure 4. Examples of comparisons between MODIS EVI and MODIS NDWI profiles in rice fields with (Top) flooding and (Bottom) agronomic inundation. EVI provides information on transplanting dates and surface water duration needed to discriminate hazardous flooding and non-hazardous agronomic inundation. Locations for the top and bottom figures are Legonkulon, Subang and Pedes, Karawang, respectively.
Remotesensing 10 01003 g004
Figure 5. EVI profiles (average of 5 × 5 pixels) in rice fields with flooding and rice fields with agronomic inundation in 2013/2014 (AI, solid markers) and Long-Term Average 2000–2015 (LTA, open markers). Symbols I–IV and V correspond to the yellow dots and the red dot Figure 1A, respectively.
Remotesensing 10 01003 g005
Figure 6. Rice fields with (A) surface water detected using EVI ≤ 0.1 (blue) and (B) with flooding detected using EVI40 (black). Black rectangle represents rice fields affected by a dike failure on 18 January 2014. Dotted green circle is misclassified flooded rice fields. (C) Total area rice fields with flooding detected using EVI40 from DOY 337 to 129 in 2013/2014 and 2014/2015. Figure 6 corresponds to Figure 1B.
Remotesensing 10 01003 g006
Figure 7. Time series of total areas (km2) of rice fields with surface water and flooding derived from EVI ≤ 0.1 and EVI40 respectively in 2013/2014, 2014/2015, and long-term average (2000–2015). Black arrow points to misclassified flood pixels (False Positive) detected using EVI40 during dry planting seasons 2014 and 2015.
Remotesensing 10 01003 g007
Figure 8. Maps of flood duration generated using EVI40 during wet planting seasons (DOY 1–89) in 2013/2014 and 2014/2015.
Remotesensing 10 01003 g008
Table 1. Conditions of rice fields with flooding and rice fields with agronomic inundation in Bobos and Pangarengan villages (Legonkulon sub-district) during wet planting seasons 2013/2014 (flooding year) and 2014/2015 (dry year). Table 1 corresponds to the black rectangle in Figure 1B.
Dates
(WPS 1 2014)
Rice Field Condition
(Interview)
Dates
(WPS 2015)
Rice Field Condition
(Fieldwork)
17 January (DOY 017)Flooding17 January (DOY 017)Fallow
25 January (DOY 025)Flooding25 January (DOY 025)Fallow
2 February (DOY 032)Flooding2 February (DOY 032)Fallow
10 February (DOY 041)Flooding10 February (DOY 041)Tillage
18 February (DOY 049)Flooding18 February (DOY 049)Tillage
26 February (DOY 057)Flooding26 February (DOY 057)Tillage
1 WPS: Wet Planting Season.
Table 2. Landsat 5 TM (Path: 122, Row: 64) imageries used to validate surface water areas derived from MODerate resolution Imaging Spectroradiometer (MODIS) Enhanced Vegetation Index (EVI) ≤ 0.1.
NoDate *DOYNoDateDOYNoDateDOY
108/08/2001220819/06/20061701506/22/2007173
225/03/200484905/07/20061861625/08/2007237
331/07/20042121006/08/20062181726/09/2007269
401/09/20042441122/08/20062341828/09/2008271
502/07/2005331207/09/20062501901/08/2010213
604/09/20052471309/10/2006282
716/04/20061061425/10/2006298
* Date (dd/mm/yyy).
Table 3. Evaluation matrix to assess estimated flooded rice pixels derived using EVI40.
Method and Formula
True Positive: flooding is correctly identified as flooding;
SOSx a − SOSz b > 25 days
True Positive Rate or Sensitivity or Recall:
TP d/(TP+FN e)
Positive Predictive Value or Precision:
TP/(TP+FP)
False Positive: agronomic inundation is incorrectly identified as flooding;
SOSy c − SOSz > 25 days
False Positive Rate:
FP/(FP+TN)
Negative Predictive Value:
TN/(TN+FN)
True Negative: agronomic inundation is correctly identified as agronomic inundation;
SOSy − SOSz ≤ 25 days
True Negative Rate or Specificity:
TN f/(FP g+TN)
Accuracy:
(TP+TN)/(TP+FP+TN+FN)
False Negative: flooding is incorrectly identified as agronomic inundation;
SOSx − SOSz ≤ 25 days
False Negative Rate:
FN/(FN+TP)
F1 Score:
2TP/(2TP+FP+FN)
a SOSx = Start of Season rice fields with flooding; b SOSz = Long-term average Start of Season; c SOSy = Start of Season rice fields with agronomic inundation; d TP = True Positive; e FN = False Negative; f TN = True Negative; g FP = False Positive.
Table 4. Duration (Mean±Stdev, in days) of surface water (agronomic inundation and flooding) in irrigated rice fields per year derived from EVI from 2000/2001 to 2014/2015 (n = number of pixels). Duration is the difference between transplanting date (SOS a) and the date when agronomic inundation or flooding first detected.
Agronomic Inundation
(n-total = 1287)
Flooding
(n-total = 284)
2015 *
(n = 42)
25 ± 11
2014
(n = 49)
24 ± 11
2013
(n = 79)
30 ± 9
2012
(n = 89)
27 ± 10
2011
(n = 90)
29 ± 10
Swampland rice fields
2015 *
(n = 133)
60 ± 22
2010
(n = 87)
27 ± 11
2009
(n = 93)
27 ± 11
2008
(n = 99)
25 ± 12
2007
(n = 88)
22 ± 11
2006
(n = 98)
21 ± 9
2014
(n = 90)
83 ± 22
2005
(n = 95)
24 ± 11
2004
(n = 72)
26 ± 12
2003
(n = 101)
25 ± 11
2002
(n = 104)
27 ± 10
2001
(n = 101)
28 ± 9
Dyke failure event
18 January 2014 *
(n = 61)
95 ± 20
a SOS is the DOY when EVI = 0.1 or EVI = the last minimum value if two or more values are detected during the growing phase; * rice fields were visited during fieldwork.
Table 5. Confusion matrix of rice fields with flooding derived using EVI40 based on respondents’ reports on flood locations during the wet planting season 2014.
Reference Data
Agronomic InundationFloodingTotal
Classified imageNon-hazardous
agronomic inundation
34446390
Hazardous flooding93230323
total437276713
Overall Accuracy80.5%Kappa60.16%
Producer’s AccuracyOmission errorUser’s AccuracyCommission error
Non-hazardous
agronomic inundation
78.71%21.29%88.2%11.8%
Hazardous flooding83.3%16.7%71.2%28.8%
Table 6. Error matrix of rice fields with flooding using the Start of Season (SOS) as an indicator for detecting disruptions in cropping schedules. SOS of the wet planting season 2013/2014 is compared to that of the long-term average (2000–2015).
5 × 5 pixels
(n = 1918)
Methods
True Positive: 1032True Positive Rate or Sensitivity or Recall: 82.49%Positive Predictive Value or Precision: 81%
False Positive: 242False Positive Rate or Fall out: 36.28%Negative Predictive Value: 65.99%
True Negative: 425True Negative Rate or Specificity: 63.72%Overall Accuracy: 75.96%
False Negative: 219False Negative Rate or Miss Rate: 17.51%F1 Score: 81.74%

