Multiscale Comparative Evaluation of the GPM IMERG v5 and TRMM 3B42 v7 Precipitation Products from 2015 to 2017 over a Climate Transition Area of China


 ,
,
Abstract
:
1. Introduction
2. Materials and Methods
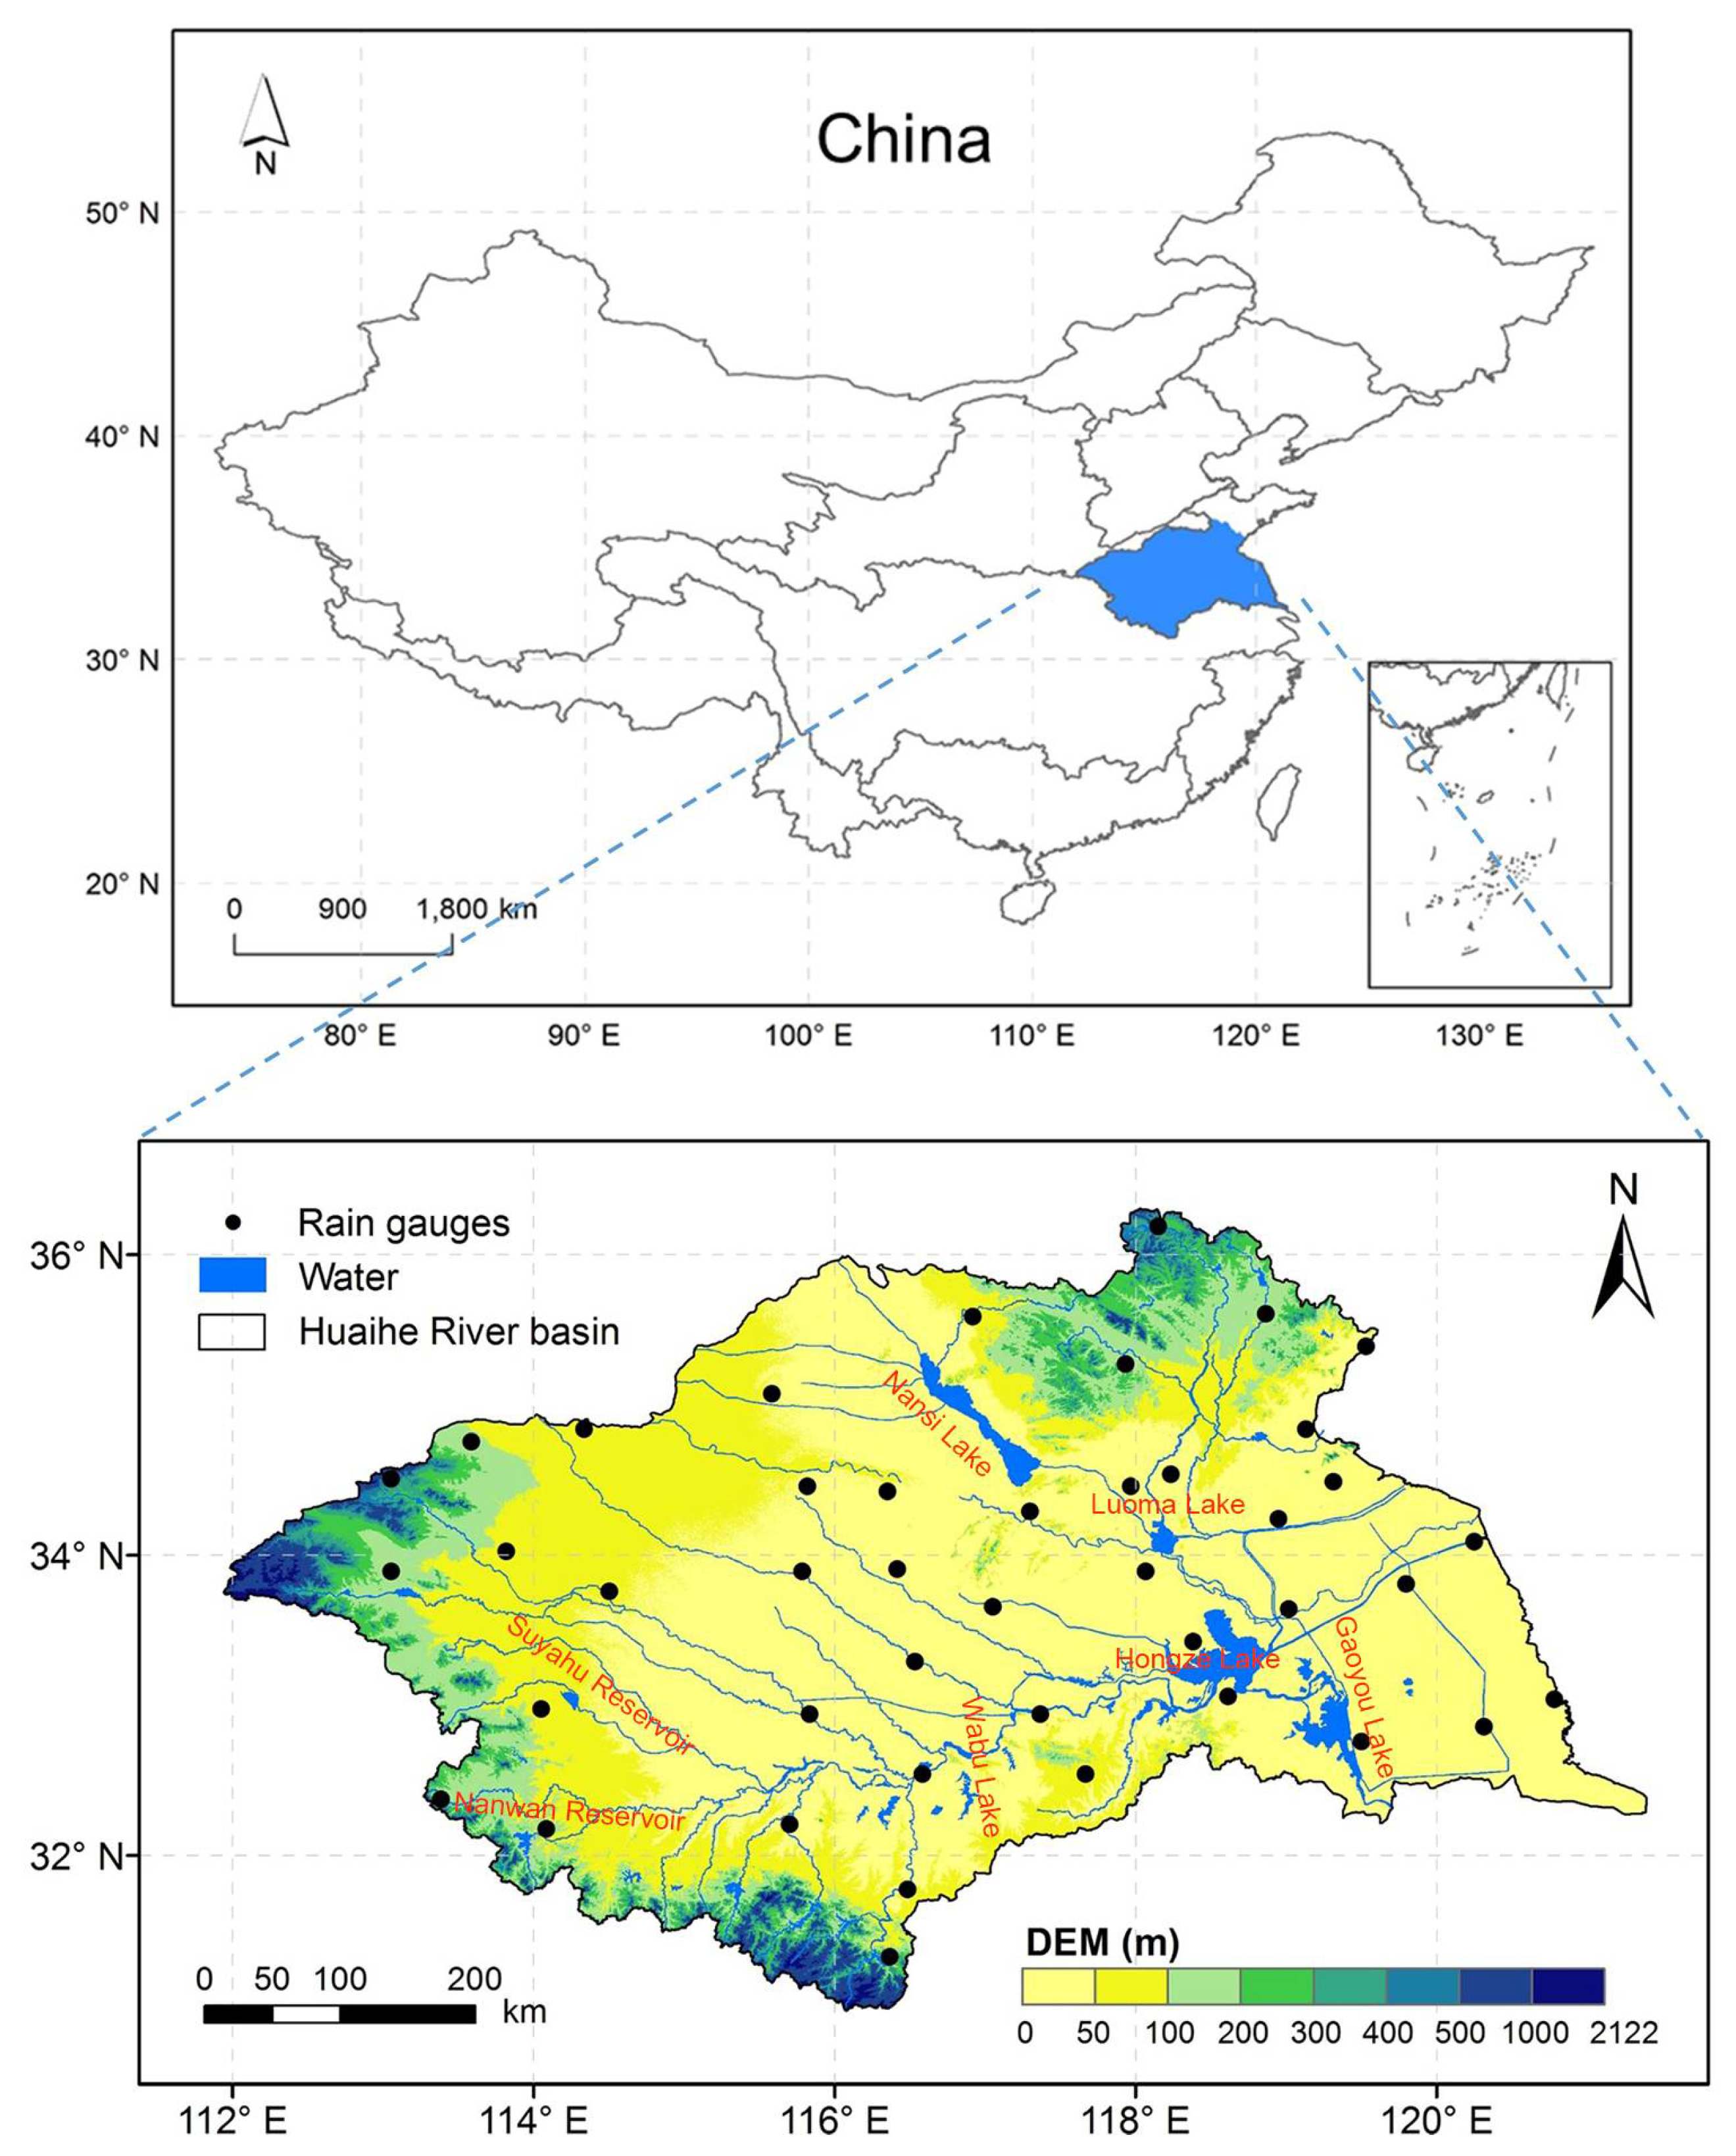
2.1. Study Area
2.2. Datasets and Preprocessing
2.2.1. TRMM 3B42 v7
2.2.2. GPM IMERG v5
2.2.3. Rain Gauge Data
2.2.4. DEM Data
2.3. Methodologies
3. Results
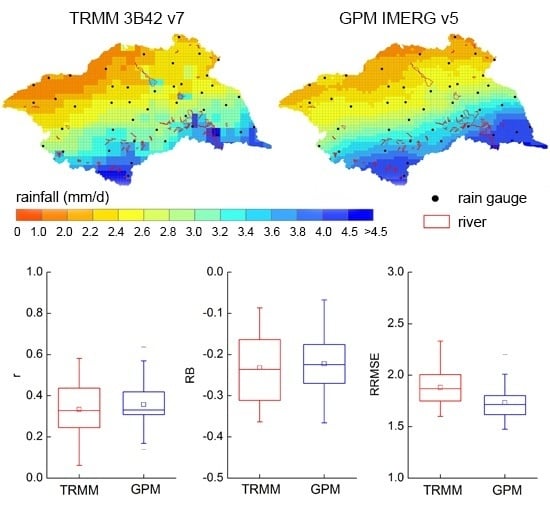
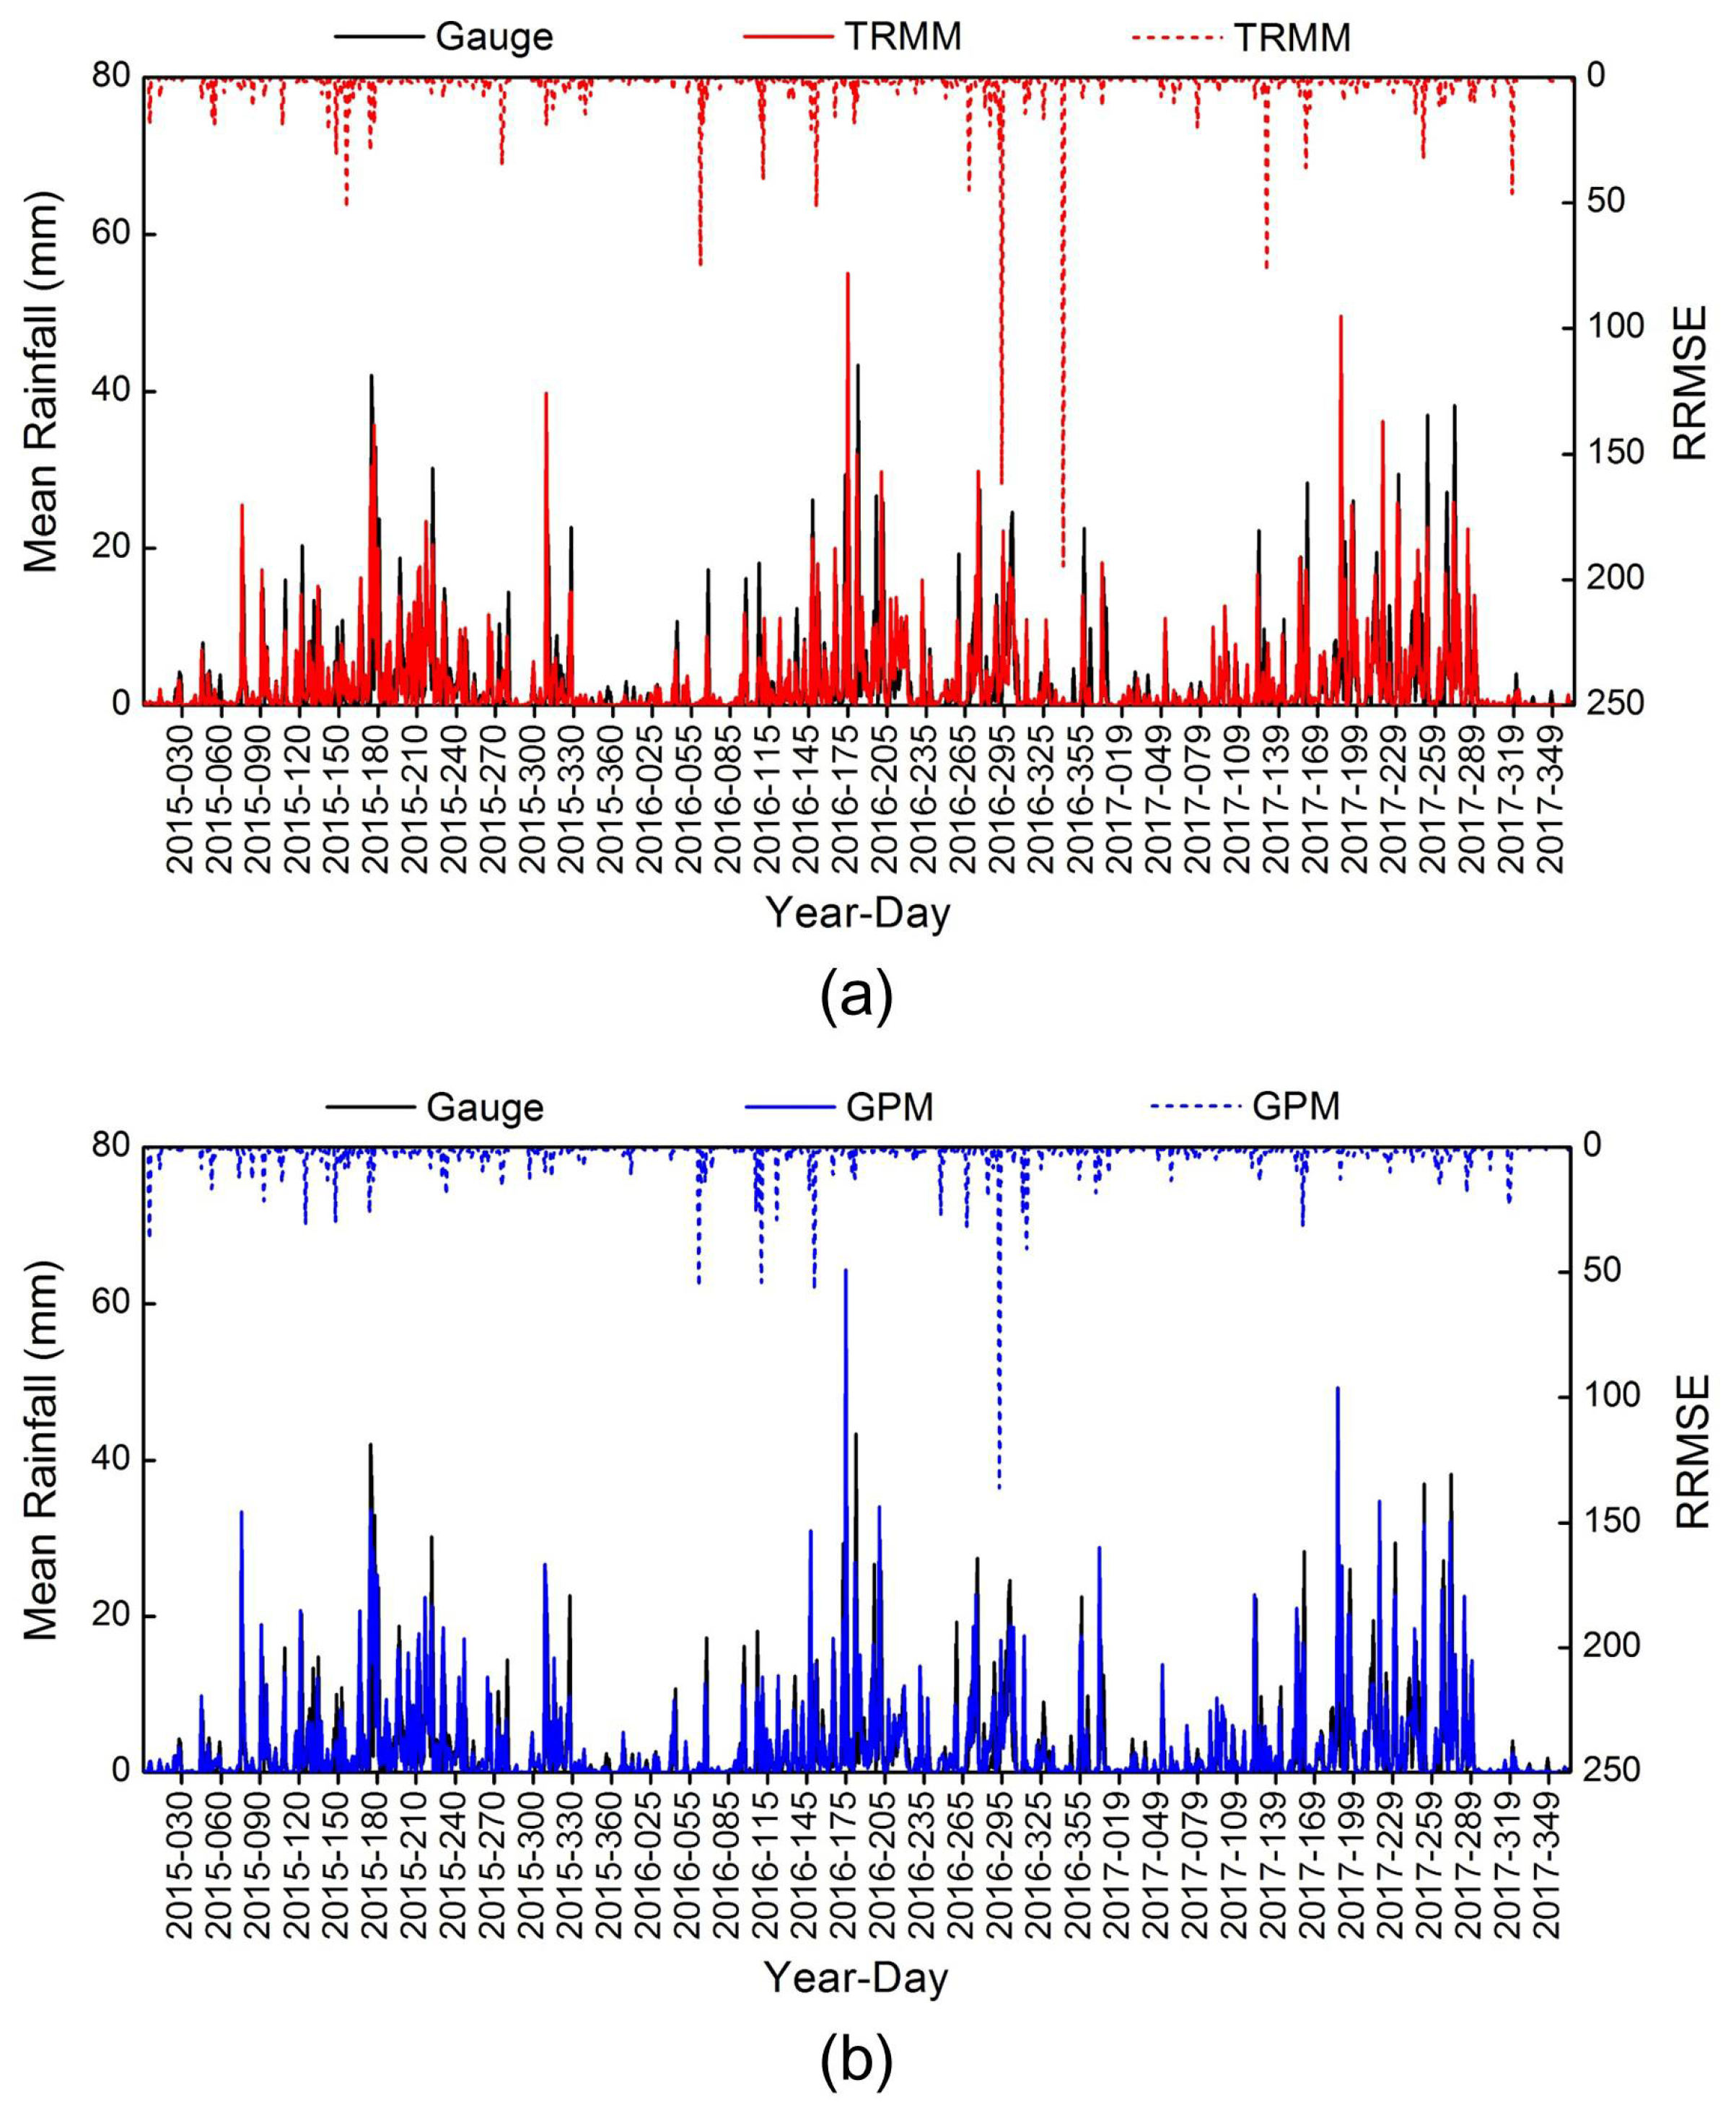
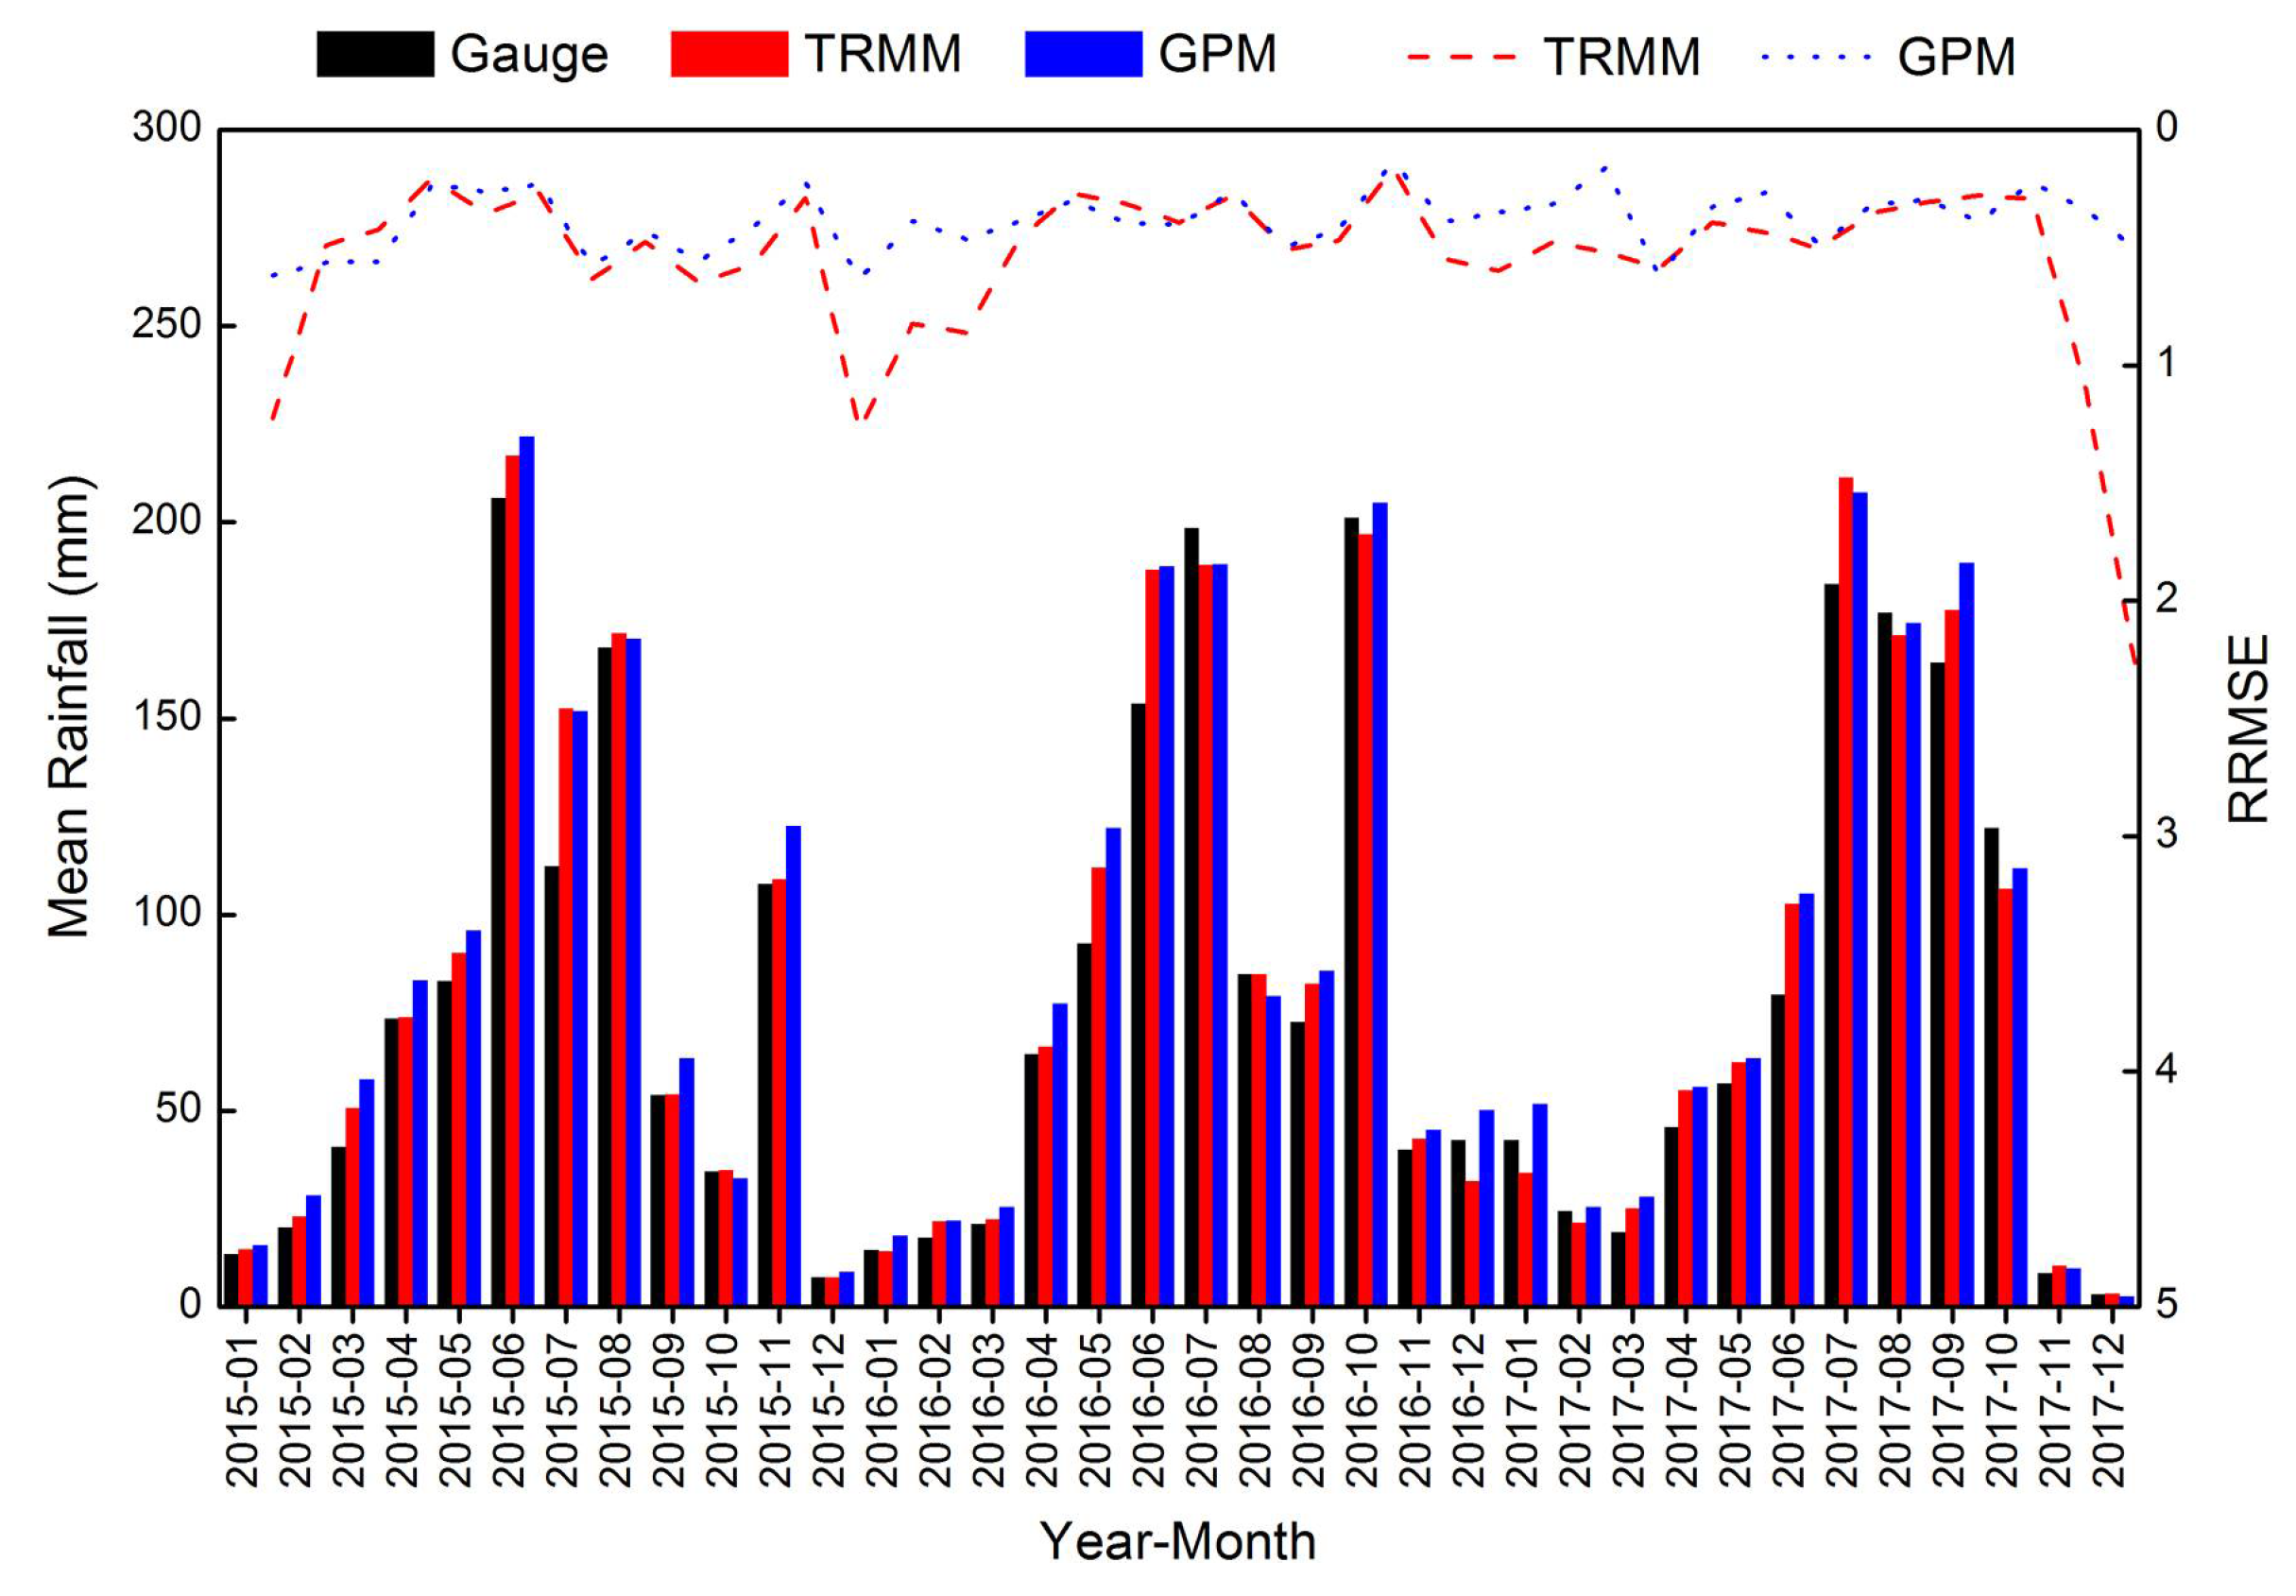
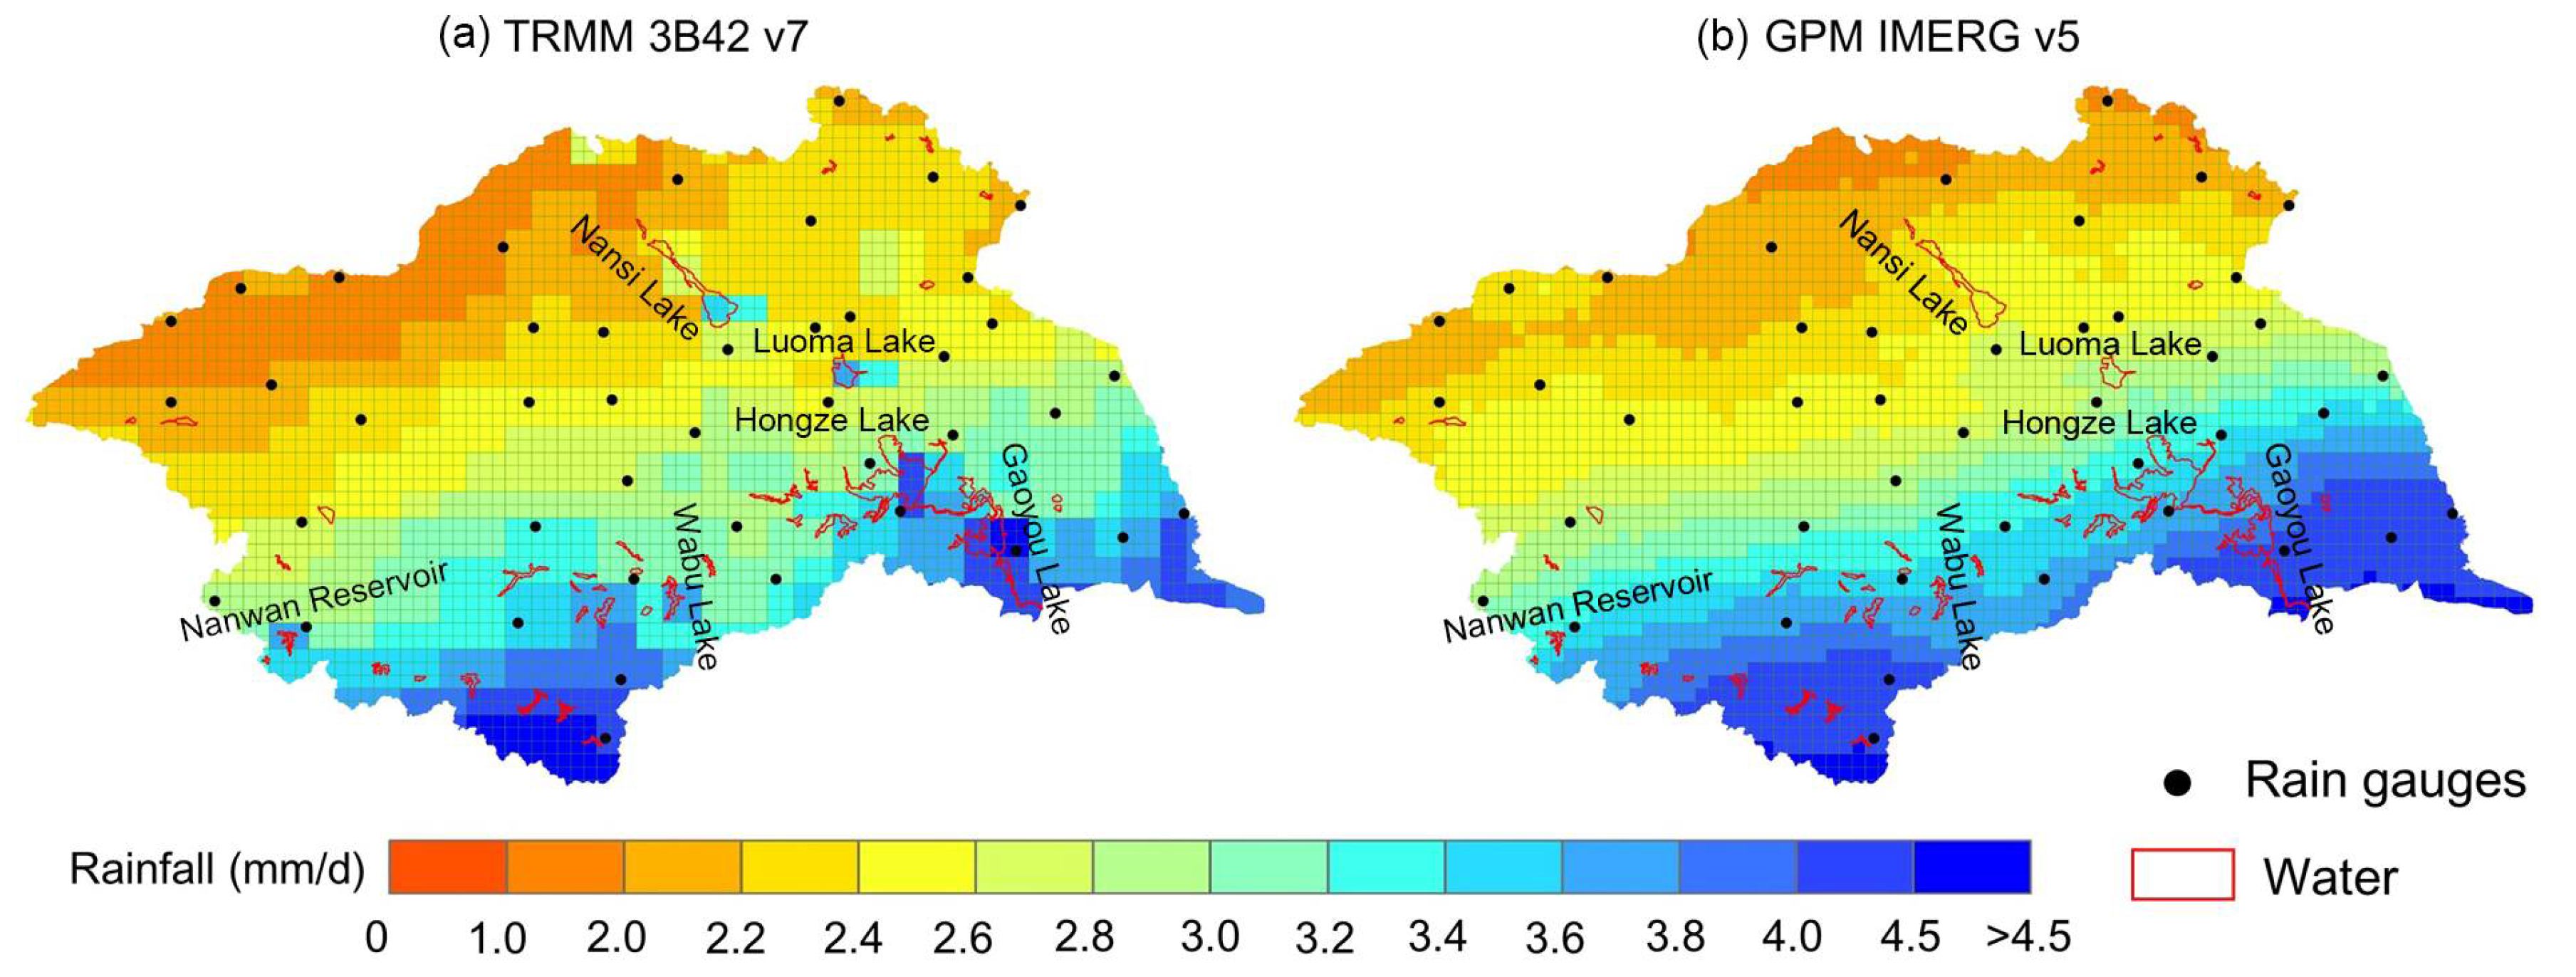
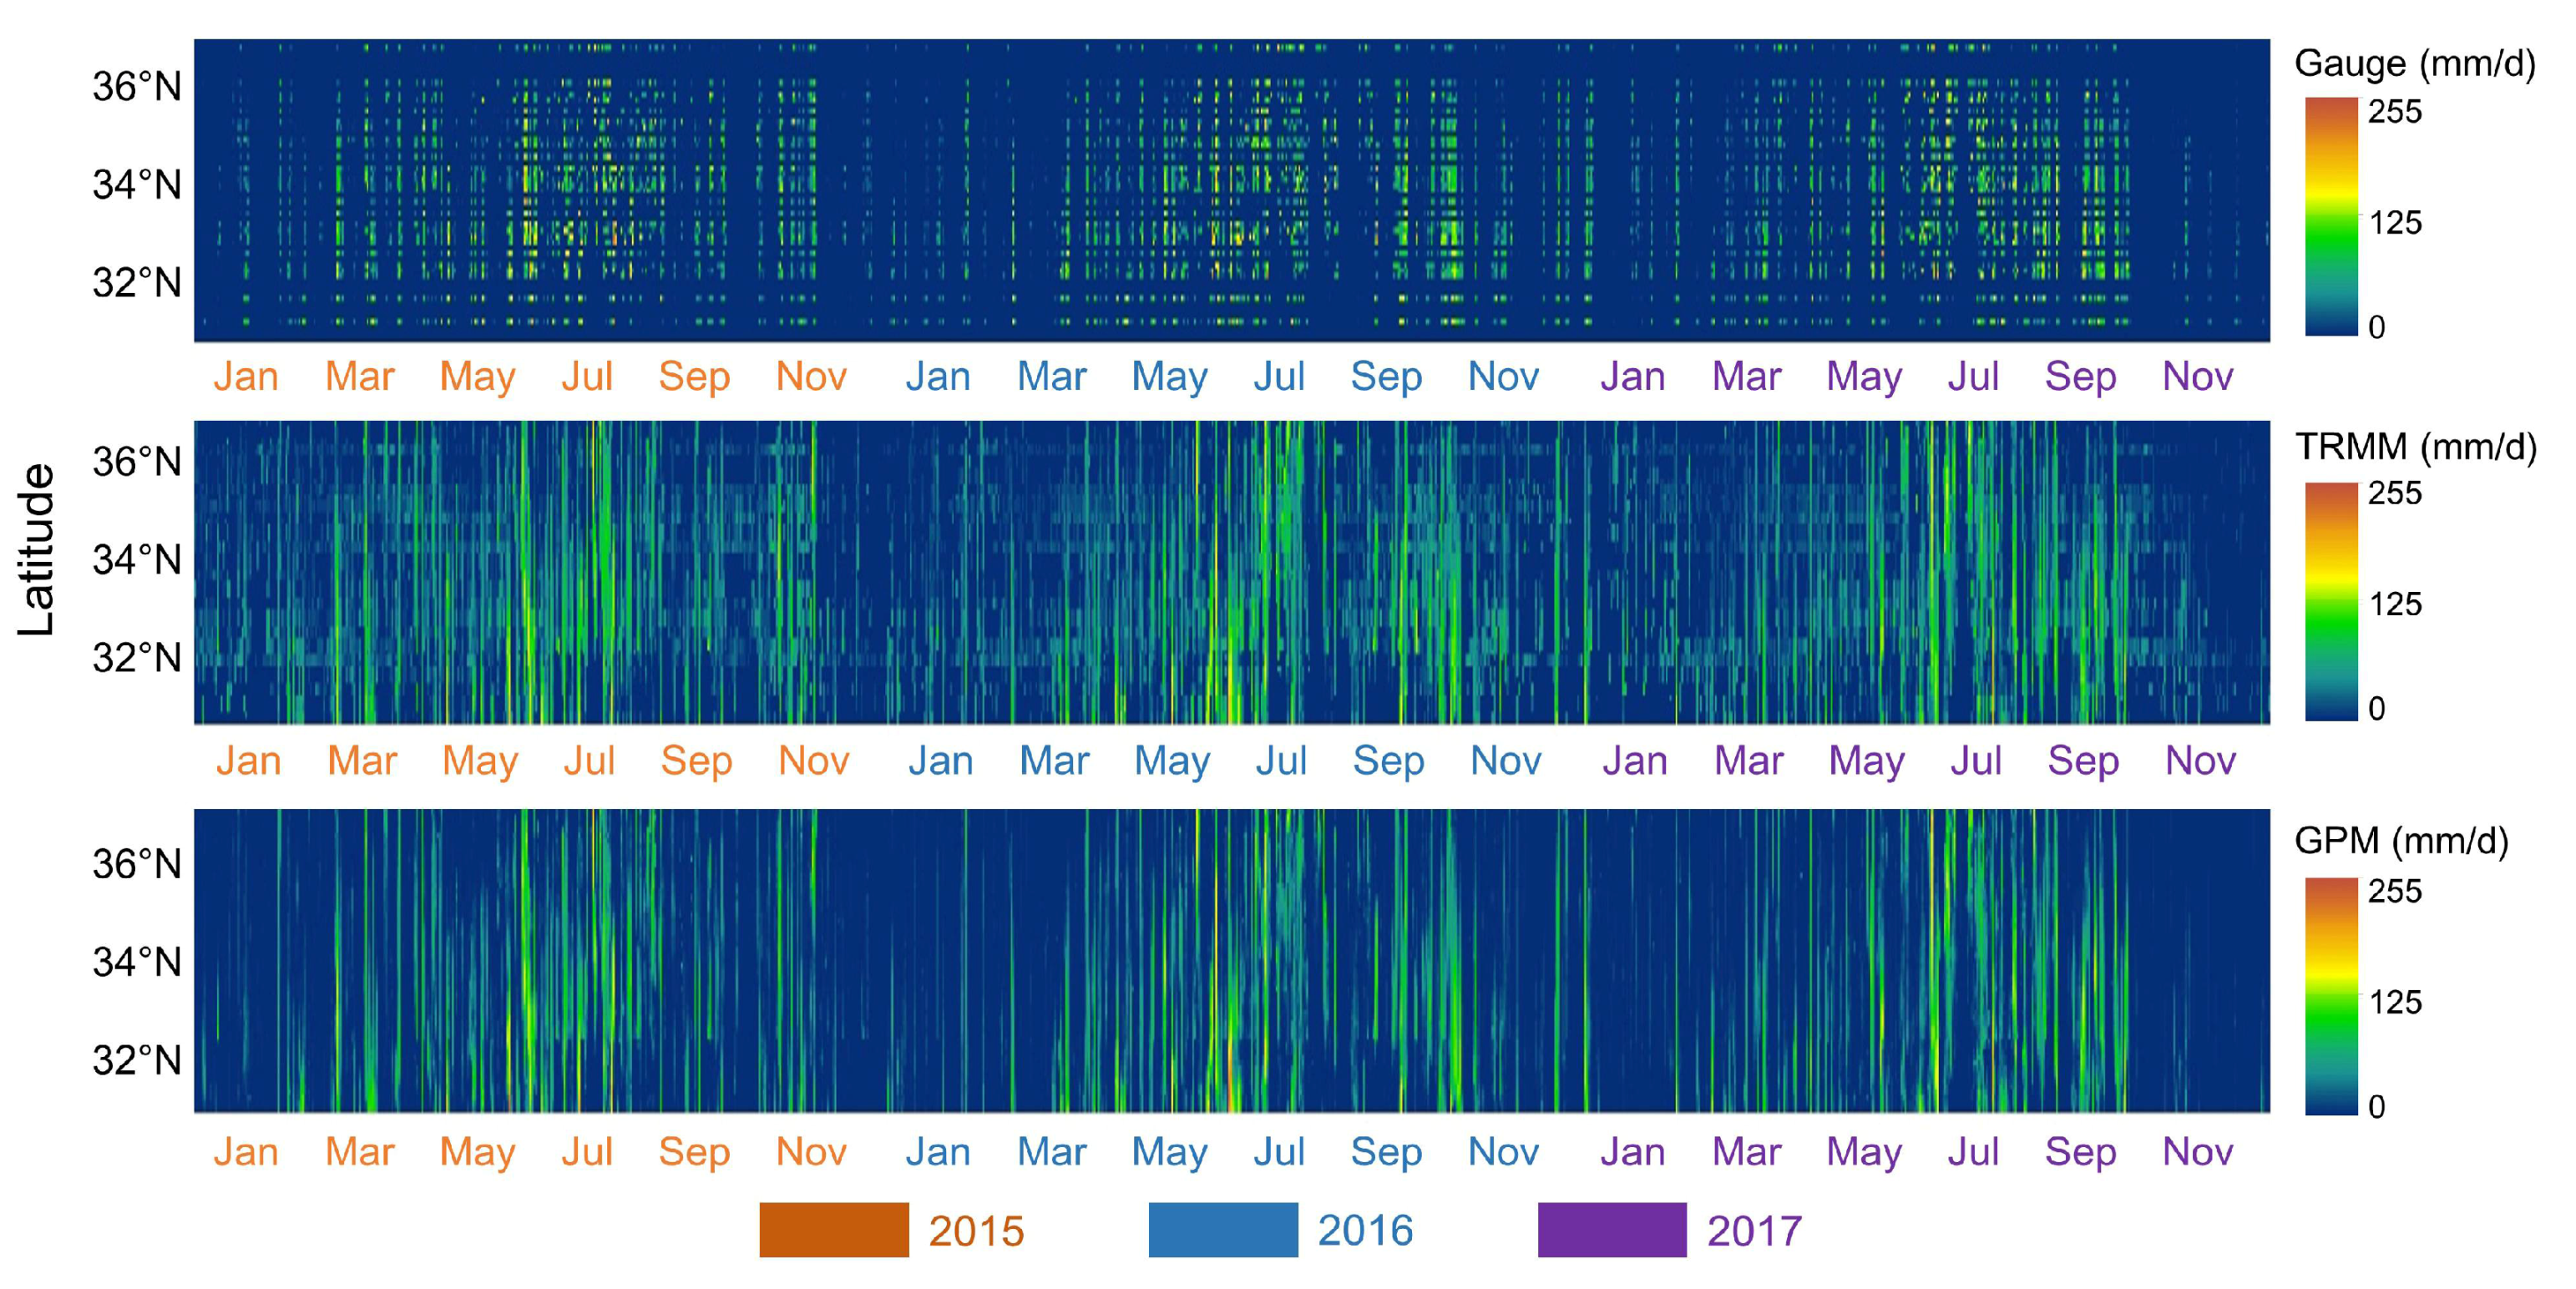
3.1. Spatiotemporal Assessment of IMERG v5 and 3B42 v7 Precipitation Estimates
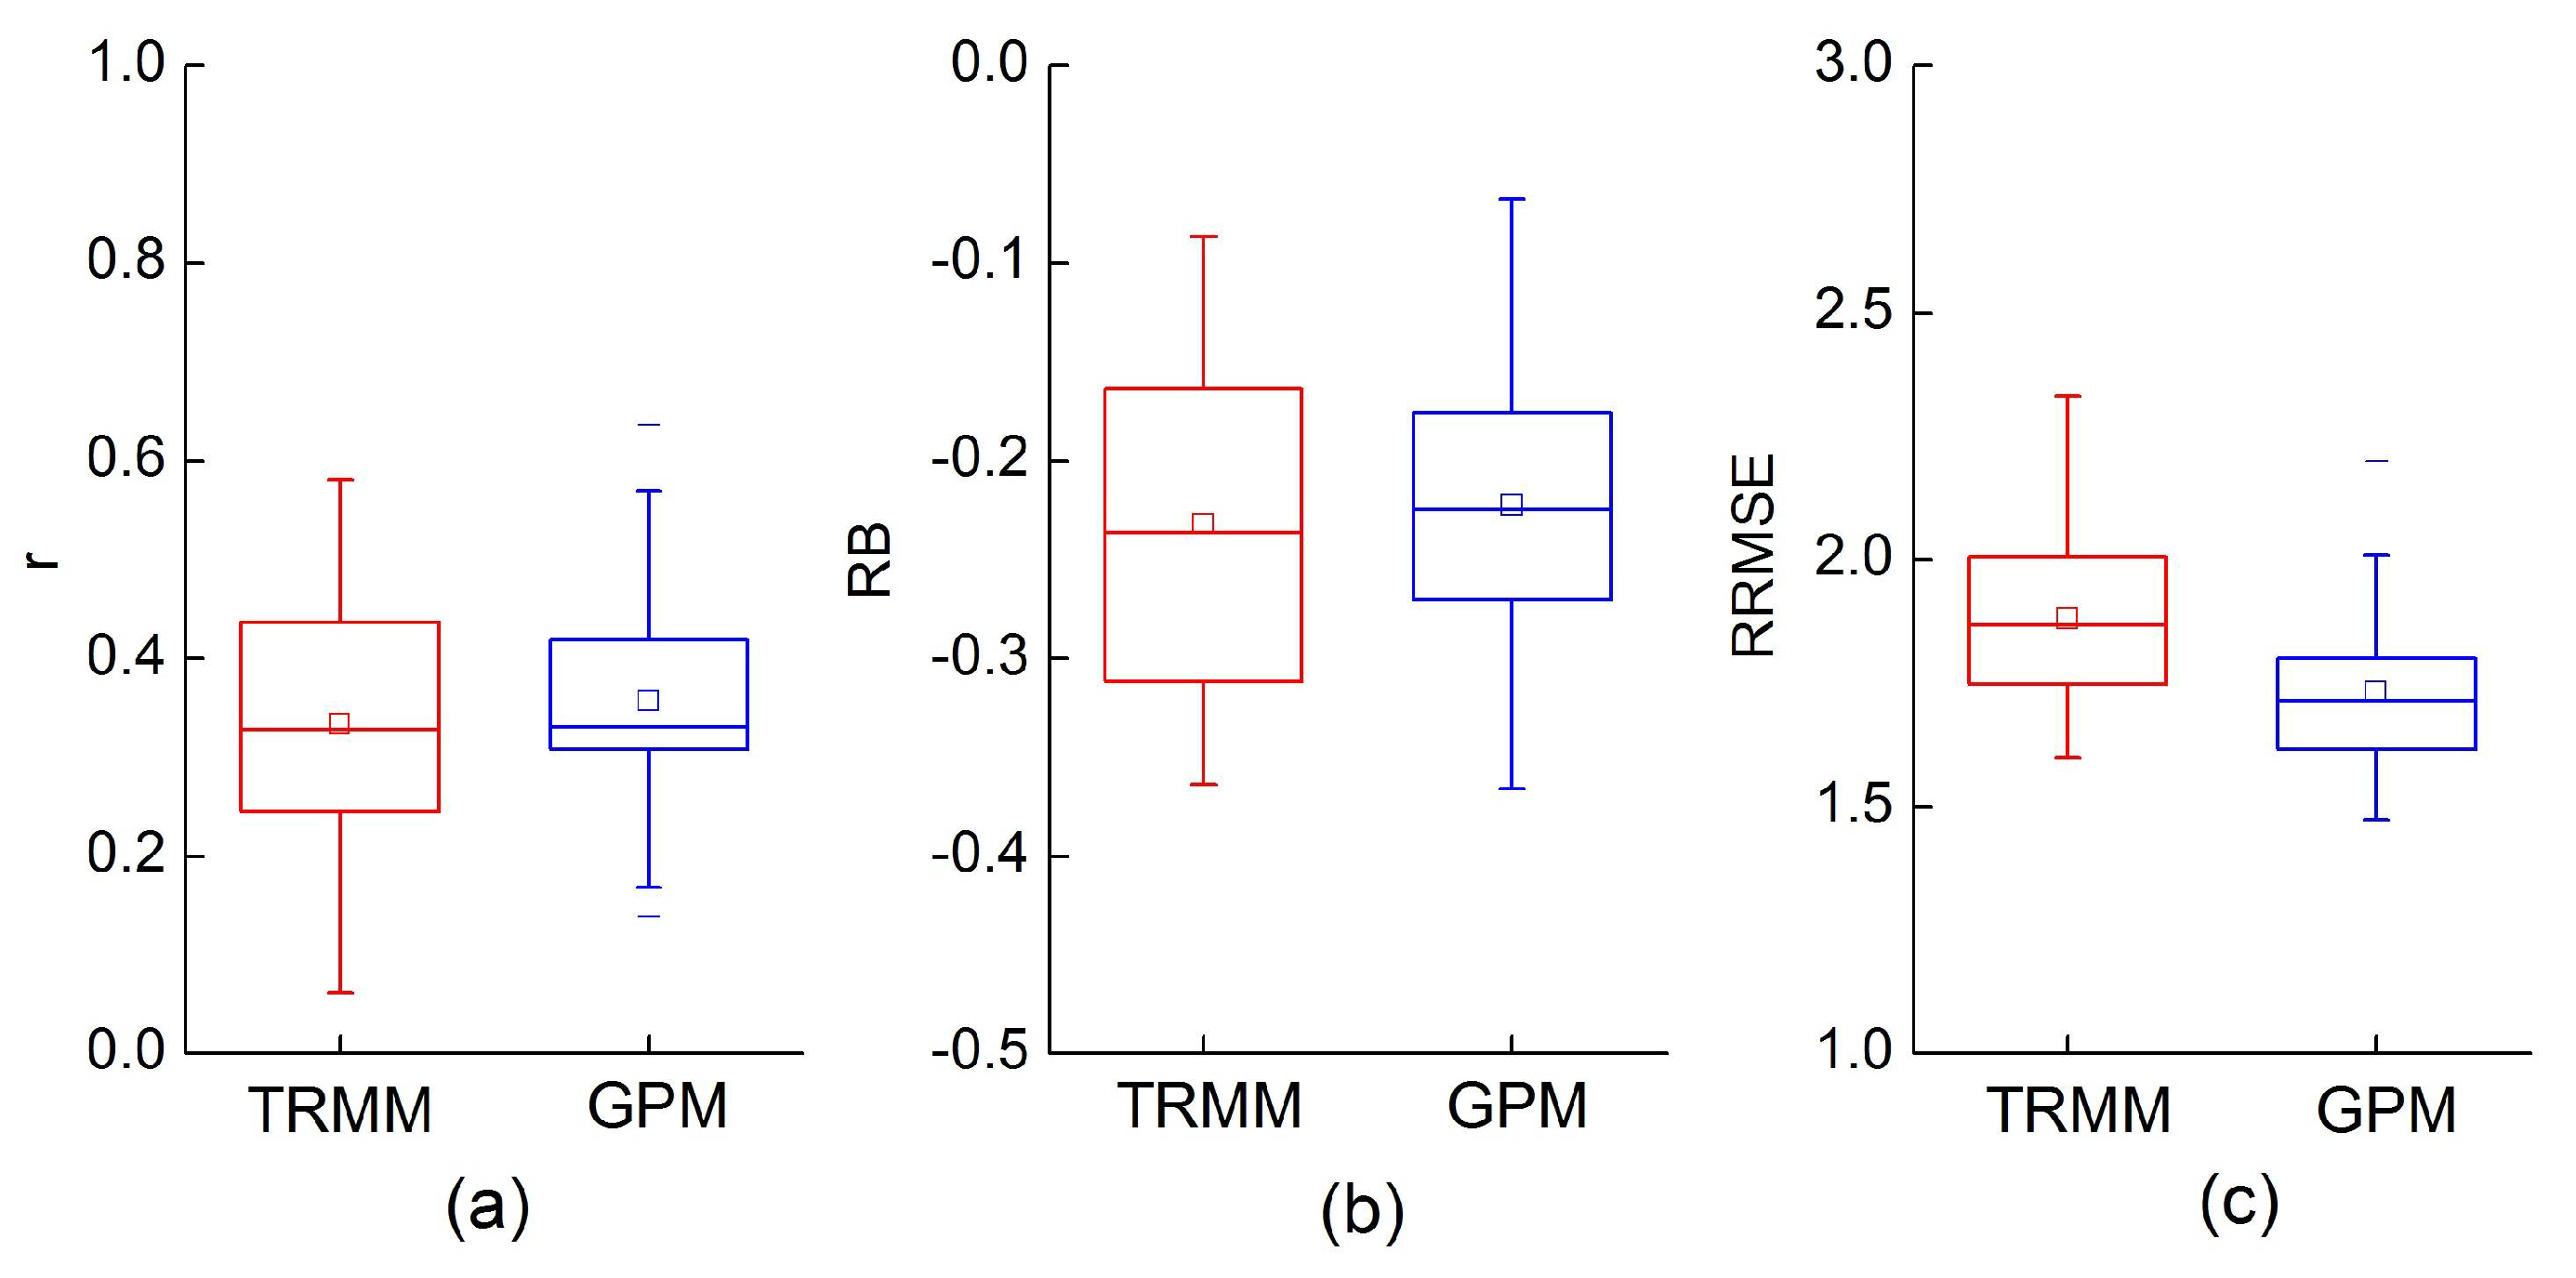
3.2. Evaluation and Comparison at Each Individual Gauge Station
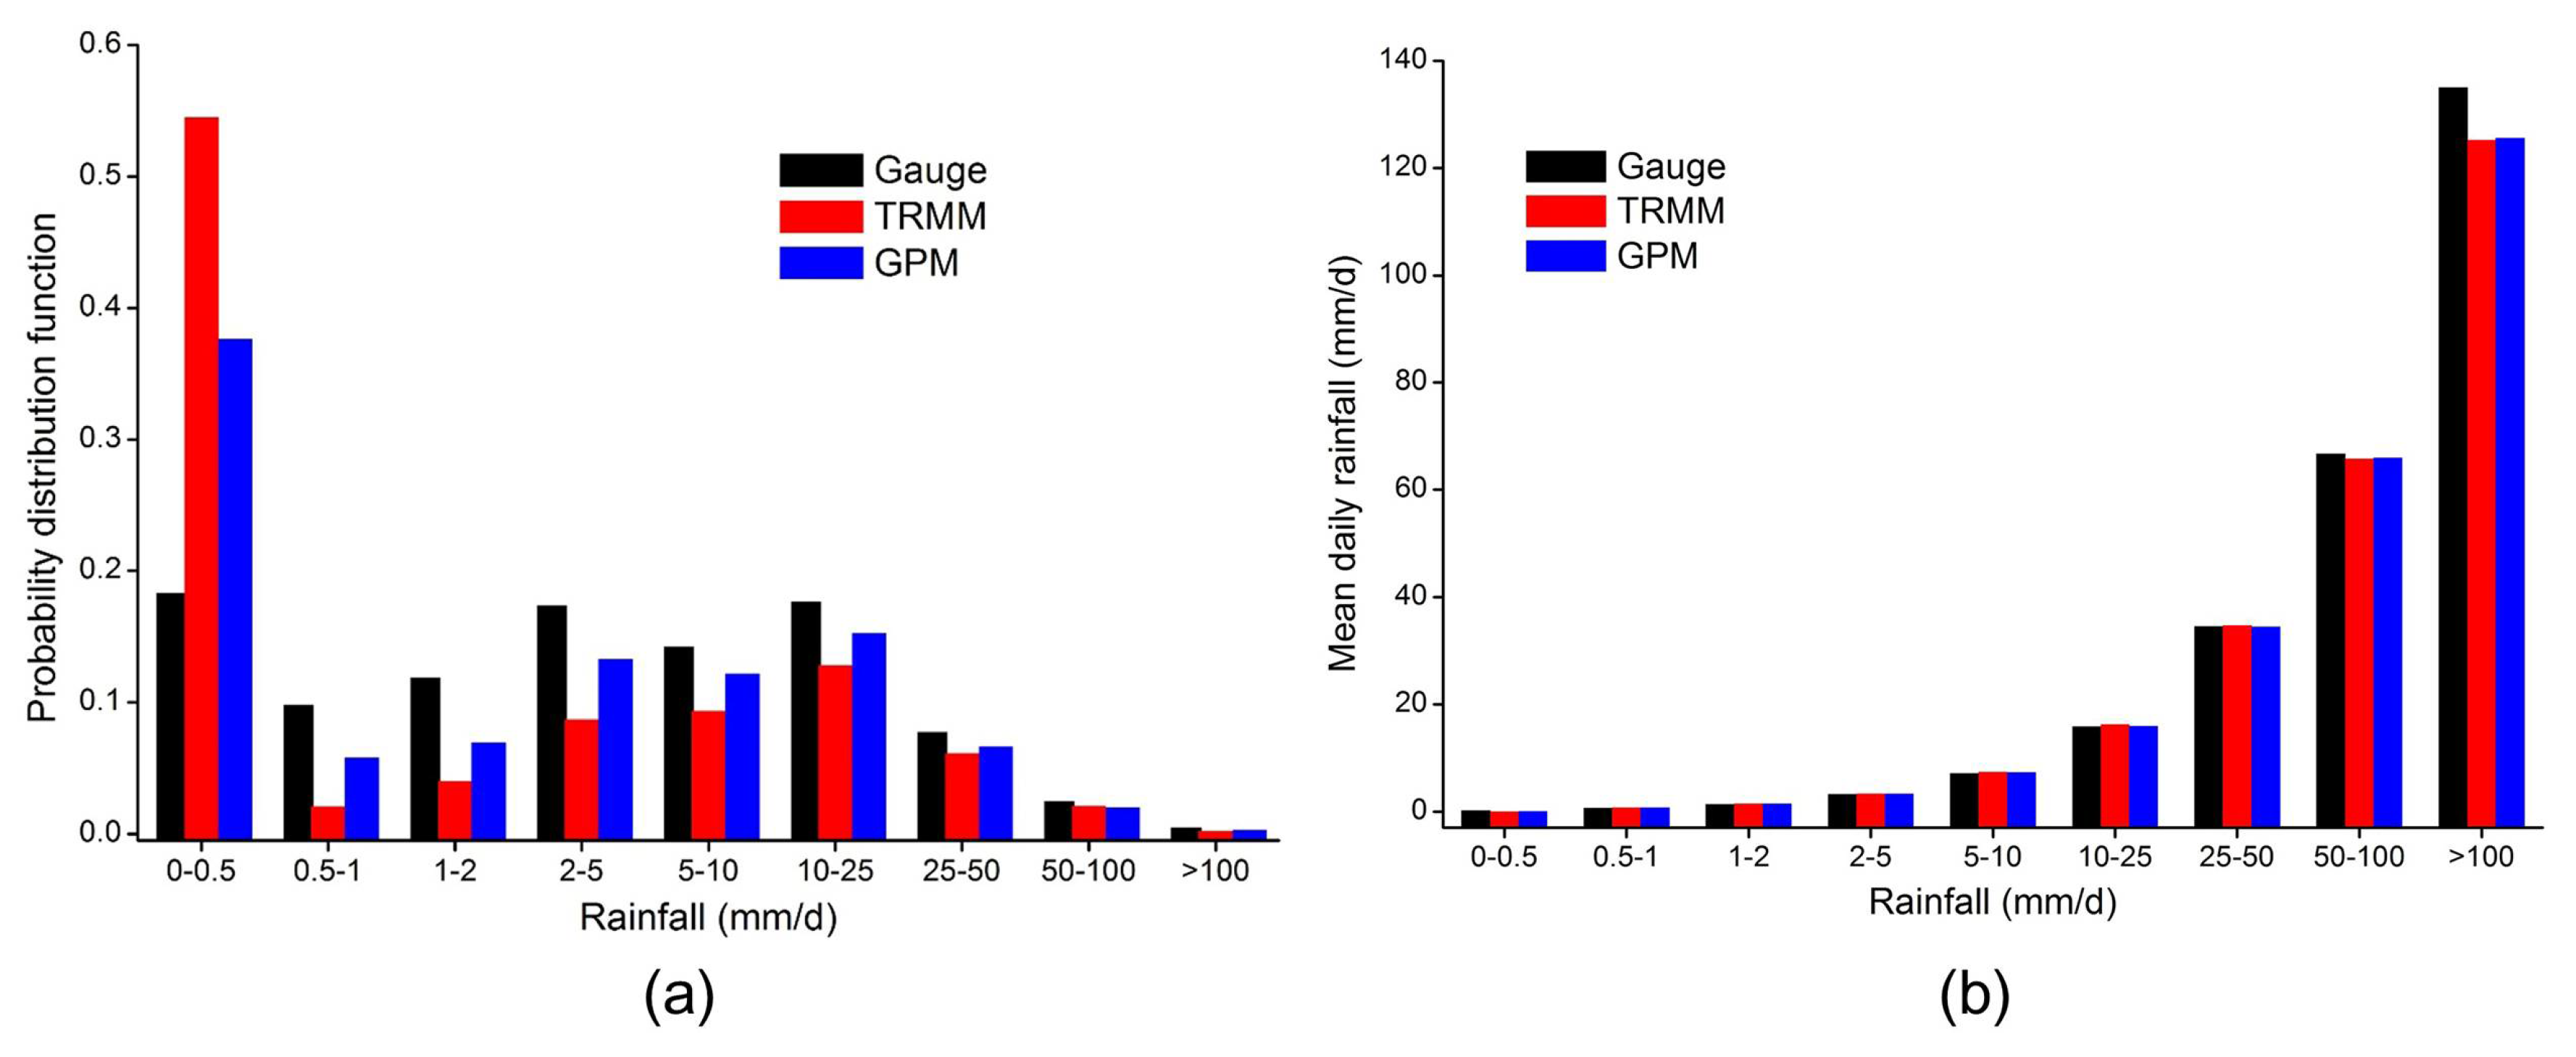
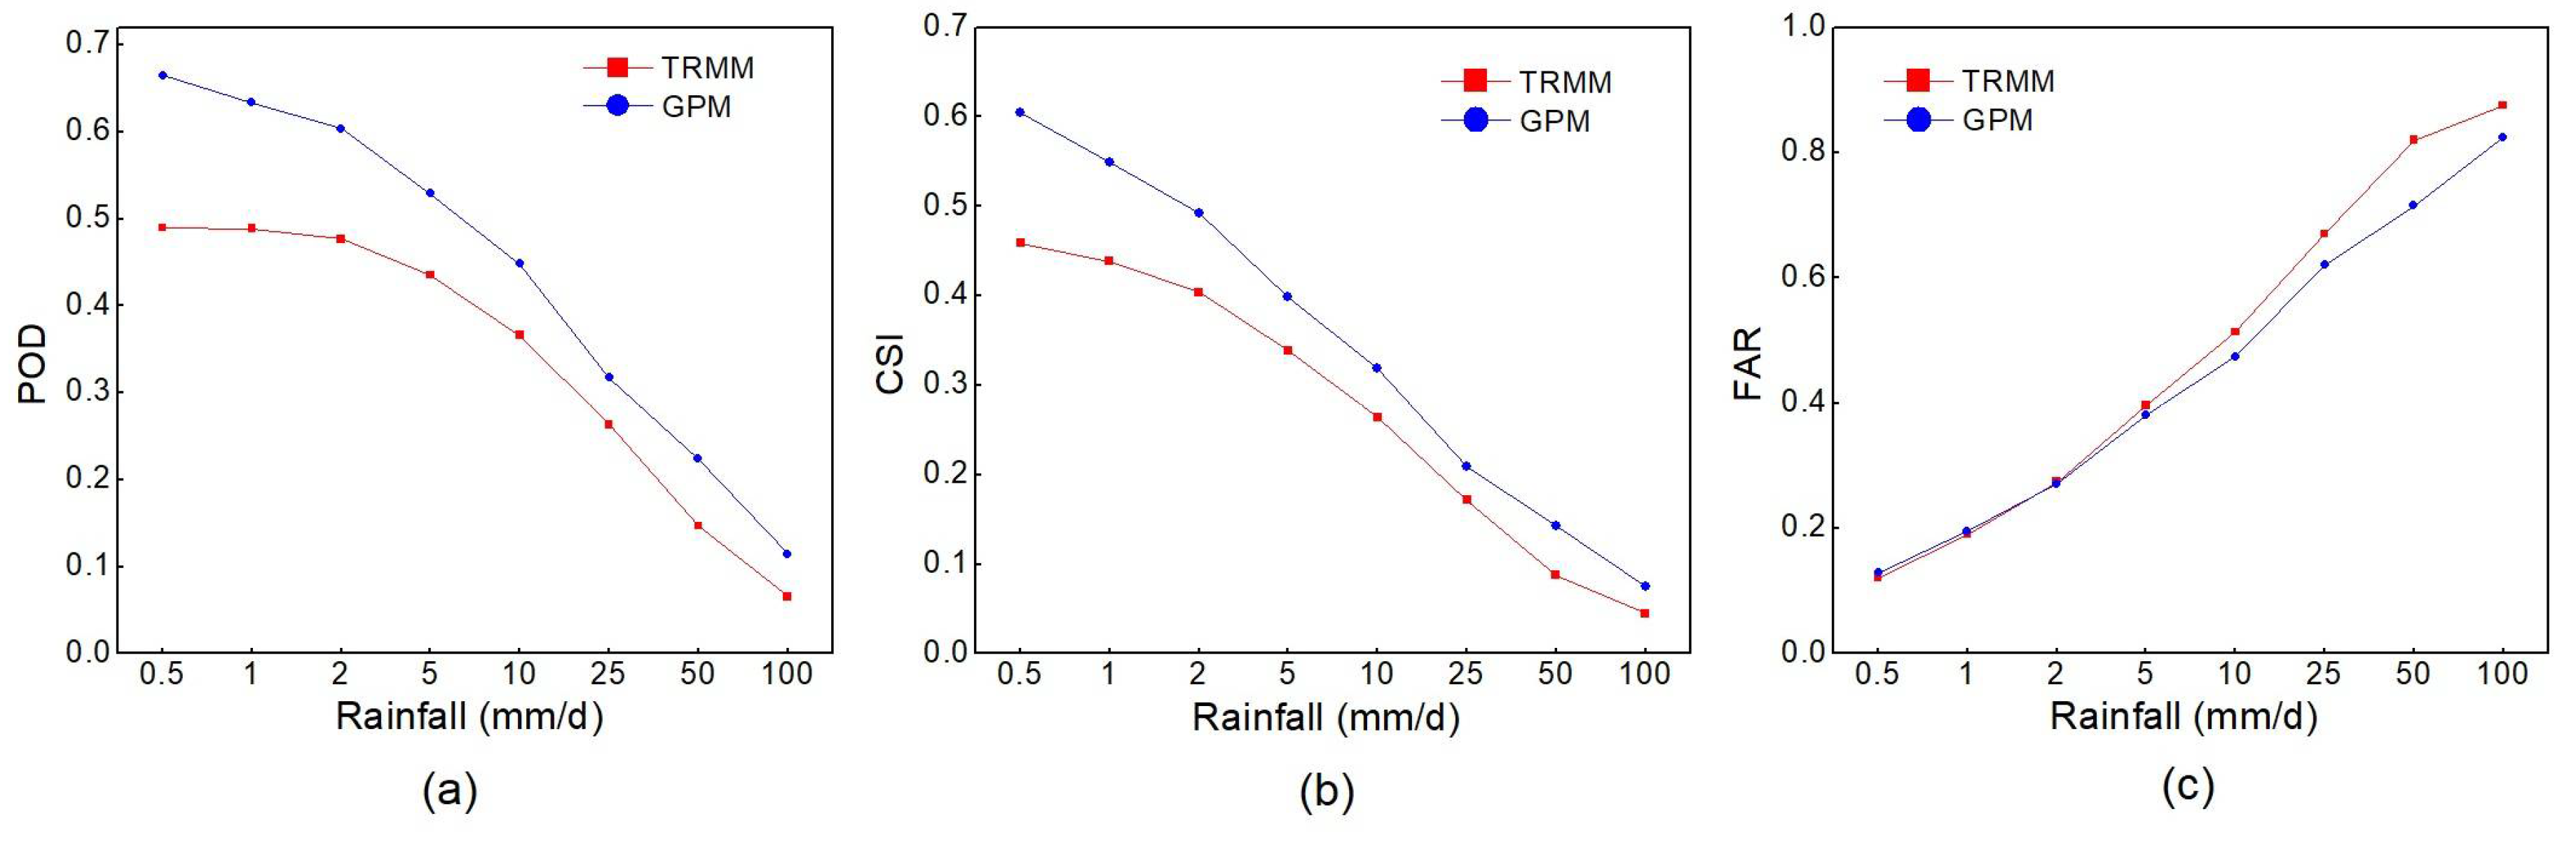
3.3. Performance of Satellite Precipitation Estimates at Different Rainfall Thresholds
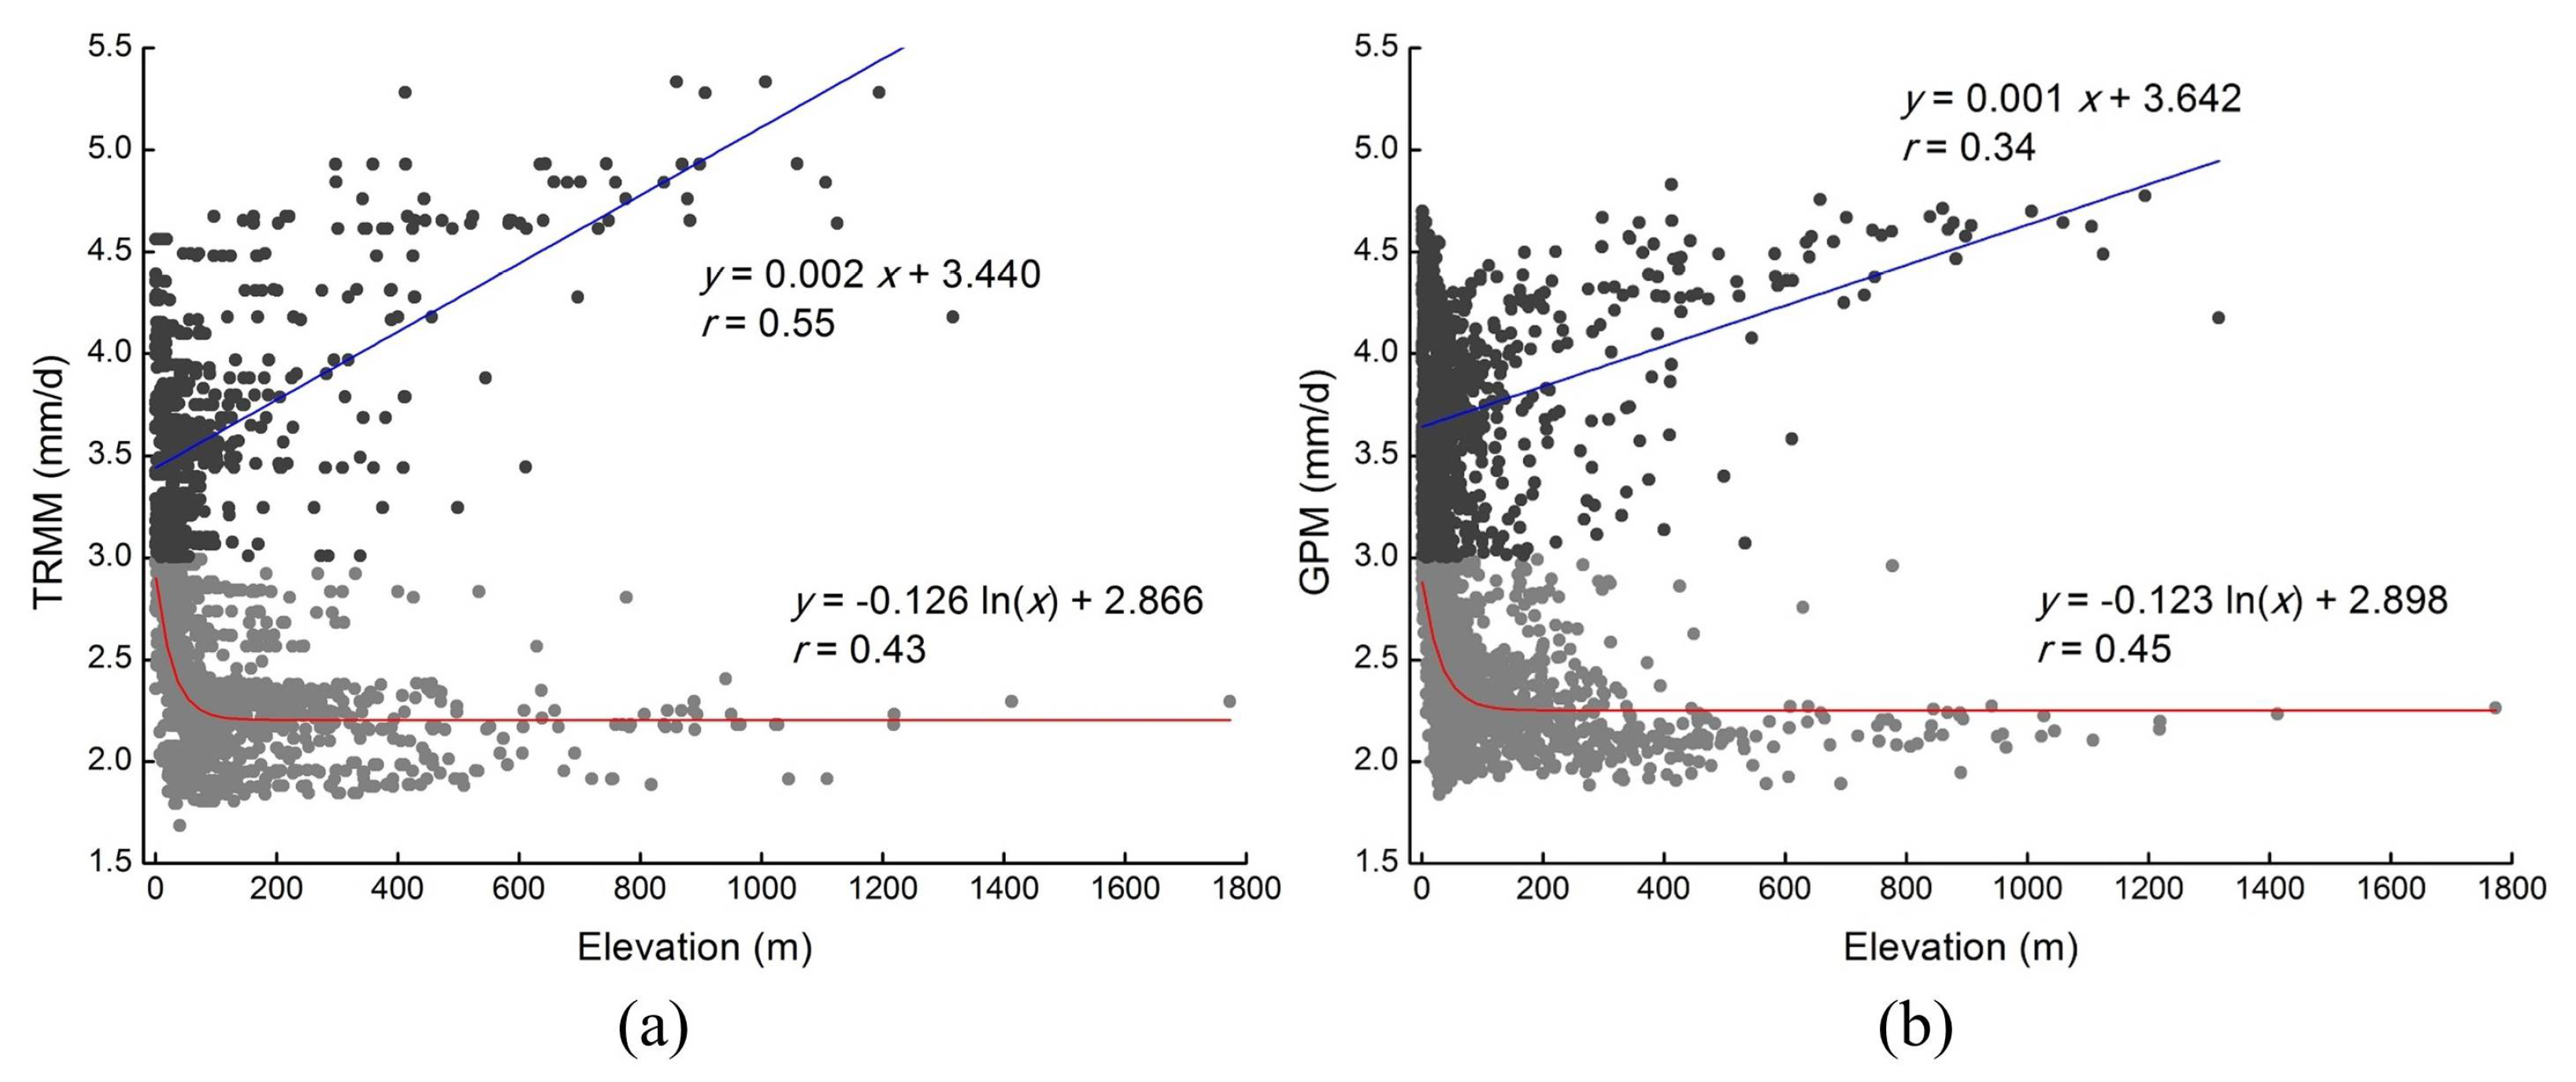
3.4. Influence of Latitude and Elevation on Satellite Precipitation
4. Discussion
5. Conclusions
Author Contributions
Funding
Acknowledgments
Conflicts of Interest
References
- Langella, G.; Basile, A.; Bonfante, A.; Terribile, F. High-resolution space–time rainfall analysis using integrated ann inference systems. J. Hydrol. 2010, 387, 328–342. [Google Scholar] [CrossRef]
- Duan, Z.; Bastiaanssen, W.G.M. First results from Version 7 TRMM 3B43 precipitation product in combination with a new downscaling–calibration procedure. Remote Sens. Environ. 2013, 131, 1–13. [Google Scholar] [CrossRef]
- Chen, C.; Zhao, S.; Duan, Z.; Qin, Z. An improved spatial downscaling procedure for TRMM 3B43 precipitation product using geographically weighted regression. IEEE J. Sel. Top. Appl. Earth Obs. Remote Sens. 2015, 8, 4592–4604. [Google Scholar] [CrossRef]
- Allen, M.R.; Ingram, W.J.; Stainforth, D.A. Constraints on future changes in climate and the hydrologic cycle. Nature 2002, 419, 224. [Google Scholar] [CrossRef] [PubMed]
- Sorooshian, S.; Hsu, K.L.; Gao, X.; Gupta, H.V.; Imam, B.; Dan, B. Evaluation of persiann system satellite–based estimates of tropical rainfall. Bull. Am. Meteorol. Soc. 2000, 81, 2035–2046. [Google Scholar] [CrossRef]
- Joyce, R.J.; Janowiak, J.E.; Arkin, P.A.; Xie, P. CMORPH: A method that produces global precipitation estimates from passive microwave and infrared data at high spatial and temporal resolution. J. Hydrometeorol. 2004, 5, 487–503. [Google Scholar] [CrossRef]
- Kubota, T.; Shige, S.; Hashizume, H.; Aonashi, K.; Takahashi, N.; Seto, S.; Kachi, M. Global precipitation map using satellite-borne microwave radiometers by the GSMaP project: Production and validation. IEEE Trans. Geosci. Remote Sens. 2007, 45, 2259–2275. [Google Scholar] [CrossRef]
- Funk, C.; Peterson, P.; Landsfeld, M.; Pedreros, D.; Verdin, J.; Shukla, S.; Michaelsen, J. The climate hazards infrared precipitation with stations—A new environmental record for monitoring extremes. Sci. Data 2015, 2, 150066. [Google Scholar] [CrossRef] [PubMed]
- Huffman, G.J.; Bolvin, D.T.; Nelkin, E.J.; Wolff, D.B.; Adler, R.F.; Gu, G.; Stocker, E.F. The TRMM multisatellite precipitation analysis (TMPA): Quasi-global, multiyear, combined-sensor precipitation estimates at fine scales. J. Hydrometeorol. 2007, 8, 38–55. [Google Scholar] [CrossRef]
- Hou, A.Y.; Kakar, R.K.; Neeck, S.; Azarbarzin, A.A.; Kummerow, C.D.; Kojima, M.; Iguchi, T. The global precipitation measurement mission. Bull. Am. Meteorol. Soc. 2014, 95, 701–722. [Google Scholar] [CrossRef]
- Huffman, G.J.; Bolvin, D.T.; Braithwaite, D.; Hsu, K.; Joyce, R.; Xie, P.; Yoo, S.H. NASA global precipitation measurement (GPM) integrated multi-satellite retrievals for GPM (IMERG). In Algorithm Theoretical Basis Document (ATBD); NASA/GSFC: Greenbelt, MD, USA, 2014. [Google Scholar]
- Huffman, G.J.; Bolvin, D.T.; Nelkin, E.J. Integrated Multi-SatellitE Retrievals for GPM (IMERG) Technical Documentation; NASA/GSFC Code; NASA/GSFC: Greenbelt, MD, USA, 2015. [Google Scholar]
- Tang, G.; Ma, Y.; Long, D.; Zhong, L.; Hong, Y. Evaluation of GPM Day-1 IMERG and TMPA Version-7 legacy products over Mainland China at multiple spatiotemporal scales. J. Hydrol. 2016, 533, 152–167. [Google Scholar] [CrossRef]
- Tang, G.; Zeng, Z.; Long, D.; Guo, X.; Yong, B.; Zhang, W.; Hong, Y. Statistical and hydrological comparisons between TRMM and GPM level-3 products over a midlatitude basin: Is day-1 IMERG a good successor for TMPA 3B42V7? J. Hydrometeorol. 2016, 17, 121–137. [Google Scholar] [CrossRef]
- Ma, Y.; Tang, G.; Long, D.; Yong, B.; Zhong, L.; Wan, W.; Hong, Y. Similarity and error intercomparison of the GPM and its predecessor-TRMM Multisatellite Precipitation Analysis using the best available hourly gauge network over the Tibetan Plateau. Remote Sens. 2016, 8, 569. [Google Scholar] [CrossRef]
- Gaona, M.R.; Overeem, A.; Leijnse, H.; Uijlenhoet, R. First-Year Evaluation of GPM Rainfall over The Netherlands: IMERG Day 1 Final Run (V03D). J. Hydrometeorol. 2016, 17, 2799–2814. [Google Scholar] [CrossRef]
- Prakash, S.; Mitra, A.K.; AghaKouchak, A.; Liu, Z.; Norouzi, H.; Pai, D.S. A preliminary assessment of GPM-based multi-satellite precipitation estimates over a monsoon dominated region. J. Hydrol. 2016, 556, 865–875. [Google Scholar] [CrossRef]
- Prakash, S.; Mitra, A.K.; Pai, D.S.; AghaKouchak, A. From TRMM to GPM: How well can heavy rainfall be detected from space? Adv. Water Resour. 2016, 88, 1–7. [Google Scholar] [CrossRef]
- Asong, Z.E.; Razavi, S.; Wheater, H.S.; Wong, J.S. Evaluation of Integrated Multisatellite Retrievals for GPM (IMERG) over Southern Canada against Ground Precipitation Observations: A Preliminary Assessment. J. Hydrometeorol. 2017, 18, 1033–1050. [Google Scholar] [CrossRef]
- Tan, M.L.; Duan, Z. Assessment of GPM and TRMM Precipitation Products over Singapore. Remote Sens. 2017, 9, 720. [Google Scholar] [CrossRef]
- Li, Z.; Yang, D.; Gao, B.; Jiao, Y.; Hong, Y.; Xu, T. Multiscale hydrologic applications of the latest satellite precipitation products in the Yangtze River Basin using a distributed hydrologic model. J. Hydrometeorol. 2015, 16, 407–426. [Google Scholar] [CrossRef]
- Duan, Z.; Liu, J.; Tuo, Y.; Chiogna, G.; Disse, M. Evaluation of eight high spatial resolution gridded precipitation products in Adige Basin (Italy) at multiple temporal and spatial scales. Sci. Total Environ. 2016, 573, 1536–1553. [Google Scholar] [CrossRef] [PubMed]
- Yang, X.; Geng, W. Accuracy evaluation of TRMM-based Multi-satellite Precipitation in Huai River Basin. Water Resour. Power. 2016, 34, 1–5. [Google Scholar]
- Sun, R.; Yuan, H.; Liu, X.; Jiang, X. Evaluation of the latest satellite–gauge precipitation products and their hydrologic applications over the Huaihe River basin. J. Hydrol. 2016, 536, 302–319. [Google Scholar] [CrossRef]
- Stocker, E.F.; Kelley, O. GPM V05 Gridded Text Products. Available online: https://ntrs.nasa.gov/search.jsp?R=20170009623 (accessed on 2 December 2017).
- Zulkafli, Z.; Buytaert, W.; Onof, C.; Manz, B.; Tarnavsky, E.; Lavado, W.; Guyot, J.L. A comparative performance analysis of TRMM 3B42 (TMPA) versions 6 and 7 for hydrological applications over Andean–Amazon river basins. J. Hydrometeorol. 2014, 15, 581–592. [Google Scholar] [CrossRef]
- Huffman, G.J.; Bolvin, D.T. TRMM and Other Data Precipitation Data Set Documentation, Mesoscale Atmospheric Processes Laboratory, NASA Global Change Master Directory Doc. Available online: https://pmm.nasa.gov/sites/default/files/document_files/3B42_3B43_doc_V7.pdf (accessed on 8 April 2015).
- Sandwell, D.T. Biharmonic spline interpolation of GEOS-3 and SEASAT altimeter data. Geophys. Res. Lett. 1987, 14, 139–142. [Google Scholar] [CrossRef] [Green Version]
- Tan, M.L.; Santo, H. Comparison of GPM IMERG, TMPA 3B42 and PERSIANN-CDR satellite precipitation products over Malaysia. Atmos. Res. 2018, 202, 63–76. [Google Scholar] [CrossRef]
- Duan, L.; Fan, K.; Li, W.; Liu, T. Spatial downscaling algorithm of TRMM precipitation based on multiple high-resolution satellite data for Inner Mongolia, China. Theor. Appl. Climatol. 2017, 1–15. [Google Scholar] [CrossRef]
- Zhang, Q.; Singh, V.P.; Li, J.; Chen, X. Analysis of the periods of maximum consecutive wet days in China. J. Geophys. Res. Atmos. 2011, 116. [Google Scholar] [CrossRef] [Green Version]
- Xu, W.; Li, Q.; Wang, X.L.; Yang, S.; Cao, L.; Feng, Y. Homogenization of Chinese daily surface air temperatures and analysis of trends in the extreme temperature indices. J. Geophys. Res. Atmos. 2013, 118, 9708–9720. [Google Scholar] [CrossRef] [Green Version]
- Yong, B.; Ren, L.L.; Hong, Y.; Wang, J.H.; Gourley, J.J.; Jiang, S.H.; Wang, W. Hydrologic evaluation of Multisatellite Precipitation Analysis standard precipitation products in basins beyond its inclined latitude band: A case study in Laohahe basin, China. Water Resour. Res. 2010, 46. [Google Scholar] [CrossRef] [Green Version]
- Li, Z.; Yang, D.; Hong, Y. Multi-scale evaluation of high-resolution multi-sensor blended global precipitation products over the Yangtze River. J. Hydrol. 2013, 500, 157–169. [Google Scholar] [CrossRef]
- Wang, W.; Lu, H.; Zhao, T.; Jiang, L.; Shi, J. Evaluation and comparison of daily rainfall from latest GPM and TRMM products over the Mekong River Basin. IEEE J. Sel. Top. Appl. Earth Obs. Remote Sens. 2017, 10, 2540–2549. [Google Scholar] [CrossRef]
- Wilks, D.S. Statistical Methods in the Atmospheric Sciences; Academic Press: Cambridge, MA, USA, 2011. [Google Scholar]
- Ebert, E.E.; Janowiak, J.E.; Kidd, C. Comparison of near-real-time precipitation estimates from satellite observations and numerical models. Bull. Am. Meteorol. Soc. 2007, 88, 47–64. [Google Scholar] [CrossRef]
- El Kenawy, A.M.; Lopez-Moreno, J.I.; McCabe, M.F.; Vicente-Serrano, S.M. Evaluation of the TMPA-3B42 precipitation product using a high-density rain gauge network over complex terrain in northeastern Iberia. Global Planet. Chang. 2015, 133, 188–200. [Google Scholar] [CrossRef] [Green Version]
- Kawanishi, T.; Takamatsu, H.; Kozu, T.; Okamoto, K.; Kumagai, H. TRMM precipitation radar. Adv. Space Res. 2000, 25, 969–972. [Google Scholar] [CrossRef]
- Xu, R.; Tian, F.; Yang, L.; Hu, H.; Lu, H.; Hou, A. Ground validation of GPM IMERG and TRMM 3B42V7 rainfall products over southern Tibetan Plateau based on a high-density rain gauge network. J. Geophys. Res. Atmos. 2017, 122, 910–924. [Google Scholar] [CrossRef]
- Ebrahimi, S.; Chen, C.; Chen, Q.; Zhang, Y.; Ma, N.; Zaman, Q. Effects of temporal scales and space mismatches on the TRMM 3B42 v7 precipitation product in a remote mountainous area. Hydrol. Process. 2017, 31. [Google Scholar] [CrossRef]
- Sharifi, E.; Steinacker, R.; Saghafian, B. Assessment of GPM-IMERG and other precipitation products against gauge data under different topographic and climatic conditions in Iran: Preliminary results. Remote Sens. 2016, 8, 135. [Google Scholar] [CrossRef]
- Cheema, M.; Bastiaanssen, W. Local calibration of remotely sensed rainfall from the TRMM satellite for different periods and spatial scales in the Indus Basin. Int. J. Remote Sens. 2012, 33, 2603–2627. [Google Scholar] [CrossRef]
- Bonacina, L.C.W.; Poulter, R.; Ashmore, S.; Manley, G.; Bonacina, L. Orographic rainfall and its place in the hydrology of the globe. Q. J. Roy. Meteor. Soc. 1945, 71, 41–55. [Google Scholar]
- Hughes, M.; Hall, A.; Fovell, R.G. Blocking in areas of complex topography, and its influence on rainfall distribution. J. Atmos. Sci. 2009, 66, 508–518. [Google Scholar] [CrossRef]
- Kumari, M.; Singh, C.K.; Bakimchandra, O.; Basistha, A. Geographically weighted regression based quantification of rainfall–topography relationship and rainfall gradient in Central Himalayas. Int. J. Climatol. 2017, 37, 1299–1309. [Google Scholar] [CrossRef]
- Qing, Y.; Zhu-Guo, M.A.; Liang, C. A preliminary analysis of the relationship between precipitation variation trends and altitude in China. Atmos. Ocean. Sci. Lett. 2011, 4, 41–46. [Google Scholar] [CrossRef]
- Qu, W.; Wang, J.; Gao, S.; Wu, T. Effect of the strengthened western Pacific subtropical high on summer visibility decrease over eastern China since 1973. J. Geophys. Res. Atmos. 2013, 118, 7142–7156. [Google Scholar] [CrossRef] [Green Version]
- Ueda, H.; Ohba, M.; Xie, S.P. Important factors for the development of the Asian–Northwest Pacific summer monsoon. J. Clim. 2009, 22, 649–669. [Google Scholar] [CrossRef]
- Xie, S.P.; Hu, K.; Hafner, J.; Tokinaga, H.; Du, Y.; Huang, G.; Sampe, T. Indian Ocean capacitor effect on Indo–Western Pacific climate during the summer following El Niño. J. Clim. 2009, 22, 730–747. [Google Scholar] [CrossRef]
- Meng, J.; Li, L.; Hao, Z.; Wang, J.; Shao, Q. Suitability of TRMM satellite rainfall in driving a distributed hydrological model in the source region of Yellow River. J. Hydrol. 2014, 509, 320–332. [Google Scholar] [CrossRef]
- Tang, G.; Long, D.; Hong, Y. Systematic anomalies over inland water bodies of High Mountain Asia in TRMM precipitation estimates: No longer a problem for the GPM era? IEEE Geosci. Remote Sens. Lett. 2016, 13, 1762–1766. [Google Scholar] [CrossRef]
- Awange, J.; Forootan, E. An evaluation of high-resolution gridded precipitation products over Bhutan (1998–2012). Int. J. Climatol. 2016, 36, 1067–1087. [Google Scholar]


| G ≥ Threshold | G < Threshold | |
|---|---|---|
| P ≥ threshold | H (hits) | F (false alarms) |
| P < threshold | M (misses) | CN (correct negatives) |
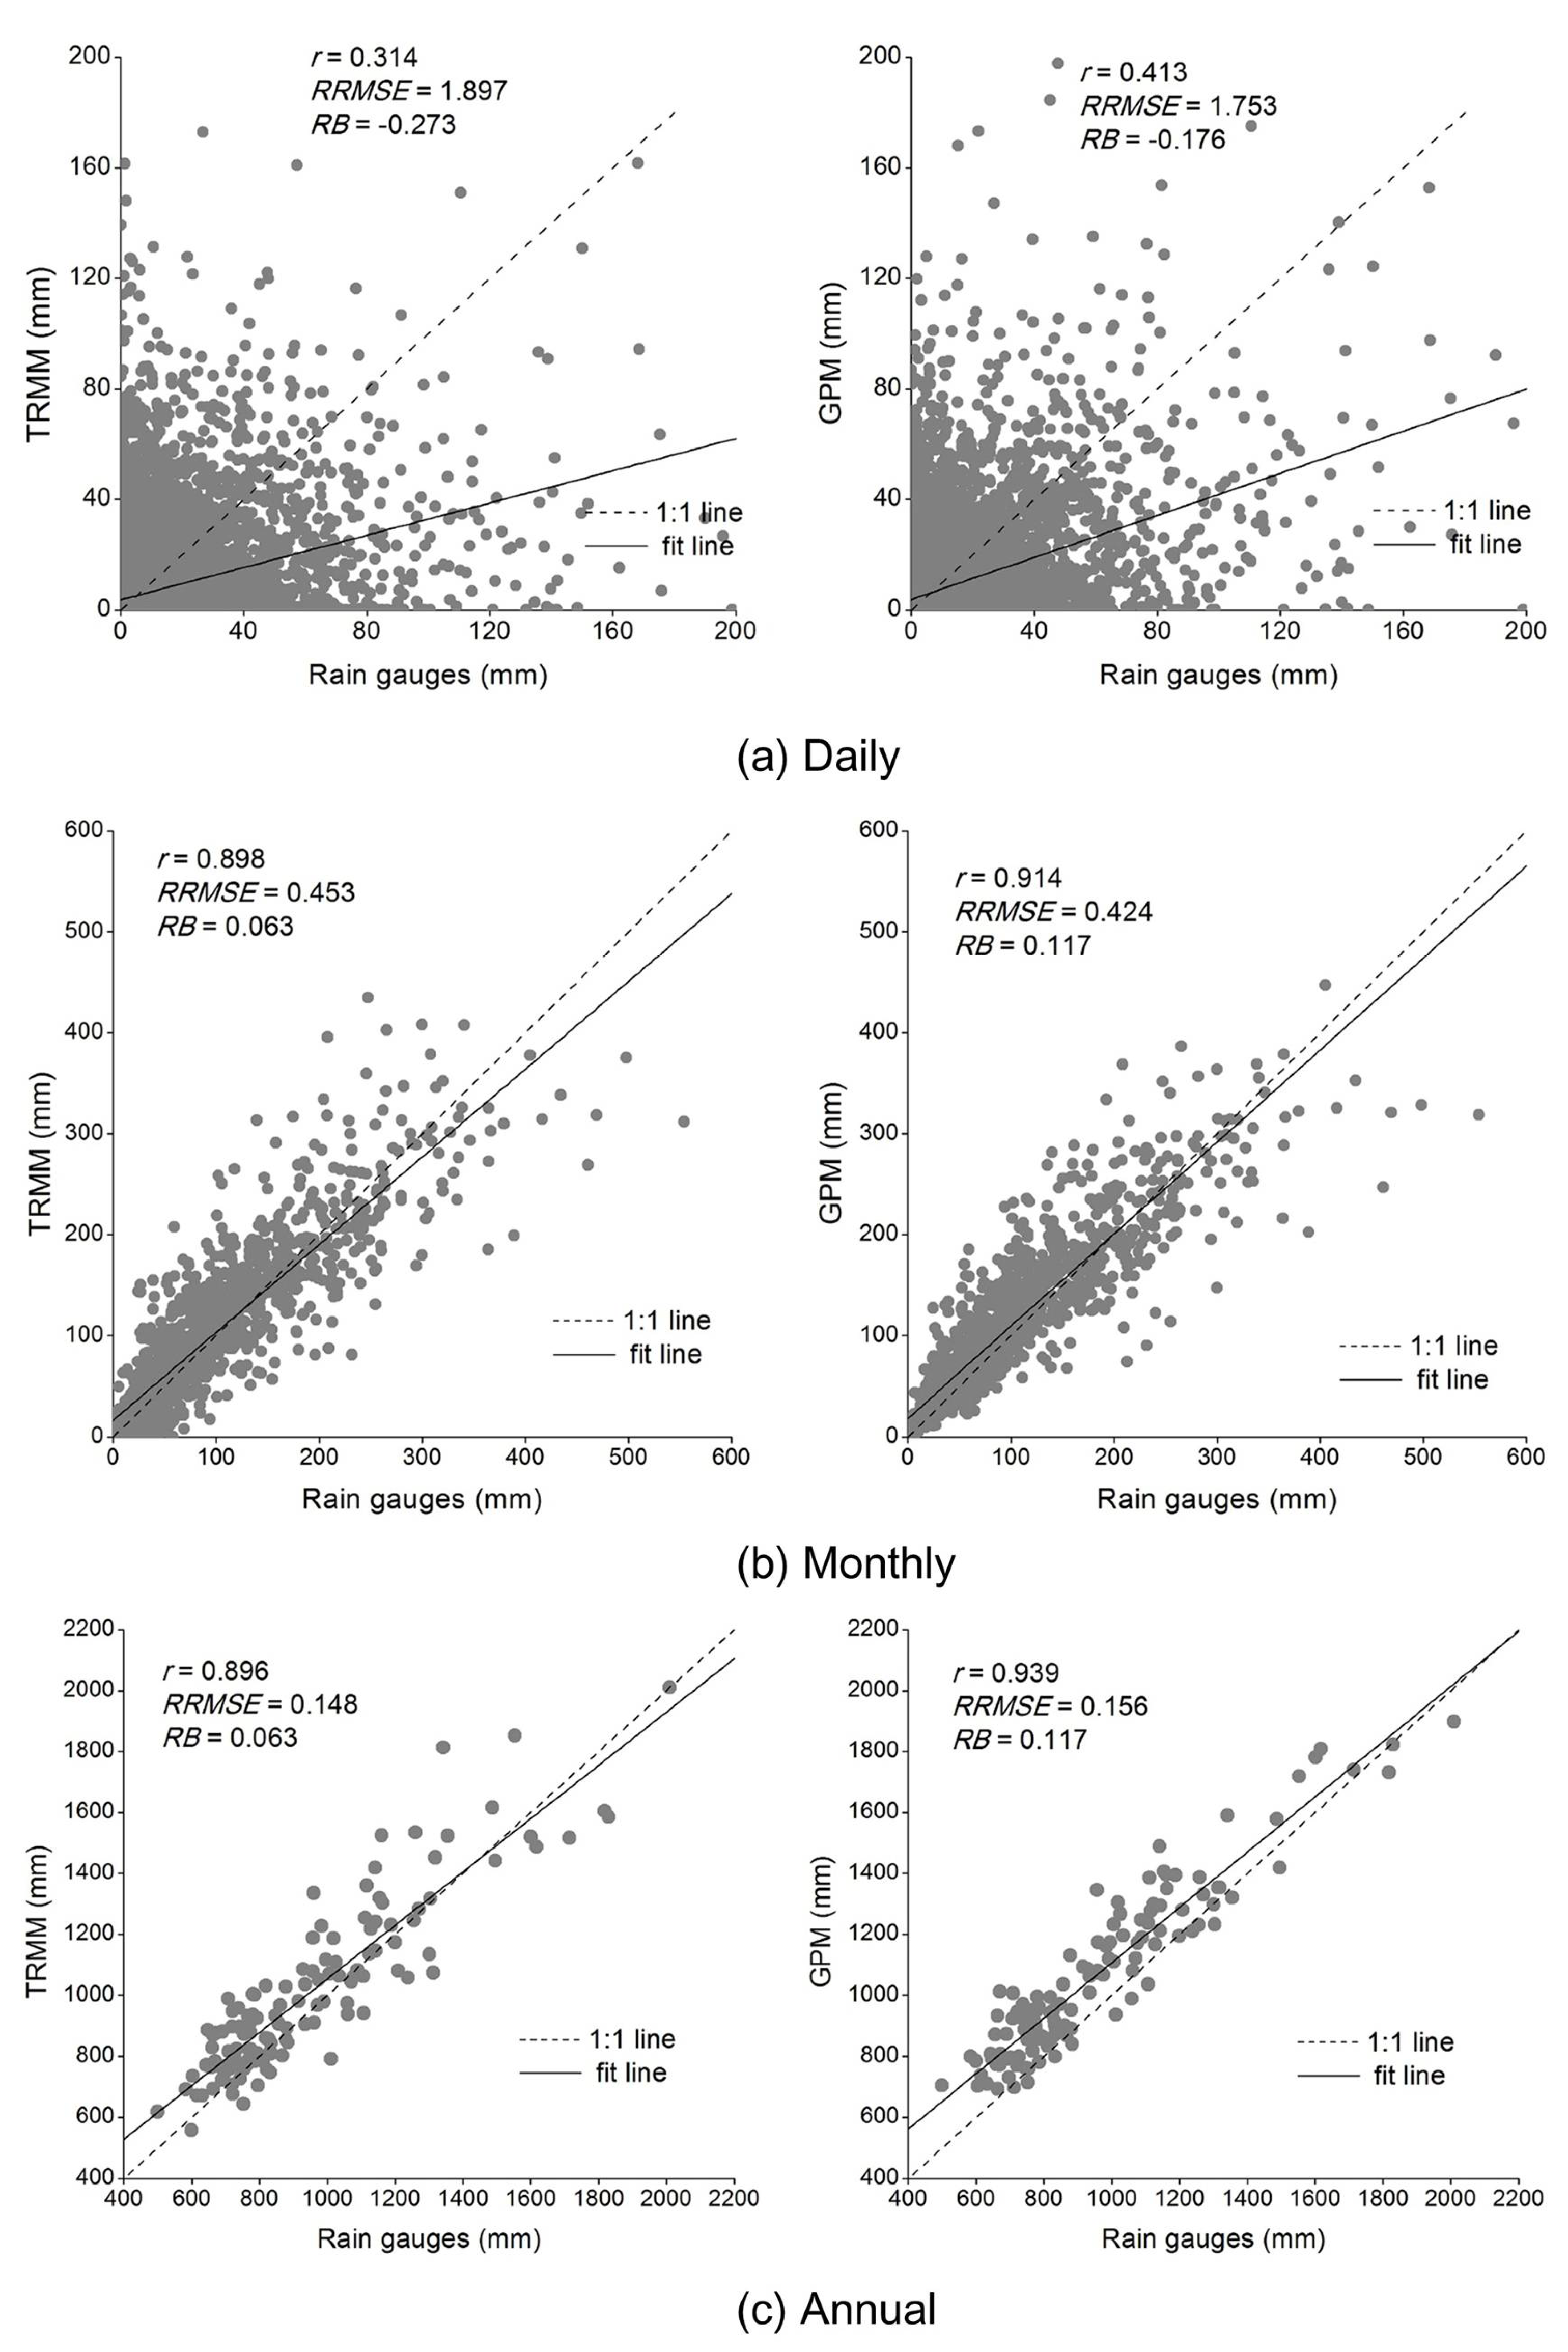
| Time Scales | Satellite Products | r | RB | RRMSE |
|---|---|---|---|---|
| Daily | TRMM 0.25° | 0.259 | –0.385 | 1.965 |
| TRMM 0.1° | 0.314 | –0.273 | 1.897 | |
| GPM 0.1° | 0.413 | –0.176 | 1.753 | |
| Monthly | TRMM 0.25° | 0.904 | 0.059 | 0.442 |
| TRMM 0.1° | 0.896 | 0.063 | 0.453 | |
| GPM 0.1° | 0.914 | 0.117 | 0.424 | |
| Annual | TRMM 0.25° | 0.901 | 0.059 | 0.141 |
| TRMM 0.1° | 0.896 | 0.063 | 0.148 | |
| GPM 0.1° | 0.939 | 0.117 | 0.156 |
| r | ||||||
|---|---|---|---|---|---|---|
| r | Absolute RB | RRMSE | ||||
| TRMM | GPM | TRMM | GPM | TRMM | GPM | |
| Elevation | –0.40 log | –0.42 log | # | # | # | 0.38 lin |
| Annual rainfall | 0.56 lin | # | –0.54 exp | 0.36 exp | # | # |
© 2018 by the authors. Licensee MDPI, Basel, Switzerland. This article is an open access article distributed under the terms and conditions of the Creative Commons Attribution (CC BY) license (http://creativecommons.org/licenses/by/4.0/).
Share and Cite
Chen, C.; Chen, Q.; Duan, Z.; Zhang, J.; Mo, K.; Li, Z.; Tang, G. Multiscale Comparative Evaluation of the GPM IMERG v5 and TRMM 3B42 v7 Precipitation Products from 2015 to 2017 over a Climate Transition Area of China. Remote Sens. 2018, 10, 944. https://doi.org/10.3390/rs10060944
Chen C, Chen Q, Duan Z, Zhang J, Mo K, Li Z, Tang G. Multiscale Comparative Evaluation of the GPM IMERG v5 and TRMM 3B42 v7 Precipitation Products from 2015 to 2017 over a Climate Transition Area of China. Remote Sensing. 2018; 10(6):944. https://doi.org/10.3390/rs10060944
Chicago/Turabian StyleChen, Cheng, Qiuwen Chen, Zheng Duan, Jianyun Zhang, Kangle Mo, Zhe Li, and Guoqiang Tang. 2018. "Multiscale Comparative Evaluation of the GPM IMERG v5 and TRMM 3B42 v7 Precipitation Products from 2015 to 2017 over a Climate Transition Area of China" Remote Sensing 10, no. 6: 944. https://doi.org/10.3390/rs10060944