1. Introduction
With the development of remote sensing sensors, satellite image sensors can offer images with a spatial resolution at the decimeter level. We call these images high-resolution remote sensing images (HRIs). However, despite enhanced resolution, these details often suffer from the spectral uncertainty problems stemming from an increase of the intra-class variance [
1] and a decrease of the inter-class variance [
2]. Taking into account these characteristics, HRIs classification methods have evolved from pixel-oriented methods to object-oriented methods and have achieved precise object recognition performance [
3,
4,
5]. However, these methods may lead to the so-called “semantic gap” [
6], namely the divergence between low-level data and high-level semantic information. In order to better acquire the semantic information in accordance with human cognition, scene classification aimed at automatically labeling an image from a set of semantic categories [
7], has been proposed with remarkable success in image interpretation.
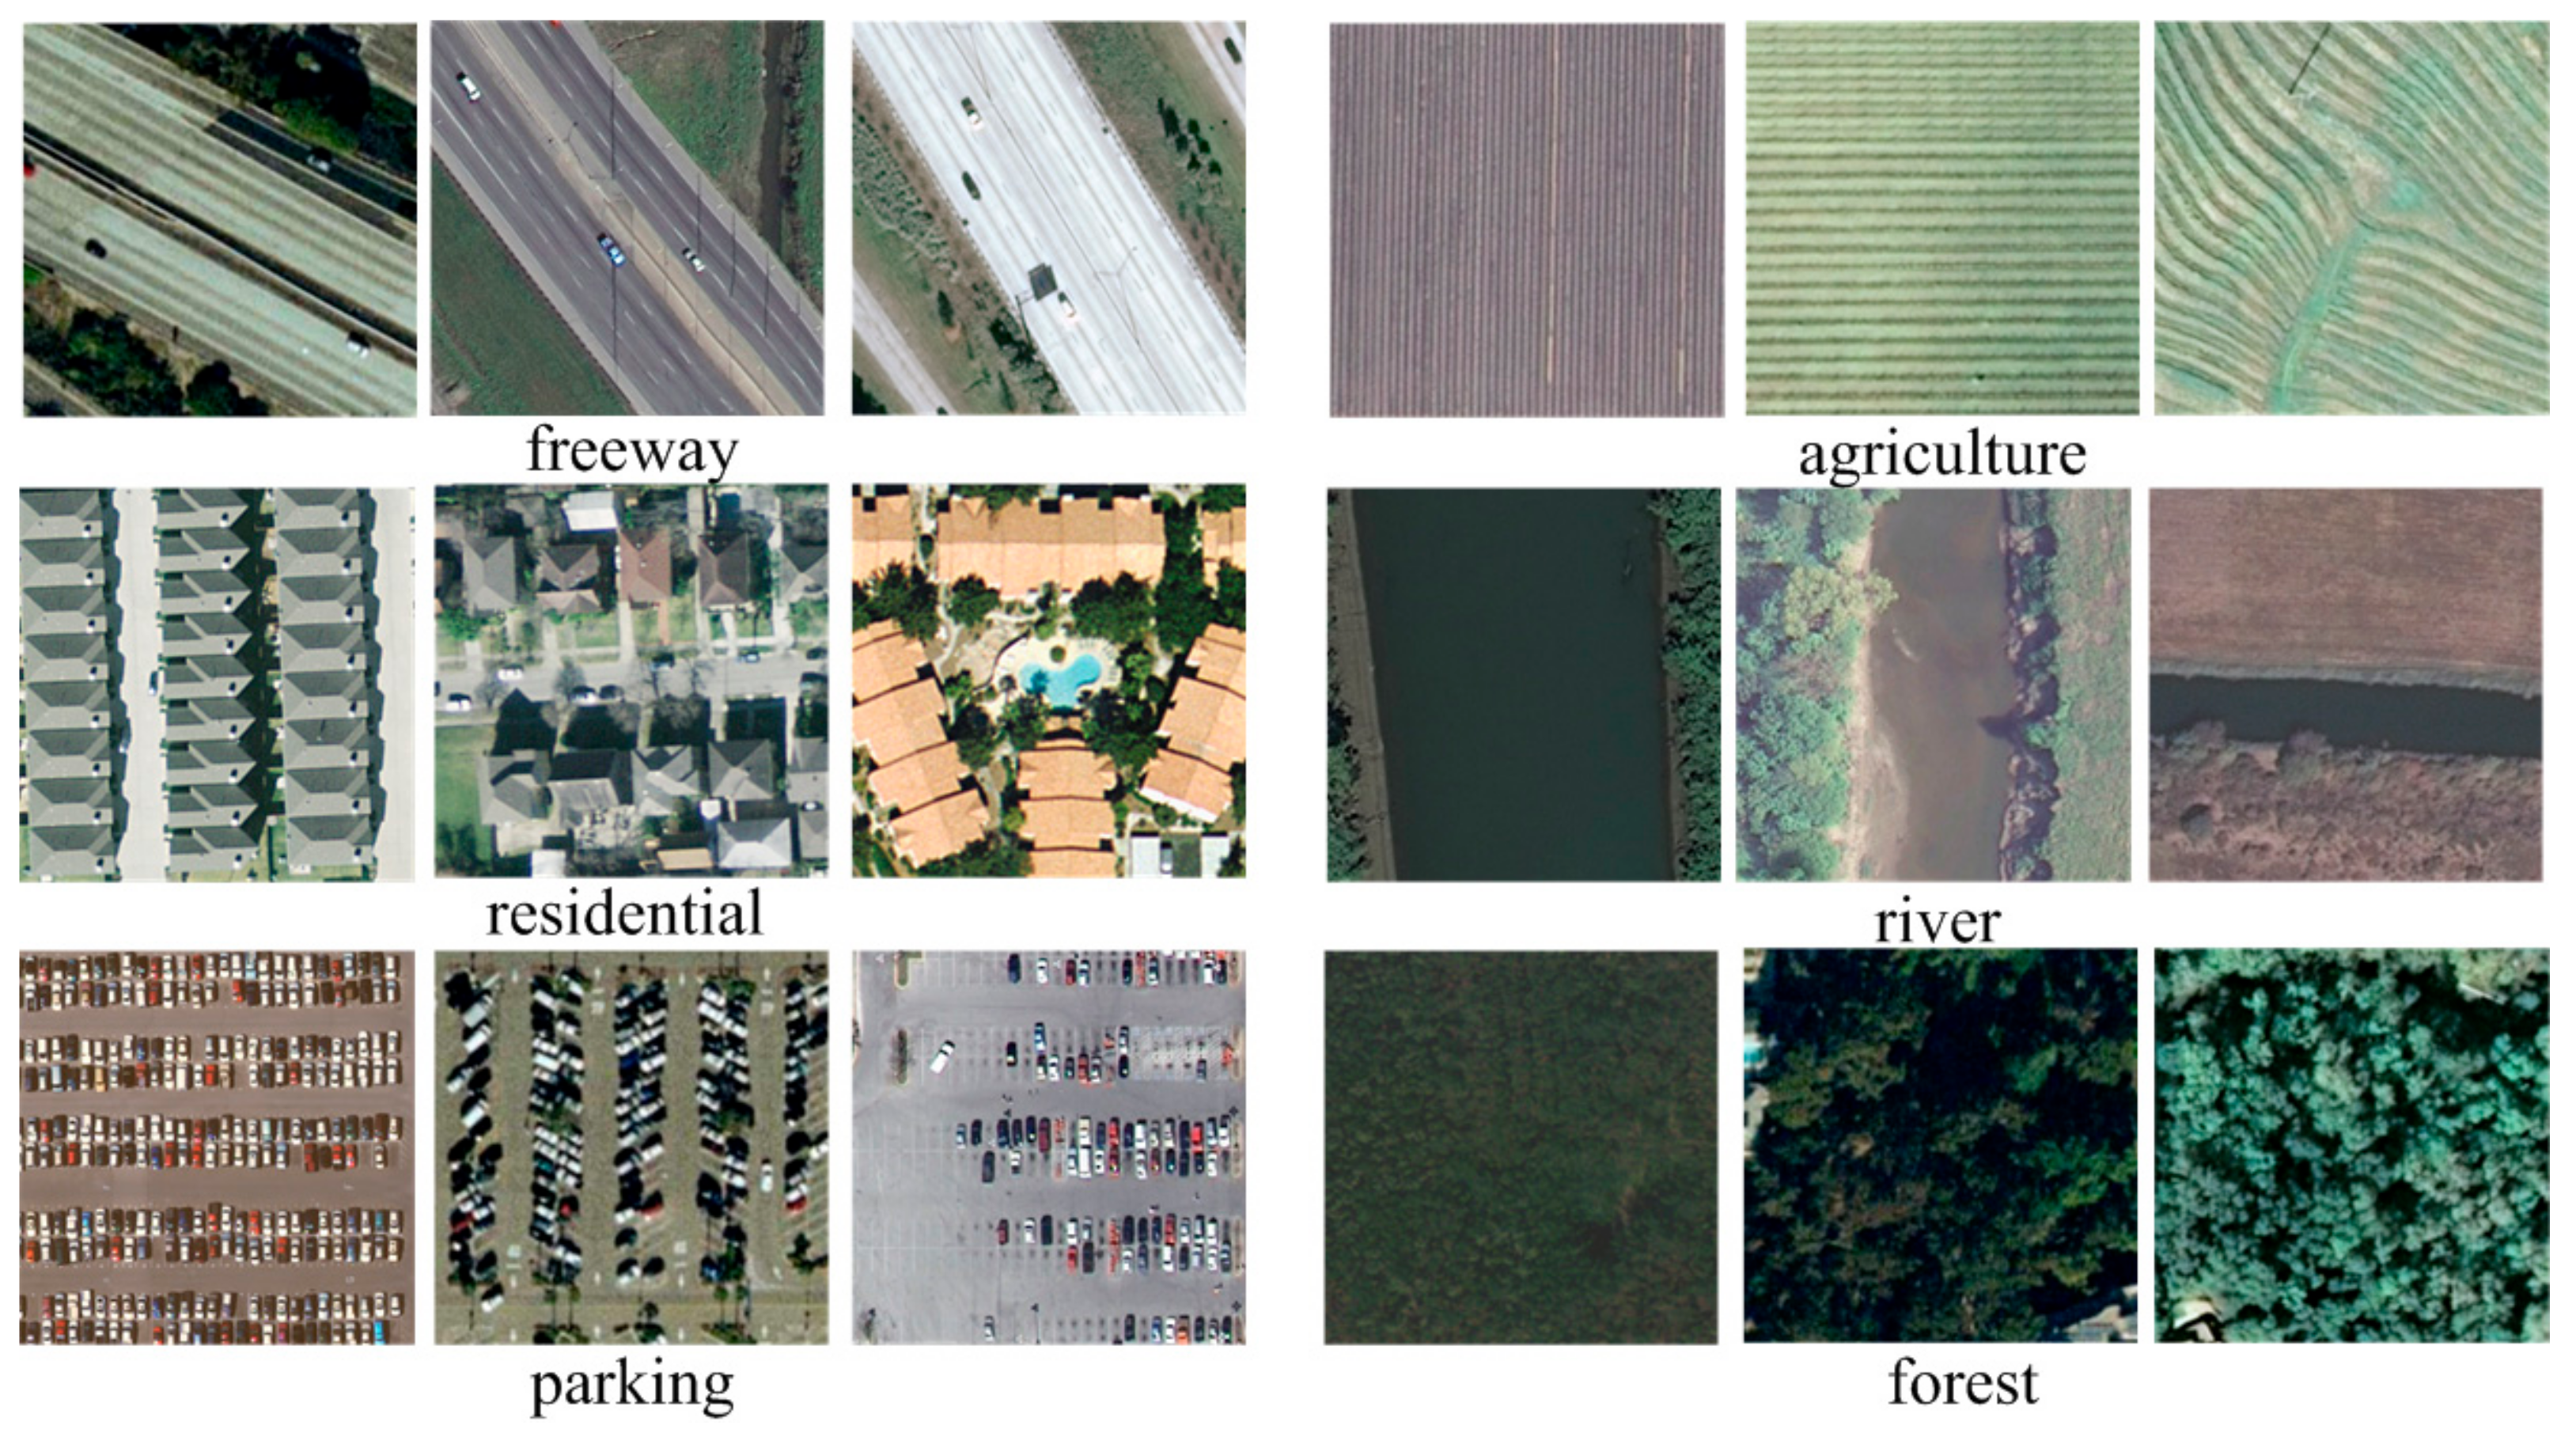
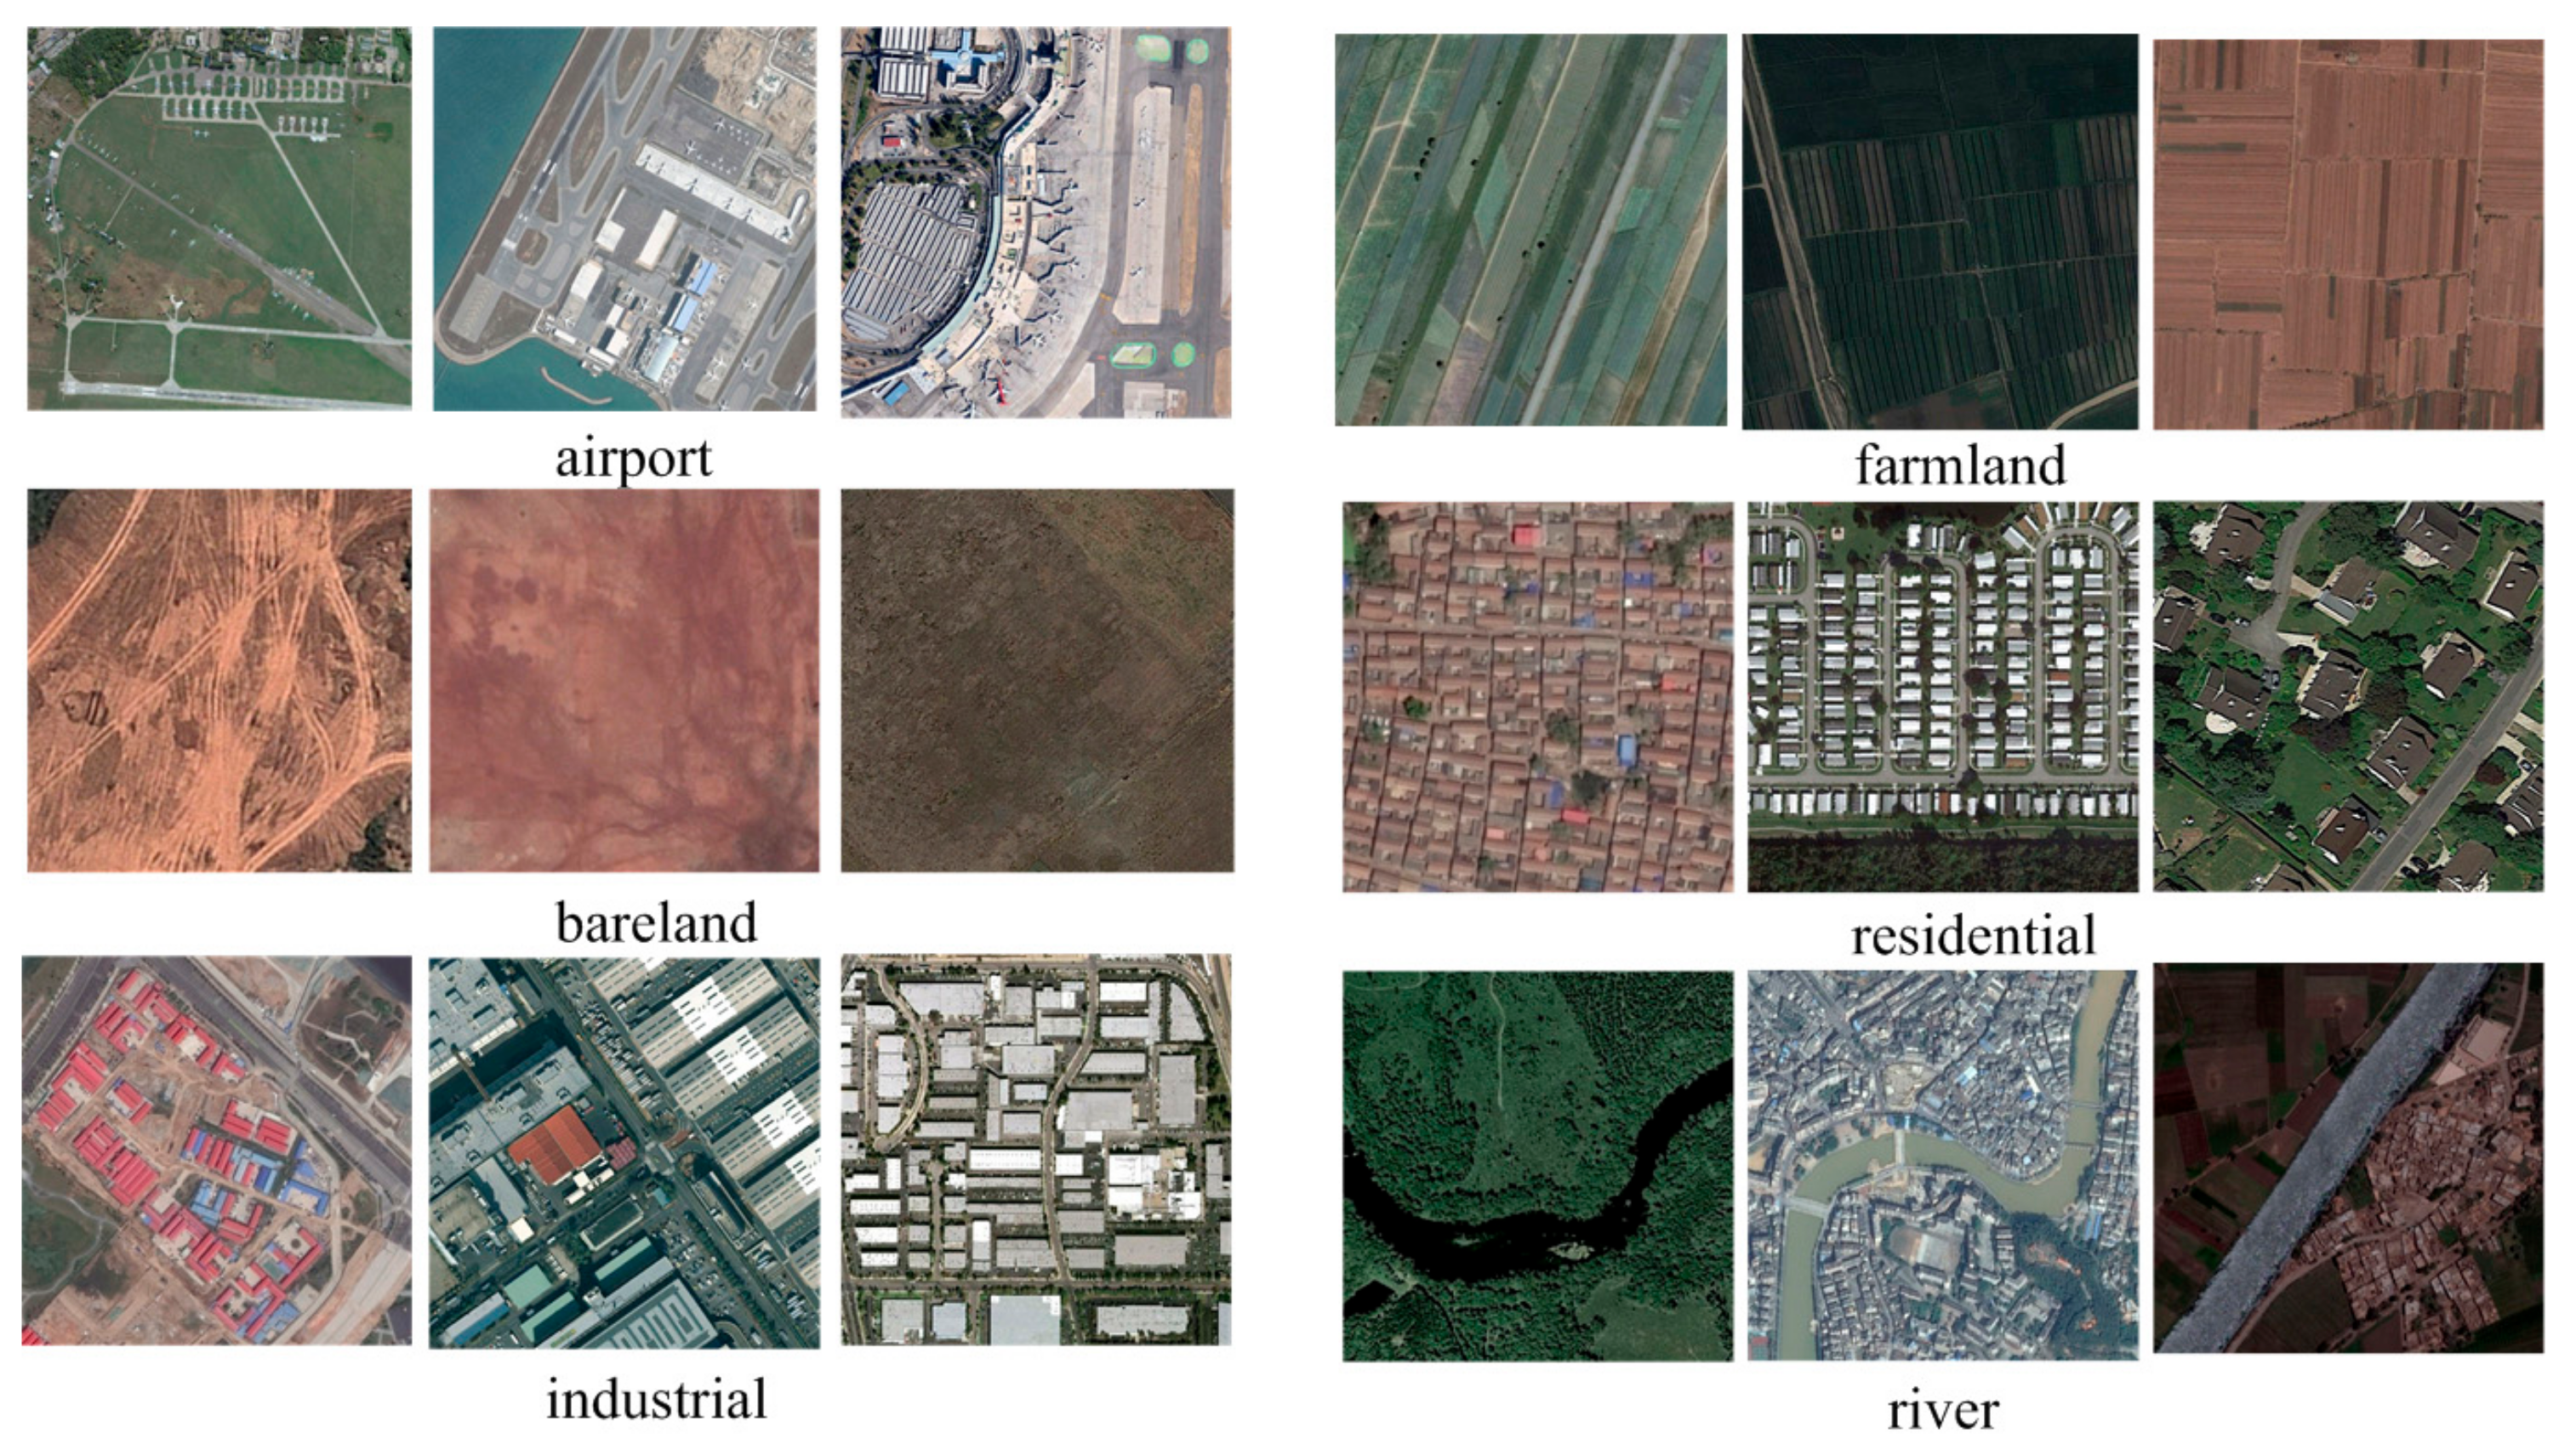
Scene classification with HRI is usually based on supervised learning method requiring a set of new collected samples [
8,
9]. However, we are usually faced with the tasks that the target images are with a limited number of samples, but we have sufficient previous labeled data. In many cases, previous labeled data remains useful for training a new target classifier [
10,
11]. However, the direct application of previous instances to new remote sensing images often provides poor results because the spectra observed in the new scene is highly different from that in the existing scenes even though they represent the same types of objects. This is due to a variety of factors, such as changes in the acquisition conditions including the illumination or acquisition angle, seasonal changes, or the use of different sensors. This problem can be suppressed by transfer learning methods [
12].
As mentioned by Devis Tuia [
13], transfer learning methods in the remote sensing literature can be categorized into four categories:
- (1)
Selection of invariant features. These methods are usually achieved by considering only a subset of the original features that are invariant between the domains [
14,
15,
16,
17,
18].
- (2)
Adaptation of the data distributions. Data is adapted such that the feature distributions over the different domains are more compatible. This technique is also known as feature extraction and representation learning [
19,
20,
21,
22,
23,
24,
25].
- (3)
Adaptation of the classifier with semi-supervised method. Techniques belonging to this family take a semi-supervised strategy that utilizes the unlabeled target samples to adapt a classifier trained using the labeled source samples [
26,
27,
28,
29,
30,
31].
- (4)
Adaptation of the classifier by active learning (AL). These techniques also utilize a semi-supervised strategy. However, instead of automatically labeling samples from the target domain, these techniques require the user to label some target samples. Therefore, the main challenge here is how to select the minimal set of informative target samples that the expert user needs to annotate [
32,
33,
34,
35,
36].
In order to recognize and analyze scenes from remote sensing images, various scene classification methods have been proposed over decades. One particular method called the bag-of-visual-words (BOVW) [
37,
38], has been successfully utilized for scene classification. The BOVW approach treats an image as a collection of unordered feature descriptors, and represents images with the frequency of “visual words” that are constructed by quantizing local features. It can be divided into two parts: dictionary learning and feature encoding. Dictionary learning consists of clustering feature descriptors in each local patch and using the resulting clusters as visual vocabularies. These visual vocabularies can be used for the feature encoding. In the feature encoding step, the images are finally represented by the unordered collections of the visual vocabularies and the histograms of the occurrences concerning the visual vocabularies.
However, the BOVW representation does not perform well in the adaptation of the data distributions due to following reasons:
- (1)
The influence of background information in images. Existing BOVW representations mainly extract features from the whole image rather than the salient regions, which may lead to higher difference between representations from both domains owing to more complex scenes in remote sensing domains.
- (2)
The effect of rotation transformation. Existing BOVW methods suffer from rotation transformations since patches in spatial pyramid matching (SPM) [
39] are in a fixed order. Therefore, when faced with more serious rotation transformations in images from both domains, poor cross-domain scene classification performance may be delivered due to aggravated feature bias between two domains.
- (3)
The transfer of SVM parameters from the source to the target domain. The performance of support vector machine classifiers [
40] is directly influenced by the values of its free parameters. The free parameters of instances in the source domain are different from those in the target domain because of different feature distributions. Therefore, more optimal parameters for the target domain need to be adjusted to the free parameters in the source domain.
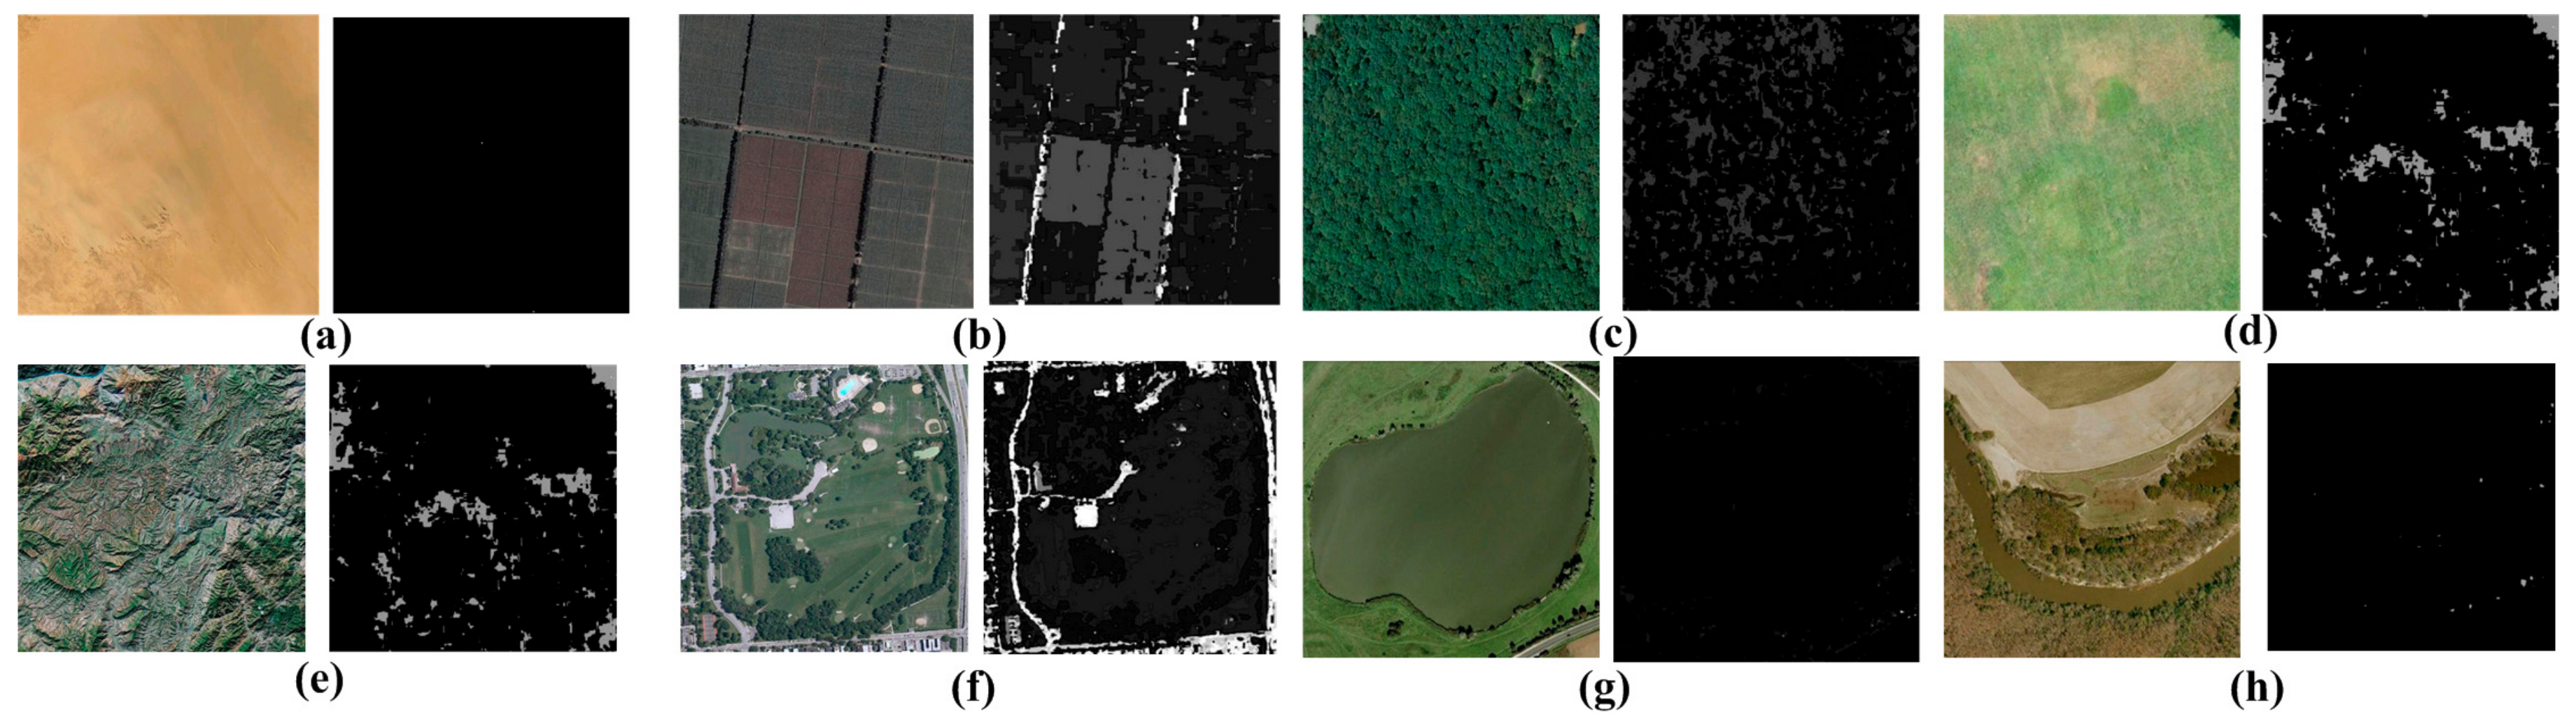
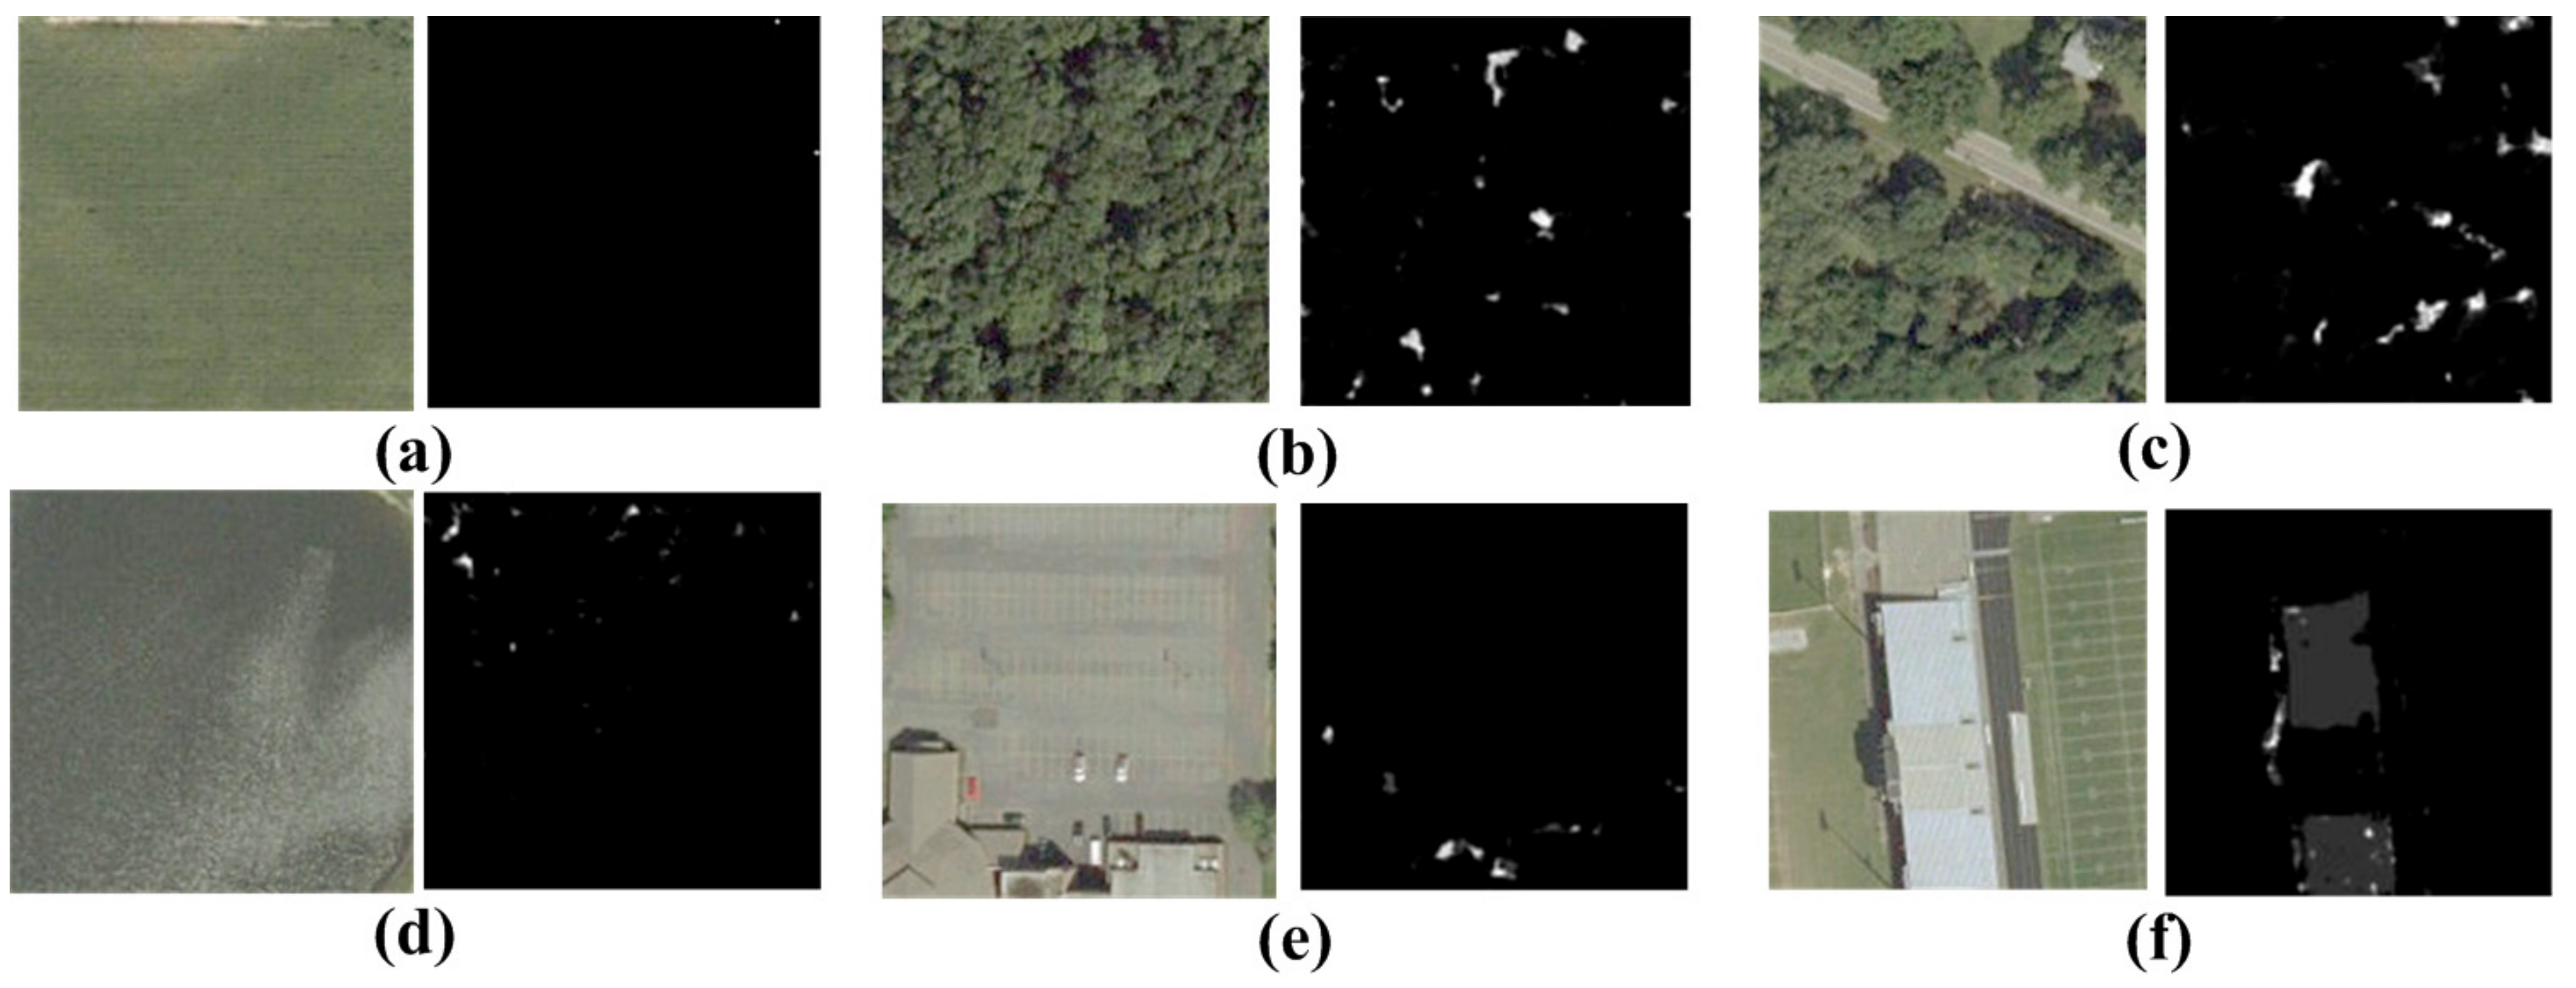
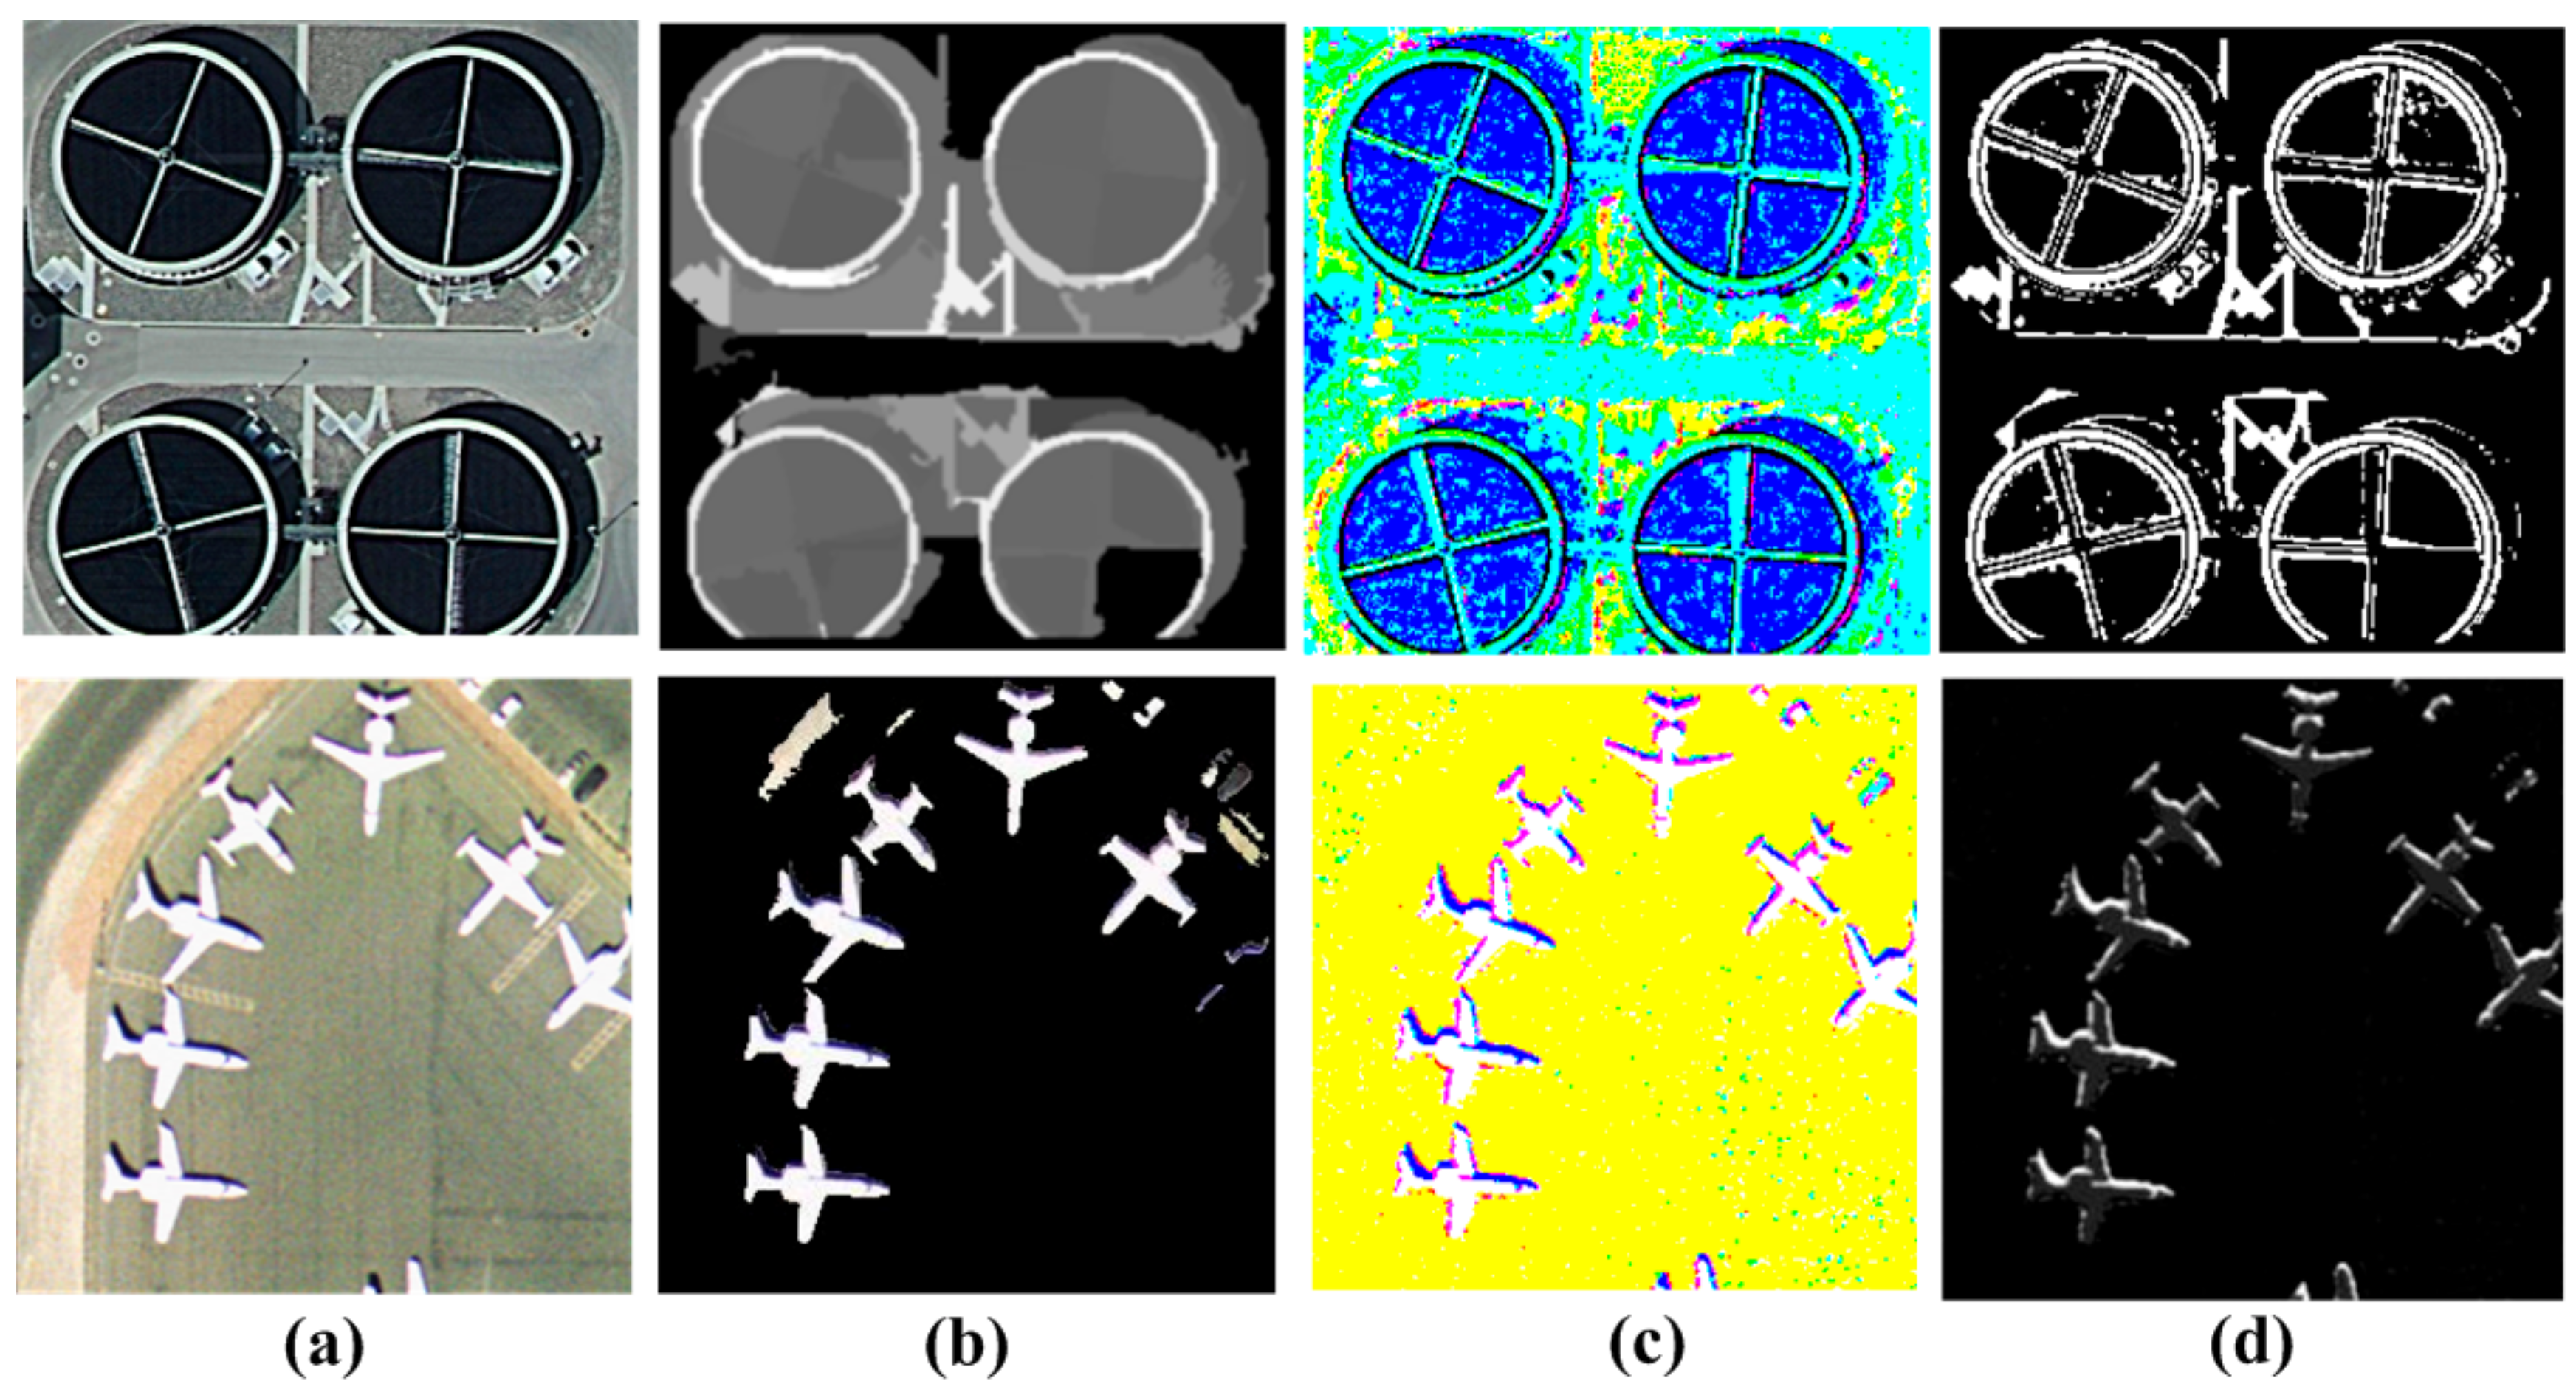
The BOVW representation considers feature representations of a set of patches from SPM in the whole image. However, it may be affected by noisy information, such as the background or other irrelevant objects, which may increase the feature difference in the representations of the same category from different domains. In order to solve this problem, various studies have been conducted on salient region detection to detect the salient objects in the same category from both domains for higher similarity in BOVW representations, such as airplanes in airports, cars in parking lots, and so on. The salient region detection methods can be categorized into two types: local contrast based methods and global contrast methods [
41].
Local contrast based methods investigate the rarity of image regions with respect to local neighborhoods. Itti [
42] defines image saliency using central-surrounded differences between multi-scale image features based on the highly influential biologically-inspired early representation model introduced by Koch and Ullman [
43]. Ma and Zhang [
44] propose an alternate local contrast analysis for generating saliency maps, which is then extended using a fuzzy growth model. Liu [
45] finds multi-scale contrast by linearly combining contrast to a Gaussian image pyramid. More recently, Goferman [
46] simultaneously modeled local low-level clues, global considerations, visual organization rules, and high-level features to highlight salient objects along with their contexts. Such methods using local contrasts tend to produce higher saliency values near edges instead of uniformly highlighting salient regions in images, which may remove regions corresponding to relevant objects.
In order to solve the problem of the local contrast based methods, global contrast-based methods have been proposed over decades. Global contrast-based methods evaluate saliency of an image region using its contrast with respect to the entire image. Zhai and Shah [
47] define pixel-level saliency based on a pixel’s contrast to all other pixels. However, for efficiency they use only luminance information, thus ignoring distinctiveness clues in other channels. Achanta [
48] proposes a frequency tuned method that directly defines pixel saliency using a pixel’s color difference from the average image color. The elegant approach, however, only considers first order average color, which can be insufficient to analyze complex variations in remote sensing images. Ko and Nam [
49] select salient regions using a support vector machine trained on image segment features, and then cluster these regions to extract salient objects. Han et al. [
50] model color, texture, and edge features of a Markov random field framework to grow salient object regions from seed values in the saliency maps. Cheng [
41] proposes the saliency of one region depends on its contrast with respect to its nearby regions, while contrasts to distant regions are less significant. However, when faced with complex scenes such as remote sensing images, the global contrast based saliency detection methods usually deliver poor performance because of relatively low contrast between background and salient objects, which may misclassify the background regions as salient regions [
51]. Therefore, a color-boosted method originally in salient point detectors [
52] has been introduced to global contrast-based salient region detection to increase the color contrast between different regions in images for more accurate salient region detection.
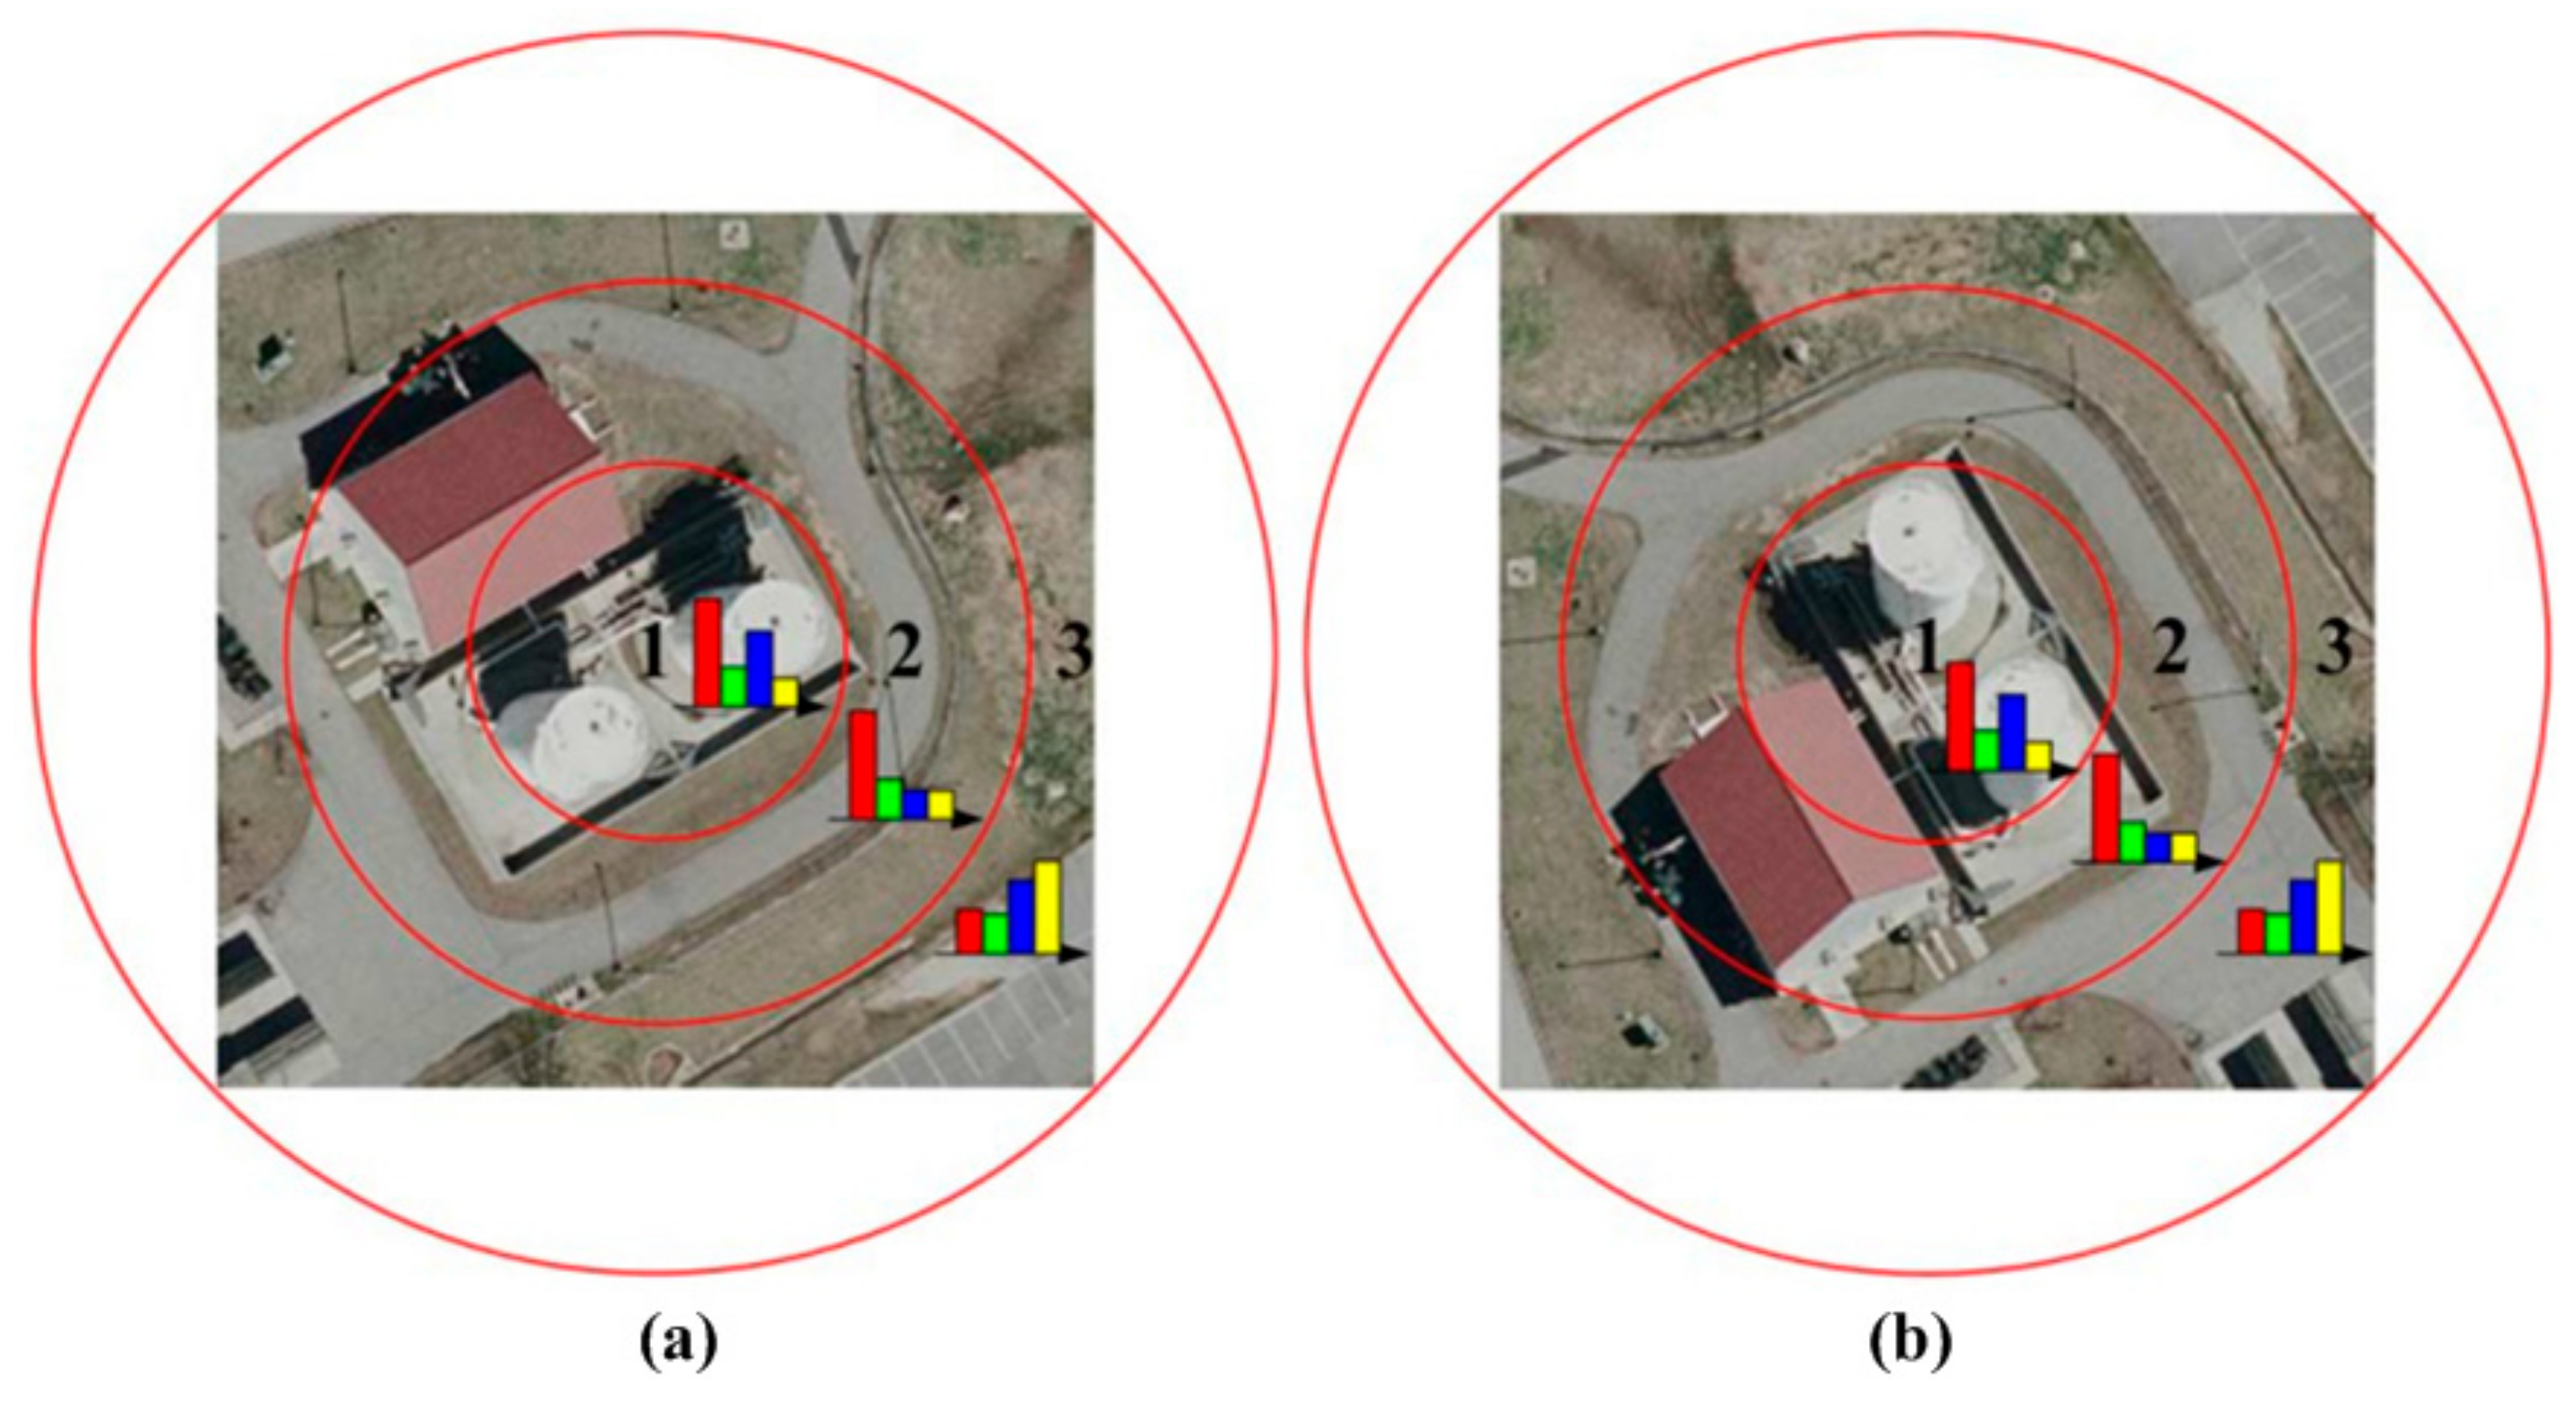
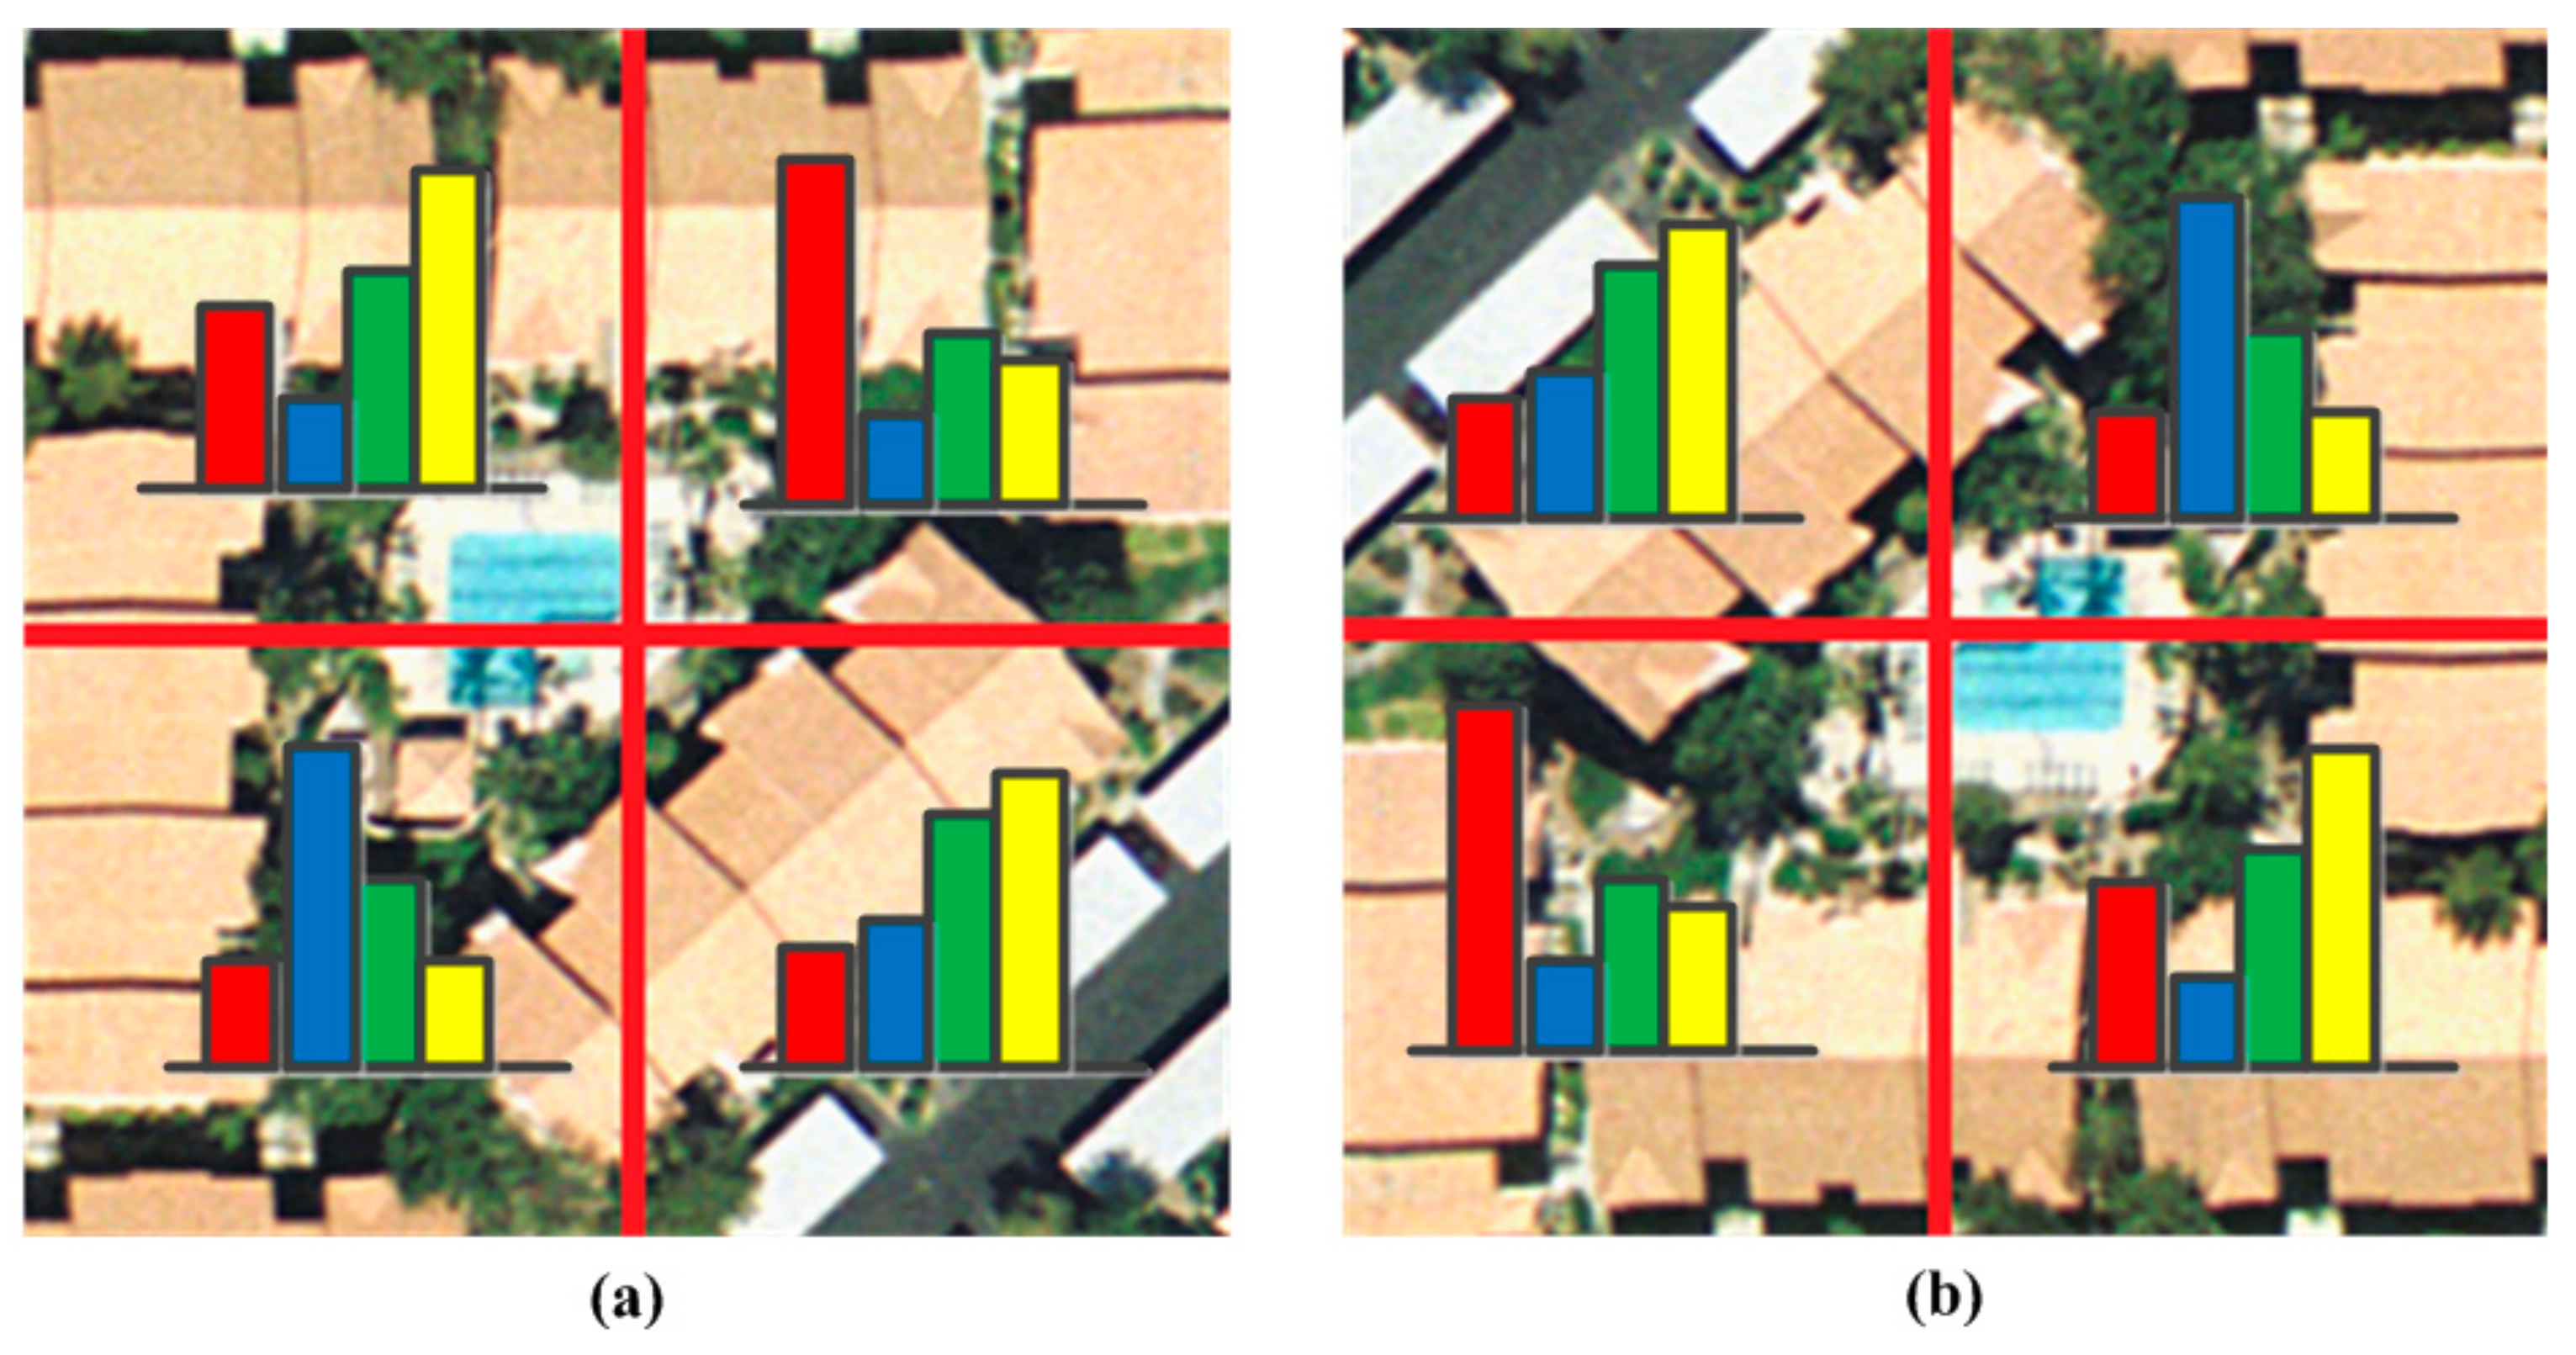
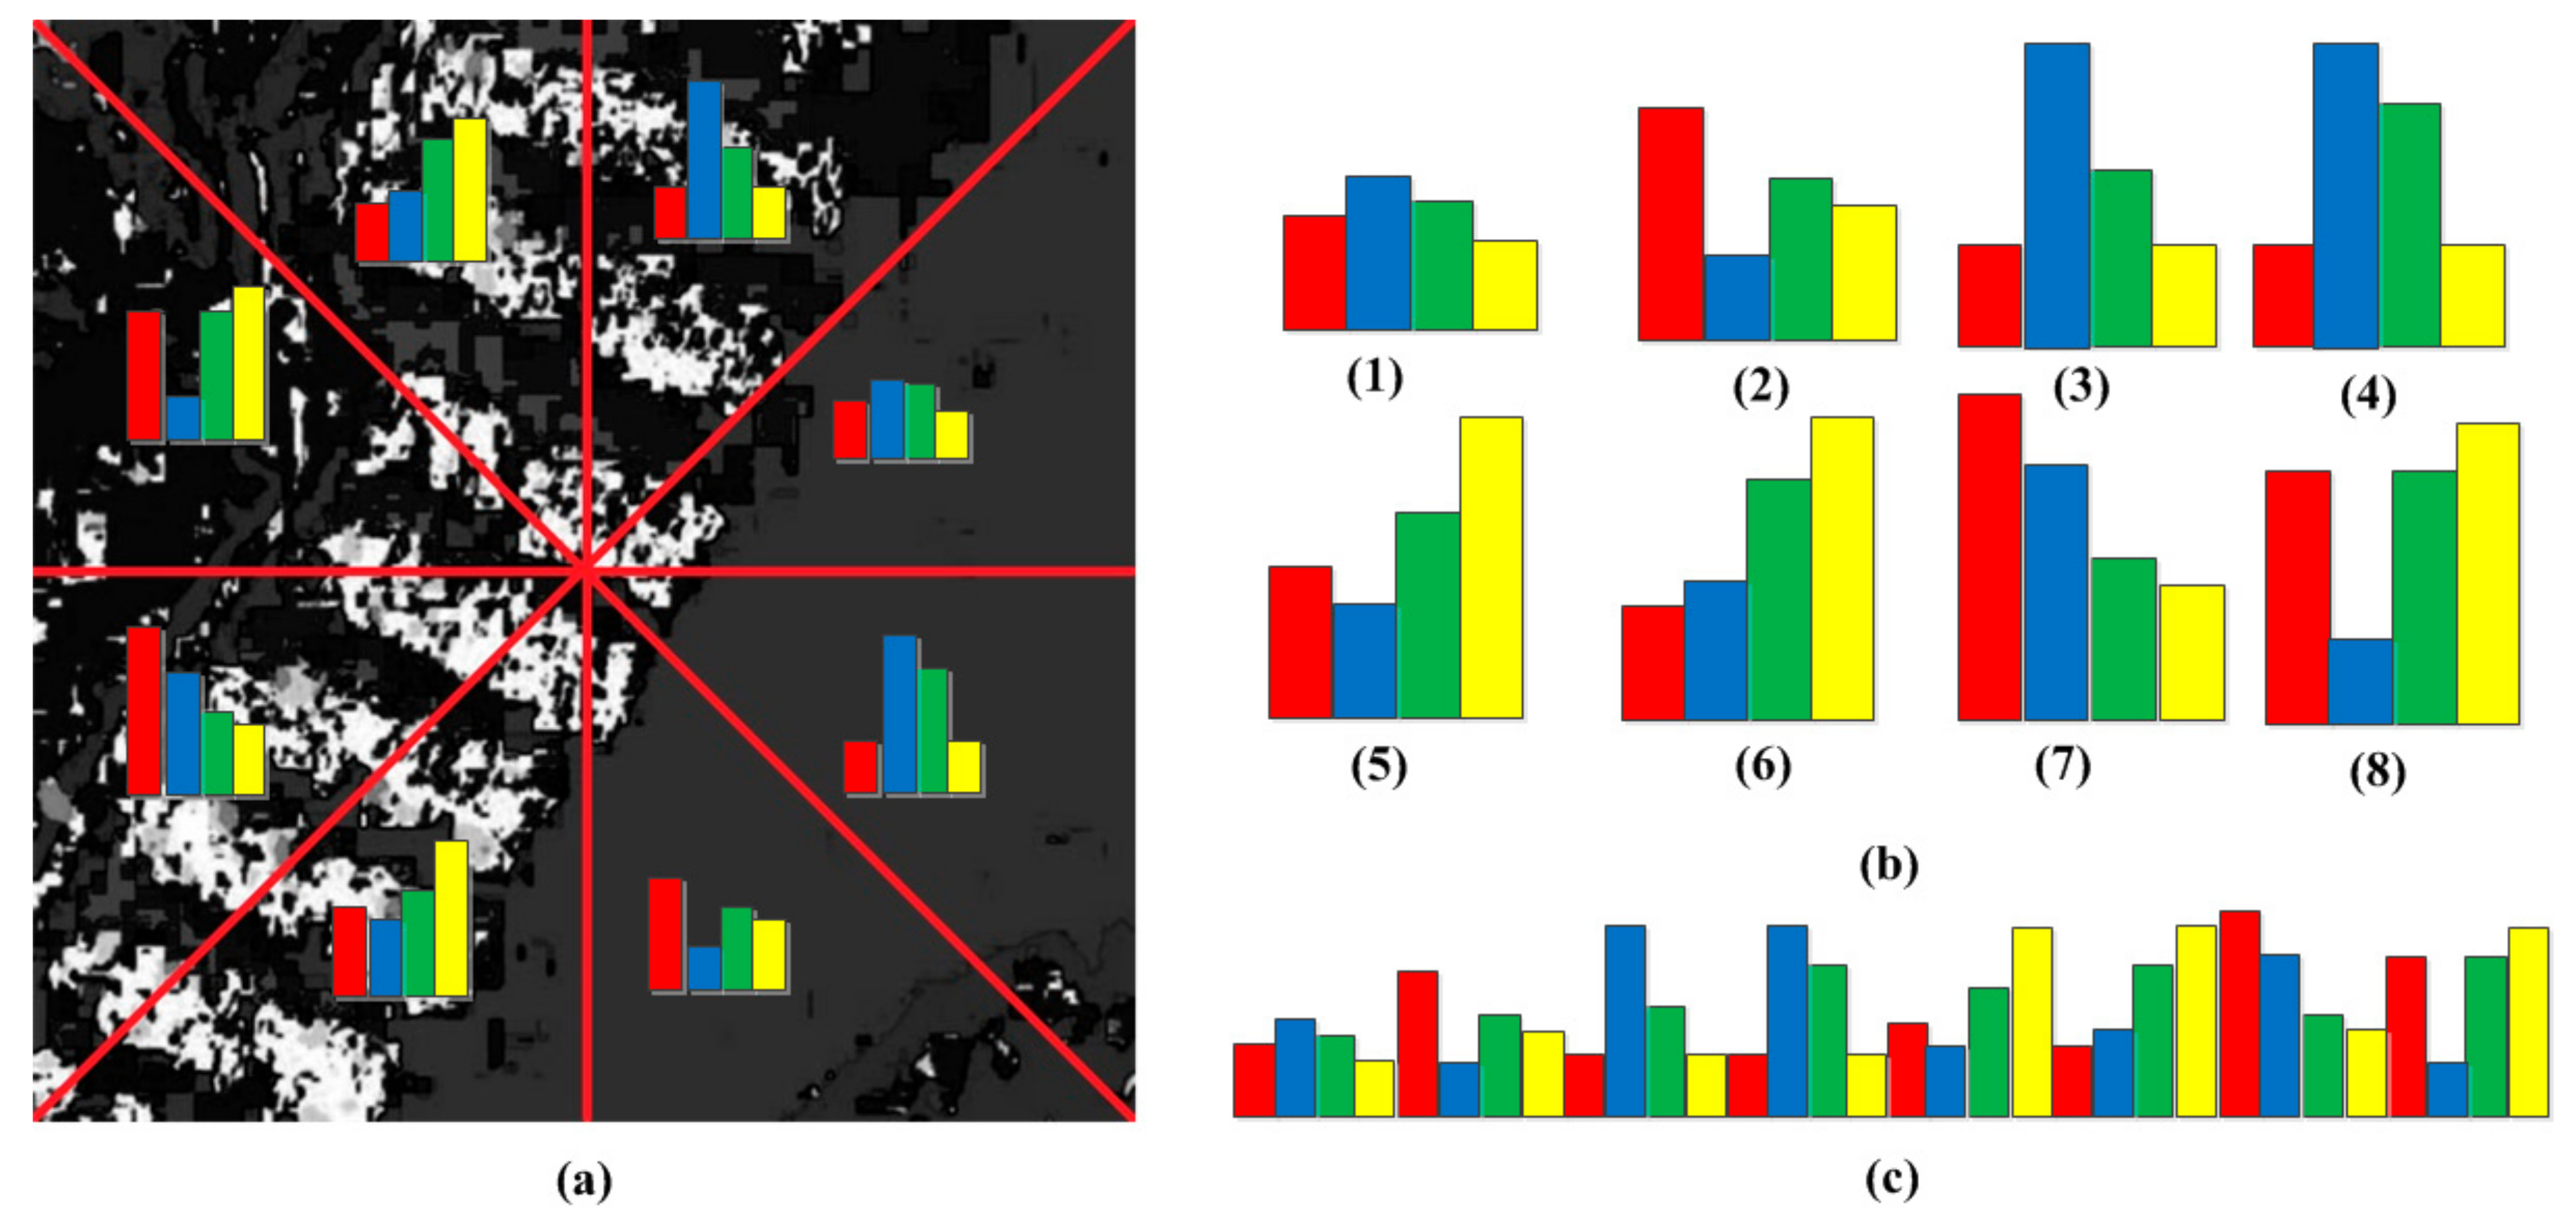
BOVW with the SPM method mostly uses ordered regular grid or block partition of an image to incorporate spatial information [
53] and, therefore, are sensitive to the rotation transformation of scenes, which will inevitably result in misclassification of scene images that belong to the same category and influence the classification accuracy. As shown in
Figure 1, many approaches based on the concentric circle-based partition strategy of an image in color and texture feature extraction has been proposed. Qi [
54] proposes a multi-scale deeply-described correlatons (MDDC)-based model by applying adaptive vector quantization of multi-scale correlograms to achieve rotation invariant representation without loss of discrimination. Zhao [
55] proposes a concentric circle-structured multi-scale BOVW model by partitioning the image into a series of annular sub-regions and computing histograms of local features found inside each annular sub region. Khan [
56] proposes a pairwise spatial histogram by concentric circles and angles centered on each descriptor. However, the spatial layout information may be lost to some degree since we only know these patches are adjacent but we do not know the specific spatial relationships. To solve this problem, a shifting operation is proposed to BOVW representation with an order of ascending distance between zero vector and feature vector in one sub-image from eight sub-images adjacent to each other uniformly segmented from the whole image, which is a simple, but effective, way to incorporate rotation-invariant spatial layout information of scene images into the original BOVW model.
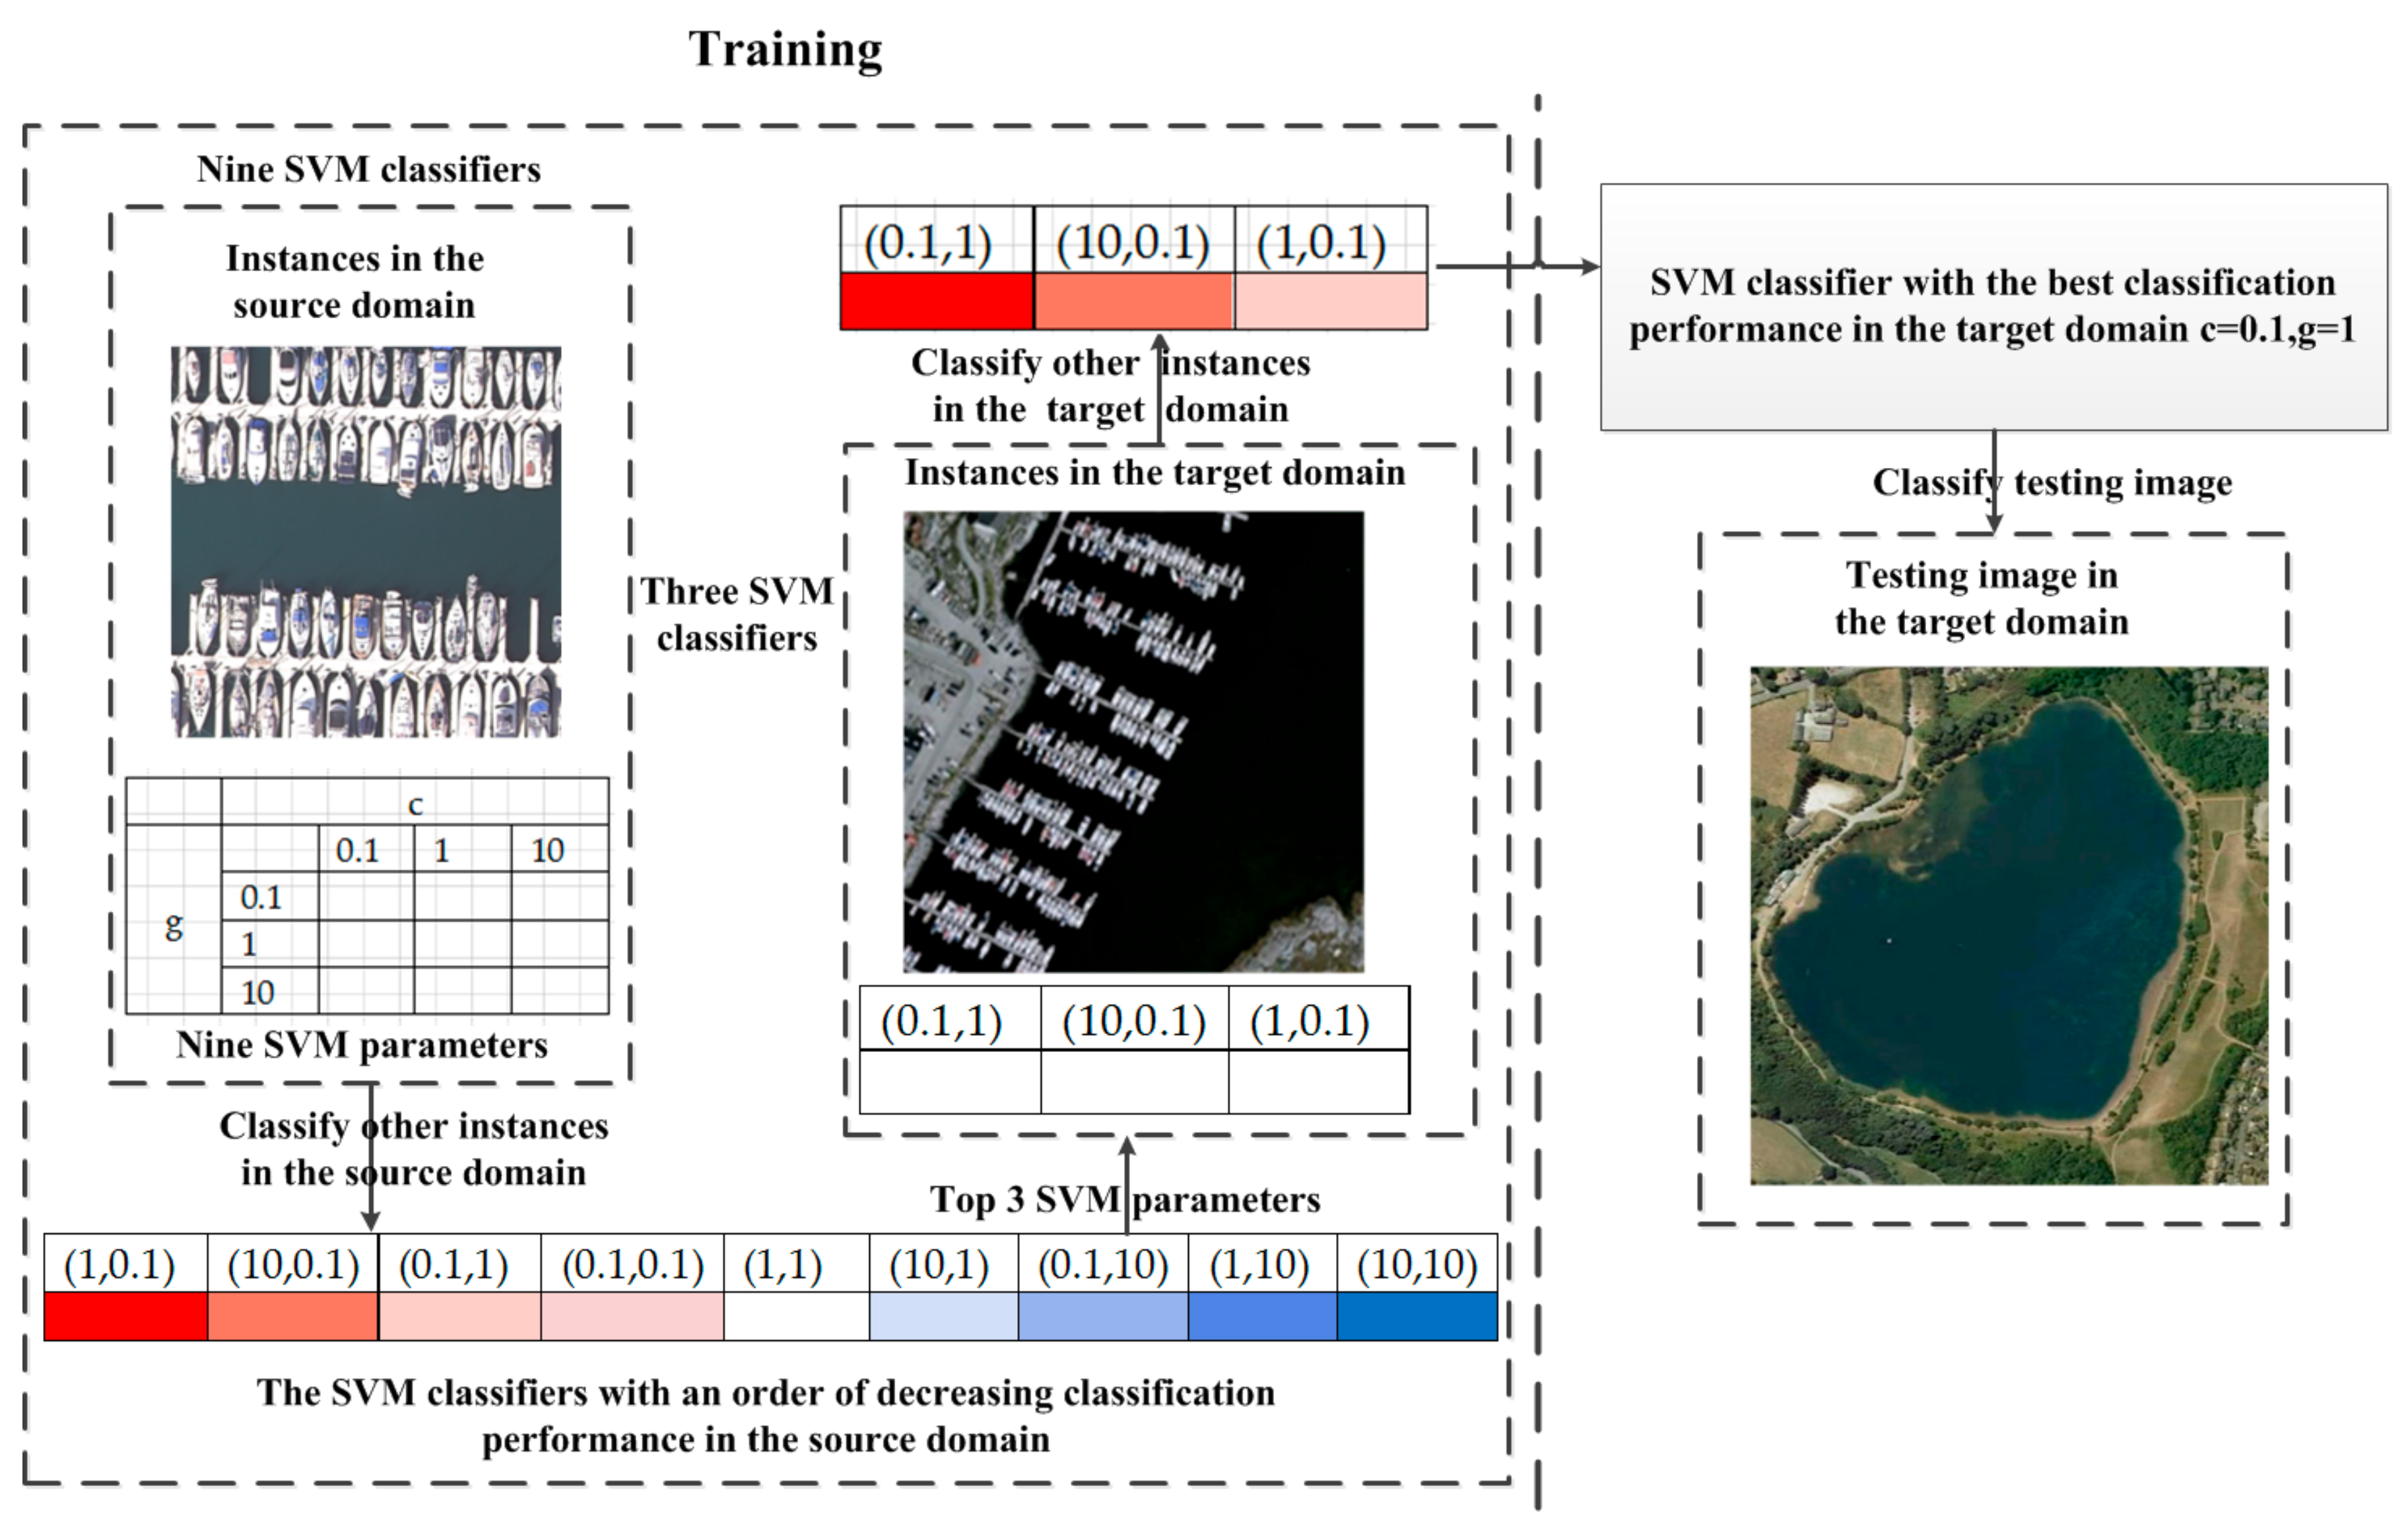
The BOVW representations will be put into a support vector machine (SVM) classifier for cross-domain scene classification. The performance of SVM is directly influenced by the choice of kernel function and values of its free parameters, such as the penalty for the cost function c and the coefficient for the kernel function g. However, the parameters of SVM classifiers from instances in the source domain need to be adjusted to those in the target domain due to feature distribution bias between instances in both domains. Regarding the transfer of parameters, most approaches assume that the individual SVM for different, but related, domains must share some parameters featuring a transfer supervised learning. Some studies closely related to transfer onto SVM parameters are described next.
Soares et al. [
57] propose a meta-learning methodology that explores information about the past performance of different parameters. The methodology is applied to adjust the width of the Gaussian kernel for regression problems with low error while providing significant savings in time. In [
58], particle swarm optimization (PSO) was applied to the problem of parameter tuning of support vector machines. As learning systems are essentially multi-objective problems, the multi-objective PSO was used to maximize the success rate and minimize the complexity of the model with faster search process convergence speed and less computational cost. Ideas of meta-learning and case-based reasoning have been used to provide good starting points for genetic algorithms to find good parameters for support vector machines and random forests. The presented approach achieves accuracy comparable to grid search with a significantly lower computational cost. Reif [
59] uses ideas of meta-learning and case-based reasoning to provide good starting points for genetic algorithm to find good parameters for SVM classifiers. Ali and Smith-Miles [
60] used goal-based learning rules for automatic kernel selection with empirical evaluation based on classification.
However, the aforementioned studies focus on the search techniques or the choice of kernel functions may suffer from heavy computational burden due to too large a search space or enormous manual interventions on labeling instances in the target domain. In order to suppress the problems, the several top pre-calculated parameter configurations organized in decreasing order of classification performance in the source domain are proposed to be transferred to the target domain and the parameter with the best classification performance in the target domain will be the optimal parameter to reduce the computational cost of parameter transfers and increase classification accuracy in the target domain with limited samples in the target domain.
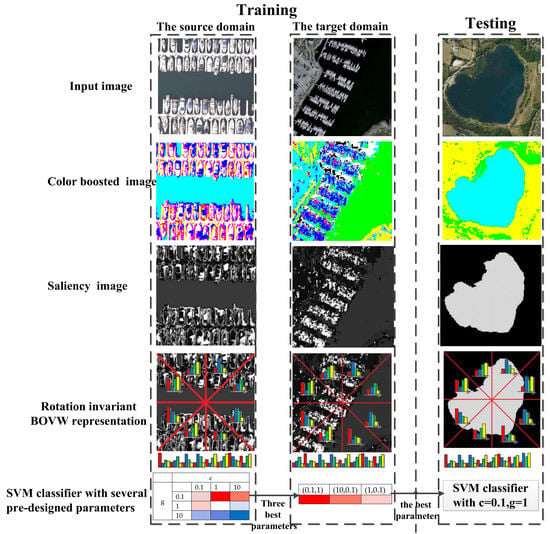
Inspired by the aforementioned work, we propose a color-boosted saliency-guided rotation invariant BOVW model with a transfer of SVM parameters from the source domain to the target domain. The main contributions of this paper are summarized below:
- (1)
A color-boosted method has been introduced to global contrast based salient region detection method to increase the color contrast between different regions and obtain salient regions for BOVW representations in order to reduce the effect of background or non-salient objects on the BOVW representation.
- (2)
A shifting operation has been applied to represent the images with BOVW representations of patches in an order of ascending distance from zero to feature vectors in the sub-image rather than those of patches in SPM so as to decrease the effect of rotation transformation on classification accuracy.
- (3)
Several pre-calculated best parameters in the source domain have been transferred to the target domain in a decreasing order and the parameter with the best performance in the target domain will be the optimal parameter setting to reduce the required number of instances in the target domain and the effort in searching for the optimal parameters.
The rest of the paper is organized as follows: In
Section 2, we describe the overall process and details of the proposed color boosted saliency-guided rotation invariant BOVW approach with parameter transfer. In
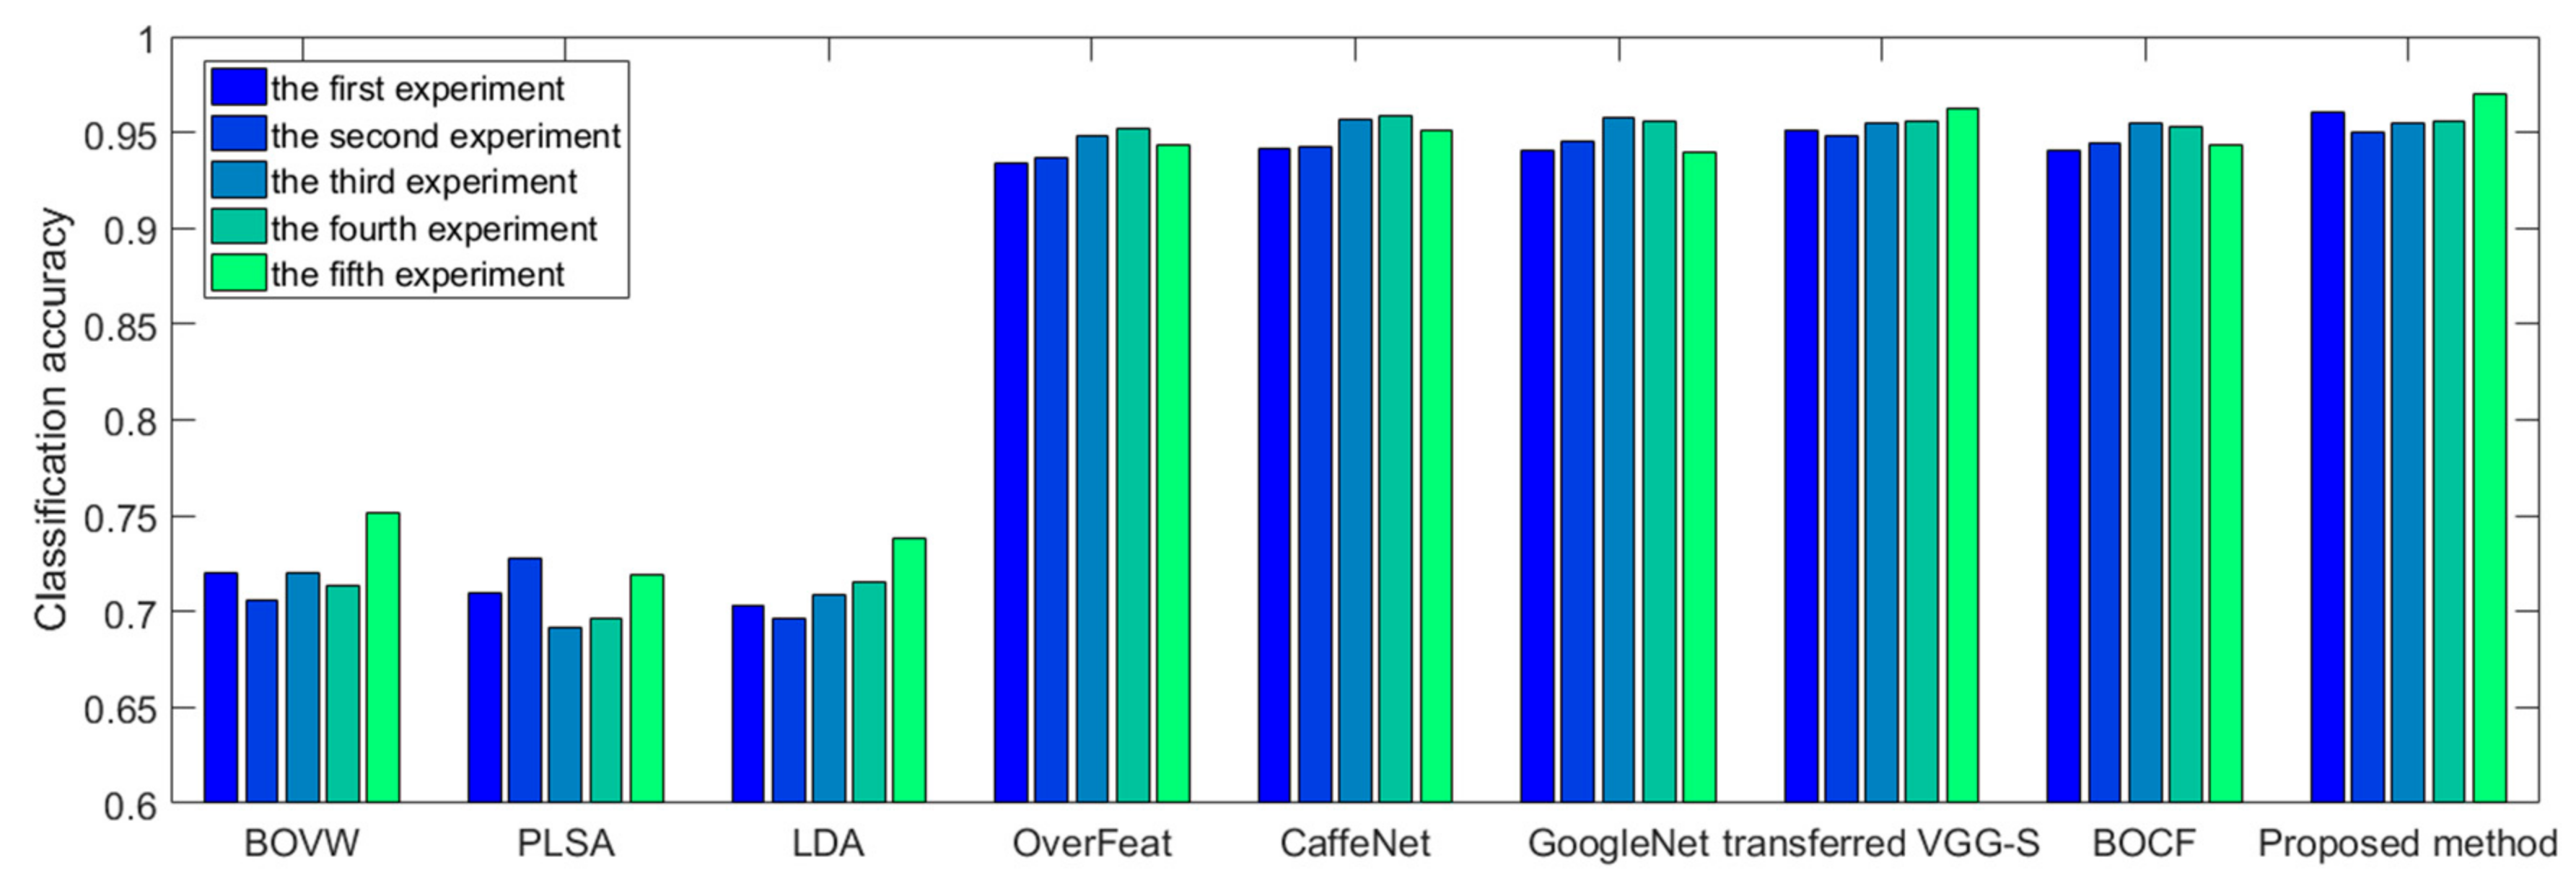
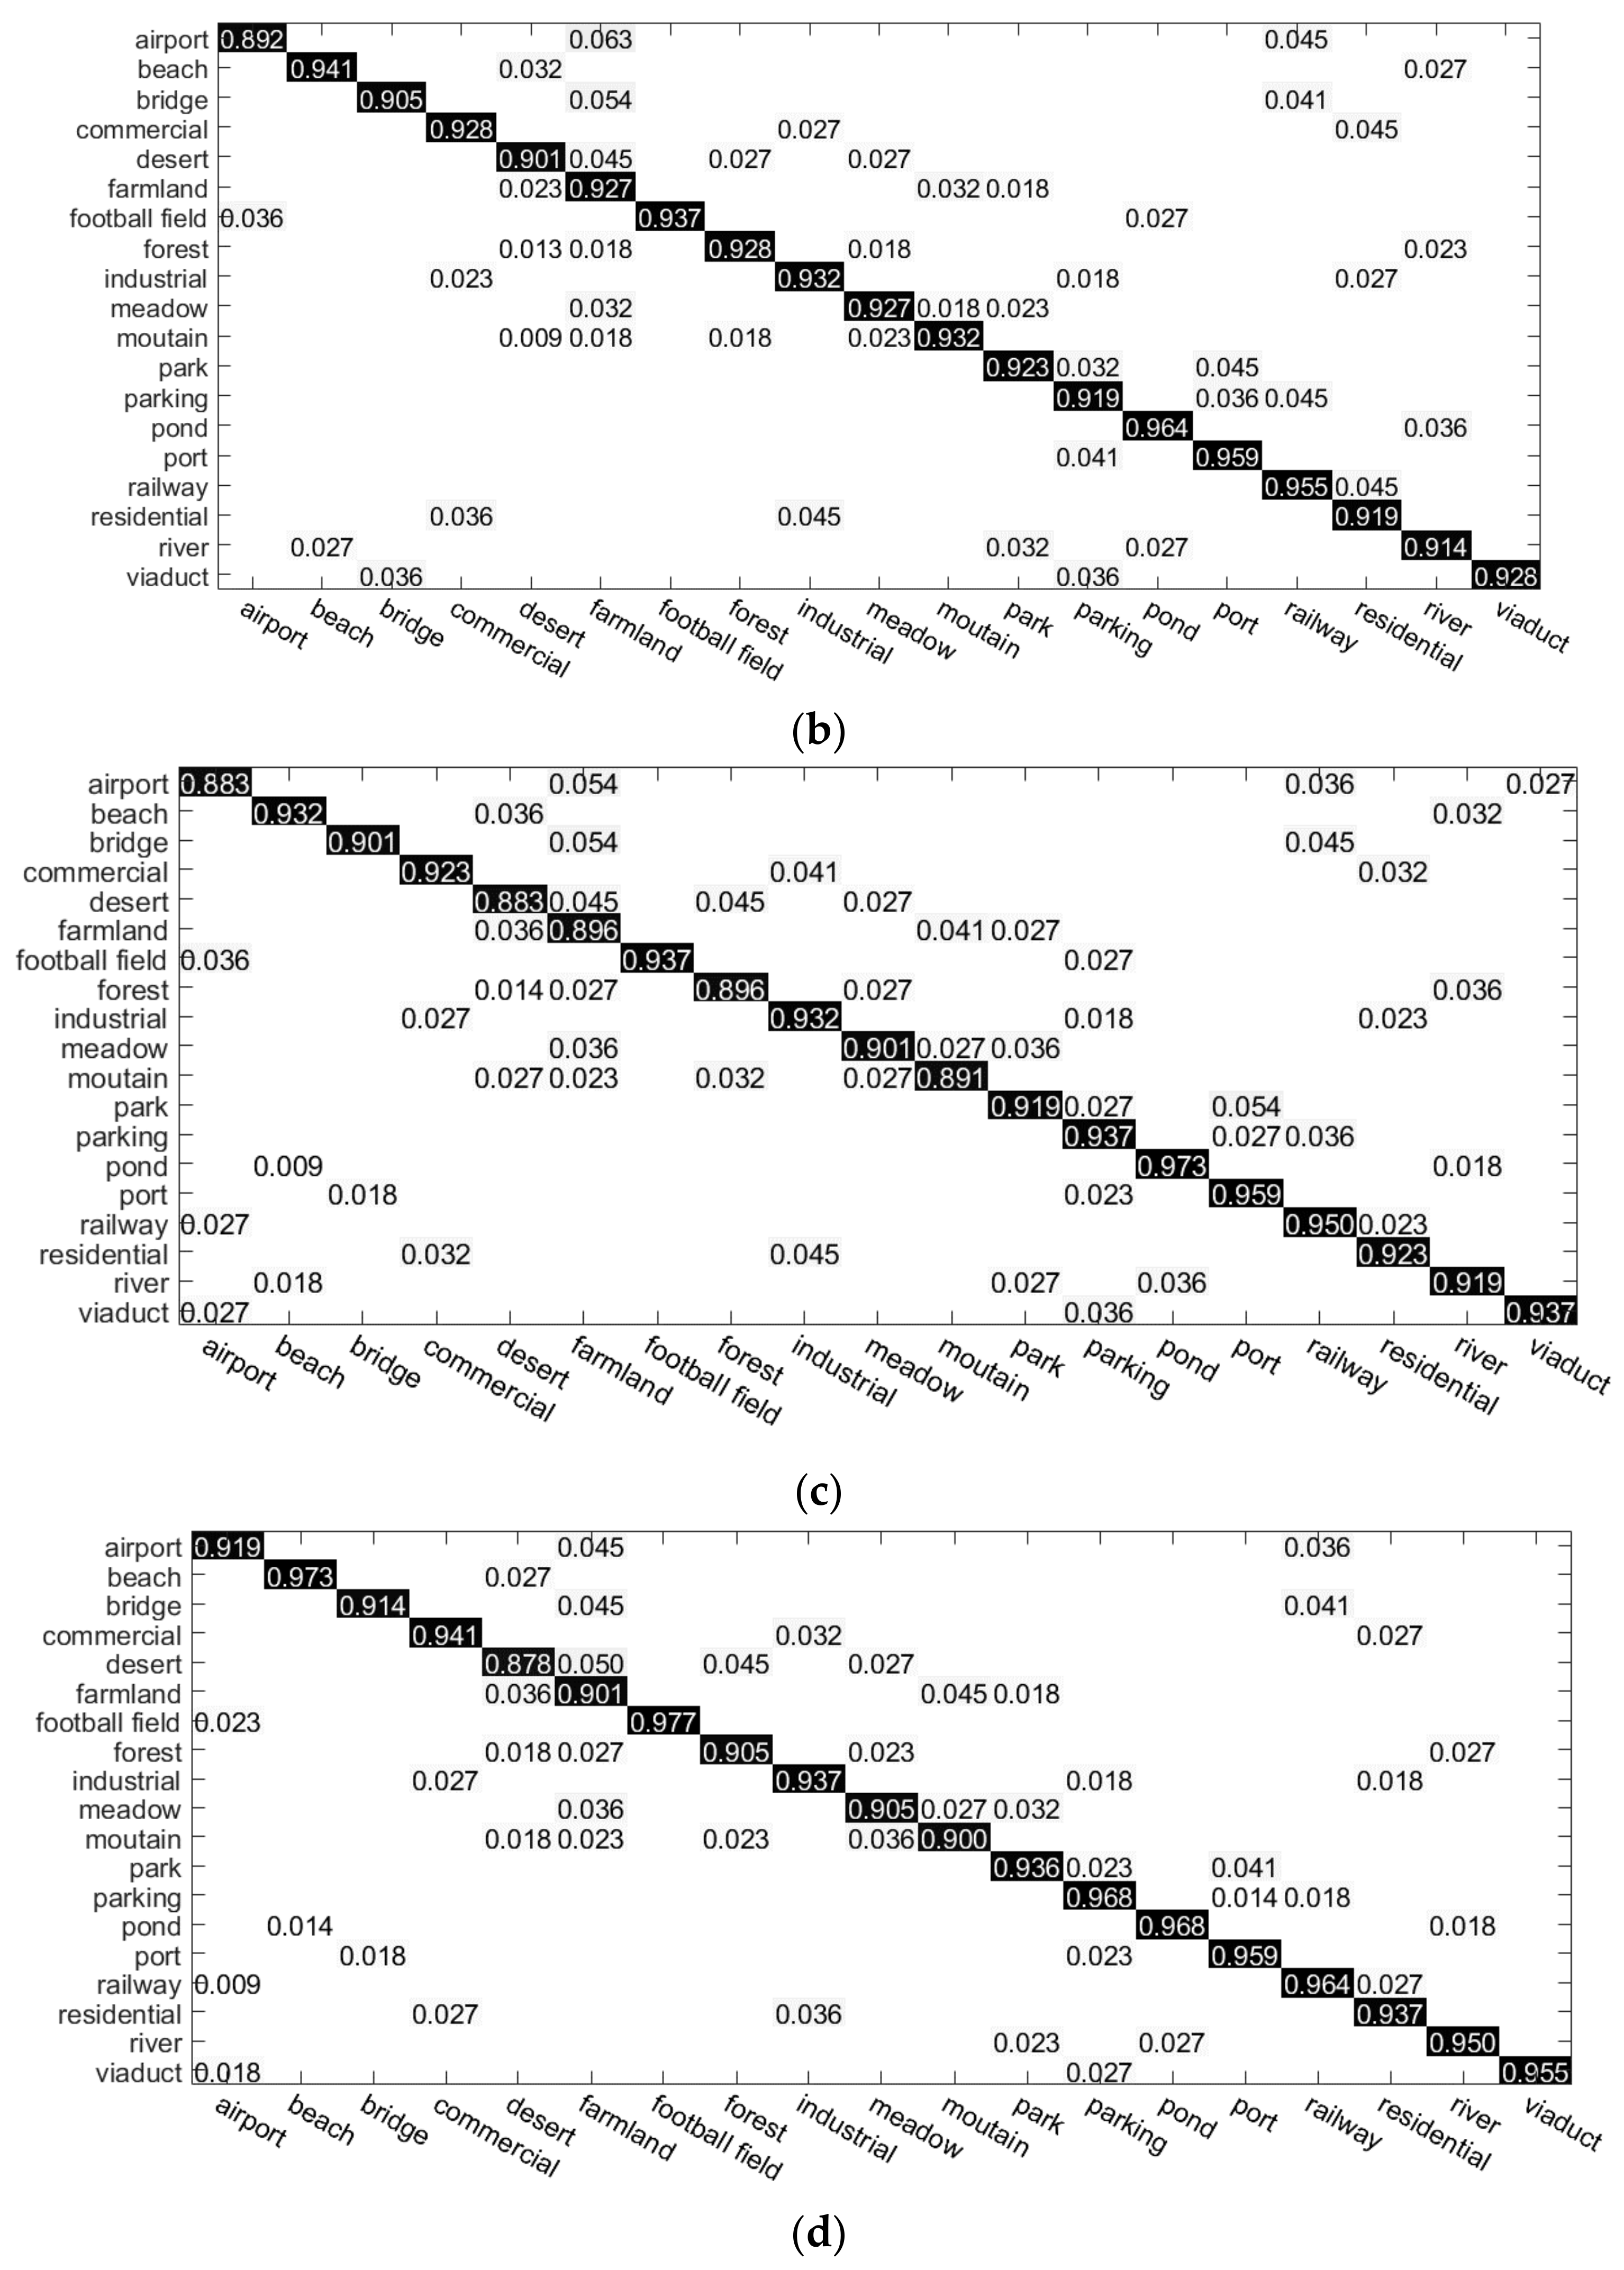
Section 3, several experiments and results in two benchmark datasets are presented to demonstrate the effectiveness and superiority of the proposed algorithms. In
Section 4, a discussion about the proposed method with a parameter sensitivity analysis is conducted. Conclusions and suggestions for future work are summarized in
Section 5.


