Impact of Vertical Canopy Position on Leaf Spectral Properties and Traits across Multiple Species


1
Faculty of Geo-Information Science and Earth Observation (ITC), University of Twente, P.O. Box 6, 7500 AA Enschede, The Netherlands
2
Department of Environmental Science, Macquarie University, Sydney, NSW 2106, Australia
*
Author to whom correspondence should be addressed.
Remote Sens. 2018, 10(2), 346; https://doi.org/10.3390/rs10020346
Submission received: 31 January 2018
/
Revised: 17 February 2018
/
Accepted: 20 February 2018
/
Published: 23 February 2018
Abstract
:Understanding the vertical pattern of leaf traits across plant canopies provide critical information on plant physiology, ecosystem functioning and structure and vegetation response to climate change. However, the impact of vertical canopy position on leaf spectral properties and subsequently leaf traits across the entire spectrum for multiple species is poorly understood. In this study, we examined the ability of leaf optical properties to track variability in leaf traits across the vertical canopy profile using Partial Least Square Discriminatory Analysis (PLS-DA). Leaf spectral measurements together with leaf traits (nitrogen, carbon, chlorophyll, equivalent water thickness and specific leaf area) were studied at three vertical canopy positions along the plant stem: lower, middle and upper. We observed that foliar nitrogen (N), chlorophyll (Cab), carbon (C), and equivalent water thickness (EWT) were higher in the upper canopy leaves compared with lower shaded leaves, while specific leaf area (SLA) increased from upper to lower canopy leaves. We found that leaf spectral reflectance significantly (P ≤ 0.05) shifted to longer wavelengths in the ‘red edge’ spectrum (685–701 nm) in the order of lower > middle > upper for the pooled dataset. We report that spectral bands that are influential in the discrimination of leaf samples into the three groups of canopy position, based on the PLS-DA variable importance projection (VIP) score, match with wavelength regions of foliar traits observed to vary across the canopy vertical profile. This observation demonstrated that both leaf traits and leaf reflectance co-vary across the vertical canopy profile in multiple species. We conclude that canopy vertical position has a significant impact on leaf spectral properties of an individual plant’s traits, and this finding holds for multiple species. These findings have important implications on field sampling protocols, upscaling leaf traits to canopy level, canopy reflectance modelling, and subsequent leaf trait retrieval, especially for studies that aimed to integrate hyperspectral measurements and LiDAR data.
1. Introduction
Leaf traits play a key role in ecosystem structure, functioning and resilience [1] and ecophysiology [2]. They improve our understanding of evolutionary and phylogenetic relationships among different forms of biota [3] as well as the parameterization of dynamic global biogeochemical models and nutrient budget simulations [4]. Based on the realization that leaf traits are a critical component of essential biodiversity variables (EBVs) [5], quantifying leaf traits improves our conservation and spectroscopic monitoring efforts of EBVs towards the Aichi Biodiversity Targets [6].
Field spectroscopy provides a cost-effective and practical means to monitor EBVs and ecosystem functioning with a capacity to upscale to airborne and satellite imagery. Multi- and hyper-spectral sensors afford a comprehensive spectral information that has provided a cost effective opportunity to; estimate foliar biochemistry [7,8], quantify plant biophysical properties [9,10], identify plant species [11,12] and assess plant physiological status over space and time [13]. Basically, two approaches [i.e., empirical (statistical) and physical models (radiative transfer models-RTM)] are often employed to link spectral signatures and field measured leaf traits. Empirical approaches explore parametric and non-parametric statistical relationships between spectral data or features and leaf traits [14]. Physical models on the other hand, rigorously simulate light absorption and scattering inside vegetation canopies accounting for leaf traits composition, canopy structural properties and soil background based on radiation transfer theory [15]. Although these spectroscopic approaches for studying plant traits are promising, many efforts have been placed on the spectra-trait relationship for mature, sunlit leaves at the top of canopy [16]. The implicit assumption is that variability in leaf traits content and leaf spectral properties within a canopy are very small and consequently, top of canopy foliar samples are representative of the canopy as a whole [16]. To this end, the vertical heterogeneity in leaf traits across the canopy is often not accounted for in most modelling approaches. However, the distribution of leaf traits within vegetation canopies is complex and often varies across the canopy vertical profile especially in resource constrained ecosystems [17].
The distribution of leaf traits content across the canopy vertical profile is indicative of the strategies plants use to optimize critical metabolic processes such as photosynthesis [18]. Plants exhibit higher nutrient stoichiometry in the upper illuminated leaves that receive higher photon flux density compared to lower canopy shaded leaves [19]. The vertical distribution of leaf traits particularly nitrogen content is thus an attempt to maintain a balance between the RuBisCO-limited rate of carboxylation and electron transport limited rate of carboxylation [20]. Plants are also known to absorb foliar nutrients from older leaves located in the lower canopy and translocate the nutrients to the upper canopy leaves for protein repair and maintenance of a metabolic balance [21]. These intrinsic mechanisms result in marked effects on leaf morphological, chemical as well as physiological traits across the canopy vertical profile [22] and subsequently influence whole canopy spectral reflectance [23]. In light of this background, we hypothesize that leaf spectral properties track variability in leaf traits across the canopy vertical profile.
Although the concept of vertical heterogeneity in leaf morphological, chemical and physiological traits is well documented in plant physiology domain [18,22], to date few studies [24,25,26,27] have examined the impact of canopy vertical position on leaf spectral properties in addition to assessing the ability of leaf optical properties (in VNIR, SWIR spectral domain) to track variability in leaf traits across the canopy vertical profile for multiple species across the entire spectrum. One of the possible reasons related to limited or lack of studies thereof is the inadequacy and complexity in collecting field measurements at different canopy positions to characterize the vertical heterogeneity in leaf spectral properties and leaf traits [28]. A few studies that have attempted to understand the leaf traits-spectra interactions across the canopy have not only restricted their work on understanding the effect of canopy position on the empirical relationship between crops’ leaf spectra, and their Cab and nitrogen content but also focused on the wavelengths before 1100 nm [29,30]. For example, Ma and Upadhyaya [27], examined the effects of leaf position on tomato leaf optical properties at only two wavelengths i.e., 660 and 730 nm. To this end, spectral discrepancies across the canopy vertical profiles need to be fully characterized across the whole spectrum and across multiple species outside crops. Simultaneous measurement of leaf optical properties together with a suite of leaf traits across the canopy require attention for improved understanding of the spectra-traits interaction across the canopy vertical profile. Understanding the effect of vertical heterogeneity on leaf spectral properties does not only offer a promising path in canopy reflectance modeling using multi-layer radiative transfer models (RTM) but also has a strong implication on within-canopy sampling and leaf traits upscaling to canopy and subsequently landscape level. For instance, Wang and Li [31] demonstrated that vertical heterogeneity in leaf dry matter per unit area, Cab, water and dry matter contents have a significant effect on simulated canopy reflectance and subsequently inversion of multiple-layer canopy radiative transfer model. Sprintsin et al. [32] also demonstrated that upscaling leaf traits to canopy scale based on the ‘big leaf’ (sunlit only) and ‘two leaf’ (sunlit plus shaded) upscaling models, can have a profound effect on gross primary productivity estimations against flux tower measurements. Their study demonstrated that the exclusion of the photosynthetic contribution of shaded leaves can underestimate the canopy photosynthesis estimations by over 70% in highly clumped forest stands. In this regard, a detailed understanding on the impact of vertical canopy position on leaf traits content and spectral reflectance properties is imperative and has broad implications on leaf traits upscaling to canopy level and subsequent retrieval or estimation.
This study aims at examining the effect of canopy vertical position on leaf spectral properties across multiple species. We studied the impact of canopy position on leaf spectral properties to assess the capability of leaf optical properties to track variability in leaf traits across the vertical canopy profile. We also aimed at identifying key spectral wavebands that are influential in the discrimination of leaf samples into the three groups of canopy position. We hypothesize that the influential spectral wavebands match wavelength absorption features associated with the measured leaf traits.
2. Materials and Methods
2.1. Species Description
We selected four plant species with different leaf forms and canopy structure to examine the impact of canopy vertical position on leaf spectral properties and traits at leaf level. The selected species were Camellia japonica (n = 10, mean height 83.71 ± 4.75 cm), Ficus benjamina (n = 10; mean height 82.07 ± 4.27 cm), Chamaedorea elegans (n = 10; mean height 88.5 ± 4.75 cm) and Fatshedera lizei (n = 10; mean height 88.93 ± 1.53 cm). C. japonica is an evergreen broad-leaved woody plant whose flowers are bisexual and disposed in racemes. The leaf blade length for C. japonica range between 5 and 10 cm and a mature C. japonica can reach a height of 6 m. F. benjamina is also an evergreen shrub with pendulous branches bearing glossy, elliptic, slender pointed ovate leaves. A mature F. benjamina plant can reach 30 m in height while the leaf blades can extend up to 8 cm. C. elegans is an evergreen palm with slender, solitary or clustered stems bearing slender stalked, pinnate leaves. The leaf blade length for C. elegans range between 6 and 12 cm and the plant can reach 4 m at maturity. F. lizei is a hybrid between Fatsia japonica and Hedera helix. F. lizei is characterized by large, leathery, palmately lobed leaves and small flower in globose panicles. The plant can grow up to 4 m in height and its leaf blades range between 7 and 25 cm at maturity. All the plants used in this study were purchased from a local nursery.
2.2. Experimental Setup
Considering that plants obtained from the nursery were pretreated with fertilizer, we changed the potted soil to a new homogenized mixture of seven parts of poor-nutrient sand soil to two parts of fertile loamy soil. After changing the potting soil, three soil nitrogen treatments (high, medium and low) were administered to 40 plants. For the high (n = 13) and medium (n = 14) treatment groups, 2.9 g and 0.9 g per pot were supplied per pot respectively, while for the low (n = 13) treatment no fertilizer was supplied. The fertilizer was administered once a week over a four-week period after which plants were left to acclimatize for another four weeks without fertilizer treatment. The three soil nitrogen treatment were administered in order to create variation in leaf traits and subsequently leaf spectral properties among the different potted plants. The potted plants were kept under artificial light and at a normal room temperature of 21 °C. Three overhead halogen lamps of 50 W each were used for illumination. To minimize the effect of a microclimate the pots were randomly placed in the experimental room and rotated after every two days. Care was taken to avoid plants shading one another.
2.3. Leaf Spectral Measurement
For each leaf sample measurement, approximately three (3) gram of fresh leaves (between six to ten leaves-depending on leaf size and weight) were randomly sampled from the upper, middle and lower canopy vertical layers for each plant (Figure 1). At each of three canopy layers, leaf samples were picked from both the outer and interior canopy in all directions. The three layers were determined based on the height of a plant along the stem. We divided the canopy into three layers for two reasons. Firstly, the plants used in this study were relatively short (mean height ~85 cm) to identify and characterize more than three canopy layers. Secondly, three canopy layers match forestry and agronomic standards in reporting research in canopy layers [33,34]. The leaves picked from the three canopy layers were stored in a portable cooler and all laboratory measurements were performed within two hours of leaf picking. Leaf directional hemispherical reflectance from 350 to 2500 nm for each sample was measured using an ASD FieldSpec-3 Pro FR spectroradiometer coupled with an ASD RTS-3ZC Integrating Sphere. To minimize spectral noise, the spectroradiometer was set to average two hundred scans into a single spectrum per each spectral measurement. The spectra were calibrated for dark current and stray light following the Integrating Sphere User Manual instructions [35]. During spectral measurements, care was taken to avoid leaf primary veins. Spectral measurements of leaves constituting a sample were averaged to a single spectrum that represented the spectra of each sample. In total spectral reflectance measurements were performed on 120 samples (40 plants × 3 canopy layers). A moving second order Savitzky-Golay filter [36] with a frame size of 11 was applied on each sample spectra to minimize instrument noise. Due to the low signal-to-noise ratio for wavelengths after 2200 nm as well as spectral bands before 400 nm, the spectra were cropped to 400–2200 nm range. Therefore, 1801 spectral bands were retained for further analysis.
Leaf Traits Measurement
Following measurement of leaf spectral properties, the following leaf traits were measured; leaf chlorophyll content (Cab), leaf nitrogen content (N), leaf carbon content (C), fresh weight, dry weight and leaf area. Consequently, equivalent water thickness (EWT) and specific leaf area (SLA) were then retrieved. For each sample the average leaf chlorophyll content (Cab: μg/cm2) was determined using a CCM-300 chlorophyll content meter [37]. After measuring the Cab, fresh weight (Fw g) for each sample was determined using a digital scale at an accuracy of 0.01 g. We also measured the leaf surface area (LA cm2) of each sample using an AMH 350 area meter [38]. The samples were then oven-dried for 72 h at 65 °C to determine dry weight (Dw g). Specific leaf area (SLA cm2/g) and equivalent water thickness (EWT cm) were calculated using the following formulas:
where: Dw, Fw and LA are sample dry weight, fresh weight and leaf area respectively.
SLA (cm2/g) = LA/Dw
EWT (cm) = Fw − Dw/LA
Leaf N and C (% dry weight) were determined by dry combustion using the Perkin Elmer 2400 CHNS/O Elemental Analyzer [39]. Prior to determining leaf N and C content using the elemental analyzer leaves representing a sample were shredded and grounded to a fine and homogeneous powder using a mortar and pestle to pass through a 180 μm mesh screen. The sample powder was placed in tin capsules for N and C analysis. We duplicated twenty-five percent of samples and run an acetanilide standard after every ten to fifteen samples to constantly monitor the system calibration and integrity. Results from the elemental analyzer were obtained on a dry mass ash-included basis [40]. We then converted the mass-based N obtained from the elemental analyzer to the area-based N by dividing mass-based N of each sample by dry mass per unit area [41].
2.4. Statistical Analysis
2.4.1. Impact of Canopy Vertical Position on Leaf Spectral Properties and Traits
To understand the impact of canopy vertical position on leaf spectral properties, we examined whether there was a statistical difference between mean leaf spectral reflectance of the three canopy positions at each wavelength across the entire electromagnetic spectrum (400–2200 nm). We also examined whether leaf traits vary across the canopy vertical profile. Variability in leaf spectral reflectance and leaf traits were performed for both individual species and for the pooled dataset. Differences in mean leaf spectral reflectance (per wavelength), as well as leaf traits at the three canopy positions, were tested using a one-way analysis of variance (ANOVA) with canopy position as a fixed factor. We tested the null hypothesis that there was no significant difference in leaf spectral reflectance of different canopy positions at every spectral wavelength; Ho: μ1 = μ2 = μ3 versus the alternative hypothesis that there was a difference; vis: Ho: μ1 ≠ μ2 ≠ μ3. The mean leaf spectral reflectance for the upper, middle and lower layers at every spectral wavelength is denoted by μ1, μ2, and μ3 respectively. Following a significant ANOVA test, Tukey Honest significance difference (HSD) post-hoc tests [42] were performed on the leaf spectral reflectance data and leaf traits respectively. Post-hoc tests were computed to highlight pairwise differences in both leaf spectral reflectance and leaf traits for all possible pairs (upper vs. lower, middle vs. upper, middle vs. lower) of the three canopy positions. Tukey HSD post hoc test accounts for type I error by reducing the significant level of each test such that the group-wise type I error rate remains at a selected level, in this case, α = 0.05 [43]. The multiple comparisons highlights leaf traits and wavelengths that significantly vary between each pair of canopy positions (upper vs. lower, middle vs. upper, middle vs. lower) with minimal error [44]. The ANOVA and Tukey HSD post hoc tests were performed using R 3.4.1 for Windows.
2.4.2. Discriminating Leaf Samples into Respective Canopy Positions Groups
While the ANOVA and Tukey HSD post hoc test for difference in means between groups, discriminatory analysis can be used to classify and identify key variables that maximize assignment of objects to their defined group. We set out to identify and confirm whether influential spectral wavebands in the discrimination of leaf samples into the three vertical canopy positions matches the wavelength absorption features associated with the measured leaf traits. Identification of influential wavebands that match spectral absorption features of the traits provide an opportunity to assess whether leaf optical properties track variability in leaf traits across the vertical canopy profile. We used a bootstrapped Partial Least Squares-Discriminant Analysis (PLS-DA) to identify key wavebands that influence the spectral separatibility of leaf samples into the three canopy positions groups. Bootstrapping with 1000 replicates was used to train the PLS-DA model. PLS-DA is a classification technique that fuses Partial Least Square regression and the properties of discriminant analysis for identification of the variables that enhance the separation or classification of different groups [45]. PLS-DA aim to discriminate the response matrix (Y) by means of a predictive matrix (X) utilizing a set of orthogonal components (so-called latent variables) that maximizes the co-variance between matrices (X) and (Y) [46]. The Y matrix in our study represents the three canopy position (upper, middle and lower), while the X represents the spectral reflectance (400–2200 nm). This technique is suitable for high dimensional and collinear datasets such as hyperspectral measurements. Prior to model calibration, we randomly split our dataset into model calibration (70%) and external validation (30%). The model calibration dataset was used to develop the PLS-DA model to discriminate the leaf samples. The model was then applied on the 30% external validation dataset that was never used in the development of the model to determine the performance of the model. The number of latent variables (nlv) were determined by maximizing the accuracy of the PLS-DA model i.e., the model with the maximum accuracy was considered to have the optimum number of latent variables [47]. We used the variable importance of projection (VIP) to determine the influence of each waveband on the discrimination of the leaf samples into their defined vertical canopy position group. VIP scores greater than one (1) were regarded as influential in the classification procedure. The PLS-DA analysis was performed using R 3.4.1 for Windows using the classification and regression (caret) package [48].
3. Results
3.1. Characteristics of Leaf Traits
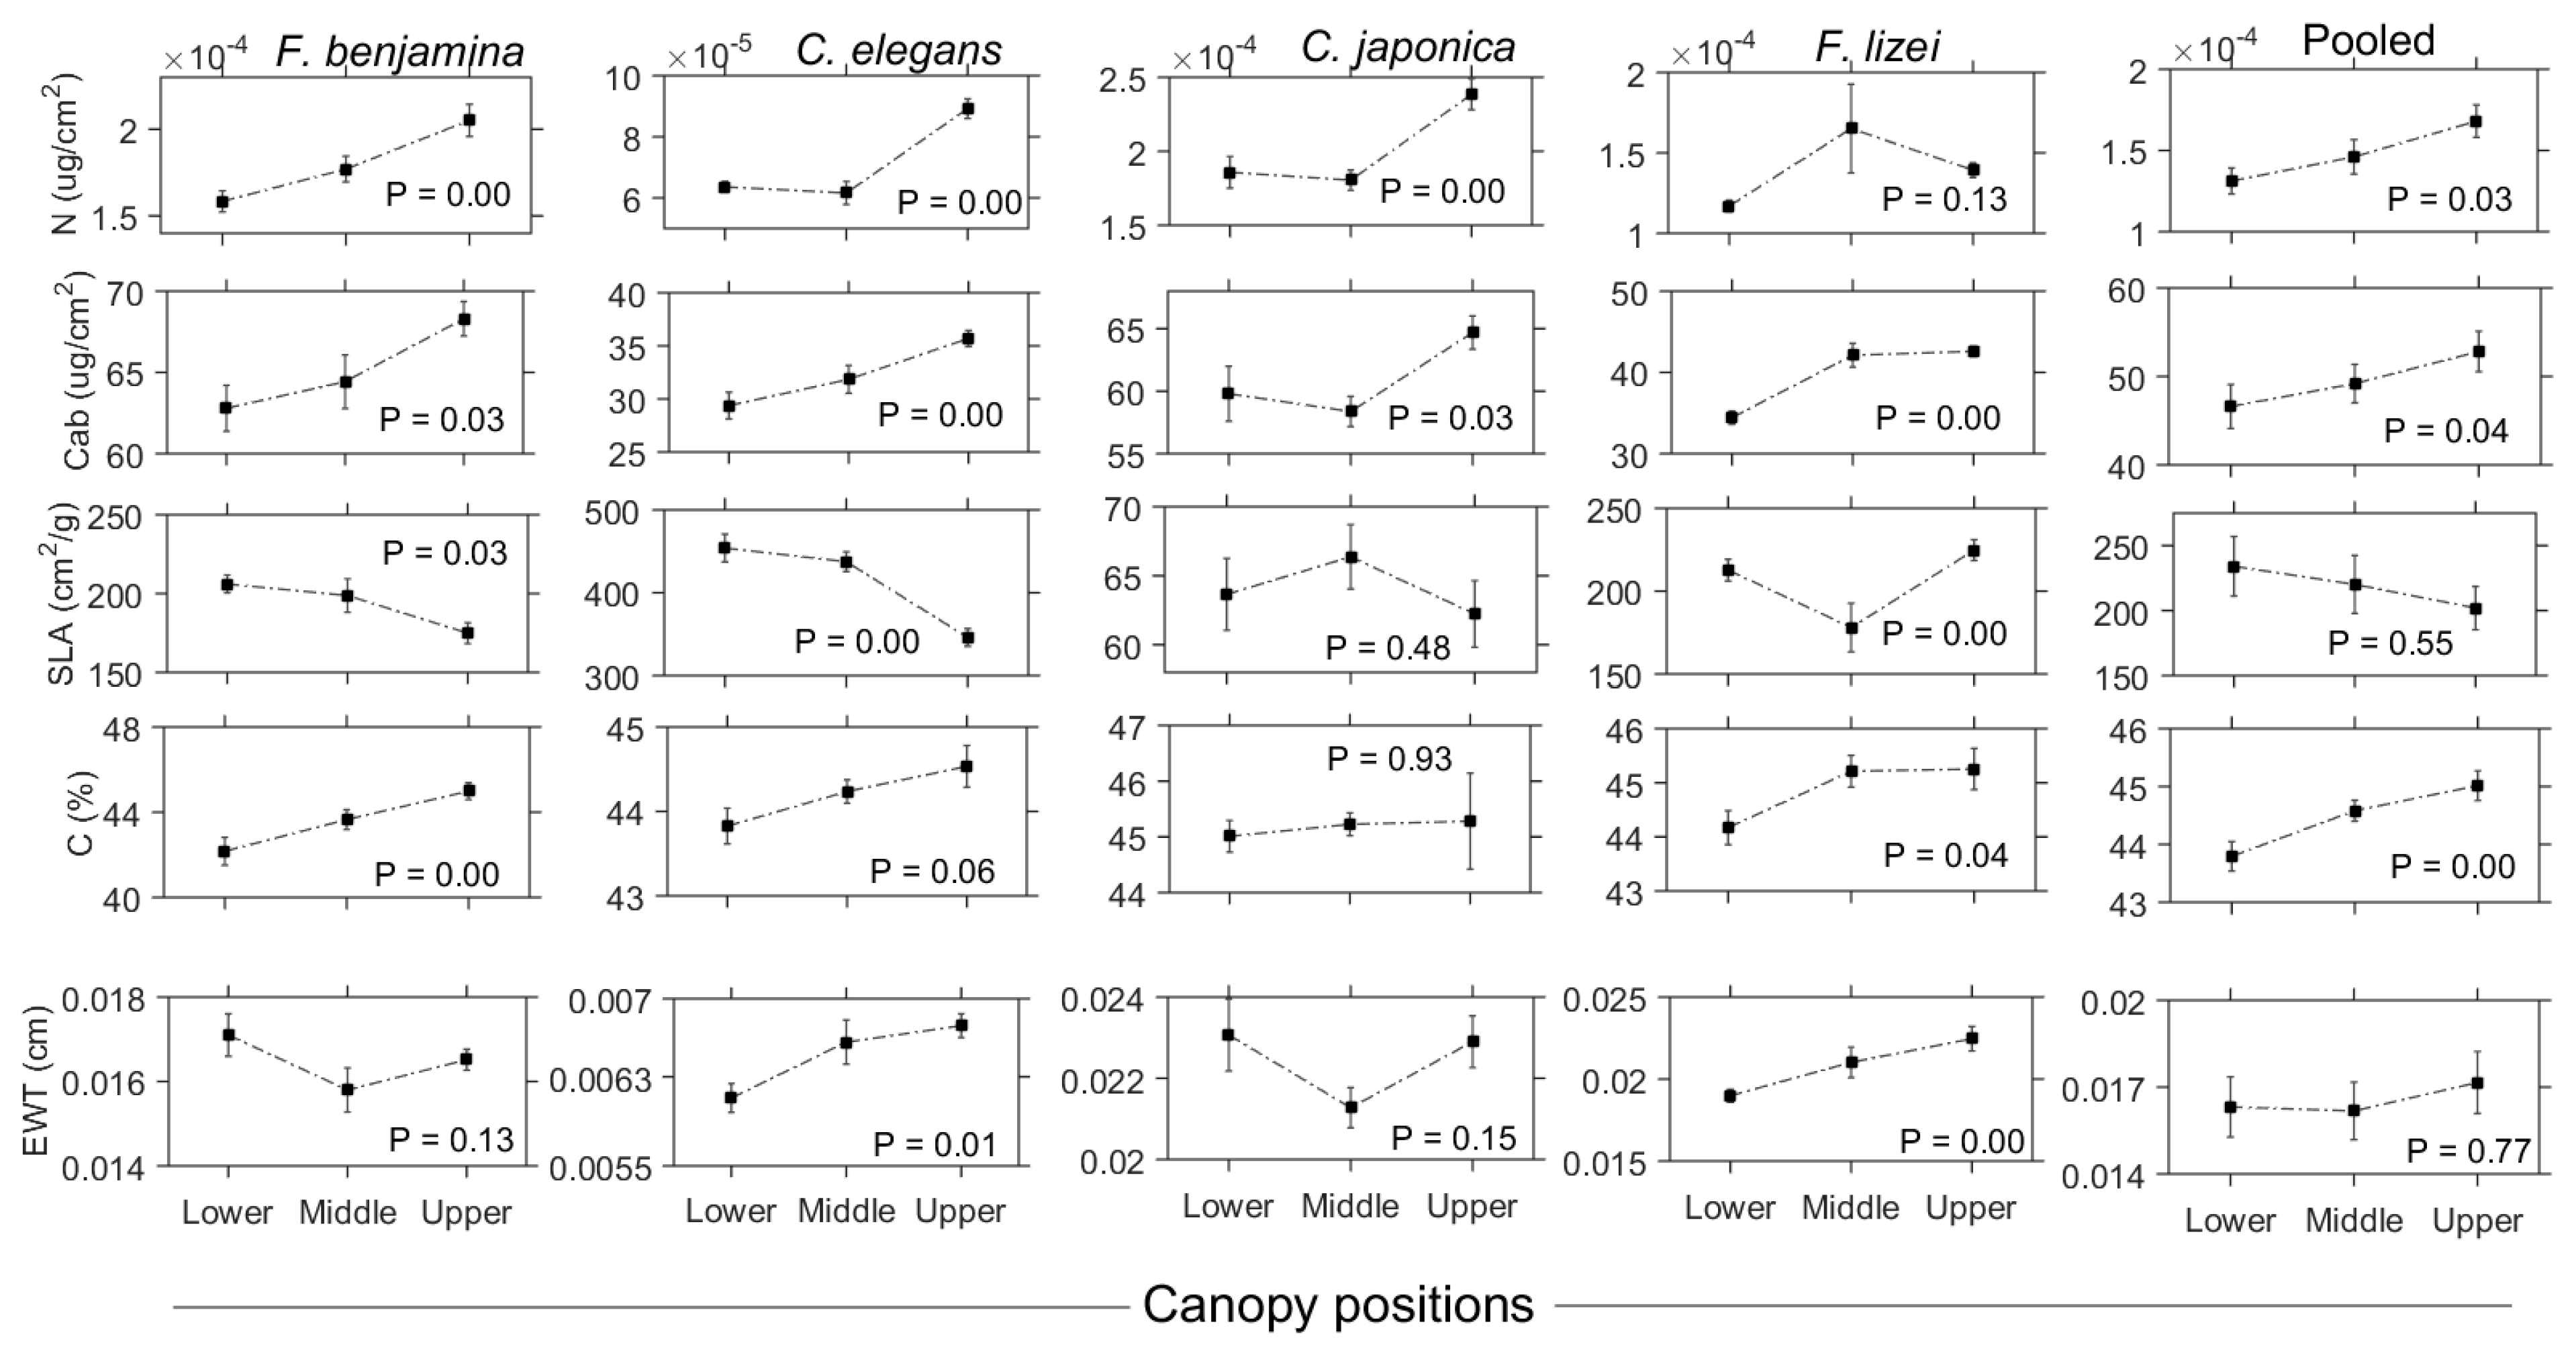
Table 1 summarizes the characteristics of leaf traits across the three canopy levels. N ranged from 3.15 × 10⁻⁵ to 4.04 × 10⁻⁴ μg/cm2 whereas Cab varied from 24.86 to 72.85 μg/cm2. SLA spanned a ten-fold range of values (53.67–530.21 cm2/g), while the range of C was only limited between 37.96 and 47.55%. EWT ranged from 0.00545 to 0.0275 cm. Generally, N, Cab, C, and EWT increased from the lower to the upper canopy while SLA decreased with increasing canopy depth.
3.2. Impact of Canopy Position on Leaf Spectral Properties
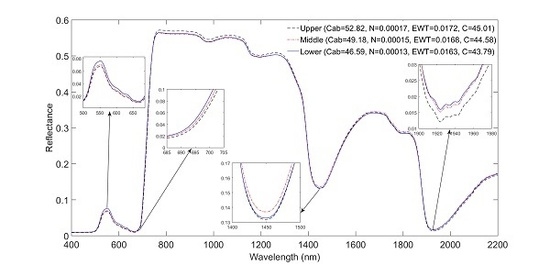
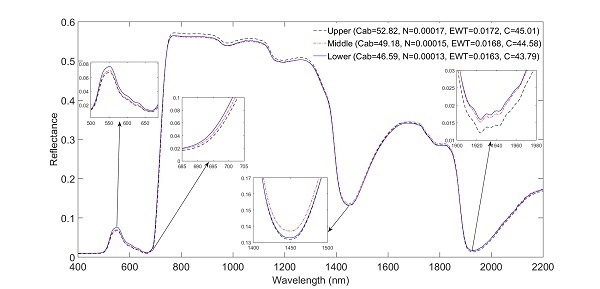
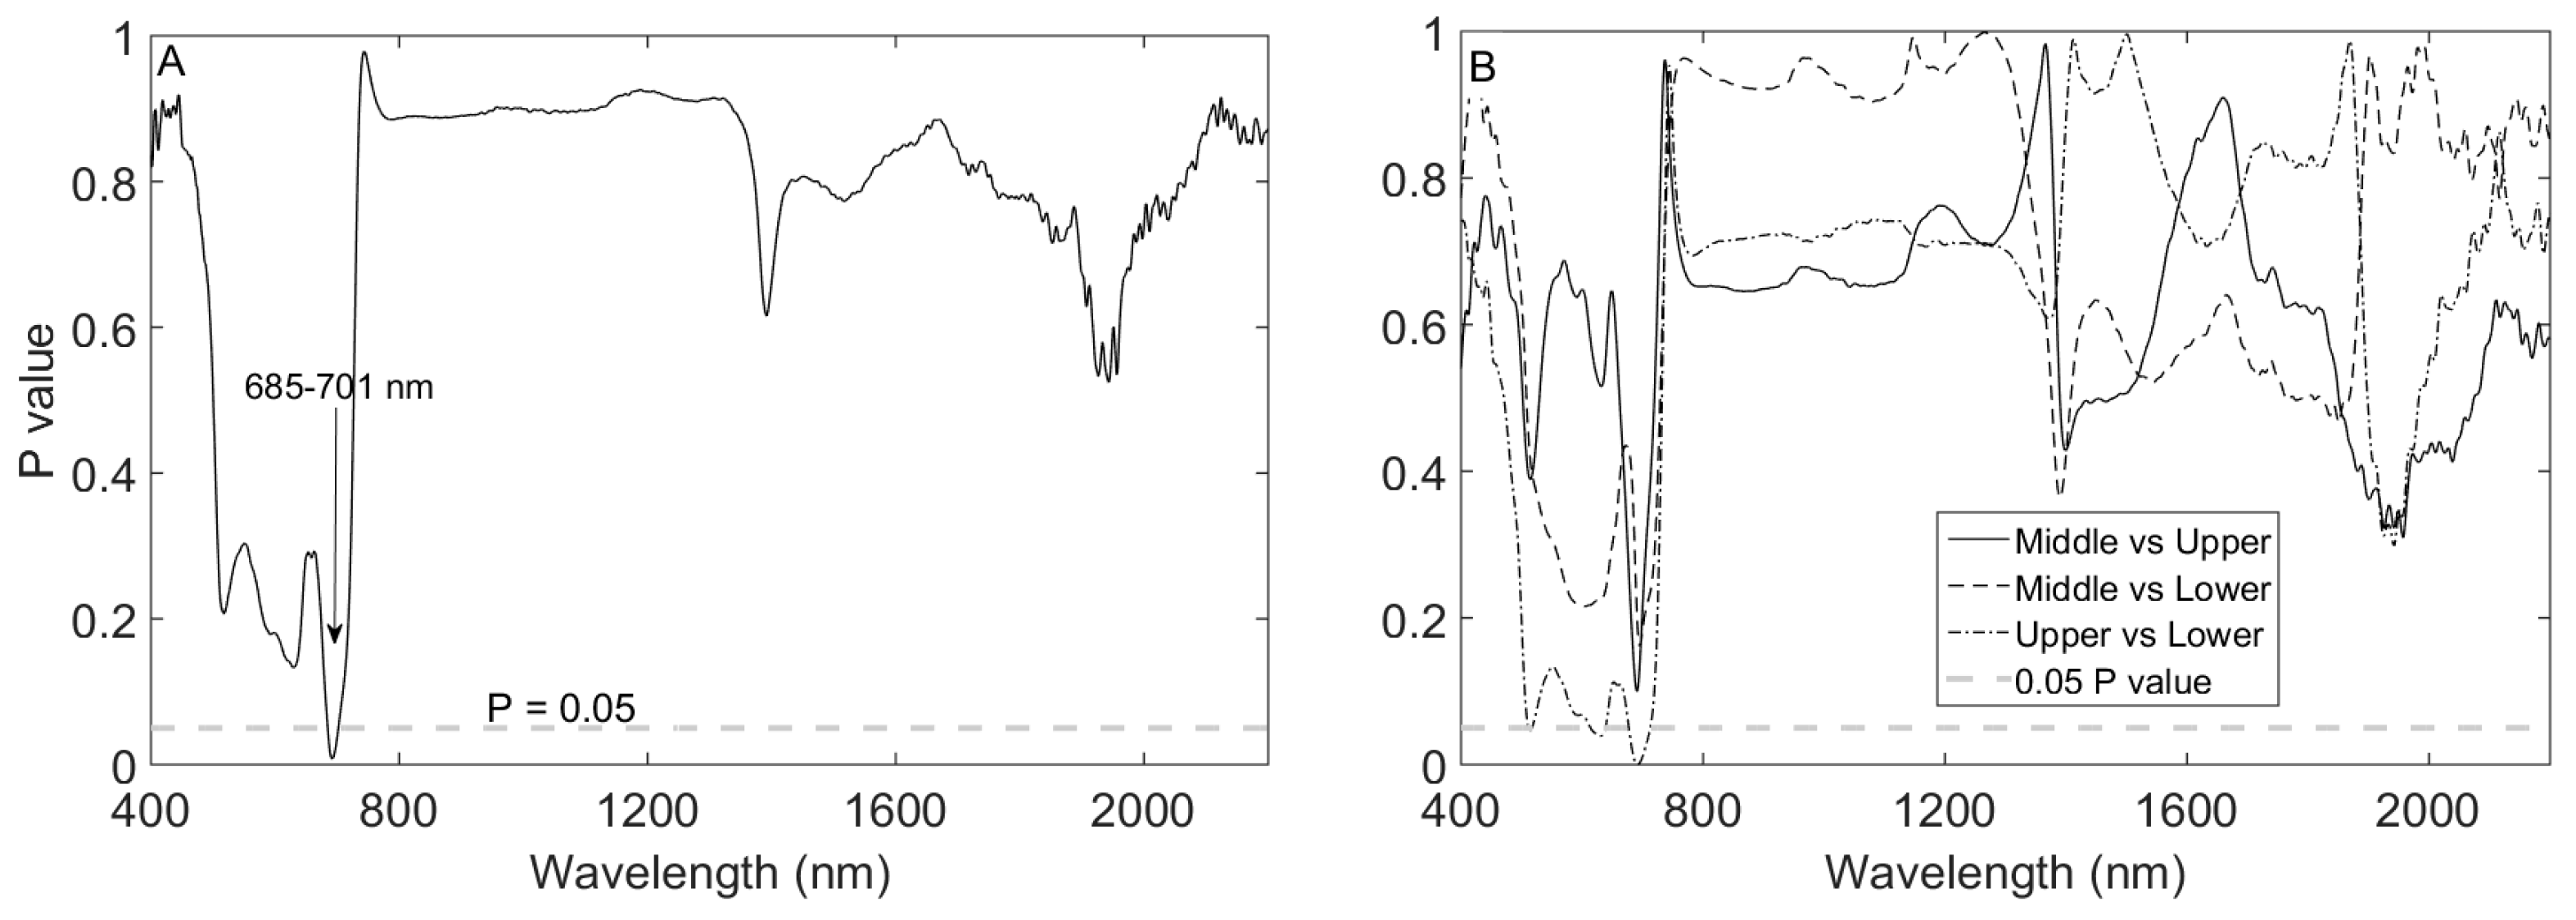
Leaf spectral reflectance significantly (P ≤ 0.05) shifted to longer wavelengths in the ‘red edge’ spectrum in the order of lower > middle > upper (Figure 2) for the pooled species data. The spectra significantly shifted to longer wavelengths in wavebands 685–701 nm (Figure 3). Moreover, mean leaf spectral reflectance displayed a consistent descending pattern in the order of lower > middle > upper canopy layers in the visible spectrum (400–700 nm; Figure 2). Spectral variations in the ‘red edge’ and visible spectrum demonstrated a significant (P ≤ 0.05) increase in Cab and N observed from the lower to the upper canopy layer (Table 1). At longer wavelengths, leaf spectra for the upper canopy leaves consistently exhibited relatively low reflectance values around 1450 and 1940 nm compared to leaf spectra for the middle and lower canopy sections (see inserts Figure 2). This spectral variation relates to relatively higher EWT observed for the upper leaves for the pooled dataset (Table 1). A Tukey HSD post hoc test revealed significant (P ≤ 0.05) pairwise difference in leaf spectra only between the upper and lower canopy layers within the 685–701 nm spectral range (Figure 3). This pairwise difference in spectra confirmed the significant differences observed for most traits especially between the upper and lower canopy layers (Table 2).
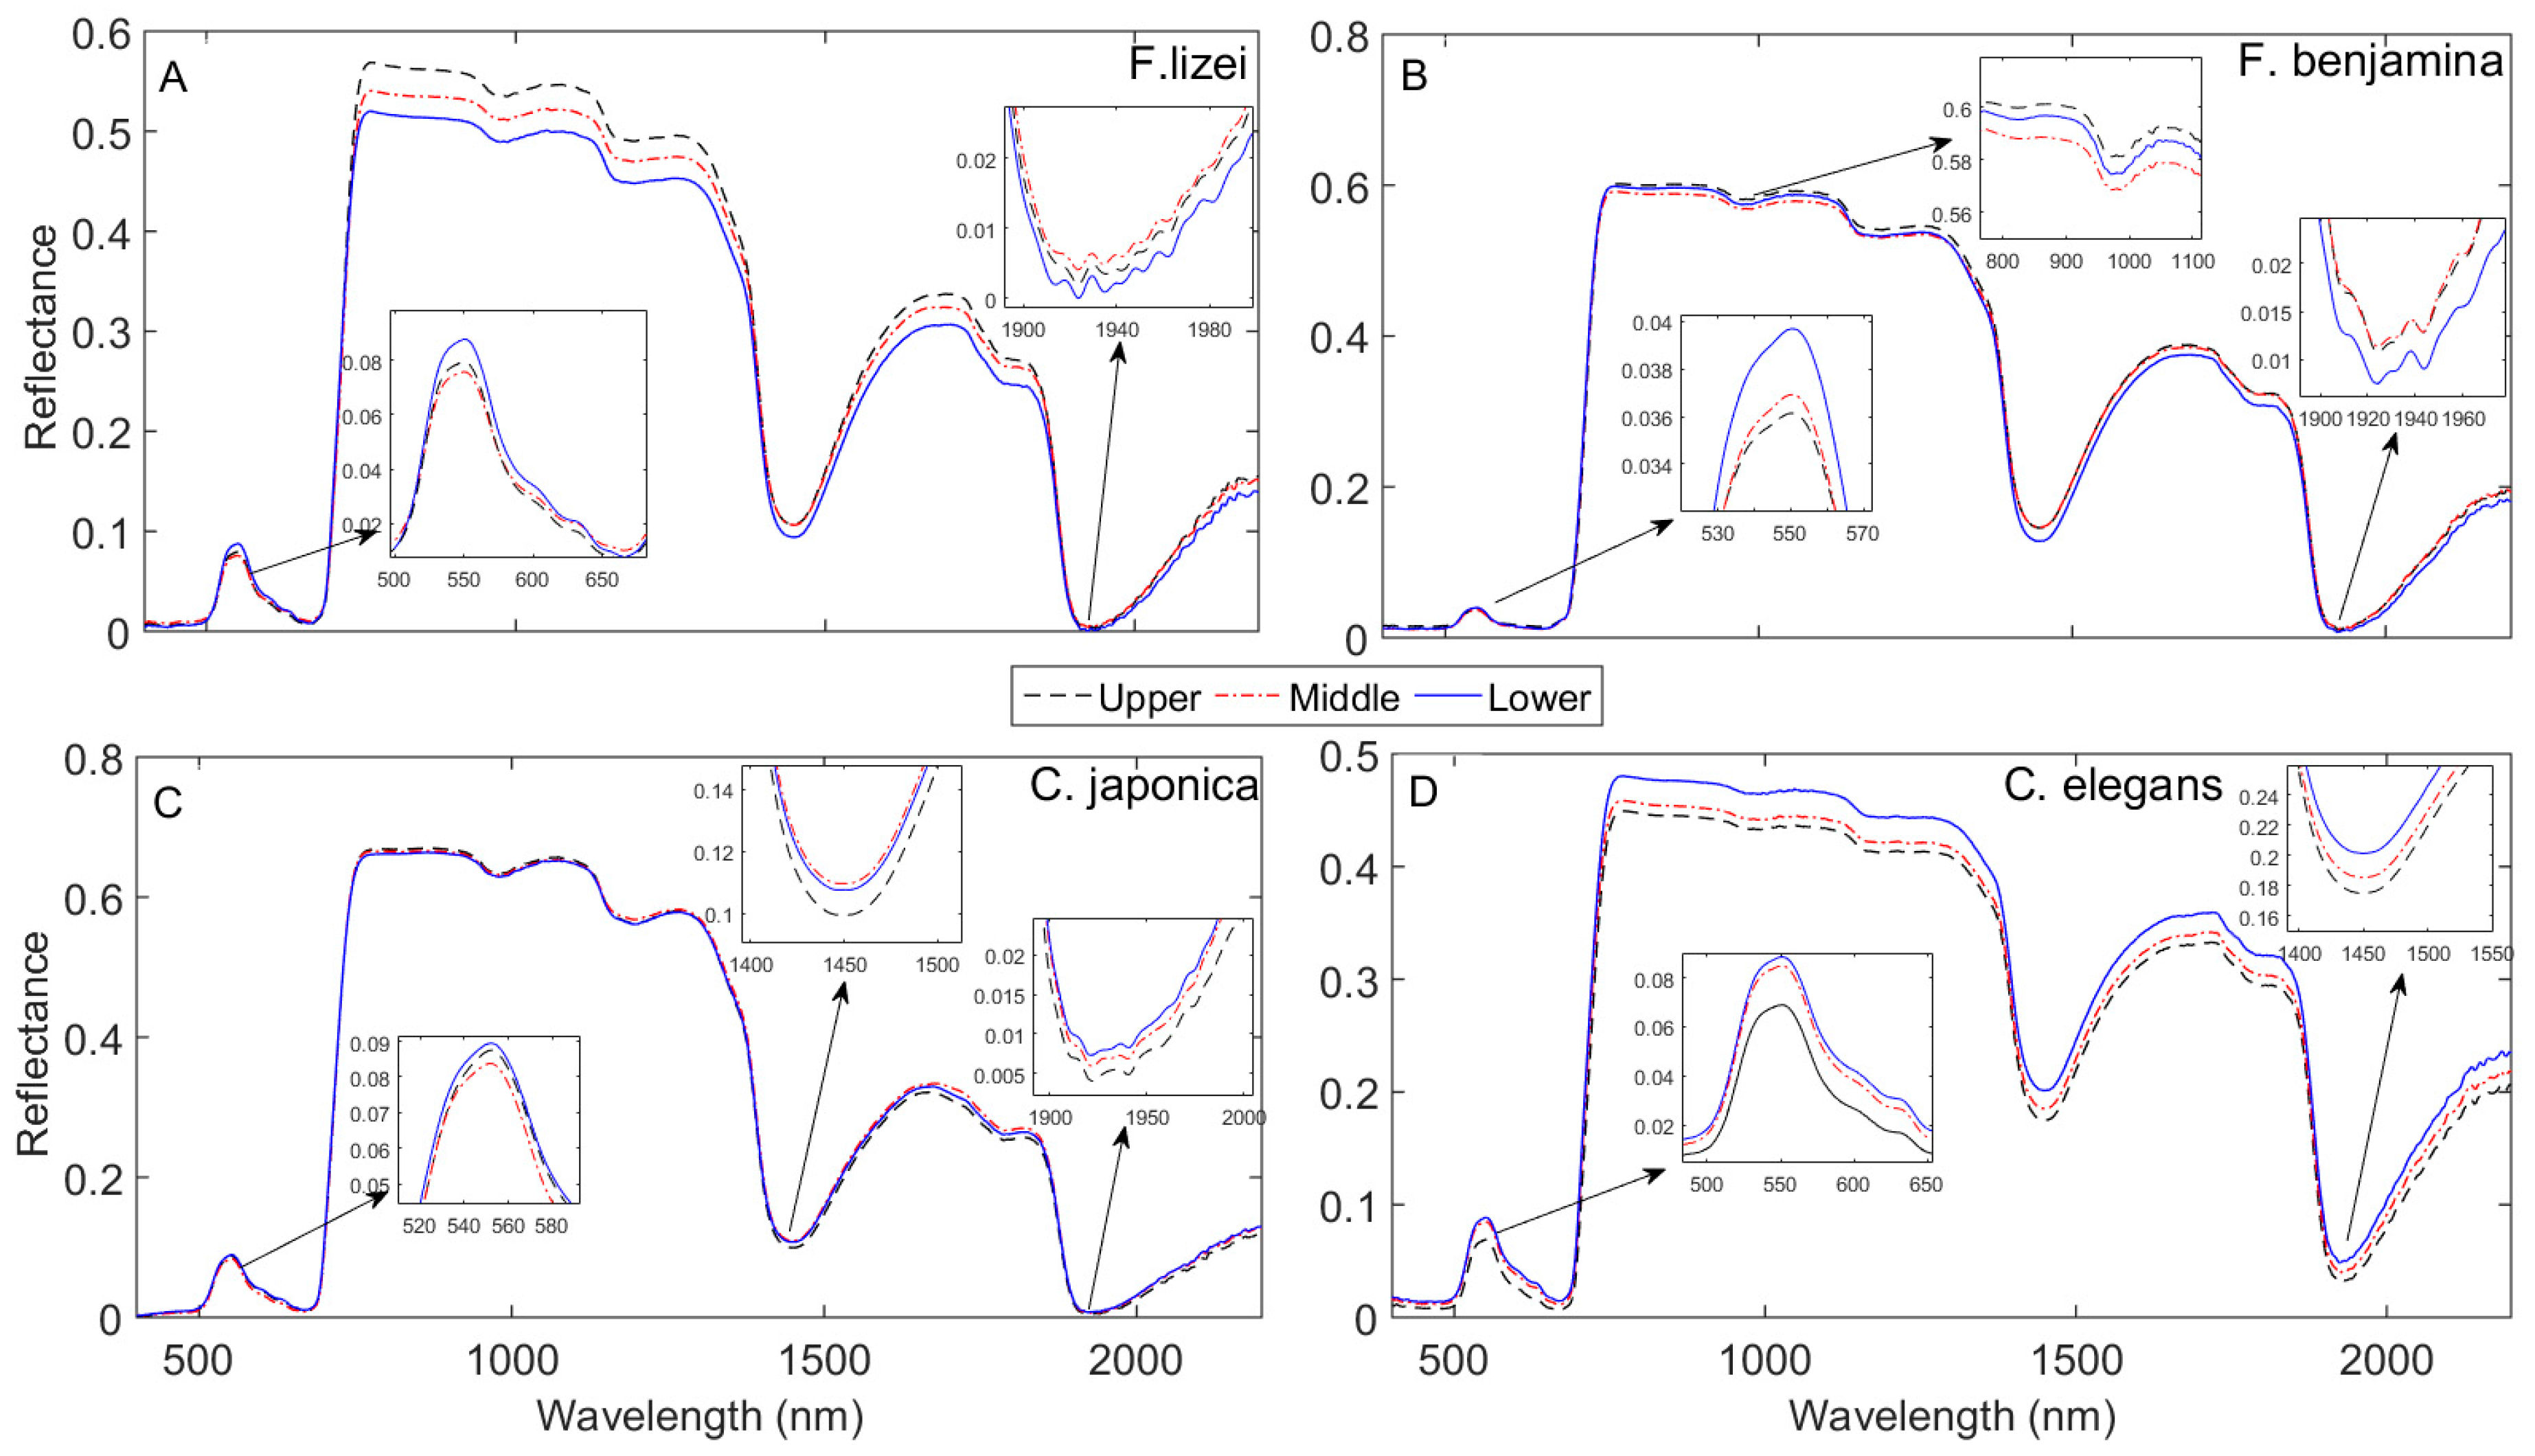
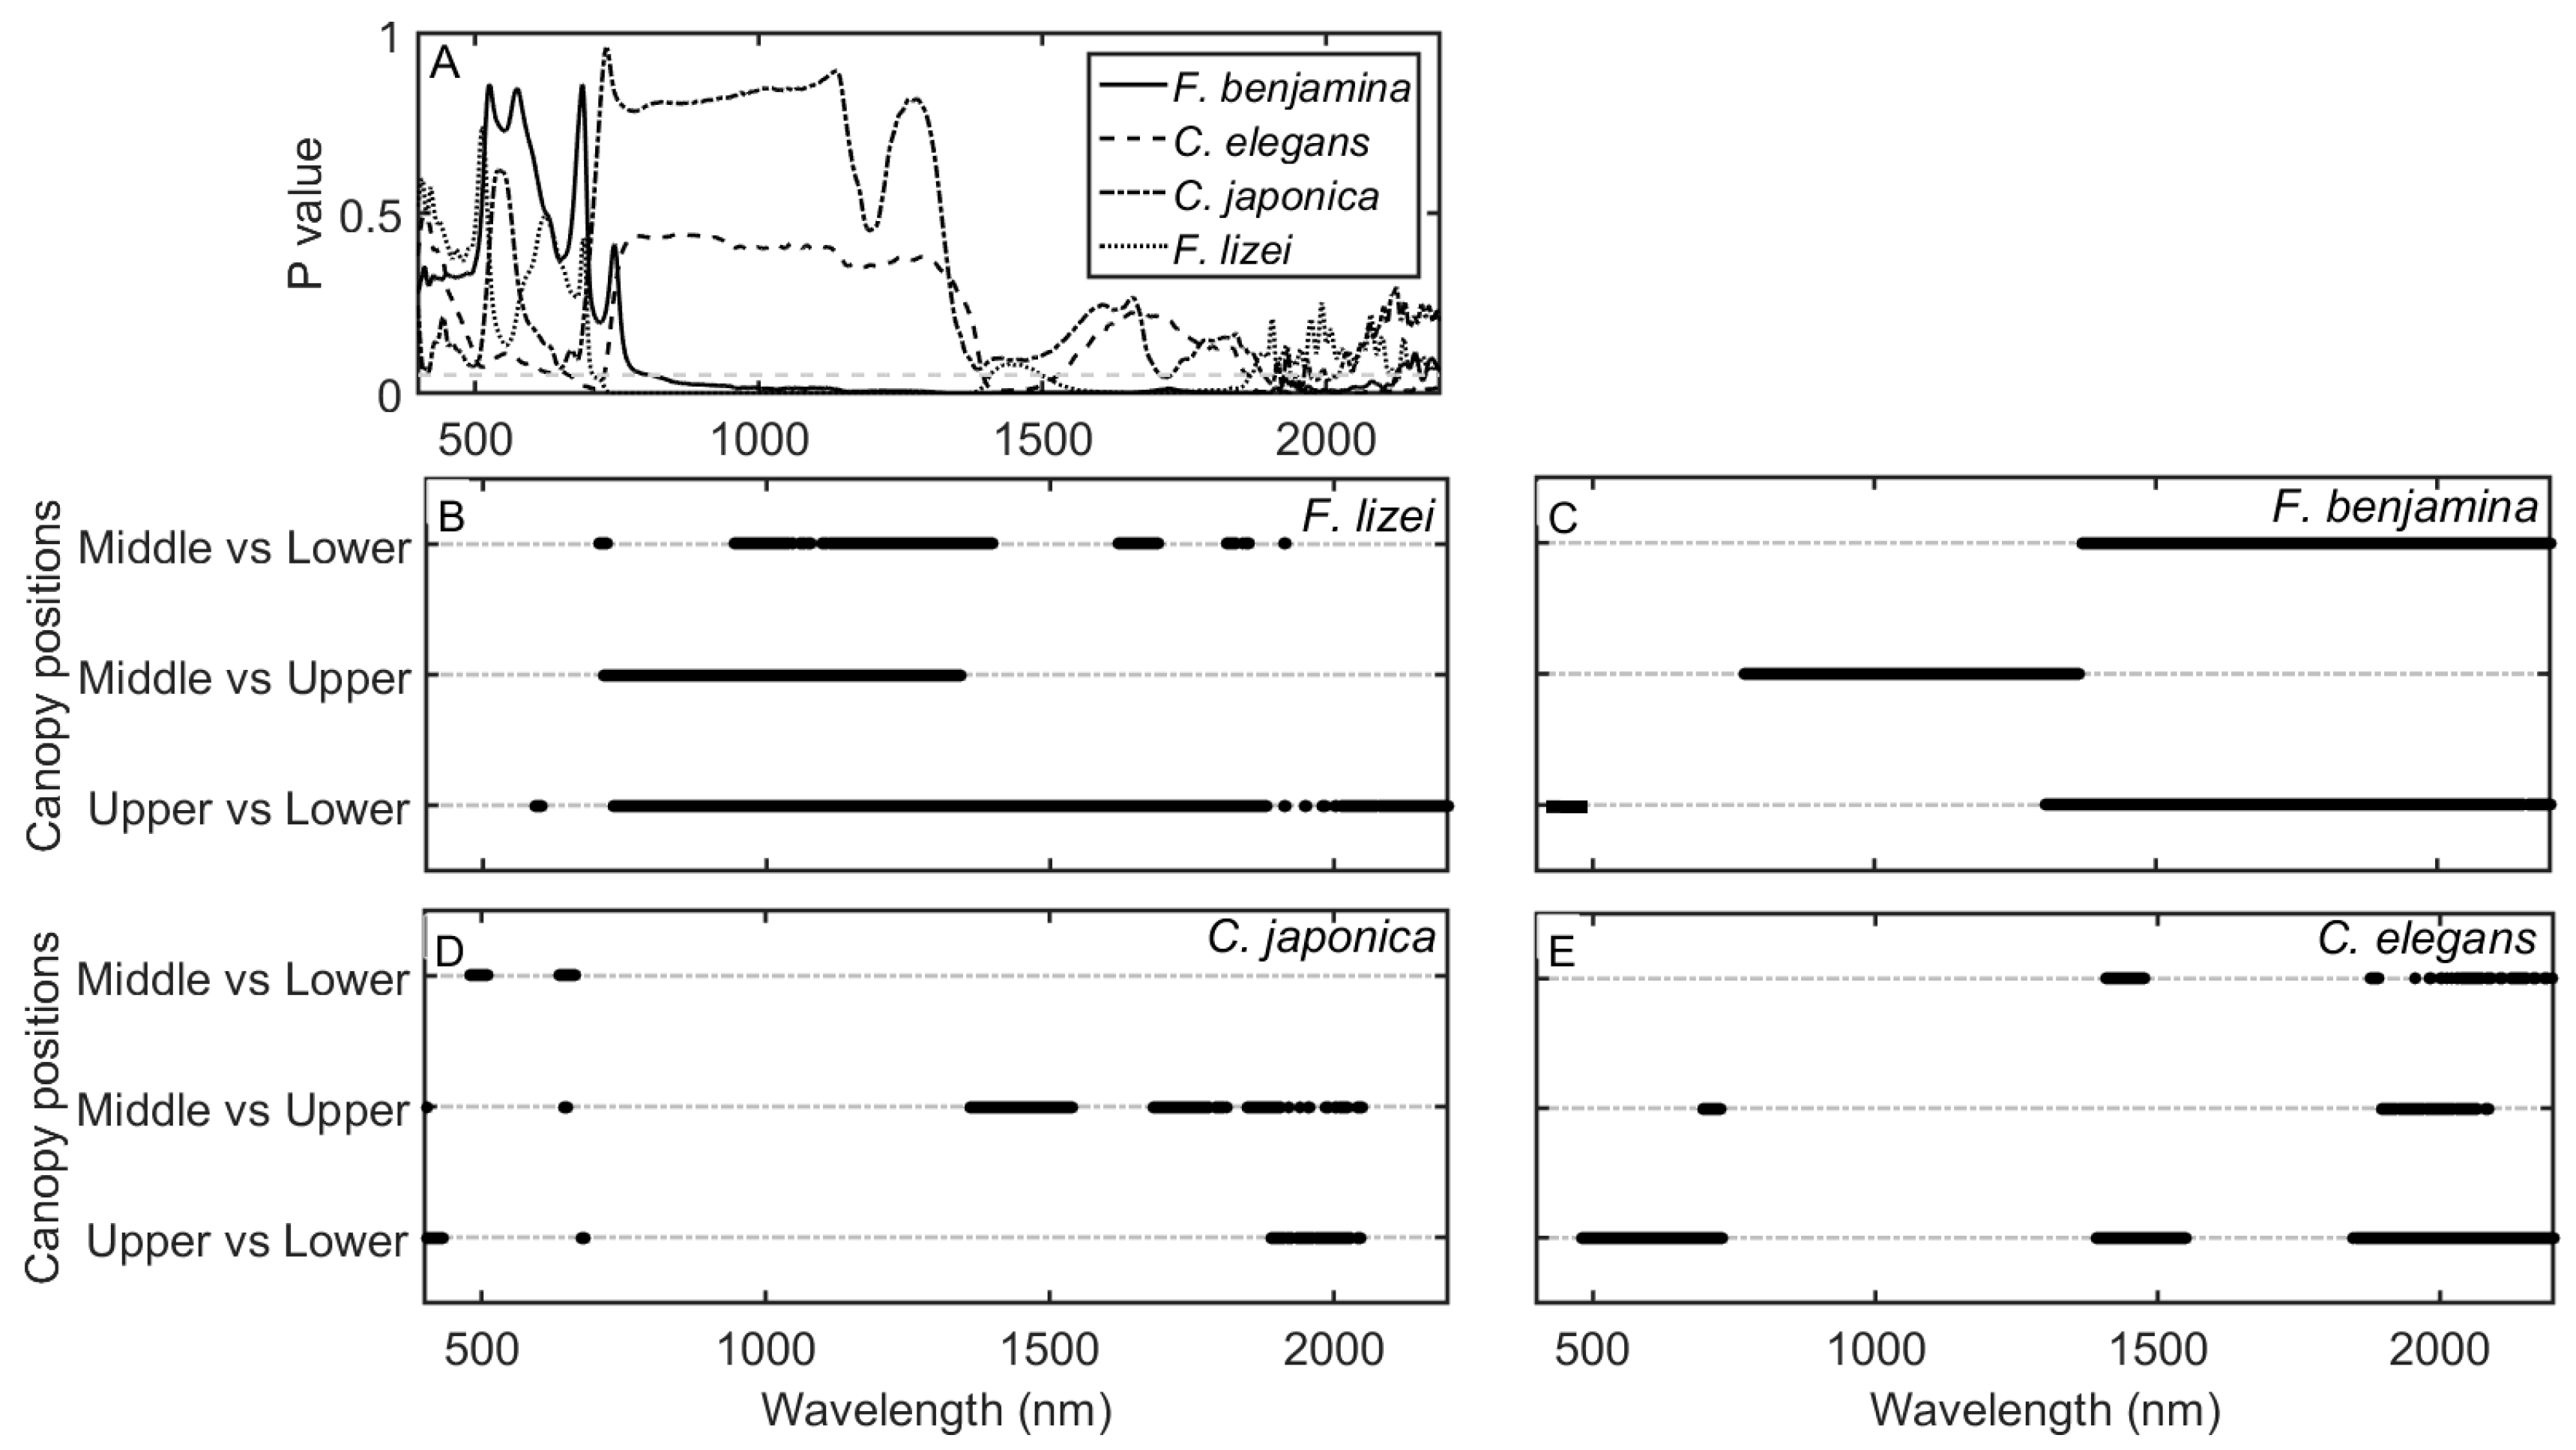
An ANOVA test showed that spectral response varied among species, resulting in species-dependent leaf spectral properties across the canopy vertical profile. Generally, for all the species studied leaf spectral reflectance was consistently higher for the lower canopy layer in the visible spectrum (Figure 4)—a result confirmed by the ANOVA test (5A) followed by the Tukey HSD post hoc test (Figure 5B–E). The descending spectral reflectance trend in the visible spectrum (lower > middle > upper) was more pronounced for F lizei, F.benjamina and C elegans. This pattern is similar to the one observed for the pooled species data. C. Japonica exhibited a small variation in the visible spectrum between canopy layers—reflecting a small variation in Cab observed in Figure 6. We found no significant variation in leaf spectra for C. japonica in the NIR spectral domain, and this reflects variation in C observed for this species which was not statistically significant (P > 0.05). In the SWIR spectral domain especially in wavebands centered around 1950 nm, leaf spectra for C. japonica and C. elegans decreased in the order of lower > middle > upper canopy layers (Figure 4C,D). The descending pattern in leaf spectra in these wavebands was statistically significant (P ≤ 0.05) for C elegans (Figure 5E), while for C. japonica the descend was significant between the upper layer against the middle and lower canopy layers respectively (Figure 5D). The trend observed for C. japonica and C. elegans conform to the trend observed for the pooled species data. Leaf spectra for the lower canopy layer for F. lizei and F. benjamina exhibited significantly low reflectance values in the SWIR spectral domain compared to the upper and middle canopy layers (Figure 4A,B).
3.3. Variation in Leaf Functional Trait Content across the Vertical Canopy Profile
Cab, N, and C demonstrated a significant (P ≤ 0.05) ascending pattern in order of lower > middle > upper canopy layers for individual species as well as the pooled dataset (Figure 6). This demonstrated that upper canopy leaves contained higher trait content than shaded lower canopy leaves. Among all, it was noted that F. lizei demonstrated a contrasting pattern for N, with high foliar N values in the middle layer compared to the bottom and upper layer. SLA was observed to be generally lower in the upper canopy layers compared to middle and lower layers. Again it was noted that F. lizei demonstrated significantly (P ≤ 0.05) low SLA values in the middle layer compared to the upper and lower layers. EWT exhibited contrasting patterns among species. For example, C. elegans and F. lizei demonstrated a significant (P ≤ 0.05) increase in EWT values in the order of lower > middle > upper. In contrast, C. Japonica and F. Benjamina demonstrated low EWT values in the middle layer compared to bottom and upper canopy layers. Details of leaf traits comparison across the canopy at the species level and pooled dataset based on the Tukey HSD post hoc test are shown in Table 2. Prominent variability in leaf traits existed between the upper and lower layers of the canopy than any other canopy layer pair.
3.4. Discriminating Leaf Samples into Respective Canopy Positions Groups
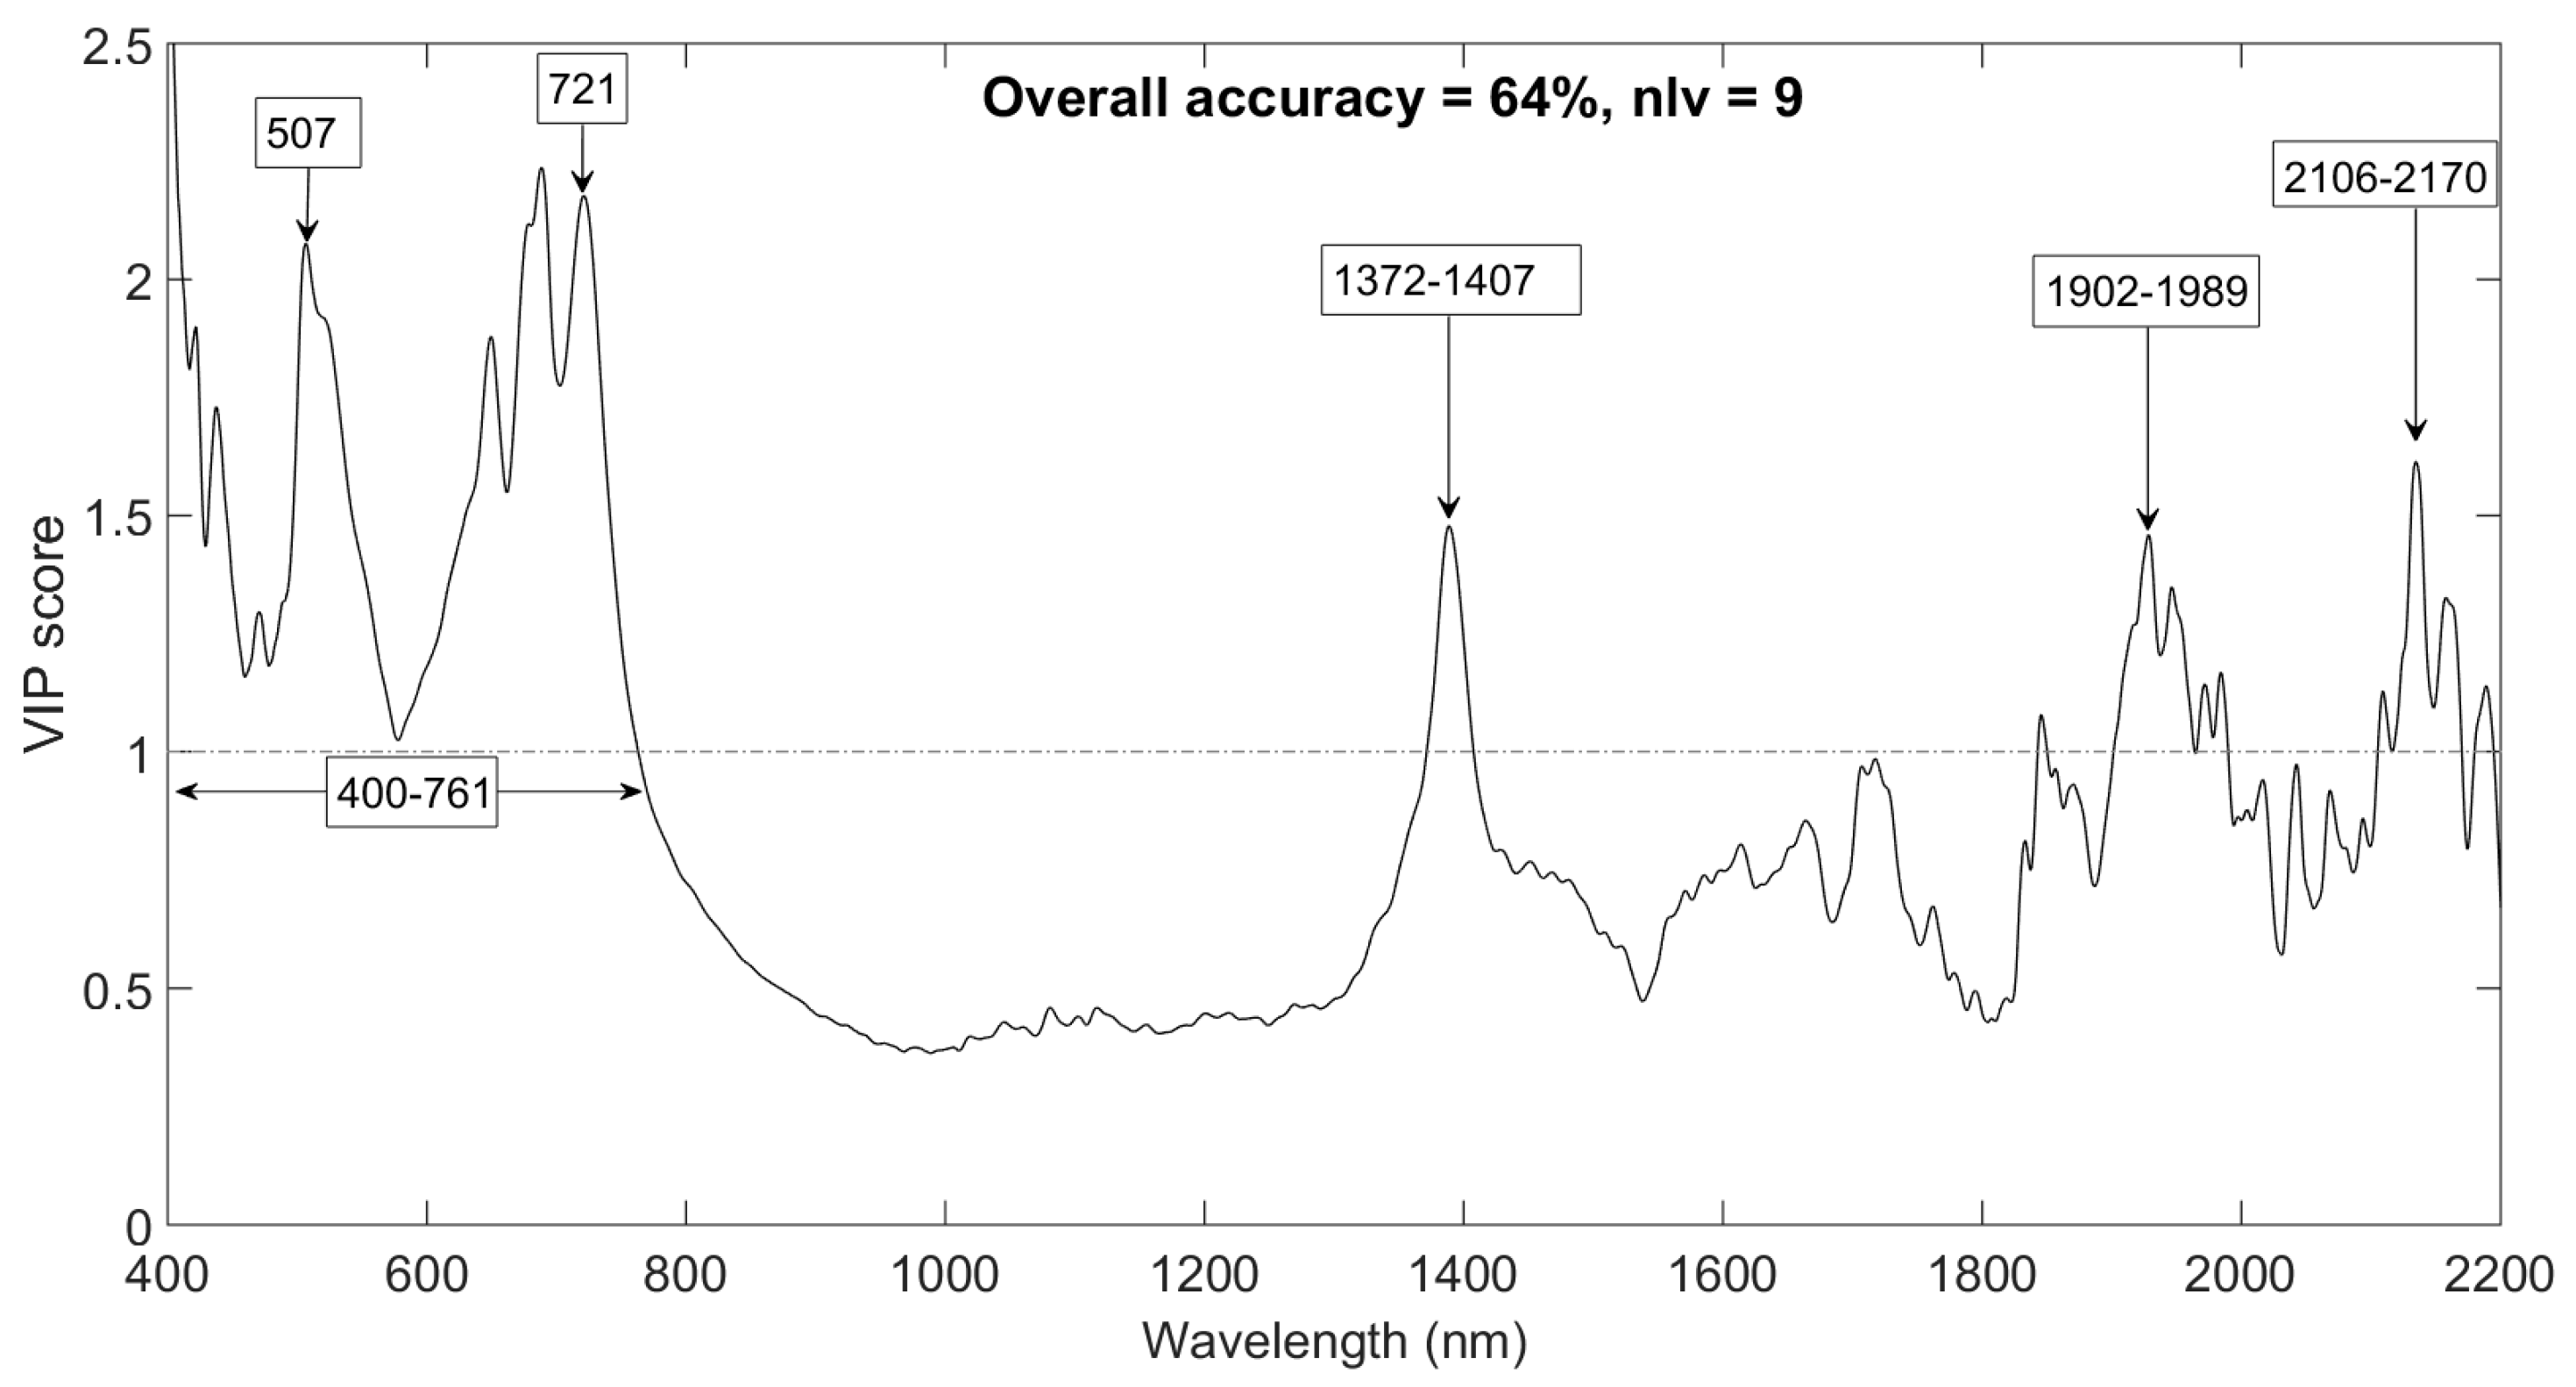
Leaf samples were successfully discriminated into their defined vertical canopy position groups with an overall accuracy of 64 % based on 9 latent variables (Table 3) using PLS-DA.
Key wavebands that were influential in the spectral discrimination of leaf samples into their defined vertical canopy position groups were identified as 400–761, 1372–1407, 1902–1989 and 2106–2170 nm (Figure 7). These wavebands had VIP scores greater than the significant threshold of one (1)—demonstrating the strong influence on the classification procedure. Highly influential spectral wavebands (i.e., with VIP score > 2) were identified in the visible spectrum (around 507 nm) and in the red-edge spectrum (around 721 nm). Other influential spectral wavebands matched with wavelength regions of known leaf water (1372–1407) and as well as SLA and N (1902–1989 and 2106–2170 nm) absorption features. The influential wavebands (VIP score > 1) exhibit key wavebands in the discrimination of leaf samples into the three vertical canopy positions.
4. Discussion
4.1. Effect of Canopy Position on Leaf Spectral Properties and Leaf Traits
In this study, we explored the impact of vertical canopy position on leaf spectral properties and subsequently leaf traits on multiple species across the entire spectrum. We report discrepancies in leaf spectral properties across the vertical canopy profile of multiple species indicating that leaf spectral properties reflect variability in leaf traits content within a canopy. Results from this study demonstrated that leaf spectra significantly (P ≤ 0.05) shifted to longer wavelengths in the ‘red edge’ spectrum (685–701 nm) when the data from four studied species were pooled (Figure 2 and Figure 3). Spectral shifts in the ‘red edge’ spectrum reflected an increase in Cab and N in the order of lower > middle > upper canopy layers observed in Figure 6 and Table 2 for the pooled dataset. Although earlier studies have also demonstrated that wavelengths in the ‘red-edge’ spectral region are sensitive to variations in Cab and foliar N content [49,50,51], however spectral shifts in the red edge across vertical canopy profile were not examined. Results observed in the “red edge’ spectrum are related to Ma and Upadhyaya [27] who demonstrated that reflectance at 730 nm for the upper canopy leaves was significantly lower compared to the lower shaded leaves. However, Ma and Upadhyaya [27] did not use the full leaf spectrum but focused on optical properties variations at 660 and 730 nm only. In the visible spectrum, mean leaf spectral reflectance decreased in the order of lower > middle > upper canopy layers (Figure 2). This ascending pattern in leaf spectral reflectance in the visible spectrum concurred with the significant increase in Cab and N content from the lower to the upper canopy observed in Figure 6 for the pooled dataset. The leaf spectral reflectance pattern observed in the visible spectrum concur with results obtained by Yu et al. [29] in a study performed in pepper plants. However, the spectral discrepancies in the visible spectrum of the pepper plants were only related to measured foliar N as a suite of other traits were not measured. Allocating more foliar N and Cab to the upper canopy leaves is known to improve plant photosynthetic capacity and light use efficiency by 20% and 30% respectively [15]. Our observation demonstrates the ability of leaf spectral properties to track variation in foliar nutrients particularly Cab and N across the vertical canopy profile.
Leaf spectra for all the studied species were consistently higher for the lower canopy layer compared to the upper and middle canopy layers in the visible spectrum (Figure 4). The spectral discrepancy in the visible spectrum reflected a significant increase in Cab and N from the lower to the upper canopy for almost all the species studied (Figure 6). However, C. japonica exhibited a small change in spectral reflectance in the visible spectrum. This could be explained by the more open canopy characterizing the C. Japonica canopy which allows more light to reach the lower canopy layers. Anten and Ackerly [52] observed that defoliation in C. elegans canopies significantly increased Cab and subsequently light-saturated photosynthesis per unit leaf area for the newly exposed leaves. Contrary to the spectral patterns observed in the visible spectrum in our study, Khavaninzadeh et al. [24], observed that leaf reflectance measured using a three band RGB camera increased significantly from the lower to upper canopy in a study conducted in an area characterized by high levels of air pollution. In this regard, changes in leaf optical patterns as a function of canopy height can be used as a proxy of vegetation strain to stress factors such as air pollution.
Results from our study demonstrated that only C. elegans leaf spectral reflectance (Figure 4D) increased concomitantly with its SLA (Figure 6) which may be explained by the species ability to adjust traits content across their vertical canopy profile [53]. Generally, spectral analysis at species-specific level revealed significant spectral discrepancies outside the visible and ‘red edge’ spectral regions (Figure 5A). The spectral discrepancies in the NIR and SWIR varied among species, resulting in species-dependent leaf spectral properties across the vertical canopy profile. Variation in spectral response between species can be explained by different growth strategies employed by plants which potentially influence the allocation and immobilization of leaf traits across the canopy profile. However, the trend observed for N and SLA absorption features (centered on 2000 nm) especially between the lower and upper canopy layers was more or less similar across all species (Figure 5).
Influential wavebands in the spectral separatibility of leaf samples demonstrated the ability of leaf optical properties to track variation in leaf traits across the vertical canopy profile (Figure 7). Spectral wavebands between 400–761 nm, especially the more pronounced peaks (i.e., VIP scores > 2) in the visible spectrum (507 nm) and red edge spectrum (721 nm) are known to be strongly influenced by foliar Cab and N [49,54]. The 1372–1407 nm spectral wavebands are sensitive to leaf water content (EWT), while variation in the SWIR 1902–1989 nm and 2106–2170 nm have been identified to be sensitive to protein, N, dry matter and its reciprocal SLA [55]. These observations imply that leaf traits do not only vary with the phenological stage of a plant [40], but also with the light environment (micro climate) within the vertical canopy profile [18]. The position of a leaf within the canopy especially between sunlit and shaded leaves is known to influence the concentration of leaf traits such as N, C, and SLA, which are strongly related to the photosynthetic capacity of vegetation [17]. The spectral match observed between key wavebands in leaf samples discrimination and spectral absorption features of leaf traits across the vertical canopy profile demonstrated that leaf spectral reflectance has the ability to explain the impact of vertical canopy profile on leaf traits. High influential wavebands match wavelength regions of Cab, EWT, and N absorption features.
The vertical heterogeneity in leaf traits can be explained by two ecological mechanisms i.e., the optimization and coordination theories. The optimization theory [19] explains that plants develop an intrinsic mechanism to allocate more N to the upper illuminated leaves which receive the highest photon flux density compared to lower shaded leaves [17]. This mechanism optimizes total canopy photosynthetic as nitrogen-rich (30–50% N) enzyme i.e., ribulose-1.5-biphosphate (RuBP) carboxylase and phenolyenolpyruvate (PEP) responsible for carbon fixation in C3 and C4 plants respectively are deployed to commensurate light conditions within the canopy. Upper canopy leaves are therefore characterized by a higher density of mitochondria per cell area [56] and increased rates of carbon gain [22] to support increased metabolic demands. The coordination theory further explains that the vertical heterogeneity in leaf traits especially N is an attempt by plants to maintain a balance between the Rubisco-limited rate of carboxylation (Wc) and electron transport-limited rate of carboxylation (Wj) [20]. The driving force for the allocation of N within a canopy is the variation between leaf N content at a given time and the leaf N content that is required to bring Wc and Wj into a balance [17,20]. The ascending pattern in leaf traits content may also be attributed to the interaction between leaf age and light acclimatization. Previous studies demonstrate that in fast-growing and broad-leaf evergreen species newly developing foliage often overshadow older leaves resulting in marked changes in light availability to older leaves and subsequently affecting leaf biochemical properties [57]. In addition, shading is also known to result in accelerated ageing, senescence and increased leaf turnover [21]. Leaf senescence in the lower canopy induces re-mobilization of foliar nutrients particularly N to the upper canopy leaves. Moreover, Hikosaka and Hirose [58] observed that leaf N and photosynthetic capacity decrease with leaf life span in C. japonica canopies. This mechanism results in an increased gradient in leaf traits content across the vertical canopy profile [59]. As such, this study demonstrated that leaf spectral properties track dynamics in leaf traits across the vertical canopy profile as observed in Figure 7. Significant variations in the spectrum were observed especially in the red edge spectrum for the pooled dataset. This observation is consistent with our understanding of leaf physiology within plant canopies.
4.2. Implication of This Study to Remote Sensing of Plant Traits
Our results have important implications on within-canopy sampling and scaling up strategies of leaf traits to canopy and landscape scales, especially for studies that are conducted in environments where foliage material from the lower canopy influences canopy reflectance. This study put into perspective upscaling methods such as the direct extrapolation [60] that apply leaf traits-spectra relationship observed at leaf level to canopy scale by assuming that all leaves within a plant canopy have the same traits content [61]. Our results indicate that leaf samples from different canopy layers exhibit different traits content and are subsequently spectrally distinct. This observation implies that failure to account for the vertical heterogeneity in key traits across the vertical canopy profile can potentially lead to considerable inaccuracies in leaf traits upscaling and subsequently leaf traits estimation especially at canopy scale [62]. For example, a recent study by Coble et al. [18] demonstrated that canopy photosynthesis estimated from models that do not account for the vertical variation in leaf traits, particularly N and dry matter content, overestimated the canopy photosynthesis by over 60%. However, before exploring the effect of vertical heterogeneity on the leaf to canopy upscaling approaches, it is imperative to understand the spectra-traits interaction at leaf level. Leaf spectra-traits interaction at leaf level provides an opportunity to understand the mechanism without the influence of canopy structure [i.e., leaf area index (LAI), canopy height, etc.], soil background and viewing geometry on the spectral reflectance [63]. An improved understanding on the effect of vertical heterogeneity of traits on spectral properties across the vertical canopy profile is also critical in improving our understanding, designing and parameterization of robust multi-layer RTM that is able to simulate canopy reflectance with minimal error [31]. Improving the design and performance of such models requires the understanding and ability to disentangle and quantify the relative contribution of each canopy layer to the top of canopy reflectance. This study also has implications for studies that aim to integrate hyperspectral measurements and LiDAR data to understand the three dimensional (3D) variability in leaf traits across vegetation canopies [64].
5. Conclusions
The effect of vertical canopy position on leaf spectral properties and leaf traits content across multiple species is not well documented. In this study, we examined the effect of vertical canopy position on leaf traits and leaf spectral properties across multiple species. We also assessed the ability of leaf optical properties to track variability in leaf traits across the vertical canopy profile. Results of this study demonstrate that vertical canopy position is a significant source of variation in leaf spectral properties and traits content. We observed that leaf spectra significantly shifted to longer wavelengths in the ‘red edge’ spectrum when data from all species were pooled together. The spectral shift reflected an increase in leaf traits content especially Cab and N in the order of lower > middle > upper canopy layers. At species-specific level leaf, spectral responses outside the visible spectrum varied, resulting in species-dependent leaf spectral properties across the vertical canopy profile. Key wavebands that are influential in the discrimination of leaf samples into their defined canopy positions match wavelength regions of Cab, EWT, SLA, and N absorption features-which significantly varied across the vertical canopy profile. This observation demonstrated the capability of leaf optical properties to track variability in leaf traits across the vertical canopy profile. We, therefore, conclude that changes in foliar nutrients translate into changes in vegetation spectral properties across the vertical canopy profile. These findings have implications on within-canopy sampling, leaf traits upscaling, interpretation and use of data in species trait databases. Future studies should aim to understand how the vertical heterogeneity in leaf traits affects the estimation of plant traits from hyperspectral measurements at canopy scale.
Acknowledgments
This study was carried out with the financial assistance of the Faculty of Geo-Information Science and Earth Observation (ITC), University of Twente. The authors extend their gratitude for the technical support during laboratory measurements from the staff of the Geosciences Laboratory at ITC faculty, University of Twente.
Author Contributions
Tawanda W. Gara, Roshanak Darvishzadeh, Andrew K. Skidmore, Tiejun Wang conceived and designed the experiment. Tawanda analyzed the data and wrote the manuscript. All authors contributed to editing of the manuscript.
Conflicts of Interest
The authors declare no conflict of interest.
References
- Diaz, S.; Hodgson, J.G.; Thompson, K.; Cabido, M.; Cornelissen, J.H.C.; Jalili, A.; Montserrat-Martí, G.; Grime, J.P.; Zarrinkamar, F.; Asri, Y.; et al. The plant traits that drive ecosystems: Evidence from three continents. J. Veg. Sci. 2004, 15, 295–304. [Google Scholar] [CrossRef] [Green Version]
- Reich, P.B.; Wright, I.J.; Cavender-Bares, J.; Craine, J.M.; Oleksyn, J.; Westoby, M.; Walters, M.B. The evolution of plant functional variation: Traits, spectra, and strategies. Int. J. Plant Sci. 2003, 164, S143–S164. [Google Scholar] [CrossRef]
- Winemiller, K.O.; Fitzgerald, D.B.; Bower, L.M.; Pianka, E.R. Functional traits, convergent evolution, and periodic tables of niches. Ecol. Lett. 2015, 18, 737–751. [Google Scholar] [CrossRef] [PubMed]
- Scheiter, S.; Langan, L.; Higgins, S.I. Next-generation dynamic global vegetation models: Learning from community ecology. New Phytol. 2013, 198, 957–969. [Google Scholar] [CrossRef] [PubMed]
- Skidmore, A.K.; Pettorelli, N.; Coops, N.C.; Geller, G.N.; Hansen, M.; Lucas, R.; Mücher, C.A.; O’Connor, B.; Paganini, M.; Pereira, H.M.; et al. Environmental science: Agree on biodiversity metrics to track from space. Nature 2015, 523, 403–405. [Google Scholar] [CrossRef] [PubMed]
- Pereira, H.M.; Ferrier, S.; Walters, M.; Geller, G.N.; Jongman, R.H.G.; Scholes, R.J.; Bruford, M.W.; Brummitt, N.; Butchart, S.H.M.; Cardoso, A.C.; et al. Essential biodiversity variables. Science 2013, 339, 277. [Google Scholar] [CrossRef] [PubMed] [Green Version]
- Ferwerda, J.G.; Skidmore, A.K. Can nutrient status of four woody plant species be predicted using field spectrometry? ISPRS J. Photogramm. Remote Sens. 2007, 62, 406–414. [Google Scholar] [CrossRef]
- Kokaly, R.F. Investigating a physical basis for spectroscopic estimates of leaf nitrogen concentration. Remote Sens. Environ. 2001, 75, 153–161. [Google Scholar] [CrossRef]
- Dusseux, P.; Hubert-Moy, L.; Corpetti, T.; Vertès, F. Evaluation of SPOT imagery for the estimation of grassland biomass. Int. J. Appl. Earth Obs. Geoinf. 2015, 38, 72–77. [Google Scholar] [CrossRef]
- Darvishzadeh, R.; Skidmore, A.; Schlerf, M.; Atzberger, C. Inversion of a radiative transfer model for estimating vegetation LAI and chlorophyll in a heterogeneous grassland. Remote Sens. Environ. 2008, 112, 2592–2604. [Google Scholar] [CrossRef]
- Schmidt, K.S.; Skidmore, A.K. Spectral discrimination of vegetation types in a coastal wetland. Remote Sens. Environ. 2003, 85, 92–108. [Google Scholar] [CrossRef]
- Mariey, L.; Signolle, J.P.; Amiel, C.; Travert, J. Discrimination, classification, identification of microorganisms using FTIR spectroscopy and chemometrics. Vib. Spectrosc. 2001, 26, 151–159. [Google Scholar] [CrossRef]
- Rapaport, T.; Hochberg, U.; Shoshany, M.; Karnieli, A.; Rachmilevitch, S. Combining leaf physiology, hyperspectral imaging and partial least squares-regression (PLS-R) for grapevine water status assessment. ISPRS J. Photogramm. Remote Sens. 2015, 109, 88–97. [Google Scholar] [CrossRef]
- Verrelst, J.; Camps-Valls, G.; Muñoz-Marí, J.; Rivera, J.P.; Veroustraete, F.; Clevers, J.G.P.W.; Moreno, J. Optical remote sensing and the retrieval of terrestrial vegetation bio-geophysical properties—A review. ISPRS J. Photogramm. Remote Sens. 2015, 108, 273–290. [Google Scholar] [CrossRef]
- Homolová, L.; Malenovský, Z.; Clevers, J.G.P.W.; García-Santos, G.; Schaepman, M.E. Review of optical-based remote sensing for plant trait mapping. Ecol. Complex. 2013, 15, 1–16. [Google Scholar] [CrossRef]
- Thomas, V.; Treitz, P.; McCaughey, J.H.; Noland, T.; Rich, L. Canopy chlorophyll concentration estimation using hyperspectral and LiDAR data for a boreal mixedwood forest in northern Ontario, Canada. Int. J. Remote Sens. 2008, 29, 1029–1052. [Google Scholar] [CrossRef]
- Li, H.; Zhao, C.; Huang, W.; Yang, G. Non-uniform vertical nitrogen distribution within plant canopy and its estimation by remote sensing: A review. Field Crops Res. 2013, 142, 75–84. [Google Scholar] [CrossRef]
- Coble, A.P.; VanderWall, B.; Mau, A.; Cavaleri, M.A. How vertical patterns in leaf traits shift seasonally and the implications for modeling canopy photosynthesis in a temperate deciduous forest. Tree Physiol. 2016, 36, 1077–1091. [Google Scholar] [CrossRef] [PubMed]
- Hirose, T.; Werger, M.J.A. Maximizing daily canopy photosynthesis with respect to the leaf nitrogen allocation pattern in the canopy. Oecologia 1987, 72, 520–526. [Google Scholar] [CrossRef] [PubMed]
- Chen, J.-L.; Reynolds, J.; Harley, P.; Tenhunen, J. Coordination theory of leaf nitrogen distribution in a canopy. Oecologia 1993, 93, 63–69. [Google Scholar] [CrossRef] [PubMed]
- Hikosaka, K. Leaf canopy as a dynamic system: Ecophysiology and optimality in leaf turnover. Ann. Bot. 2005, 95, 521–533. [Google Scholar] [CrossRef] [PubMed]
- Weerasinghe, L.K.; Creek, D.; Crous, K.Y.; Xiang, S.; Liddell, M.J.; Turnbull, M.H.; Atkin, O.K. Canopy position affects the relationships between leaf respiration and associated traits in a tropical rainforest in far north Queensland. Tree Physiol. 2014, 34, 564–584. [Google Scholar] [CrossRef] [PubMed]
- He, L.; Zhang, H.-Y.; Zhang, Y.-S.; Song, X.; Feng, W.; Kang, G.-Z.; Wang, C.-Y.; Guo, T.-C. Estimating canopy leaf nitrogen concentration in winter wheat based on multi-angular hyperspectral remote sensing. Eur. J. Agron. 2016, 73, 170–185. [Google Scholar] [CrossRef]
- Khavaninzadeh, A.R.; Veroustraete, F.; Van Wittenberghe, S.; Verrelst, J.; Samson, R. Leaf reflectance variation along a vertical crown gradient of two deciduous tree species in a Belgian industrial habitat. Environ. Pollut. 2015, 204, 324–332. [Google Scholar] [CrossRef] [PubMed]
- Liu, S.; Peng, Y.; Du, W.; Le, Y.; Li, L. Remote estimation of leaf and canopy water content in winter wheat with different vertical distribution of water-related properties. Remote Sens. 2015, 7, 4626–4650. [Google Scholar] [CrossRef]
- Van Wittenberghe, S.; Alonso, L.; Verrelst, J.; Hermans, I.; Valcke, R.; Veroustraete, F.; Moreno, J.; Samson, R. A field study on solar-induced chlorophyll fluorescence and pigment parameters along a vertical canopy gradient of four tree species in an urban environment. Sci. Total Environ. 2014, 466–467, 185–194. [Google Scholar] [CrossRef] [PubMed]
- Ma, L.; Upadhyaya, M.K. Effects of leaf position on reflectance, transmittance and absorption of red and far-red light in tomato, chenopodium album and amaranthus retroflexus leaves. Weed Res. 2018, 58, 17–24. [Google Scholar] [CrossRef]
- Li, P.; Wang, Q. Developing and validating novel hyperspectral indices for leaf area index estimation: Effect of canopy vertical heterogeneity. Ecol. Indic. 2013, 32, 123–130. [Google Scholar] [CrossRef]
- Yu, K.-Q.; Zhao, Y.-R.; Li, X.-L.; Shao, Y.-N.; Liu, F.; He, Y. Hyperspectral imaging for mapping of total nitrogen spatial distribution in pepper plant. PLoS ONE 2015, 9, e116205. [Google Scholar] [CrossRef] [PubMed]
- Liao, Q.; Wang, J.; Yang, G.; Zhang, D.; Li, H.; Fu, Y.; Li, Z. Comparison of spectral indices and wavelet transform for estimating chlorophyll content of maize from hyperspectral reflectance. APPRES 2013, 7, 0735751–07357511. [Google Scholar] [CrossRef]
- Wang, Q.; Li, P. Canopy vertical heterogeneity plays a critical role in reflectance simulation. Agric. Meteorol. 2013, 169, 111–121. [Google Scholar] [CrossRef]
- Sprintsin, M.; Chen, J.M.; Desai, A.; Gough, C.M. Evaluation of leaf-to-canopy upscaling methodologies against carbon flux data in North America. J. Geophys. Res. Biogeosci. 2012, 117, 1–17. [Google Scholar] [CrossRef]
- Wilkes, P.; Jones, S.D.; Suarez, L.; Haywood, A.; Mellor, A.; Woodgate, W.; Soto-Berelov, M.; Skidmore, A.K. Using discrete-return airborne laser scanning to quantify number of canopy strata across diverse forest types. Methods Ecol. Evolut. 2016, 7, 700–712. [Google Scholar] [CrossRef]
- Whitehurst, A.; Swatantran, A.; Blair, J.; Hofton, M.; Dubayah, R. Characterization of canopy layering in forested ecosystems using full waveform LiDAR. Remote Sens. 2013, 5, 2014–2036. [Google Scholar] [CrossRef]
- ASD Inc. Integrating Sphere User Manual; Analytical Spectral Devices, Inc. (ASD): Boulder, CO, USA, 2008. [Google Scholar]
- Savitzky, A.; Golay, M.J.E. Smoothing and differentiation of data by simplified least squares procedures. Anal. Chem. 1964, 36, 1627–1639. [Google Scholar] [CrossRef]
- Opti-Sciences, Inc. CCM-300 Chlorophyll Content Meter; Opti-Sciences, Inc.: Hudson, NY, USA, 2011. [Google Scholar]
- ADC-BioScientific Ltd. Am350 Portable Leaf Area Meter; ADC BioScientific Ltd.: Hoddesdon, UK, 2013. [Google Scholar]
- Perkin-Elmer, Inc. 2400 Series II CHNS/O Elemental Analysis; Perkin Elmer, Inc.: Waltham, MA, USA, 2005. [Google Scholar]
- Meerdink, S.K.; Roberts, D.A.; King, J.Y.; Roth, K.L.; Dennison, P.E.; Amaral, C.H.; Hook, S.J. Linking seasonal foliar traits to VSWIR-TIR spectroscopy across California ecosystems. Remote Sens. Environ. 2016, 186, 322–338. [Google Scholar] [CrossRef]
- Wang, Z.; Skidmore, A.K.; Darvishzadeh, R.; Heiden, U.; Heurich, M.; Wang, T. Leaf nitrogen content indirectly estimated by leaf traits derived from the prospect model. IEEE J. Sel. Top. Appl. Earth Obs. Remote Sens. 2015, 8, 3172–3180. [Google Scholar] [CrossRef]
- Tukey, J.W. Comparing individual means in the analysis of variance. Biometrics 1949, 5, 99–114. [Google Scholar] [CrossRef] [PubMed]
- Quinn, G.P.; Keough, M.J. Experimental Design and Data Analysis for Biologists; Cambridge University Press: Cambridge, UK, 2002. [Google Scholar]
- Carvalho, S.; Schlerf, M.; van der Putten, W.H.; Skidmore, A.K. Hyperspectral reflectance of leaves and flowers of an outbreak species discriminates season and successional stage of vegetation. Int. J. Appl. Earth Obs. Geoinf. 2013, 24, 32–41. [Google Scholar] [CrossRef]
- Wold, S.; Sjöström, M.; Eriksson, L. PLS-regression: A basic tool of chemometrics. Chemom. Intell. Lab. Syst. 2001, 58, 109–130. [Google Scholar] [CrossRef]
- Makvandi, S.; Ghasemzadeh-Barvarz, M.; Beaudoin, G.; Grunsky, E.C.; McClenaghan, M.B.; Duchesne, C.; Boutroy, E. Partial least squares-discriminant analysis of trace element compositions of magnetite from various VMS deposit subtypes: Application to mineral exploration. Ore Geol. Rev. 2016, 78, 388–408. [Google Scholar] [CrossRef]
- Pereira, H.V.; Amador, V.S.; Sena, M.M.; Augusti, R.; Piccin, E. Paper spray mass spectrometry and PLS-DA improved by variable selection for the forensic discrimination of beers. Anal. Chim. Acta 2016, 940, 104–112. [Google Scholar] [CrossRef] [PubMed]
- Kuhn, M. Building predictive models in R using the caret package. J. Stat. Softw. 2008, 28, 26. [Google Scholar] [CrossRef]
- Li, F.; Miao, Y.; Feng, G.; Yuan, F.; Yue, S.; Gao, X.; Liu, Y.; Liu, B.; Ustin, S.L.; Chen, X. Improving estimation of summer maize nitrogen status with red edge-based spectral vegetation indices. Field Crops Res. 2014, 157, 111–123. [Google Scholar] [CrossRef]
- Clevers, J.G.P.W.; Gitelson, A.A. Remote estimation of crop and grass chlorophyll and nitrogen content using red-edge bands on Sentinel-2 and -3. Int. J. Appl. Earth Obs. Geoinf. 2013, 23, 344–351. [Google Scholar] [CrossRef]
- Mutanga, O.; Skidmore, A.K. Red edge shift and biochemical content in grass canopies. ISPRS J. Photogramm Remote Sens. 2007, 62, 34–42. [Google Scholar] [CrossRef]
- Anten, N.P.R.; Ackerly, D.D. Canopy-level photosynthetic compensation after defoliation in a tropical understorey palm. Funct. Ecol. 2001, 15, 252–262. [Google Scholar]
- Chazdon, R.L. Light variation and carbon gain in rain forest understorey palms. J. Ecol. 1986, 74, 995–1012. [Google Scholar] [CrossRef]
- Curran, P.J. Remote sensing of foliar chemistry. Remote Sens. Environ. 1989, 30, 271–278. [Google Scholar] [CrossRef]
- Ali, A.M.; Darvishzadeh, R.; Skidmore, A.K.; Duren, I.V.; Heiden, U.; Heurich, M. Estimating leaf functional traits by inversion of prospect: Assessing leaf dry matter content and specific leaf area in mixed mountainous forest. Int. J. Appl. Earth Obs. Geoinf. 2016, 45 Pt A, 66–76. [Google Scholar] [CrossRef]
- Tissue, D.T.; Lewis, J.D.; Wullschleger, S.D.; Amthor, J.S.; Griffin, K.L.; Anderson, O.R. Leaf respiration at different canopy positions in sweetgum (Liquidambar styraciflua) grown in ambient and elevated concentrations of carbon dioxide in the field. Tree Physiol. 2002, 22, 1157–1166. [Google Scholar] [CrossRef] [PubMed]
- Niinemets, Ü. Photosynthesis and resource distribution through plant canopies. Plant Cell Environ. 2007, 30, 1052–1071. [Google Scholar] [CrossRef] [PubMed]
- Hikosaka, K.; Hirose, T. Photosynthetic nitrogen-use efficiency in evergreen broad-leaved woody species coexisting in a warm-temperate forest. Tree Physiol. 2000, 20, 1249–1254. [Google Scholar] [CrossRef] [PubMed]
- Kull, O.; Kruijt, B. Acclimation of photosynthesis to light: A mechanistic approach. Funct. Ecol. 1999, 13, 24–36. [Google Scholar] [CrossRef]
- He, Y.; Mui, A. Scaling up semi-arid grassland biochemical content from the leaf to the canopy level: Challenges and opportunities. Sensors 2010, 10, 11072–11087. [Google Scholar] [CrossRef] [PubMed]
- Peterson, D.L.; Aber, J.D.; Matson, P.A.; Card, D.H.; Swanberg, N.; Wessman, C.; Spanner, M. Remote sensing of forest canopy and leaf biochemical contents. Remote Sens. Environ. 1988, 24, 85–108. [Google Scholar] [CrossRef]
- Luo, J.; Ma, R.; Feng, H.; Li, X. Estimating the total nitrogen concentration of reed canopy with hyperspectral measurements considering a non-uniform vertical nitrogen distribution. Remote Sens. 2016, 8, 789. [Google Scholar] [CrossRef]
- Wang, Z.; Skidmore, A.K.; Wang, T.; Darvishzadeh, R.; Heiden, U.; Heurich, M.; Latifi, H.; Hearne, J. Canopy foliar nitrogen retrieved from airborne hyperspectral imagery by correcting for canopy structure effects. Int. J. Appl. Earth Obs. Geoinf. 2017, 54, 84–94. [Google Scholar] [CrossRef]
- Zhu, X.; Wang, T.; Skidmore, A.K.; Darvishzadeh, R.; Niemann, K.O.; Liu, J. Canopy leaf water content estimated using terrestrial LiDAR. Agric. For. Meteorol. 2017, 232, 152–162. [Google Scholar] [CrossRef]
Figure 1.
The demarcation of the three canopy layers.

Figure 2.
Mean leaf spectral reflectance at each canopy position for the pooled dataset. Note that the red edge shifts to longer wavelengths with increasing Cab.
Figure 2.
Mean leaf spectral reflectance at each canopy position for the pooled dataset. Note that the red edge shifts to longer wavelengths with increasing Cab.

Figure 3.
Variation in leaf spectral reflectance at different canopy positions for the pooled dataset (ANOVA test) (A); and pairwise variation in leaf spectral reflectance at different canopy positions (B).
Figure 3.
Variation in leaf spectral reflectance at different canopy positions for the pooled dataset (ANOVA test) (A); and pairwise variation in leaf spectral reflectance at different canopy positions (B).

Figure 4.
Species-specific mean leaf spectral reflectance at each canopy position for F. lizei (A), F. benjamina (B), C. japonica (C) and C. elegans (D).
Figure 4.
Species-specific mean leaf spectral reflectance at each canopy position for F. lizei (A), F. benjamina (B), C. japonica (C) and C. elegans (D).

Figure 5.
Species- specific ANOVA test for mean leaf spectral reflectance at three canopy positions (A) and pairwise t-test of mean leaf spectral reflectance at three canopy positions for F. lizei (B), F. benjamina (C), C. japonica (D) and C. elegans (E). Dark circles indicate spectral wavebands that were significantly different (P ≤ 0.05) for each pairwise comparison.

Figure 6.
Graphical matrix showing variation in leaf functional traits across the vertical canopy profile for the studied species as well as for the pooled dataset (fifth column). Error bars represent standard errors.
Figure 6.
Graphical matrix showing variation in leaf functional traits across the vertical canopy profile for the studied species as well as for the pooled dataset (fifth column). Error bars represent standard errors.

Figure 7.
Key wavelengths that enhance leaf sample discrimination. Canopy position was used as the discrimination group.
Figure 7.
Key wavelengths that enhance leaf sample discrimination. Canopy position was used as the discrimination group.


Table 1.
Summary statistics of leaf traits at the three canopy levels.
| Leaf Trait | Upper (n = 40) | Middle (n = 40) | Lower (n = 40) | |||||||||
|---|---|---|---|---|---|---|---|---|---|---|---|---|
| Min | Max | Mean | SD | Min | Max | Mean | SD | Min | Max | Mean | SD | |
| N (μg/cm2) | 7.31 × 10⁻⁵ | 2.94 × 10⁻⁴ | 1.68 × 10⁻⁴ | 6.29 × 10⁻⁵ | 3.15 × 10⁻⁵ | 4.04 × 10⁻⁴ | 1.46 × 10⁻⁴ | 6.7 × 10⁻⁵ | 5.24 × 10⁻⁵ | 2.36 × 10⁻⁴ | 1.31 × 10⁻⁴ | 5.07 × 10⁻⁵ |
| Cab (μg/cm2) | 30.96 | 72.85 | 52.82 | 14.44 | 27.03 | 69.54 | 49.19 | 13.77 | 24.86 | 68.41 | 46.6 | 15.7 |
| SLA (cm2/g) | 53.67 | 380.4 | 201.94 | 105.42 | 57.43 | 512.21 | 220.16 | 140.87 | 54.3 | 530.21 | 234.08 | 144.92 |
| C (%) | 37.96 | 47.55 | 45.01 | 1.63 | 41.33 | 46.69 | 44.58 | 1.14 | 38.94 | 46.4 | 43.79 | 1.61 |
| EWT (cm) | 6.28 × 10⁻³ | 2.56 × 10⁻² | 0.0172 | 6.77 × 10⁻³ | 5.98 × 10⁻³ | 2.53 × 10⁻² | 0.0162 | 6.28 × 10⁻³ | 5.46 × 10⁻³ | 2.76 × 10⁻² | 0.0163 | 6.57 × 10⁻³ |
N = nitrogen, Cab = chlorophyll, SLA = Specific leaf area, C = carbon, EWT = effective water thickness.
Table 2.
Summary of pairwise variation in leaf traits per species and within pooled data per each canopy position pair. Significant p-value at 0.1 *, 0.05 ** and 0.01 *** are indicated.
Table 2.
Summary of pairwise variation in leaf traits per species and within pooled data per each canopy position pair. Significant p-value at 0.1 *, 0.05 ** and 0.01 *** are indicated.
| Canopy Position Combination | ||||
|---|---|---|---|---|
| Species | Trait | Middle vs. Lower | Upper vs. Lower | Middle vs. Upper |
| F. benjamina | N | 0.219 | 0.000 *** | 0.04 ** |
| Cab | 0.68 | 0.025 ** | 0.14 | |
| SLA | 0.79 | 0.025 ** | 0.10 * | |
| C | 0.12 | 0.002 *** | 0.18 | |
| EWT | 0.11 | 0.623 | 0.49 | |
| C. japonica | N | 0.92 | 0.002 *** | 0.000 *** |
| Cab | 0.81 | 0.12 | 0.029 ** | |
| SLA | 0.72 | 0.912 | 0.467 | |
| C | 0.96 | 0.933 | 0.99 | |
| EWT | 0.18 | 0.984 | 0.23 | |
| C. elegans | N | 0.89 | 0.000 *** | 0.000 *** |
| Cab | 0.28 | 0.002 *** | 0.06 * | |
| SLA | 0.66 | 0.000 *** | 0.000 *** | |
| C | 0.34 | 0.05 ** | 0.56 | |
| EWT | 0.06 * | 0.013 ** | 0.77 | |
| F. lizei | N | 0.11 | 0.6 | 0.51 |
| Cab | 0.000 *** | 0.000 *** | 0.94 | |
| SLA | 0.05 ** | 0.67 | 0.007 *** | |
| C | 0.08 * | 0.07 * | 0.99 | |
| EWT | 0.14 | 0.006 *** | 0.35 | |
| Pooled | N | 0.516 | 0.02 ** | 0.24 |
| Cab | 0.71 | 0.051 * | 0.51 | |
| SLA | 0.493 | 0.075 * | 0.63 | |
| C | 0.048 ** | 0.0009 *** | 0.39 | |
| EWT | 0.93 | 0.083 * | 0.035 ** | |
N = nitrogen, Cab = chlorophyll, SLA = Specific leaf area, C = carbon, EWT = equivalent water thickness.
Table 3.
PLS-DA model calibration and performance.
| Model | Internal Validation | External Validation | |||
|---|---|---|---|---|---|
| N | Ncal | Nval | nlv | Accuracy (%) (S.D) | Accuracy (%) |
| 120 | 84 | 36 | 9 | 72 (8.3) | 64 |
N is total number of samples, Ncal is number of samples used for calibration, Nval is the number of samples used for validation and nlv is the number of latent variables, accuracy is the overall accuracy (%) while SD is the standard deviation.
© 2018 by the authors. Licensee MDPI, Basel, Switzerland. This article is an open access article distributed under the terms and conditions of the Creative Commons Attribution (CC BY) license (http://creativecommons.org/licenses/by/4.0/).
Share and Cite
MDPI and ACS Style
Gara, T.W.; Darvishzadeh, R.; Skidmore, A.K.; Wang, T. Impact of Vertical Canopy Position on Leaf Spectral Properties and Traits across Multiple Species. Remote Sens. 2018, 10, 346. https://doi.org/10.3390/rs10020346
AMA Style
Gara TW, Darvishzadeh R, Skidmore AK, Wang T. Impact of Vertical Canopy Position on Leaf Spectral Properties and Traits across Multiple Species. Remote Sensing. 2018; 10(2):346. https://doi.org/10.3390/rs10020346
Chicago/Turabian StyleGara, Tawanda W., Roshanak Darvishzadeh, Andrew K. Skidmore, and Tiejun Wang. 2018. "Impact of Vertical Canopy Position on Leaf Spectral Properties and Traits across Multiple Species" Remote Sensing 10, no. 2: 346. https://doi.org/10.3390/rs10020346
Note that from the first issue of 2016, this journal uses article numbers instead of page numbers. See further details here.