Article

Three-Dimensional Physical and Optical Characteristics of Aerosols over Central China from Long-Term CALIPSO and HYSPLIT Data

1
State Key Laboratory of Information Engineering in Surveying, Mapping, and Remote Sensing, Wuhan University, Wuhan 430079, China
2
School of Remote Sensing and Information Engineering, Wuhan University, Wuhan 430079, China
3
Collaborative Innovation Center for Geospatial Technology, Wuhan 430079, China
*
Authors to whom correspondence should be addressed.
Remote Sens. 2018, 10(2), 314; https://doi.org/10.3390/rs10020314
Submission received: 15 December 2017 / Revised: 9 February 2018 / Accepted: 9 February 2018 / Published: 18 February 2018
(This article belongs to the Special Issue Aerosol Remote Sensing)

Abstract

:
Aerosols greatly influence global and regional atmospheric systems, and human life. However, a comprehensive understanding of the source regions and three-dimensional (3D) characteristics of aerosol transport over central China is yet to be achieved. Thus, we investigate the 3D macroscopic, optical, physical, and transport properties of the aerosols over central China based on the March 2007 to February 2016 data obtained from the Cloud–Aerosol Lidar and Infrared Pathfinder Satellite Observations (CALIPSO) mission and the hybrid single-particle Lagrangian integrated trajectory (HYSPLIT) model. Our results showed that approximately 60% of the aerosols distributed over central China originated from local areas, whereas non-locally produced aerosols constituted approximately 40%. Anthropogenic aerosols constituted the majority of the aerosol pollutants (69%) that mainly distributed less than 2.0 km above mean sea level. Natural aerosols, which are mainly composed of dust, accounted for 31% of the total aerosols, and usually existed at an altitude higher than that of anthropogenic aerosols. Aerosol particles distributed in the near surface were smaller and more spherical than those distributed above 2.0 km. Aerosol optical depth (AOD) and the particulate depolarization ratio displayed decreasing trends, with a total decrease of 0.11 and 0.016 from March 2007 to February 2016, respectively. These phenomena indicate that during the study period, the extinction properties of aerosols decreased, and the degree of sphericity in aerosol particles increased. Moreover, the annual anthropogenic and natural AOD demonstrated decreasing trends, with a total decrease of 0.07 and 0.04, respectively. This study may benefit the evaluation of the effects of the 3D properties of aerosols on regional climates.

1. Introduction

Aerosols are an important atmospheric component that can greatly influence the radiation and energy budget of the atmosphere and human health [1,2,3]. Aerosols can perturb the atmospheric radiation budget by interacting with solar radiation and clouds (the direct and indirect effects of aerosol) [4,5]. Moreover, aerosol particles suspended in the atmosphere can be inhaled and affect human health [6]. Therefore, studies on the properties of aerosols should be conducted to understand their effects on climate and human life. Central China is an important material distribution center and transportation hub, and one of the most industrially developed areas in mChina [7]. Current studies on regional aerosols mainly focus on the Beijing–Tianjin–Hebei region, but there are relatively few studies on aerosols in central China [8]. Therefore, the present investigation on the three-dimensional (3D) characteristics of aerosols distributed over central China is relevant and important.
Studies on the characteristics of aerosols are mainly based on passive satellite and in situ observations [9,10,11,12]. Wang et al. investigated aerosol properties in urban Wuhan in central China based on data obtained using a sun photometer; these properties include Aerosol optical depth (AOD), single scattering albedo, aerosol size distribution, and the refractive index [9]. Wang et al. estimated hourly aerosol concentrations based on Himawari-8 over the Beijing–Tianjin–Hebei region [8]. Huang et al. estimated the relative contribution of anthropogenic and natural dust sources to regional and global emissions by using the data of the Cloud–Aerosol Lidar and Infrared Pathfinder Satellite Observations (CALIPSO) mission, and Moderate Resolution Imaging Spectroradiometer (MODIS) data [13]. Zhao et al. investigated the size distribution of dust particles during two contrasting dust events that originated from northwestern China based on CALIPSO data and the hybrid single-particle Lagrangian integrated trajectory (HYSPLIT) model [14]. Li et al. explored the characteristics and potential sources of dust aerosols in southwestern China using multiple satellite observation data and the HYSPLIT model [15]. Only a few quantitative studies were conducted on the 3D characteristics of aerosols over central China, because of the difficulty of quantifying the 3D characteristics of aerosols and their effects on regional climate using data from meteorological stations, reanalysis data, and passive remote sensing.
The present study primarily aims to quantify the transport and 3D characteristics of the aerosols over central China. Thus, we analyze the 3D macroscopic, optical, and physical characteristics of the aerosols using CALIPSO satellite data. We also combine CALIPSO data with the HYSPLIT model to quantitatively determine the distribution and transport characteristics of aerosols. Our study provides a scientific basis for the understanding and modeling of the atmospheric and ecological environments of central China and its surrounding areas.

2. Materials and Methods

This study analyzes the 3D macroscopic, optical, and physical characteristics of aerosols and their transport over central China by combining the long-term CALIPSO satellite data and HYSPLIT-4 model data from March 2007 to February 2016. CALIPSO Level 2 aerosol layer products with a 5-km resolution are used to analyze the 3D macroscopic, optical, and physical characteristics of the aerosols. The HYSPLIT-4 trajectory tracking model is used to quantitatively determine the distribution and transport characteristics of aerosols based on 1° × 1° meteorological data from the National Center for Environmental Prediction (NCEP) Global Data Assimilation System. AOD data from MODIS Aqua MYD08_M3 (MODIS Level 3 monthly averaged product) are also used to supplement the conclusions of this study. The study area was located at 109°–116°E and 26°–33°N in the East Asian region (Figure 1). This region is characterized by a monsoon climate, and is densely populated with complex and varied climate, topographical features, and precipitation patterns [16].

2.1. Satellite Data

National Aeronautics and Space Administration (NASA) launched CALIPSO in 2006 to assess the effects of aerosols on the global climate [17]. CALIPSO can detect the macro, micro, and optical properties of clouds and aerosols, and provides information on their vertical distribution on a global scale [18]. Thus, CALIPSO offers a new research perspective by providing information on the 3D distribution and properties of aerosols and on the role of clouds and aerosols in weather models [19].
CALIPSO provides the detailed vertical distributing information, which includes the attenuated backscatter, depolarization ratio, color ratio, and vertical feature mask of cloud and aerosol layers. Figure 2 shows a case under heavy aerosol loading conditions, wherein CALIPSO crossed Wuhan at 18:25 UTC 18 September 2007. During this satellite cross period, Wuhan and the surrounding areas suffered from a severe haze that consisted of polluted dust and polluted continental aerosols (in the green square frame in Figure 2d) [2]. CALIPSO can distinguish clouds and aerosols with a high degree of confidence (>90%) [20]. The detected aerosols are classified into six types based on the integrated attenuated backscatter (IAB) at 532 nm, color ratio, depolarization ratio, altitude, and latitude of the aerosol layer. IAB represents the ability of the aerosol layers detected by CALIPSO to attenuate solar radiation. The particulate color ratio is the ratio of the 1064-nm and 532-nm total backscatter signals, and the particulate depolarization ratio is the ratio of the perpendicular and parallel backscatter signals at 532 nm. The six types of aerosols are clean marine, dust, polluted continental, clean continental, polluted dust, and smoke (Figure 2d). Smoke and polluted continental aerosols are generally anthropogenic, dust is generated by nature, and polluted dust is a mixture of smoke and dust [21]. Given that anthropogenic pollution dominates central China, we define polluted dust, smoke, and polluted continental aerosols as anthropogenic aerosols, whereas clean marine, dust, and clean continental were described as natural aerosols [13].
Quality assurance procedures should be performed to reduce uncertainties when CALIPSO data are used to examine the properties of aerosols. The two parameters of “cloud-aerosol discrimination (CAD)” and “uncertainty of feature optical depth at 532 nm” are used to control the quality of the CALIPSO data, which is consistent with the previous study of Winker et al. [22]. CALIPSO can effectively eliminate the interference of clouds to distinguish aerosols with a high degree of confidence (>90%) by limiting CAD in the range of −100 to −20, and the uncertainty of feature optical depth at 532 nm less than 99.9 km−1 [20]. CALIPSO may miss or underestimate aerosol loading when the Lidar profile fails to penetrate the total atmosphere to the surface. Therefore, we only use profiles that penetrate the entire atmosphere, which can provide the whole information of aerosol in the atmosphere, to ensure the representativeness and accuracy of aerosol information. A previous study showed that 70% of CALIPSO aerosol types are consistent with Aerosol Robotic Network (AERONET) aerosol types, including those in China [23]. The highest agreement is achieved for dust (91%). Thus, these data products are appropriate and reliable for studies on 3D aerosol characteristics [24,25].

2.2. HYSPLIT Model

The HYSPLIT-4 trajectory-tracking model is an integrated model system for particle trajectory diffusion and settlement analysis. The HYSPLIT-4 model was developed by the National Oceanic and Atmospheric Administration [26]. This model simulation uses 1° × 1° global meteorological data from the NCEP Global Data Assimilation System as its initial background field. A previous study verified that the total accumulated trajectory error is approximately 20% of the traveled distance (total trajectory length) on average [27]. The present study calculates the seasonal statistics of the 48-h back trajectory in Wuhan (the biggest city in central China, 114.32°E, 30.52°N) based on the aforementioned data from March 2007 to February 2016. We first calculate two 48-h back trajectories of every day using the meteorological data. All of the back trajectories were at the same ending height of 1.5 km, which is the height of the annual vertical maximum occurrence frequency of the total aerosols in Wuhan. The numbers of back trajectories in each season are as follows: 1648 in spring, 1596 in summer, 1638 in autumn, and 1624 in winter. All of the back trajectories of each season were clustered according to their similarities in spatial distribution to obtain the final 48-h back trajectories of each season [26,28].

2.3. Principle and Methods

The dominant aerosol reflects the regularity of the seasonal occurrence of aerosol in a region [29]. Aerosol that dominates each season is defined as the type of aerosol with the highest frequency of occurrence in each grid during the observation period. For a given 1° × 1° grid, the occurrence frequency of each different aerosol subtype is calculated using Equation (1):
P = Naerosol(i)/Ntotal,
Naerosol(i) is the number of the Lidar profiles for each aerosol subtype, and Ntotal is the total number of the Lidar profiles for all of the aerosol subtypes collected in a given 1° × 1° grid [30]. The aerosol type that corresponds to the max P is the dominant aerosol type.
We validate CALIPSO, and confirm the reliability of the results with MODIS AOD from Aqua MYD08_M3. The detection efficiency of CALIPSO in the daytime is different from that at night because of the influence of solar background noise [17]. We define the day–night differences of CALIPSO data in Section 3.2 (aerosol optical properties), given that these differences are beyond the focus of our study. Other sections consider combined daytime and nighttime data. This investigation, which is based on CALIPSO data, can accurately describe the 3D macroscopic, optical, and physical properties of the aerosols distributed over central China.

3. Results

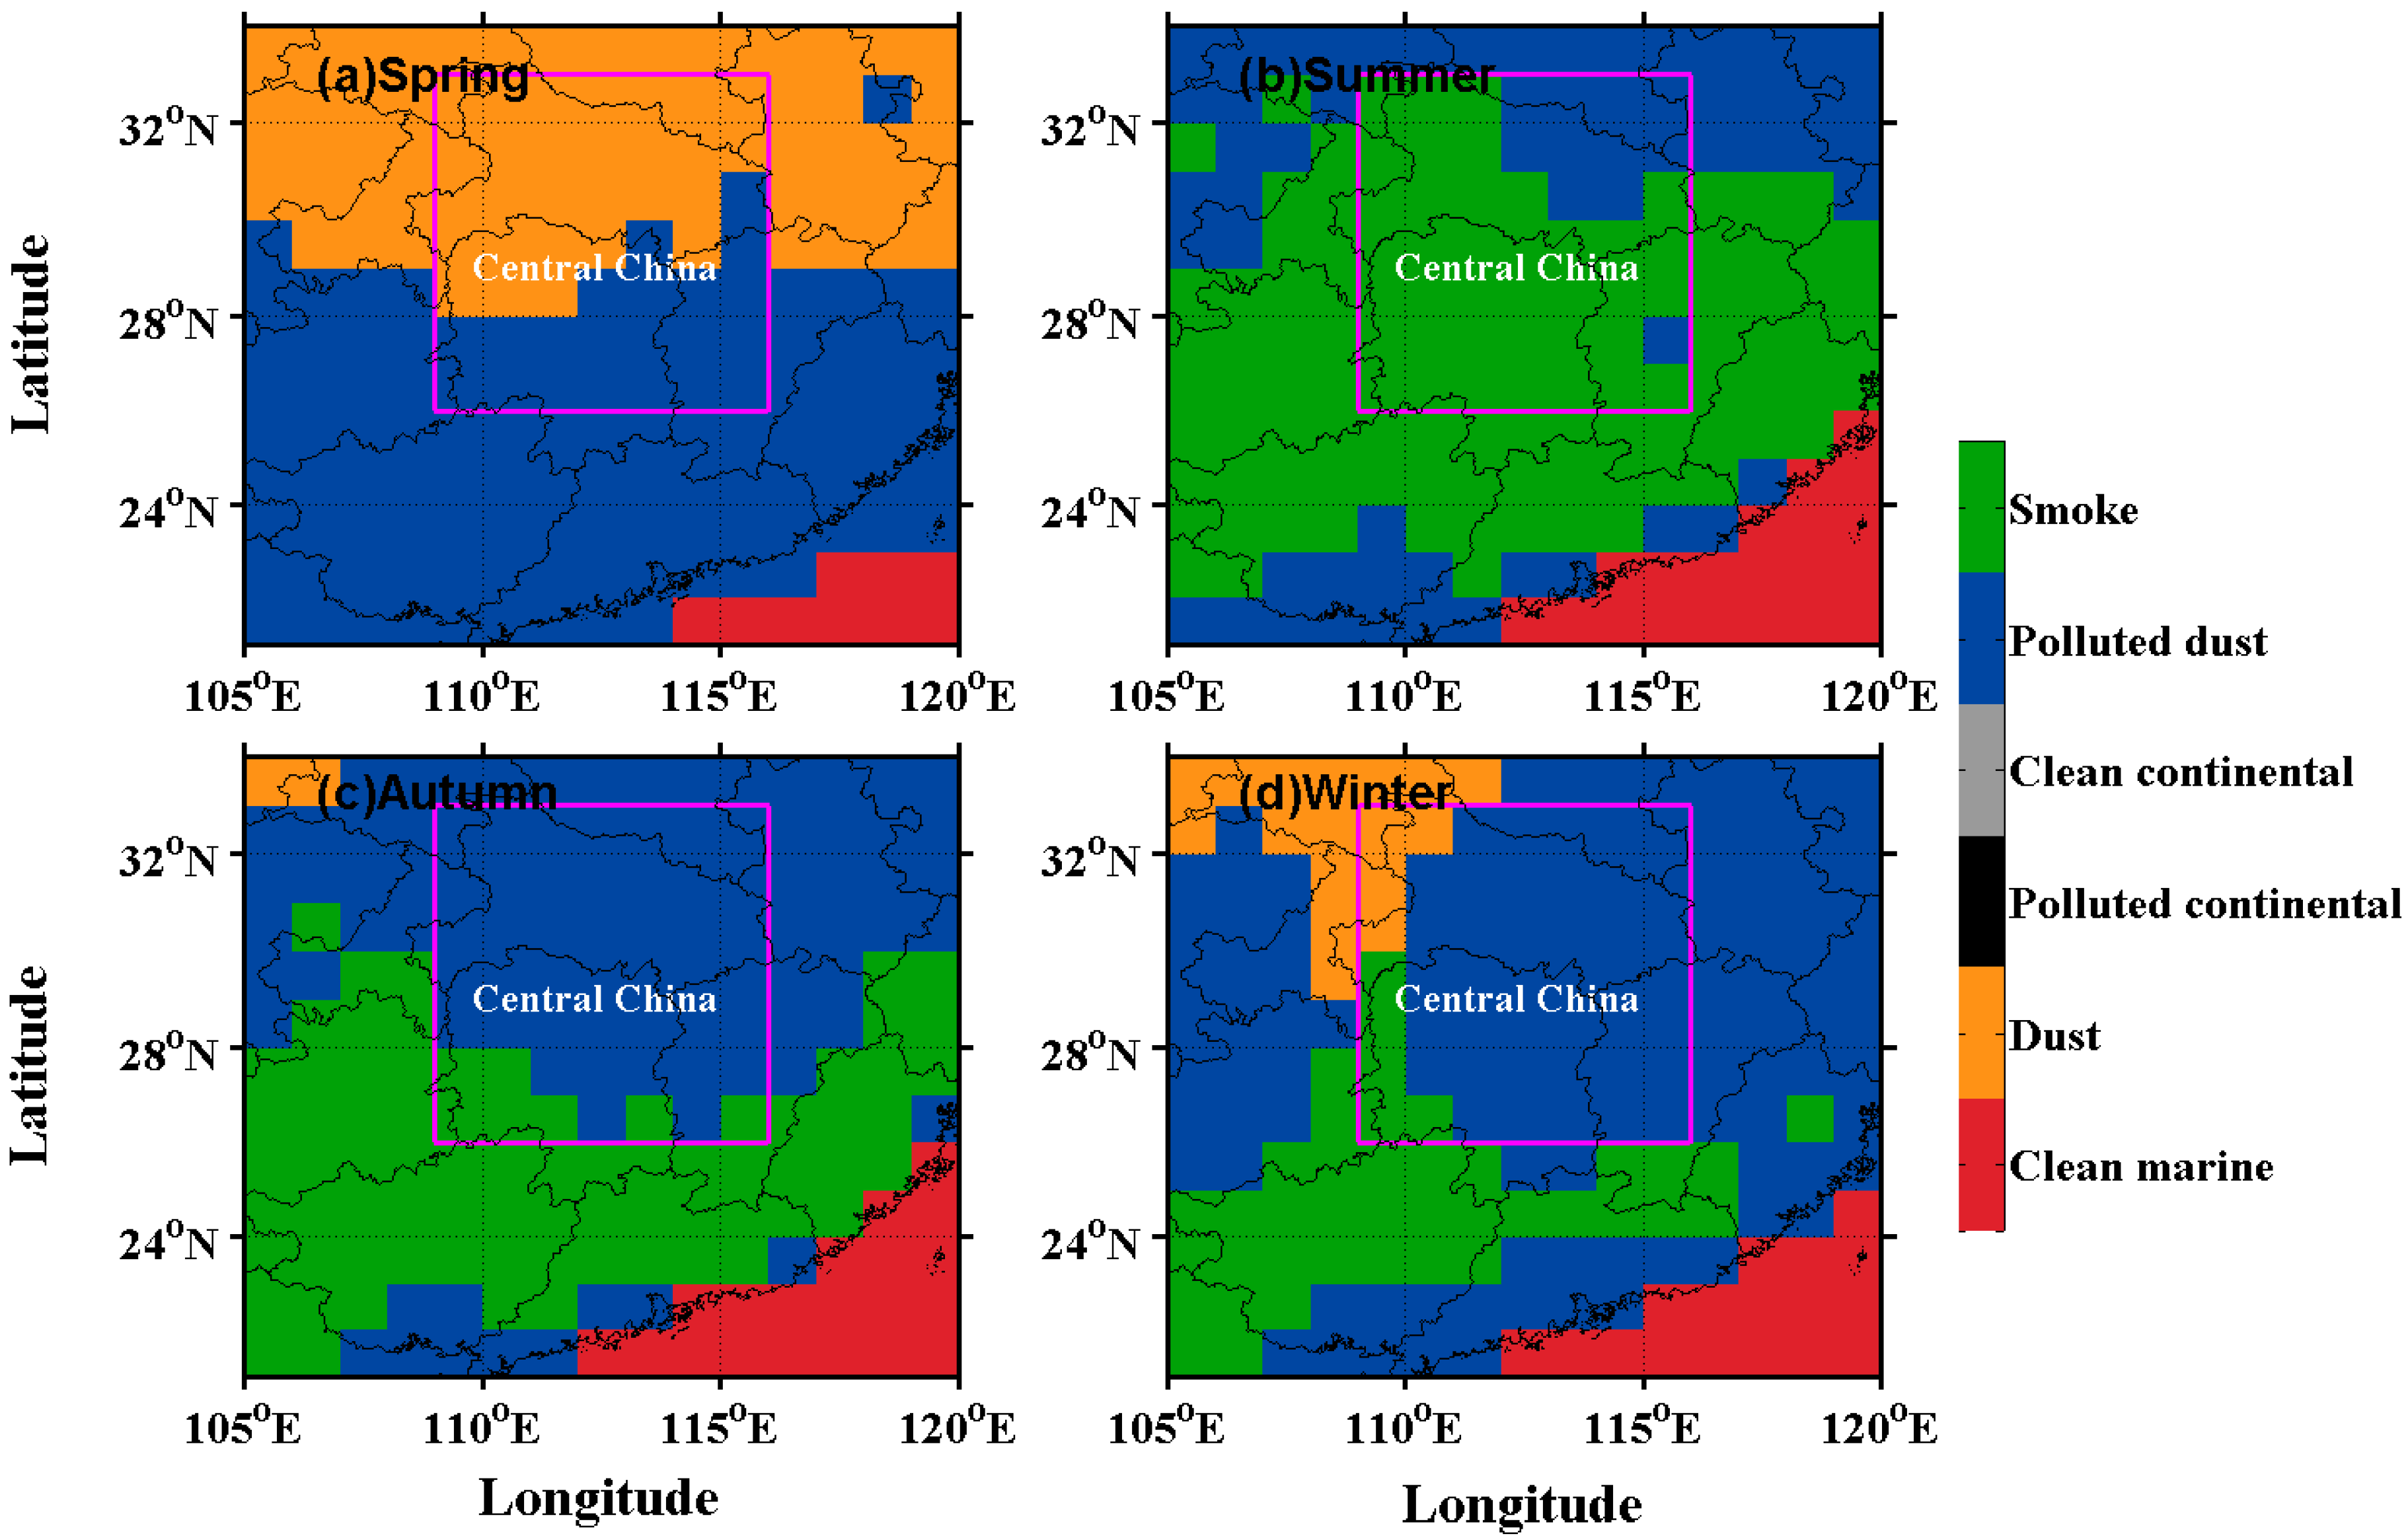
3.1. Macroscopic Properties of Aerosols

Figure 3 shows the distribution of dominant aerosols with a spatial resolution of 1 degree over central China in each season from March 2007 to February 2016. We investigate the first two aerosol subtypes with the highest occurrence frequency in the study. The sum of the occurrence frequencies of all of the aerosol subtypes in one season is probably more than 1, given that a particular profile may contain more than one aerosol type. Figure 3b shows that the dominant aerosols in summer are smoke (50.9%) and polluted dust (45.3%), whereas polluted dust (61.6%) and dust (43.3%) dominate in winter (Figure 3d). These statistics are obtained from the regional average occurrence frequencies of aerosol subtypes for each season, which are calculated using Equation (1). These findings indicate that the aerosols distributed over central China mostly consisted of polluted dust, smoke, and dust. Table 1 lists the detailed regional average occurrence frequencies of each aerosol subtype for each season. Therefore, anthropogenic aerosols (polluted dust and smoke) constitute the majority of the aerosol pollutants in this region.
In Figure 4, the aerosol geometrical depth (AGD) indicates the thickness of each aerosol layer, which is the difference between the top and base heights detected by CALIPSO. Mid-aerosol height is one-half of the top height and base height of each aerosol layer. Figure 4a shows that the joint probability initially increases, and then decreases as AGD increases. AGD peaks at an altitude of approximately 1.2 km above mean sea level, which indicates that the aerosols detected by CALIPSO are concentrated at low atmospheric altitudes over central China. As AGD increases, the corresponding AGD probability distribution of each aerosol type initially increases, and then decreases (Figure 4b). The AGD of each aerosol layer is nearly below 2.4 km. The largest probability areas are found between 0.2–1.2 km. The aerosol layers over central China mainly consist of 37.7% polluted dust, 23.5% smoke, and 25.8% dust. These major aerosols show a significant distribution ratio in each AGD interval. The amounts of polluted and clean continental aerosols are relatively low, and other types of aerosols can be disregarded. Anthropogenic aerosols constitute the majority of the aerosol pollutants (69.0%), whereas natural aerosols (mainly dust) constitute lesser amounts (31.0%).

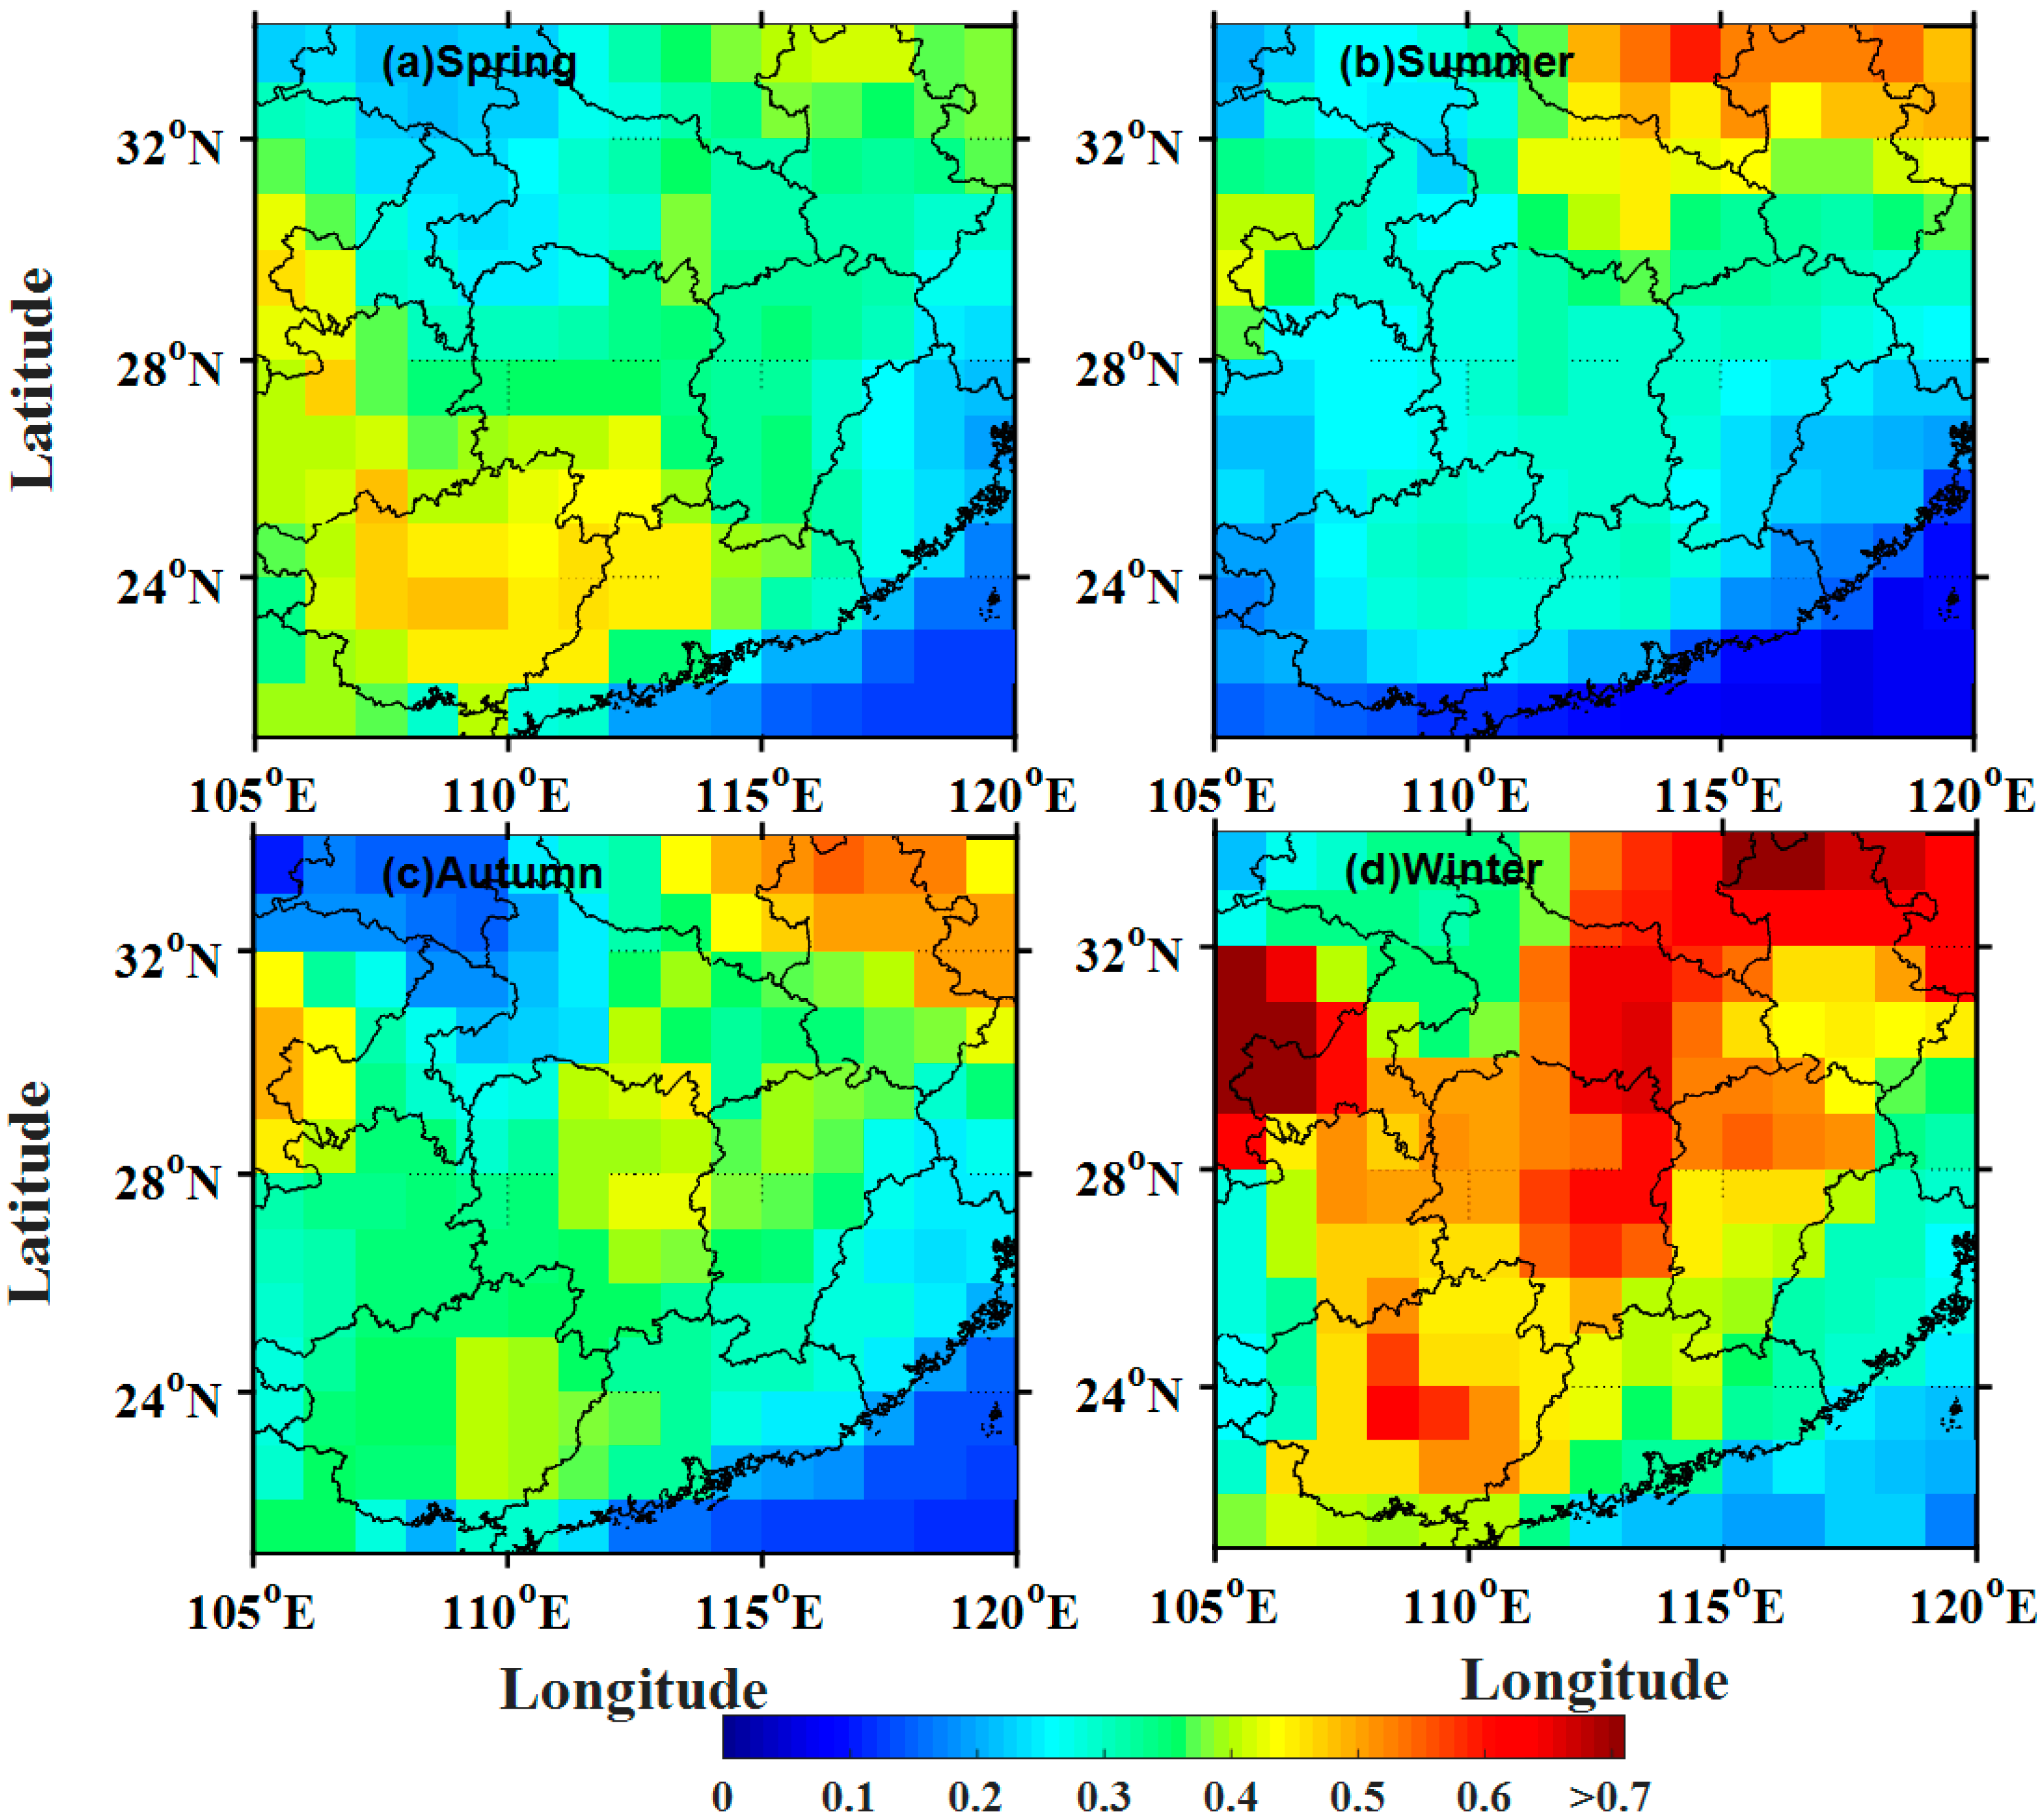
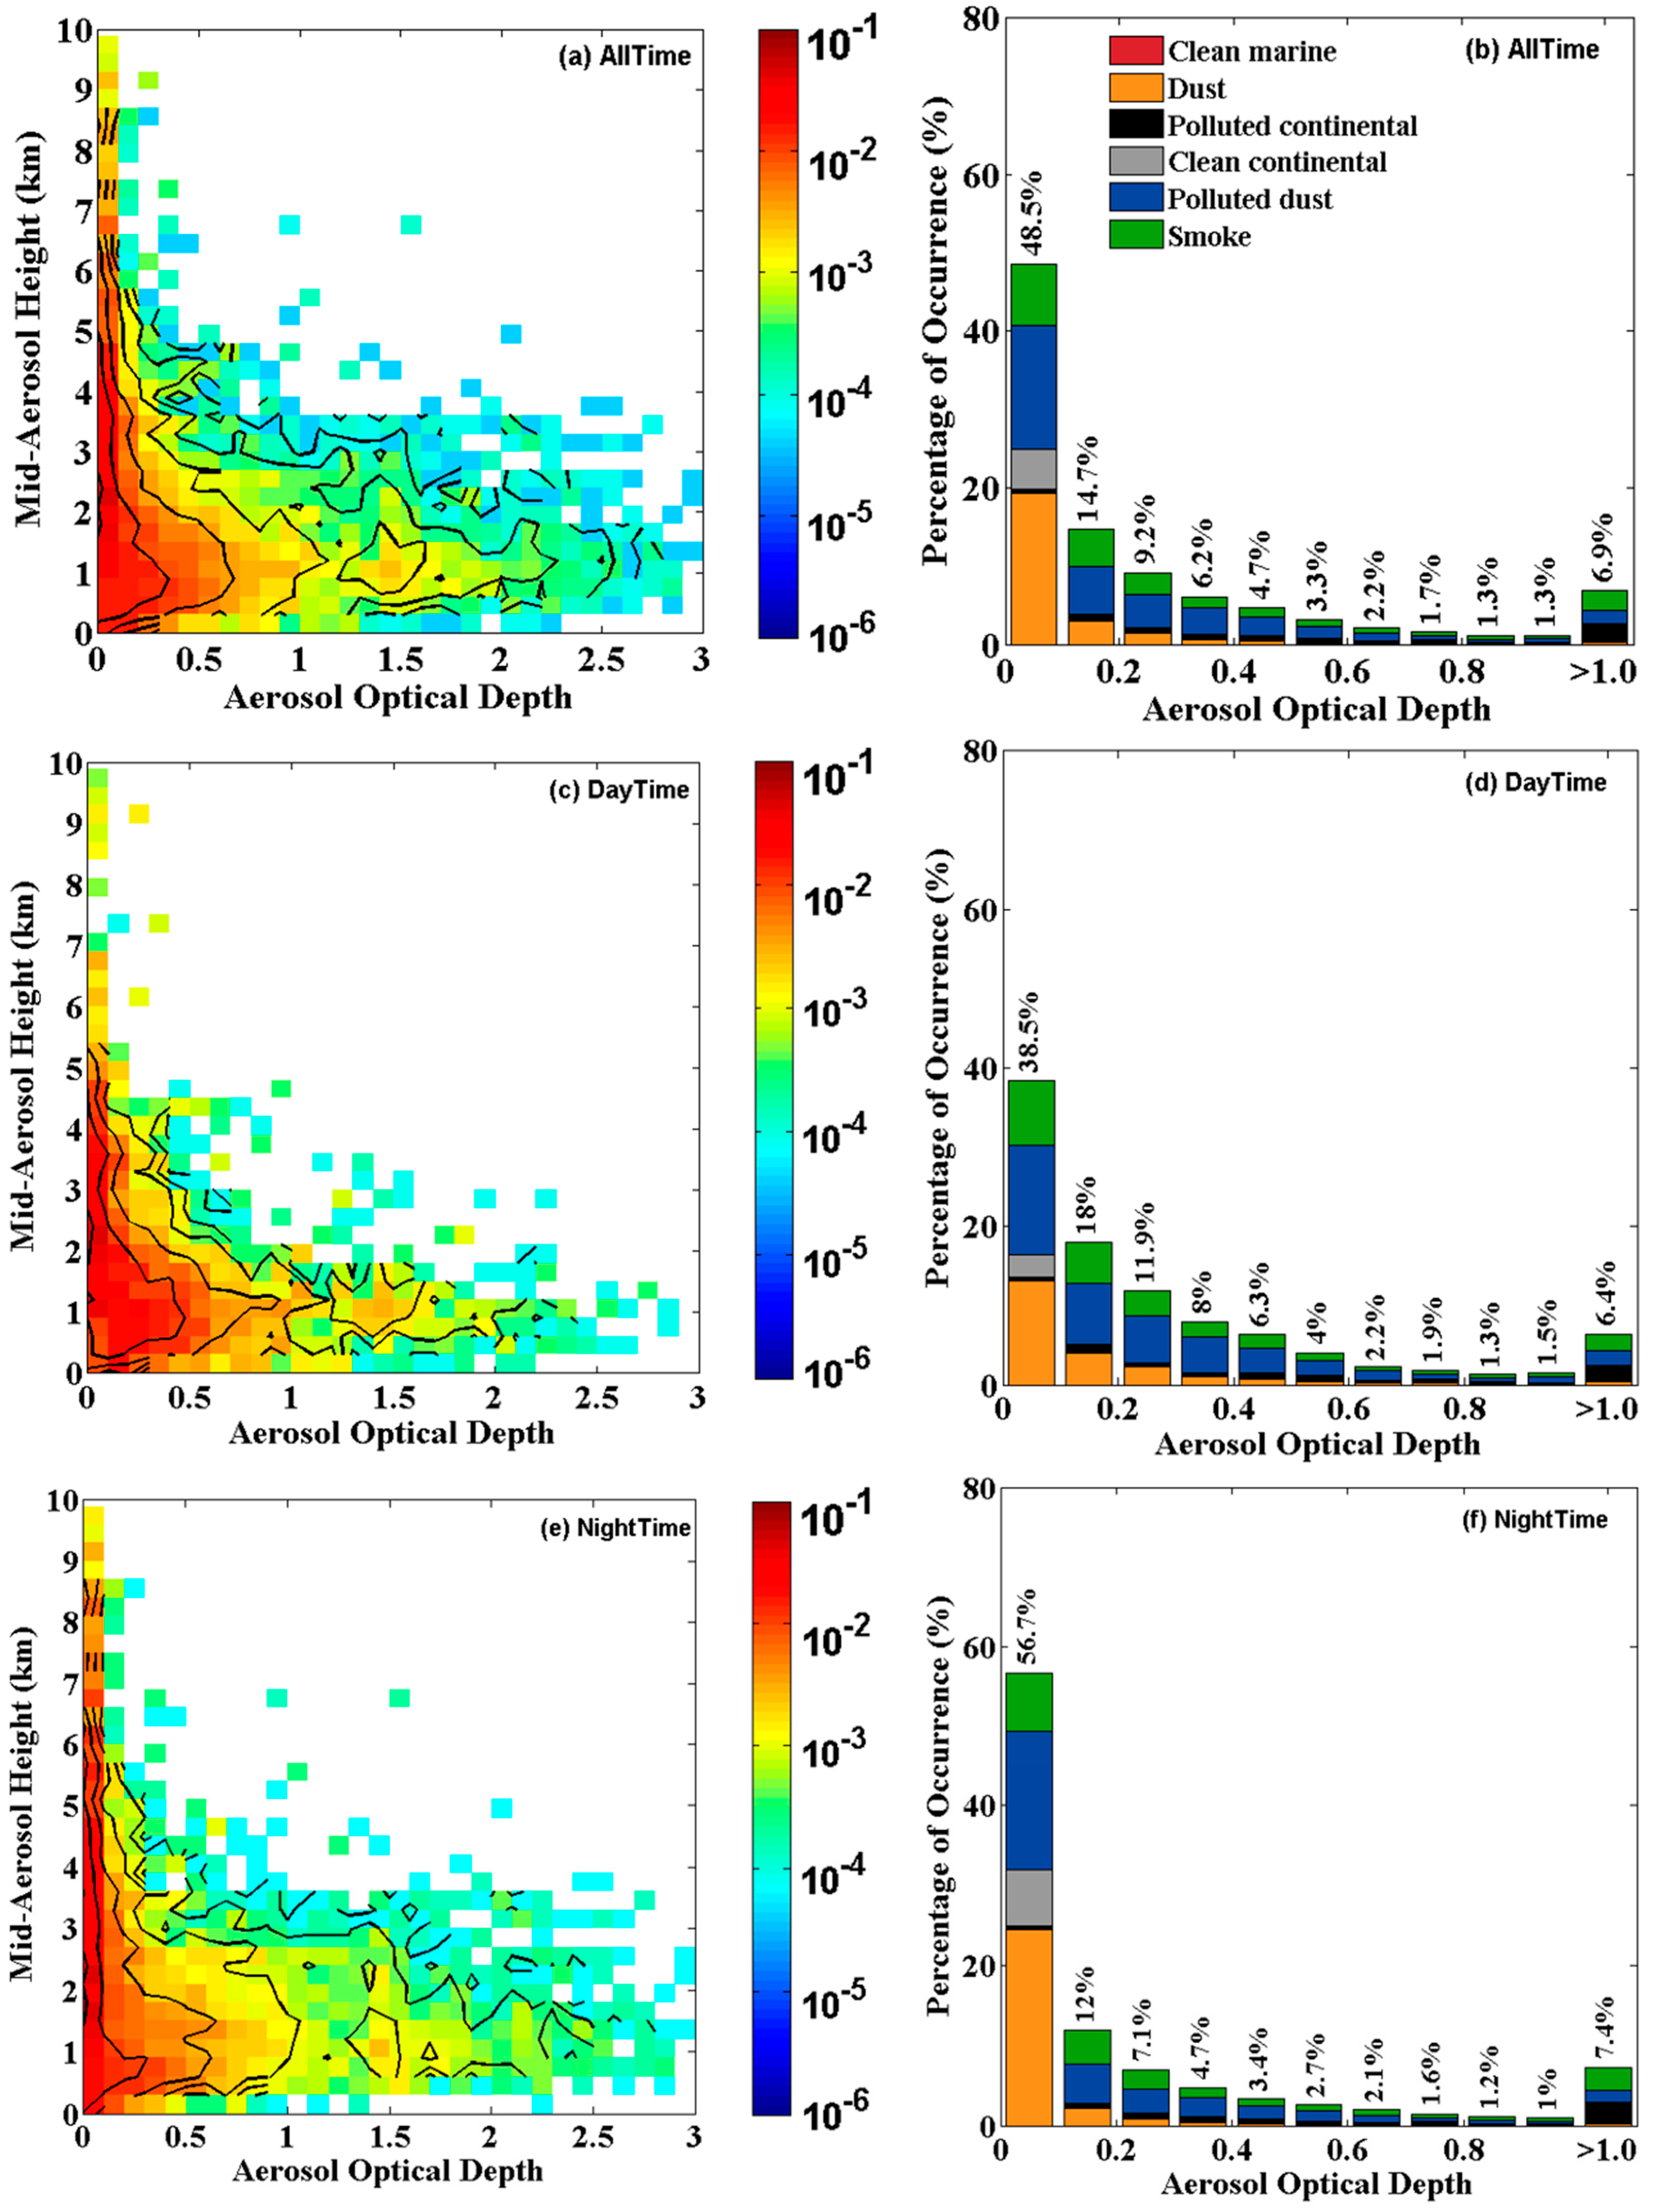
3.2. Optical Properties of Aerosols

Figure 5 shows that the column AOD values of the entire area are the lowest in spring within 0.3–0.5 (mostly close to 0.4). Aerosols over central China in spring mainly consist of dust (Figure 3a). The column AOD in the middle part of central China increases to approximately 0.50 in the summer (Figure 5b). The column AOD in the other parts of central China ranges from 0.3 to 0.55. The high-column AOD in summer is related to high temperature and humidity [31]. The most severe pollution occurs in winter, with an average AOD of approximately 0.55 in central China. This phenomenon is mainly caused by the burning of coal and biomass, and the weak atmospheric dynamics in winter [9]. However, column AODs may be underestimated because of the weak signal-to-noise ratio in the daytime, high or low clouds, and the Lidar-ratio accuracy of CALIPSO detection [32]. Nevertheless, CALIPSO AOD values indicate good correlation with MODIS AOD in all of the time scales, particularly yearly AOD [20]. This AOD spatial distribution over central China is consistent with the study of Tian et al. [21].
Figure 6 illustrates the occurrence frequency of the AOD of an aerosol layer combined with mid-aerosol height, and the relative probability distribution of AOD at 0.1 intervals over central China from March 2007 to February 2016. Overall, the joint probability gradually decreased as AOD increased (Figure 6a). A high-value center could be found in areas where the mid-aerosol height was 0.2–2 km, and AOD was 0–0.2. Moreover, 55.0% of the optically thick aerosol (AOD > 0.4) and 26.1% of the optically thin aerosol (AOD < 0.2) were below 2 km. The AOD of an aerosol layer presented the unimodal distribution in altitude, with the peak at approximately 1 km; this decreased as aerosol height increased at altitudes above approximately 1 km.
The AOD of an aerosol layer during the whole study period (day and night time) was nearly below 1, and was mostly distributed between 0 and 0.2 (63.2%) (Figure 6b). During the whole study period, the contribution rate of polluted dust to total aerosols increased from 32.4% to 53.2% as AOD increased between 0 and 0.4. Contribution rate fluctuated but became restricted to 39% in a sequential broad range of optical depth (0.4–1.0). However, CALIPSO possibly overestimated the occurrence frequency of polluted dust [33]. Moreover, the contribution rate of dust decreased from 39.8% to 4% as AOD increased. The contribution rate of smoke remained mainly at 16–40%. The statistics of the AOD probability distributions of different aerosol subtypes presented in Figure 6b are provided in detail in Table 2. Figure 6c–f present the AOD distributions of the daytime and nighttime data, respectively. Their distributions are similar to that during the whole study time (Figure 6a,b), but the mean AOD at daytime was higher than that during the whole study time, and the mean AOD at nighttime was lower than that during the whole study time. This difference is caused by many factors, such as changes in meteorological conditions, signal-to-noise ratios, and different aerosol emissions between the daytime and nighttime [34].

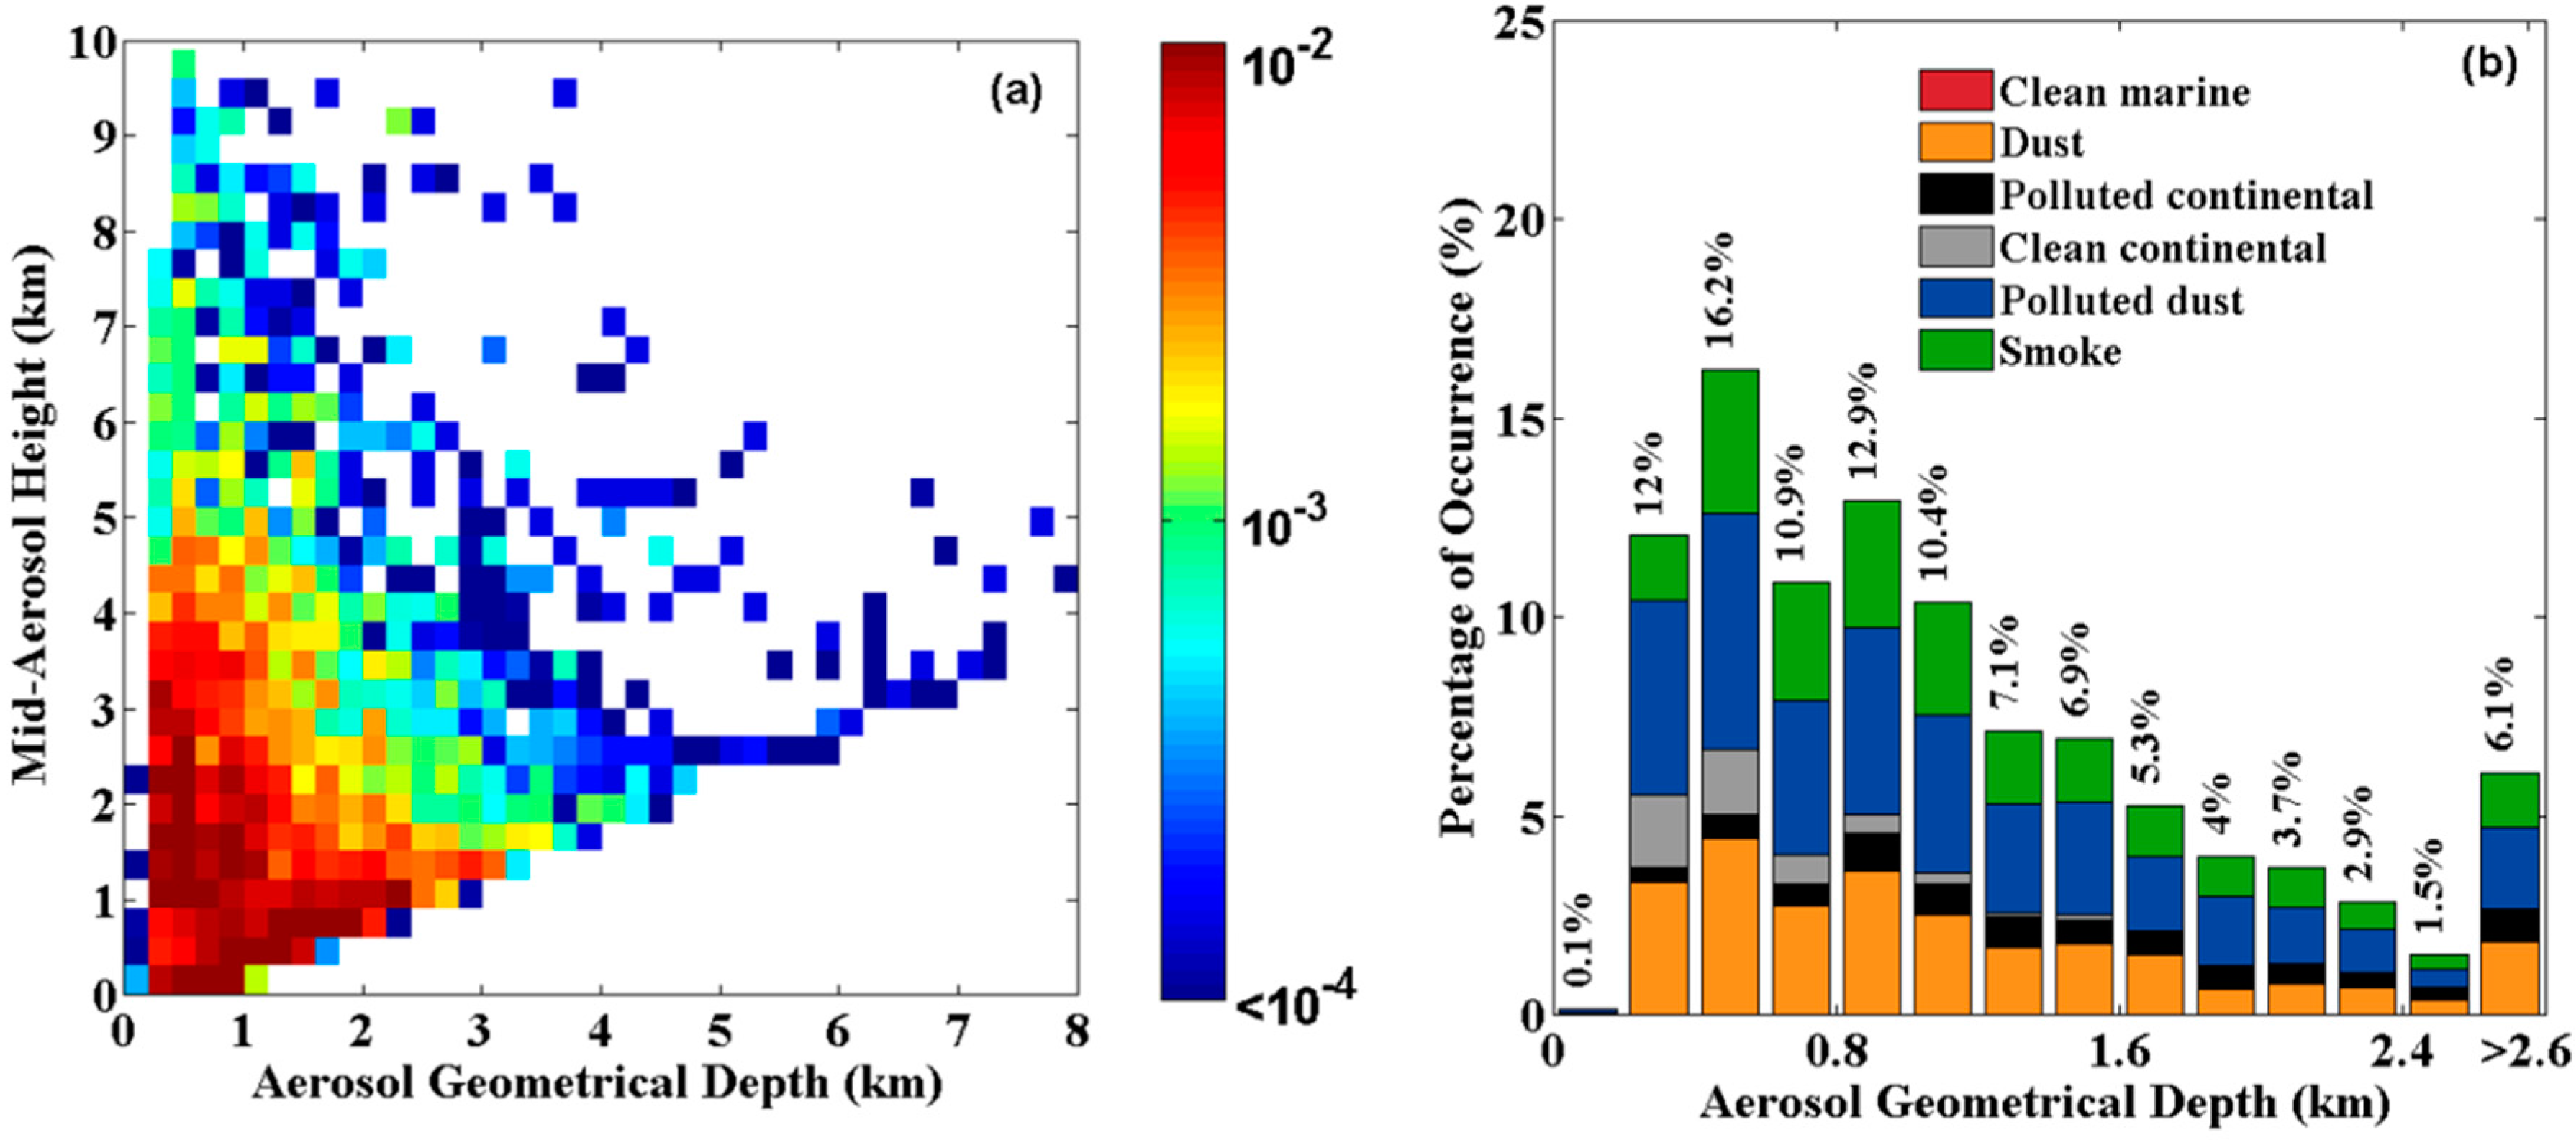
3.3. Physical Properties of Aerosols

We indicate the size and irregularity of aerosol particles based on the integrated particulate color ratio (CR) and integrated 532-nm particulate depolarization ratio (DR), which are positively correlated with the size and irregularity of aerosol particles [21]. Figure 7a shows that the joint probability distribution of IAB and mid-aerosol height is roughly triangular. IAB nearly peaked at vertical heights of 1–2 km. Aerosol IAB decreased gradually at altitudes higher than 2 km [25]. The corresponding IAB probability distribution decreased gradually as IAB increased (Figure 7b). The IAB of each aerosol layer was almost always less than 0.01, and was mostly between 0 and 0.002. The distribution of all of the aerosol types in each interval are similar to that of AOD (Figure 6b). Figure 7c,d reveal that joint probability initially increases, and then decreases as CR increases. Maximum probability areas occur at 0.5–0.6 of CR for all of the aerosol subtypes, except for dust. This finding is consistent with the results of Omar et al. [20]. Moreover, a high-value center exists when mid-aerosol height is 0.3–3 km, and when the DR is 0–0.1 (Figure 7e). The DRs of smoke, polluted dust, and dust are mainly at 0–0.1, 0.05–0.2, and >0.1, respectively. This study states that aerosol particles have non-spherical shapes, as DR with more than 0.1 and the spherical shapes as DR with less than 0.1, which refer to the previous study of Yu et al. [25]. The distribution of CR in Figure 7f indicates that spherical aerosol particles (54.4%) are more than non-spherical aerosol particles (45.6%) over central China during the study period.
The annual average AOD detected by CALIPSO and MODIS show the same decreasing trend, with slight seasonal differences in AOD distribution (Figure 8). CALIPSO AOD is possibly underestimated against MODIS AOD, because of the weak signal-to-noise ratio in the daytime, and the Lidar-ratio accuracy of the CALIPSO detection. Moreover, the CALIPSO AOD is verified to be consistent with the MODIS AOD with regard to the geographical patterns and seasonal variations [21]. The AOD and DR detected by the CALIPSO displayed decreasing trends, with a total decrease of 0.11 and 0.016 over central China from March 2007 to February 2016, respectively. This finding indicates that the extinction properties of aerosols decreased, and the degree of sphericity in aerosol particles increased during this study period. The trend of CR is not distinct with the annual average of 0.82, which indicates that the size of the aerosol particles did not distinctly change. The annual fluctuation of CR (1.19) in 2008 was mainly due to the anomalously high CR (2.57) in the summer of that year (2008).
Moreover, the seasonal changes in all of the parameters are significant (Figure 8b). The CR showed the maximum value and the DR showed the minimum value in the summer. This result is consistent with our conclusions that smoke is the maximum aerosol in summer, and can display the smallest DR (average of 0.05 for smoke) (Figure 3b and Figure 7f). However, the mean CR in the summer (1.06) (Figure 8b) is larger than that of other seasons (0.74) mainly due to the anomalously high CR (2.57) in the summer of 2008 [35]. These significant seasonal changes indicate that the irregularity and size of the aerosol particles differed greatly in each season, which is possibly caused by the different dominant aerosol subtypes and meteorological conditions in different seasons [36].
We obtained the annual and seasonal distributions of the anthropogenic and natural AODs observed by CALIPSO in order to quantify the changes of anthropogenic and natural contribution to the total AOD (Figure 9). The annual anthropogenic AOD (annual mean of 0.34) demonstrated a significant (p = 0.08) decreasing trend, with a total decrease of 0.07, whereas the annual average AOD of natural aerosol decreased totally by 0.04, with low significance (p = 0.2) from March 2007 to February 2016. Although industrial productivity increased in recent years, China implemented a strict pollution control strategy [37], which possibly contributed to no obvious increase of anthropogenic AOD in central China. Moreover, the anthropogenic AOD in summer was larger than that in other seasons (Figure 9b), which is possibly caused by abundant anthropogenic activities, such as agricultural biomass burning in the summer [38].

3.4. Changes of Aerosol Vertical Distributions and Aerosol Sources

The profiles of the vertical distributions of aerosols exhibit the vertical characteristics of aerosols (Figure 10 and Figure 11). The profile is defined as the occurrence frequency of aerosols detected by CALIPSO in bins at different heights in a given region (central China). The vertical distributions of all kinds of aerosols are unimodal in each season, with three major types of aerosols, namely: dust, smoke, and polluted dust (Figure 10). The highest occurrence frequency (Figure 10b) is observed in smoke, followed by polluted dust, at altitudes of 2.0 km and 1.3 km, because of the effects of local emissions and long-distance transport pollutants in summer. The maximum vertical occurrence frequency of polluted dust in each season is almost distributed at approximately 1.3 km. Moreover, the annual occurrence frequency of dust is larger than that of other aerosol subtypes above 4 km (Figure 10e). The aerosol characteristics (DR and IAB) of smoke and polluted continental are similar (Figure 7b,f). In this situation, the aerosol layer is classified as polluted continental aerosol at low altitude, based on the classification criteria of CALIPSO described in Mielonen et al. [23]. Consequentially, almost no smoke is observed in the near surface (Figure 10). The altitude of the maximum occurrence frequency of smoke in each season is approximately 2.0 km.
Figure 11 shows the profiles of the vertical occurrence frequency of anthropogenic and natural aerosols to distinguish their vertical characteristics. Given the frequent occurrence of dust, the occurrence frequency of natural aerosols is larger than that of the anthropogenic aerosols at altitudes above 4 km in spring and winter (Figure 11a,d). However, the occurrence frequency of anthropogenic aerosols is larger than that of natural aerosols in autumn, and especially in summer (Figure 11b,c). This finding is consistent with the seasonal characteristics of anthropogenic and natural AOD (Figure 9b). Overall, the altitude of the largest occurrence frequency of anthropogenic aerosols (1.3 km) is lower than that of the natural aerosols (2.2 km) (Figure 11e). Moreover, the annual occurrence frequency of natural aerosols is larger than that of the anthropogenic aerosols at altitudes above 4 km (Figure 11e), which is attributed to the frequent occurrence of dust in the spring and winter. These phenomena indicate that the anthropogenic aerosols always occur below 2 km, whereas the natural aerosols generally occur at an altitude higher than that of the anthropogenic aerosols. Anthropogenic aerosols dominate the total aerosols condition with respect to the AOD and occurrence frequency, especially in the summer (Figure 9b and Figure 11b), which is possibly caused by the abundant anthropogenic activities in the summer, such as agricultural biomass burning [38].
Figure 12 illustrates the backward trajectory distribution from the HYSPLIT-4 model for the Wuhan region on annual and seasonal scales. The upper half of each subgraph in Figure 12 presents the planar map of the trajectory. The lower half is the variation map that presents the vertical height of the trajectory (above ground level). We determine the ending height of all of the back trajectories as 1.5 km, based on the annual vertical maximum occurrence frequency of total aerosols (Figure 10e) in Wuhan. The HYSPLIT-4 model uses the change in the total spatial variance (TSV) to choose the optimum number of clusters in each season in Figure 12 [28,39]. This model initially considers each trajectory as a cluster; consecutive passes group the two clusters with the absolute lowest spatial variance. This process is repeated until only one cluster is calculated, and a TSV is calculated at each step [40]. The optimal number of clusters is finally chosen when the increase of TSV is the lowest. In this study, the corresponding TSV to the optimum number of clusters in each season over central China is as follows: 20% in spring, 16% in summer, 10% in autumn, and 19% in winter. The optimum number of clusters in each season is as follows: three in spring, four in summer, four in autumn, and four in winter. Our research focuses on the 3D characteristics of aerosols over central China. Thus, we define central China as the domain of the local source of aerosols and other regions as the domain of the non-local source of aerosols. We use 48-h back trajectories to analyze the aerosol sources, because 48 h is sufficiently long to indicate air mass source. Table 3 lists the detailed cluster results of the trajectory distributions for each season in Figure 12.
The air masses that reach Wuhan in the summer often come from the non-local areas (approximately 72%), especially from heavily polluted northern China (Figure 12b). The air masses (39%) that originate from southern China (a major smoke source region, as shown in Figure 3b) can be uplifted above 1.5 km, and then enter Wuhan [41]. However, approximately 60% of air masses, which mainly originate from the local and nearby areas, reach Wuhan in other seasons, after a short distance transport. The result in the summer is different from that in other seasons due to the emission status and active atmospheric dynamics conditions from the summer monsoon [42,43]. Approximately 20% of air masses during spring and winter come from the northwestern dust source region, which generates the elevated dust aerosol above 3 km in central China (Figure 10a,d).
Figure 12e shows that the annual average air masses distributed over central China mainly come from the local regions (approximately 60%), whereas the percentage of the non-local air masses is approximately 40%. Local air masses, which originate from the local and nearby areas, are mainly distributed at approximately 2.0 km over central China (Figure 12e). The non-local air masses are transported from the northwestern dust (22%) and southern smoke (15%) source regions in China, which mainly contribute to the dust and smoke in central China [44]. Dust is always transported from the higher altitudes to Wuhan (green line in Figure 12e), which is consistent with the vertical distributions of dust (above 3 km) detected by CALIPSO (Figure 10e). The vertical distributions of aerosols (Figure 10 and Figure 11) are caused by the trajectory distributions of local and non-local air masses in Figure 12, which are also affected by topography and regional emissions [45].

4. Discussion

Our analysis of the aerosol properties detected by CALIPSO and the HYSPLIT-4 model shows that the annual mean column AOD detected by CALIPSO over central China is 0.49. The annual mean anthropogenic AOD and natural AOD are 0.34 and 0.15, respectively. Moreover, the CR in the summer (Figure 8b) is larger than that of other seasons (Figure 7d). This result is mainly due to the anomaly high CR (2.57) in the summer of 2008, which is mainly contributed by anomalous dust, with an anomalous CR of 3.10. Anomalous dust may be attributed to dust from northwestern China (the largest dust source region in China), which is consistent with Gao et al. [35]. This anomaly also elevated the standard deviation of the CR in the summer (±0.55) to a level higher than that in the other seasons (±0.05). Moreover, the annual average result indicates that 60% of the aerosols distributed over central China mainly originated from the local areas, which is one of China’s most polluted regions. Non-local aerosols (approximately 40%) were transported from the northwestern dust and southern smoke source regions in China. However, the result in the summer (72% non-local air masses) is different from that in the other seasons due to its emission status and active atmospheric dynamics conditions from the summer monsoon [42,43]. The anthropogenic pollutants in summer are mostly heavy (Figure 9b and Figure 11b), which are possibly caused by the abundant anthropogenic activities, such as agricultural biomass burning in the summer [44].
This study also provides the detailed 3D characteristics of aerosols distributed over central China, which is the basis for the analysis of regional aerosol effects. The emphases in recent studies mainly focus on the influence of aerosols on the atmospheric radiation budget and clouds [7,46]. However, these studies often lack the 3D characteristics of aerosols and their transportation. The vertical distributions of aerosols play an important role in aerosol–cloud–radiation interactions. When the column AOD is constrained, uncertainties in aerosol vertical distributions can still contribute to important uncertainties in the analysis of the atmospheric radiation budget [47]. Our next work focuses on the influence of the 3D characteristics of aerosols on the atmospheric radiation budget based on CALIPSO data and the radiation transfer model.

5. Conclusions

Comprehensive studies are yet to be conducted on the 3D characteristics of aerosols distributed over central China. Therefore, the present study utilizes the March 2007 to February 2016 data from the CALIPSO mission and the HYSPLIT-4 model to investigate the 3D macroscopic, optical, physical, and transport properties of the aerosols over central China. The following conclusions are drawn based on the results of our data analysis:
(1)
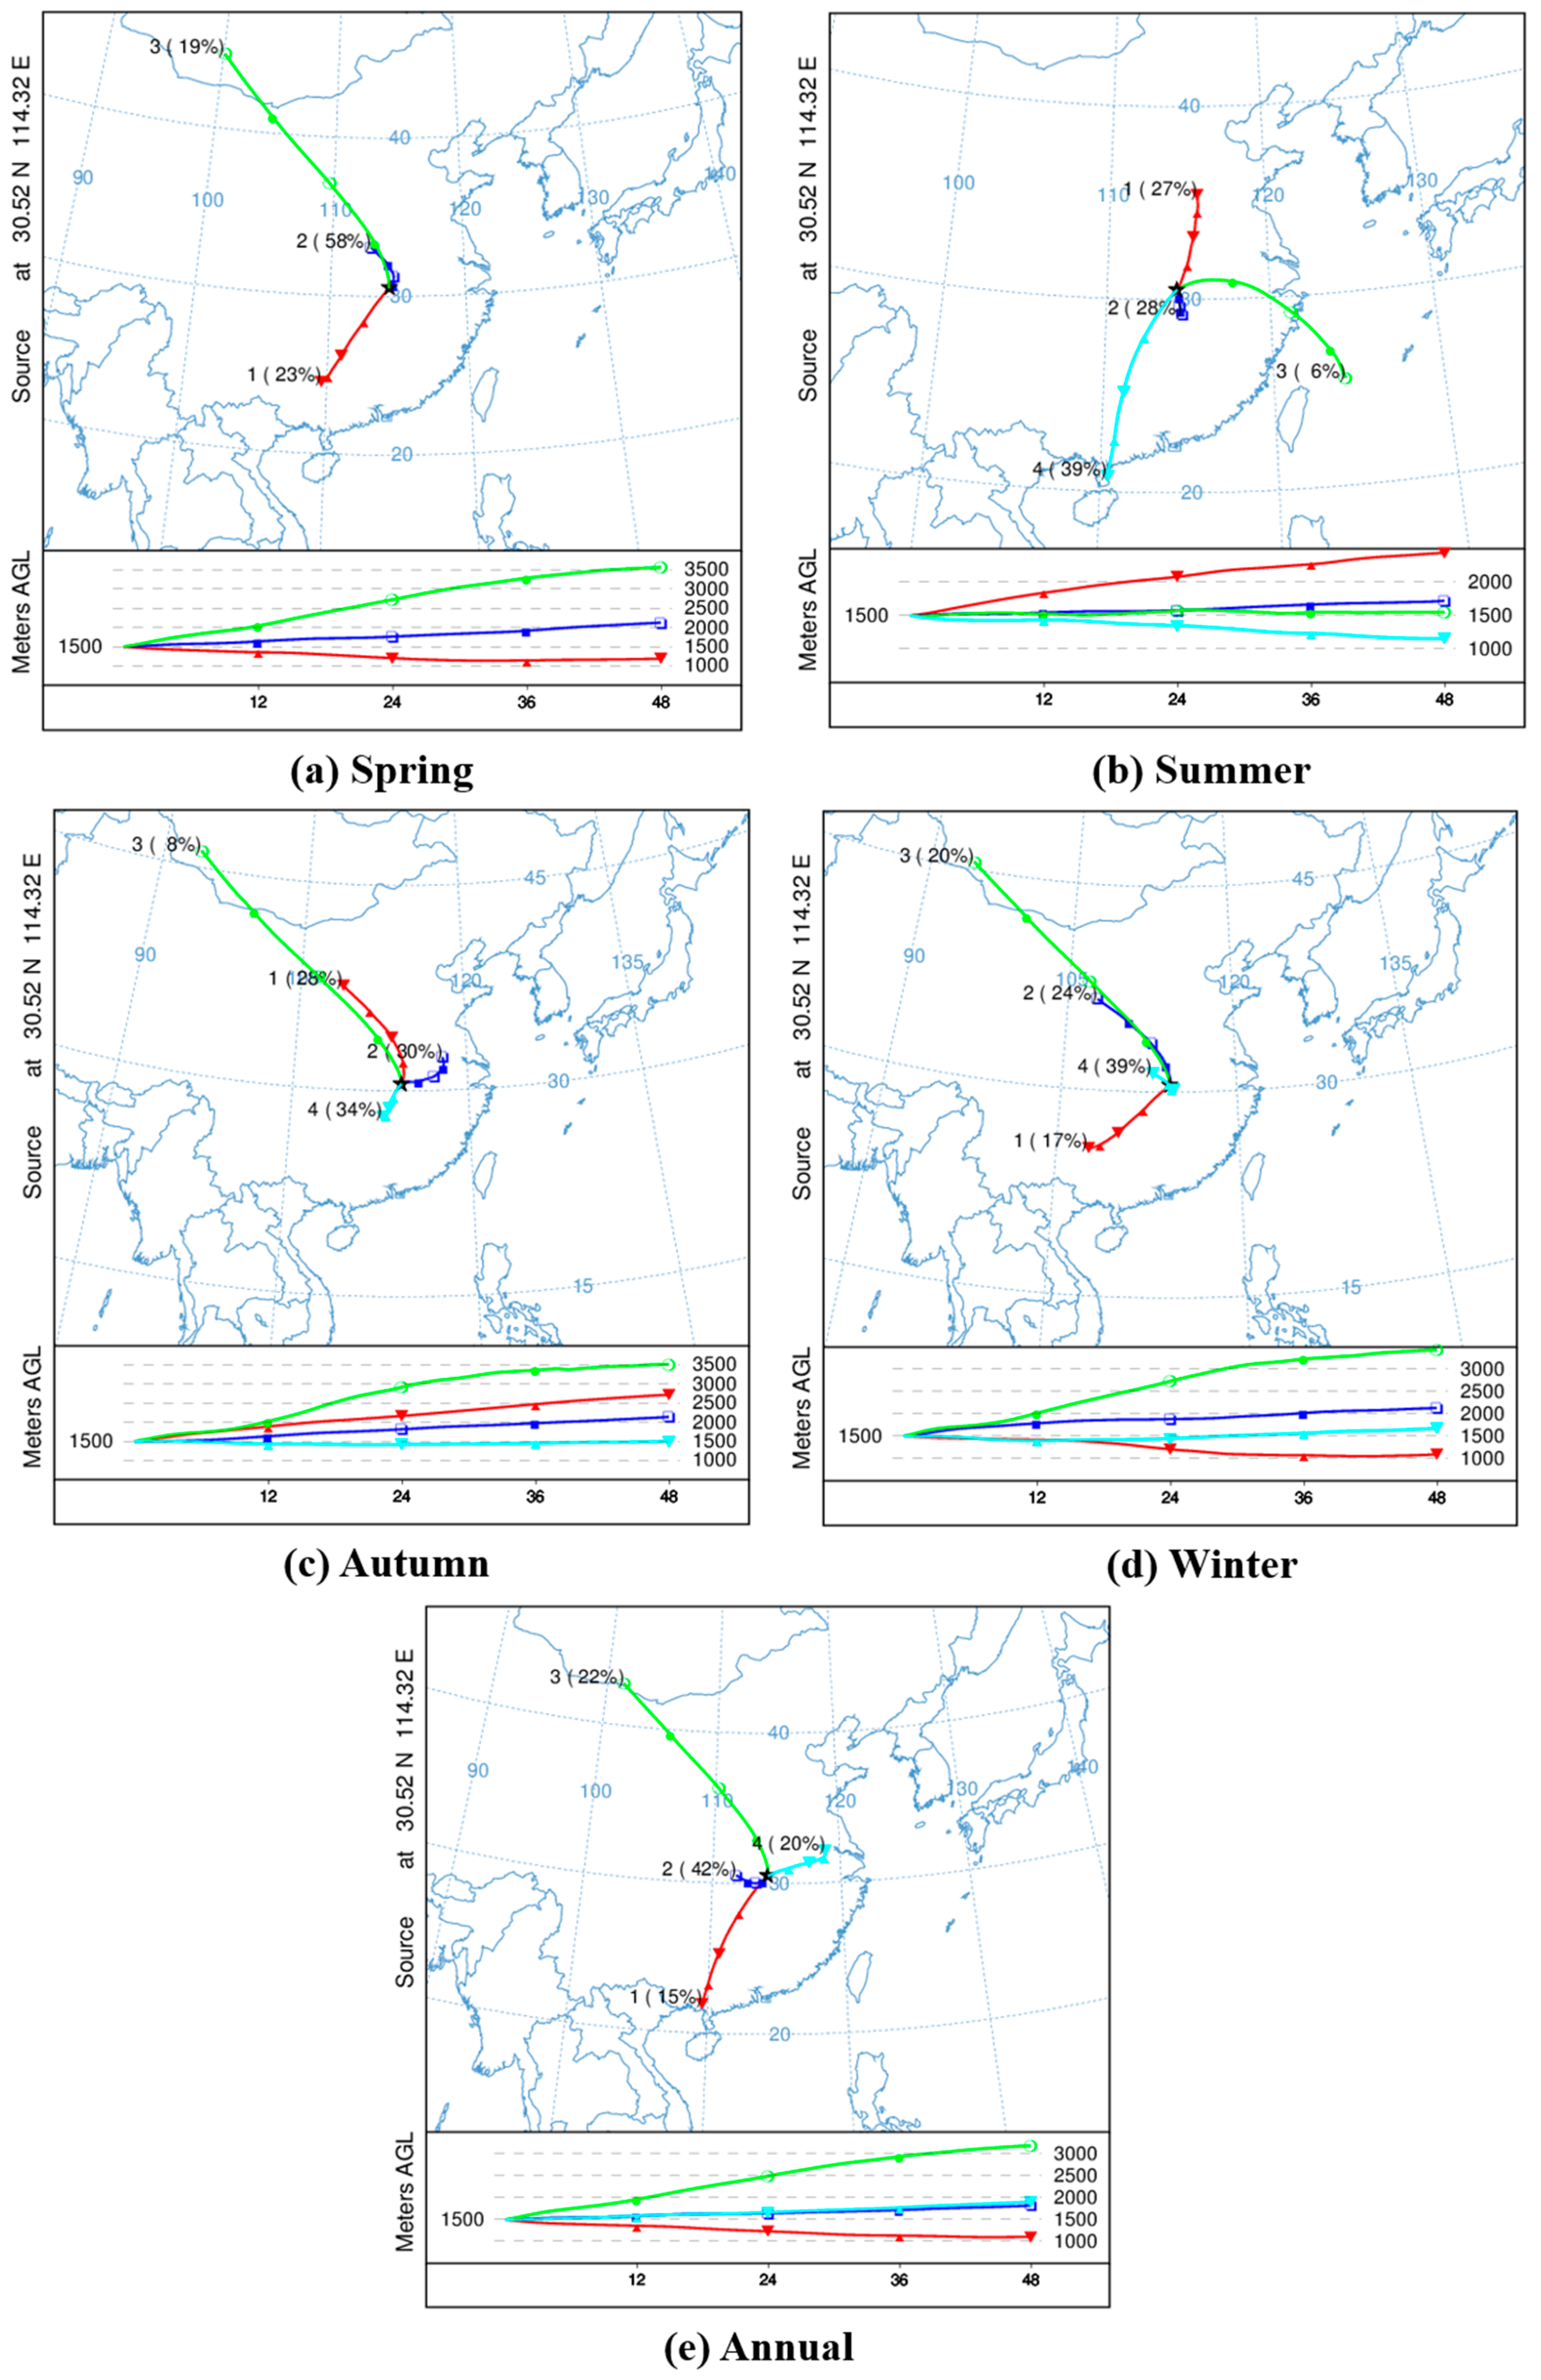
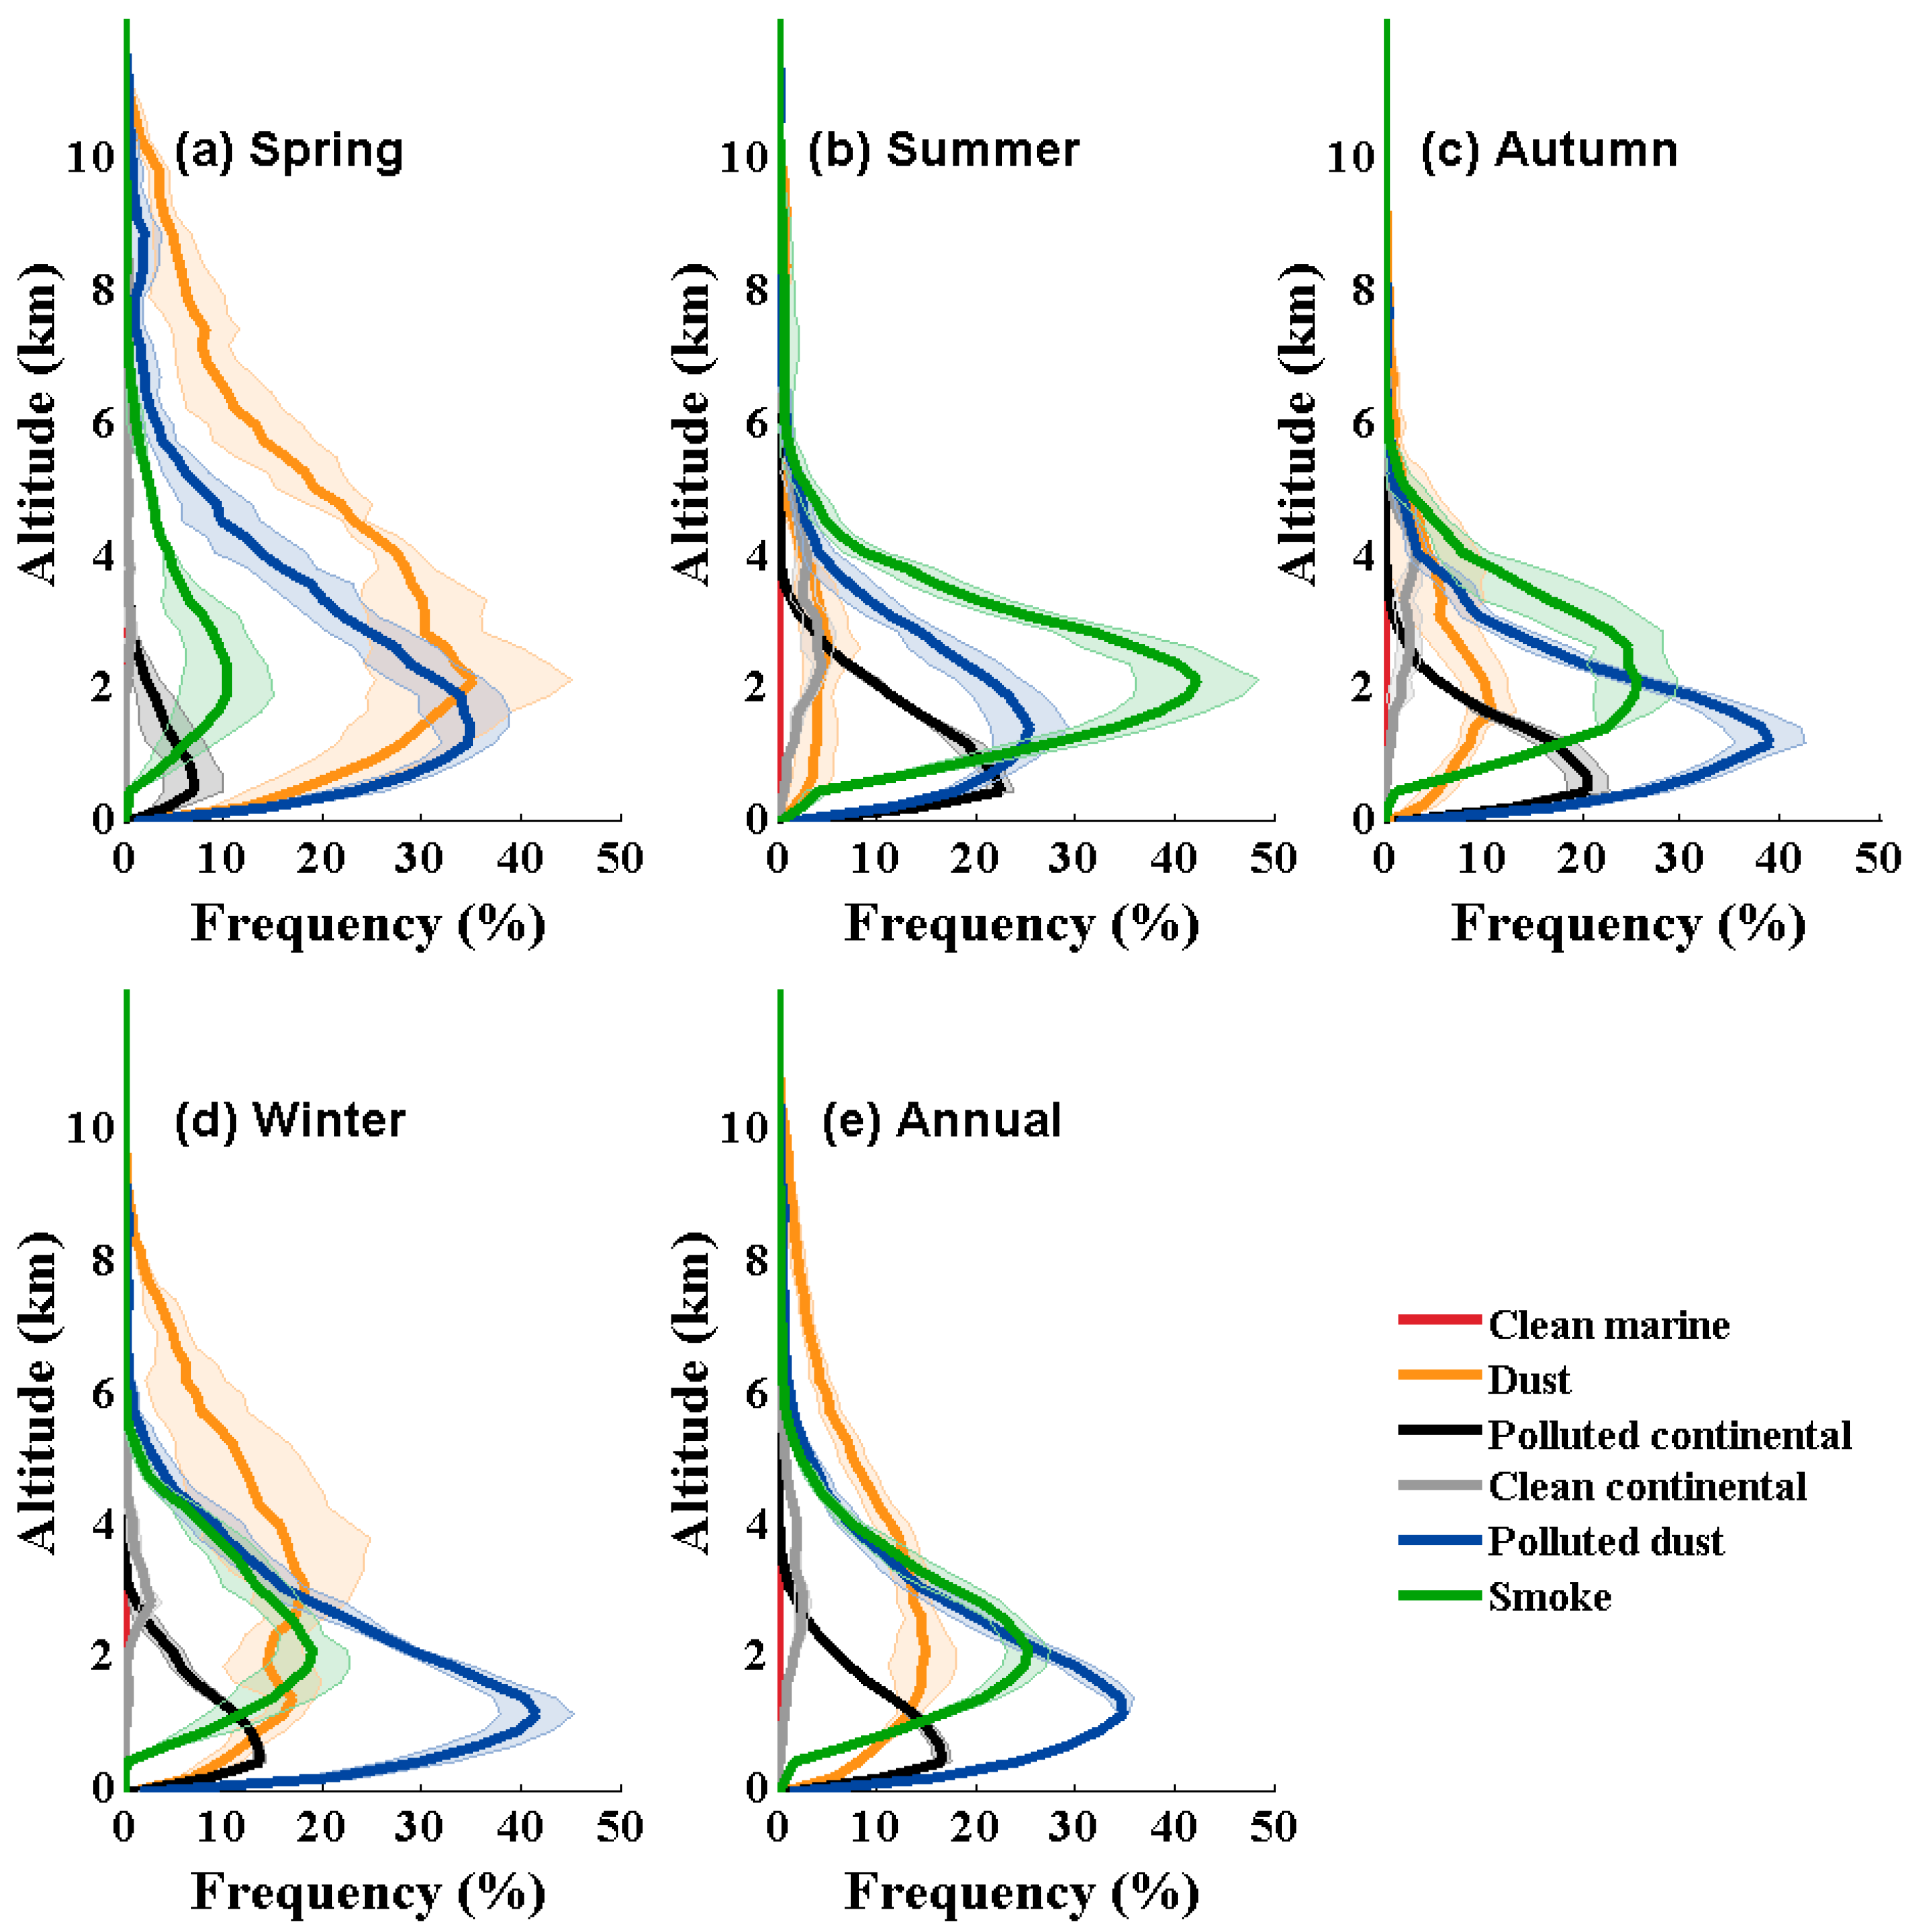
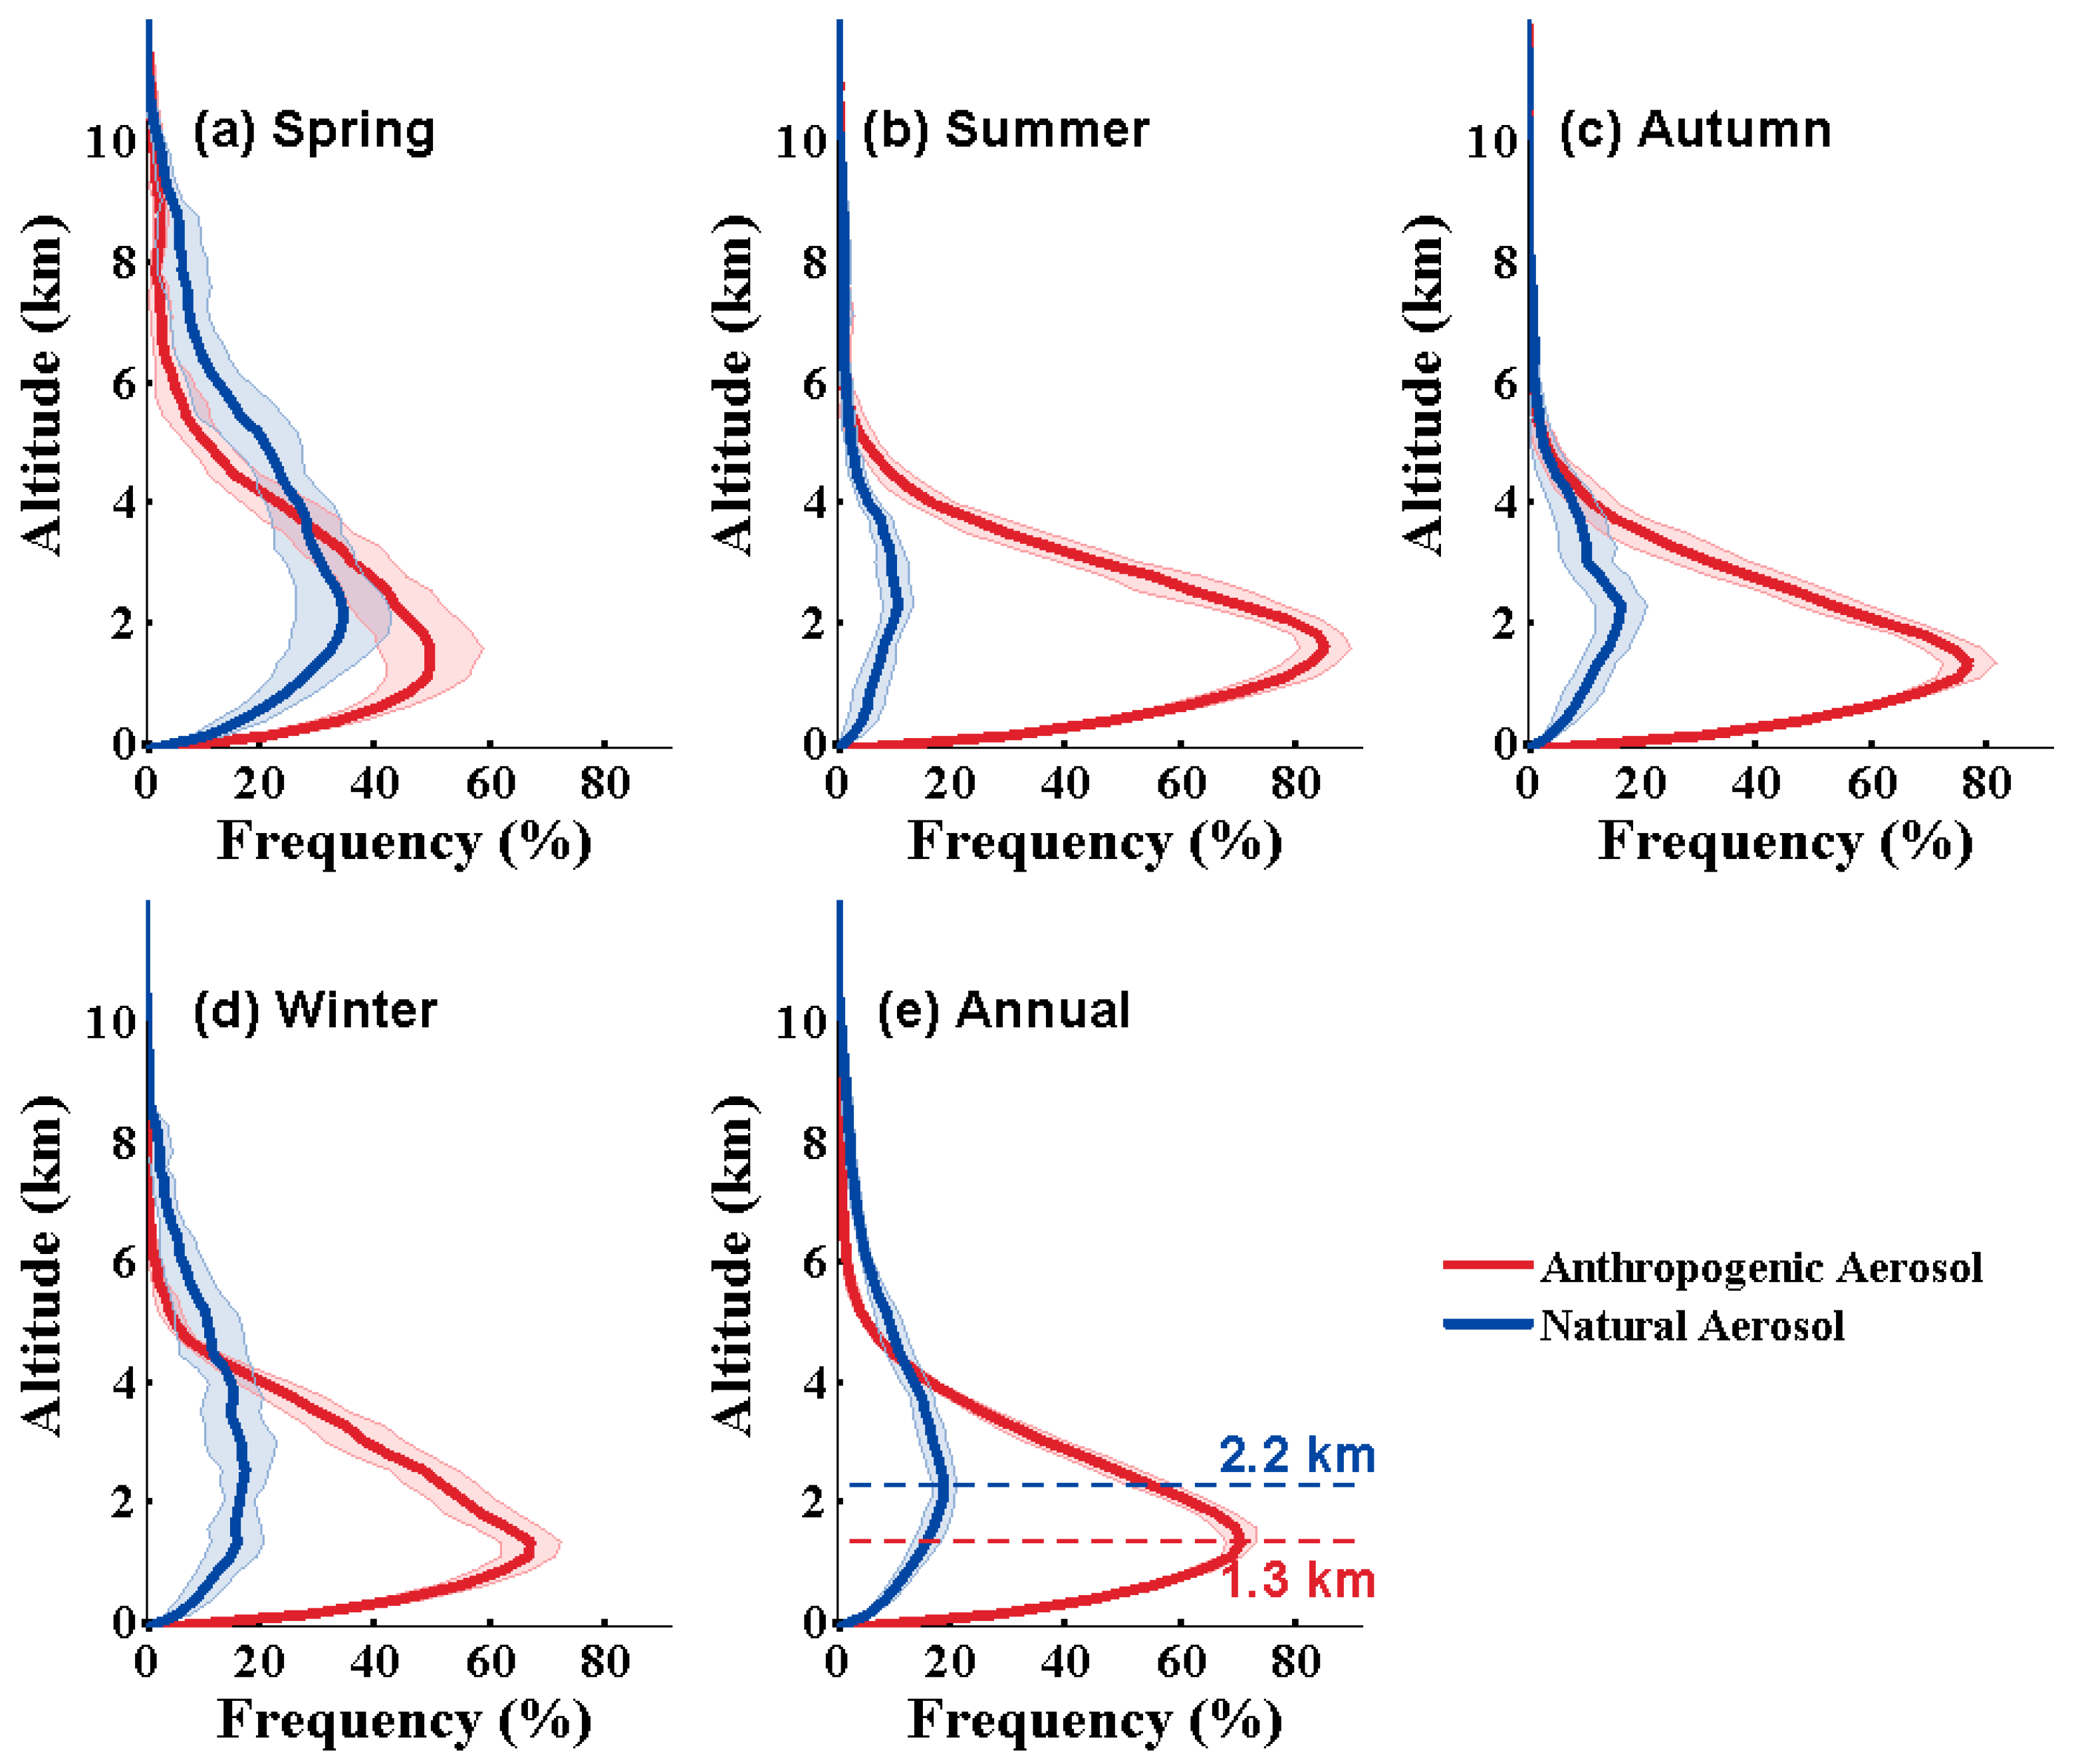
An annual average of approximately 60% of aerosols distributed over central China mainly originated from local areas, whereas non-locally produced aerosols constituted approximately 40%. Anthropogenic polluted aerosols contributed 69.0% of aerosols, which mainly distributed below 2.0 km. Natural aerosols accounted for a small portion of the total amount of aerosols, and usually existed at an altitude higher than that of anthropogenic aerosols.
(2)
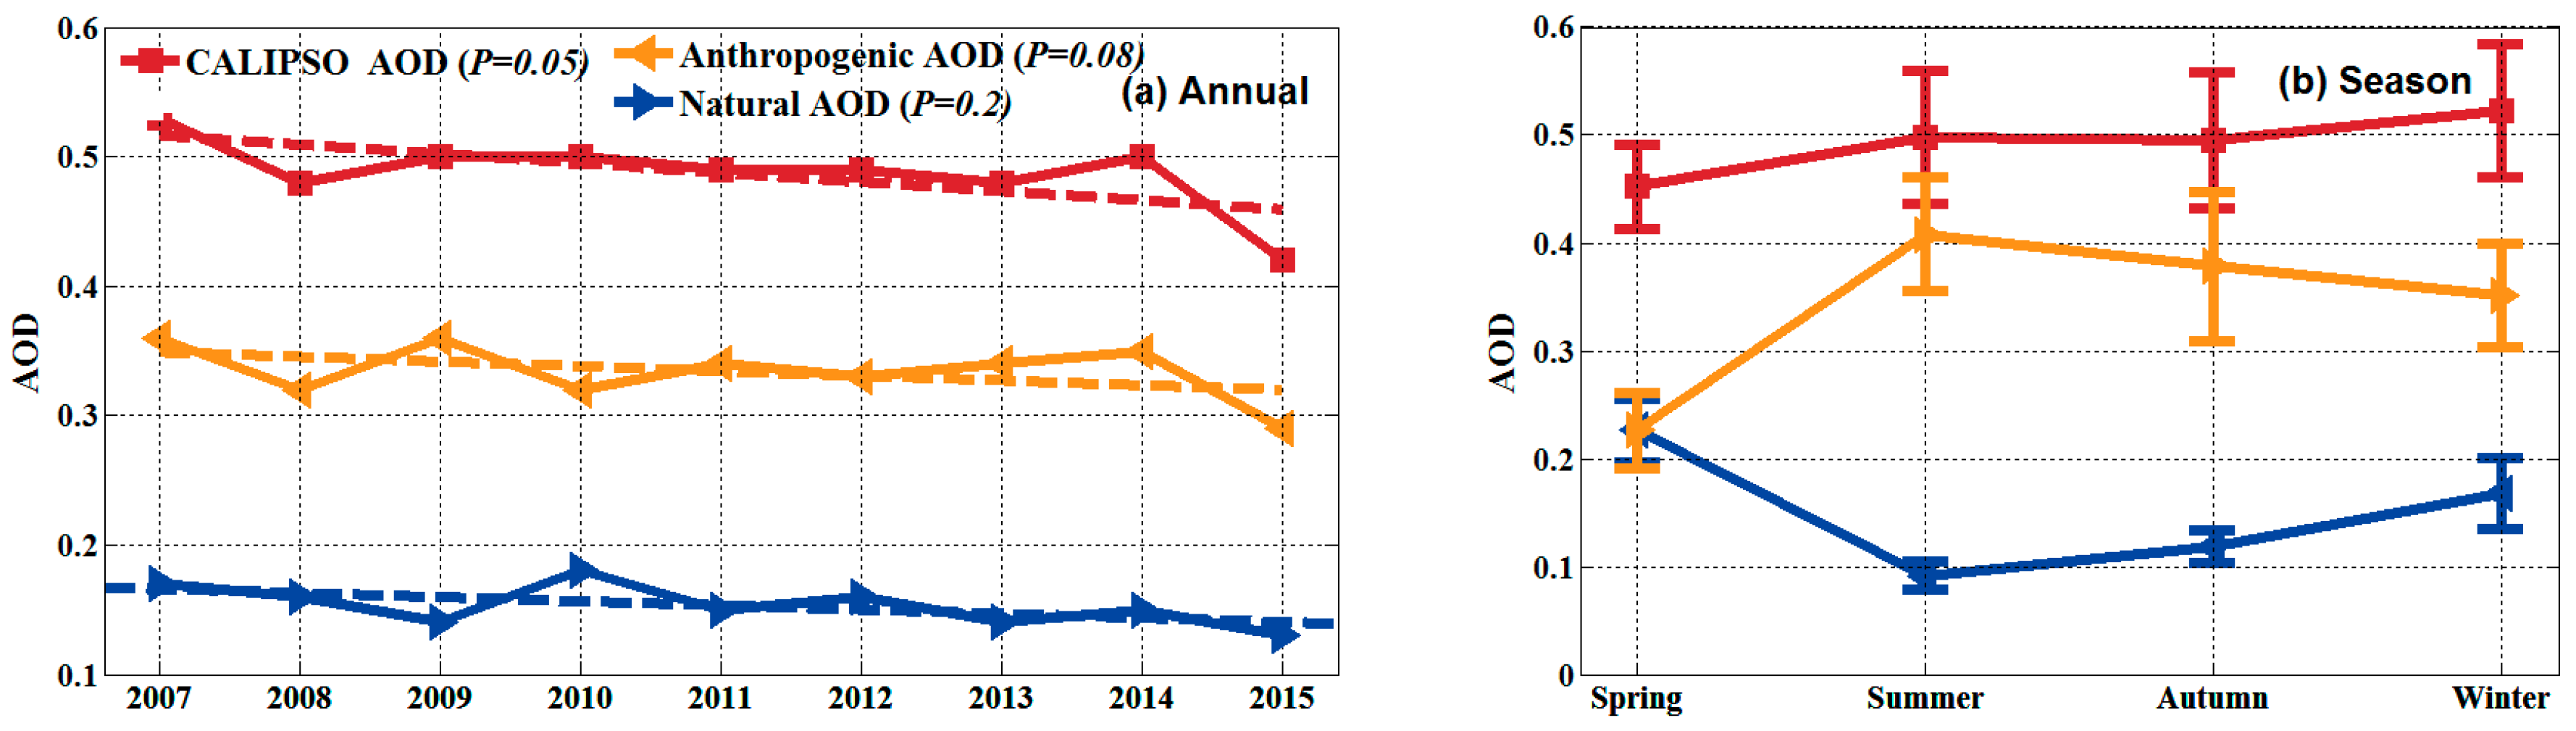
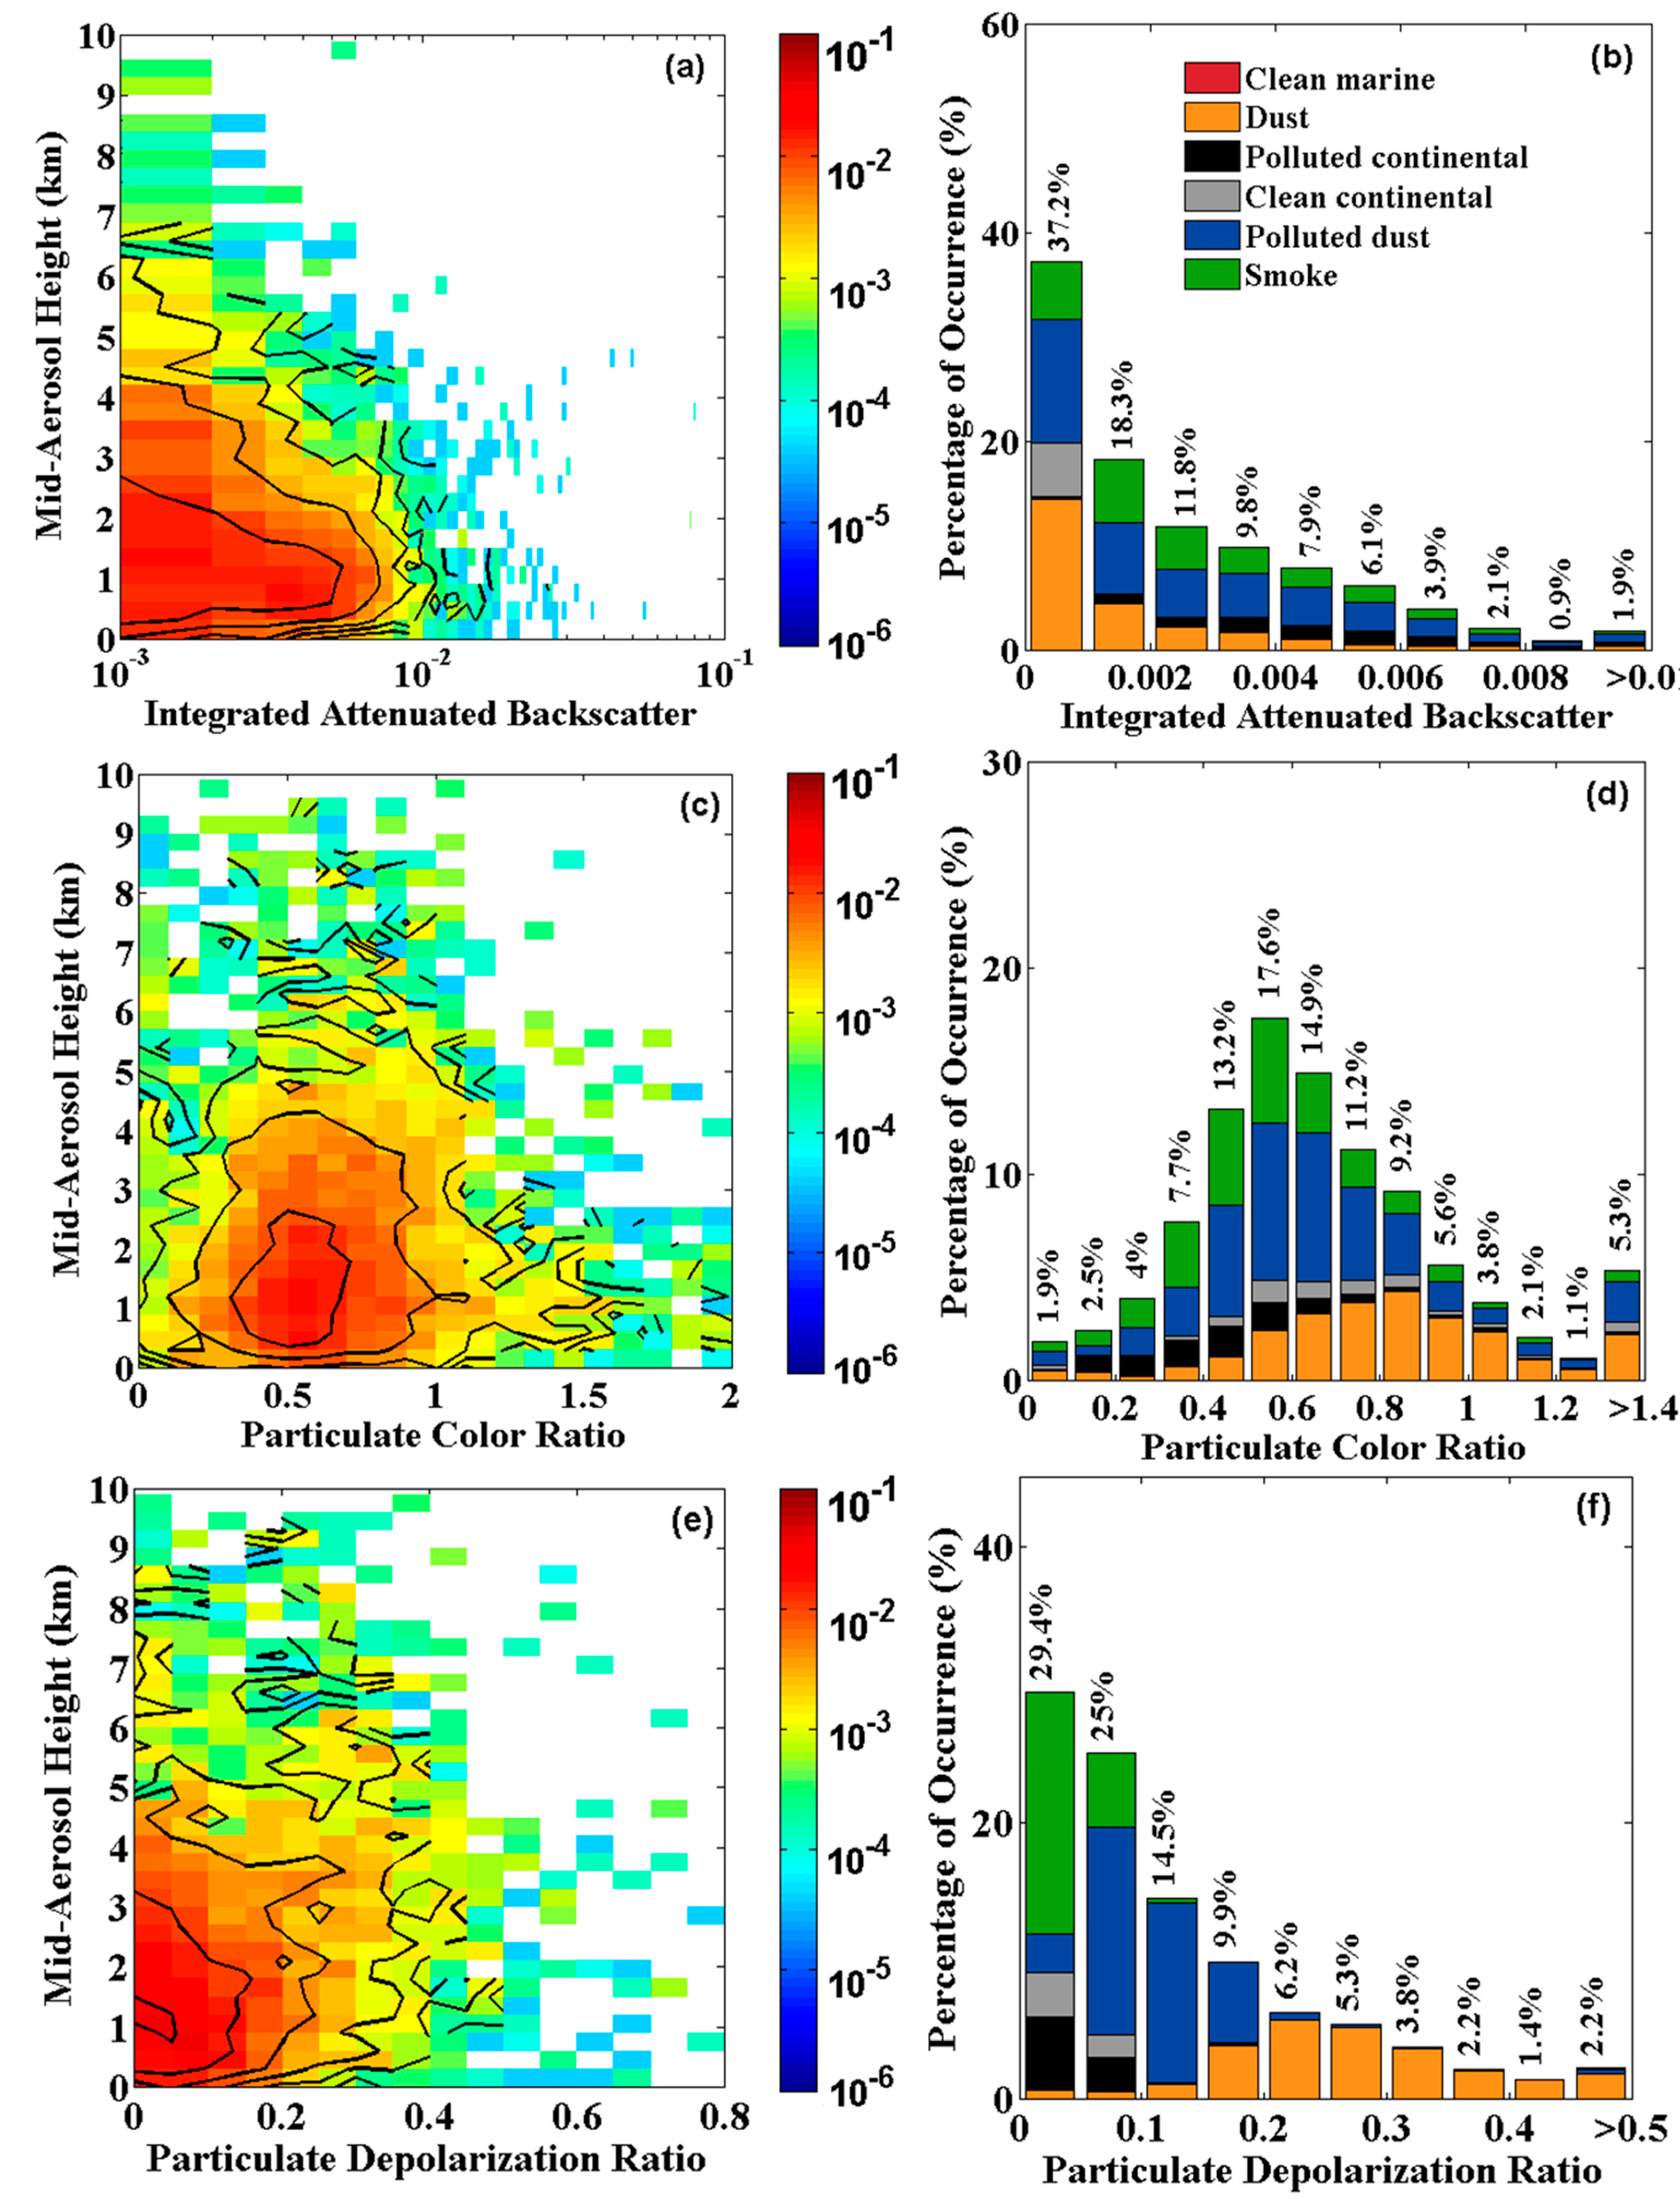
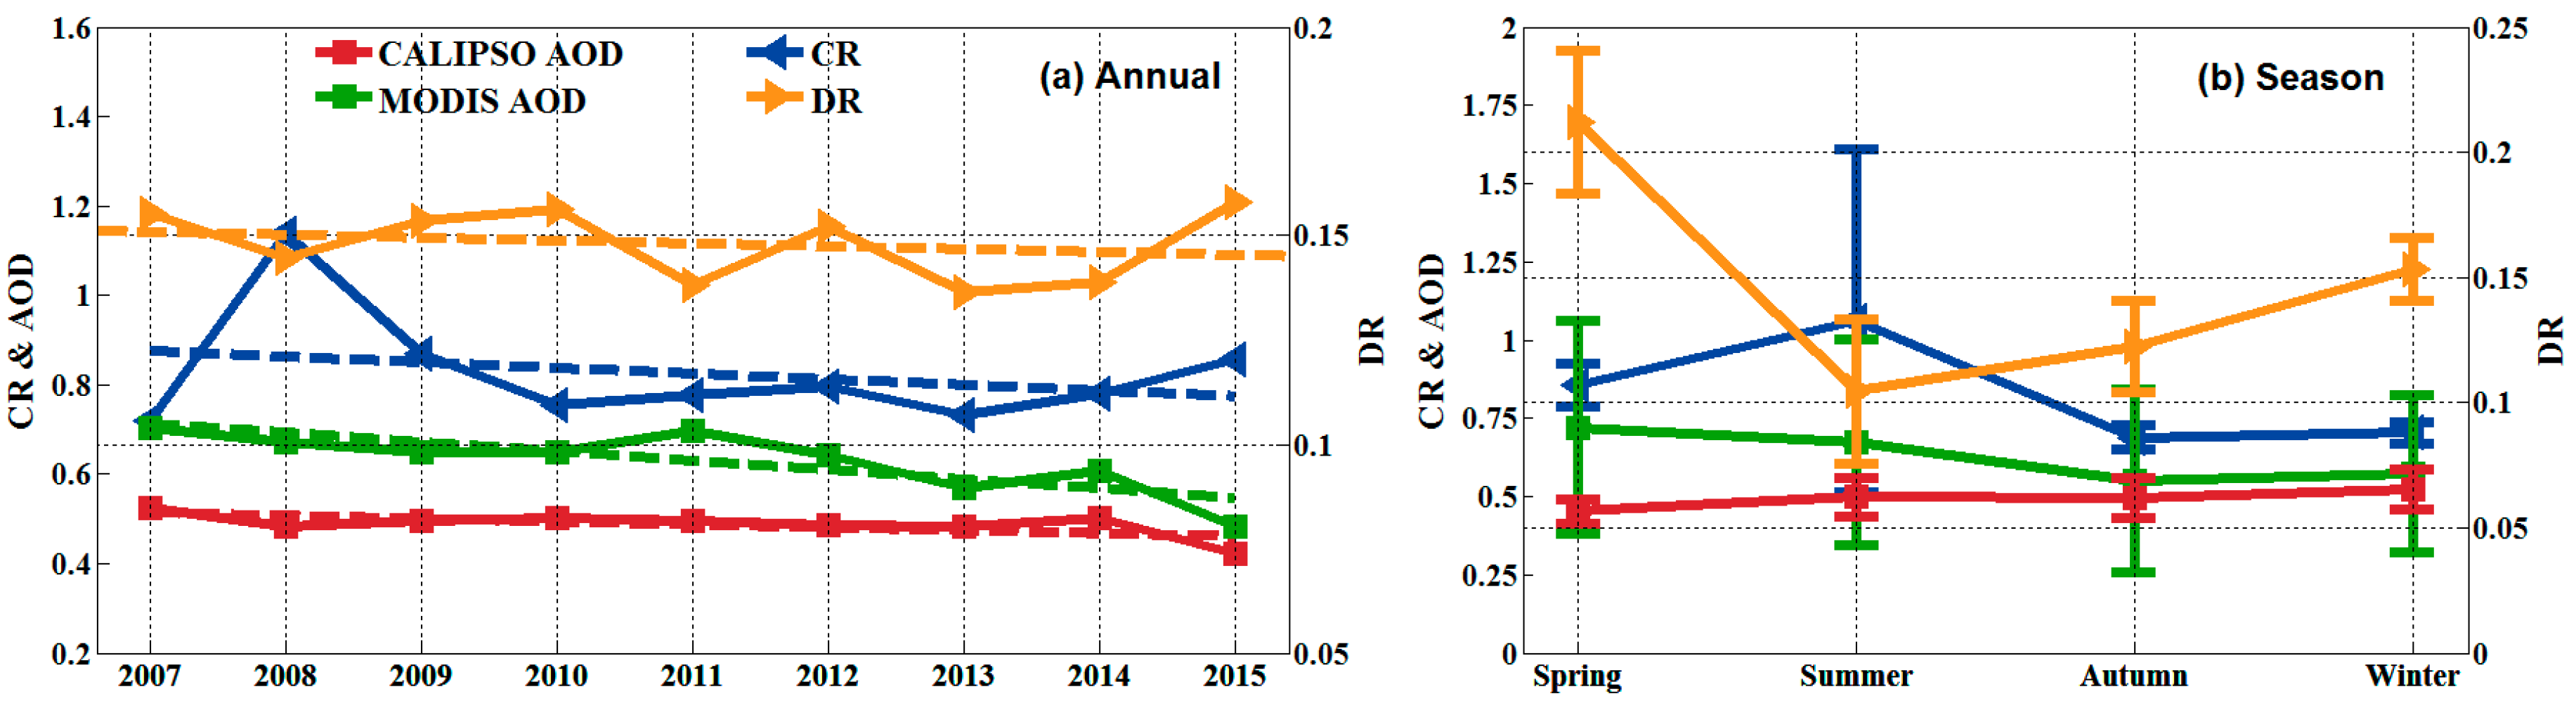
AGD was approximately 0.2–1.2 km, and the mean column AOD was approximately 0.49. The annual mean anthropogenic AOD and natural AOD were 0.34 and 0.15, respectively. IAB, CR, and DR were approximately 0.002, 0.82, and 0.14, respectively. Most of the aerosol particles distributed in the near surface were smaller and more spherical than those distributed above 2 km.
(3)
AOD and DR detected by CALIPSO displayed decreasing trends, with a total decrease of 0.11 and 0.016, respectively. These phenomena indicate that the extinction properties of aerosols decreased, and the degree of sphericity in aerosol particles increased during this study period. The trend of CR is not distinct, which possibly indicates that the size of the aerosol particles did not distinctly change. Moreover, the annual anthropogenic AOD and natural AOD demonstrated decreasing trends, with a total decrease of 0.07 and 0.04, respectively.
This study provides a scientific basis for understanding and modeling the atmospheric and ecological environments in central China and its surrounding areas. In the future, we will combine more sensors and models to comprehend the 3D characteristics of aerosols over central China, compare these characteristics with those of aerosols from other regions, and reveal more physical rules in aerosol science.

Acknowledgments

This study is supported by the National High Technology Research and Development Program of China (i.e., 863 Program, 2013AA102401), National Key R&D Program of China (2017YFC0212600, 2016YFC0200900) and the National Natural Science Foundation of China (41701381, 41627804, and 41571344). We are grateful to the science teams for providing excellent and accessible CALIPSO (www.eosweb.larc.nasa.gov), MODIS (www.ladsweb.modaps.eosdis.nasa.gov), and NCEP (www.esrl.noaa.gov/psd/) data, and the HYSPLIT (www.ready.arl.noaa.gov/HYSPLIT.php) model.

Author Contributions

X.L., F.M., and Z.P. conceived and designed the experiments; X.L. performed the experiments and wrote the manuscript; X.L. and Z.P. analyzed the data; W.W. contributed and analyzed Figure 1; F.M., W.G., L.T., and S.F. helped with discussion and paper touches.

Conflicts of Interest

The authors declare no conflict of interest.

Abbreviations

The following abbreviations are used in this manuscript:
AODaerosol optical depth
MODISModerate Resolution Imaging Spectroradiometer
CALIPSOCloud–Aerosol Lidar and Infrared Pathfinder Satellite Observations
HYSPLIThybrid single-particle Lagrangian integrated trajectory
IABintegrated attenuated backscatter
NCEPNational Center for Environmental Prediction
AGDaerosol geometrical depth
CRintegrated particulate color ratio
DRintegrated 532 nm particulate depolarization ratio

References

  1. Huang, J.; Minnis, P.; Lin, B.; Wang, T.; Yi, Y.; Hu, Y.; Sun-Mack, S.; Ayers, K. Possible influences of Asian dust aerosols on cloud properties and radiative forcing observed from MODIS and CERES. Geophys. Res. Lett. 2006, 33, 272–288. [Google Scholar] [CrossRef]
  2. Mao, F.; Duan, M.; Min, Q.; Gong, W.; Pan, Z.; Liu, G. Investigating the impact of haze on MODIS cloud detection. J. Geophys. Res. Atmos. 2016, 120, 12237–12247. [Google Scholar] [CrossRef]
  3. Guo, J.; Deng, M.; Lee, S.S.; Wang, F.; Li, Z.; Zhai, P.; Liu, H.; Lv, W.; Yao, W.; Li, X. Delaying precipitation and lightning by air pollution over the Pearl River Delta. Part I: Observational analyses. J. Geophys. Res. Atmos. 2016, 121, 6472–6488. [Google Scholar] [CrossRef]
  4. Mace, G.G.; Benson, S.; Kato, S. Cloud radiative forcing at the Atmospheric Radiation Measurement Program Climate Research Facility: 2. Vertical redistribution of radiant energy by clouds. J. Geophys. Res. Atmos. 2006, 111, 1937–1952. [Google Scholar] [CrossRef]
  5. Thorsen, T.J.; Fu, Q. CALIPSO-inferred aerosol direct radiative effects: Bias estimates using ground-based Raman lidars. J. Geophys. Res. Atmos. 2016, 120, 12209–12220. [Google Scholar] [CrossRef]
  6. Li, S.; Joseph, E.; Min, Q.; Yin, B.; Sakai, R.; Payne, M.K. Remote sensing of PM2.5 during cloudy and nighttime periods using ceilometer backscatter. Atmos. Meas. Tech. 2017, 10, 1–21. [Google Scholar] [CrossRef]
  7. Zhang, M.; Wang, L.; Gong, W.; Ma, Y.; Liu, B. Aerosol optical properties and direct radiative effects over central China. Remote Sens. 2017, 9, 997. [Google Scholar] [CrossRef]
  8. Wang, W.; Mao, F.; Du, L.; Pan, Z.; Gong, W.; Fang, S. Deriving Hourly PM2.5 Concentrations from Himawari-8 AODs over Beijing–Tianjin–Hebei in China. Remote Sens. 2017, 9, 858. [Google Scholar] [CrossRef]
  9. Wang, L.; Gong, W.; Xia, X.; Zhu, J.; Li, J.; Zhu, Z. Long-term observations of aerosol optical properties at Wuhan, an urban site in Central China. Atmos. Environ. 2015, 101, 94–102. [Google Scholar] [CrossRef]
  10. Kim, M.; Zhang, X.; Holt, J.B.; Liu, Y. Spatio-Temporal Variations in the Associations between Hourly PM2.5 and Aerosol Optical Depth (AOD) from MODIS Sensors on Terra and Aqua. Health 2013, 5, 8–13. [Google Scholar] [CrossRef] [PubMed]
  11. Qu, W.; Wang, J.; Zhang, X.; Sheng, L.; Wang, W. Opposite seasonality of the aerosol optical depth and the surface particulate matter concentration over the North China Plain. Atmos. Environ. 2015, 127, 90–99. [Google Scholar] [CrossRef]
  12. Yin, B.; Min, Q. Climatology of aerosol and cloud optical properties at the Atmospheric Radiation Measurements Climate Research Facility Barrow and Atqasuk sites. J. Geophys. Res. Atmos. 2014, 119, 1820–1834. [Google Scholar] [CrossRef]
  13. Huang, J.; Liu, J.; Chen, B.; Nasiri, S.L. Detection of anthropogenic dust using CALIPSO lidar measurements. Atmos. Chem. Phys. 2015, 15, 10163–10198. [Google Scholar] [CrossRef]
  14. Zhao, S.; Yu, Y.; Xia, D.; Yin, D.; He, J.; Liu, N.; Li, F. Urban particle size distributions during two contrasting dust events originating from Taklimakan and Gobi Deserts. Environ. Pollut. 2015, 207, 107–122. [Google Scholar] [CrossRef] [PubMed]
  15. Li, R. Multi-Satellite Observation of an Intense Dust Event over Southwestern China. Aerosol Air Qual. Res. 2015, 15, 263–270. [Google Scholar] [CrossRef]
  16. Tao, S.Y. A review of recent research on the East Asian summer monsoon in China. In Monsoon Meteorology; Chang, C.-P., Krishnamurti, T.N., Eds.; Oxford Univ. Press: New York, NY, USA, 1987; pp. 60–92. [Google Scholar]
  17. Winker, D.M.; Pelon, J.; Coakley, J.A.; Ackerman, S.A.; Charlson, R.J.; Colarco, P.R.; Flamant, P.; Fu, Q.; Hoff, R.M.; Kittaka, C. The CALIPSO Mission: A Global 3D View of Aerosols and Clouds. Bull. Am. Meteorol. Soc. 2010, 91, 1211–1229. [Google Scholar] [CrossRef]
  18. Pan, Z.; Mao, F.; Gong, W.; Min, Q.; Wang, W. The warming of Tibetan Plateau enhanced by 3D variation of low-level clouds during daytime. Remote Sens. Environ. 2017, 198, 363–368. [Google Scholar] [CrossRef]
  19. Pan, Z.; Gong, W.; Mao, F.; Li, J.; Wang, W.; Li, C.; Min, Q. Macrophysical and optical properties of clouds over East Asia measured by CALIPSO. J. Geophys. Res. Atmos. 2015, 120, 11653–11668. [Google Scholar] [CrossRef]
  20. Omar, A.H.; Winker, D.M.; Kittaka, C.; Vaughan, M.A.; Liu, Z.; Hu, Y.; Trepte, C.R.; Rogers, R.R.; Ferrare, R.A.; Lee, K.P. The CALIPSO Automated Aerosol Classification and Lidar Ratio Selection Algorithm. J. Atmos. Ocean. Technol. 2009, 26, 1994–2014. [Google Scholar] [CrossRef]
  21. Tian, P.; Cao, X.; Zhang, L.; Sun, N.; Sun, L.; Logan, T.; Shi, J.; Wang, Y.; Ji, Y.; Lin, Y. Aerosol vertical distribution and optical properties over China from long-term satellite and ground-based remote sensing. Atmos. Chem. Phys. 2017, 17, 1–47. [Google Scholar] [CrossRef]
  22. Winker, D.M.; Tackett, J.L.; Getzewich, B.J.; Liu, Z.; Vaughan, M.A.; Rogers, R.R. The global 3-D distribution of tropospheric aerosols as characterized by CALIOP. Atmos. Chem. Phys. 2012, 12, 24847–24893. [Google Scholar] [CrossRef]
  23. Mielonen, T.; Arola, A.; Komppula, M.; Kukkonen, J.; Koskinen, J.; De Leeuw, G.; Lehtinen, K.E.J. Comparison of CALIOP level 2 aerosol subtypes to aerosol types derived from AERONET inversion data. Geophys. Res. Lett. 2009, 36, 252–260. [Google Scholar] [CrossRef]
  24. Geng, F.; Liu, Q.; Chen, Y.; Hua, Z.; Mao, X. Preliminary Study of Vertical Distribution of Aerosols during Dry Haze Periods around Shanghai Based on CALIPSO. Procedia Earth Planet. Sci. 2011, 2, 217–222. [Google Scholar] [CrossRef]
  25. Yu, H.; Chin, M.; Winker, D.M.; Omar, A.H.; Liu, Z.; Kittaka, C.; Diehl, T. Global view of aerosol vertical distributions from CALIPSO lidar measurements and GOCART simulations: Regional and seasonal variations. J. Geophys. Res. Atmos. 2010, 115, 1307–1314. [Google Scholar] [CrossRef]
  26. Draxler, R.R.; Hess, G.D.; Draxler, R.R. An overview of the HYSPLIT-4 modelling system for trajectories. Aust. Meteorol. Mag. 1998, 47, 295–308. [Google Scholar]
  27. Freitag, S.; Clarke, A.D.; Howell, S.G.; Kapustin, V.N.; Campos, T.; Brekhovskikh, V.L.; Zhou, J. Combining airborne gas and aerosol measurements with HYSPLIT: A visualization tool for simultaneous evaluation of air mass history and back trajectory consistency. Atmos. Meas. Tech. 2014, 7, 107–128. [Google Scholar] [CrossRef] [Green Version]
  28. Huang, X.F.; He, L.Y.; Xue, L.; Sun, T.L.; Zeng, L.W.; Gong, Z.H.; Hu, M.; Zhu, T. Highly time-resolved chemical characterization of atmospheric fine particles during 2010 Shanghai World Expo. Atmos. Chem. Phys. 2012, 12, 1093–1115. [Google Scholar] [CrossRef]
  29. Badarinath, K.V.S.; Kharol, S.K.; Kaskaoutis, D.G.; Sharma, A.R.; Ramaswamy, V.; Kambezidis, H.D. Long-range transport of dust aerosols over the Arabian Sea and Indian region—A case study using satellite data and ground-based measurements. Glob. Planet. Chang. 2010, 72, 164–181. [Google Scholar] [CrossRef]
  30. Guo, J.; Liu, H.; Wang, F.; Huang, J.; Xia, F.; Lou, M.; Wu, Y.; Jiang, J.H.; Xie, T.; Zhaxi, Y. Three-dimensional structure of aerosol in China: A perspective from multi-satellite observations. Atmos. Res. 2016, 178–179, 580–589. [Google Scholar] [CrossRef]
  31. Che, H.; Zhang, X.; Chen, H.; Damiri, B.; Goloub, P.; Li, Z.; Zhang, X.; Wei, Y.; Zhou, H.; Dong, F. Instrument calibration and aerosol optical depth validation of the China Aerosol Remote Sensing Network. J. Geophys. Res. 2009, 114, 1065–1066. [Google Scholar] [CrossRef]
  32. Ma, X.; Bartlett, K.; Harmon, K.; Yu, F. Comparison of AOD between CALIPSO and MODIS: Significant differences over major dust and biomass burning regions. Atmos. Meas. Tech. 2013, 6, 2391–2401. [Google Scholar] [CrossRef]
  33. Burton, S.P.; Ferrare, R.A.; Vaughan, M.A.; Omar, A.H. Aerosol classification from airborne HSRL and comparisons with the CALIPSO vertical feature mask. Atmos. Meas. Tech. 2013, 12, 1397–1412. [Google Scholar] [CrossRef]
  34. Pérezramírez, D.; Lyamani, H.; Olmo, F.J.; Whiteman, D.N.; Aladosarboledas, L. Columnar aerosol properties from sun-and-star photometry: Statistical comparisons and day-to-night dynamic. Atmos. Chem. Phys. 2012, 12, 9719–9738. [Google Scholar] [CrossRef] [Green Version]
  35. Gao, L.; Tian, Y.; Zhang, C.; Shi, G.; Hao, H.; Zeng, F.; Shi, C.; Zhang, M.; Feng, Y.; Li, X. Local and long-range transport influences on PM2.5 at a cities-cluster in northern China, during summer 2008. Particuology 2014, 13, 66–72. [Google Scholar] [CrossRef]
  36. Zhang, W.; Zhuang, G.; Guo, J.; Xu, D.; Wang, W.; Baumgardner, D.; Wu, Z.; Yang, W. Sources of aerosol as determined from elemental composition and size distributions in Beijing. Atmos. Res. 2010, 95, 197–209. [Google Scholar] [CrossRef]
  37. Zheng, S.; Yi, H.; Li, H. The impacts of provincial energy and environmental policies on air pollution control in China. Renew. Sustain. Energy Rev. 2015, 49, 386–394. [Google Scholar] [CrossRef]
  38. Guo, J. Observation of an agricultural biomass burning in central and east China using merged aerosol optical depth data from multiple satellite missions. Int. J. Remote Sens. 2014, 35, 5971–5983. [Google Scholar]
  39. Latif, M.T.; Huey, L.S.; Juneng, L. Variations of surface ozone concentration across the Klang Valley, Malaysia. Atmos. Environ. 2012, 61, 434–445. [Google Scholar] [CrossRef]
  40. Fernandoy, F.; Meyer, H.; Tonelli, M. Stable water isotopes of precipitation and firn cores from the northern Antarctic Peninsula region as a proxy for climate reconstruction. Cryosphere Discuss. 2012, 5, 313–330. [Google Scholar] [CrossRef] [Green Version]
  41. Zhang, Z.; Engling, G.; Lin, C.Y.; Chou, C.K.; Lung, S.C.C.; Chang, S.Y.; Fan, S.; Chan, C.Y.; Zhang, Y.H. Chemical speciation, transport and contribution of biomass burning smoke to ambient aerosol in Guangzhou, a mega city of China. Atmos. Environ. 2010, 44, 3187–3195. [Google Scholar] [CrossRef]
  42. Yang, Y.J.; Fu, Y.F.; Wu, B.W.; Shi, C.E.; Deng, X.L.; Zhang, H.; Zhang, Y. Impacts of agricultural fire on aerosol distribution over East China during summer harvest time. J. Atmos. Environ. Opt. 2013, 8, 5–16. [Google Scholar]
  43. Zhang, L.; Liao, H.; Li, J. Impacts of Asian summer monsoon on seasonal and interannual variations of aerosols over eastern China. J. Geophys. Res. Atmos. 2010, 115. [Google Scholar] [CrossRef]
  44. Zhang, F.; Cheng, H.R.; Wang, Z.W.; Lv, X.P.; Zhu, Z.M.; Zhang, G.; Wang, X.M. Fine particles (PM2.5) at a CAWNET background site in Central China: Chemical compositions, seasonal variations and regional pollution events. Atmos. Environ. 2014, 86, 193–202. [Google Scholar] [CrossRef]
  45. Deng, X.; Shi, C.; Wu, B.; Chen, Z.; Nie, S.; He, D.; Zhang, H. Analysis of aerosol characteristics and their relationships with meteorological parameters over Anhui province in China. Atmos. Res. 2012, 109–110, 52–63. [Google Scholar] [CrossRef]
  46. Li, S.; Joseph, E.; Min, Q.; Yin, B. Multi-year ground-based observations of aerosol-cloud interactions in the Mid-Atlantic of the United States. J. Quant. Spectrosc. Radiat. Transf. 2016, 188, 192–199. [Google Scholar] [CrossRef]
  47. Feng, Y.; Kotamarthi, V.R.; Coulter, R.; Zhao, C.; Cadeddu, M. Radiative and thermodynamic responses to aerosol extinction profiles during the pre-monsoon month over South Asia. Atmos. Chem. Phys. 2016, 16, 247–264. [Google Scholar] [CrossRef]
Figure 1. Map of China. The red box represents central China, and the white-filled circle represents Wuhan.
Remotesensing 10 00314 g001
Figure 2. Latitude-height contour plots of quantities determined by the Cloud–Aerosol Lidar and Infrared Pathfinder Satellite Observations (CALIPSO) mission at 18:25 UTC 18 September 2007 under heavy aerosol loading conditions: (a) 532-nm total attenuated backscatter, (b) 532-nm attenuated depolarization ratio, (c) attenuated color ratio, and (d) vertical feature mask of aerosol subtypes (CM: Clean Marine; PC: Polluted Continental; CC: Clean Continental; PD: Polluted Dust; Other: Clear sky, clouds, or surface). The red lines indicate the location of Wuhan.
Remotesensing 10 00314 g002
Figure 3. Distribution of dominant aerosols with a spatial resolution of one degree over central China in each season from March 2007 to February 2016.
Remotesensing 10 00314 g003
Figure 4. (a) Joint probability distribution of aerosol geometrical depth (AGD) combined with mid-aerosol height at 0.3 km bin size. (b) The corresponding AGD probability distribution of each aerosol type within the aerosol column at 0.2-km intervals over central China from March 2007 to February 2016.
Remotesensing 10 00314 g004
Figure 5. Annual average distribution of column aerosol optical depth with a spatial resolution of one degree in each season over central China from March 2007 to February 2016.
Remotesensing 10 00314 g005
Figure 6. (a) Joint probability distribution of aerosol optical depth (AOD) of aerosol layers combined with mid-aerosol height at 0.3 km bin size, and (b) the corresponding AOD probability distribution of aerosol layers with each aerosol type during the whole study time over central China from March 2007 to February 2016. (c,d) and (e,f) are the same as (a,b) but for daytime and nighttime, respectively. The black solid line indicates the joint probability contour plots.
Remotesensing 10 00314 g006
Figure 7. Joint probability distribution of (a) integrated attenuated backscatter (IAB), (c) color ratio (CR), and (e) depolarization ratio (DR) with mid-aerosol height at 0.3-km bin size and the corresponding (b) IAB, (d) CR, and (f) DR probability distribution of each aerosol type over central China from March 2007 to February 2016. The black solid line indicates the joint probability contour plots.
Remotesensing 10 00314 g007
Figure 8. Annual and seasonal distributions of the column aerosol optical depth, color ratio, and depolarization ratio observed by the CALIPSO and MODIS AOD over central China from March 2007 to February 2016. The dashed lines in Figure 8a are the linear trend fitting lines of the annual means for each aerosol parameters.
Remotesensing 10 00314 g008
Figure 9. Annual and seasonal distributions of AOD (anthropogenic and natural), anthropogenic AOD, and natural AOD observed by CALIPSO over central China from March 2007 to February 2016. The dashed lines in Figure 9a are the linear trend fitting lines of the annual means for each aerosol parameter. p indicates the value of significance level of each aerosol parameter.
Remotesensing 10 00314 g009
Figure 10. Full-resolution seasonal and annual average occurrence frequencies of aerosols versus altitude over central China from March 2007 to February 2016. The lightly shaded solid line indicates the inter-annual standard deviation of the vertical distributions of aerosol.
Remotesensing 10 00314 g010
Figure 11. Full-resolution seasonal and annual average occurrence frequencies of anthropogenic aerosols and natural aerosols versus altitude over central China from March 2007 to February 2016. The lightly shaded solid line indicates the inter-annual standard deviation of the vertical distributions of aerosol. The dashed line in Figure 11e indicates the altitude of the largest occurrence frequency (the blue for natural aerosol and the red for anthropogenic aerosol).
Remotesensing 10 00314 g011
Figure 12. Backward trajectory distribution of the hybrid single-particle Lagrangian integrated trajectory (HYSPLIT)-4 model for the Wuhan region from 2007 to 2016.
Remotesensing 10 00314 g012
Table 1. Statistics of the regional average occurrence frequency of each different aerosol subtype over central China for each season from March 2007 to February 2016 (unit: %).
SpringSummerAutumnWinter
Dust58.8114.8825.5243.32
Polluted continental8.4422.0320.4615.78
Clean continental5.2914.9810.416.28
Polluted dust54.9645.3051.5661.62
Smoke20.8950.8938.1233.19
Table 2. Statistics of the probability distribution of the AOD of five aerosol subtypes defined by CALIPSO over central China from March 2007 to February 2016 (unit: %). The numbers shown in the first line are AOD intervals. The clean marine aerosol is not shown, because it is negligible in land.
0–0.10.1–0.20.2–0.30.3–0.40.4–0.50.5–0.60.6–0.70.7–0.80.8–0.90.9–1.0>1.0Total
Dust19.33.01.50.70.40.20.10.20.10.325.8
Polluted continental0.50.90.60.70.70.60.40.40.30.32.47.8
Clean continental5.25.2
Polluted dust15.76.24.33.32.41.61.10.50.40.51.737.7
Smoke7.84.62.81.51.20.90.60.60.50.52.523.5
All Aerosol Types48.514.79.26.24.73.32.21.71.31.36.9100
Table 3. Statistics of the cluster results in Figure 12 for each season, from March 2007 to February 2016.
Cluster in RedCluster in BlueCluster in GreenCluster in Cyan
Spring23%58%19%
Summer27%28%6%39%
Autumn28%30%8%34%
Winter17%24%20%39%
Annual15%42%22%20%

