Lithological and Hydrothermal Alteration Mapping of Epithermal, Porphyry and Tourmaline Breccia Districts in the Argentine Andes Using ASTER Imagery


Abstract
:
1. Introduction
2. Geology
3. Ore Deposits and Related Hydrothermal Alteration Zones
4. Methodology
4.1. Image Pre-Processing Techniques
4.2. Image Processing Techniques
4.3. SWIR Portable Instruments
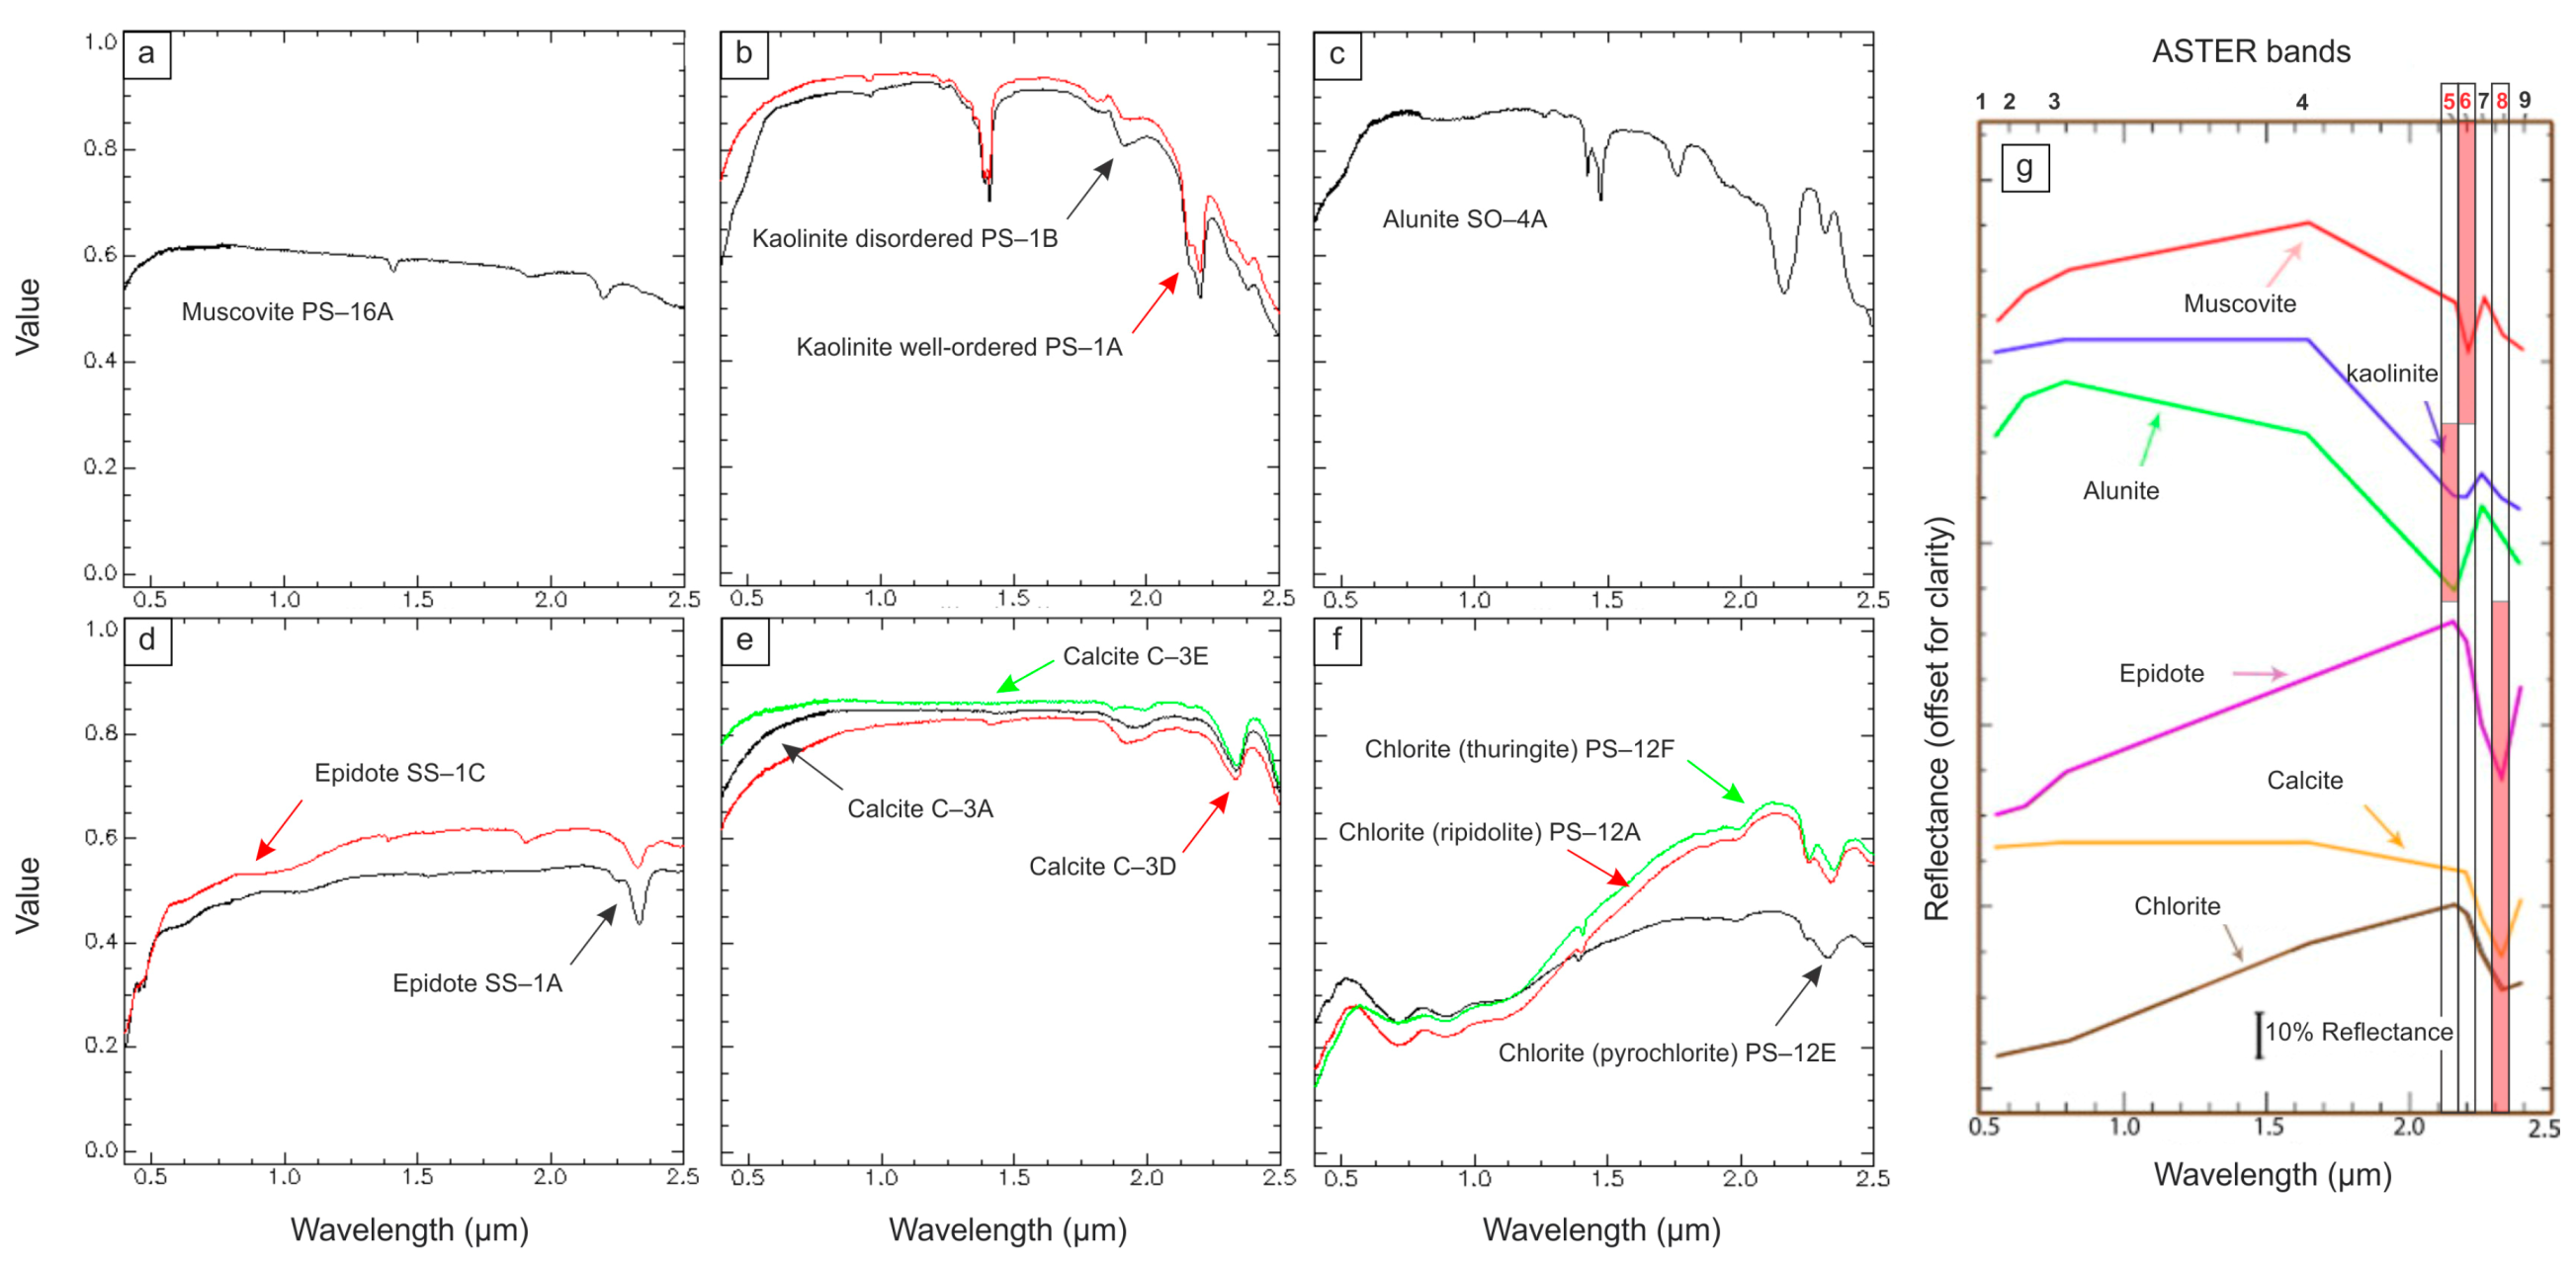
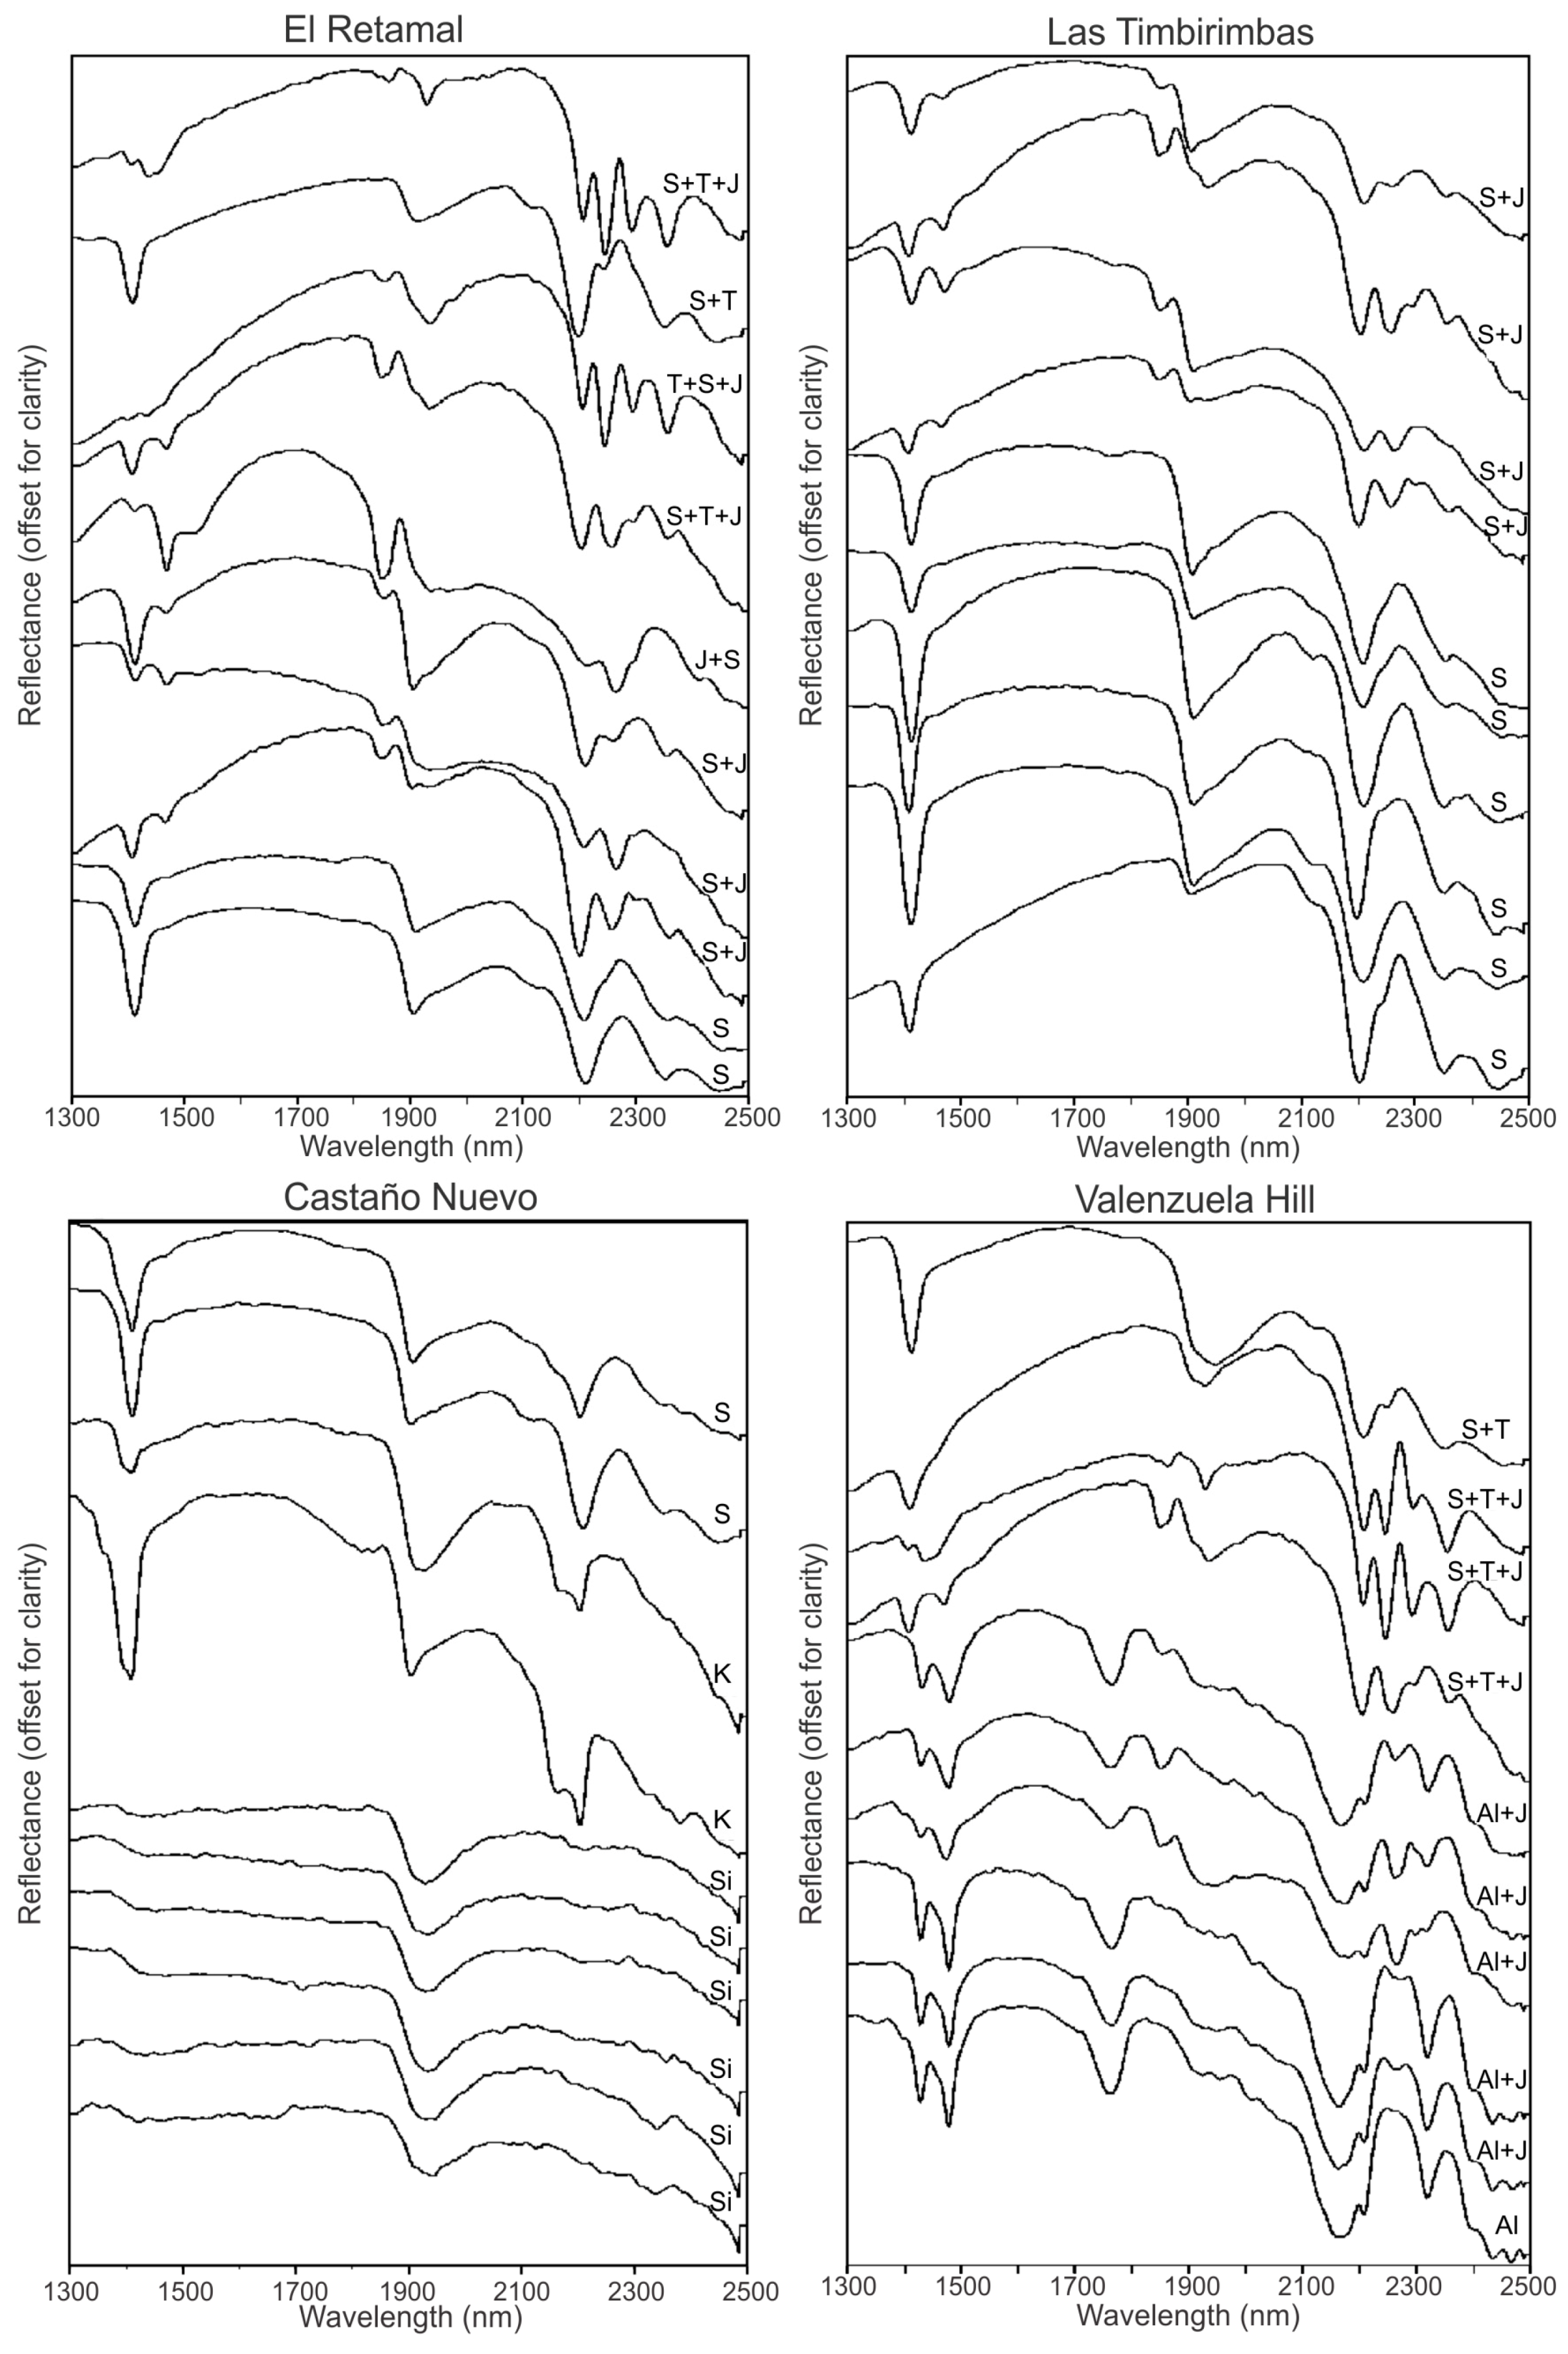
- Spectra published by Delendatti and Bastías (2001) and Delendatti (2003) [20,41], collected with PIMA-SP™ for the Castaño area. This instrument was made by Integrated and Spectronics Pty. Ltd., Australia. It measures signals from 1300 to 2500 nm wavelength. Despite PIMA having a circular window of 1 cm diameter, the measured area is a strip of 1 × 0.2 cm. To produce a spectrum it takes approximately 25 s to measure a spot and 25 additional seconds to measure an internal standard [45]. Delendatti and Bastías (2001) published a series of reflectance PIMA spectra for the most commonly detected hydrothermal mineral assemblages at El Retamal [41]. Delendatti (2003) expanded the available reference data with reflectance SWIR spectra for pure minerals and mineral assemblages at El Retamal, Las Timbirimbas, Castaño Nuevo and Valenzuela Hill [20].
- Over 600 air-dried, visually homogenous samples were measured every 500 m (approximately) across the San Francisco de los Andes district with TerraSpec™. This instrument was made by Analytical Spectral Devices, Inc. (ASD) Longmont, Colorado, USA and purchased in 2007 by CODES, University of Tasmania. TerraSpec collects data in a wider range (from 350 to 2500 nm) and from a larger area (2.5 cm diameter circle) than PIMA. The measurement time in TerraSpec depended on the darkness of each sample. The analyzed samples were medium to dark colored, as no sample had a strong argillic or sericitic alteration. The recommended measurement time it 4 to 6 s (light-colored samples), 6 to 10 s (medium-colored samples) and 10 to 20 s (dark samples) [45]. The optimization and white balance were conducted every 20 min approximately. Typically, three to four spots were measured on flat surfaces to consider any heterogeneity in the sample. The obtained mineral spectra collected with TerraSpec were interpreted with The Spectral Geologist™ (TSG) software version 7.
5. Results: ASTER Spectral and Spatial Processing
5.1. False Color Composite Images—RGB Band Combinations
5.2. Band Ratios and Logical Operators
5.3. SWIR and TIR Indices for Mineral and Lithologic Mapping
5.3.1. SWIR Indices
- OHI = (band 7/band 6) × (band 4/band 6)
- KLI = (band 4/band 5) × (band 8/band 6)
- ALI = (band 7/band 5) × (band 7/band 8)
- CLI = (band 6/band 8) × (band 9/band 8)
- OHIb = (band 7/band 5) × (band 4/band 5)
5.3.2. TIR Indices
- QI = (band 11/band 10)/(band 11/band 12)
- CI = band 13/band 14
- SI = band 12/band 13
5.4. Principal Component Analysis
6. Discussion: Field Verification
7. Conclusions
Supplementary Materials
Acknowledgments
Author Contributions
Conflicts of Interest
Appendix A

| Unit Name and Age | Description | Spatial Relationship with Other Units | Interpretations and/or Additional Comments |
|---|---|---|---|
| La Puentecilla Formation • Pliocene-Pleistocene age | A 600 m-thick sedimentary sequence of conglomerates, sandstones and siltstones | It unconformably overlies the Olivares Formation (Figure 3) | Alluvial fans shed from the active Andean orogenic front |
| Olivares Formation • Late Neogene: late Miocene to Pliocene age | A series of andesitic basalts and basaltic andesites | The 300 m-thick massive flows are unconformably underlain by Puntas Negras Formation and were intruded by dacitic to rhyodacitic bodies (Figure 3) | – |
| Lomas del Campanario Formation • Miocene age | Ignimbrites, andesites, tuffs, agglomerates, conglomerates and sandstones of up to 950 m thick | Unconformably overlies the Tocota Pluton to the west; Most of this unit accumulated on the eastern foothills of Frontal Cordillera (Figure 3) | – |
| Melchor Group: Puntas Negras Formation • Middle Miocene age • The middle-upper part of Punta Negra Formation yielded K–Ar ages of 15.6 ± 1.3 Ma and 13.4 ± 2 Ma (unspecified mineral) | 1500 to 2000 m-thick sequence of tuffs, ignimbrites, pyroclastic flows, agglomerates and lapilli; The pyroclastic materials are commonly intercalated with basaltic, andesitic, dacitic and rhyolitic flows | The volcaniclastic sequence is unconformably underlain by the Vizcachas Formation, Vizcachas Granodiorite, Choiyoi Group and Tocota Pluton (Figure 3) | • The younger sedimentary facies of the Melchor Group (i.e., Rio Mondaca Formation) are not exposed in the study area; • The Las Vizcachas Formation is considered to be the oldest unit of the Melchor Group by Heredia et al. (2002) [30] |
| Las Vizcachas Formation • Controversial Upper Permian age based on a 255 ± 5 Ma K–Ar whole-rock age in andesite [29] • Either Jurassic or Oligocene-Miocene age based on its stratigraphic position between the Choiyoi Group and the Melchor Group [26,31] | 300 to 400 m-thick package of massive andesitic flows with minor agglomerates and lithic tuffs | It is unconformably underlain by the Castaño and Vega de los Machos formations; It is unconformably overlain by Puntas Negras Formation (Figure 3) | More likely to be Tertiary in age as it has only been affected by Andean compressive tectonics; The strong unconformity separating the Choiyoi Group from Las Vizcachas Formation appears to reflect the fossilization of the prior extensional period |
| Granitic Intrusives • Triassic | A group of granites, leucomicrogranites and rhyolitic porphyries | The Manrique Pluton is the only Granitic Intrusive outcropping in the study area (Figure 3) | We consider the Triassic Granitic Intrusives part of the Mesozoic Intrusives |
| Mesozoic Intrusives: Las Vizcachas Granodiorite • Early Jurassic age based on a 200 ± 7 Ma K–Ar age (unspecified mineral) | A group of plutonic to subvolcanic igneous bodies associated with the Choiyoi Group. The Las Vizcachas Granodiorite and an andesite porphyry are the largest Mesozoic intrusives exposed in the study area (Figure 3) | This N-trending tonalite to granite complex, to the NW of the andesite porphyry, has intruded the Vega de los Machos and Castaño formations, and it is covered by volcanic rocks from the Tertiary Melchor Group to the north (Figure 3) | Based on Pearce tectonic setting discrimination diagrams this unit formed in a calc-alkaline continental magmatic arc |
| Mesozoic Intrusives : Andesite porphyry • Triassic age | Intruded the Choiyoi Group, particularly the Vega de los Machos and Castaño formations (Figure 3) | The genetic relationship with the Manrique granitic pluton to the south is unclear, because profuse hydrothermal alteration masks the contact between both Mesozoic intrusives [29] | |
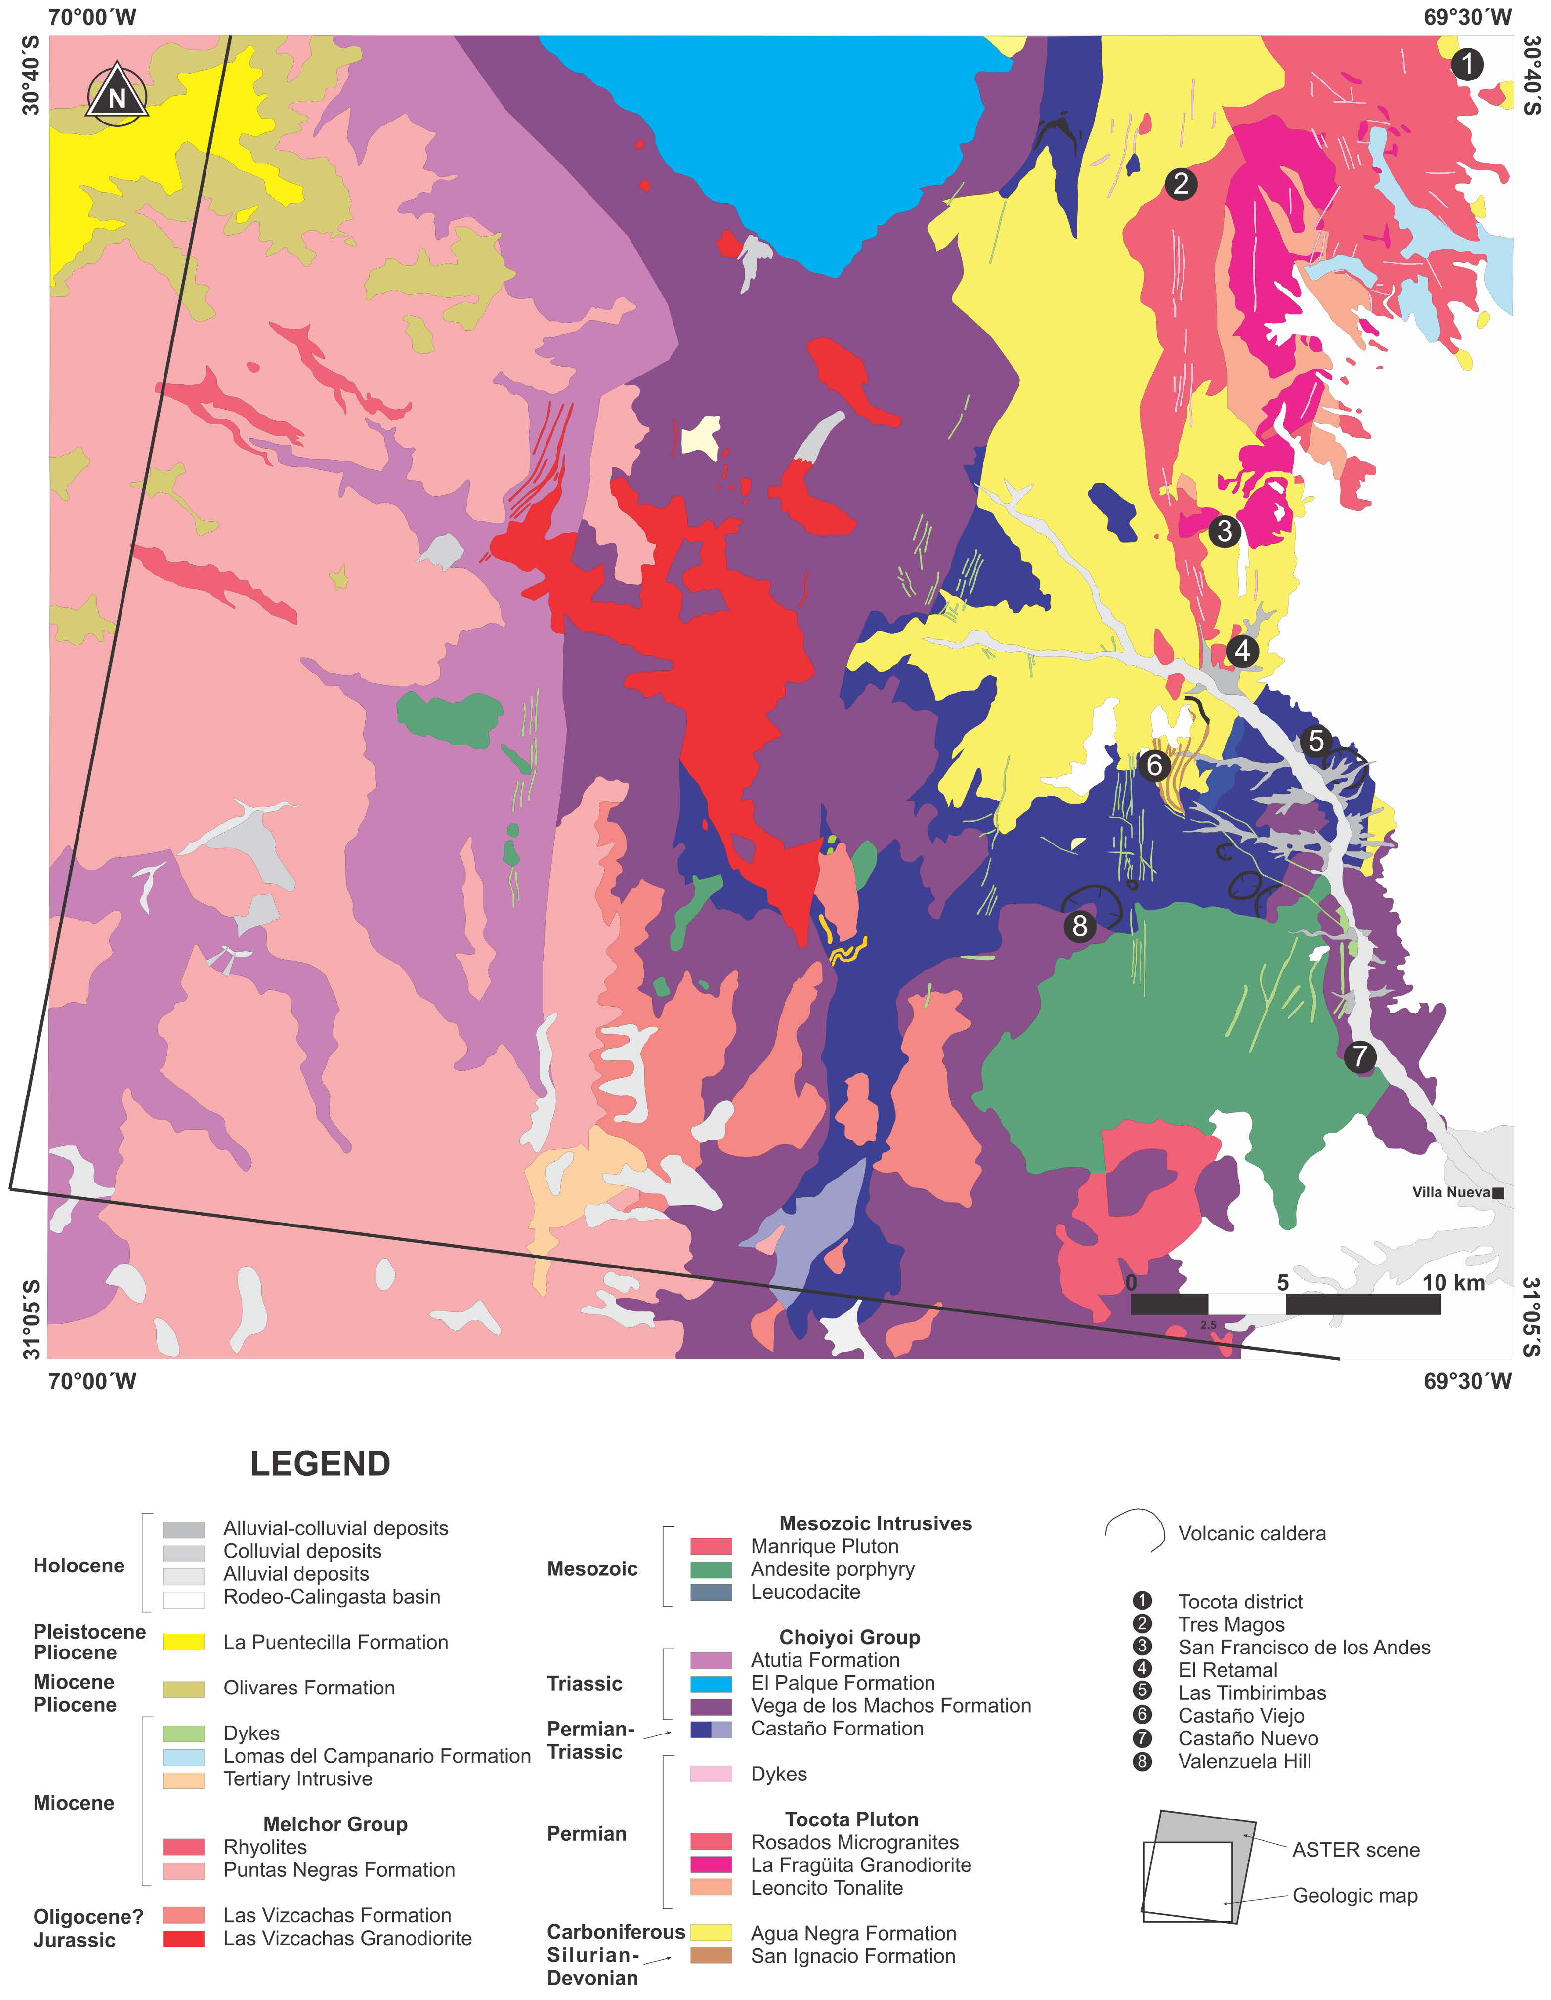
| Choiyoi Group: El Palque Formation • Absolute ages range from 267 ± 5 to 233 ± 10 Ma | An acidic volcanic sequence with mainly rhyolitic and rhyodacitic flows, ignimbrites, agglomerates and tuffs | A 1500 m-thick sub-horizontal rhyolitic flow is exposed as a triangular outcrop between the San Francisco and Las Leñas rivers (Figure 3) | • The Choiyoi Group accumulated during a rifting event associate with normal faulting caused by the beginning of the rupture of Gondwana, and its thickness decreases eastwards due to the Tocota Pluton horst; • Collapse calderas have been documented to the south of the Castaño River in the Castaño Formation (Figure 3), which represent the Choiyoi Group’s volcanic edifice roots located on top of buried magmatic chambers; They correlate with the exposed Tocota Pluton to the north of the river |
| Choiyoi Group: Vega de los Machos Formation • Permo-Triassic unit: • Lower Permian age based on a 289 ± 19 Ma Rb–Sr whole-rock isochron age and a 288 ± 5 Ma K–Ar plagioclase age • Middle Triassic age based on 243.8 ± 5 and 234.6 ± 4.5 Ma K–Ar ages (unspecified mineral) | Andesites, breccias, agglomerates, andesitic tuffs, ignimbrites and minor latites and dacites | It overlies the Castaño Formation (Figure 3) | |
| Choiyoi Group: Castaño Formation • Permian age | Sequence of polymict orthoconglomerate intercalated with agglomerates, tuffs, and andesitic flows; Sandstones and siltstones with volcanic components, andesites and minor rhyodacites to rhyolites are common in the middle levels; Limestones with chert nodules intercalated in the volcanic facies characterize the upper levels | The volcano-sedimentary Choiyoi Group unconformably overlies the Agua Negra Formation (Figure 3) | |
| Tocota Pluton: The Leoncito Tonalite, La Fragüita Granodiorite, Rosados Granite, and related N-oriented dykes • Permian based on Rb–Sr ages on primary biotite-whole rock pairs (269.1 ± 1 to 267.2 ± 1 Ma; Roadian to Wordian stage), and U–Pb zircon ages (Kungurian to Wordian stage) | North-elongated plutonic to sub-volcanic complex with a rough centripetal compositional zonation, where the younger and more acidic facies occur toward the center | Intruded the Agua Negra Formation (Figure 3); It is the southernmost extension of the Colangüil Batholith | Post-orogenic extensional pluton |
| Agua Negra Formation • Upper Carboniferous to lower Permian age based on fossil plants (Rhacopteris ovate and Gondwanidium platinum), and marine invertebrate (Cancrinella sp. and Orthoceras sp.) assemblages | Shales, sandstones, conglomerates and limestones | The 2000 m-thick sedimentary sequence is unconformably overlaying the San Ignacio Formation (Figure 3) | The Carboniferous sediments were deposited in a back arc basin where deltaic system transitioned to open marine conditions; whereas the Permian sequence was accumulated in a retroarc foreland basin |
| San Ignacio Formation • Siluro-Devonian age based on spore type in the marly facies | Limestone, dolomite and marly-limestone intercalated with shales | Very localized outcrops south of the Castaño River (25 to 70 m- thick overthrust sequence); Basement of the study area (Figure 3) | A shallow-water carbonate platform |
| District, Deposit Type and Occurrence | Location | Common Ore and Gangue Minerals | Grades | Host Rocks | Hydrothermal Alteration |
|---|---|---|---|---|---|
| Castaño Viejo • Polymetallic vein system • Center-south: Base metal-rich veins have an approximate E-trend; Only San Nicolas and Animas veins are particularly enriched in silver • North: Silver-rich San Ignacio vein system and neighboring veins have variable orientations | Located to the south of the Castaño River (Figure 3) | Argentiferous galena, sphalerite, chalcopyrite, chalcocite, covellite, tetrahedrite and pyrite; Carbonates and quartz are the main gangue minerals | • Center- south: Only the San Nicolas and Animas veins are Ag-rich • North: Silver-rich San Ignacio vein system (2–6 kg/t Ag) • The inferred and indicated reserves at Castaño Viejo are 0.8 mt @ 3–9% Pb, 1–7.4% Zn, 114–507 g/t Ag, < 1% Cu and < 2 g/t Au | • Center-South: The Permo- Triassic volcaniclastic rocks of Castaño Formation • North: Carboniferous sedimentary rocks of Agua Negra Formation and locally both the the Siluro- Devonian San Ignacio Formation and the Permo- Triassic San Ignacio rhyodacite | • To the east of the N-trending cluster of Triassic rhyolitic dykes, there is a distinctive NNE hydrothermal alteration zone: The 10 km long and 6 km width alteration domain extends from Valenzuela Hill to El Retamal (Figure 3); This zone is characterized by silicic, pyritic and sericitic alteration proximal to the vein system and distal propylitic alteration • Geochemical assays from Secretaria Minera de la Nación identified several Cu and Mo anomalies; To the north, west and south of the Castaño Viejo district, alteration zones with consistent Cu, Mo, Pb and Zn geochemical anomalies were documented by Gonzalez Amorin et al. (1968, 1969) |
| Castaño Nuevo • High grade, low sulfidation epithermal Au–Ag veins • Between 1890 and the 1950s, three veins were exploited at Castaño Nuevo: 1- Dios Protége, a NNE-trending vein of > 370 m length and 3 m wide, which likely extends north across the Castaño River; 2- The NW-trending St Agustin vein system, located 700 m west of Dios Protége, has been mined over 150 m strike, with widths of 1–3 m; 3- Southwest from St Agustin is the San Pedro vein with limited historical mining | Located 7 km downstream from Las Timbirimbas (Figure 3) | Quartz–adularia with late amethyst and very low sulfide contents | • Argentinean government records indicate an average grade of 20 g/t Au [34] • In December 2009, Troy Resources Argentina Ltd acquired 100% legal right over the Castaño Nuevo project; Ten assays yielded gold grades with values below 10 g/t Au except for a 15 cm sample containing 27 g/t Au. The gold–silver ratio is about 1:1 [34] | Choiyoi Group: Vega de los Machos Formation | The quartz vein systems are associated with argillic and silicic alteration zones to the south; According to Troy Resources Limited’s website, these large zones of argillic alteration and silicification represent hot spring-style hydrothermal alteration that occurred at the paleosurface, implying a shallow epithermal level; The entire district, including the quartz vein system to the north and the hydrothermal alteration to the south, covers an area of 2.5 x 2.5 km |
| San Francisco de los Andes (SFDLA) • Magmatic- hydrothermal tourmaline-cemented breccia pipes and veins are spatially associated with the Tocota Pluton; • Southern domain: San Francisco de los Andes, Amancay, Cortaderas, Esmeralda, Pingo, Martina Chapanay and La Fortuna-Chorillo mines; • Central domain: Los Tres Magos, Mary, Santa Barbara, Larry, Mirkokleia, Rodophis, San Roque and Flor de los Andes deposits; • The Northern domain includes the Dos Amigos and Ranqueles mines and it is comparable with the As-rich Tocota district described by Wetten (1999) [39] | The district extends for over 30 km to the north of the Castaño River (Figure 3) • The San Francisco de los Andes mine is located 5 km north from the Castaño River, and the Tres Magos mine 11.5 km NNW from San Francisco de los Andes (Figure 3) | • San Francisco de los Andes is the largest Bi deposit hosted in a hydrothermal breccia complex in Argentina; It has complex Bi–Cu–Pb–Zn–Mo–As–Fe–Ag–Au mineralization, including native elements, sulfides, and sulfosalts; • At Tres Magos, the mineralization hosted in the granodiorite occurs as supergene Bi- and Fe-arsenates coatings | • The SFDLA deposit was sporadically mined (1940s – 1980s); Production reached 112 t of ore and bismuth concentrates; 2,420 t of mineral with 3–6% Cu and 1.2–4.5% Bi [36] • In 1990, Aguilar Mining Company estimated a resource of 0.15 Mt with 5% Cu, 1.2% Bi, 200 g/t Ag for the 35 m thick supergene zone; Although the total depth of the breccia complex is unknown, it was identified a hypogene zone with grades of 0.8% Cu, 0.6% Bi, 80 g/t Ag, and 4 g/t Au at depths between 35 and 80 m | The Bi–Cu–Au mineralized structures are hosted within the Tocota Pluton and adjacent sedimentary rocks of the Agua Negra Formation • At Tress Magos, the geological features are similar to the ones at San Francisco de los Andes, with tourmaline-bearing quartz veins and aplitic dykes crosscutting the granodiorite and sedimentary units | • At San Francisco de los Andes deposit, hydrothermal alteration around the tourmaline breccia complex is characterized by scarce mm-thick epidote veins with associated chlorite; Tourmaline, magnetite and K-feldspar occur as veins or hydrothermal replacement in more restricted areas; Illitic and silicic alteration is restricted to areas next to the breccia bodies or veins [21] • At Tres Magos, kaolinite-rich argillic altered granodiorite was documented by Angelelli (1984) [36] |
| Tocota • As-rich veins • Three mineralized structures: 1- Sub-vertical arsenopyrite – pyrite – quartz – tourmaline-rich veins commonly striking E (NE and NW locally), 5–60 cm width and < 50 m depth; 2- A NW-trending quartz – tourmaline- cemented breccia dyke is 10 to 30 m thick and 1300 m long; 3- Small tourmaline-cemented breccia outcrops (a few m long) associated with the vein system | Located on the eastern limit of the Frontal Cordillera, 5 km east of Tocota town (Figure 3); The most important mines of the district include Krammer and Colo-Colo, close to Tocota, as well as Ranqueles and Chimborazo in the northern part of the district | The principal ores extracted were Cu–As–Co-rich supergene minerals • Common hypogene minerals in the vein system are pyrite, chalcopyrite, Co-rich arsenopyrite, pyrrhotite, marcasite, cassiterite, sphalerite, gold, quartz and tourmaline; Supergene minerals include covellite, chalcocite, digenite, arsenates, jarosite and goethite; • The NW-trending breccia dyke contains quartz, tourmaline, arsenopyrite, jarosite, hematite and supergene copper minerals | As-rich veins were mined between 1943 and 1952; The average grades ranged between 20 and 30% As; The minable reserves exceed more than 37,500 t, equivalent to 5000 t As; The annual As productions for 1943 and 1944 were 1050 t and 850 t As respectively • The maximum gold content in the vein system is 5 g/t and in the breccia facies 0.34 g/t | The mineralized structures are hosted in the Agua Negra Formation and locally close to the contact with the Tocota Pluton | • Moderate to low Intensity • Potassic, phyllic, local intermediate argillic and more regional propylitic alteration zones • Lara et al. (1993) linked the NW-trending breccia dyke with blind porphyry copper deposits • A buried mineralized porphyry body was interpreted based on induced polarization (IP) anomaly; Concentric alterations close to Krammer: strong quartz – sericite – jarosite-rich phyllic alteration in the center, grades outwards to an Intermediate alteration and distal epidote – chlorite-rich propylitic alteration [40] |
| El Retamal • Porphyry-style mineralization, which occurs as veins and disseminated ore | Located to the north of the Castaño River (Figure 3), after the confluence of the Atutia and San Francisco rivers | Supergene Cu sulfates and hypogene molybdenite identified at the surface (Quebrada Seca), and hypogene chalcopyrite, molybdenite and pyrite at depth (both disseminated and veinlets); Bornite, chalcocite, aresnopyrite and marcasite are less abundant, and disseminated native gold is rare | Selected intervals in diamond drill cores yielded high Au grade of up to 6 g/t | Aguan Negra Formation and the Tocota Pluton | The hydrothermal alteration zone covers 7 km2 and represents the NNE extension of the Castaño Viejo alteration system; The Leoncito Granodiorite and Agua Negra Formation are regionally altered to sericite; Strong silicic alteration clusters and very localized potassic alteration are common, but less abundant than the sericitic alteration; Quartz – tourmaline alteration was overprinted by late stage illite, quartz, pyrite, jarosite, goethite and traces of hematite |
| Las Timbirimbas • Geochemical and geophysical anomalies | Located along the Castaño river banks (Figure 3), downstream from El Retamal and upstream from Castaño Nuevo | Geochemical and geophysical anomalies detected, but scarce mineralization has been documented (quartz, pyrite and sulfates) | --- | Choiyoi Group: Castaño Formation | Andesites, tuffs and rhyodacites have been moderately altered to sericite, secondary quartz and jarosite; This hydrothermal alteration is superimposed on early formed tourmaline veins |


| ASTER Products | Lithologic Features Detected | Hydrothermal Alteration Features Detected | Additional Comments |
|---|---|---|---|
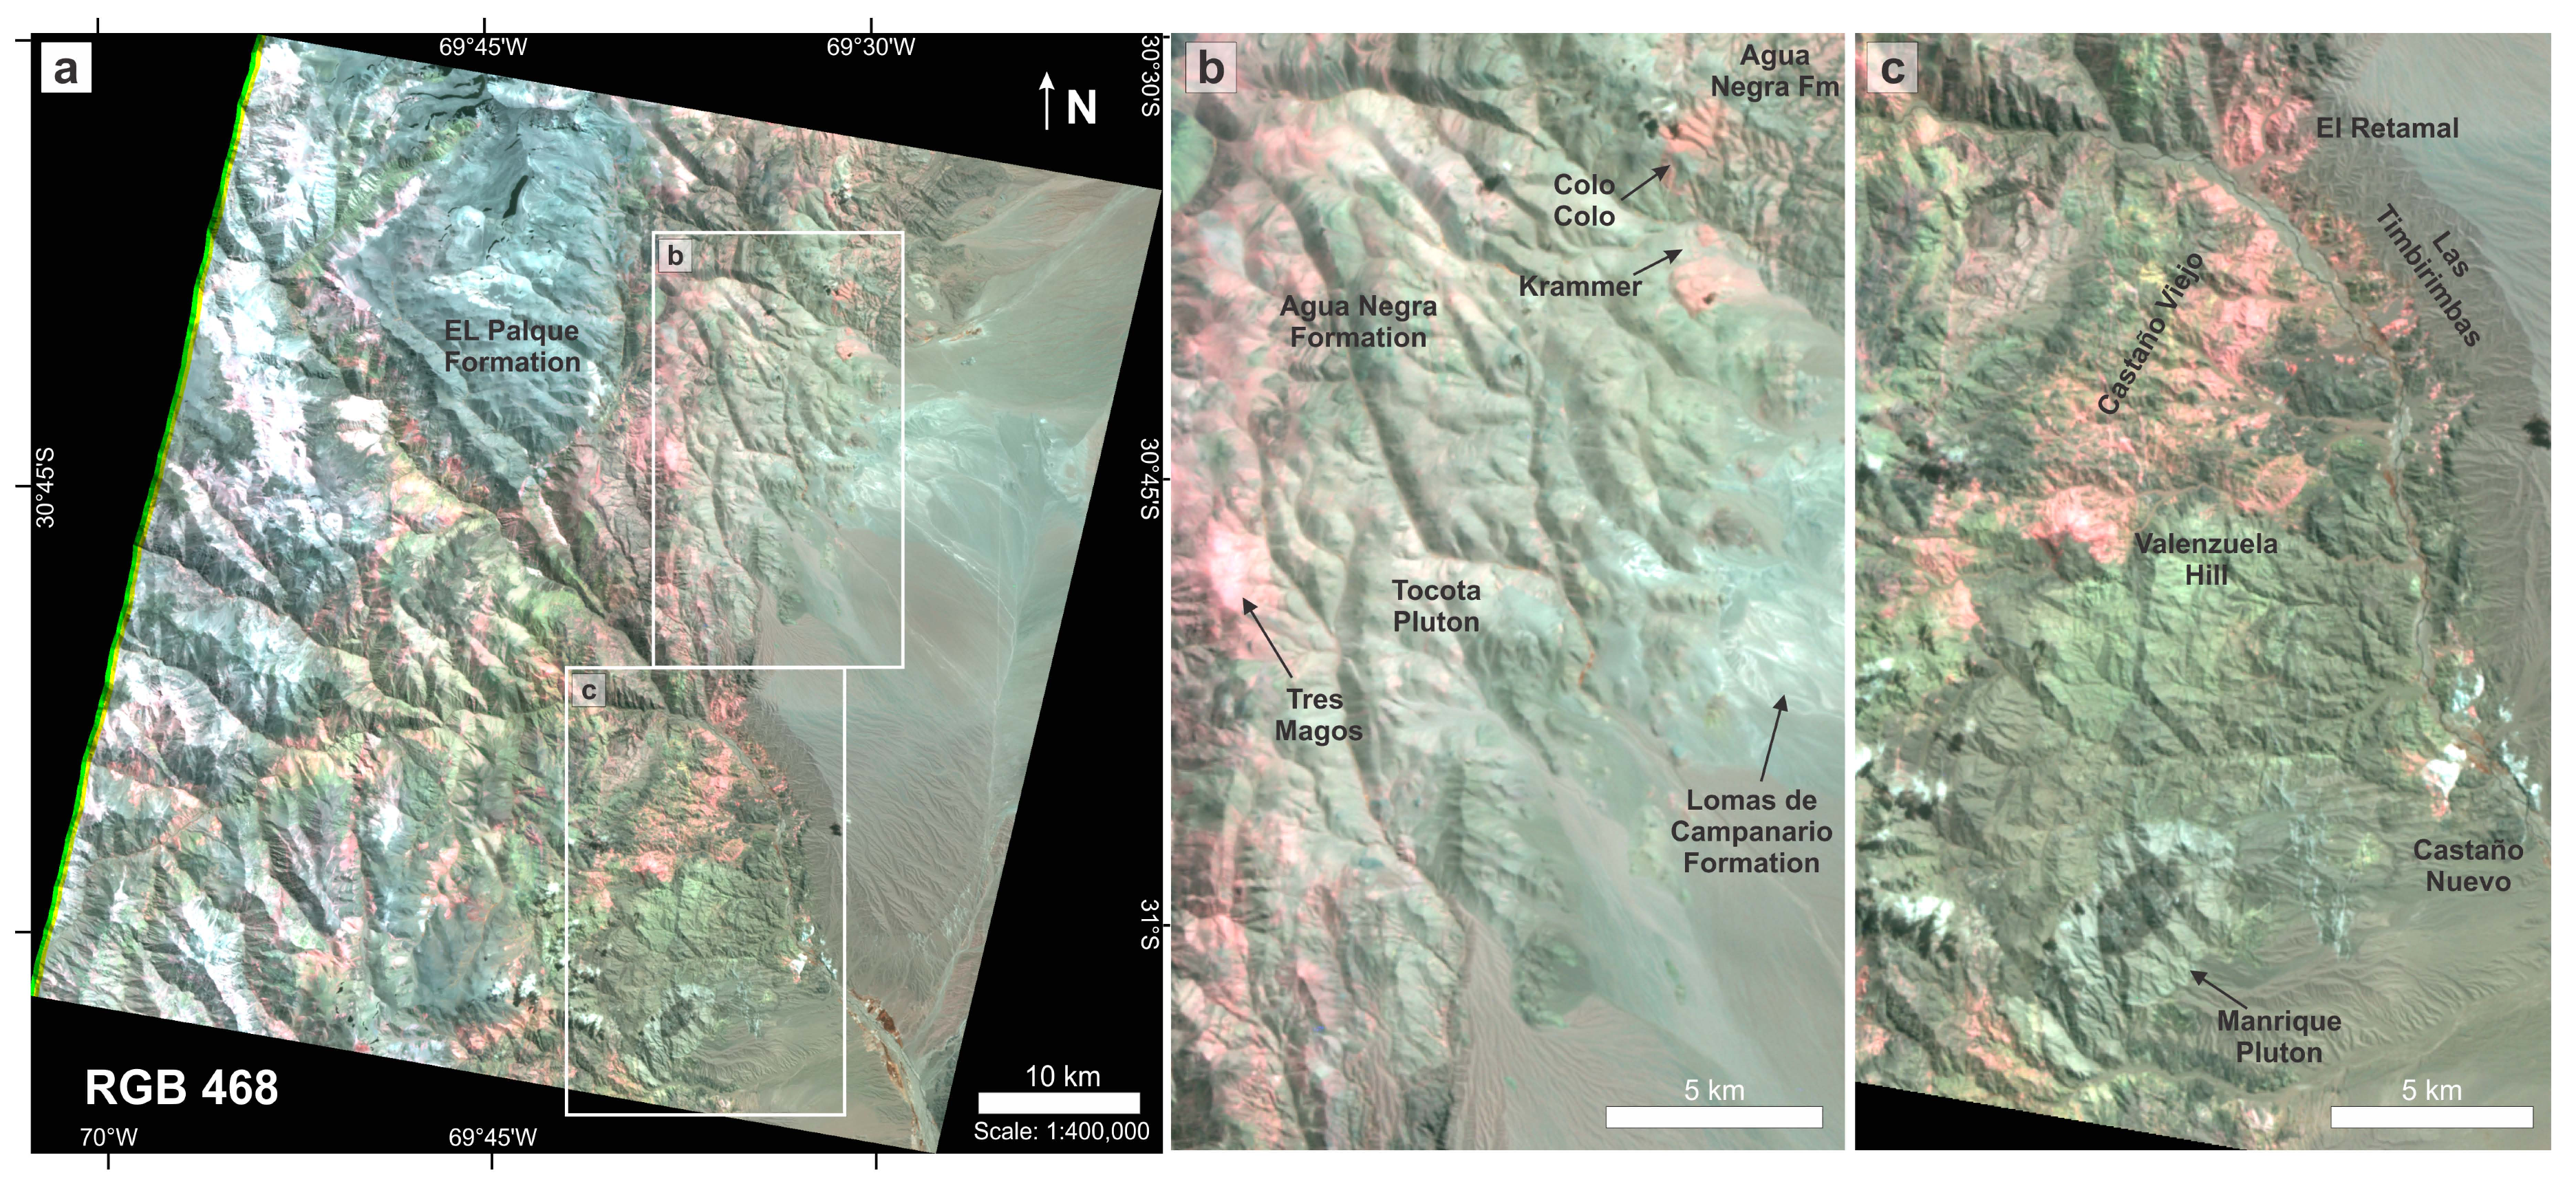
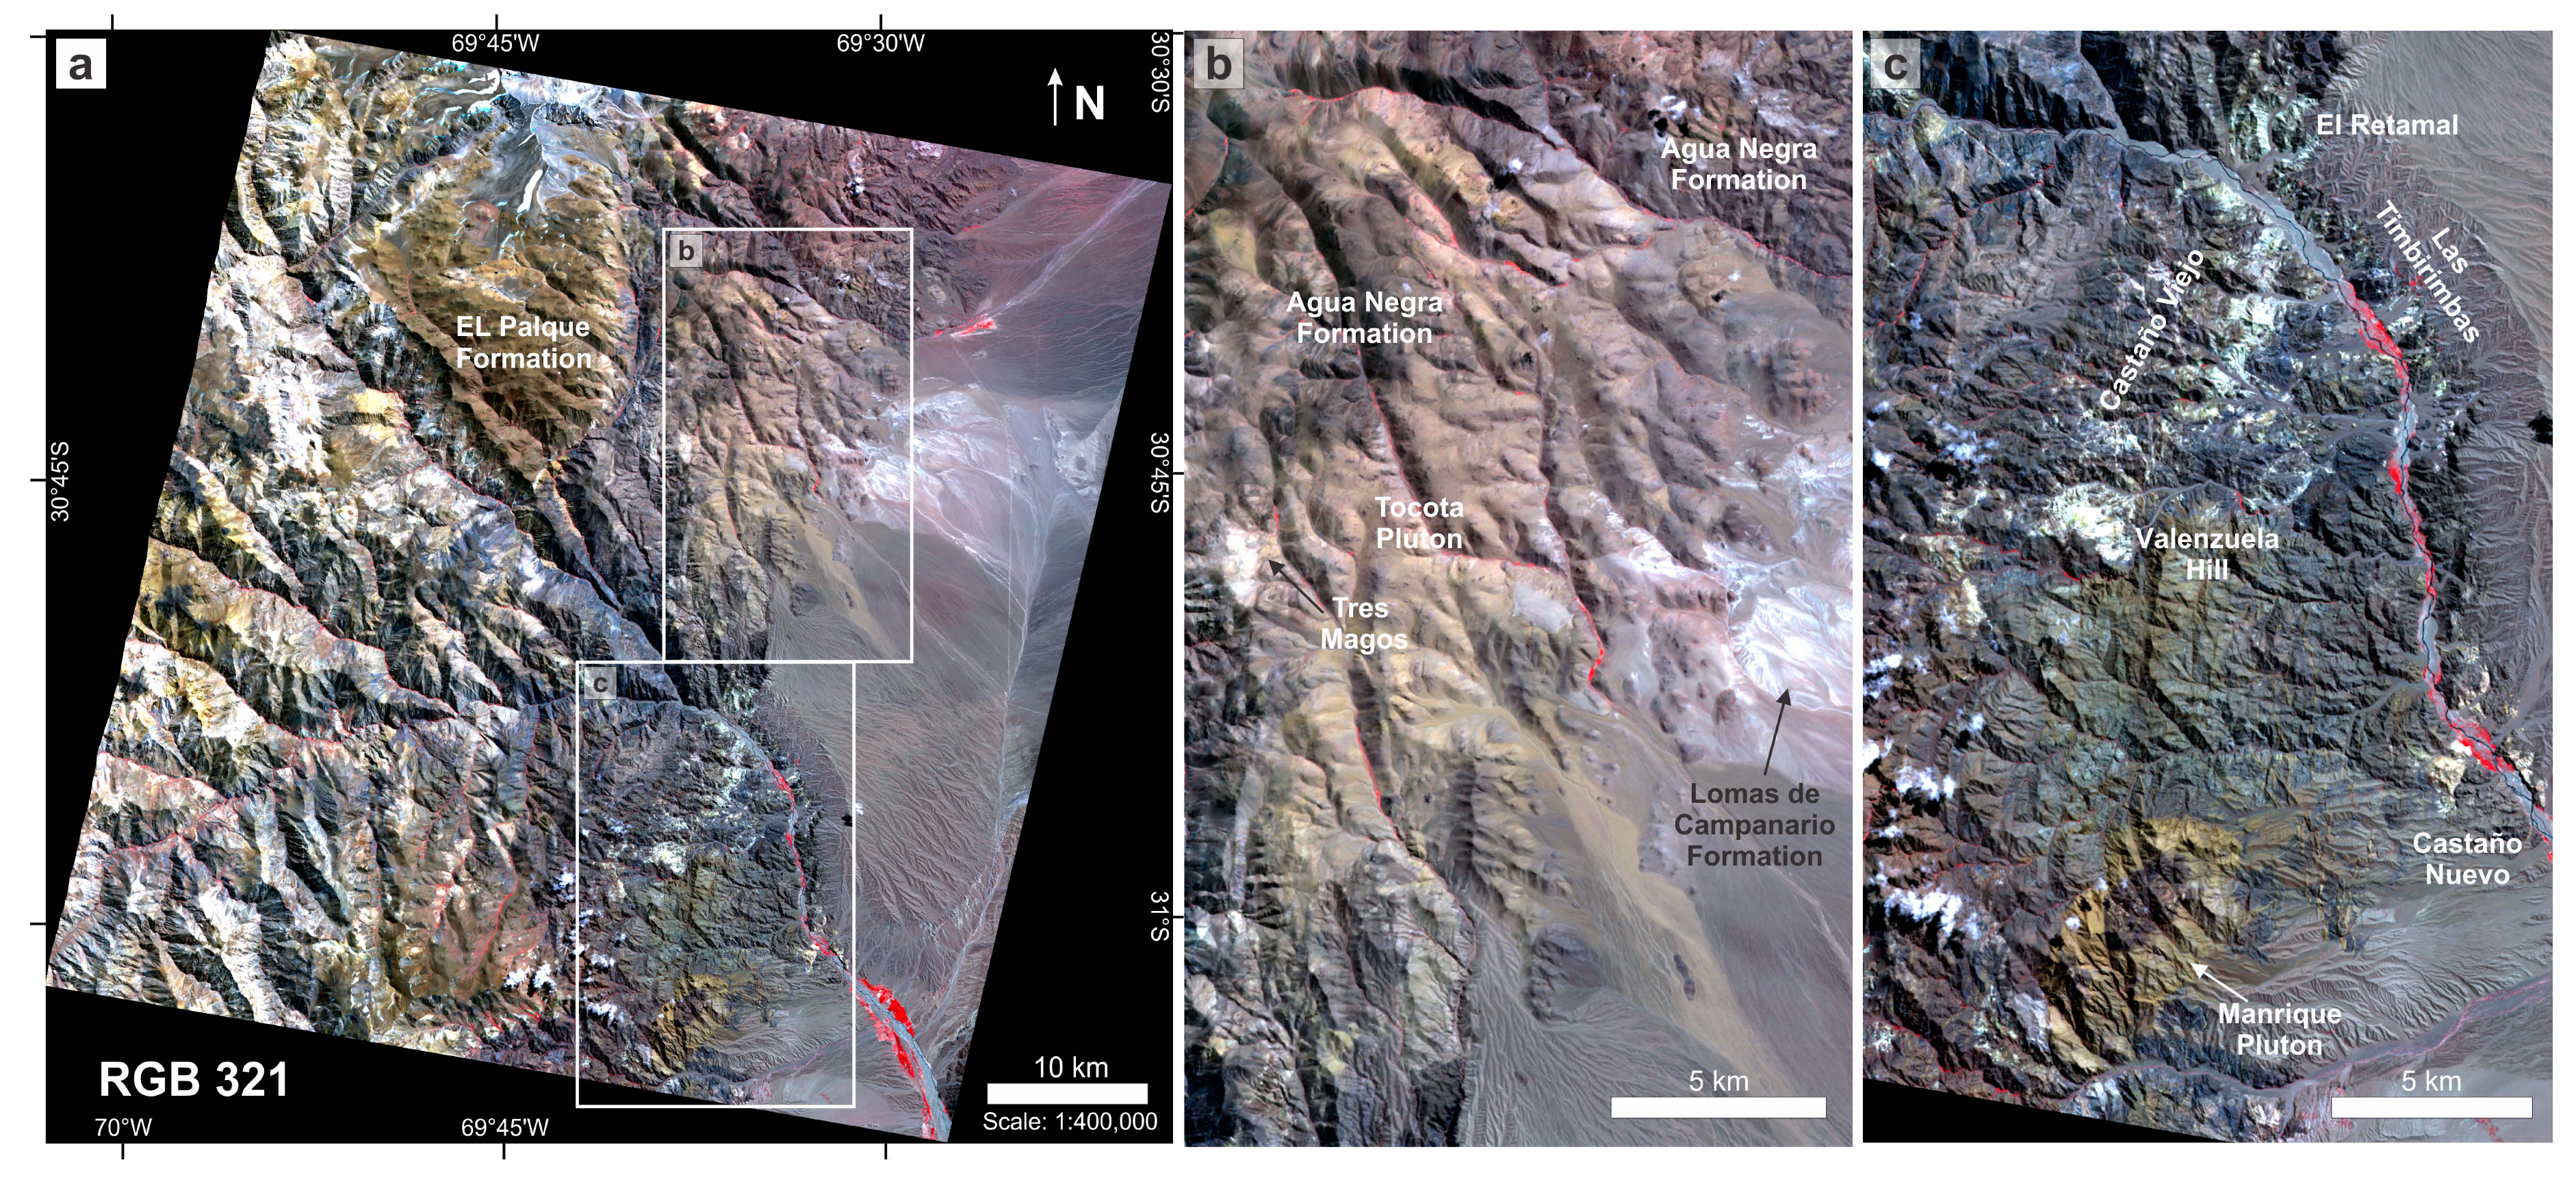
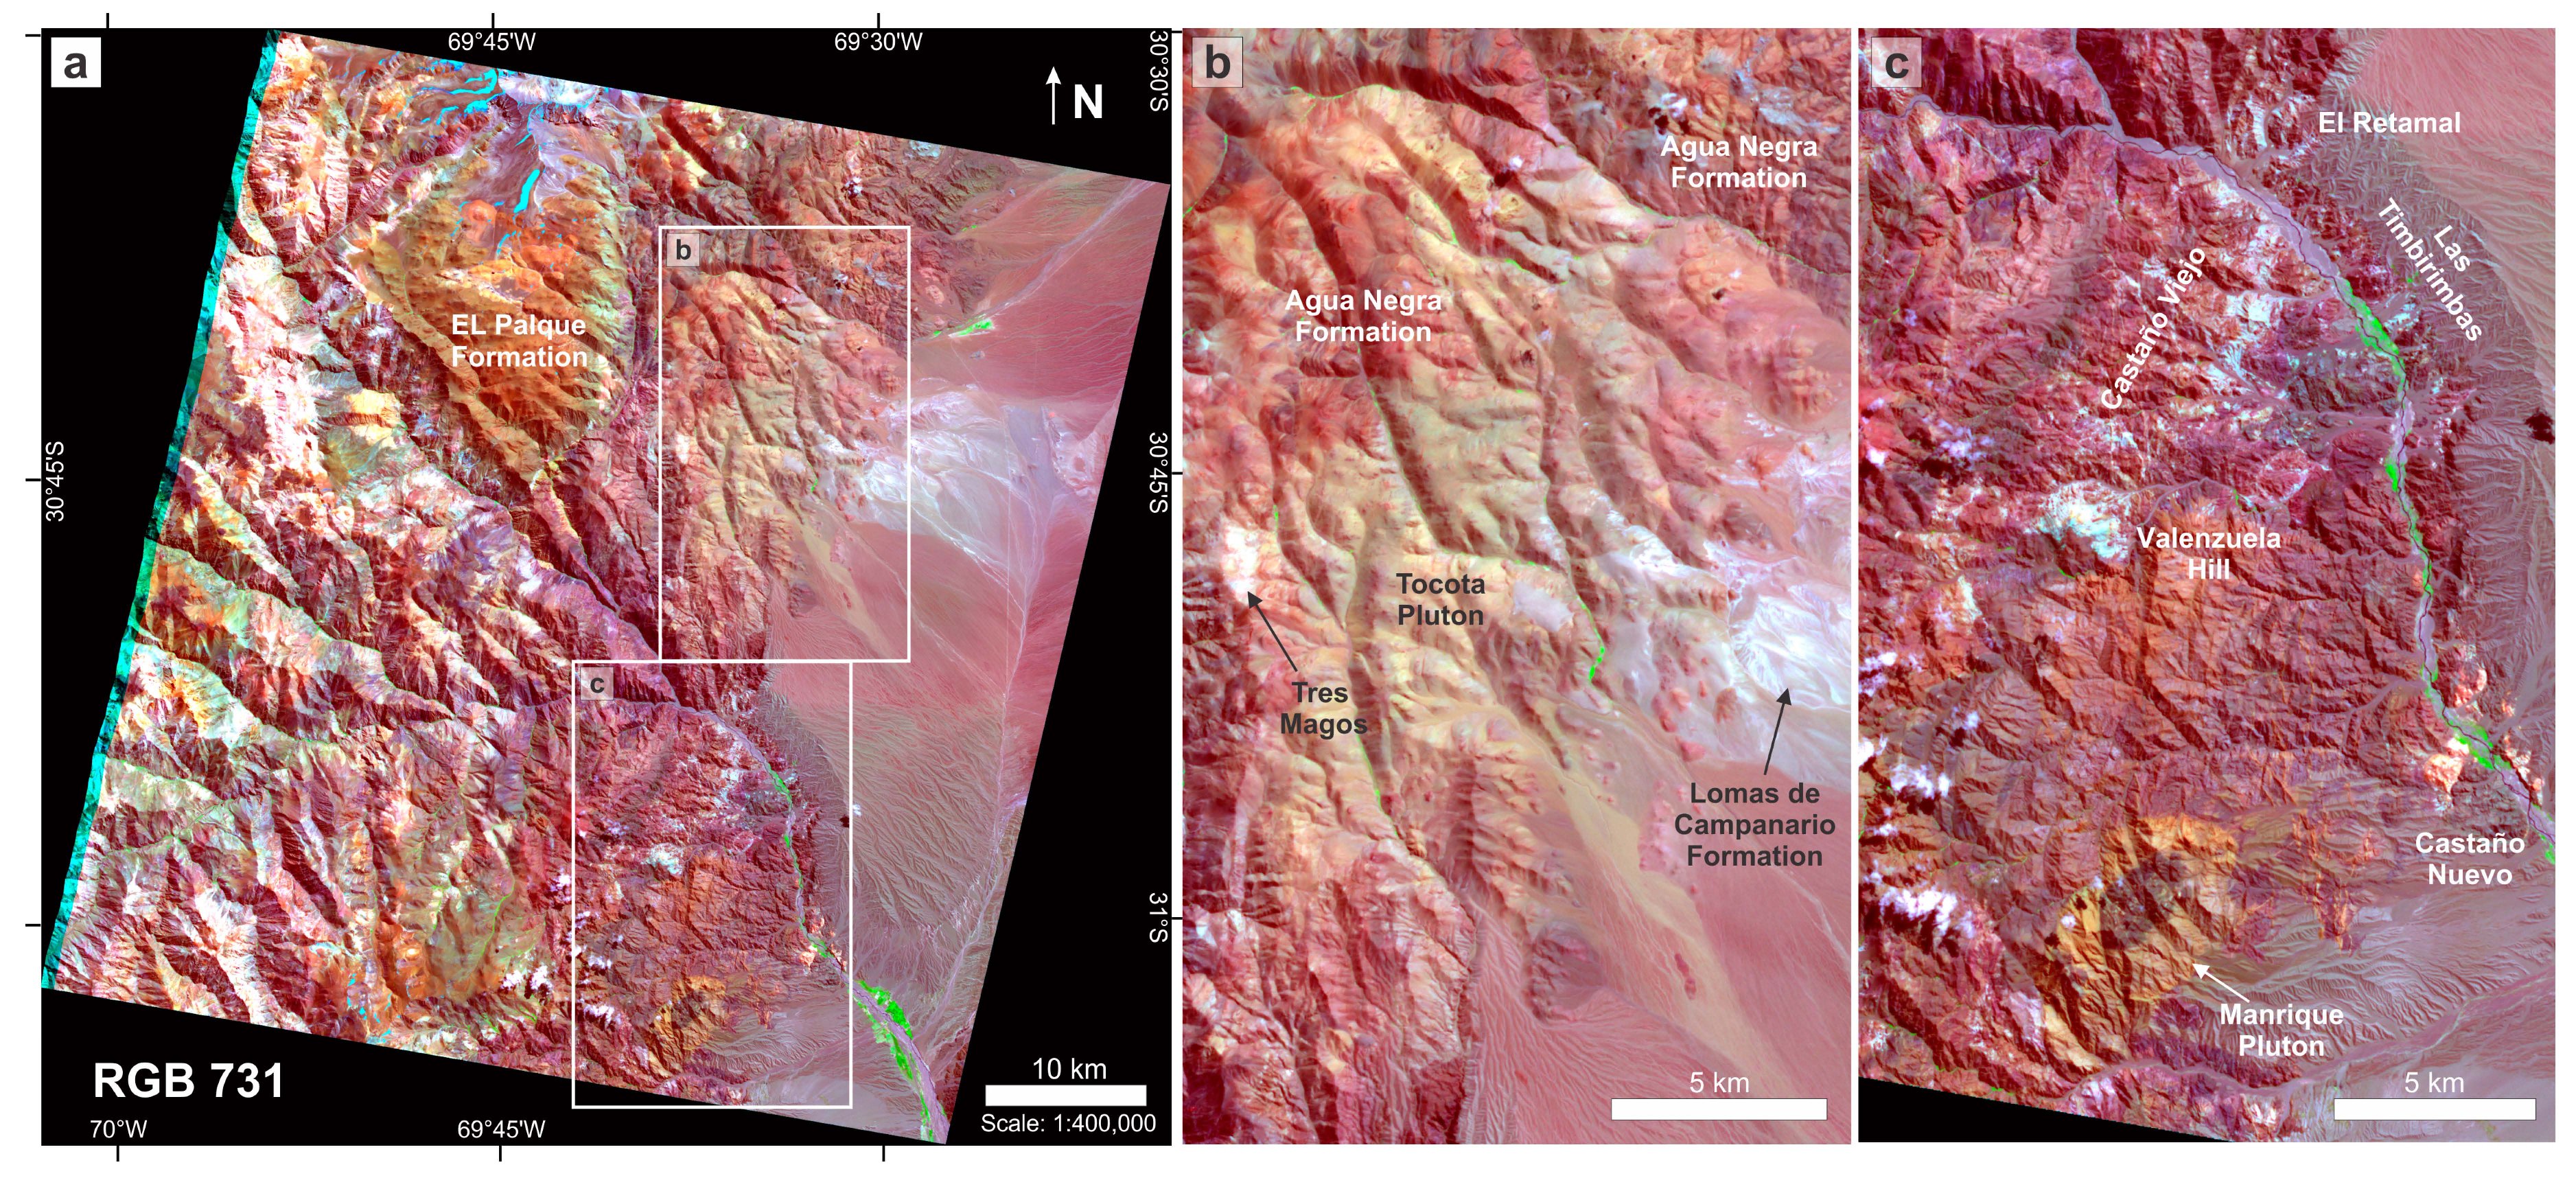
| Figure A1 – False color composite image: Bands 3 2 1 (RGB) | • Felsic units: El Palque Formation (light brown), Tocota Pluton (orange brown), Loma del Campanario (white), Manrique Pluton and rhyolitic dykes (orange yellow) • Broadly detected sedimentary units: Agua Negra Formation (dark brown) | • Argillic – phyllic alteration (whitish color): Tres Magos, Valenzuela Hill, Castaño Viejo , El Retamal, Las Timbirimbas, and locally Castaño Nuevo • Silicic alteration (whitish color): Castaño Nuevo | • These three ASTER color composite band combinations (RGB) best detected the location of certain geologic units, particularly felsic rocks. They roughly detected hydrothermal alteration zones • The false color composite image 468 is the most comprehensive RGB band combination to detect hydrothermal alteration as it clearly differentiated argillic – phyllic alteration form silicic alteration; It was the only RGB band combination able to highlight Krammer and Colo-Colo argillic hydrothermal alteration zones; and to roughly detect argillic – phyllic alteration zones (pink) affecting the Vega de los Machos Formation (outline surrounding El Palque Formation), and alteration patches to the west of known ore deposits • The three images clearly detected modern alluvial deposits with vegetation and non-hydrothermal clays and/or micas, particularly evident in floodplain adjacent to the Castaño River (e.g., Villanueva village), and more localized areas (e.g., Tocota village and creeks): 321 (bright red), 731 (bright green), 468 (dark brown) |
| Figure A2 – False color composite image: Bands 7 3 1 (RGB) | • Felsic units: El Palque Formation (orange brown), Tocota Pluton (greenish grey), Loma del Campanario (bluish white), Manrique Pluton and rhyolitic dykes (light brown) • Broadly detected sedimentary units: Agua Negra Formation (reddish maroon) | • Tres Magos argillic alteration zone (white) • Argillic – phyllic alteration (light blue): Valenzuela Hill, Castaño Viejo, El Retamal, Las Timbirimbas, and locally Castaño Nuevo • Silicic alteration (pink orange): Castaño Nuevo | |
| Figure 5 – False color composite image: Bands 4 6 8 (RGB) | • El Palque Formation (teal), Tocota Pluton (light green), Loma del Campanario (whitish green), Agua Negra Formation (dark green), Manrique Pluton and rhyolitic dykes (greenish blue) • Poor color contrast between units prevent from a clear boundary detection (e.g., Tocota Pluton, Agua Negra and Lomas del Campanario Formation) | • Tres Magos argillic alteration zone (whitish pink) • Argillic – phyllic alteration (pink): Colo-Colo, Krammer, Valenzuela Hill, Castaño Viejo , El Retamal, Las Timbirimbas, and Castaño Nuevo • Silicic alteration (white to light blue): Castaño Nuevo | |
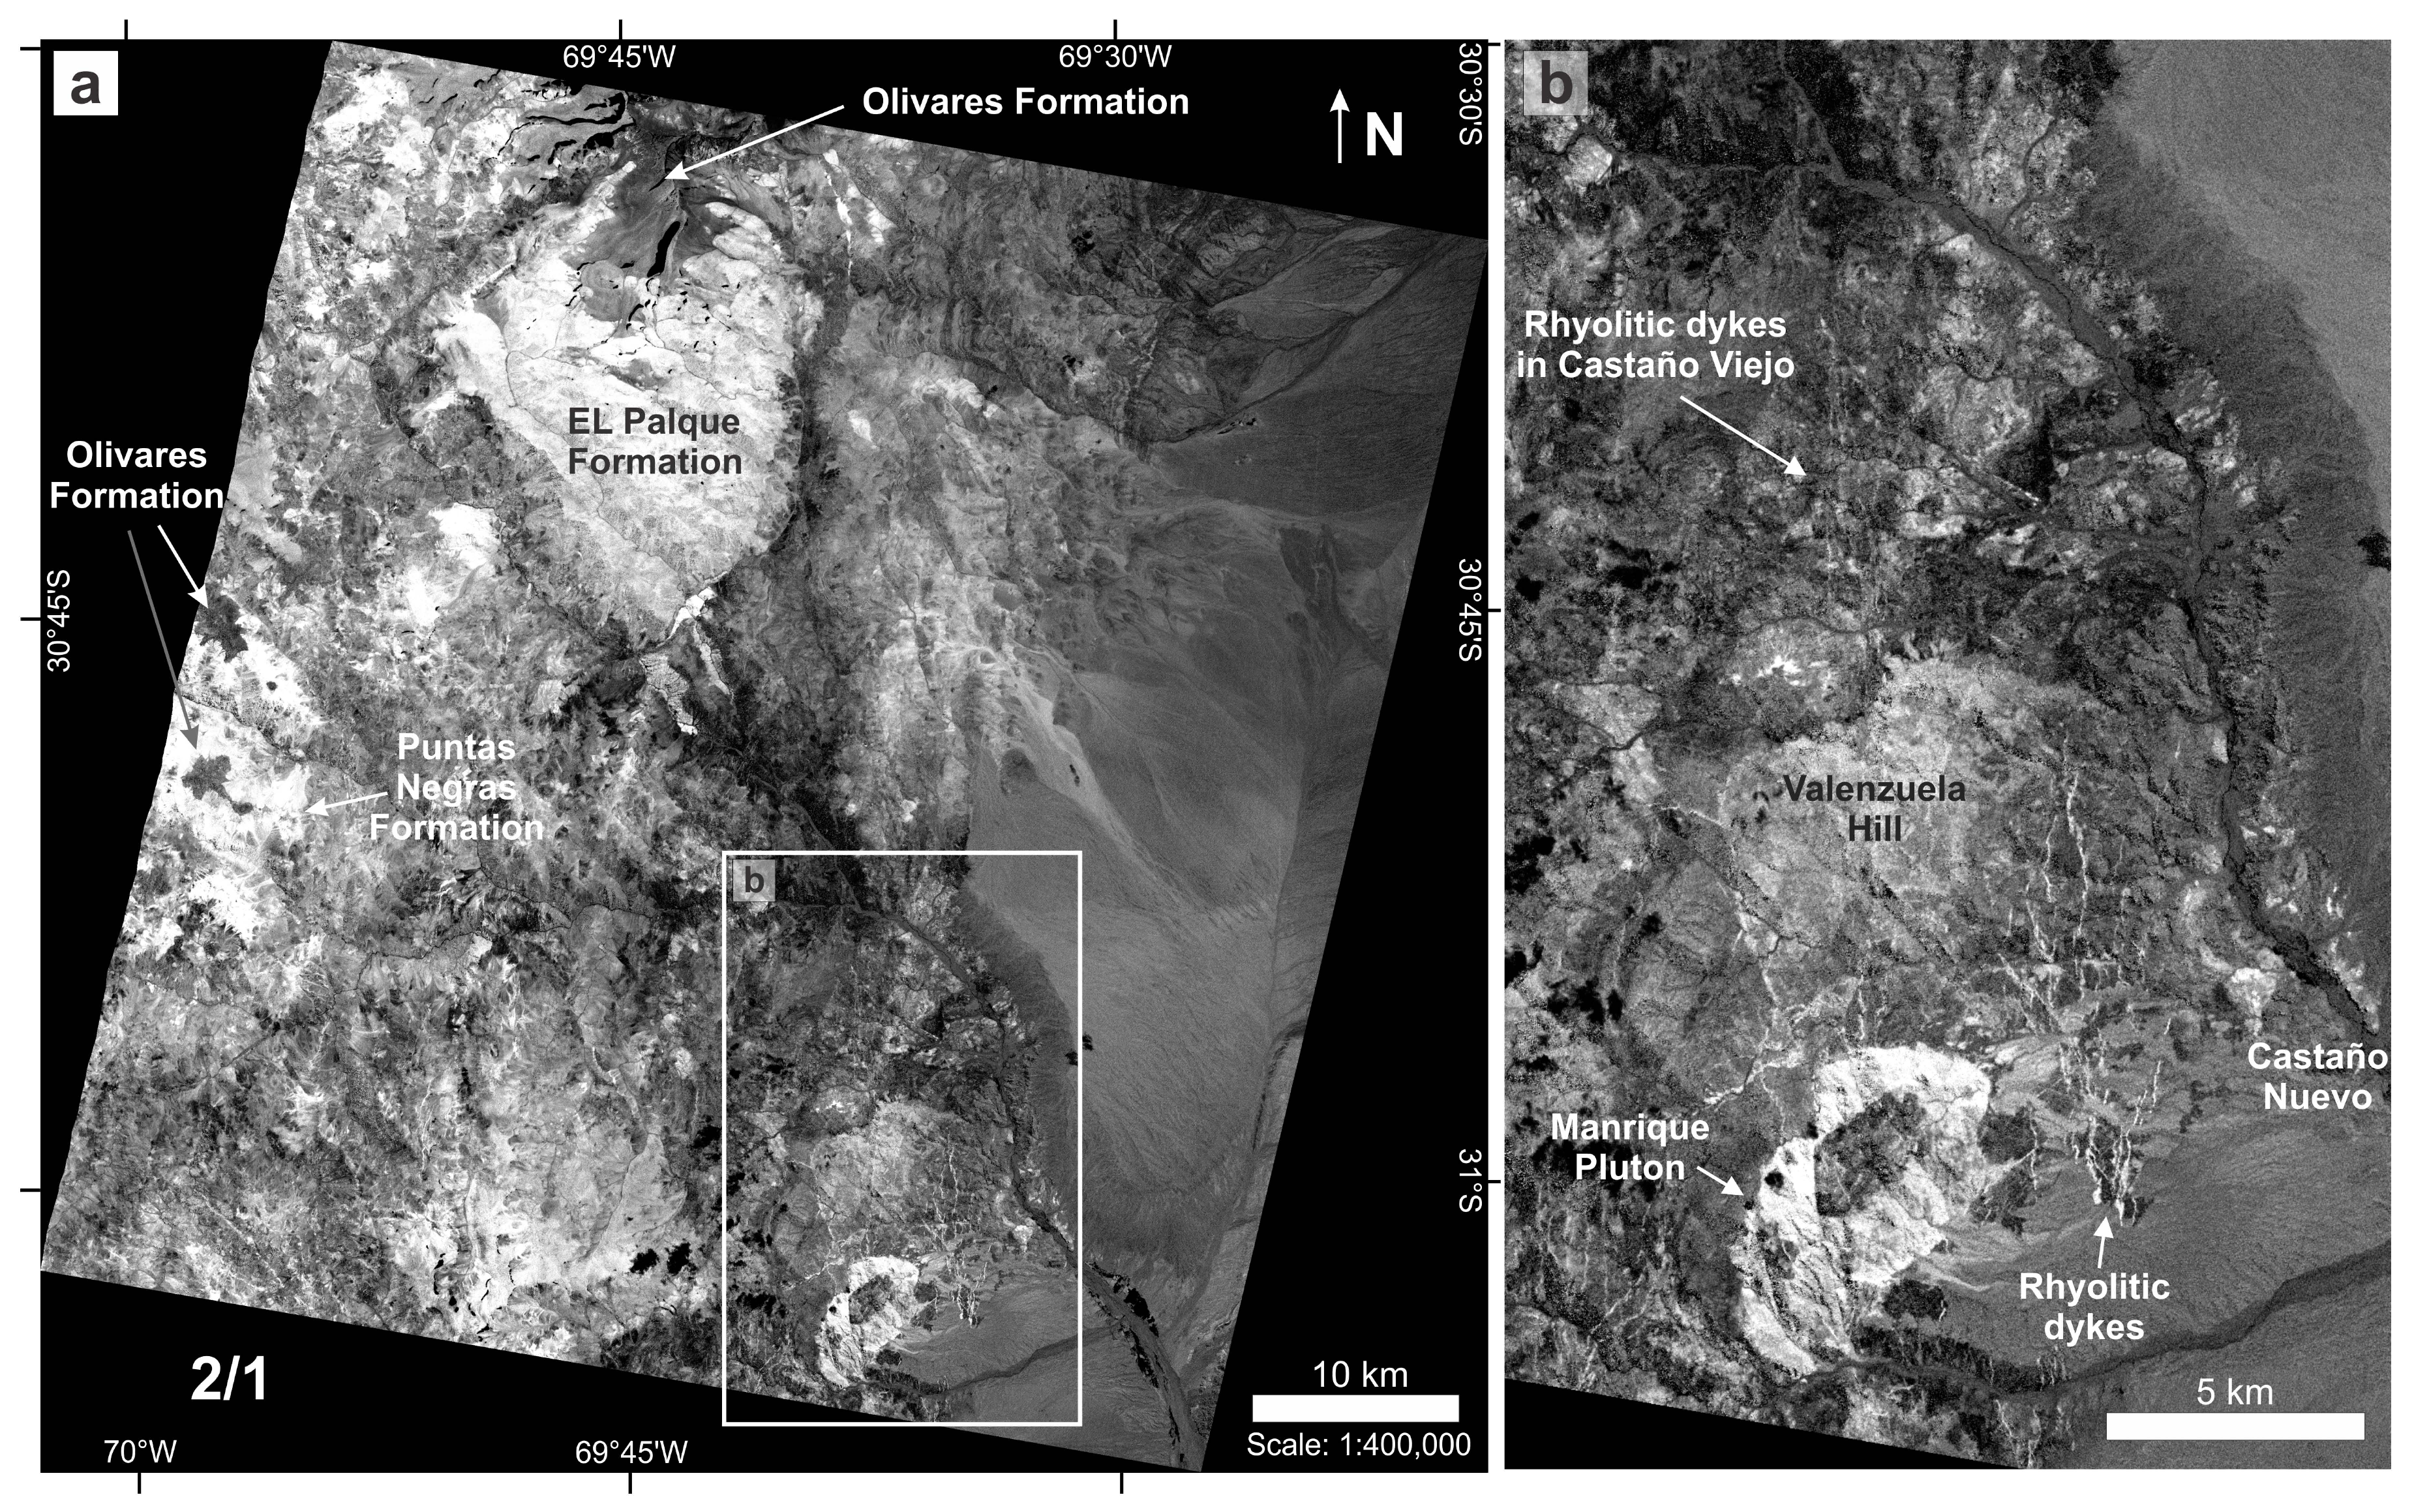
| Figure 6 – VNIR band ratio: 2/1 | • Felsic to intermediate units (light color): El Palque Formation, Puntas Negras Formation, Manrique Pluton and N- trending rhyolitic dykes • Intermediate to mafic units (dark color): Olivares basalts, roof pendant of the Vega de los Machos Formation on top of the Manrique Pluton | Poor discriminator: it does not provide major information regarding hydrothermal alteration, only areas with a moderate to strong silicic alteration yielded brighter shades (e.g., Castaño Nuevo and Valenzuela Hill) | Good lithology discriminator for igneous rocks based on mineral composition/acidity; particularly useful where lithologic units with contrasting compositions are spatially related or in contact to one another • The 15 m spatial resolution for ASTER bands in the VNIR portion of the electromagnetic spectrum in much higher than SWIR and TIR; thus rhyolitic dykes are best mapped with the 2/1 ratio; In order for these dykes to be detected their width must be larger than the pixel size |
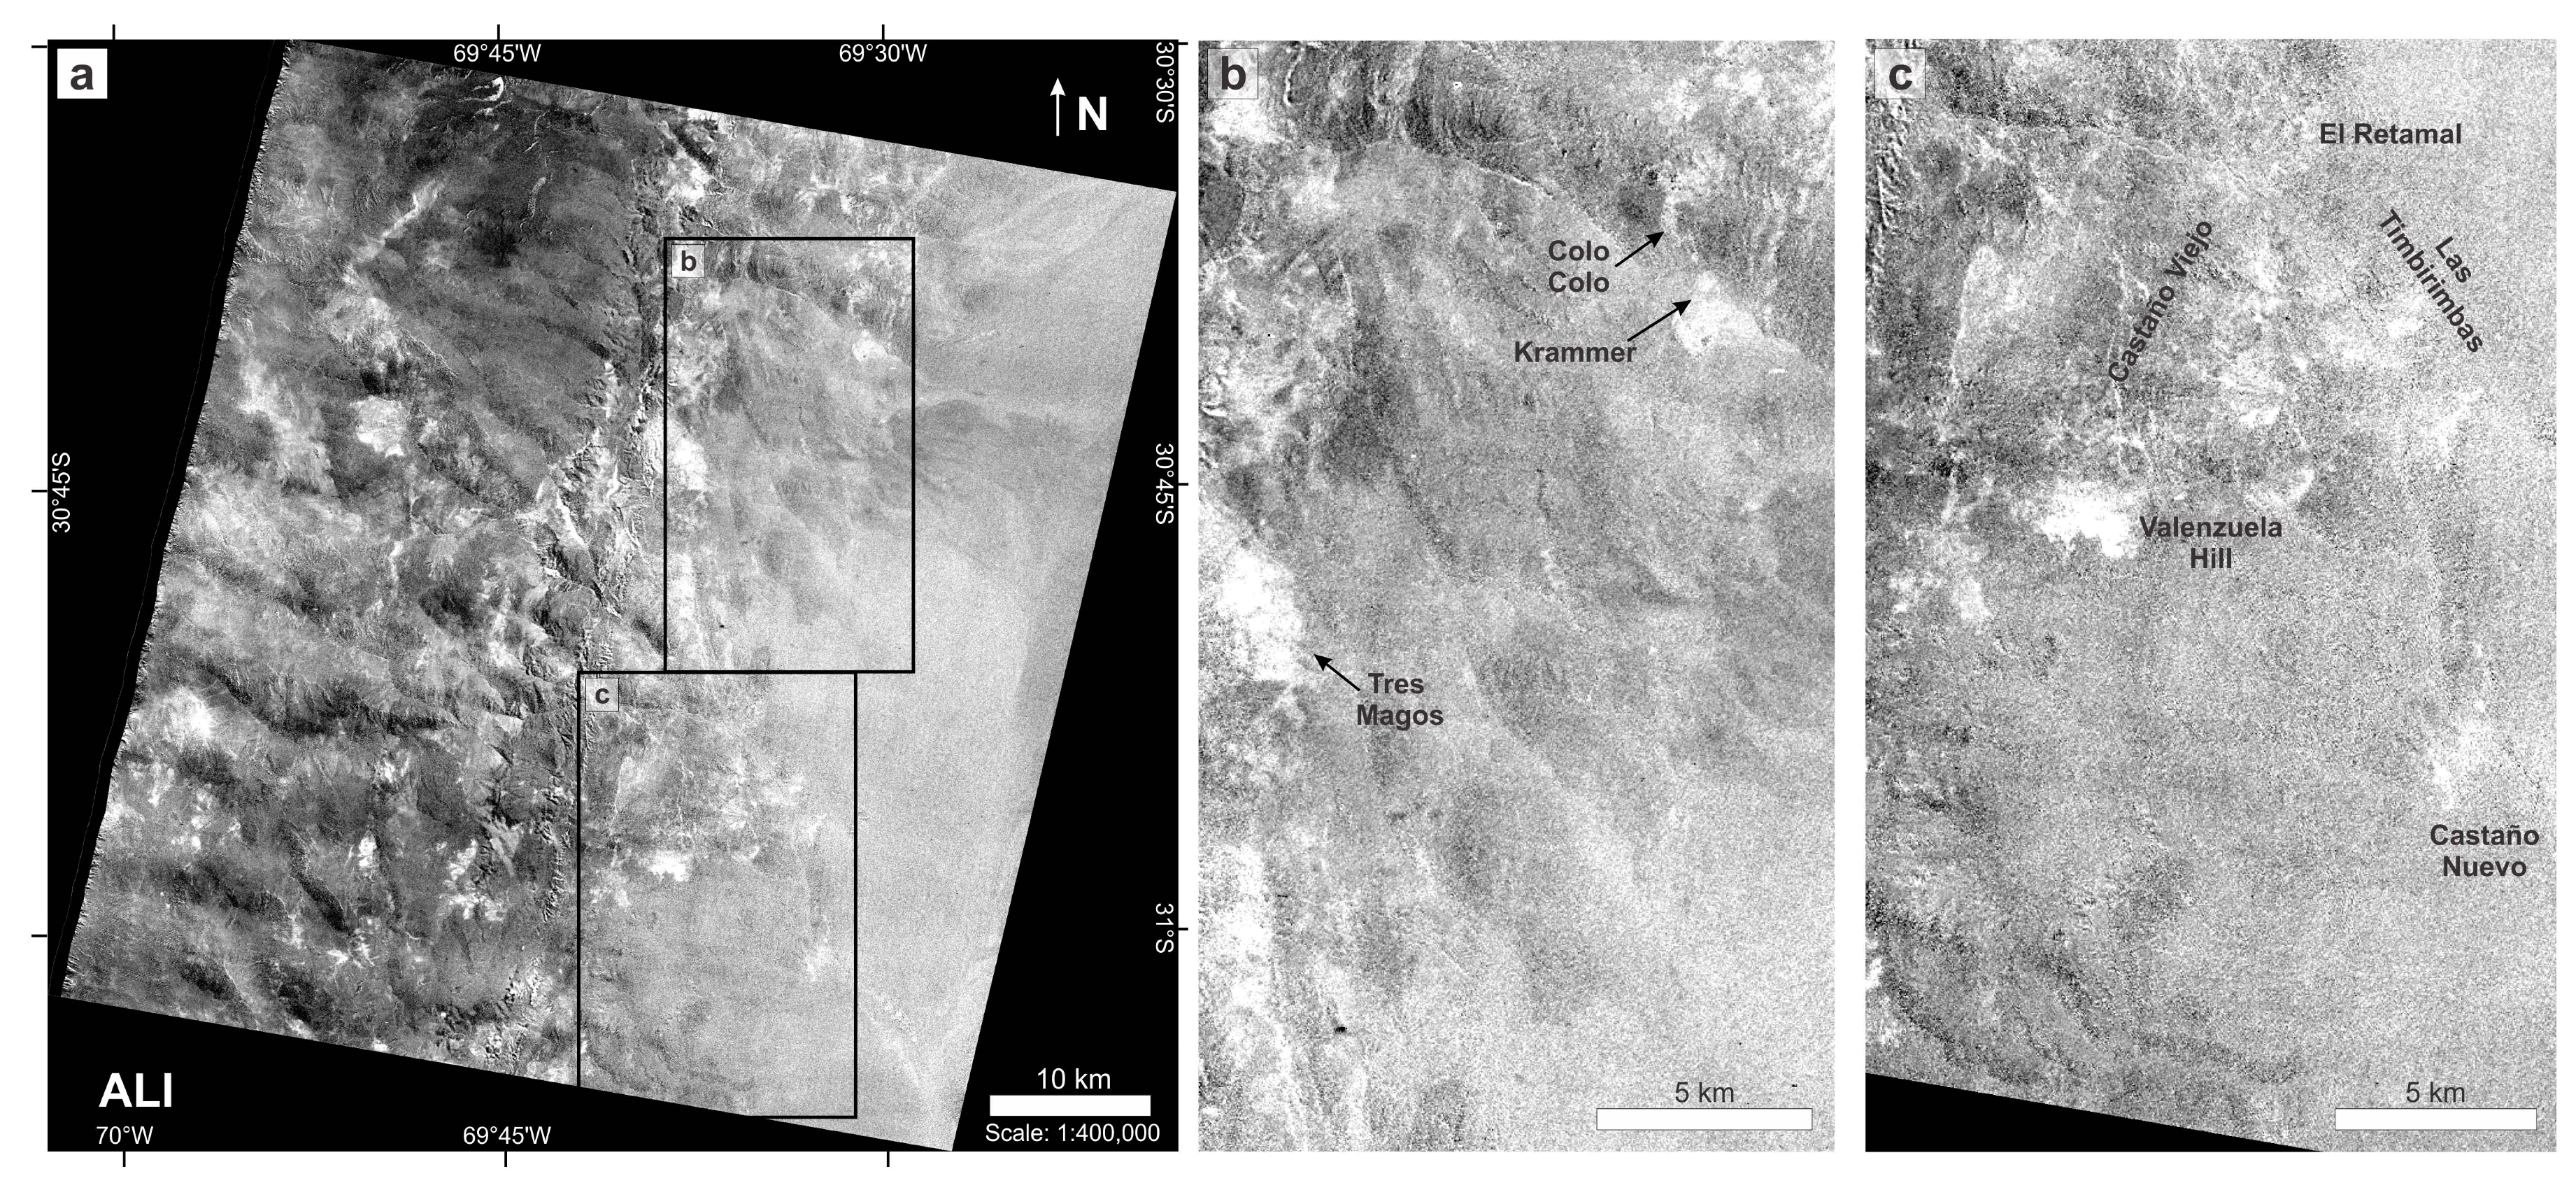
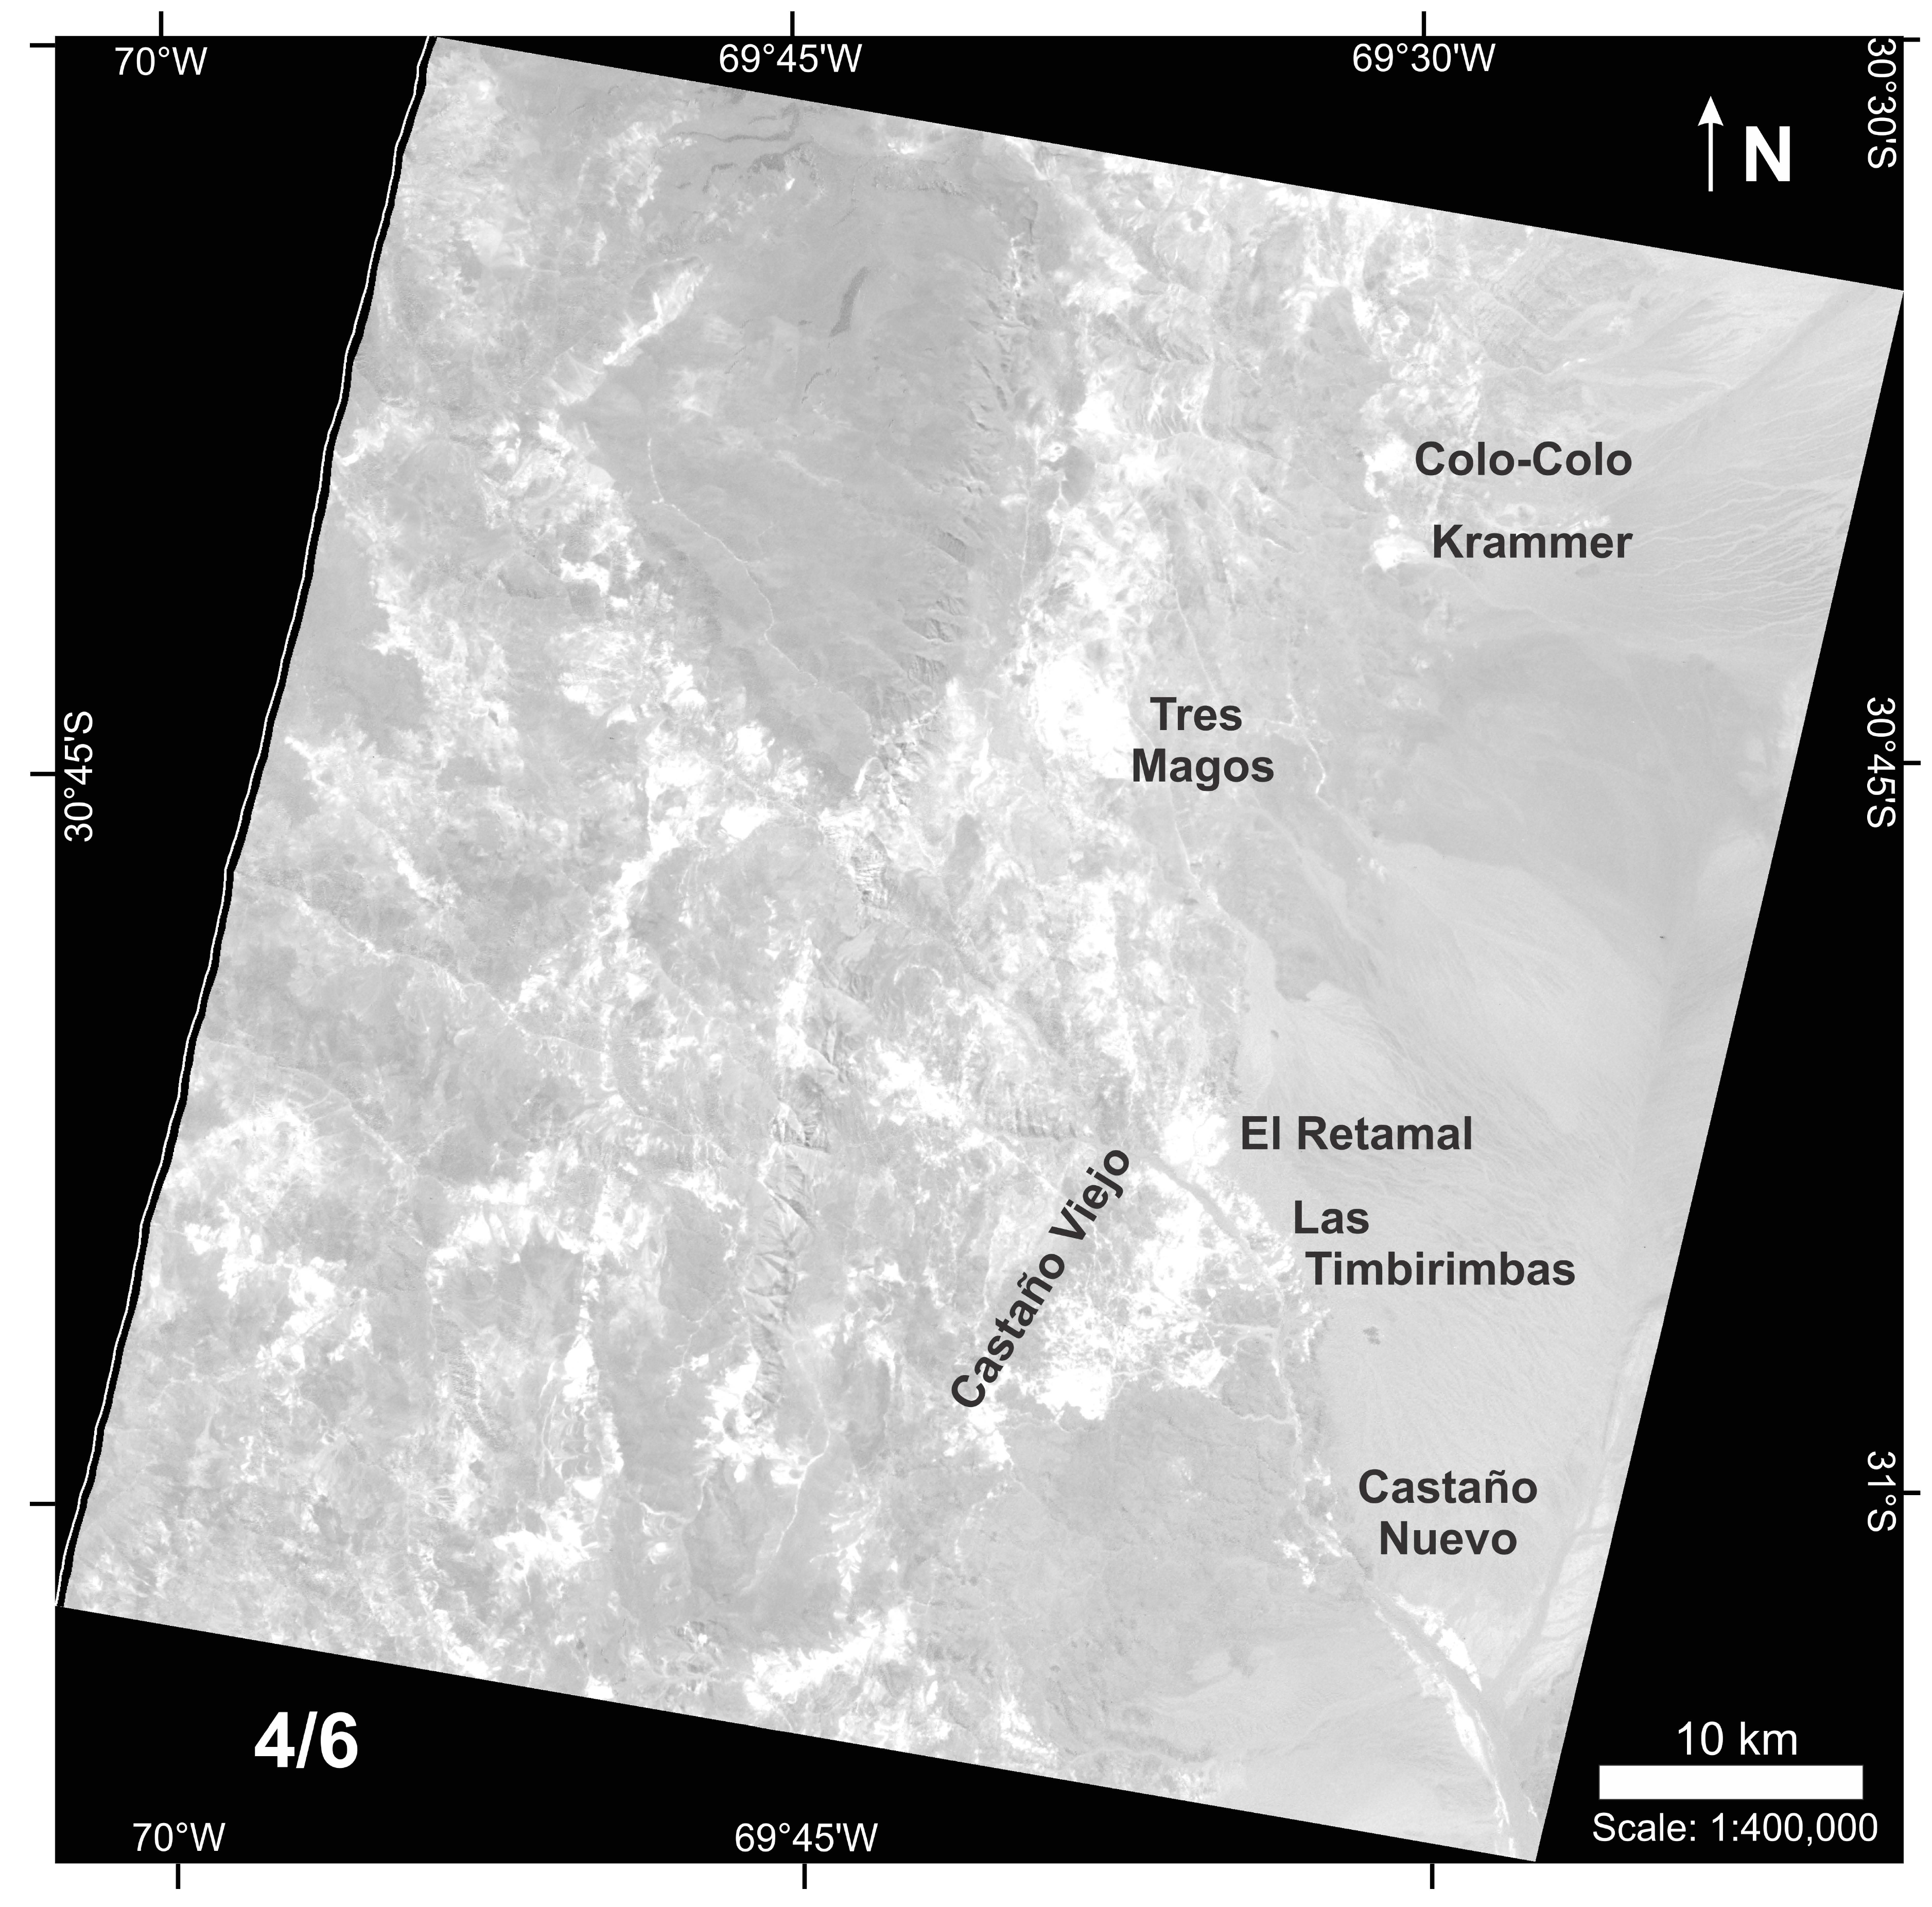
| Figure A3 – SWIR band ratio: 4/6 | Poor discriminator: it does not provide information regarding lithology | It highlights argillic and phyllic alteration in white; silicic alteration is undetectable • Argillic – phyllic alteration zones related to known deposits: Colo-Colo, Krammer, Tres Magos, Valenzuela Hill, Castaño Viejo, El Retamal, Las Timbirimbas, and Castaño Nuevo • Argillic – phyllic alteration zones related to barren areas or unknown deposits: Vega de los Machos Formation (white outline surrounding El Palque Formation), and alteration patches to the west of known deposits | Good hydrothermal alteration discriminator; it effectively enhanced the response of clay and micas as kaolinite group and OH-bearing minerals have high reflectance in band 4 but low reflectance in band 6, therefore it highlights argillic and phyllic alterations • The ASTER 4/6 SWIR band ratio may lead to wrong interpretations as areas rich in non-hydrothermal clays and/or micas ± vegetation (e.g., sediments from the floodplain adjacent to the Castaño River) are also highlighted |
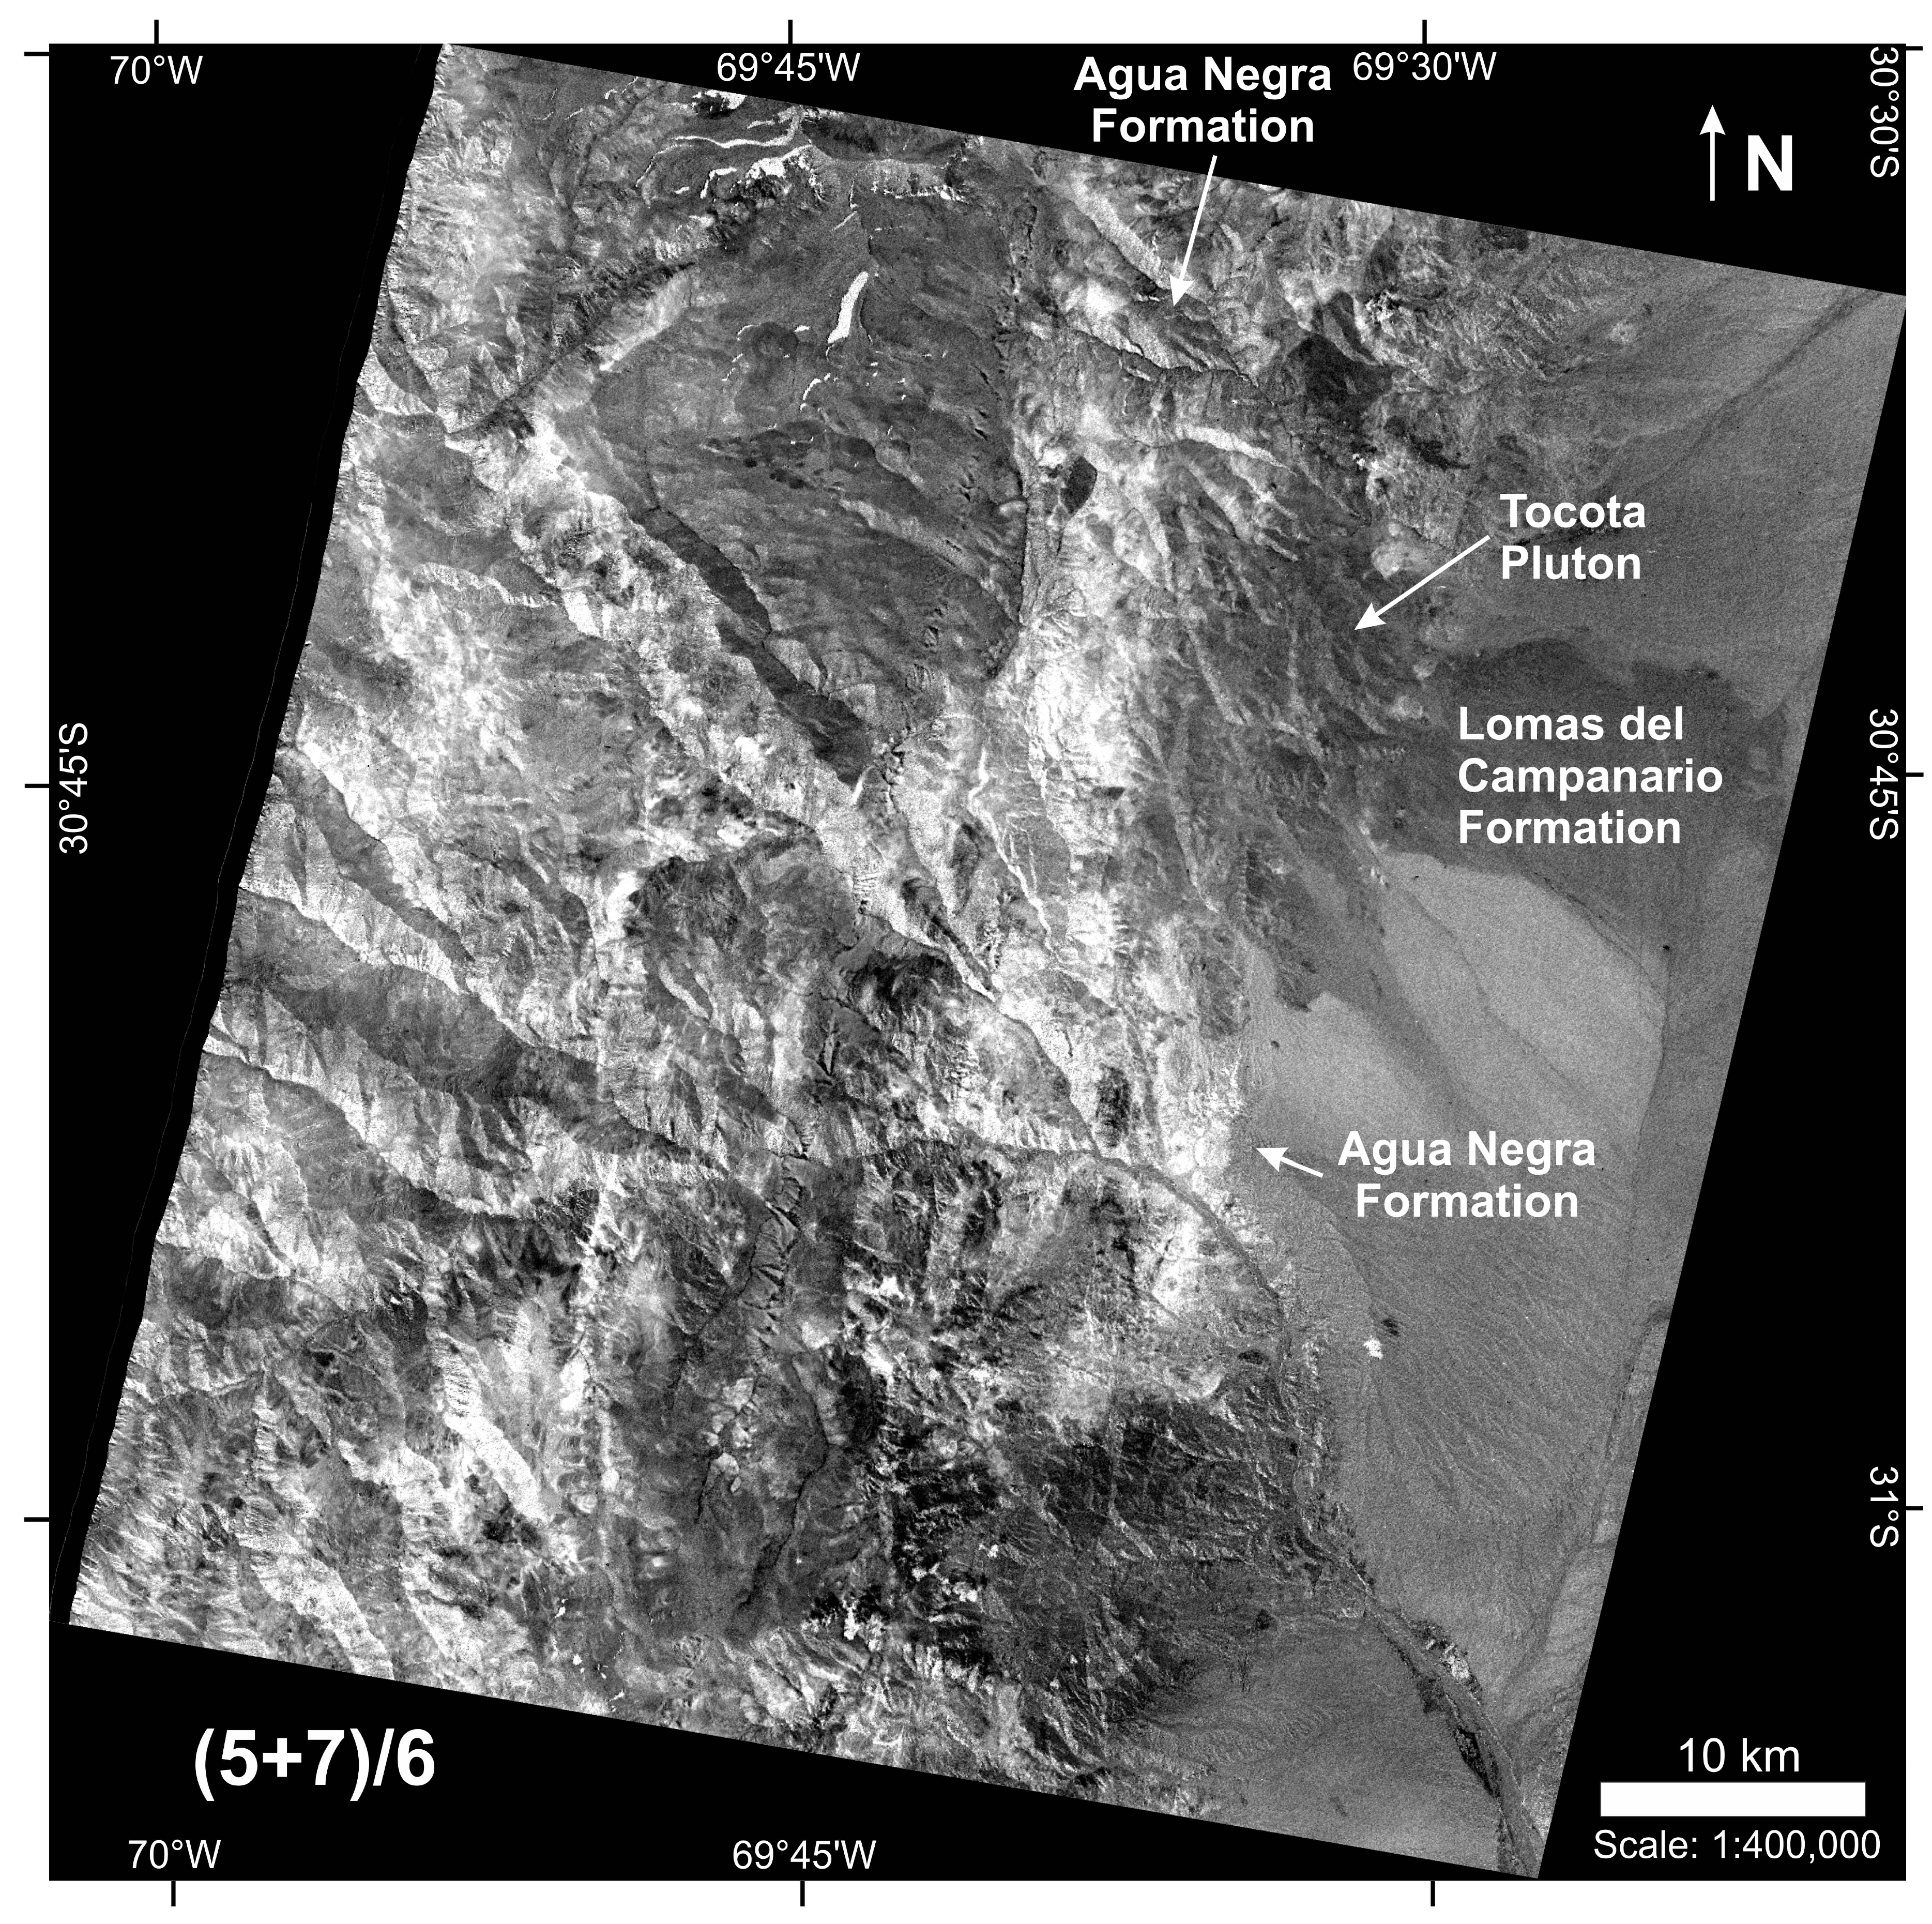
| Figure A4 – Math operation: (5+7)/6 | • Sandstones and mica-rich siltstones from Agua Negra Formation (light color) • Igneous rocks (dark color): Tocota Pluton, El Palque and Loma del Campanario formations | Poor discriminator: it does not provide information regarding hydrothermal alteration | Good lithology discriminator to differentiate the sedimentary rocks of Agua Negra Formation from the surrounding igneous rocks; Similarly, the alluvial fans (Rodeo-Calingasta basin) have light grey color that contrasts with the dark-colored igneous rocks (i.e., Tocota Pluton and Loma del Campanario Formation) |
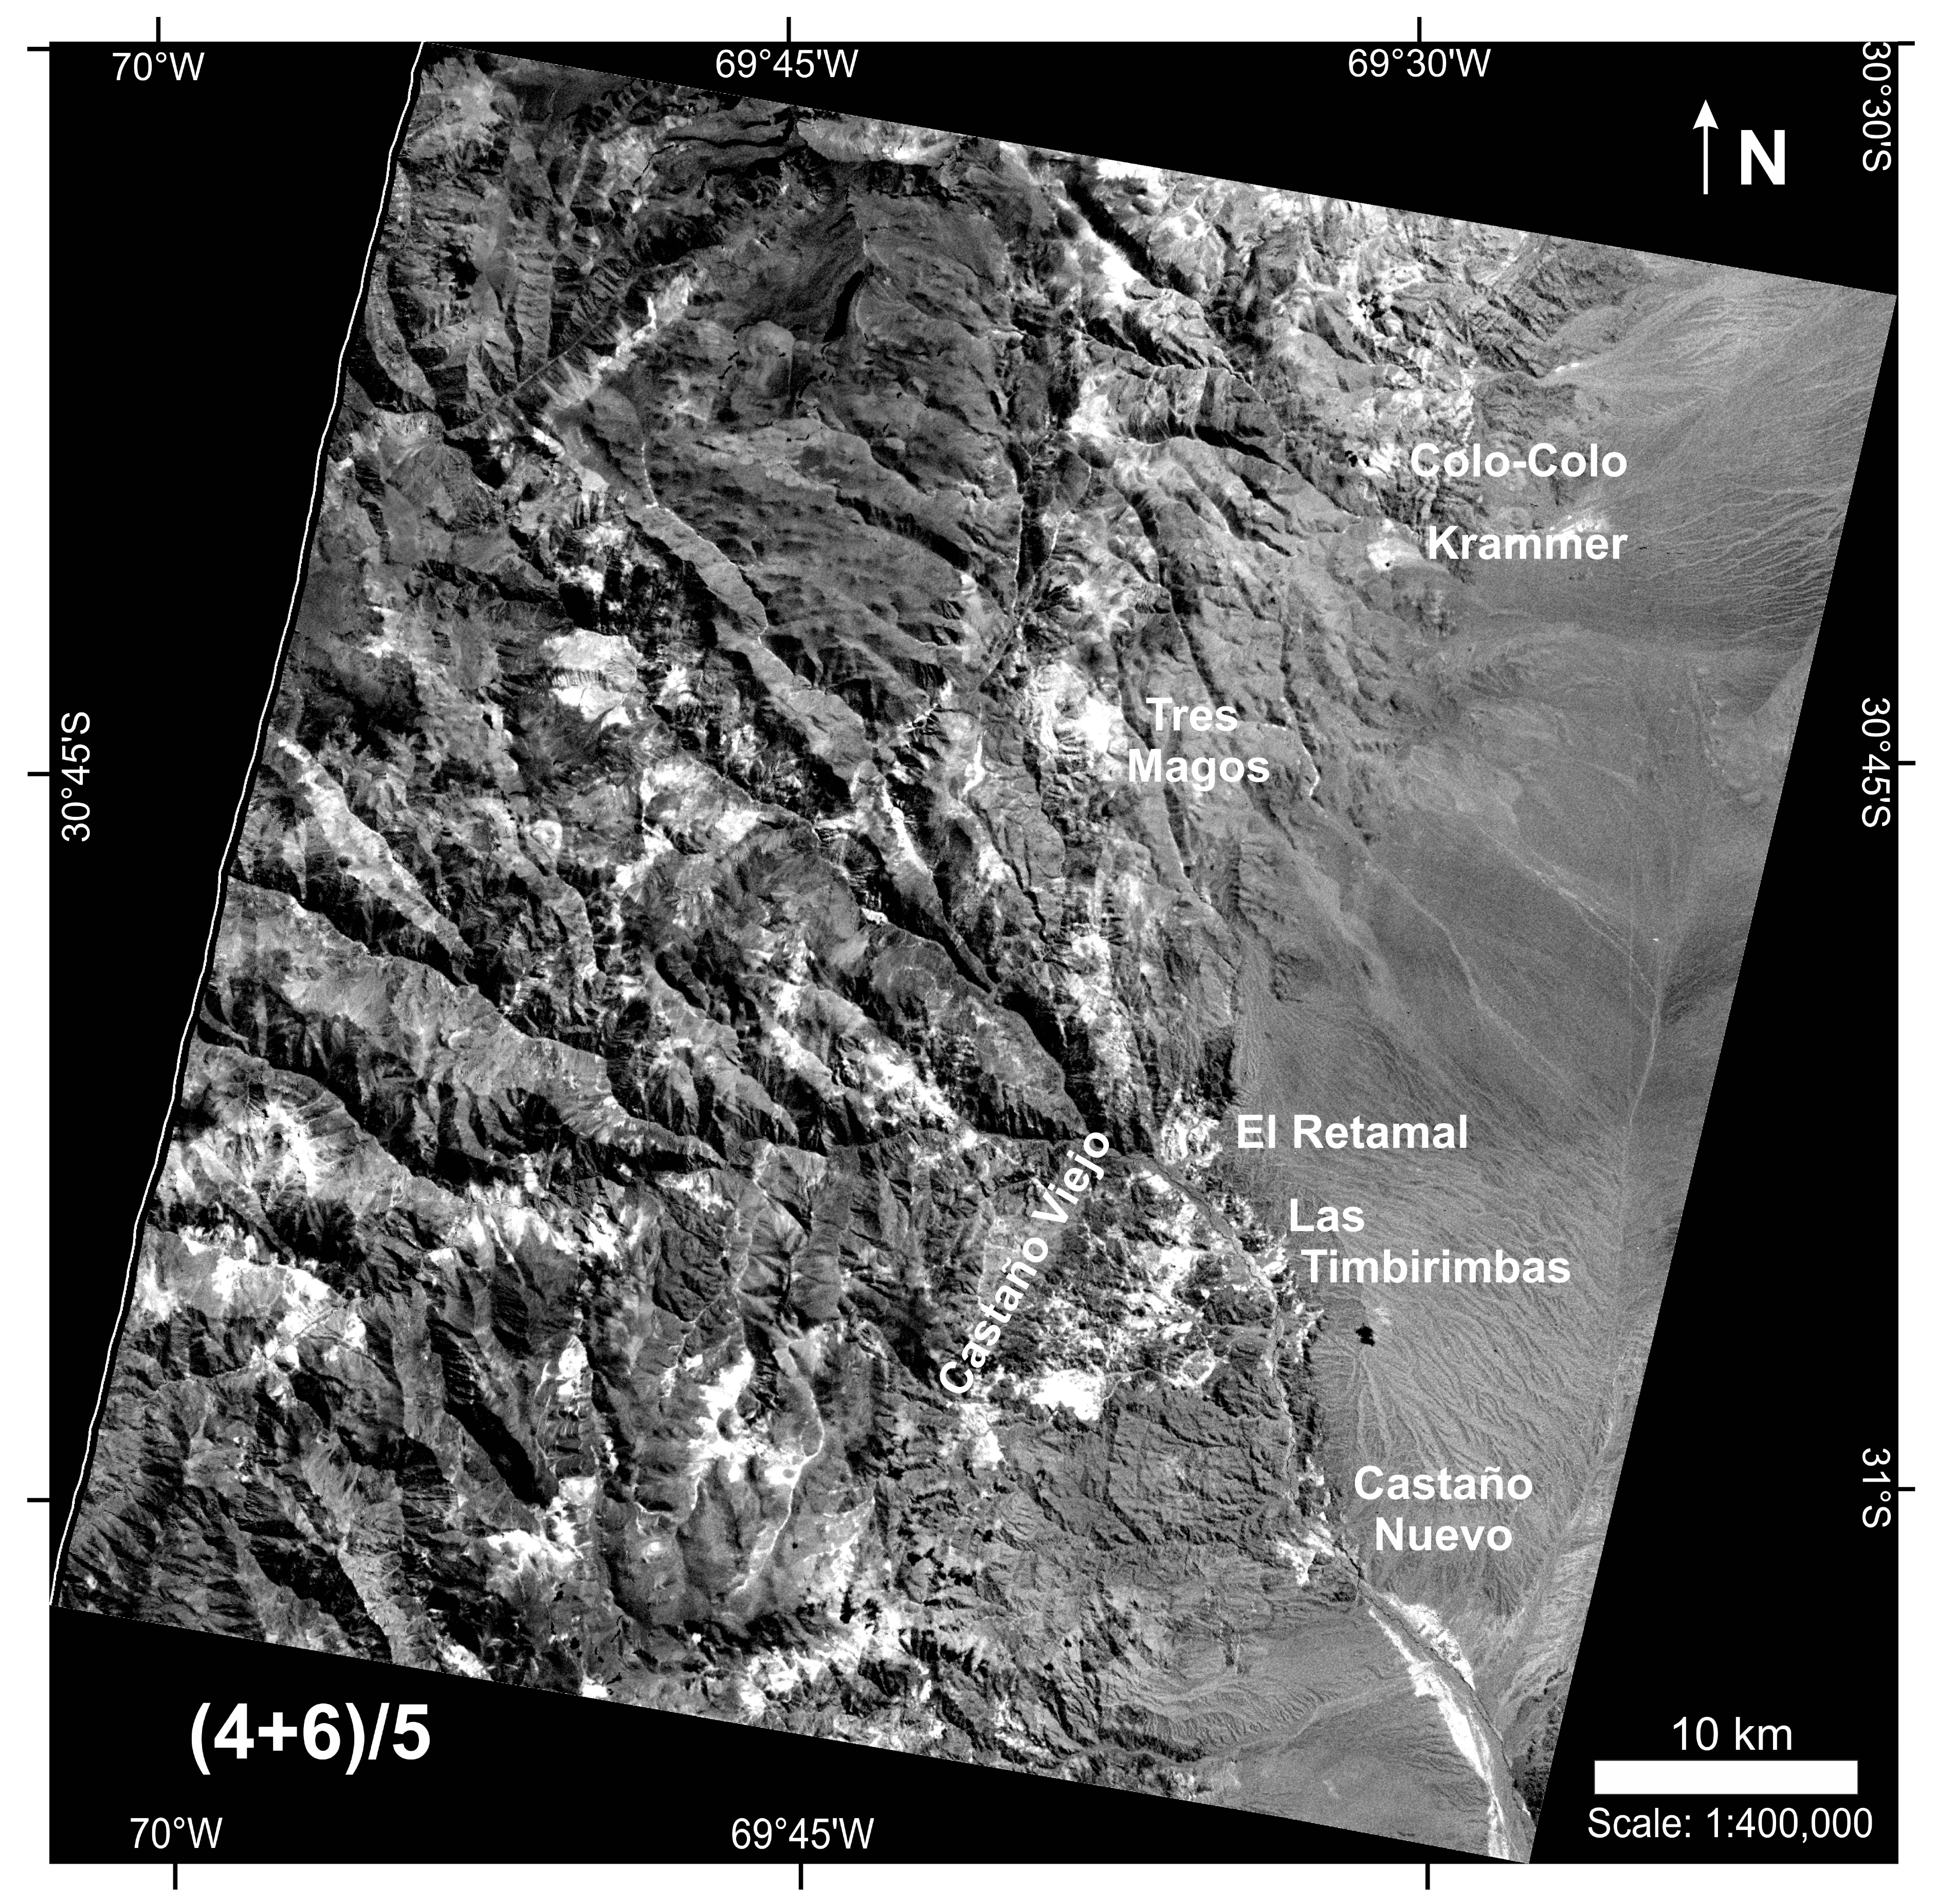
| Figure A5 – Math operation: (4+6)/5 | Poor discriminator: it does not provide information regarding lithology | Useful to differentiate hydrothermally altered mica-rich and clay-rich units from unaltered units and the mica-rich sedimentary facies of Agua Negra Formation | Good hydrothermal alteration discriminator; it highlighted bright areas that are likely to contain alunite, kaolinite, pyrophyllite and/or illite • Caution is advised as this image may lead to wrong interpretations as areas rich in non-hydrothermal clays and/or micas (e.g., alluvial sediments ± vegetation) are also highlighted |
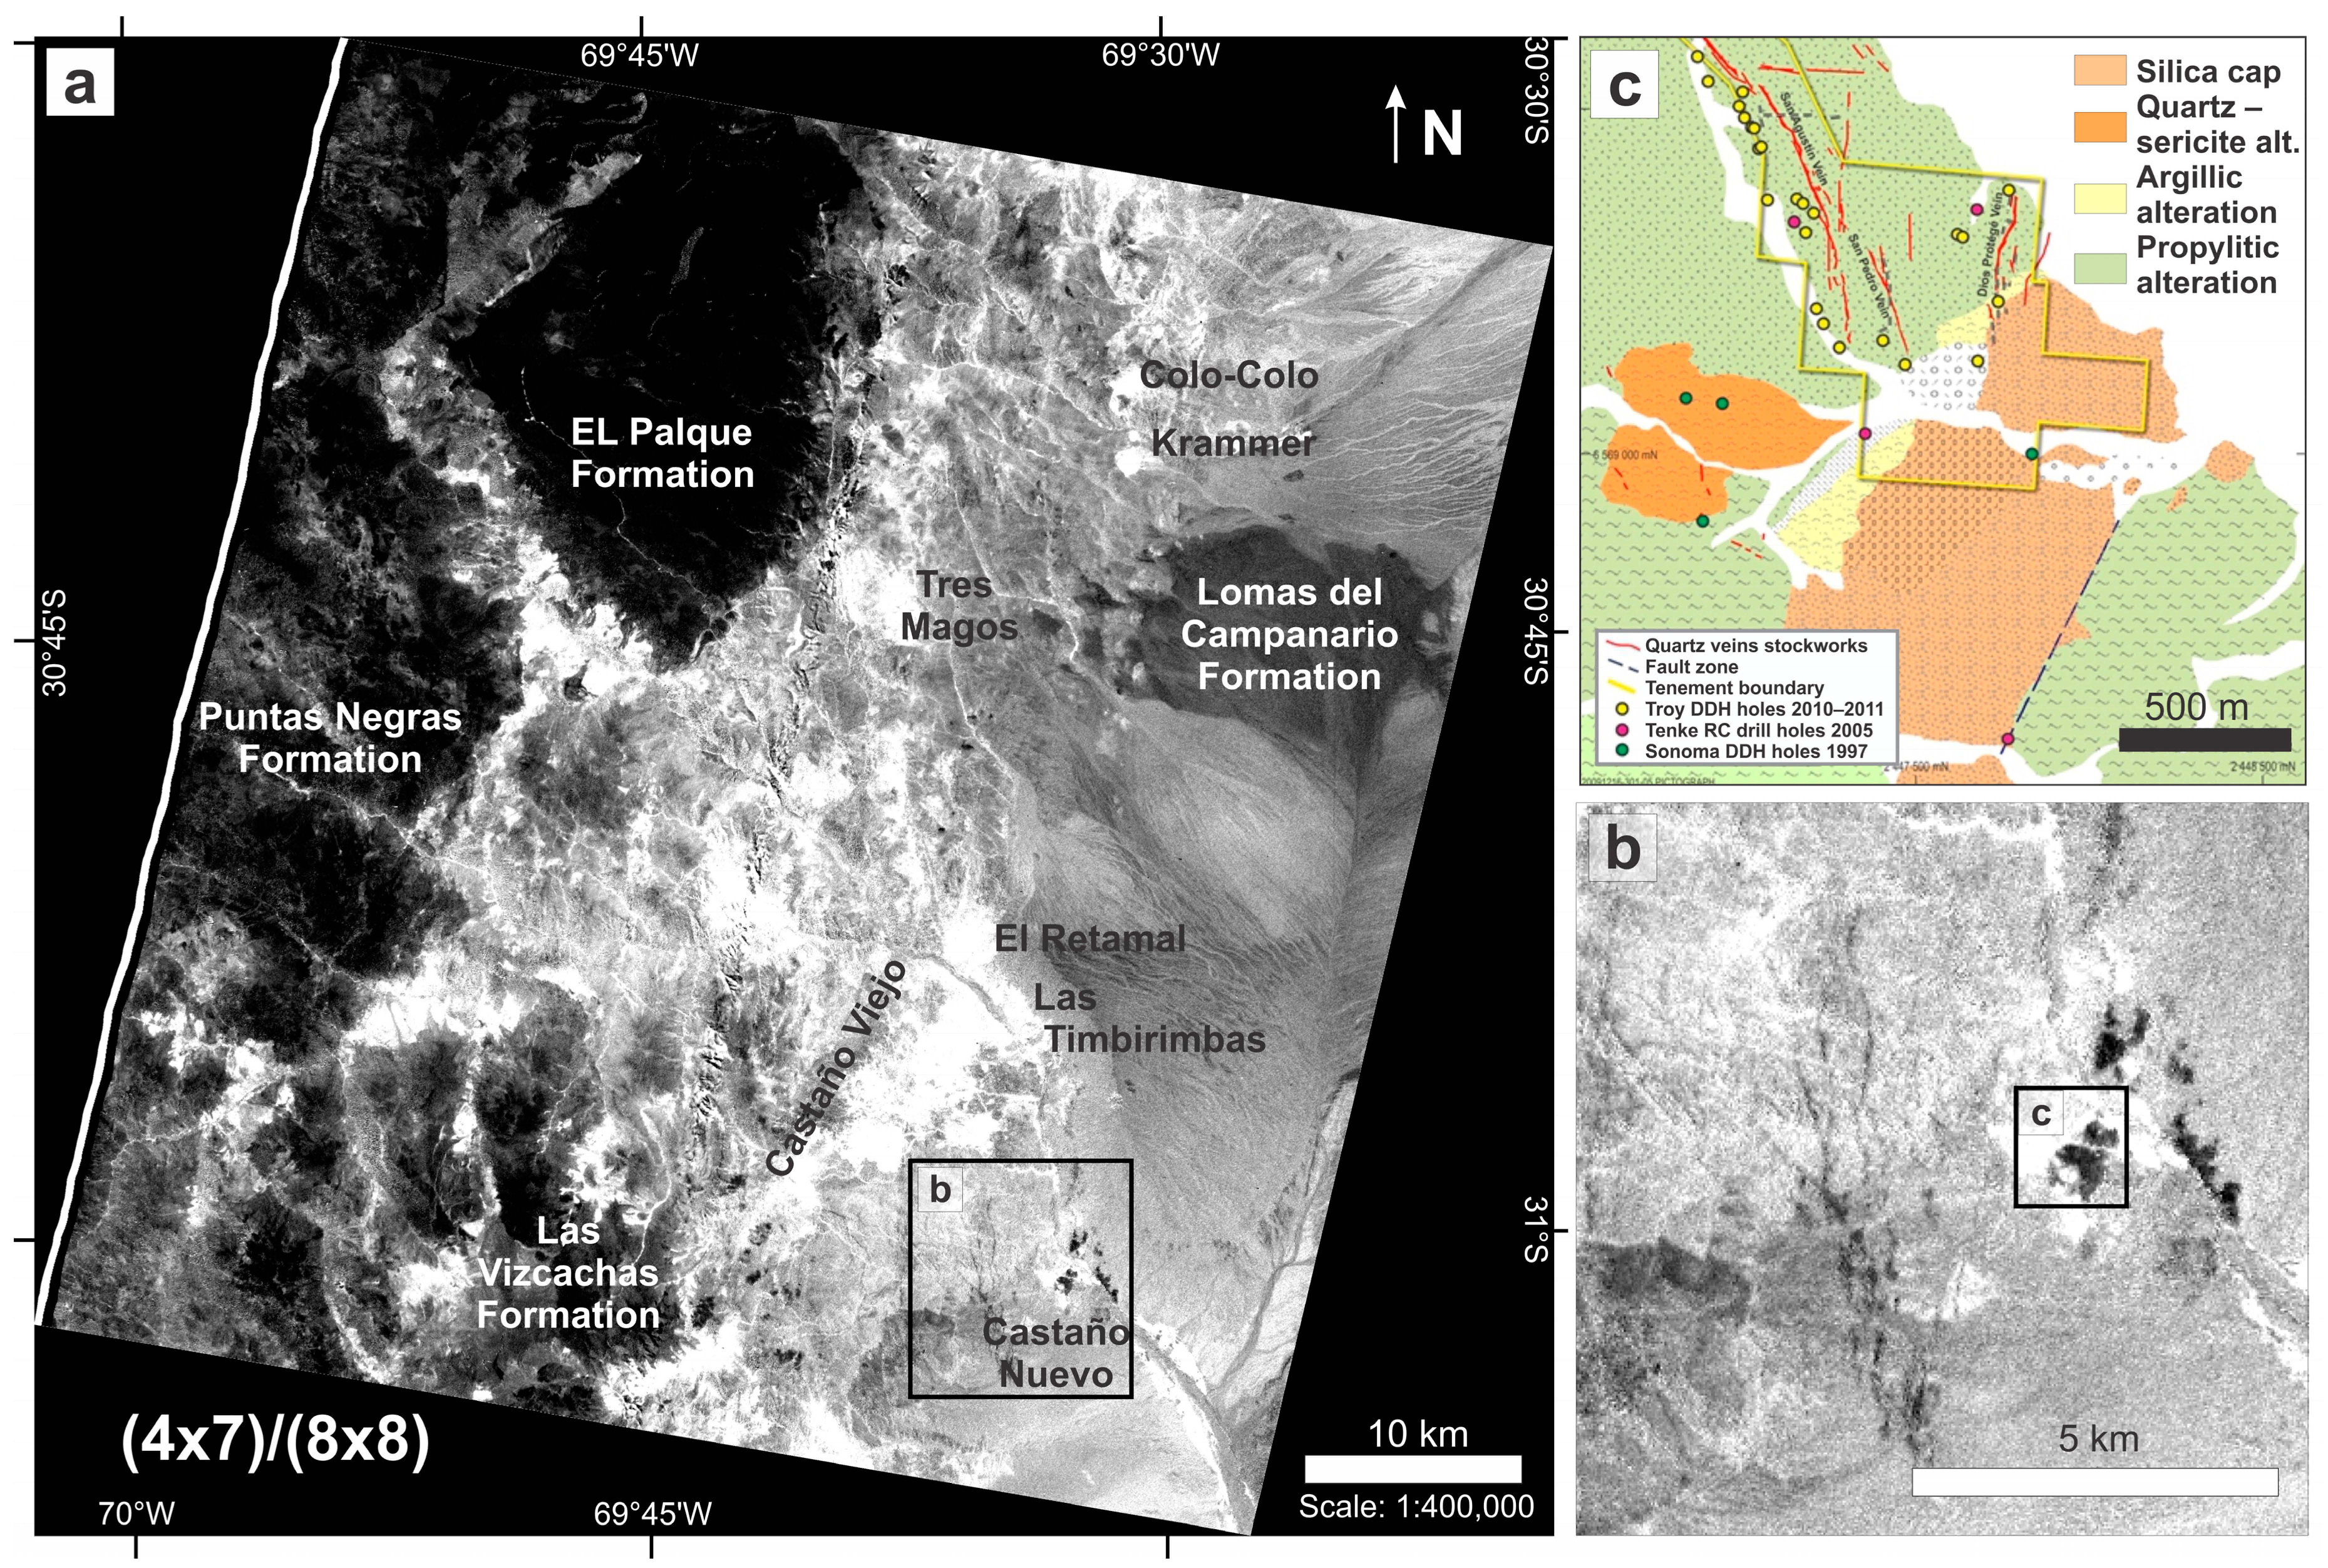
| Figure 7 – Math operation: (4x7)/(8x8) | It identifies the location of the Puntas Negras, El Palque, Lomas del Campanario and Las Vizcachas formations in dark shades | • Argillic – phyllic alteration related to known deposits (white): Colo-Colo, Krammer, Tres Magos, Valenzuela Hill, Castaño Viejo , El Retamal, Las Timbirimbas, and Castaño Nuevo • Argillic – phyllic alteration zones related to barren areas or unknown deposits (white): Vega de los Machos Formation (surrounding El Palque Formation), and alteration patches to the west of known deposits • Silicic alteration (black): Castaño Nuevo | Both good lithology and hydrothermal alteration discriminator within one image; This operation with a linear enhancement was developed for this study; Both muscovite/illite and kaolinite group minerals have high reflectance in bands 4 and 7, and low reflectance in band 8; The proposed math operation enhanced these spectral features and thus detect phyllic and argillic alteration zones • It broadly highlighted mica- and clay-rich alteration zones and the more local silicified zones in the Castaño Nuevo district; the hydrothermal alteration map for Castaño Nuevo proposed by Troy Resources Ltd helps validate this image efficiency; According to the Troy Ltd website and Delendatti (2003) [20,34], the Castaño Nuevo area has fine grained siliceous alteration located south of the Au–Ag-bearing quartz veins and north of the main argillic – phyllic alteration zone • Pro: Clearly identified the location of Puntas Negras, El Palque, Lomas del Campanario and Las Vizcachas formations • Con: Alluvial deposits rich in non-hydrothermal clays and/or micas ± vegetation were also detected |
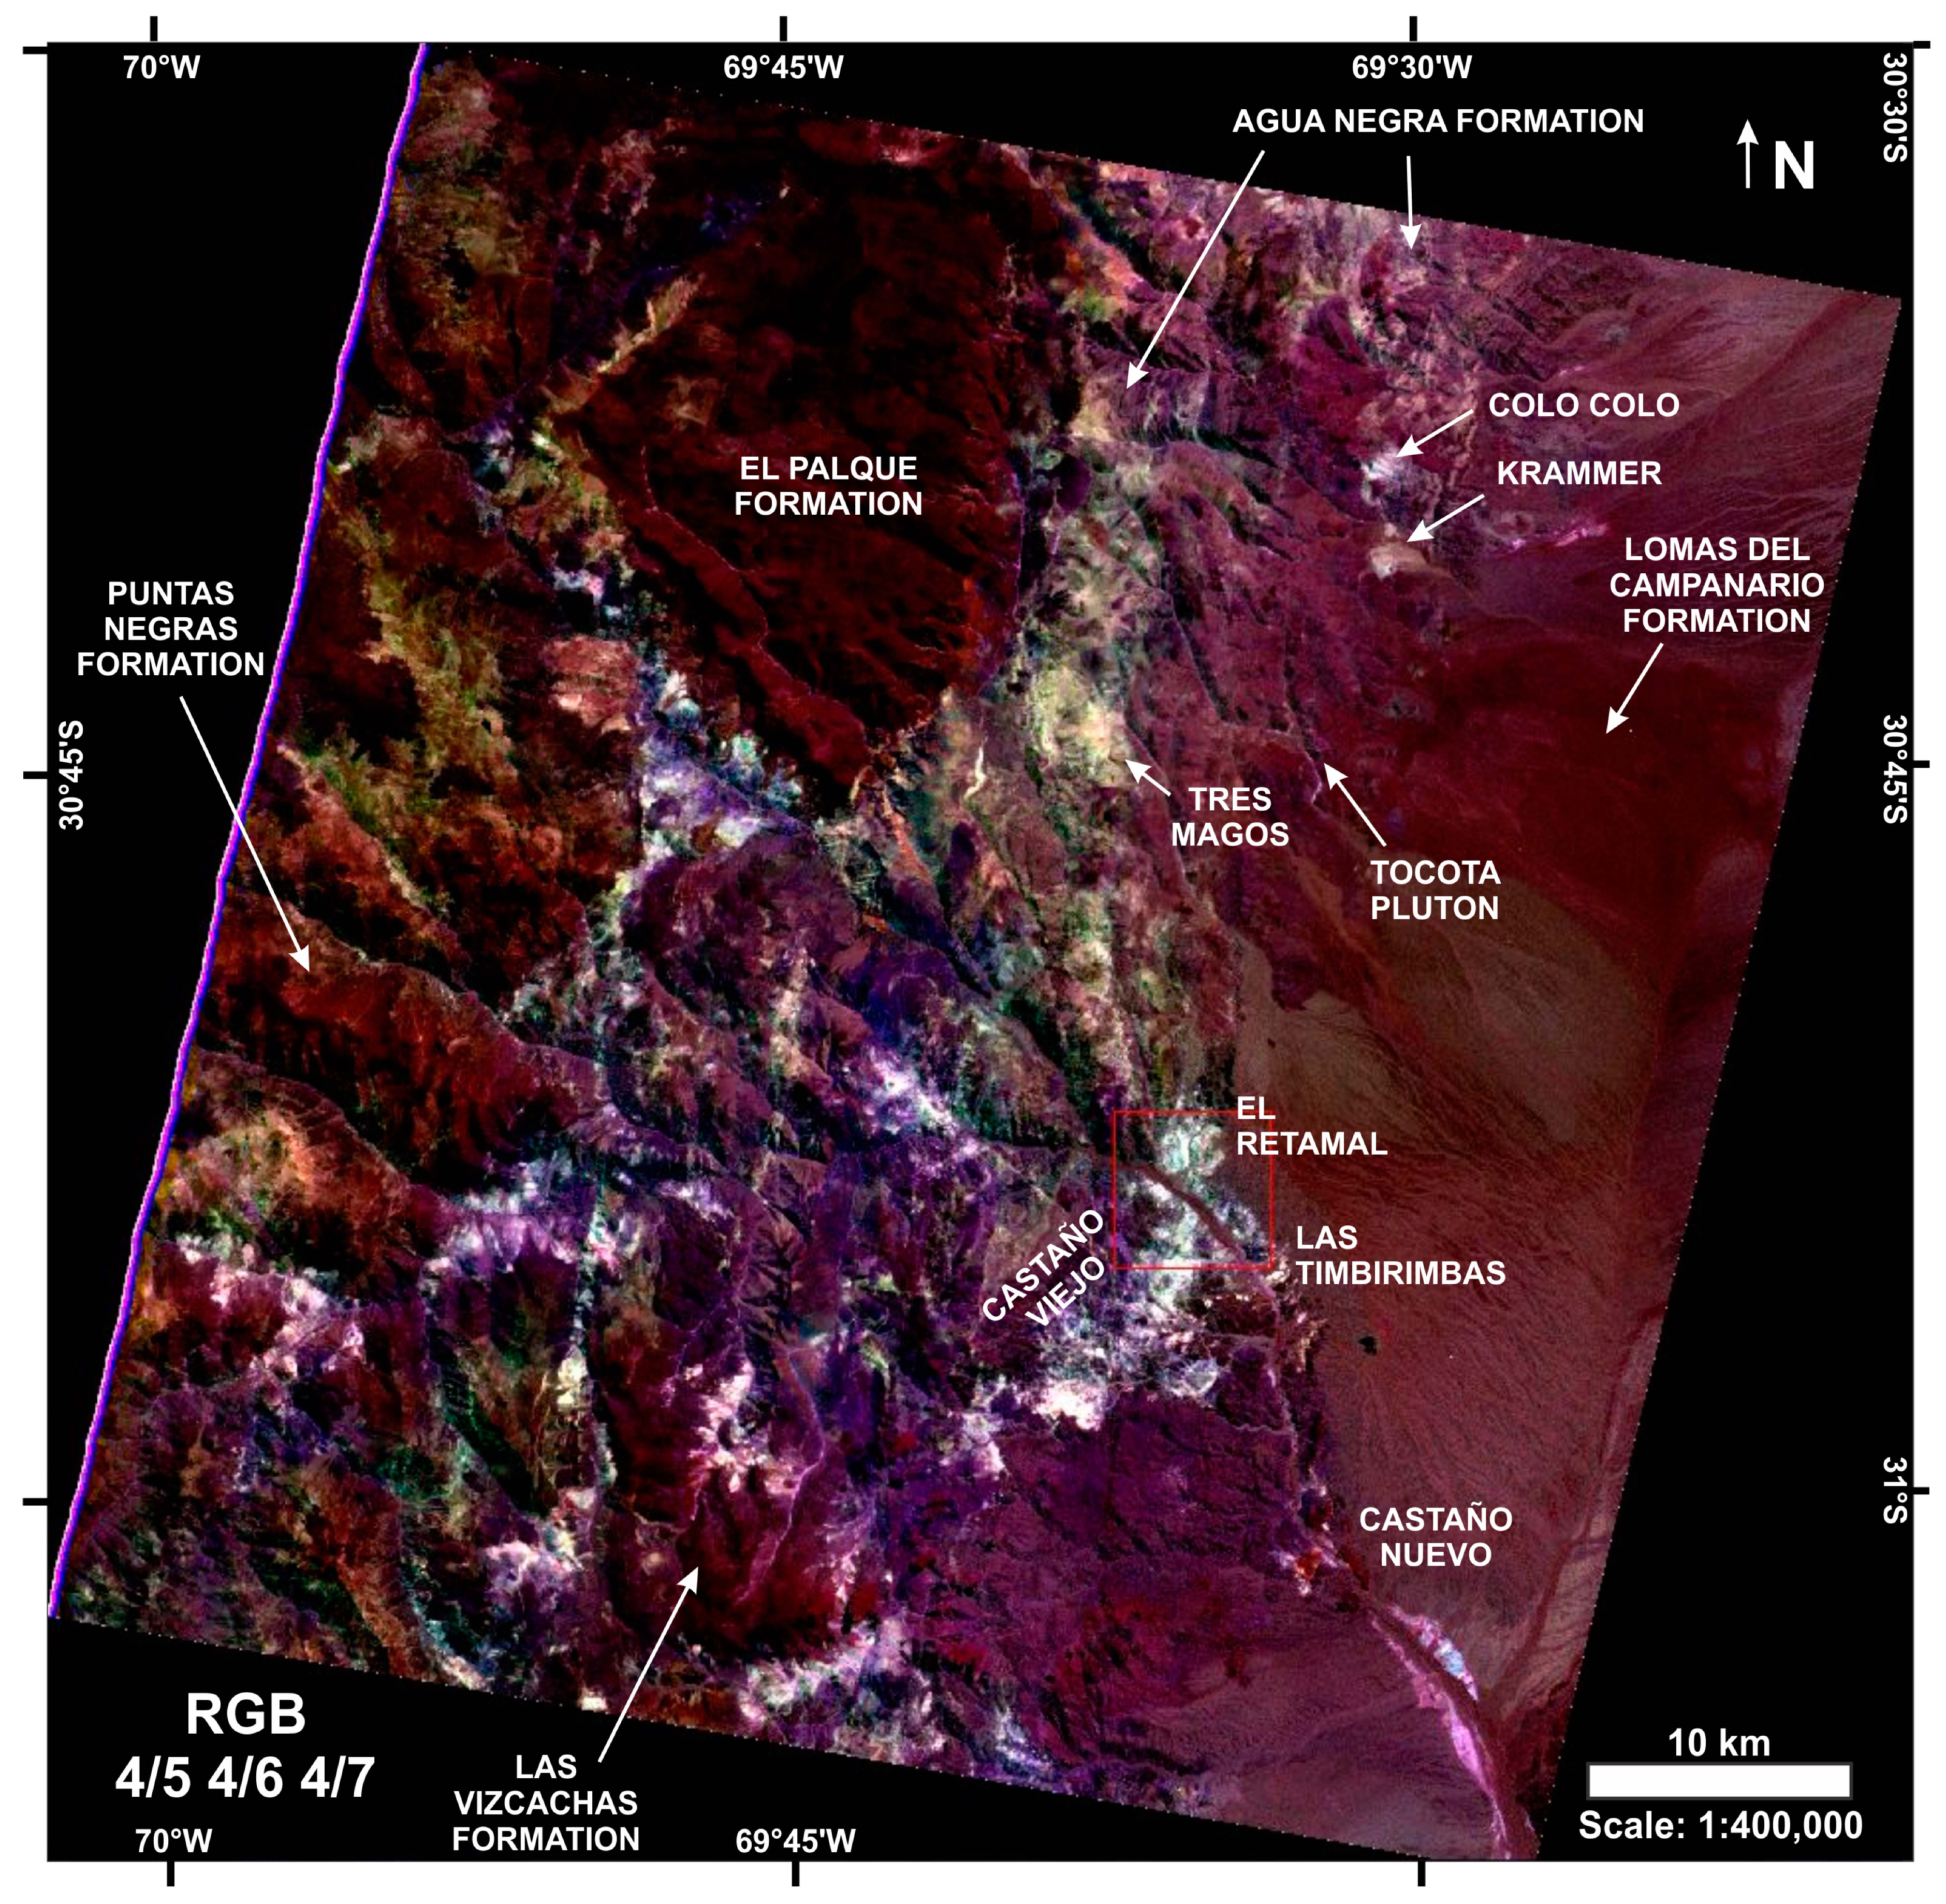
| Figure 8 – False color composite image: Band ratio 4/5 4/6 4/7 (RGB) | • It highlights igneous rocks (maroon): Puntas Negras, El Palque, Lomas del Campanario and Las Vizcachas formations, as well as the Tocota Pluton (purple maroon) • Sedimentary units (light green to light maroon): Agua Negra Formation | • Argillic – phyllic alteration related to known deposits (white to light blue colors): Colo-Colo, Krammer, Tres Magos, Valenzuela Hill, Castaño Viejo , El Retamal, Las Timbirimbas, and Castaño Nuevo • Argillic – phyllic alteration zones related to barren areas or unknown deposits (white to light blue colors): Vega de los Macho Formation (at the base of El Palque rhyolitic flows, which might have affected the underlying unit), and alteration patches to the west of known deposits • Silicic alteration (maroon): Castaño Nuevo | Good hydrothermal alteration discriminator, which roughly distinguished lithologic units; It differentiated hydrothermal clays and micas (white light blue) from the mica- and clay-rich facies of Agua Negra Formation (greenish tones); It highlighted well-developed argillic – phyllic alteration zones and local silicic alteration related to known ore deposits • This image may lead to wrong interpretations as areas enriched in non-hydrothermal clays and/or micas ± vegetation (e.g., sediments from the floodplain adjacent to the Castaño River) are also highlighted |
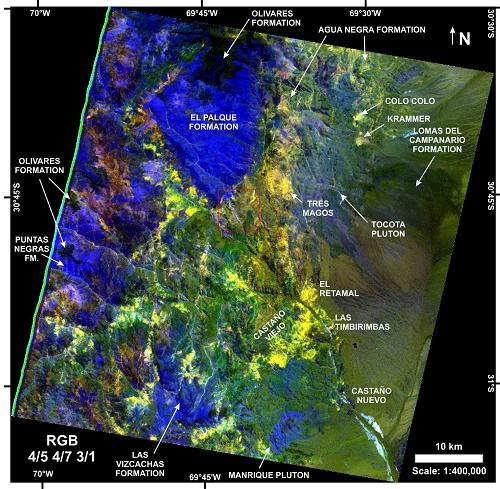
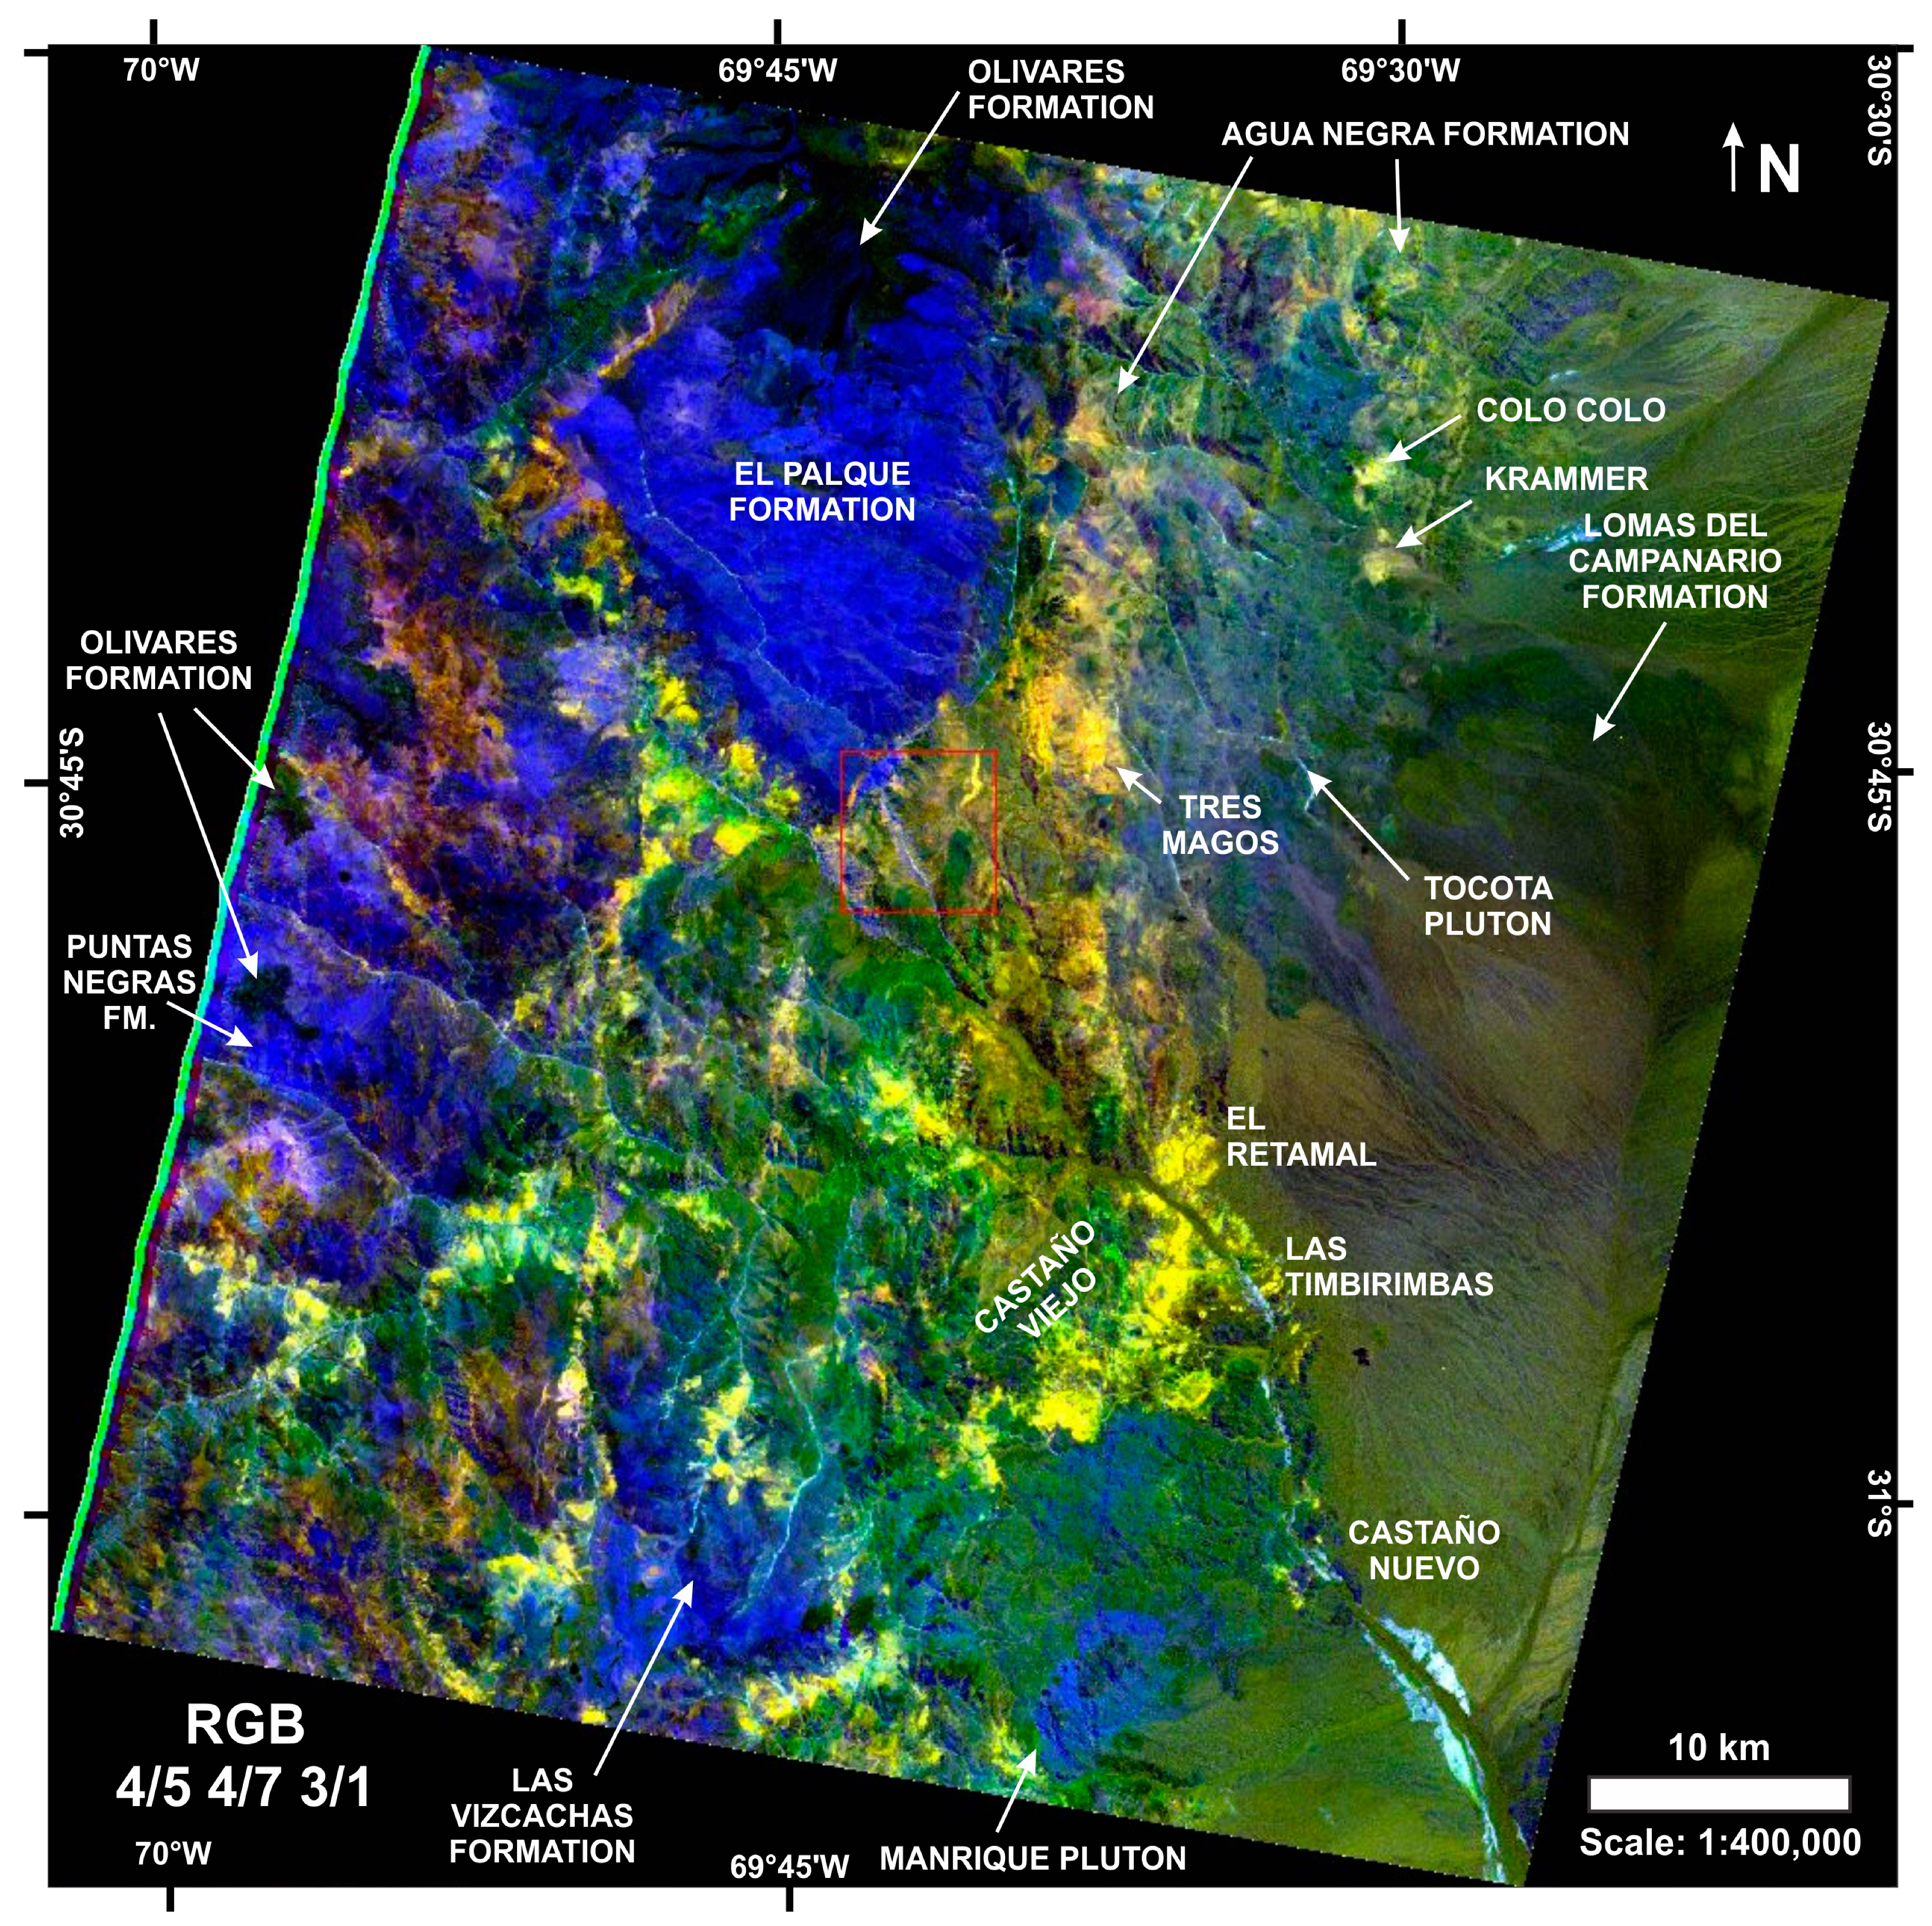
| Figure 9 – False color composite image: Band ratio 4/5, 4/7 and 3/1 (RGB) | • Acid to intermediate rocks (blue): Manrique and Tocota intrusive bodies and Las Vizcachas, Puntas Negras and El Palque formations • Basic rocks (black to dark green): Olivares Formation • Agua Negra Formation (brown-green and light orange): High contrast between the sedimentary unit and the El Palque Formation and Tocota Pluton (both blue) | • Different argillic – phyllic alteration assemblages related to known deposits based on tonality: 1 - Colo-Colo and Krammer (whitish yellow), 2 - Tres Magos (mustard yellow), 3 - Valenzuela Hill, Castaño Viejo , El Retamal, Las Timbirimbas, and Castaño Nuevo (yellow) • Argillic – phyllic alteration zones related to barren areas or unknown deposits (yellow): Vega de los Machos Formation (surrounding El Palque Formation), and alteration patches to the west of known deposits • It discriminates hydrothermal clays and micas from the non-hydrothermal mica (± clay)-rich sedimentary facies of Agua Negra Formation • Silicic alteration (blue – dark blue): Castaño Nuevo | Most comprehensive image, it effectively differentiated both lithologic units and types of hydrothermal alteration; The RGB combination of band ratios 4/5, 4/7 and 3/1 with a linear stretch of 2% contrast was developed for this study; It displayed an enhanced image that provides abundant information within one single image • The band ratios 4/5 and 4/7 were expected to enhance the detection of argillic and phyllic alteration respectively. These ratios are based on kaolinite having high reflectance in band 4 and low reflectance in band 5, whereas muscovite/illite having high reflectance in band 4 and relatively lower reflectance in band 7 • A major advantage is that areas rich in non-hydrothermal clays and/or micas ± vegetation (sediments from the floodplain adjacent to the Castaño River) are detected in white to light blue, not yellow as hydrothermal clays and micas • Bands 1 and 3 have been used traditionally to detect Fe-oxide minerals, but previous studies have documented contrasting spectral responses in felsic and mafic rocks based on these ASTER bands [67]; Basalts have low reflectance in band 1 and higher reflectance in band 3, whereas granites have opposite spectral behavior; The band ratio 3/1 was conceived to aid the detection of granitic plutons and basaltic lavas • The proposed RGB band ratio combination is similar to 4/6, 4/7, 3/1 used by Di Tommaso and Rubinstein (2007) [49], the former gives markedly better results for the study area |
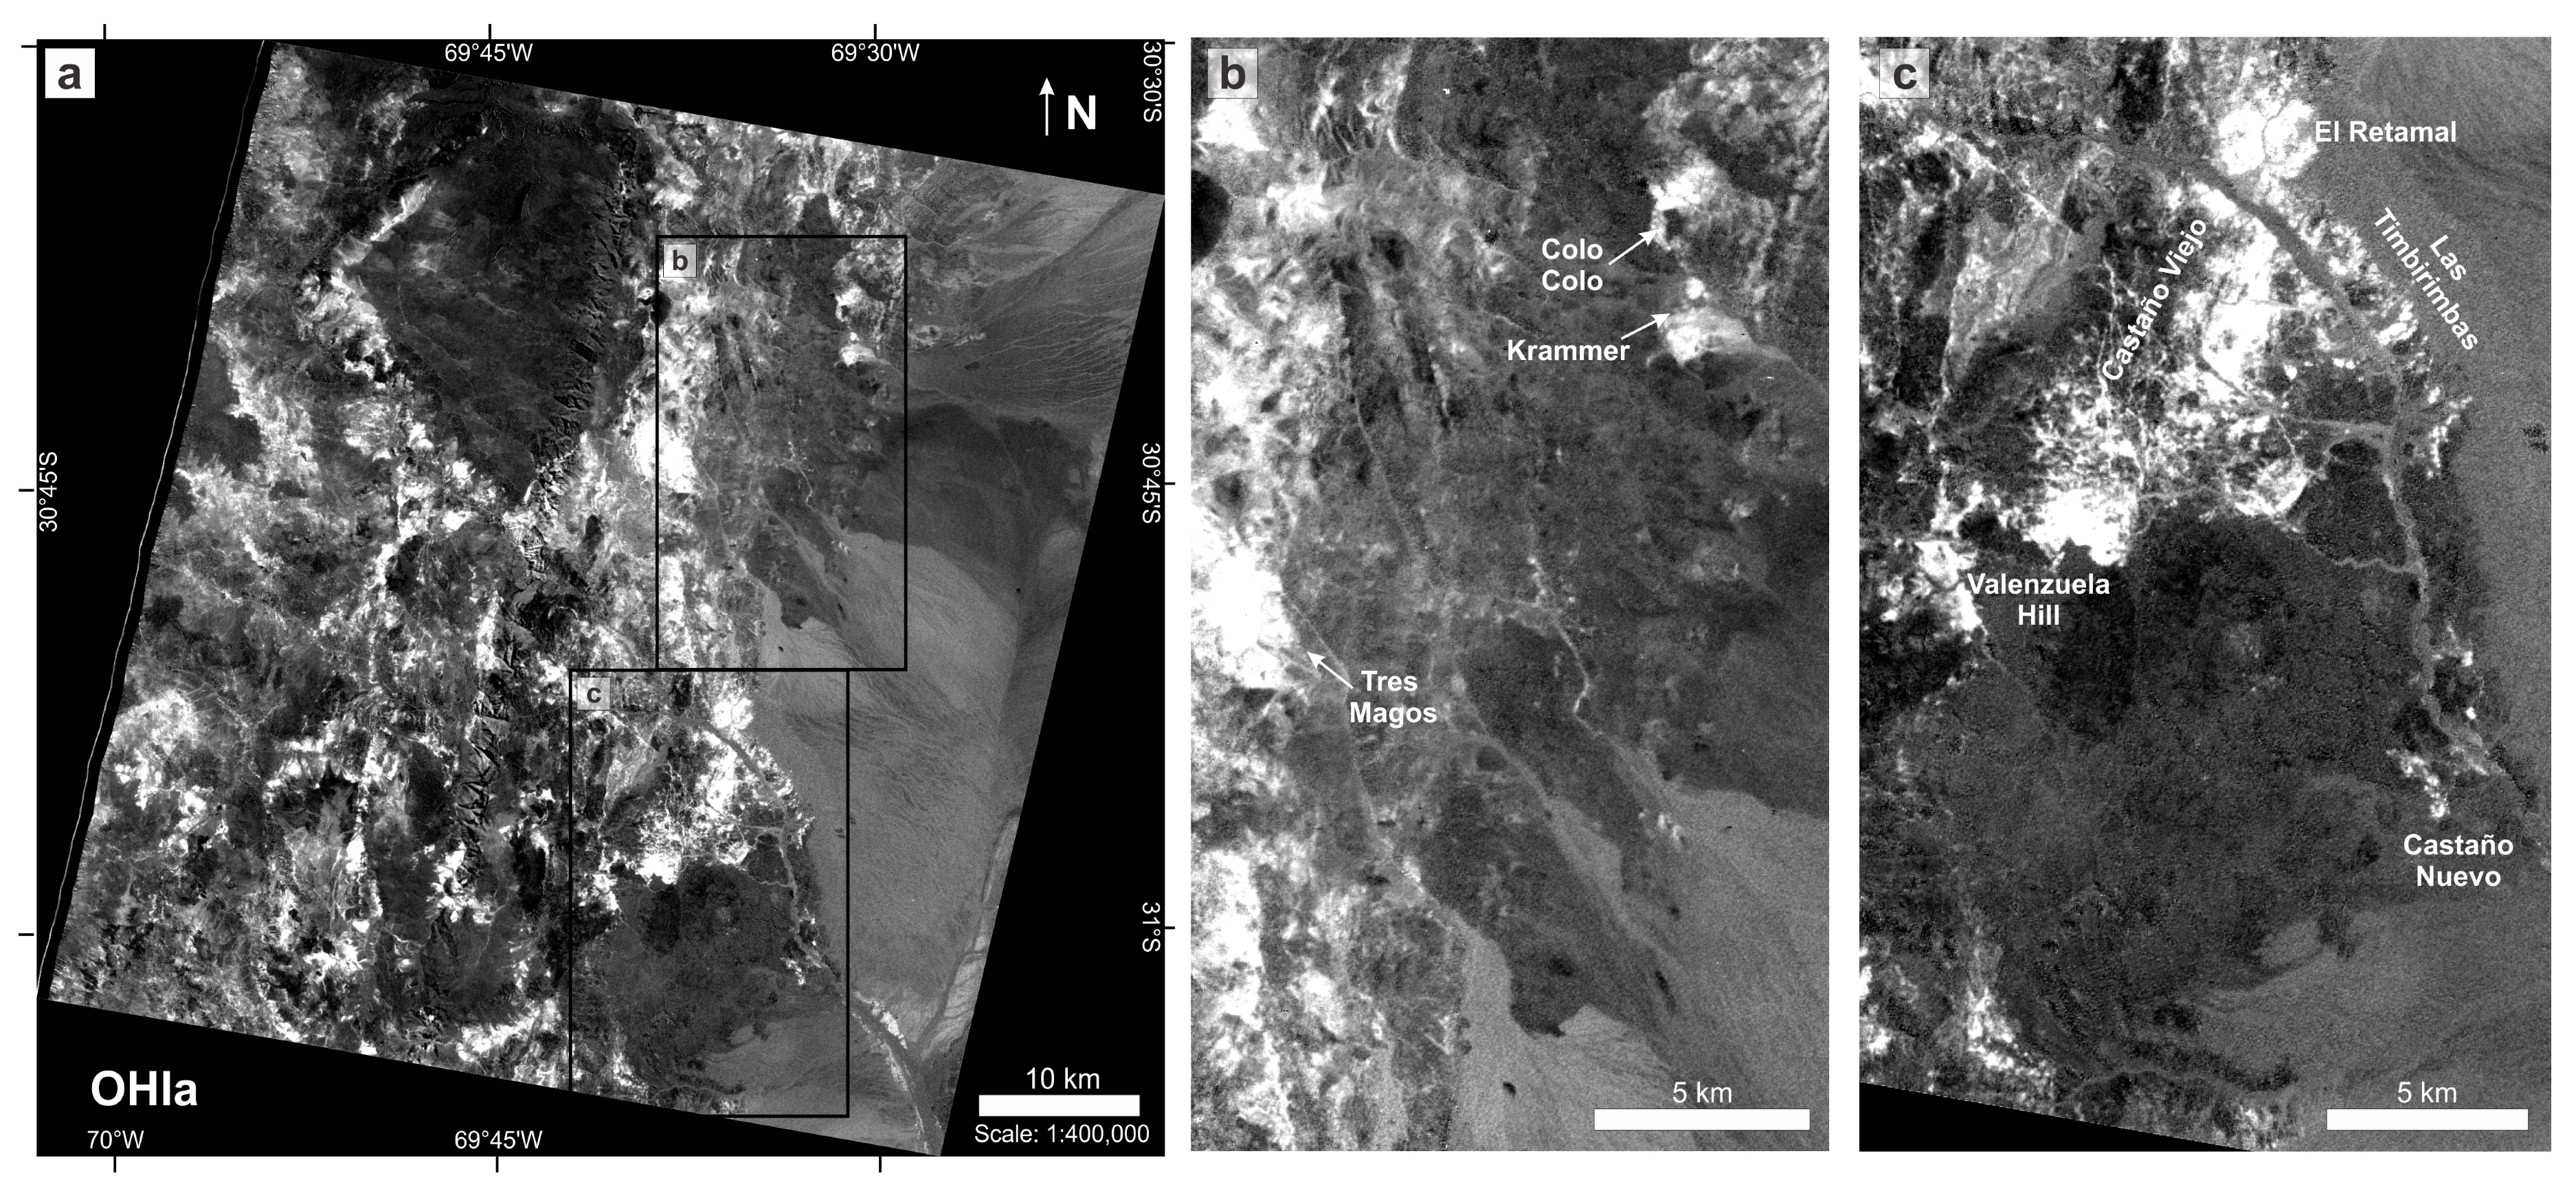
| Figure 10 – OH-bearing minerals index image (OHIa) | N/A | White pixels represent areas where it is more likely to find phyllosilicates • Alteration zones related to known deposits: Colo-Colo, Krammer, Tres Magos, Valenzuela Hill, Castaño Viejo, El Retamal, Las Timbirimbas, and the more restricted Castaño Nuevo alteration zone • Alteration zones related to barren areas or unknown deposits: Vega de los Machos Formation (surrounding El Palque Formation), alteration patches to the west of known deposits • Agua Negra Formation (light grey pixels between El Palque Formation and the Tocota Pluton) has areas with both phyllosilicate-rich siltstones facies and hydrothermal patches | • The OHIa image is a better and more useful index than OHIb for detecting alteration in the study area; The sericitic alteration zones described by Delendatti (2003) [20] in the Castaño River area are consistently detected by OHIa • Only the lower and intermediate section of Choiyoi Group exhibit an evident mica-rich hydrothermal alteration: (a) The Castaño and Vega de los Machos formations host the ore deposits and hydrothermal alteration associated to Castaño Viejo and Castaño Nuevo; (b) Westward, the Vega de los Machos ± Atutia formations have alteration patches, even though no ore deposit is known to be associated with them • Con: Alluvial deposits rich in non-hydrothermal micas and/or clays ± vegetation were also detected |
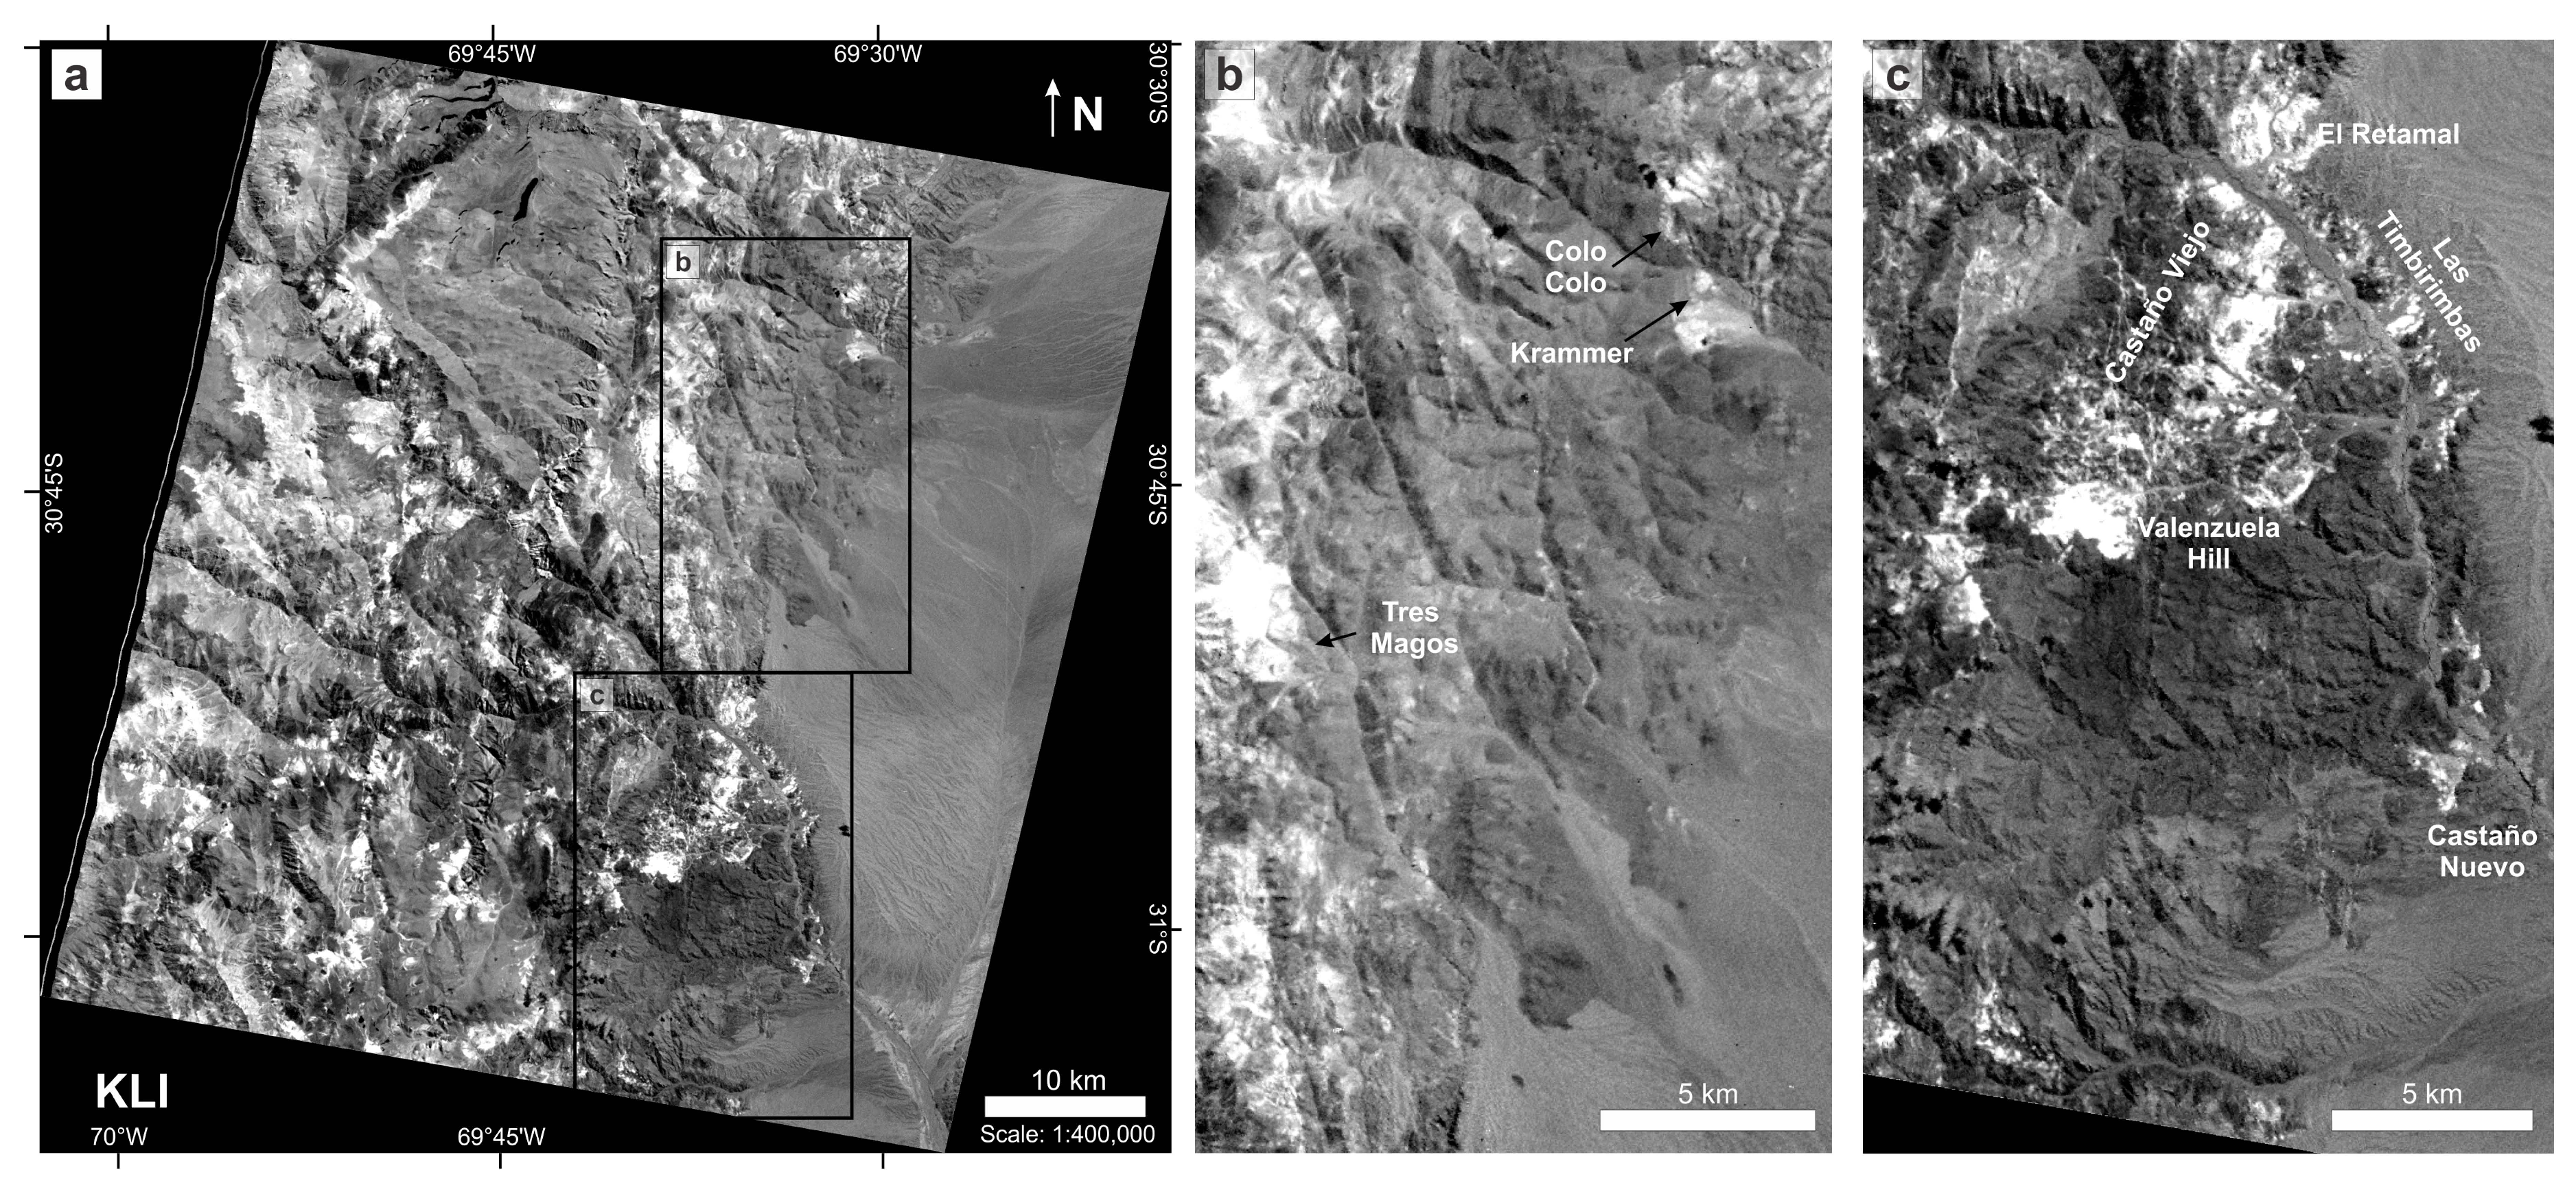
| Figure 11 – Kaolinite index image (KLI) | N/A | White pixels represent areas where it is more likely to find kaolinite • Alteration zones related to known deposits: Idem OHIa (less color contrast) • Alteration zones related to barren areas or unknown deposits: Idem OHIa (less color contrast) | • The KLI image yielded similar responses to OHIa; This behavior is due to kaolinite, which is part of the third group of OH-bearing minerals with absorption features in bands 5 and 6 • Con: Most of the pixels classified as kaolinite are likely to be muscovite or illite, as they have a regional and more abundant distribution, whereas kaolinite is mainly concentrated in the Castaño Nuevo district, as proven by PIMA [20] • Pro: Unlike OHIa, the KLI image did not highlight areas rich in non-hydrothermal clays and/or micas (i.e., primary phyllosilicate-rich siltstones facies of Agua Negra Formation and sediments ± vegetation from the floodplain adjacent to the Castaño River); Only hydrothermal phyllosilicates (± kaolinite) were detected |
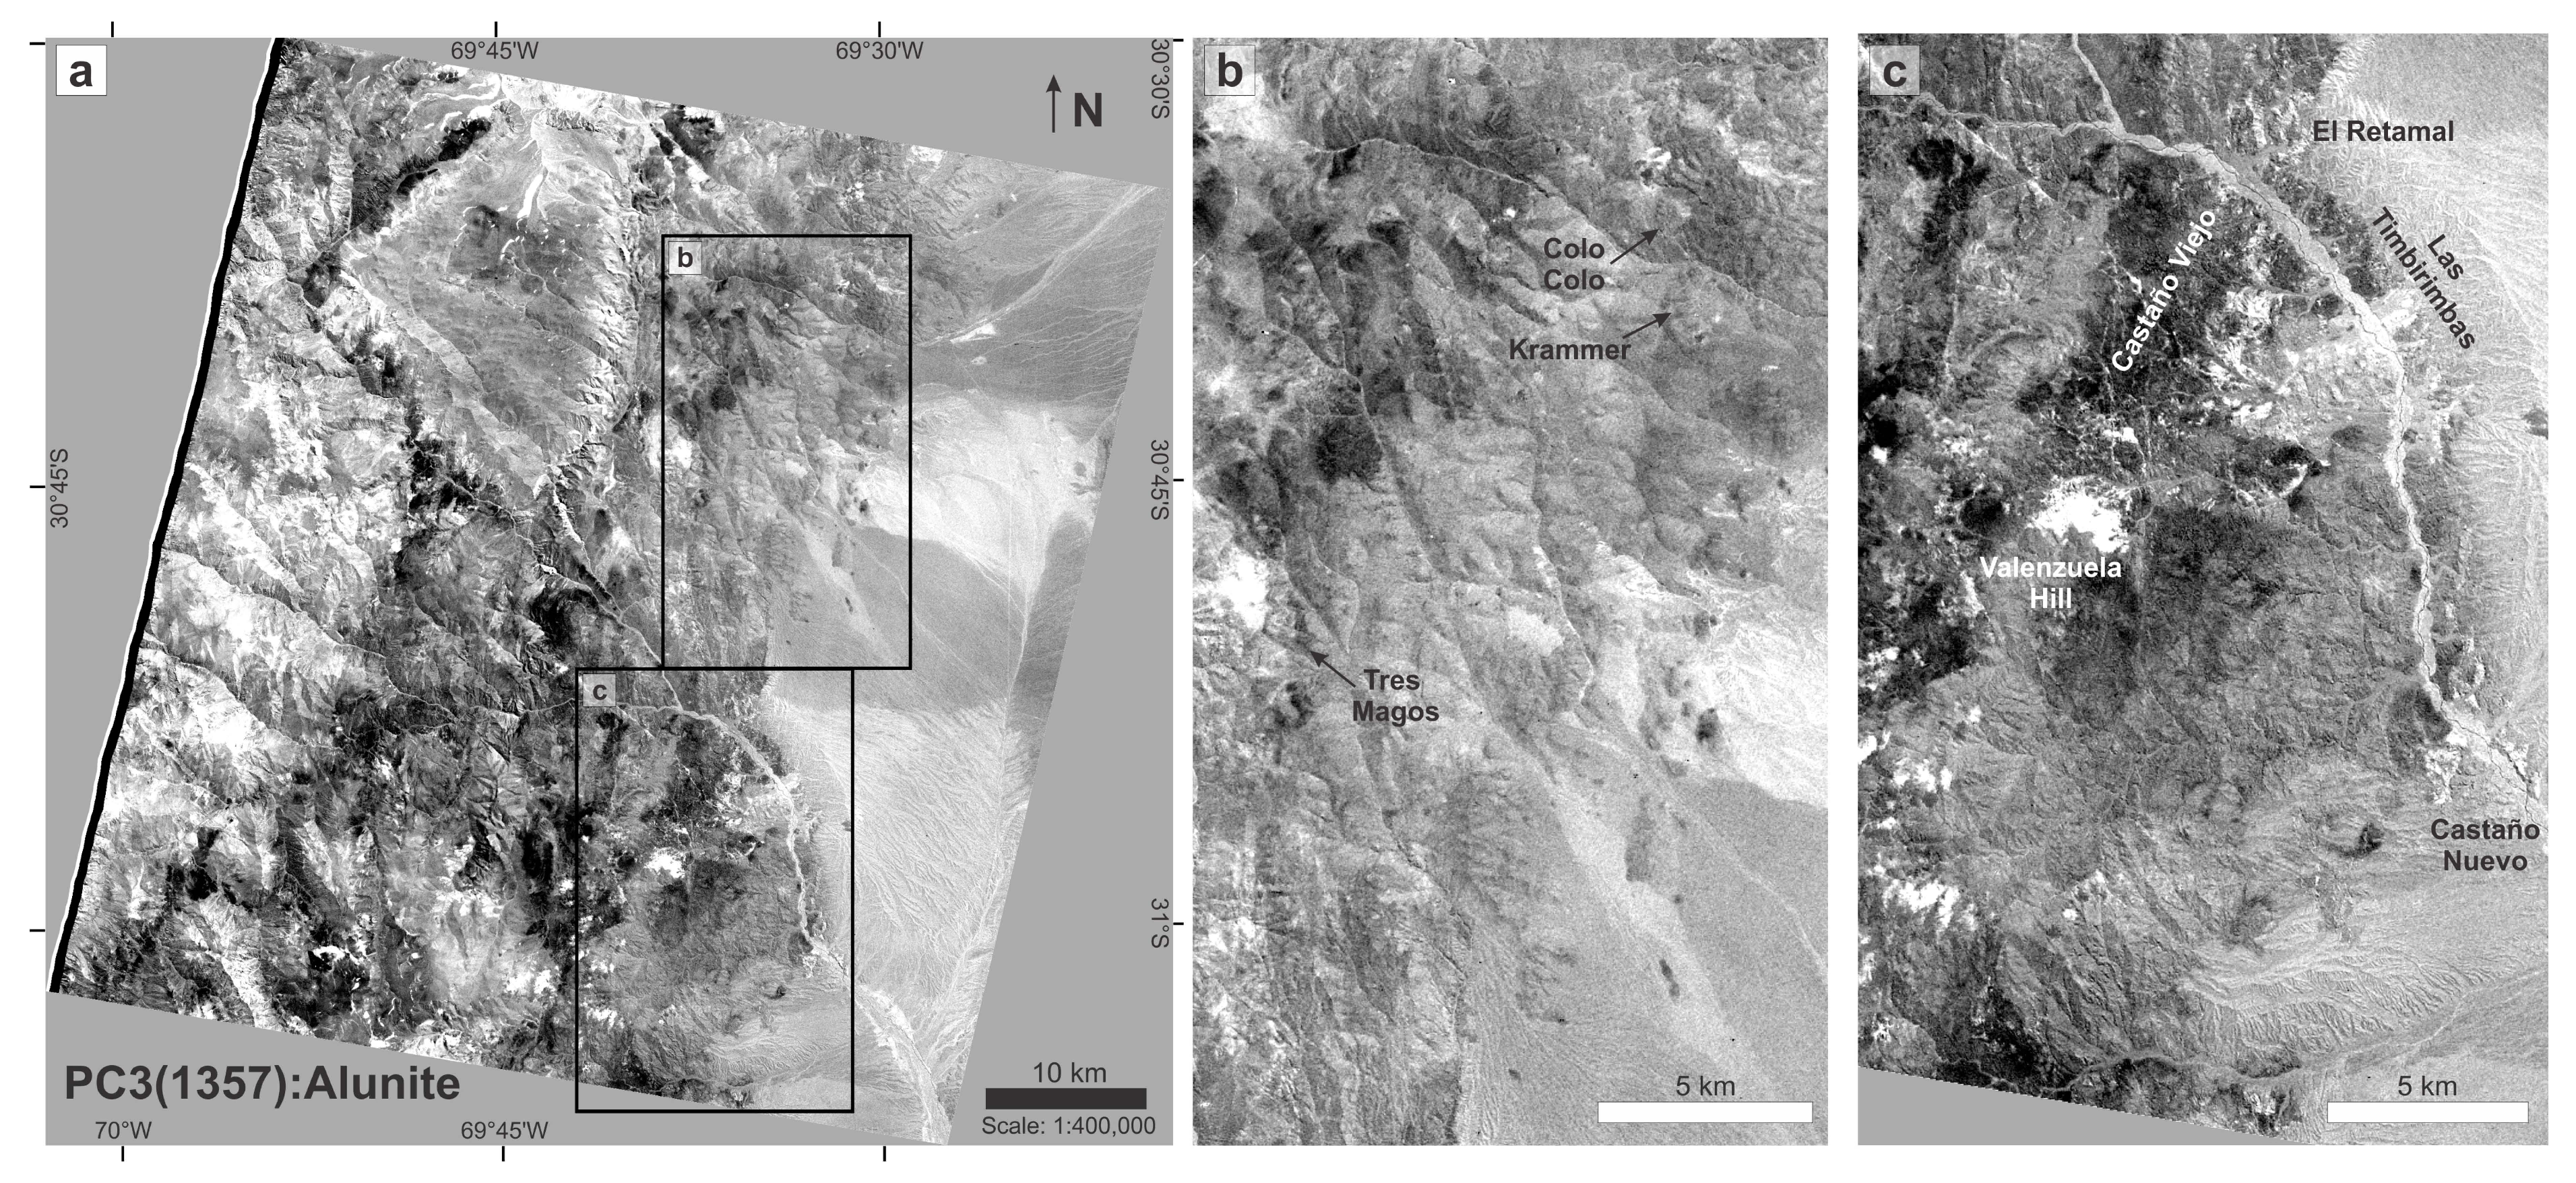
| Figure 12 – Alunite index image (ALI) | N/A | White pixels represent areas where it is more likely to find alunite • Alteration zones related to known deposits: Krammer, Tres Magos, and Valenzuela Hill | ALI’s strong responses at Valenzuela Hill, Tres Magos and Krammer are supported by field verification at Valenzuela Hill and extrapolated to Tres Magos and Krammer due to similar pixel information; Diffuse and isolated white pixels elsewhere in the Castaño Viejo region, Castaño Nuevo and Las Timbirimbas can potentially relate to trace contents of alunite (with clays and phyllosilicate admixtures); At El Retamal, the spectral response to the ALI was very poor • Con: Washed-out image; Except for the white pixels related to alunite, the overall image exhibits light grey shades with very low contrast |
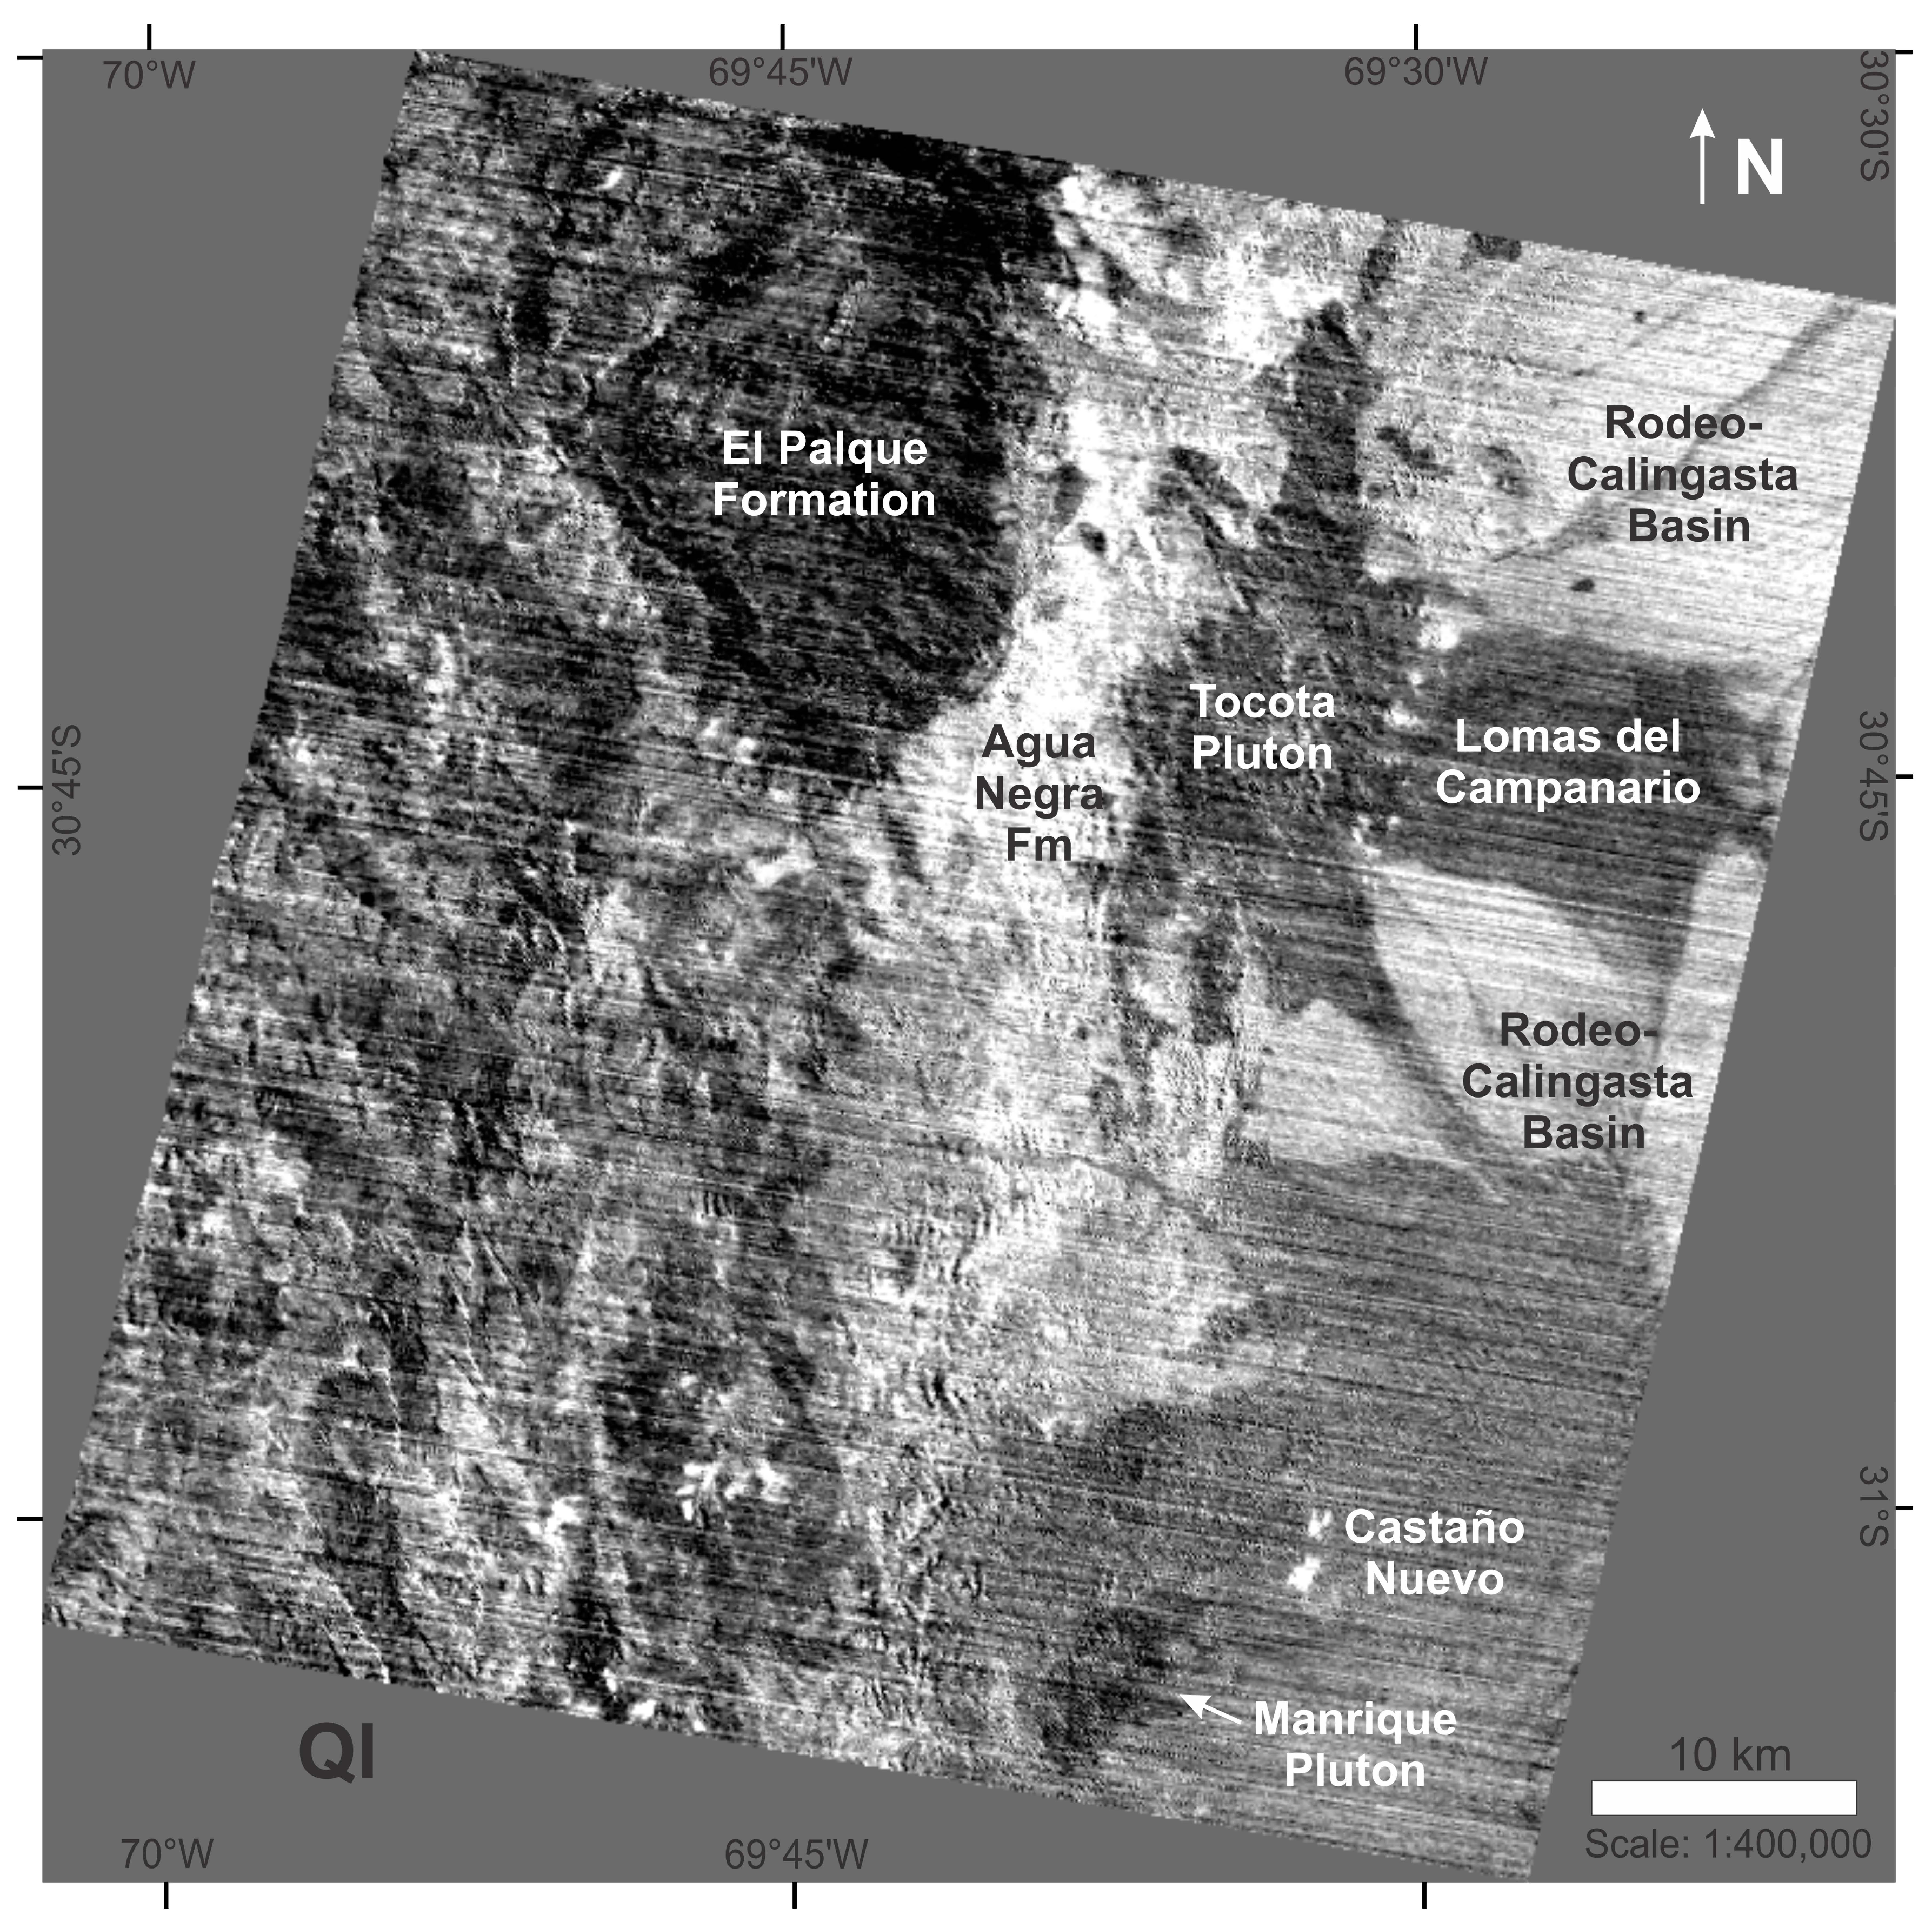
| Figure 13 – Quartz index image (QI) | • It is particularly usefully for detailed mapping of the limits of the Tocota Pluton and Lomas del Campanario Formation (dark color) • Sedimentary units including Agua Negra Formation and the alluvial fans (Rodeo-Calingasta basin) have white color • Based on color contrast, QI effectively discriminates the Tocota Pluton from the Agua Negra Formation | N/A | • It effectively discriminated the Tocota Pluton from the Agua Negra sedimentary rocks, with sharply defined limits: The Tocota Pluton contains abundant quartz and alkali feldspar, thus the dark grey shades; The sedimentary facies of Agua Negra Formation contain little or no alkali feldspar, resulting in very bright areas • The western, northern and southern limit of the Tocota Pluton are abrupt, making this index a very effective mapping tool. The contacts between the Tocota Pluton and Agua Negra Formation are undetected or less evident in other satellite images and aerial photos, and are merely simplified boundaries in geologic maps • The north-eastern and south-eastern limit of the Tocota Pluton is covered by thick unconsolidated Quaternary gravel deposits accumulated at the base of the Andes; The gravels are rich in quartz but poor in alkali feldspar, resulting in a light color contrasting with the dark pixels of the Tocota Pluton • The eastern limit of the pluton is covered by the Lomas del Campanario andesite to dacite ignimbrites and tuffs: These volcaniclastic rocks have a similar shade of grey to the Tocota Pluton making these units difficult to discriminate based on tonality; Conversely, the intrusive body has a rough texture, whereas the volcanic unit has a smoother texture, which assists in distinguishing both units |
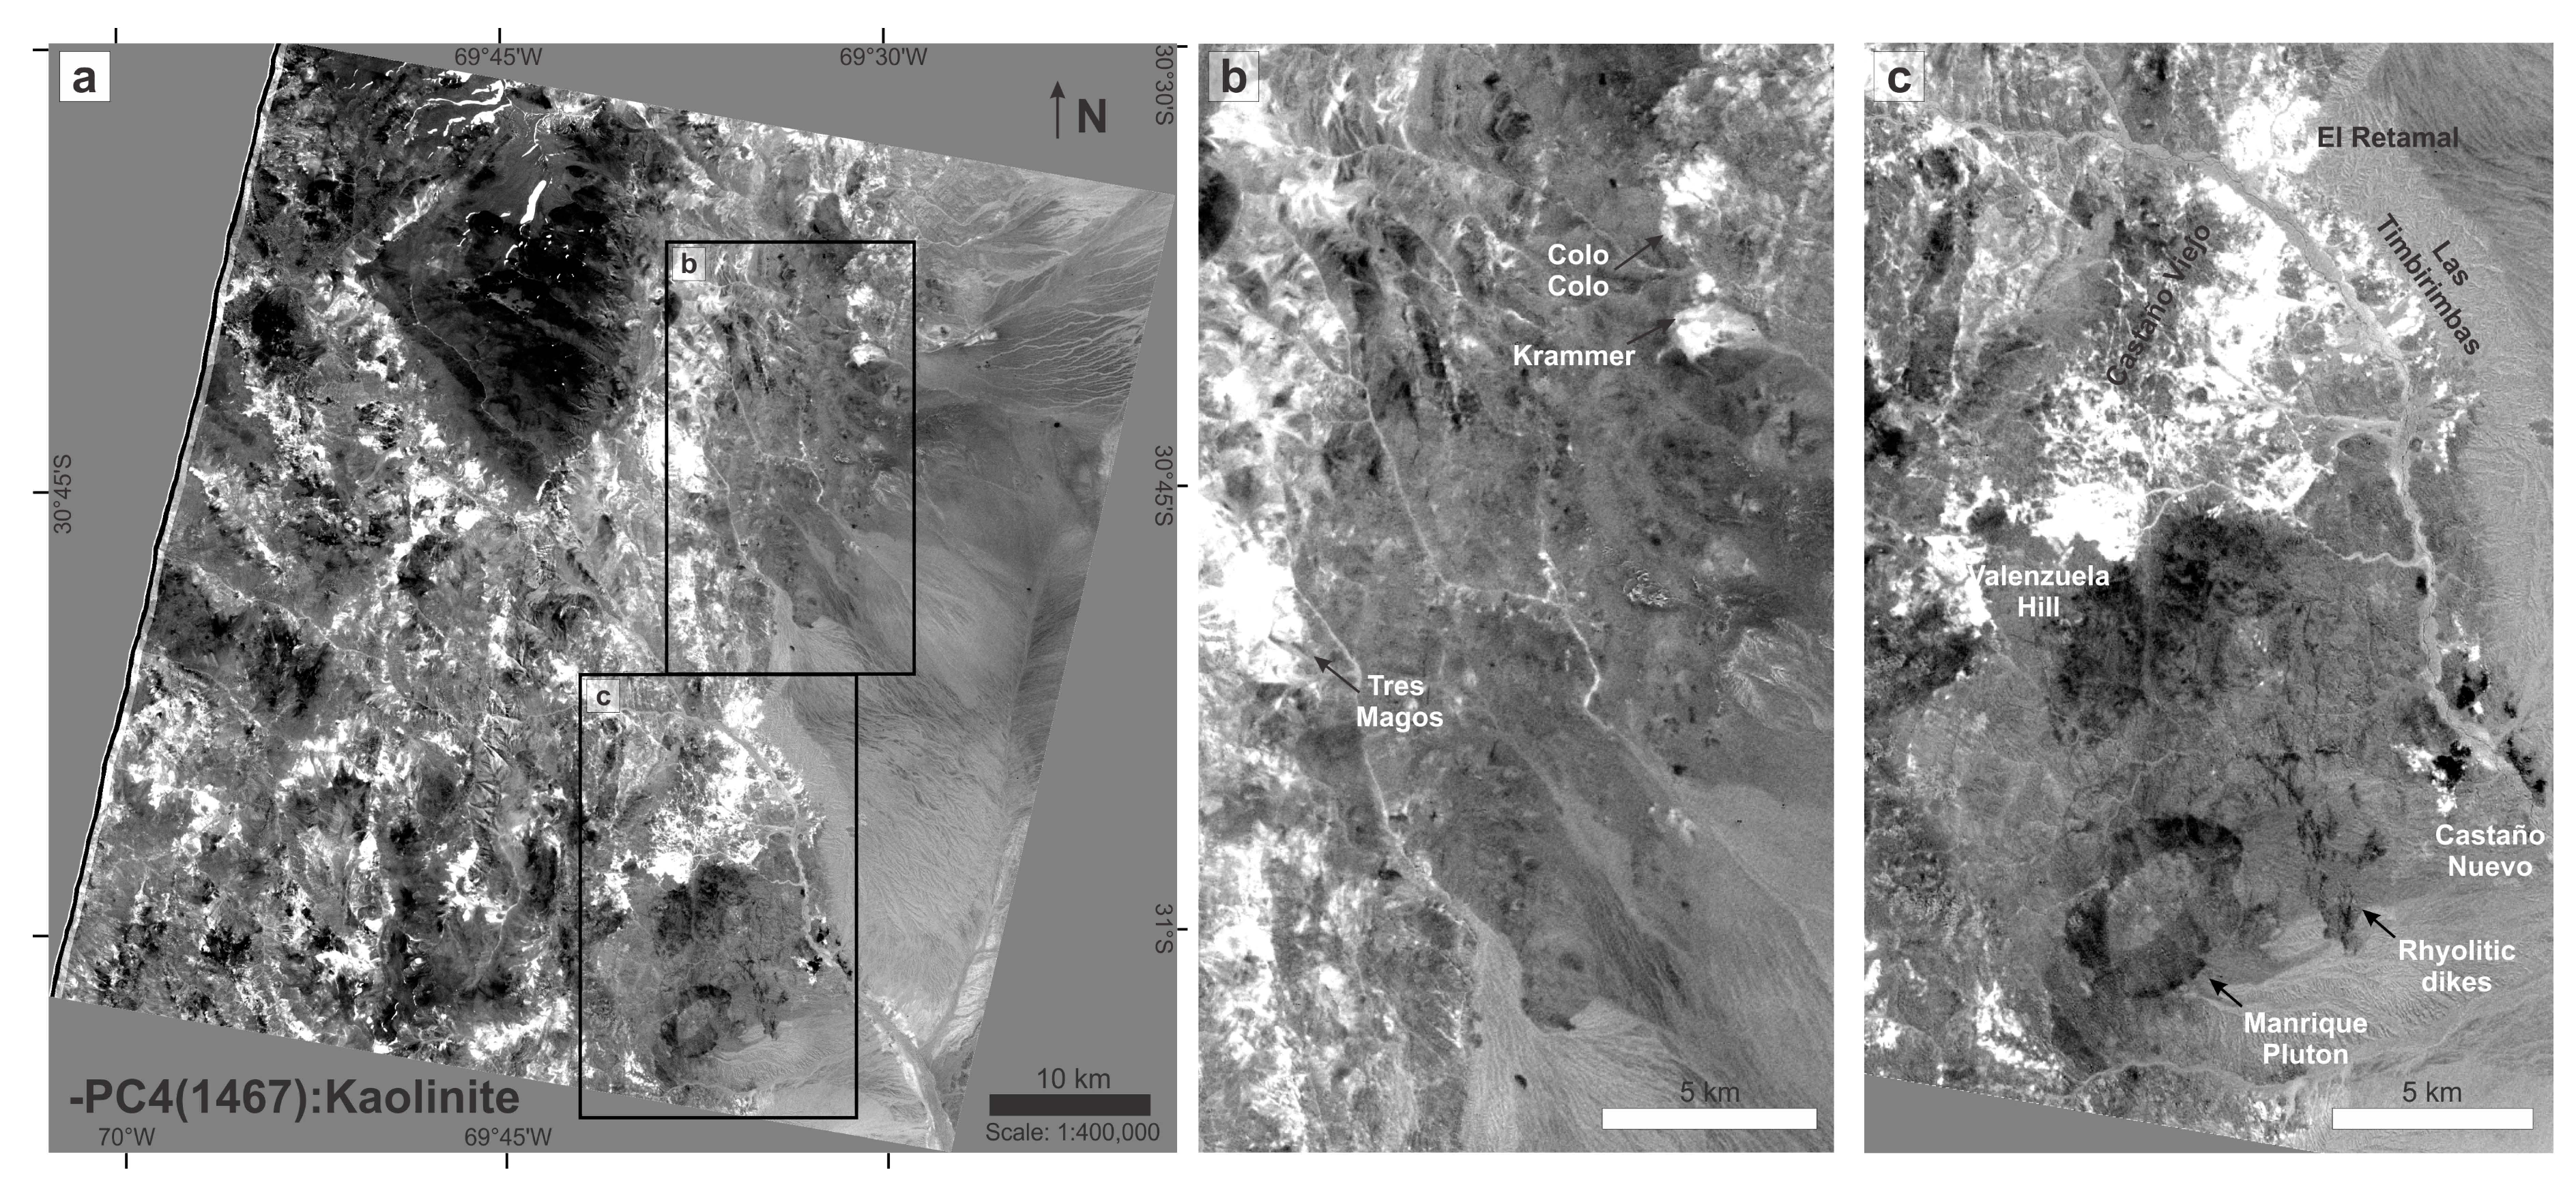
| Figure 14 – Negated principal component 4 for bands 1, 4, 6 and 7 (kaolinite) | N/A | White pixels represent areas more likely to contain kaolinite • Alteration zones related to known deposits: Colo-Colo, Krammer, Tres Magos, Valenzuela Hill, Castaño Viejo, El Retamal, Las Timbirimbas, and the more restricted Castaño Nuevo alteration zone • Alteration zones related to barren areas or unknown deposits: Vega de los Machos Formation (white outline surrounding El Palque Formation), and alteration patches to the west of known deposits | • Based on our interpretations of band operations and Ninomiya’s indices coupled with previous field studies, bright pixels are inferred to highlight areas rich in OH-bearing minerals, not only kaolinite • The dark areas in Castaño Viejo are interpreted to represent strongly silicic-altered rocks; Similarly, the dark regions near Valenzuela Hill could be areas enriched in secondary quartz, or simply silica-rich facies in the andesitic porphyry [20] • Con: Alluvial deposits rich in non-hydrothermal micas and/or clays were also detected |
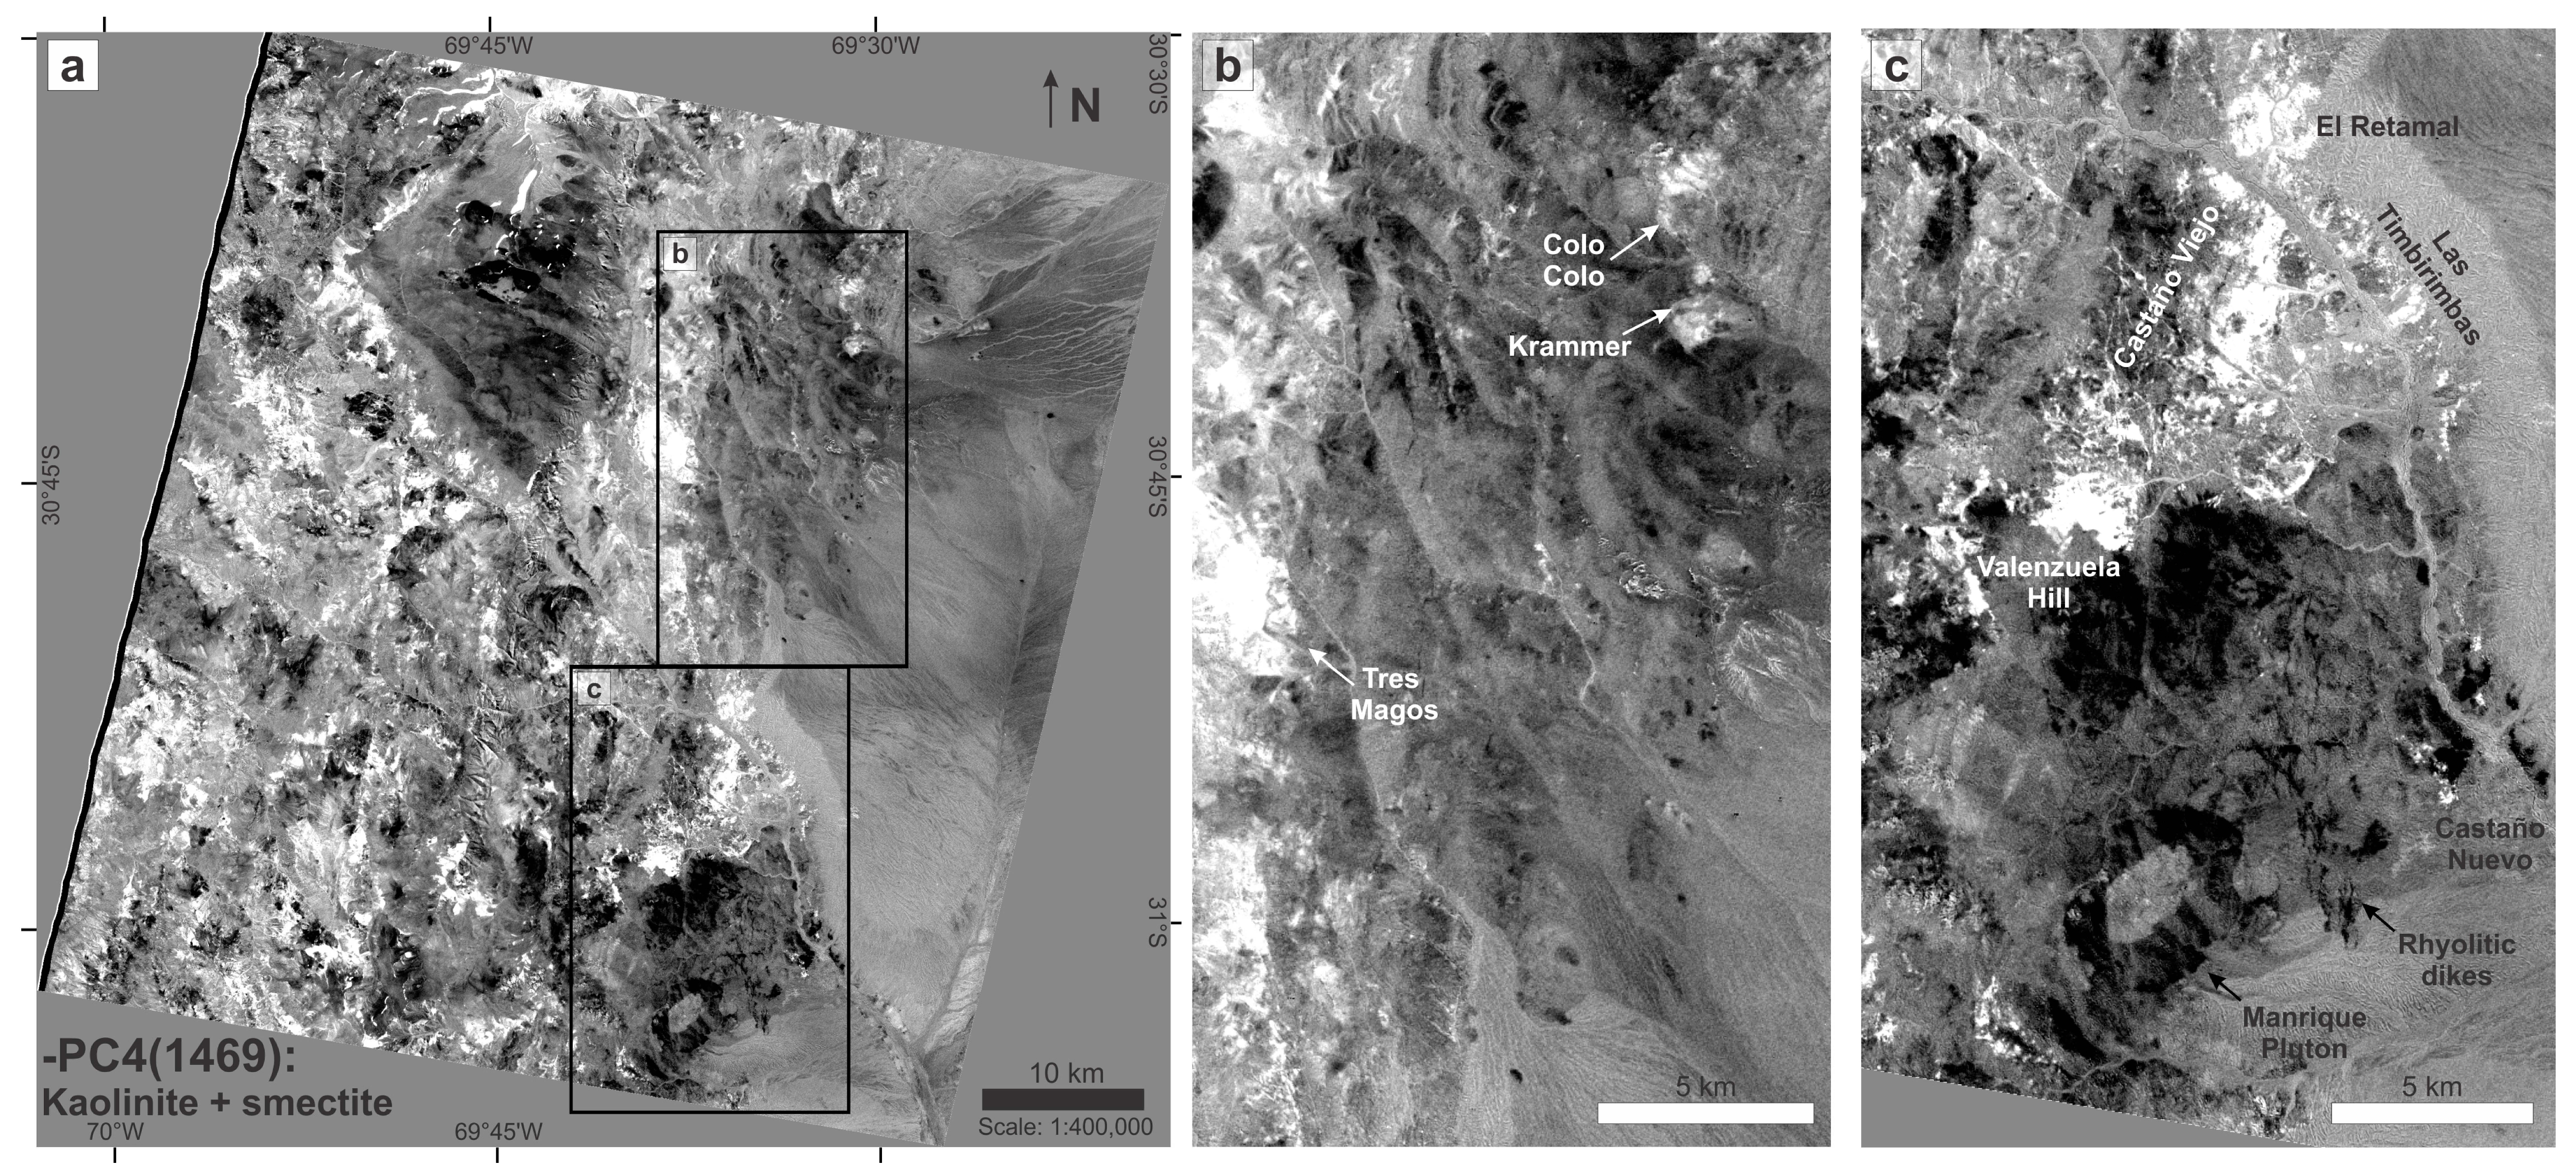
| Figure A6 – Negated principal component 4 for bands 1, 4, 6 and 9 (kaolinite and smectite) | N/A | White pixels represent areas more likely to contain kaolinite and smectite • Alteration zones related to known deposits: Idem –PC4 (1467), better contrast • Alteration zones related to barren areas or unknown deposits: Idem –PC4 (1467), better contrast | • It shows similar areas as the negated PC4 for bands 1467 • As discussed above, there are many areas with bright pixels where illite is present instead of kaolinite or smectite • The silicic-altered areas in Castaño Viejo and the silica-rich facies in Valenzuela Hill are more evident with this PC; Felsic units such as the Manrique Pluton or the N-trending rhyolitic dykes are highlighted in dark grey tones in both Figure 14 and Figure A6 • Alluvial deposits are less evident in this PCA image |
| Figure 15 – Principal component 3 for bands 1, 3, 5 and 7 (alunite) | N/A | White pixels represent areas more likely to contain alunite • Alteration zones related to known deposits: Tres Magos, and Valenzuela Hill | • It shows consistent areas with ALI; This image has markedly less ‘noise’ (bright pixels unrelated to alunite), and is less washed out than ALI • Cluster of white pixels located close to Valenzuela Hill and close to the Tres Magos mine (unlike ALI, the alteration at Krammer is undetected) • The large NNE-trending hydrothermal alteration in the Castaño Viejo district is no longer evident, only scarce white pixels at Castaño Viejo, El Retamal and Las Timbirimbas; Similarly, the alteration zones at Krammer and Colo-Colo are not highlighted due to alunite absence • Valenzuela Hill is the only control area where alunite is abundant and detected by PIMA [20]. No PIMA/TerraSpec data is available for the Tres Magos area, but based on similar pixel information (and consistency with ALI) the presence of alunite may be inferred |
References
- Hunt, G.R. Spectral signatures of particulate minerals in the visible and near infrared. Geophysics 1977, 42, 501–513. [Google Scholar] [CrossRef] [Green Version]
- Hunt, G.R.; Ashley, R.P. Spectra of altered rocks in the visible and near infrared. Econ. Geol. 1979, 74, 1613–1629. [Google Scholar] [CrossRef]
- Crowley, J.K.; Vergo, N. Near-infrared reflectance spectra of mixtures of kaolin-goup minerals: Use in clay mineral studies. Clays Clay Miner. 1988, 36, 310–316. [Google Scholar] [CrossRef]
- Clark, R.N.; King, T.V.V.; Klejwa, M.; Swayze, G.A.; Vergo, N. High spectral resolution reflectance spectroscopy of minerals. J. Geophys. Res. 1990, 95, 12653–12680. [Google Scholar] [CrossRef]
- Hunt, G.R.; Salisbury, J.W. Mid-Infrared Spectral Behavior of Igneous Rocks; Technical Report AFRCL-TR-75-0356; Air Force Cambridge Research Laboratories: Cambridge, MA, USA, 1974. [Google Scholar]
- Markham, B.; Storey, J.; Morfitt, R. Landsat-8 sensor characterization and calibration. Remote Sens. 2015, 7, 2279–2282. [Google Scholar] [CrossRef]
- Loughlin, W.P. Principal component analysis for alteration mapping. Photogramm. Eng. Remote Sens. 1991, 57, 1163–1169. [Google Scholar]
- Nielsen, R.L.; Mancuso, J.D.; Miller, R.A.; Sabins, F.F., Jr. Use of Thematic Mapping Imagery in Generative Mineral Exploration, Central Andes of South America; Preprint Number 95-9; Society for Mining, Metallurgy and Exploration Inc.: Englewood, CO, USA, 1995; pp. 1–5. [Google Scholar]
- Knight, E.J.; Kvaran, G. Landsat-8 operational land imager design, characterization and performance. Remote Sens. 2014, 6, 10286–10305. [Google Scholar] [CrossRef]
- Kaab, A.; Huggel, C.; Paul, F.; Wessels, R.; Raup, B.; Kieffer, H.; Kargel, J. Glacier monitoring from ASTER imagery: Accuracy and applications. In Proceedings of the EARSeL-LISSIG-Workshop Observing our Cryosphere from Space, Bern, Switzerland, 11–13 March 2002; pp. 43–53. [Google Scholar]
- Barsi, J.A.; Schott, J.R.; Hook, S.J.; Raqueno, N.G.; Markham, B.L.; Radocinski, R.G. Landsat-8 thermal infrared sensor (TIRS) vicarious radiometric calibration. Remote Sens. 2014, 6, 11607–11626. [Google Scholar] [CrossRef]
- Irons, J.R.; Taylor, M.P.; Rocchio, L. Landsat Science—Landsat 8. Available online: https://landsat.gsfc.nasa.gov/landsat-data-continuity-mission/ (accessed on 20 November 2017).
- Barsi, J.A.; Lee, K.; Kvaran, G.; Markham, B.L.; Pedelty, J.A. The spectral response of the Landsat-8 operational land imager. Remote Sens. 2014, 6, 10232–10251. [Google Scholar] [CrossRef]
- Abrams, M.; Hook, S.J. Simulated ASTER data for geologic studies. IEEE Trans. Geosci. Remote Sens. 1995, 33, 692–699. [Google Scholar] [CrossRef]
- Fujisada, H. Design and performance of ASTER instrument. Proc. SPIE 1995, 16–25. [Google Scholar]
- Yamaguchi, Y.; Fujisada, H.; Kudoh, M.; Kawakami, T.; Tsu, H.; Kahle, A.B.; Pniel, M. ASTER instrument characterization and operation scenario. Adv. Space Res. 1999, 23, 1415–1424. [Google Scholar] [CrossRef]
- Abrams, M. The Advanced Spaceborne Thermal Emission and Reflection Radiometer (ASTER): Data products for the high spatial resolution imager on NASA’s Terra platform. Int. J. Remote Sens. 2000, 21, 847–859. [Google Scholar] [CrossRef]
- Yamaguchi, Y.I.; Fujisada, H.; Kahle, A.B.; Tsu, H.; Kato, M.; Watanabe, H.; Sato, I.; Kudoh, M. ASTER instrument performance, operation status and application to Earth sciences. In Proceedings of the IEEE International Geosciences and Remote Sensing Symposium, Sydney, Australia, 9–13 July 2001; Volume 3, pp. 1215–1216. [Google Scholar]
- Abrams, M.; Hook, S.; Ramachandran, B. ASTER User Handbook; Version 2; Jet Propulsion Laboratory and EROS Data Center, NASA: Sioux Falls, SD, USA, 2002.
- Delendatti, G.L. Caracterización de zonas de alteración hidrotermal en las márgenes del río Castaño, provincia de San Juan, mediante procesamiento digital de imágenes TM. Revista de la Asociación Geológica Argentina 2003, 58, 97–108. [Google Scholar]
- Testa, F.J. Geology, Alteration, Mineralization and Geochemistry of Tourmaline Breccia Complexes in the Andes: Rio Blanco-Los Bronces, Chile and San Francisco de los Andes, Argentina. Ph.D. Thesis, University of Tasmania, Hobart, Australia, 2017. [Google Scholar]
- Ninomiya, Y. A Stabilized Vegetation Index and Several Mineralogic Indices Defined for ASTER VNIR and SWIR Data. In Proceedings of the IEEE International Geoscience and Remote Sensing Symposium, Toulouse, France, 21–25 July 2003; Volume 3, pp. 1552–1554. [Google Scholar]
- Ninomiya, Y. Lithologic mapping with multispectral ASTER TIR and SWIR data. Proc. SPIE 2004, 5234, 180–190. [Google Scholar]
- Ninomiya, Y.; Fu, B. Quartz index, carbonate index and SiO2 content index defined for ASTER TIR data. J. Remote Sens. Soc. Jpn. 2002, 22, 50–61. [Google Scholar]
- Crósta, A.P.; De Souza Filho, C.R.; Azevedo, F.; Brodie, C. Targeting key alteration minerals in epithermal deposits in Patagonia, Argentina, using ASTER imagery and principal component analysis. Int. J. Remote Sens. 2003, 24, 4233–4240. [Google Scholar] [CrossRef]
- Rodrı́guez Fernández, L.R.; Heredia, N.; Gallastegui, G.; Quesada, C.; Robador, A.; Marı́n, G.; Cardó, D.R. Texto Explicativo de la Carta Geológica No 3169-14 a Escala 1:100.000 (Paraje de Castaño Viejo); Instituto de Geología y Recursos Minerales, Servicio Geológico Minero Argentino (SEGEMAR): Buenos Aires, Argentina, 1996; p. 145.
- Rodrı́guez Fernández, L.R.; Heredia, N.; Marín, G.; Quesada, C.; Robador, A.; Ragona, D.; Cardó, R. Tectonoestratigrafia y estructura de los Andes Argentinos entre los 30°30′y 31°00′ de latitud Sur. In Proceedings of the XIII Congreso Geológico Argentino y III Congreso de Exploración de Hidrocarburos, Buenos Aires, Argentina, 13–18 October 1996; Volume II, pp. 111–124. [Google Scholar]
- Espina, R.G.; Cegarra, M.; Ragona, D.; Gonzalez, P.D.; Lo Forte, G.L.; Escuer, J.; Arias, D. Descripción Geológica de la Hoja “Paraje Castaño Nuevo”, No 3169-20, Provincia de San Juan. Escala 1:100.000; Secretaría de Minería de la Nación: Buenos Aires, Argentina, 1998; p. 85. [Google Scholar]
- Cegarra, M.I.; Ragona, D.; García Espina, R.; González, P.D.; Lo Forte, G.L.; Sato, A.M. Estratigrafía de la región de Castaño Nuevo, Cordillera Frontal de San Juan. In Proceedings of the 10° Congreso Latinoamericano de Geología y 6° Congreso Nacional de Geología Económica, Buenos Aires, Argentina, 8–13 Novermber 1998; Volume 1, pp. 85–90. [Google Scholar]
- Heredia, N.; Rodrı́guez Fernández, L.R.; Gallastegui, G.; Busquets, P.; Colombo, F. Geological setting of the Argentine Frontal Cordillera in the flat-slab segment (30°00′–31°30′S latitude). J. S. Am. Earth Sci. 2002, 15, 79–99. [Google Scholar] [CrossRef]
- Rodrı́guez Fernández, L.R.; Heredia, N.; Espina, R.G.; Cegarra, M.I. Estratigrafía y estructura de los Andes Centrales Argentinos entre los 30° y 31° de Latitud Sur. Stratigraphy and Structure of the Argentine Central Andes between 30° and 31° S latitude. Acta Geológica Hispánica 1999, 32, 51–75. [Google Scholar]
- Cardó, R.; Díaz, I.N. Descripción de la Hoja Geológica 3169-1 Rodeo, Provincia de San Juan. Escala 1:250.000; Instituto de Geología y Recursos Minerales, Servicio Geológico Minero Argentino (SEGEMAR): Buenos Aires, Argentina, 2005; p. 47.
- Cardó, R. Distrito polimetálico Castaño Viejo, San Juan. In Recursos Minerales de la República Argentina; Zappettini, E.O., Ed.; Instituto de Geología y Recursos Minerales, SEGEMAR: Buenos Aires, Argentina, 1999; pp. 857–863. [Google Scholar]
- Troy Resources Limited—Castaño Nuevo Project. Available online: http://www.troyres.com.au/ (accessed on 2 August 2014).
- Hedenquist, J.W. Research Applied to Mineral Exploration: Observations on Epithermal Mineralization in the Casposo and Castaño Nuevo Districts, San Juan, Argentina; Hedenquist Consulting, Inc.: Ottawa, ON, Canada, 2012; pp. 1–28. [Google Scholar]
- Angelelli, V. Yacimientos Metaliferos de la Republica Argentina; Comisión de Investigaciones Científicas de la Provincia de Buenos Aires, Facultad de Ciencias Naturales y Museo de La Plata—UNLP, Instituto de Geologia Aplicada: La Plata, Argentina, 1984; pp. 1–704. [Google Scholar]
- Testa, F.; Cooke, D.; Zhang, L.; Mas, G. Bismoclite (BiOCl) in the San Francisco de los Andes Bi–Cu–Au Deposit, Argentina. First Occurrence of a Bismuth Oxychloride in a Magmatic–Hydrothermal Breccia Pipe and Its Usefulness as an Indicator Phase in Mineral Exploration. Minerals 2016, 6, 62. [Google Scholar] [CrossRef]
- Cardó, R.; Segal, S.; Korzeniewski, L.I.; Palacio, M.B.; Chernicoff, C. Estudio Metalogenético de brechas hidrotermales portadoras de mineralización de Bi–Au–Cu en el ámbito de Cordillera Frontal, provincia de San Juan. In Serie Contribuciones Técnicas, Recursos Minerales N° 31; Servicio Geologico Minero Argentino, SEGEMAR: Buenos Aires, Argentina, 2008; pp. 2–28. [Google Scholar]
- Wetten, A.F. Distrito Minero Tocota, San Juan. In Recursos Minerales de la República Argentina; Zappettini, E.O., Ed.; Instituto de Geología y Recursos Minerales, SEGEMAR: Buenos Aires, Argentina, 1999; pp. 821–827. [Google Scholar]
- Machuca, E.; Grassi, I.; Cruz, P.; Rodríguez, J.; Atencio, M.; Ledesma, M. Evidencias de un pórfido mineralizado en el area de Tocota, departamento Iglesia, San Juan, Argentina. In Proceedings of the 7° Congreso Geológico Chileno, Concepcion, Chile, 17–21 October 1994; Volume II, pp. 843–847. [Google Scholar]
- Delendatti, G.L.; Bastías, H. Características de la alteración hidrotermal en el distrito El Retamal, San Juan, y su relación con zonas anómalas en Au–Cu. In Proceedings of the VII Congreso Argentino de Geología Económica, Salta, Argentina, 26–28 September 2001; Volume 1, pp. 73–76. [Google Scholar]
- Exelis Visual Information Solutions (ENVI). Atmospheric Correction Module: QUAC and FLAASH User’s Guide; Exelis Visual Information Solutions: Porter, CO, USA, 2009. [Google Scholar]
- Adler-Golden, S.; Berk, A.; Bernstein, L.S.; Richtsmeier, S.; Acharya, P.; Matthew, M.W.; Anderson, G.P.; Allred, C.L.; Jeong, L.S.; Chetwynd, J. Flaash, a modtran4 atmospheric correction package. In AVIRIS Workshop Proceedings; NASA Jet Propulsion Laboratory, California Institute of Technology: La Cañada Flintridge, CA, USA, 1998; Volume 4. [Google Scholar]
- Rani, N.; Mandla, V.R.; Singh, T. Evaluation of atmospheric corrections on hyperspectral data with special reference to mineral mapping. Geosci. Front. 2017, 8, 797–808. [Google Scholar] [CrossRef]
- Chang, Z.; Yang, Z. Scientific Communications: Evaluation of Inter-Instrument Variations among Short Wavelength Infrared (SWIR) Devices. Econ. Geol. 2012, 107, 1479–1488. [Google Scholar] [CrossRef]
- Baldridge, A.M.; Hook, S.J.; Grove, C.I.; Rivera, G. The ASTER spectral library version 2.0. Remote Sens. Environ. 2009, 113, 711–715. [Google Scholar] [CrossRef]
- Mars, J.C.; Rowan, L.C. Regional mapping of phyllic- and argillic-altered rocks in the Zagros magmatic arc, Iran, using Advanced Spaceborne Thermal Emission and Reflection Radiometer (ASTER) data and logical operator algorithms. Geosphere 2006, 2, 161–186. [Google Scholar] [CrossRef]
- Pour, A.B.; Hashim, M. The application of ASTER remote sensing data to porphyry copper and epithermal gold deposits. Ore Geol. Rev. 2012, 44, 1–9. [Google Scholar] [CrossRef] [Green Version]
- Di Tommaso, I.; Rubinstein, N. Hydrothermal alteration mapping using ASTER data in the Infiernillo porphyry deposit, Argentina. Ore Geol. Rev. 2007, 32, 275–290. [Google Scholar] [CrossRef]
- Hunt, G.R.; Salisbury, J.W. Visible and near infrared spectra of minerals and rocks: II. Carbonates. Mod. Geol. 1971, 2, 23–30. [Google Scholar]
- Hunt, G.R. Near-infrared (1.3–2.4) μm spectra of alteration minerals—Potential for use in remote sensing. Geophysics 1979, 44, 1974–1986. [Google Scholar] [CrossRef]
- Spatz, D.M.; Wilson, R.T. Remote sensing characteristics of porphyry copper systems, western America Cordillera. In Porphyry Copper Deposits of the American Cordillera; Pierce, F.W., Bolm, J.G., Eds.; Arizona Geological Society Digest: Tucson, AZ, USA, 1995; pp. 94–108. [Google Scholar]
- Dalton, J.B.; Bove, D.J.; Mladinich, C.S.; Rockwell, B.W. Identification of spectrally similar materials using the USGS Tetracorder algorithm: The calcite–epidote–chlorite problem. Remote Sens. Environ. 2004, 89, 455–466. [Google Scholar] [CrossRef]
- Rowan, L.C.; Schmidt, R.G.; Mars, J.C. Distribution of hydrothermally altered rocks in the Reko Diq, Pakistan mineralized area based on spectral analysis of ASTER data. Remote Sens. Environ. 2006, 104, 74–87. [Google Scholar] [CrossRef]
- Boloki, M.; Poormirzaee, R. Using ASTER Image Processing for Hydrothermal Alteration and Key Alteration Minerals Mapping in Siyahrud area, IRAN. Int. J. Geol. 2009, 3, 38–43. [Google Scholar]
- Alimohammadi, M.; Alirezaei, S.; Kontak, D.J. Application of ASTER data for exploration of porphyry copper deposits: A case study of Daraloo-Sarmeshk area, southern part of the Kerman copper belt, Iran. Ore Geol. Rev. 2015, 70, 290–304. [Google Scholar] [CrossRef]
- Feizi, F.; Mansuri, E. Identification of Alteration Zones with Using ASTER Data in A Part of Qom Province, Central Iran. J. Basic Appl. Sci. Res. 2012, 2, 10173–10184. [Google Scholar]
- Rowan, L.C.; Mars, J.C. Lithologic mapping in the Mountain Pass, California area using Advanced Spaceborne Thermal Emission and Reflection Radiometer (ASTER) data. Remote Sens. Environ. 2003, 84, 350–366. [Google Scholar] [CrossRef]
- Rowan, L.C.; Mars, J.C.; Simpson, C.J. Lithologic mapping of the Mordor, NT, Australia ultramafic complex by using the Advanced Spaceborne Thermal Emission and Reflection Radiometer (ASTER). Remote Sens. Environ. 2005, 99, 105–126. [Google Scholar] [CrossRef]
- Van der Meer, F.D.; van der Werff, H.M.A.; van Ruitenbeek, F.J.A.; Hecker, C.A.; Bakker, W.H.; Noomen, M.F.; van der Meijde, M.; Carranza, E.J.M.; De Smeth, J.B.; Woldai, T. Multi- and hyperspectral geologic remote sensing: A review. Int. J. Appl. Earth Obs. Geoinf. 2012, 14, 112–128. [Google Scholar] [CrossRef]
- Van der Meer, F.D.; van der Werff, H.M.A.; van Ruitenbeek, F.J.A. Potential of ESA’s Sentinel-2 for geological applications. Remote Sens. Environ. 2014, 148, 124–133. [Google Scholar] [CrossRef]
- Hewson, R. Summary of the 22nd ASTER Science Meeting, Tokyo, Japan, 20–23 May 2002. Available online: http://www.eoc.csiro.au/reports/hewson/22aster.htm (accessed on 29 January 2018).
- Marquetti, C.; Becchio, R.; Seggiaro, R.; Nakashima, K. Aplicacion de datos ASTER para el mapeo de la hoja geológica Andalgalá, Catamarca, Argentina. In Proceedings of the 1° Simposio ASTER–GEOSAT, Buenos Aires, Argentina, 4–5 November 2004. [Google Scholar]
- Amer, R.; Kusky, T.; Ghulam, A. Lithological mapping in the Central Eastern Desert of Egypt using ASTER data. J. Afr. Earth Sci. 2010, 56, 75–82. [Google Scholar] [CrossRef]
- Pazand, K.; Sarvestani, J.F.; Ravasan, M.R.S. Hydrothermal Alteration Mapping Using ASTER Data for Reconnaissance Porphyry Copper Mineralization in the Ahar Area, NW Iran. J. Indian Soc. Remote Sens. 2013, 41, 379–389. [Google Scholar] [CrossRef]
- Pérez, D.J.; Azcurra, D.; D’Odorico, P.; Sequeira, N. Mapeo de alteración hidrotermal con datos ASTER, en la región de La Coipa, Cordillera Frontal (31°45′S), Provincia de San Juan, Argentina. In Proceedings of the Anais XIII Simpósio Brasileiro de Sensoriamento Remoto, Florianópolis, Brazil, 21–26 April 2007; pp. 2095–2102. [Google Scholar]
- Masoumi, F.; Eslamkish, T.; Abkar, A.A.; Honarmand, M.; Harris, J.R. Integration of spectral, thermal and textural features of ASTER data using Random Forests classification for lithological mapping. J. Afr. Earth Sci. 2017, 129, 445–457. [Google Scholar] [CrossRef]
- Zhang, X.; Pazner, M. Comparison of Lithologic Mapping with ASTER, Hyperion and ETM Data in the Southeastern Chocolate Mountains, USA. Photogramm. Eng. Remote Sens. 2007, 73, 555–561. [Google Scholar] [CrossRef]
- Ninomiya, Y. Advanced Remote Lithologic Mapping in Ophiolite Zone with ASTER Multispectral Thermal Infrared Data. In Proceedings of the IEEE International Geoscience and Remote Sensing Symposium, Toulouse, France, 21–25 July 2003; Volume 3, pp. 1561–1563. [Google Scholar]
- Ninomiya, Y.; Fu, B.; Cudahy, T.J. Detecting lithology with Advanced Spaceborne Thermal Emission and Reflection Radiometer (ASTER) multispectral thermal infrared “radiance-at-sensor” data. Remote Sens. Environ. 2005, 99, 127–139. [Google Scholar] [CrossRef]
- Rockwell, B.W.; Hofstra, A.H. Identification of quartz and carbonate minerals across northern Nevada using ASTER thermal infrared emissivity data—Implications for geologic mapping and mineral resource investigations in well-studied and frontier areas. Geosphere 2008, 4, 218–246. [Google Scholar] [CrossRef]
- Guha, A.; Kumar, K.V. New ASTER derived thermal indices to delineate mineralogy of different granitoids of an Archaean Craton and analysis of their potentials with reference to Ninomiya’s indices for delineating quartz and mafic minerals of granitoids—An analysis in Dharwar Cr. Ore Geol. Rev. 2016, 74, 76–87. [Google Scholar] [CrossRef]
- Ninomiya, Y. Quantitative estimation of SiO2 content in igneous rocks using thermal infrared spectra with a neural network approach. IEEE Trans. Geosci. Remote Sens. 1995, 33, 684–691. [Google Scholar] [CrossRef]
- Pearson, K. On lines and planes of closest fit to systems of points in space. Philos. Mag. 1901, 2, 559–572. [Google Scholar] [CrossRef]
- Hotelling, H. Analysis of a complex of statistical variables into principal components. J. Educ. Psychol. 1933, 24, 417–441. [Google Scholar] [CrossRef]
- Crosta, A.P.; Moore, J.M. Enhancement of Landsat Thematic Mapper imagery for residual soil mapping in SW Minas Gerais State Brazil: A prospecting case history in greenstone belt terrain. In Proceedings of the 9th Thematic Conference on Remote Sensing for Exploration Geology, Calgary, AB, Canada, 2–6 October 1989; pp. 1173–1187. [Google Scholar]
- Crósta, A.P.; Prado, I.D.M.; Obara, M. The use of Geoscan AMSS Mk-II data for gold exploration in the Rio Itapicuru greenstone belt, Bahia, Brazil. In Proceedings of the 11th Thematic Conference on Remote Sensing for Exploration Geology, Las Vegas, NV, USA, 27–29 February 1996; pp. 205–214. [Google Scholar]
- Prado, I.D.M.; Crósta, A.P. Evaluating Geoscan AMSS Mk-II for gold exploration in the Fazenda Maria Preta District, Rio Itapicuru greenstone belt, Bahia State, Brazil. Bol. IG-USP 1997, 28, 63–84. [Google Scholar] [CrossRef]
- Xu, Y.; Lin, Q.; Shao, Y.; Wang, L. Extraction Mechanism of Alteration Zones using ASTER Imagery. In Proceedings of the IEEE International Geosciences and Remote Sensing Symposium, Anchorage, AK, USA, 20–24 September 2004; Volume 6, pp. 4174–4175. [Google Scholar]
- Bierwirth, P.N. Laboratory and imaging spectroscopy of tourmaline—A tool for mineral exploration. In Proceedings of the 14th Australasian Remote Sensing and Photogrammetry Conference, Darwin, Australia, 29 September–3 October 2008. [Google Scholar]


| ASTER | Landsat-7 (ETM+) | Landsat-8 (OLI/TIRS) | ||||||
|---|---|---|---|---|---|---|---|---|
| Bands | Wavelength (µm) | Res. (m) | Bands | Wavelength (µm) | Res. (m) | Bands | Wavelength (µm) | Res. (m) |
| 1—Ultra blue (coastal/aerosol) | 0.435–0.451 | 30 | ||||||
| 1—Visible blue | 0.45–0.52 | 30 | 2—Visible blue | 0.452–0.512 | 30 | |||
| 1—Visible green/yellow | 0.520–0.600 | 15 | 2—Visible green | 0.52–0.60 | 30 | 3—Visible green | 0.533–0.590 | 30 |
| 2—Visible red | 0.630–0.690 | 15 | 3—Visible red | 0.63–0.69 | 30 | 4—Visible red | 0.636–0.673 | 30 |
| 3N—NIR | 0.760–0.860 | 15 | 4—NIR | 0.77–0.90 | 30 | 5—NIR | 0.851–0.879 | 30 |
| 3B—NIR | 0.760–0.860 | 15 | ||||||
| 8—Panchromatic | 0.52–0.90 | 15 | 8—Panchromatic | 0.503–0.676 | 15 | |||
| 9—Cirrus | 1.363–1.384 | 30 | ||||||
| 4—SWIR | 1.600–1.700 | 30 | 5—SWIR | 1.55–1.75 | 30 | 6—SWIR | 1.566–1.651 | 30 |
| 5—SWIR | 2.145–2.185 | 30 | 7—SWIR | 2.09–2.35 | 30 | 7—SWIR | 2.107–2.294 | 30 |
| 6—SWIR | 2.185–2.225 | 30 | ||||||
| 7—SWIR | 2.235–2.285 | 30 | ||||||
| 8—SWIR | 2.295–2.365 | 30 | ||||||
| 9—SWIR | 2.360–2.430 | 30 | ||||||
| 10—TIR | 8.125–8.475 | 90 | ||||||
| 11—TIR | 8.475–8.825 | 90 | ||||||
| 12—TIR | 8.925–9.275 | 90 | ||||||
| 13—TIR | 10.250–10.950 | 90 | 6—TIR | 10.40–12.50 | (30) | 10—TIR | 10.60–11.19 | (30) |
| 14—TIR | 10.950–11.650 | 90 | 11—TIR | 11.50–12.51 | (30) | |||
| Hydrothermal Alteration Minerals | ||||
|---|---|---|---|---|
| Alunite | Illite | Kaolinite + Smectite | Kaolinite | |
| ASTER bands | 1 | 1 | 1 | 1 |
| 3 | 3 | 4 | 4 | |
| 5 | 5 | 6 | 6 | |
| 7 | 6 | 9 | 7 | |
| EIGENVECTOR | PC1 | PC2 | PC3 | PC4 |
|---|---|---|---|---|
| B1 | 0.305 | 0.562 | 0.548 | 0.538 |
| B4 | 0.841 | −0.241 | 0.207 | −0.436 |
| B6 | −0.326 | 0.484 | 0.385 | −0.714 |
| B7 | −0.303 | −0.624 | 0.712 | 0.099 |
© 2018 by the authors. Licensee MDPI, Basel, Switzerland. This article is an open access article distributed under the terms and conditions of the Creative Commons Attribution (CC BY) license (http://creativecommons.org/licenses/by/4.0/).
Share and Cite
Testa, F.J.; Villanueva, C.; Cooke, D.R.; Zhang, L. Lithological and Hydrothermal Alteration Mapping of Epithermal, Porphyry and Tourmaline Breccia Districts in the Argentine Andes Using ASTER Imagery. Remote Sens. 2018, 10, 203. https://doi.org/10.3390/rs10020203
Testa FJ, Villanueva C, Cooke DR, Zhang L. Lithological and Hydrothermal Alteration Mapping of Epithermal, Porphyry and Tourmaline Breccia Districts in the Argentine Andes Using ASTER Imagery. Remote Sensing. 2018; 10(2):203. https://doi.org/10.3390/rs10020203
Chicago/Turabian StyleTesta, Francisco J., Cecilia Villanueva, David R. Cooke, and Lejun Zhang. 2018. "Lithological and Hydrothermal Alteration Mapping of Epithermal, Porphyry and Tourmaline Breccia Districts in the Argentine Andes Using ASTER Imagery" Remote Sensing 10, no. 2: 203. https://doi.org/10.3390/rs10020203