Validation of the First Years of GPM Operation over Cyprus


1
Institute for Environmental Research & Sustainable Development, National Observatory of Athens, Athens, GR 15236, Greece
2
Department of Meteorology, Nicosia, CY 1086, Cyprus
3
The Cyprus Institute, Nicosia, CY 2121, Cyprus
*
Author to whom correspondence should be addressed.
Remote Sens. 2018, 10(10), 1520; https://doi.org/10.3390/rs10101520
Submission received: 27 July 2018
/
Revised: 20 September 2018
/
Accepted: 20 September 2018
/
Published: 21 September 2018
(This article belongs to the Special Issue Remote Sensing of Precipitation)
Abstract
:Global Precipitation Measurement (GPM) high-resolution product is validated against rain gauges over the island of Cyprus for a three-year period, starting from April 2014. The precipitation estimates are available in both high temporal (half hourly) and spatial (10 km) resolution and combine data from all passive microwave instruments in the GPM constellation. The comparison performed is twofold: first the GPM data are compared with the precipitation measurements on a monthly basis and then the comparison focuses on extreme events, recorded throughout the first 3 years of GPM’s operation. The validation is based on ground data from a dense and reliable network of rain gauges, also available in high temporal (hourly) resolution. The first results show very good correlation regarding monthly values; however, the correspondence of GPM in extreme precipitation varies from “no correlation” to “high correlation”, depending on case. This study aims to verify the GPM rain estimates, since such a high-resolution dataset has numerous applications, including the assimilation in numerical weather prediction models and the study of flash floods with hydrological models.
1. Introduction
Several researchers have presented the comparison of satellite estimates with rain-gauge measurements in various study areas. One of the most common difficulties in such an attempt is the fact that satellite estimates refer to precipitation amounts over areas of a few kilometers around a gauge station, whereas rain-gauges measurements refer to the precipitation recorded in an area of a few centimeters in diameter (point source).
A literature overview of precipitation estimates from satellite, ground-based and gridded data could be found in [1,2,3,4]. However, recently released IMERG (Integrated Multi-satellite Retrievals) is going to reduce this sampling issue such that Global Precipitation Measurement (GPM) constellation satellites will have improved spatial and temporal resolutions (i.e., 30 min) [5,6].
Contrary to other satellites, such as its ancestor Tropical Rainfall Measuring Mission (TRMM), that could not measure light rain or snowfall, GPM-IMERG uses numerous sensors that measure at various frequencies from different satellites to detect both light and heavy rain and also snowfall. GPM expands TRMM’s reach not only in terms of global coverage, but also through sophisticated satellite instrumentation, the inter-calibration of datasets from other microwave radiometers, coordinated merged precipitation datasets, reduced latency for delivering data products, simplified data access, expanded global ground-validation efforts, and integrated user applications [6]. GPM improves on TRMM’s capabilities, although it has only two instruments versus the five instruments on TRMM. Dual-frequency Precipitation Radar (DPR) and the radiometer called GPM Microwave Imager (GMI) are some of the most advanced ever developed to measure precipitation from space. The DPR is the only dual frequency radar in space and is capable of creating 3-D profiles and intensity estimates of precipitation ranging from rain to snow and ice. The GMI has a greater frequency range than TRMM’s (13 channels versus 9 channels), which allows GPM to measure precipitation intensity and type through all cloud layers using a wider data swath.
Sharifi et al. [7] compared precipitation estimates of GPM IMERG final run data sets (along with TRMM 3B42 and ERA-Interim) and with meteorological synoptic stations’ data over Iran to evaluate the GPM-based precipitation outputs for one-year period (March 2014 to February 2015). They found that IMERG underestimates precipitation slightly when considering days with observed precipitation. IMERG yields better results for detection of precipitation events on the basis of Probability of Detection (POD), Critical Success Index (CSI) and False Alarm Ratio (FAR) in areas with stratiform and orographic precipitation compared with other satellite/model data sets. In case of precipitation below 15 mm/day IMERG indicated better results, while for heavy precipitation (>15 mm/day) IMERG was far superior to the other products.
Manz et al. [8] performed validation of the GPM IMERG Day-1 and TRMM TMPA products against rain gauge stations across Ecuador and Peru from March 2014 to August 2015 at different spatial (0.1°, 0.25°) and temporal (1 h, 3 h, daily) scales. They found that IMERG showed better detection and quantitative precipitation intensity estimation ability than TMPA, particularly in the high Andes. Furthermore, IMERG showed better characterization of gauge observations after separating precipitation detection and precipitation rate estimation.
Prakash et al. [9] presented an assessment of IMERG, TMPA and Global Satellite Mapping of Precipitation (GSMaP, v.6) estimates against gauge-based observations over India at a daily scale for the southwest monsoon season (June to September 2014). Results indicated that the IMERG product represented well the mean monsoon precipitation and its variability, performing a clear improvement in missed and false precipitation bias over India. However, in areas that precipitation is dominated by orographic effects (northeast India) and over rain-shadow regions (southeast peninsular India) all three satellite-based precipitation estimates did not perform well (in terms of correlation coefficient, RMSE, bias).
Sungmin et al. [10] presented an analysis of the IMERG (v.3) Early, Late, and Final (IMERG-E, IMERG-L, and IMERG-F) half-hourly precipitation estimates against gauge-based gridded precipitation data from a high-density climate station network in southeastern Austria for the period of April–October in 2014 and 2015. Results showed that IMERG-F precipitation estimates were in the best overall agreement with the gauge-based gridded precipitation data, followed by IMERG-L and IMERG-E estimates, particularly for the hot season.
Tan and Duan [11] evaluated GPM IMERG and TRMM Multisatellite Precipitation Analysis (TMPA) 3B42 and 3B42RT precipitation data over Singapore on daily, monthly, seasonal and annual scales from April 2014 to January 2016. They found that both IMERG and TMPA products were well correlated with gauges data at monthly scale, but moderately at daily scale (IMERG had the lowest systematic bias). However, IMERG had better performance in the characterization of spatial precipitation variability and precipitation detection capability compared to the TMPA products. All satellite precipitation products overestimated moderate precipitation events (1–20 mm/day) and underestimated light (0.1–1 mm/day) and heavy (>20 mm/day) precipitation events. They concluded that in overall, IMERG showed a slight improvement compared to the TMPA products over Singapore.
Asong et al. [12] evaluated GPM IMERG (V03 Final Run) data against ground-based measurements at the 6-hourly, daily, and monthly time scales over different terrestrial ecozones of southern Canada during March 2014 to January 2016. They found that considering the mean daily precipitation IMERG and ground-based records showed similar regional variations, while IMERG was overestimated during higher monthly precipitation amounts. Regarding daily and 6-hourly time scales IMERG and ground-based records found to be in agreement for the months of June–September, unlike months November–March. Considering precipitation extremes, it was found that generally IMERG captured well the distribution of heavy precipitation amounts, although correlation was spatially varied.
Tang et al. [13] evaluated GPM IMERG Day-1 product over Mainland China from April to December 2014 (hourly data) against TRMM TMPA (3B42V7) product (3-hourly and daily data) data and hourly ground-based observations. They found that Day-1 IMERG showed better performance than 3B42V7 at both sub-daily and daily timescales, with significant differences between the two products noticed at the sub-daily resolution; IMERG especially performed better at the mid- and high-latitudes and at relatively dry climate regions; Regarding ability of capturing precipitation intensity, IMERG reproduced better the probability density function (PDF), especially in the low ranges.
Tian et al. [14] investigates the dependency of the evaluation of the GPM IMERG precipitation product on the gauge density of a ground-based rain gauge network as well as precipitation intensity over five sub-regions in mainland China during two warm seasons (April–October 2014 and 2015). They found that the denser the rain gauge network the better the evaluation metrics. In addition, IMERG tends to overestimate (underestimate) light (heavy) precipitation events.
Xu et al. [15] evaluated two satellite precipitation products (GPM IMERG and TRMM 3B42V7) in southern Tibetan Plateau region focusing on the effects of topography and precipitation intensity, for the rainy season from May to October 2014. Results indicated that GPM product presented better ability in detecting daily precipitation accumulation at all spatial scales and elevation ranges. It also tends to underestimate the amount of light rain (0–1 mm/d) events, while showing better detecting ability for light precipitation (0–5 mm/d) events; however, the detecting ability at high-elevation (>4500 m) regions was not defined. In terms of the ability of precipitation detection, false alarm ratio (FAR) of GPM (14%) was lower than that of TRMM (21%), while missing ratio of GPM (13%) was larger than that of TRMM (9%).
Dezfuli et al. [16] evaluated GPM IMERG (V04A) precipitation data using in situ observations from selected stations in West and East Africa, along with some comparisons between IMERG and TMPA. Results indicated temporal (by season) and spatial (by region) variation of correlation between the satellite-based products and stations data. They also found that precipitation diurnal cycle is relatively better captured by IMERG than TMPA, while both products demonstrated better agreement with stations data in East Africa and humid West Africa than in the southern Sahel. Regarding annual cycle, differences were found during the short rains in East Africa. A direct comparison between IMERG and TMPA over the entire continent was also established concluding that IMERG and TMPA presented large differences over mountainous regions.
Liu [17] commented on the comparison between the IMERG Final Run monthly product and the TMPA monthly product (3B43) in the boreal summer of 2014 and the boreal winter of 2014/15 on a global scale. It was found that IMERG monthly product could capture major heavy precipitation regions in the Northern and Southern Hemispheres reasonably well. However, differences between IMERG and 3B43 varied with surface types and precipitation rates in both seasons, with systematic differences found much smaller over land. When low precipitation rates were considered positive relative differences (IMERG > 3B43) were noticed in contrast to high precipitation rates (IMERG < 3B43). Over ocean, under all precipitation rates negative differences were found. Tan and Santo [18] studied the performance of six satellite precipitation products (SPPs), GPM IMERG products (IMERG-E, IMERG-L and IMERG-F), TMPA 3B42 and 3B42RT products and the PERSIANN-CDR product, against precipitation gauges for an almost two years period (March 2014 to February 2016), over Malaysia. Results indicated that all the SPPs performed well in annual and monthly precipitation measurements. However, moderate correlation was found at daily precipitation estimations.
Regarding precipitation detection ability, all the SPPs underestimated light (0–1 mm/day) and extreme (>50 mm/day) precipitation events, while overestimated moderate and heavy (1–50 mm/day) precipitation events. The IMERG demonstrated better ability in detecting light precipitation (0–1 mm/day) compared to the other SPPs.
In the literature, only a few studies with evaluation of satellite precipitation products over Cyprus are reported based on gauge observations and a few satellite precipitation products.
Retalis et al. [19] performed an analysis of precipitation data from satellite data TRMM 3B43 (versions 7 and 7A) over Cyprus and compared them with the corresponding gauge observations and E-OBS gridded data for a 15-year period (1998–2012). They found that TRMM and E-OBS estimates were well fitted with the gauge data, although they were both influenced by the variation of elevation.
A study for a 30-year period (1981–2010) for the precipitation database Climate Hazards Group Infrared Precipitation with Station data (CHIRPS) was performed over the island of Cyprus [20]. CHIRPS database was evaluated against the dense and reliable network of rain gauges. Results showed good correlation between CHIRPS values and recorded precipitation; although an overestimation, in the CHIRPS values, of the in-situ precipitation data has been noted during the last decade.
Katsanos et al. [21] in their study calculated a number of climatic indices for the CHIRPS precipitation dataset and records from rain gauges on high spatial (0.05°) and temporal (daily) resolution for a period of 30 years (1981–2010). Results indicates a quite promising performance regarding indices related to daily precipitation thresholds, resulting in high correlation scores. However, for indices referring to number of days, results showed medium or no correlation, probably due to the criteria used for the identification of a wet (rainy) day on the CHIRPS dataset.
Retalis et al. [22] proposed a novel downscaling method of TRMM 3B42 product in order to attain high resolution (1 km × 1 km) precipitation datasets, by correlating the CHIRPS dataset with elevation information and the normalized difference vegetation index (NDVI) from satellite images at 1 km × 1 km, utilizing artificial neural network models. The resulted product was validated with precipitation measurements from the corresponding rain gauge network of the Cyprus Department of Meteorology. It was found that the new product was able to capture the spatial precipitation variability, especially in the mountainous areas. Its overall accuracy in the annual products was considered rather significant, while the monthly product, although characterized by variability in the range of correlation (r) values, indicated rather significant values when mean monthly products were considered.
Katsanos et al. [23] analyzed the daily precipitation (rain gauges) database for the island of Cyprus for period of 50 years. They calculated a number of climatic indices for precipitation, including the Standardized Precipitation Index (SPI for the recent 30-year period 1981–2010 and compared the results with those of the period 1961–1990. The results showed an increase in the occurrence of heavy precipitation events and a slight decrease in extreme drought events.
The aim of this study is to assess the accuracy of the new GPM IMERG satellite precipitation product over Cyprus on a monthly basis and during extreme events. To our knowledge, no such report exists yet to study the GPM constellation satellites data over Cyprus.
2. Data and Methodology
2.1. Study Area
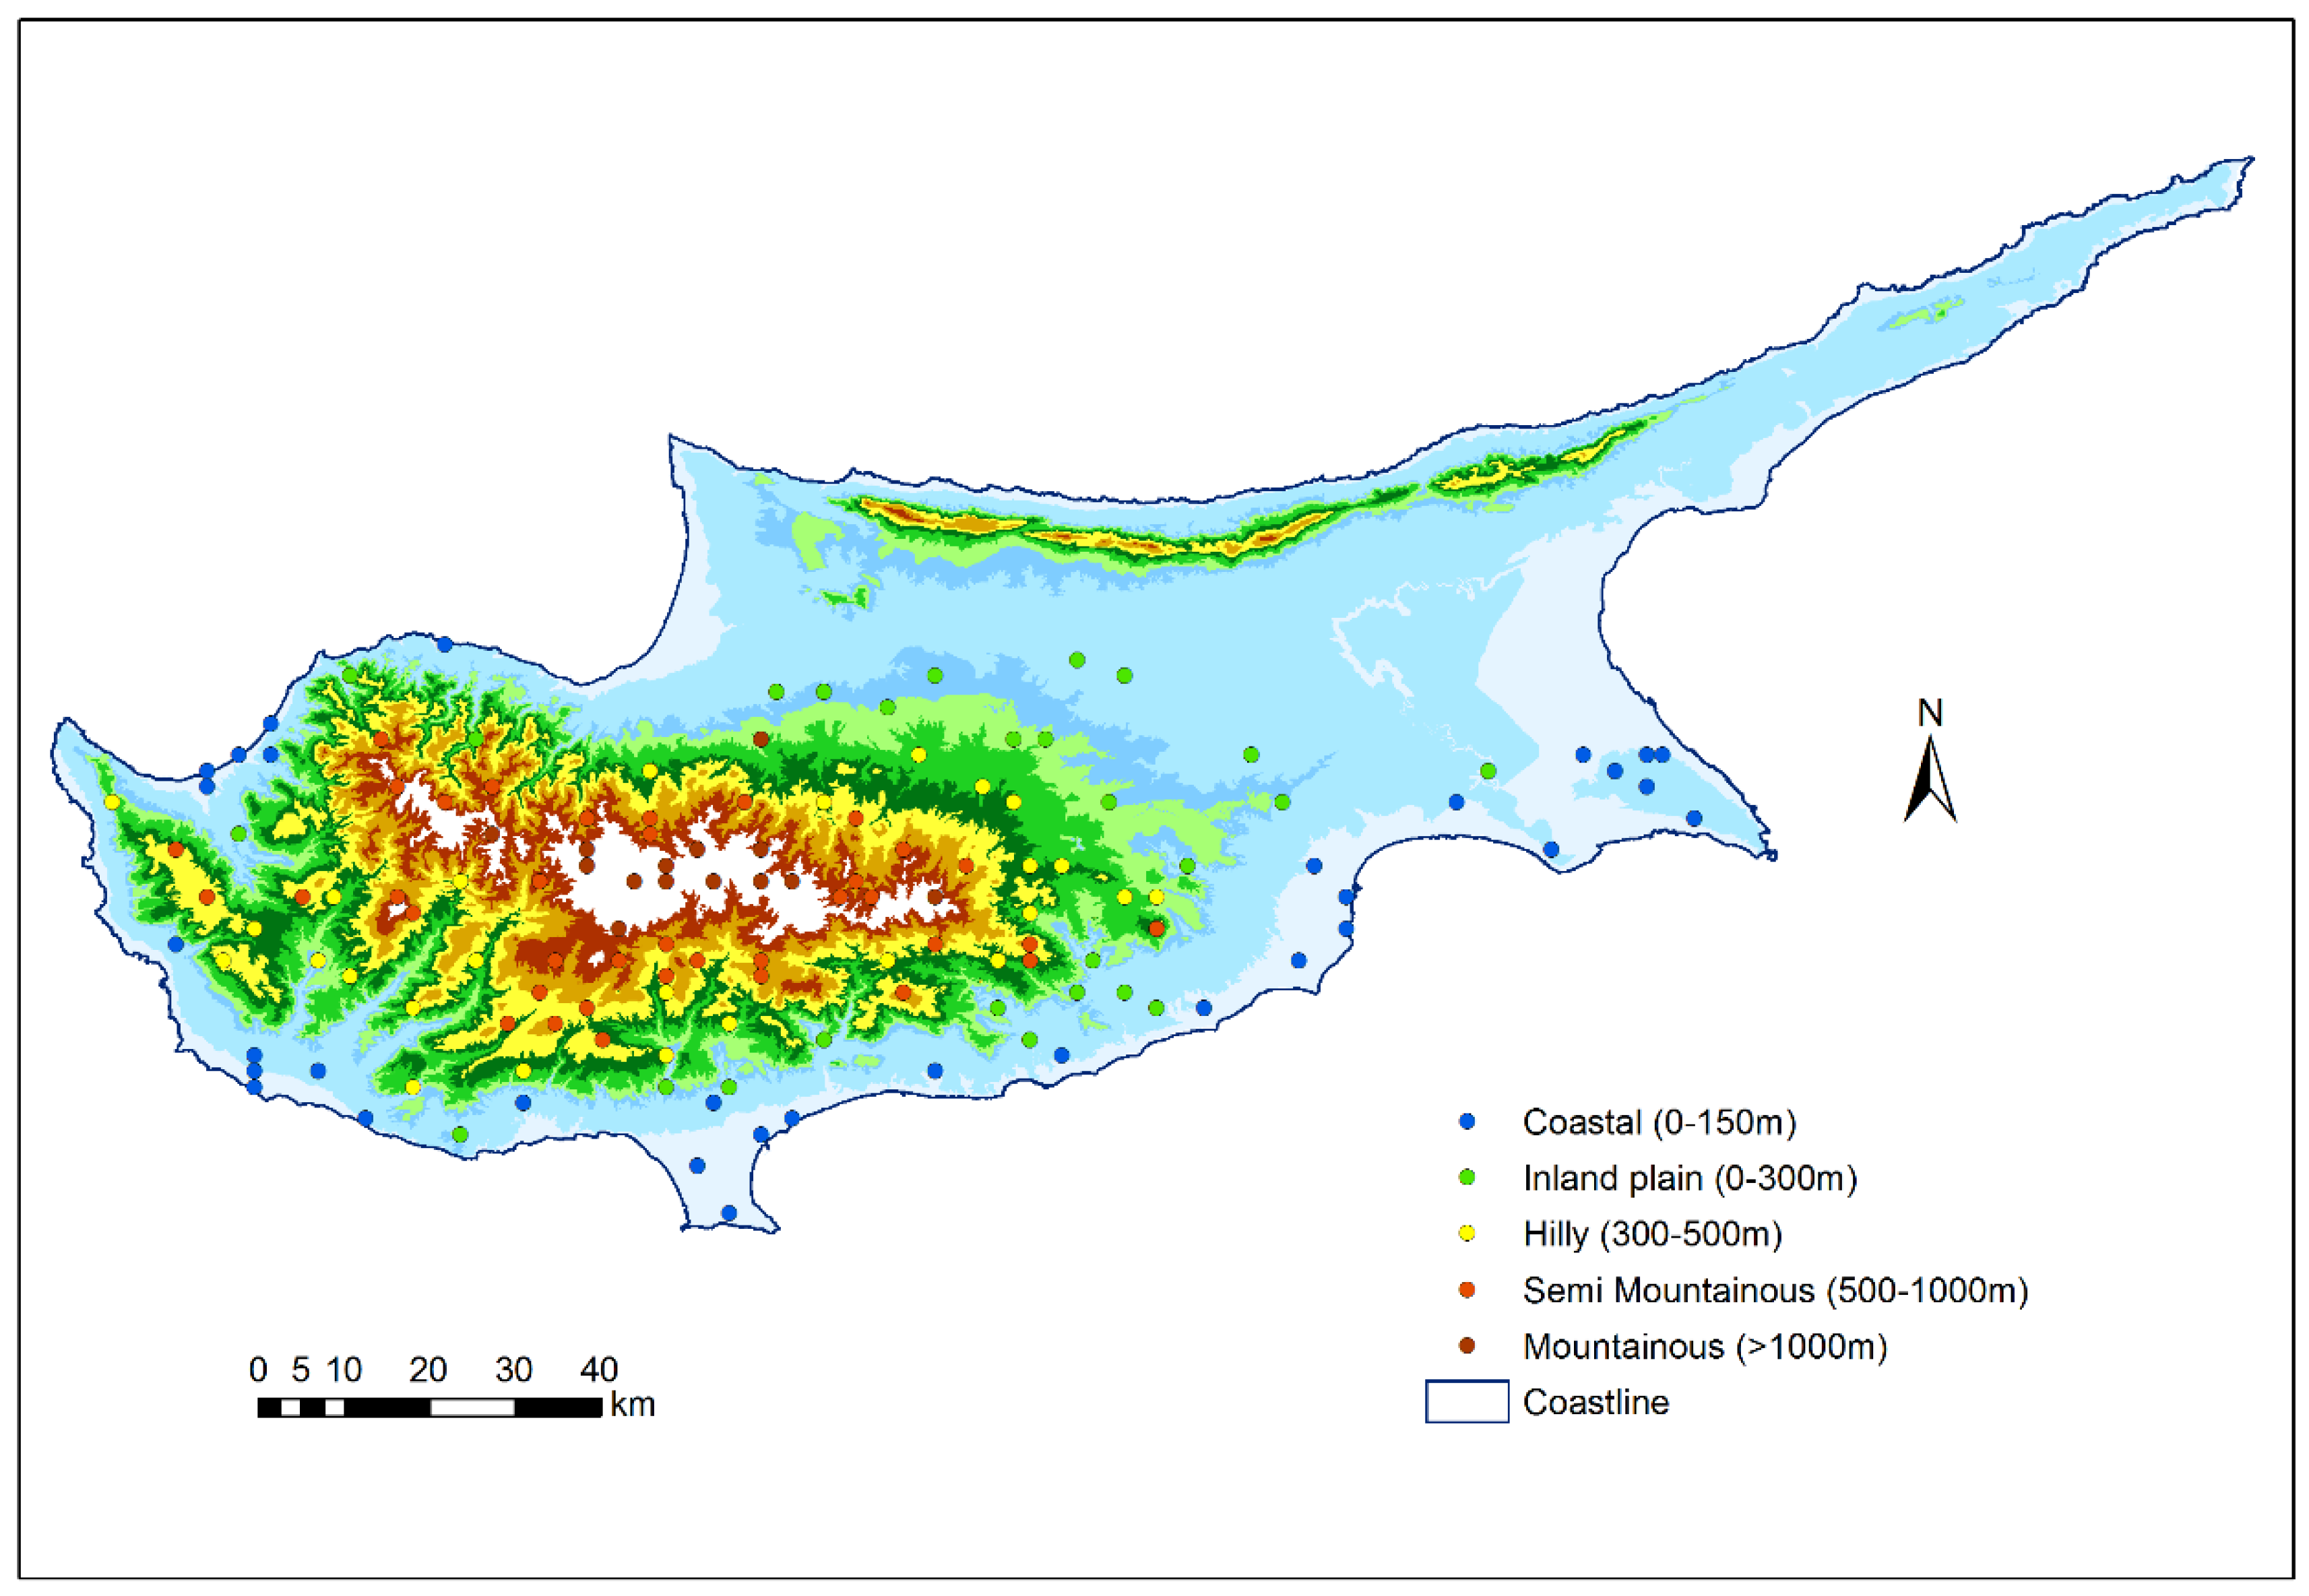
The island of Cyprus is located in the north-eastern corner of the Mediterranean Sea. It is characterized by a typical eastern-Mediterranean climate, with wet winters and dry summers, in terms of precipitation. With an average elevation of 91 m above Mean Sea Level, the island is transversed by two mountain ranges, the high Troodos massif in the southwest with the highest peak, Olympus at 1951 m, and the elongated narrow Pentadaktylos range, rising to 900 m and bordering the northern coast. Between the two mountain ranges, lies the central plain and along their seaward margins a more or less narrow coastal strip (Figure 1). The highest average annual precipitation values are recorded at the meteorological stations located on the mountainous areas of the island and the lowest at the coastal ones.
2.2. Data
2.2.1. In-Situ Rain Gauge Data
The in-situ measurements of meteorological stations operated by the Cyprus Department of Meteorology were applied for ground validation. The network is considered reliable with respect to the quality of the measuring stations and routine maintenance, dense having on the average 1 station per 30 km2, it is well-distributed covering all different climatic zones of the island (Figure 1) and provides historical daily rainfall measurements for more than a century (Figure 2). It is currently comprised of three synoptic stations, 35 online stations, 20 automatic weather stations, 90 ordinary rain gauges and 25 analog rain recorders whilst an ongoing effort exists concerning the replacement of the analog instruments with digital. All measurements are subject to quality control by qualified personnel. Daily and hourly data records from 136 rain gauges with complete data series of daily values during the study period were selected.
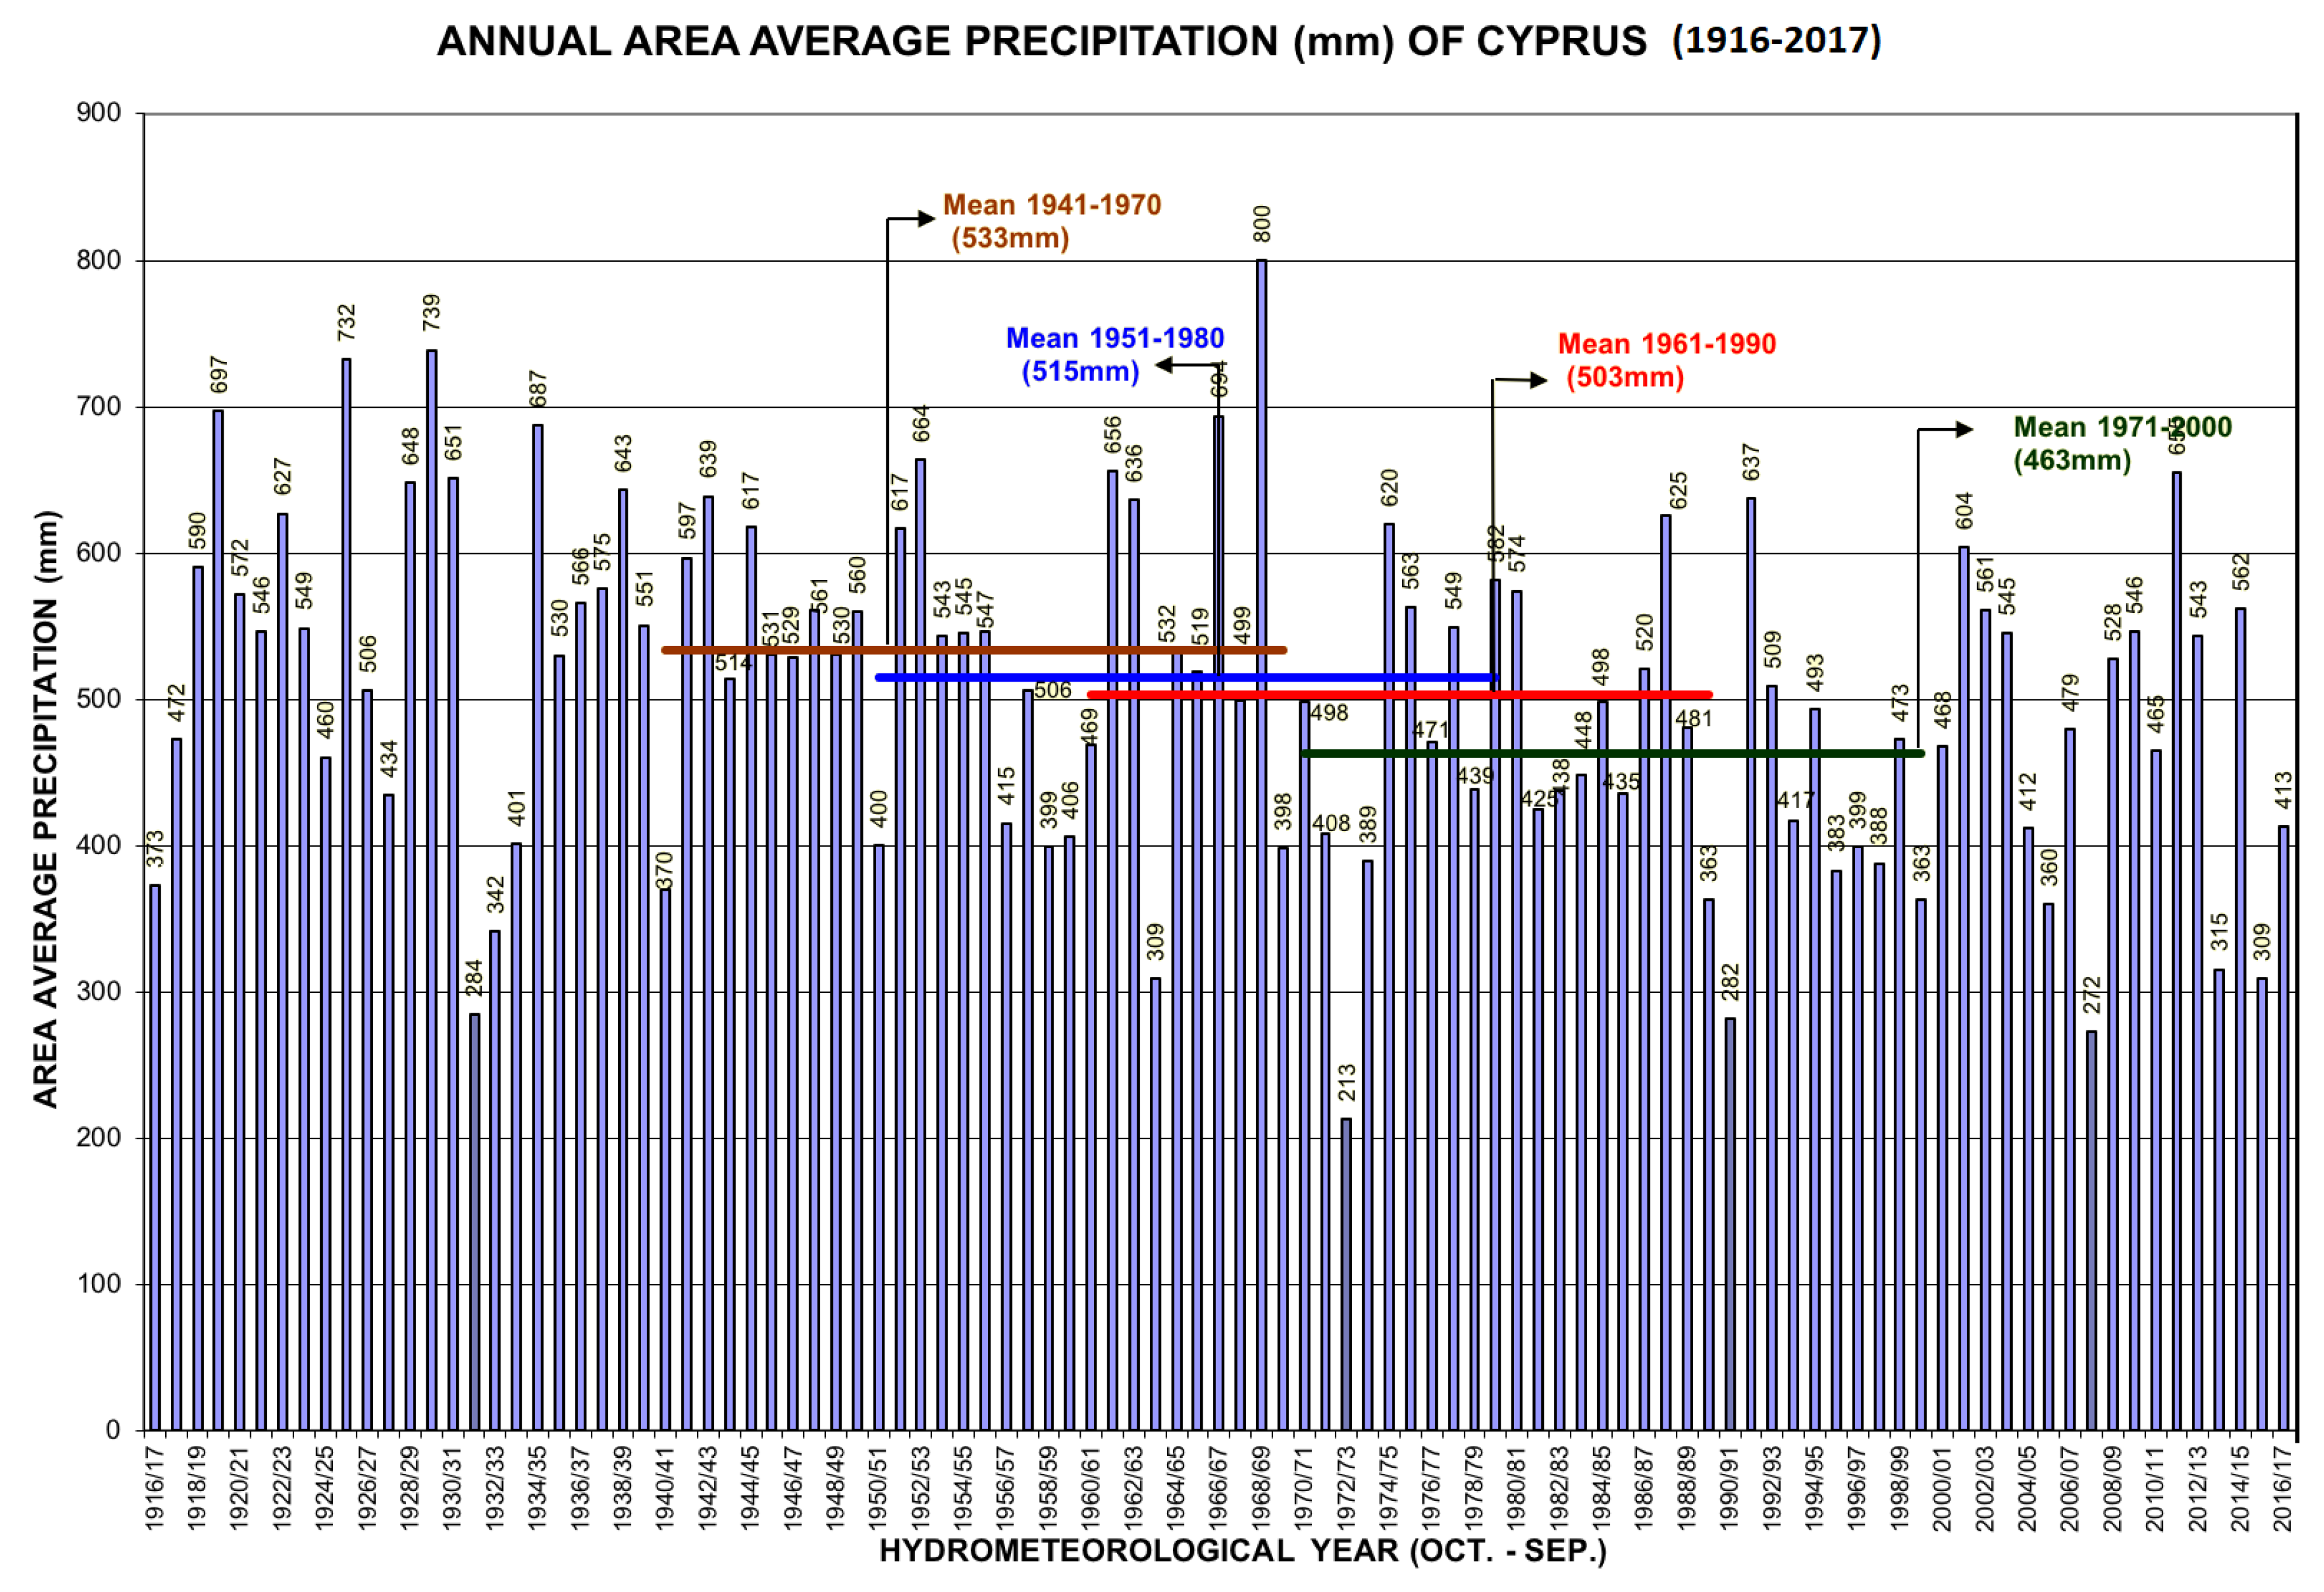
The area average precipitation provided in Figure 2 illustrates the climatology of the annual precipitation for the entire time series of the recorded data and it clearly demonstrates a decreasing trend in the annual average precipitation over the climatic periods of 1941–1970, 1951–1980, 1961–1990 and 1971–2000. The annual average area precipitation was calculated from monthly precipitation measurements with planimeter while the method was replaced by GIS after 2006. A two-year period of evaluation of the two methods revealed no significant deviations amongst them, differentiating below 4% of the yearly calculated value. This method of area calculation of precipitation is not considered accurate for the entire area since it does not take under consideration the altimeter difference of the measurement stations, but it is a good indicator for the yearly amount of precipitation received over the entire island. The total annual precipitation is approximately 300–400 mm year−1 [24]. The maximum area average precipitation is 800 mm, recorded in 1968/1969; the minimum area average precipitation is 213 mm, recorded in 1972–1973.
2.2.2. IMERG Data
Global Precipitation Measurement (GPM) Integrated Multi-Satellite Retrievals for GPM (IMERG) products provide quasi-global (60° N–60° S) precipitation estimates, beginning March 2014, from the combined use of passive microwave (PMW) and infrared (IR) satellites comprising the GPM constellation. The IMERG Final data used in this study (version 04A) have a temporal resolution of ½ h and a spatial resolution of 0.1 degree. The IMERG-F product ingests GPCC monthly gauge analyses making it a very reliable dataset. The period of study spans from April 2014 to February 2017. A known problem exists regarding a low bias in GPROF algorithm at high latitudes due to the low sensitivity of the DPR to light rain and snow, which was not fully fixed in the latest version (e.g., 05), despite the modification of giving more weight to GMI data. Furthermore, in version V05 IMERG Final datasets have fewer amounts of microwave-based data, compared to versions 03 and 04, since Version 05 GPROF-TMI estimates had not been computed for the GPM era. Another known issue is the resolution difference between GPCC (1 deg) and IMERG (0.1 deg) that lead to an unphysical “blockiness” after the bilinear interpolation used at the first versions, that was corrected at V05, after the removal of the GPCC grid box volume adjustment.
It should be noted that for each day GPM provides 48 files with measurements which means that, for a 3-year period, one has to handle (download and process) more than 50,000 files.
The satellite products were validated against the gauge stations data at daily and monthly time scales. Precipitation data within each satellite cell was compared directly. In cases where precipitation data of more than one gauges was included within the satellite cell, the comparison was carried out based on the average of the gauge stations data.
The measured (gauge stations) and estimated (IMERG) precipitation pairs were also used to construct a 2 × 2 contingency table (Table 1) in order to investigate how well the IMERG estimates correspond to the measured gauge data.
2.3. Statistical Scores
Next, some statistical scores were calculated [25].
Bias score (frequency bias)
BIAS ranges from 0 to ∞, with perfect score to be equal to 1. BIAS measures the ratio of the frequency of forecast events to the frequency of observed events. It indicates whether the forecast system has a tendency to under-forecast (BIAS < 1) or over-forecast (BIAS > 1) events. It does not measure how well the forecast corresponds to the observations, it only measures relative frequencies.
Probability of detection (hit rate, POD)
POD ranges from 0 to 1, with perfect score to be equal to 1. POD is sensitive to hits but ignores false alarms. It is very sensitive to the climatological frequency of the event. It is also a good measure for rare events. It can be artificially improved by issuing more “yes” forecasts to increase the number of hits. It is better to be used in conjunction with the false alarm ratio (below). False alarm ratio (FAR)
FAR ranges from 0 to 1, with perfect score to be equal to 0. FAR is sensitive to false alarms but ignores misses. It is very sensitive to the climatological frequency of the event. It is suggested to be used in conjunction with the probability of detection (above).
Probability of false detection (POFD)
POFD ranges from 0 to 1, with perfect score equal to 0. POFD is sensitive to false alarms but ignores misses. It can be artificially improved by issuing fewer “yes” forecasts to reduce the number of false alarms.
Success ratio (SR)
SR ranges from 0 to 1, with perfect score equal to 1. SR gives information about the likelihood of an observed event, given that it was forecast. It is sensitive to false alarms but ignores misses. SR is equal to 1-FAR. POD is plotted against SR in the categorical performance diagram.
Threat score (critical success index, TS)
TS range from 0 to 1, with 0 indicating no skill and perfect score equal to 1. TS measures the fraction of observed and/or forecast events that were correctly predicted. It can be thought of as the accuracy when correct negatives have been removed from consideration, that is, TS is only concerned with forecasts that count. Hanssen and Kuipers discriminant score (HK)
HS ranges from −1 to 1, with 0 indicating no skill and perfect score equal to 1. HS uses all elements in contingency table. It does not depend on climatological event frequency. The expression is identical to HK = POD − POFD, but the Hanssen and Kuipers score can also be interpreted as (accuracy for events) + (accuracy for non-events) − 1.
3. Results and Discussion
3.1. Monthly Validation
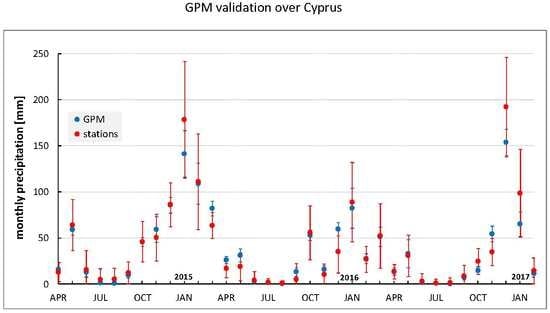
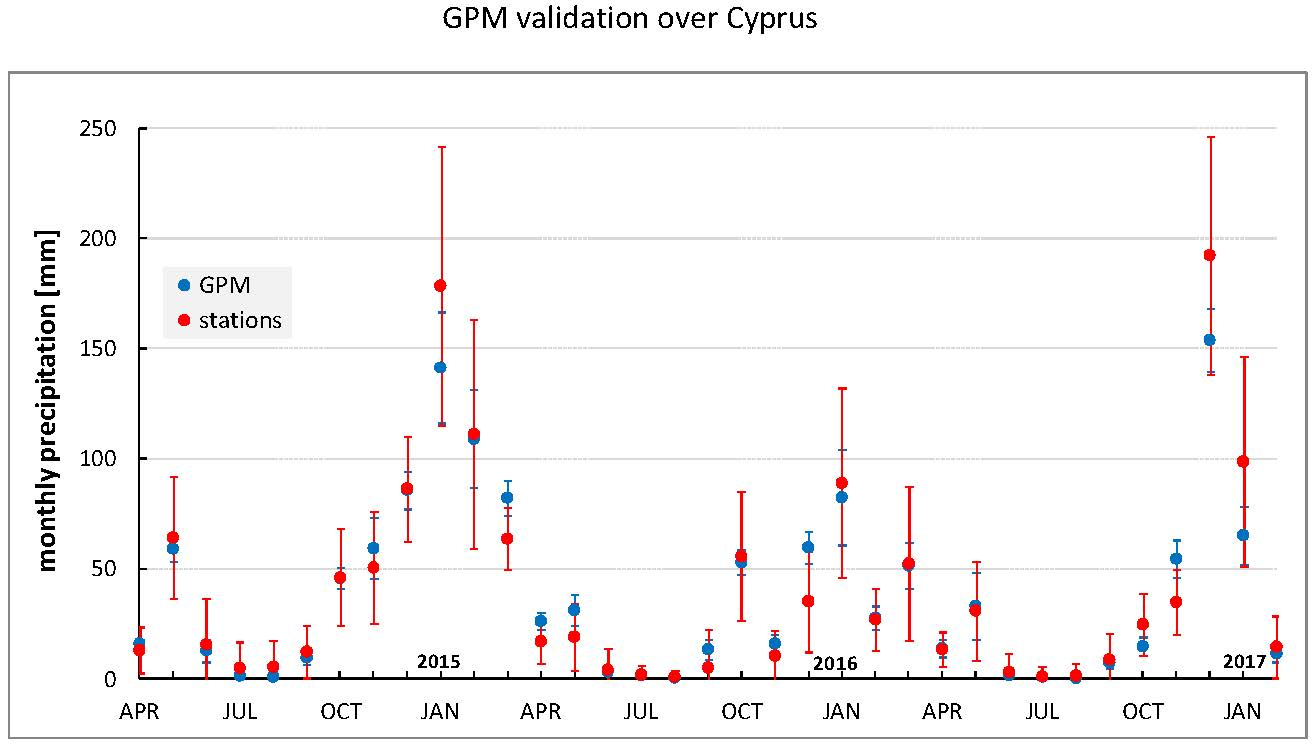
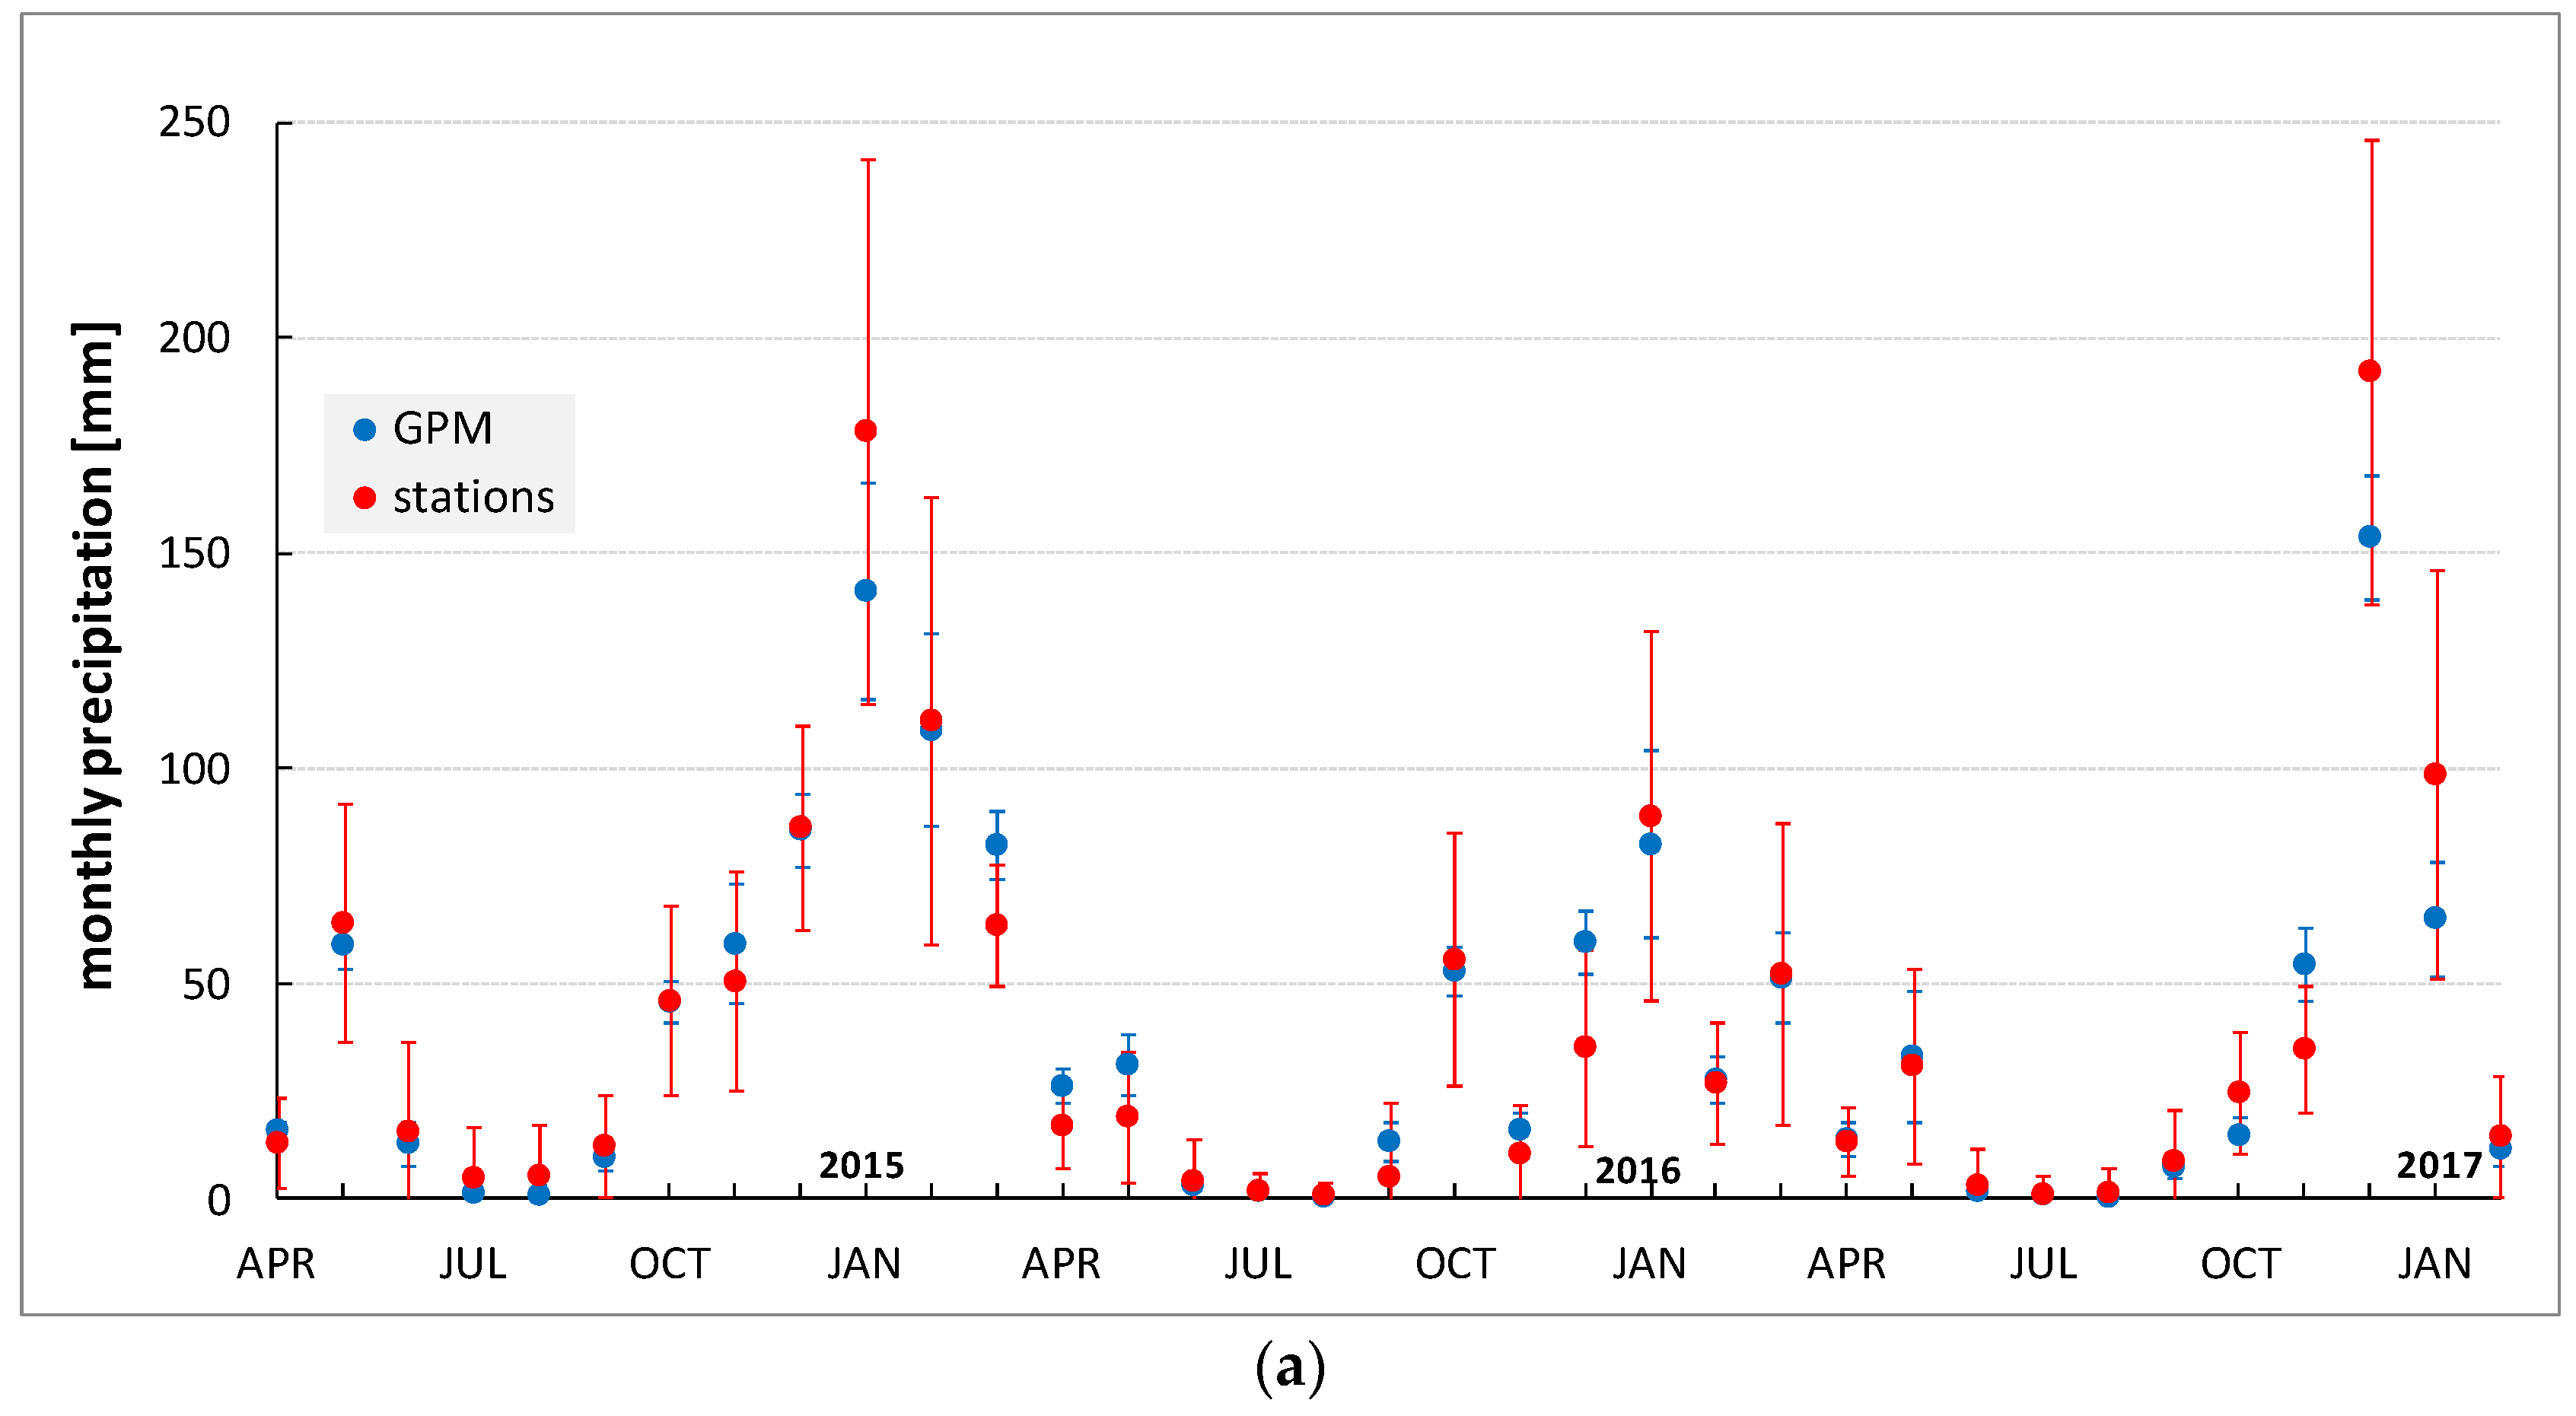
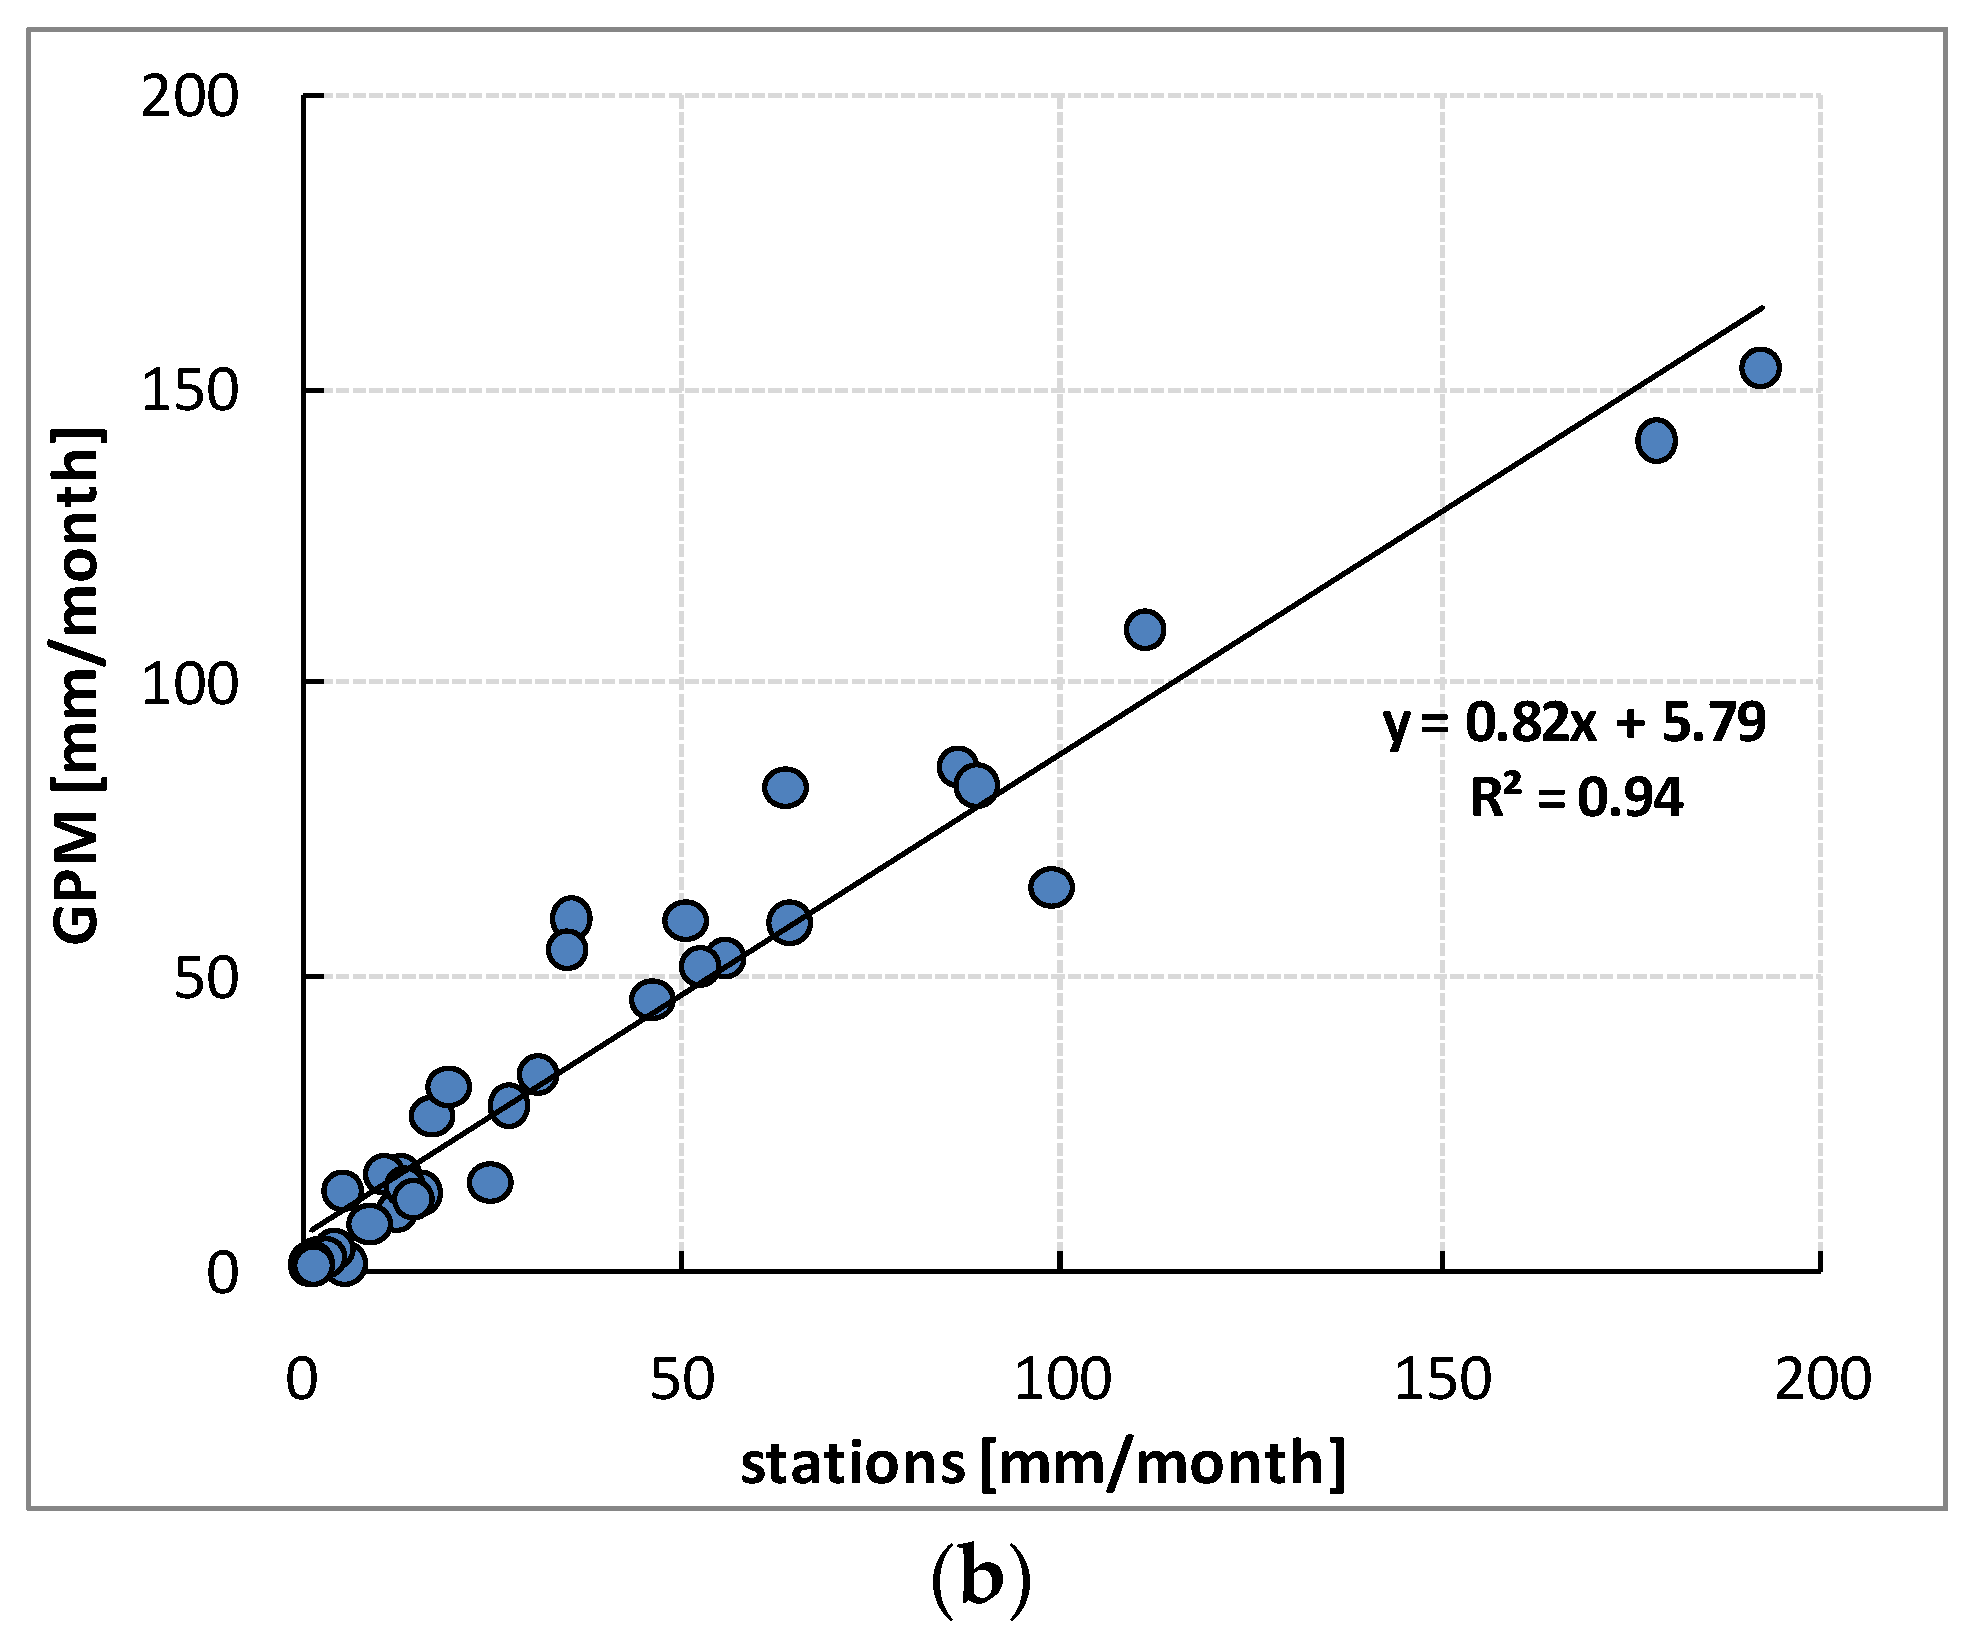
At first, the comparison of the monthly precipitation gauge data and IMERG data for the study period was performed. The monthly variation of the two data sets along with the corresponding standard variation are shown in Figure 3a. It is noticed that both data have a similar pattern of monthly variation, however, during the rainy period (October to February), IMERG was overestimating precipitation. The scatter plot of the respective data and the calculated coefficient of determination (r2 = 0.93) are presented in Figure 3b. In order to further explore the effect of topography on this relationship, data were categorized in five classes according to the elevation of gauge stations. A color code is adopted in Figure 1 in order to display the five different classes used in the present study. The five classes are shown in Table 2, together with the number of stations falling in each class. The average elevation of all the stations that were used is 368 m.
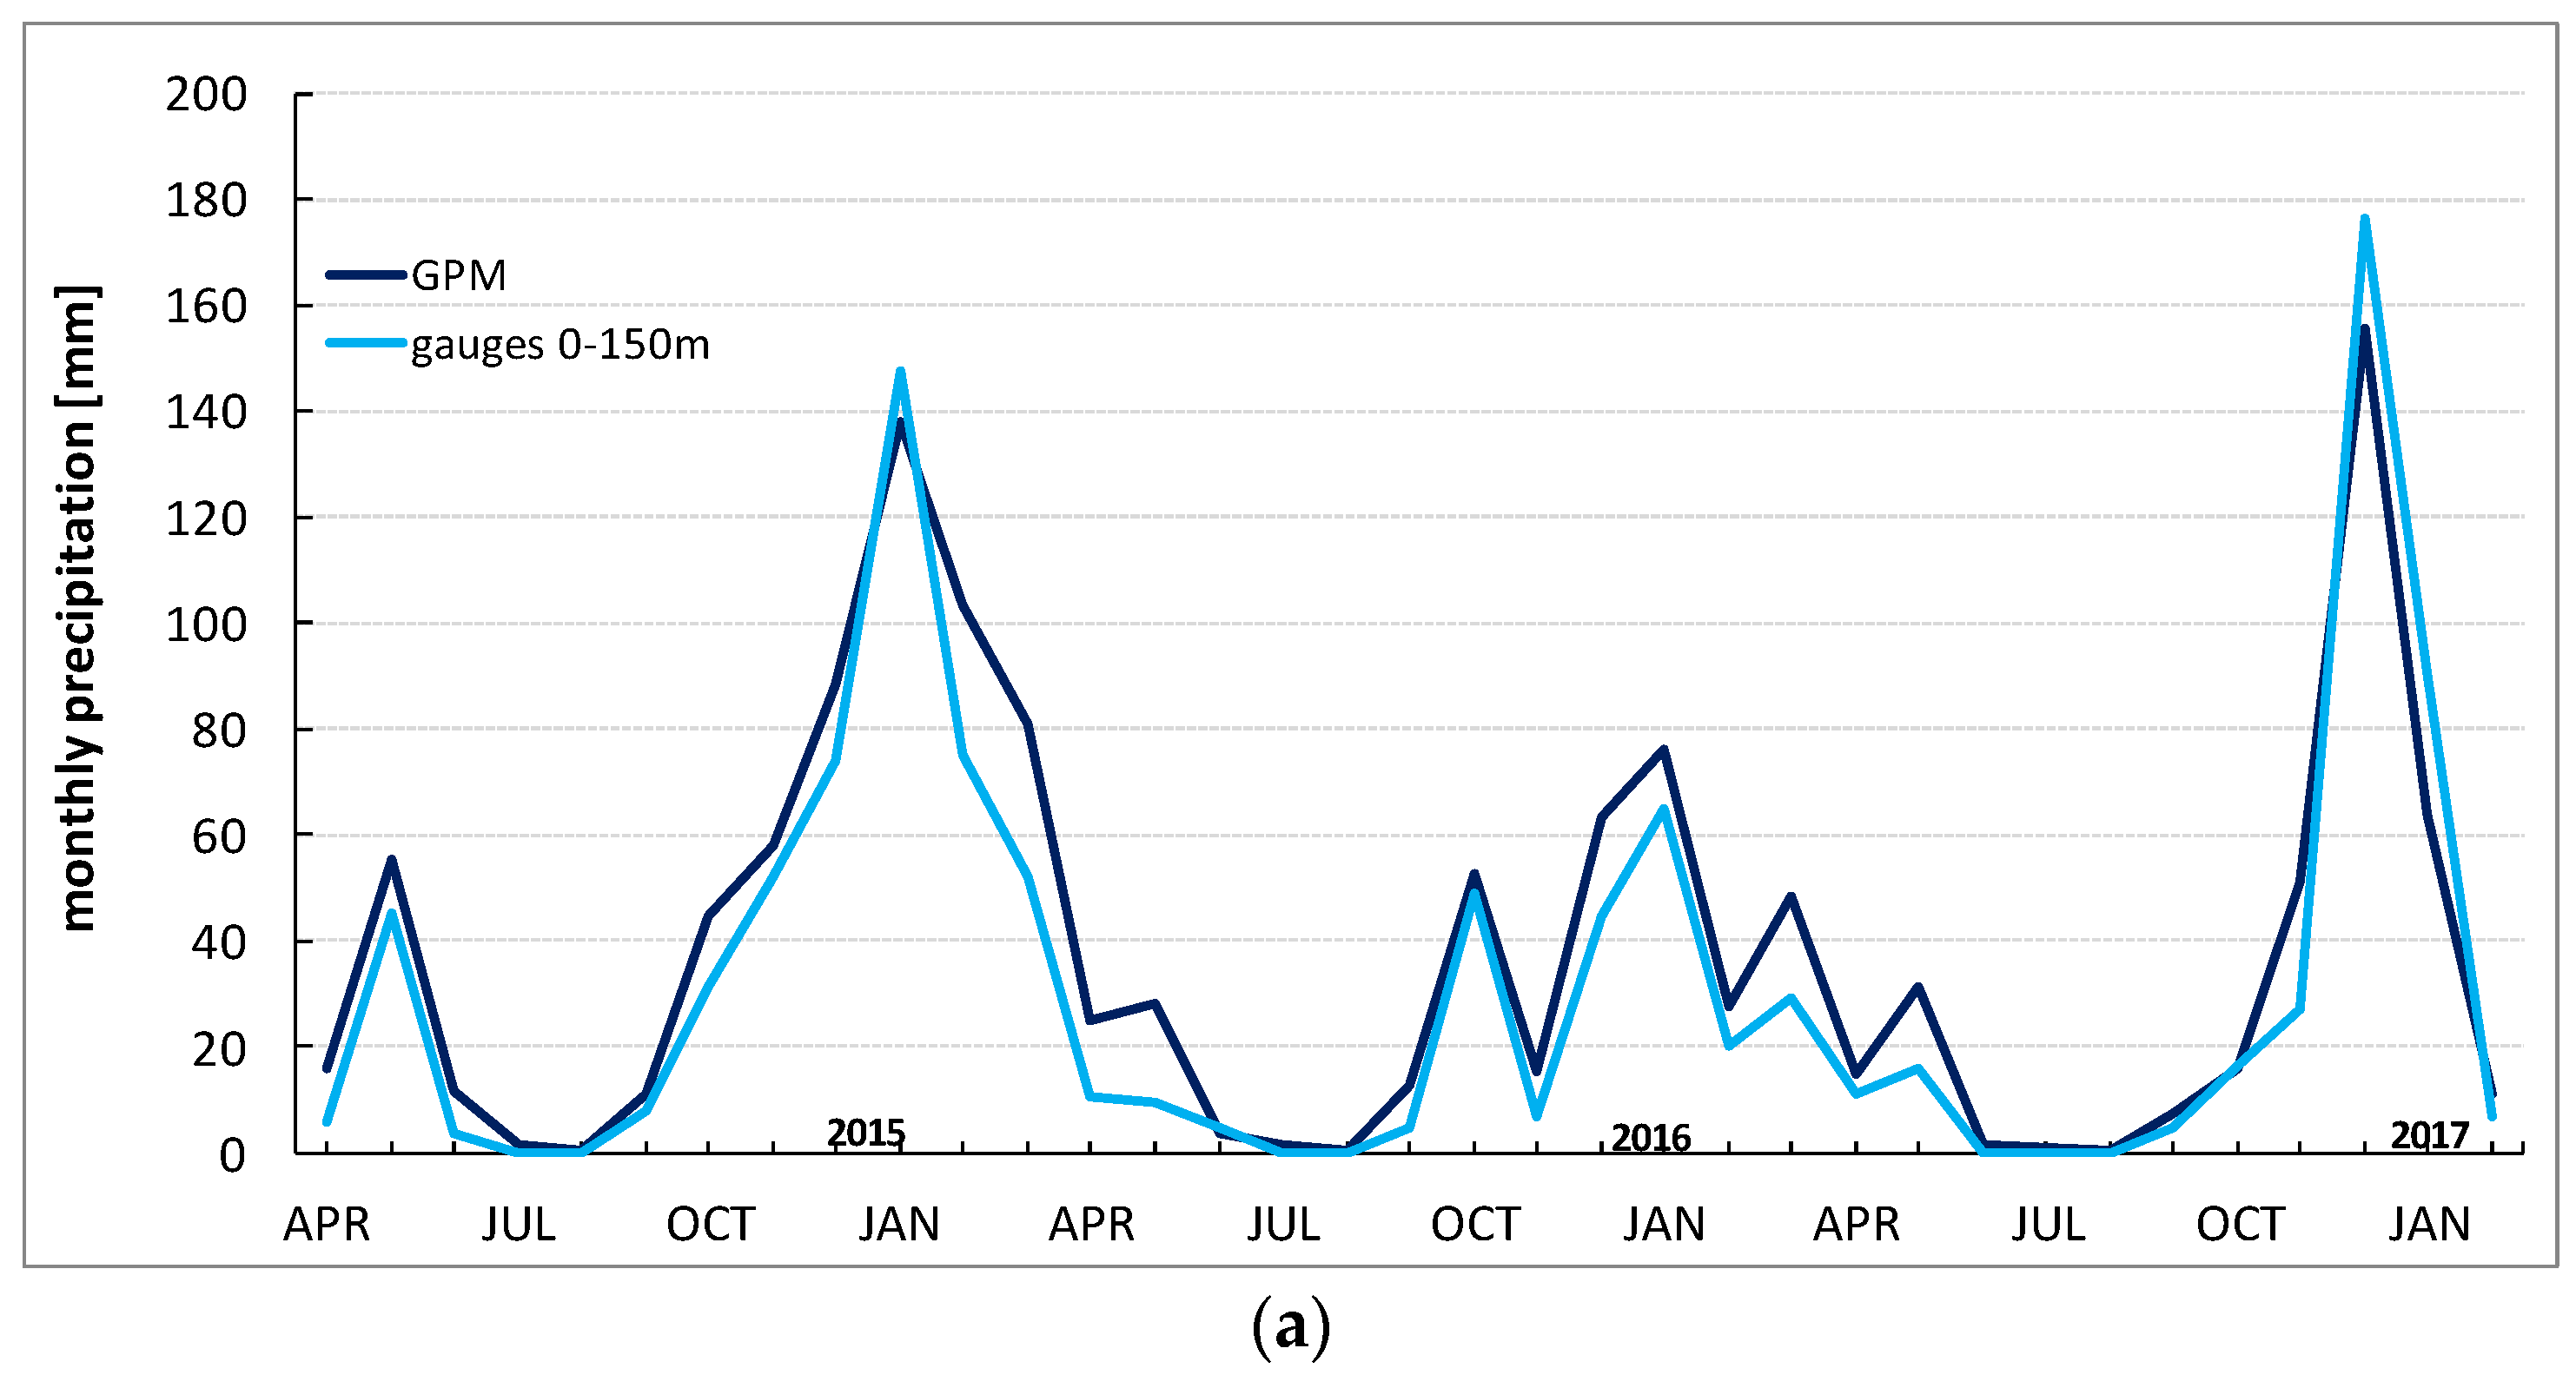
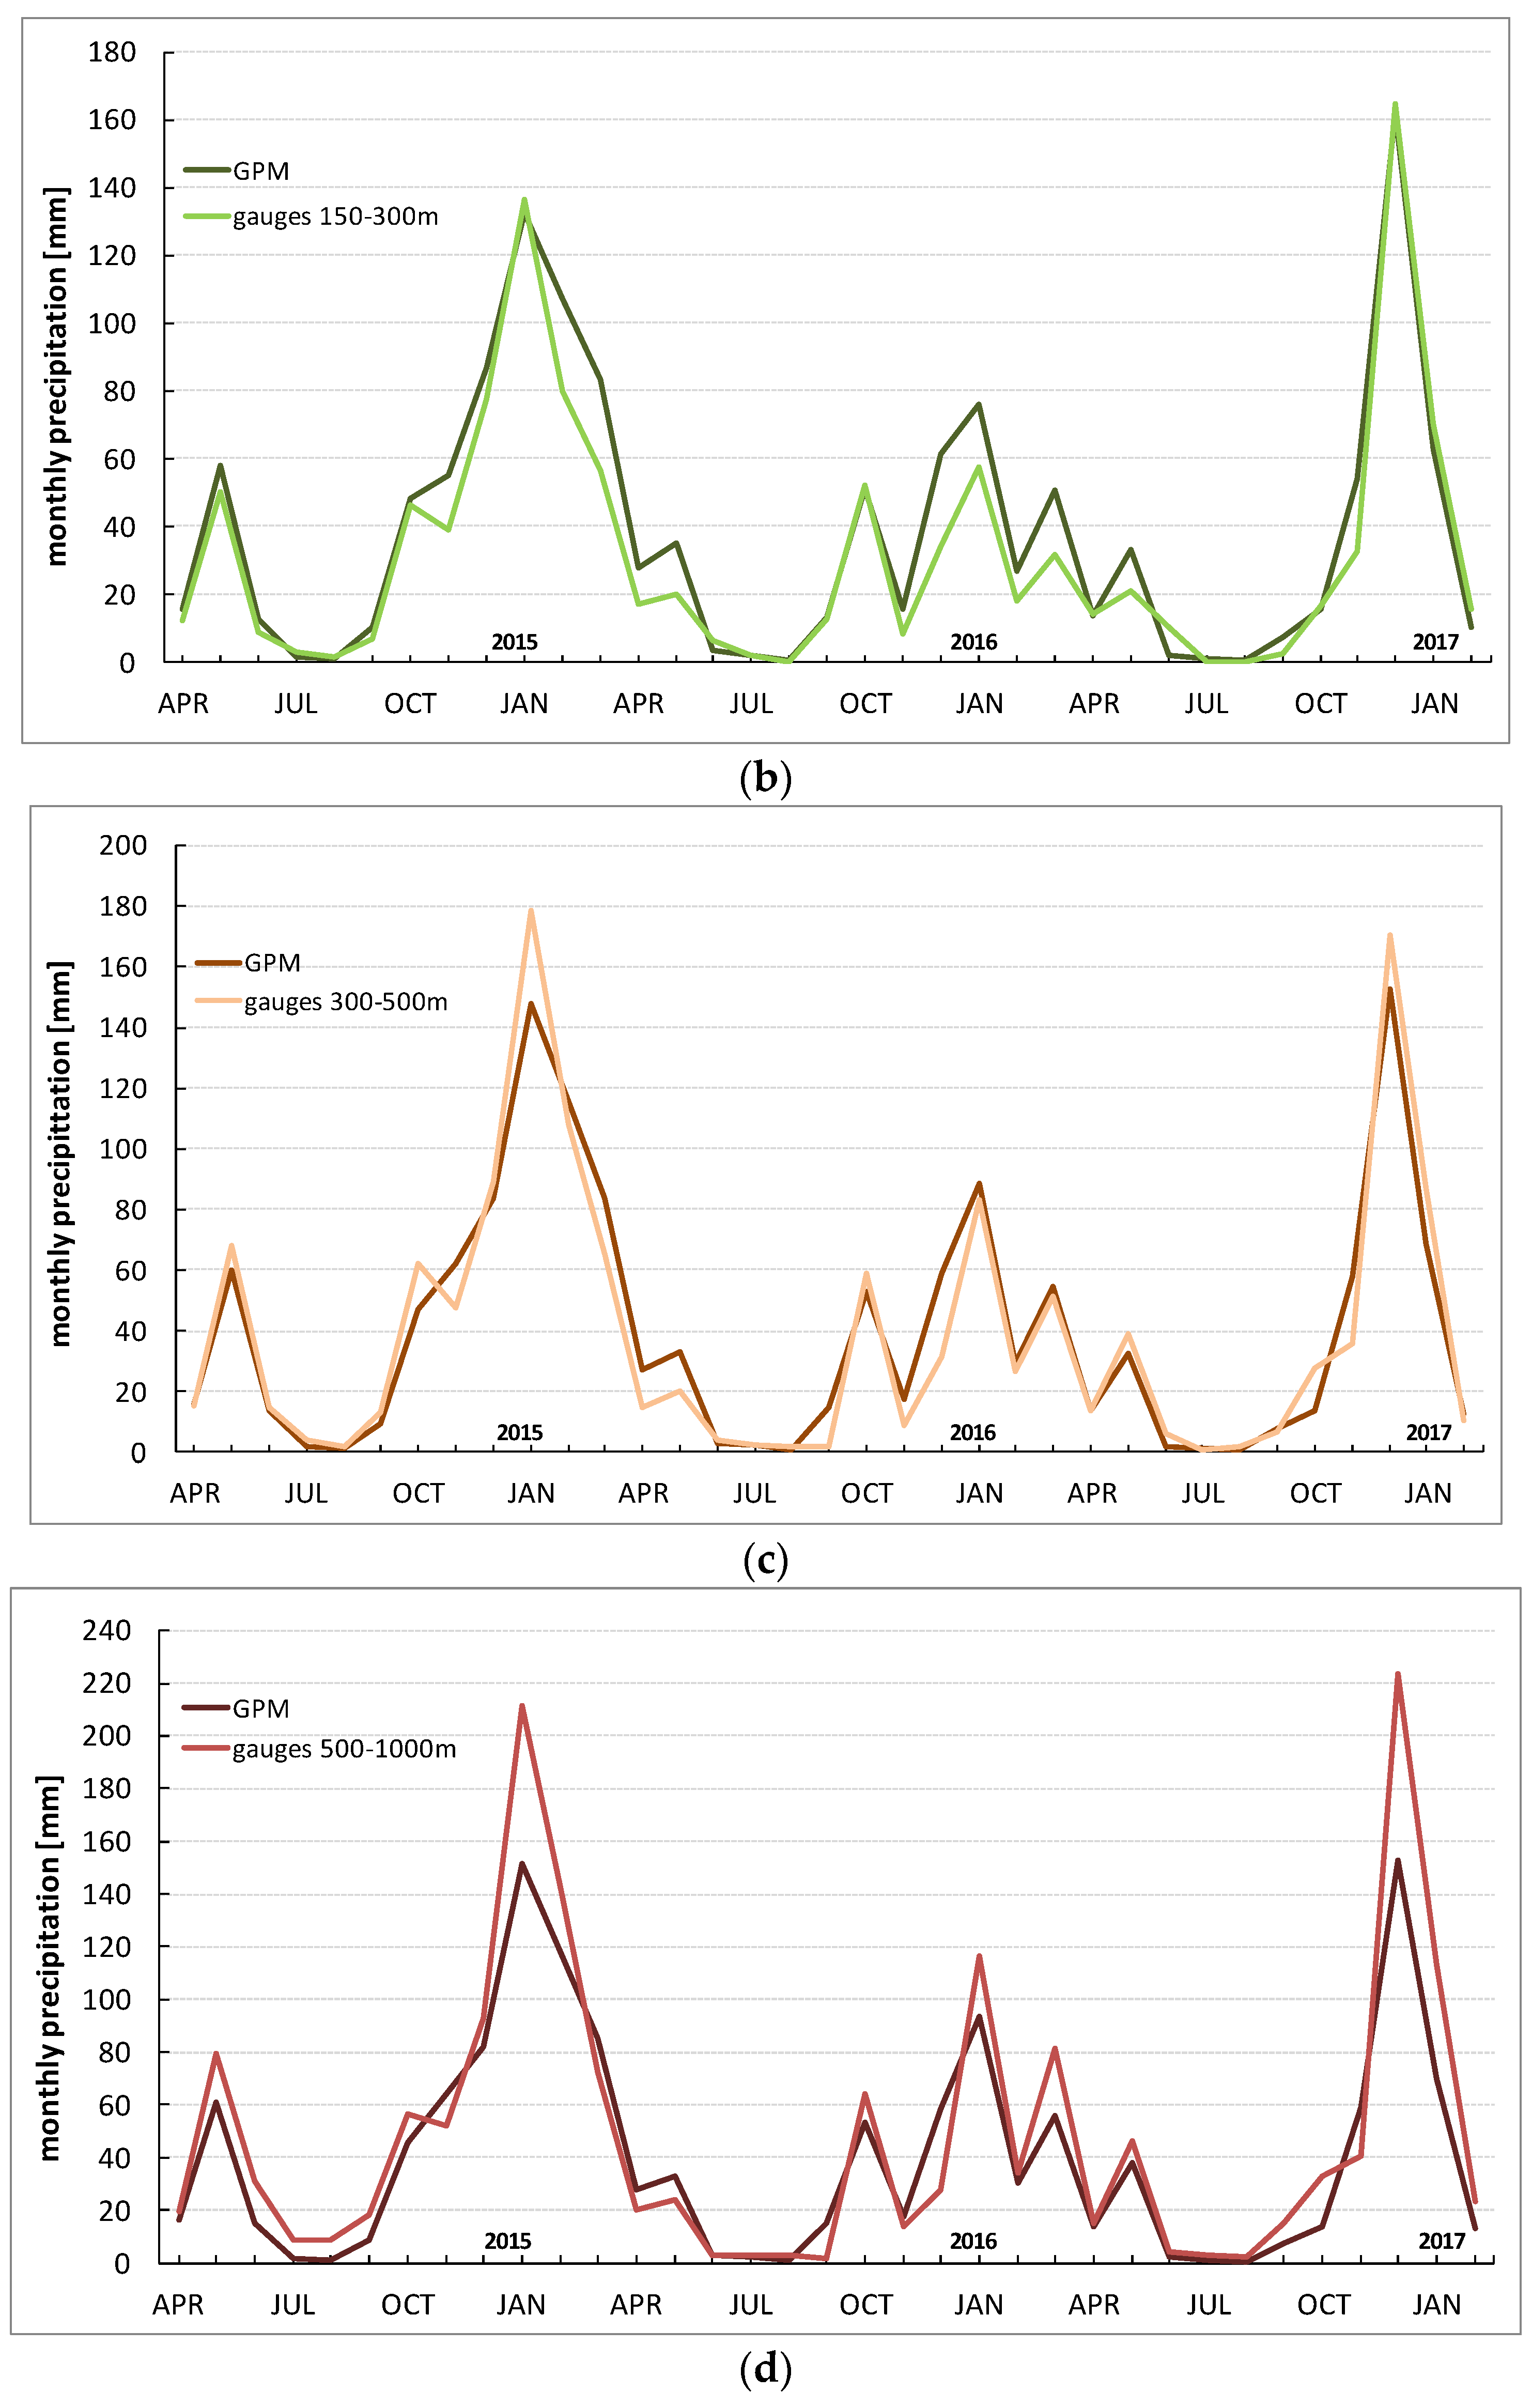
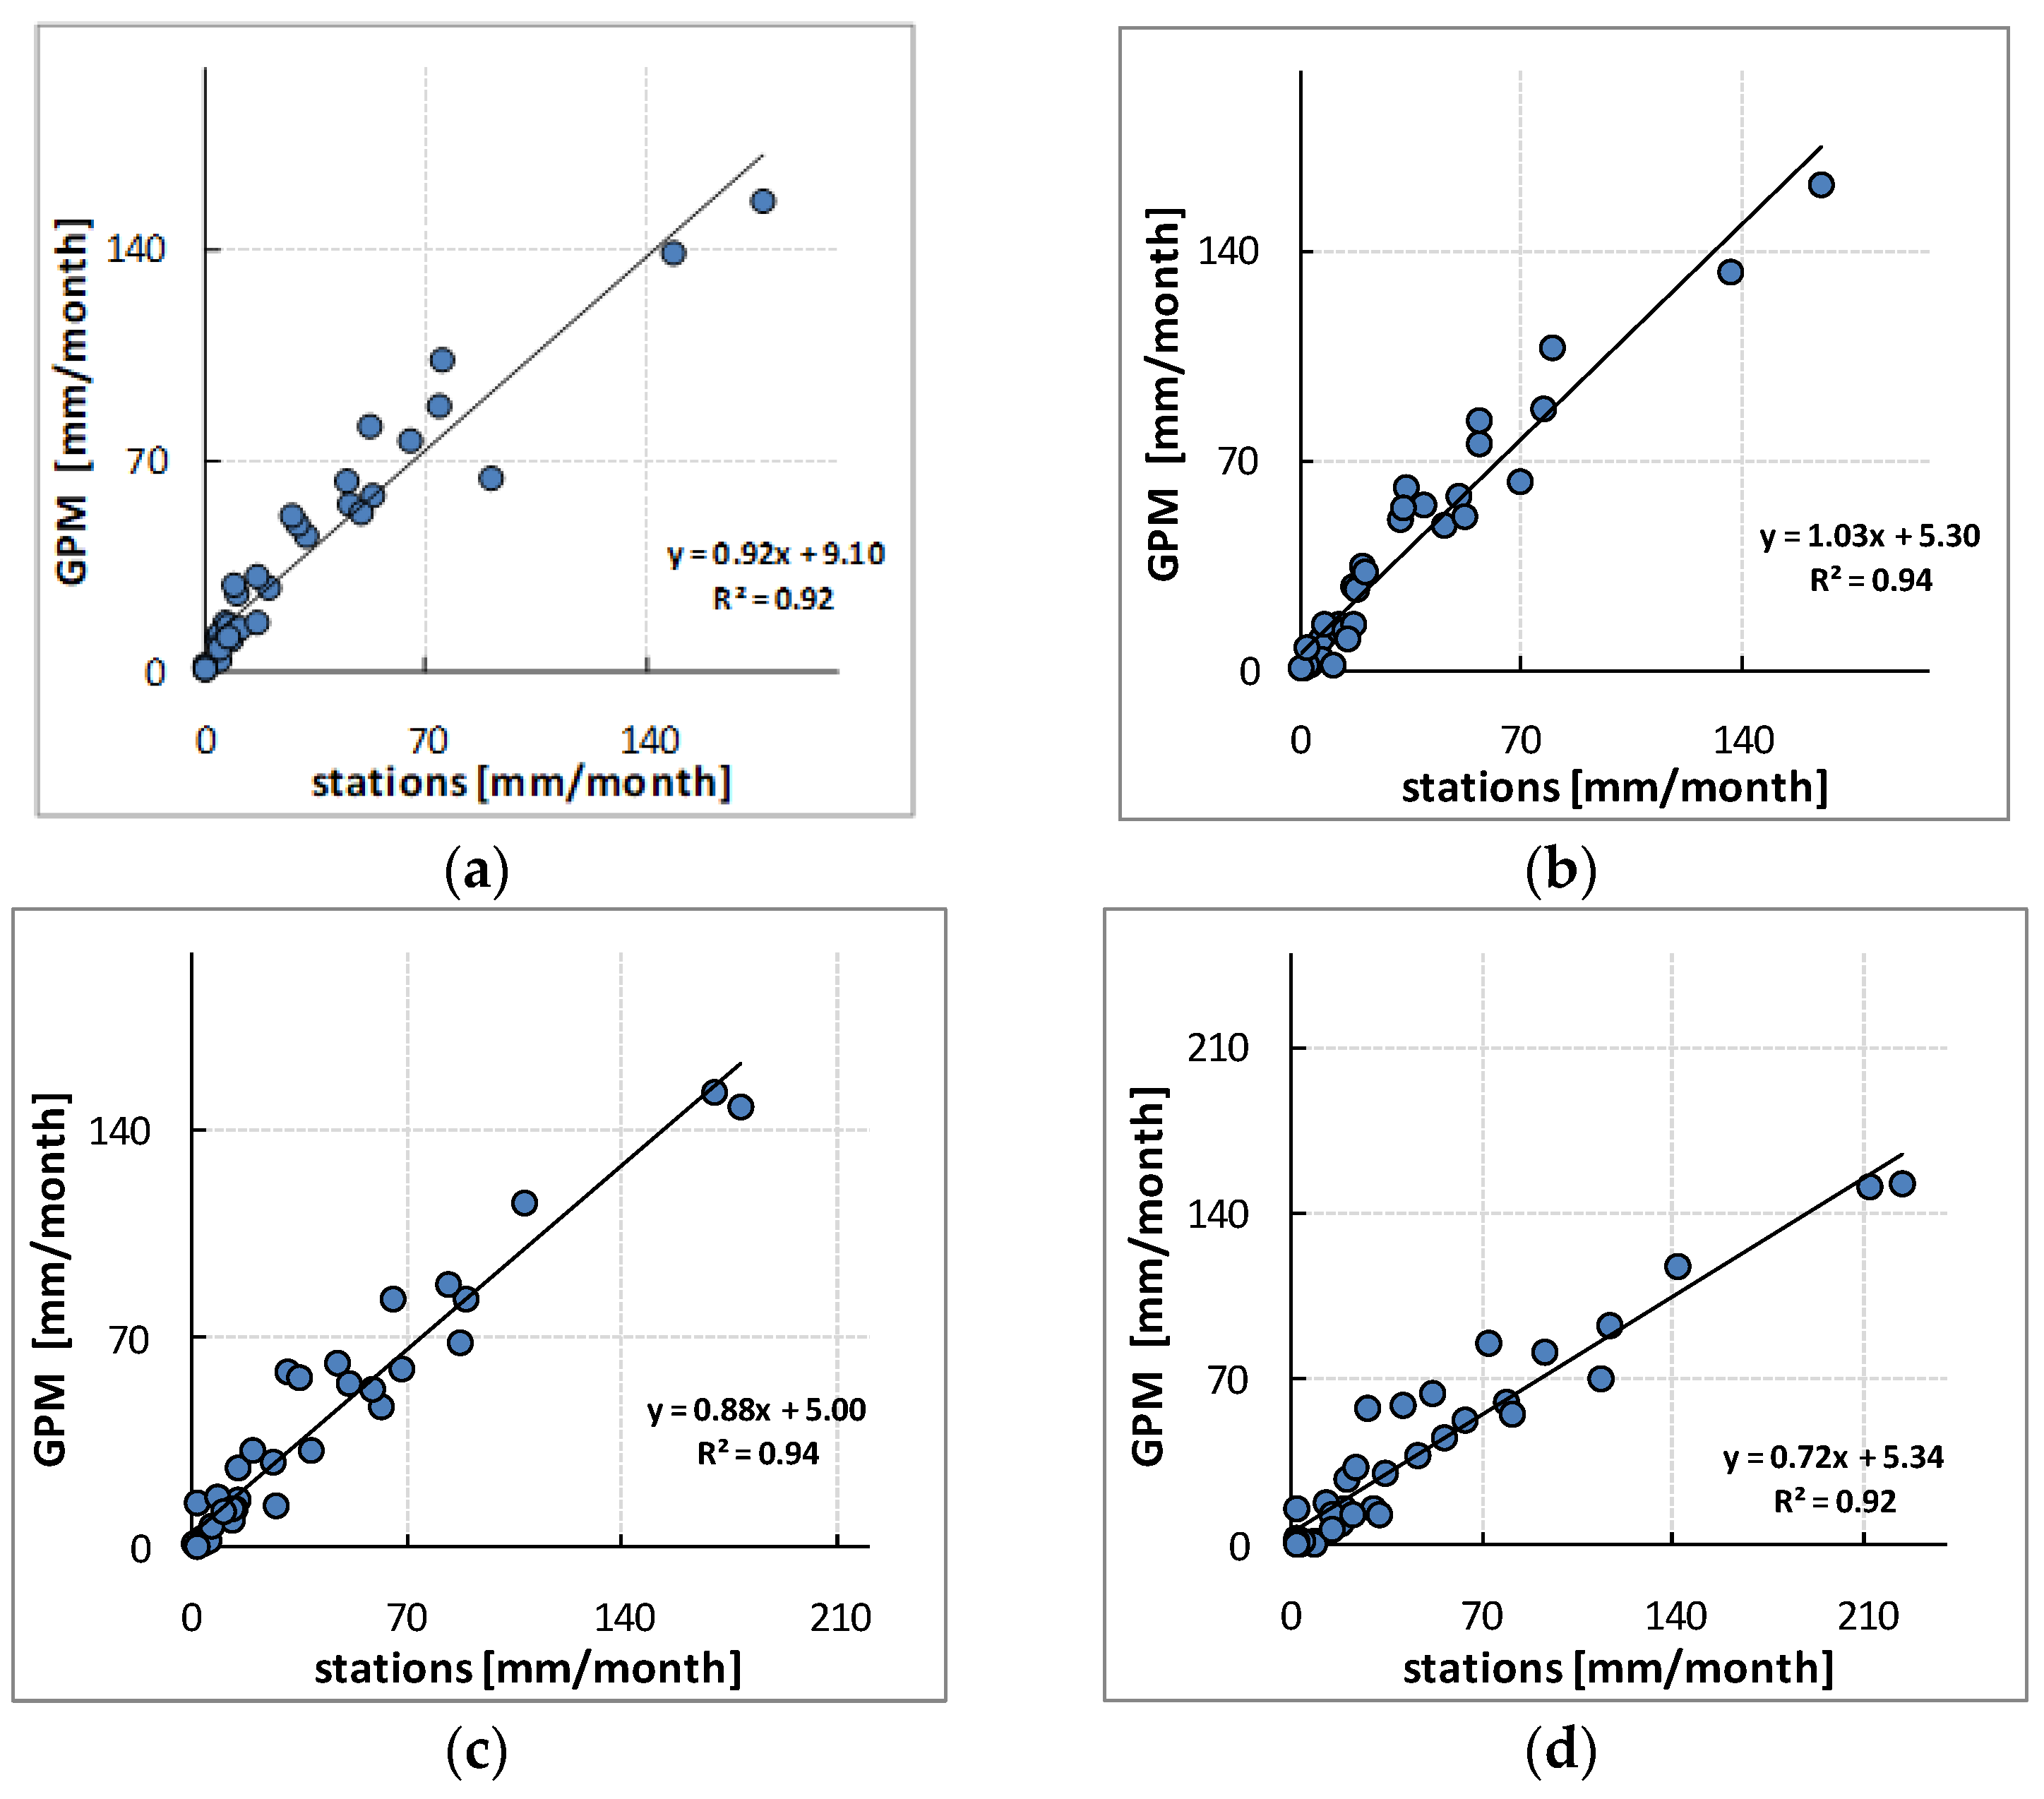
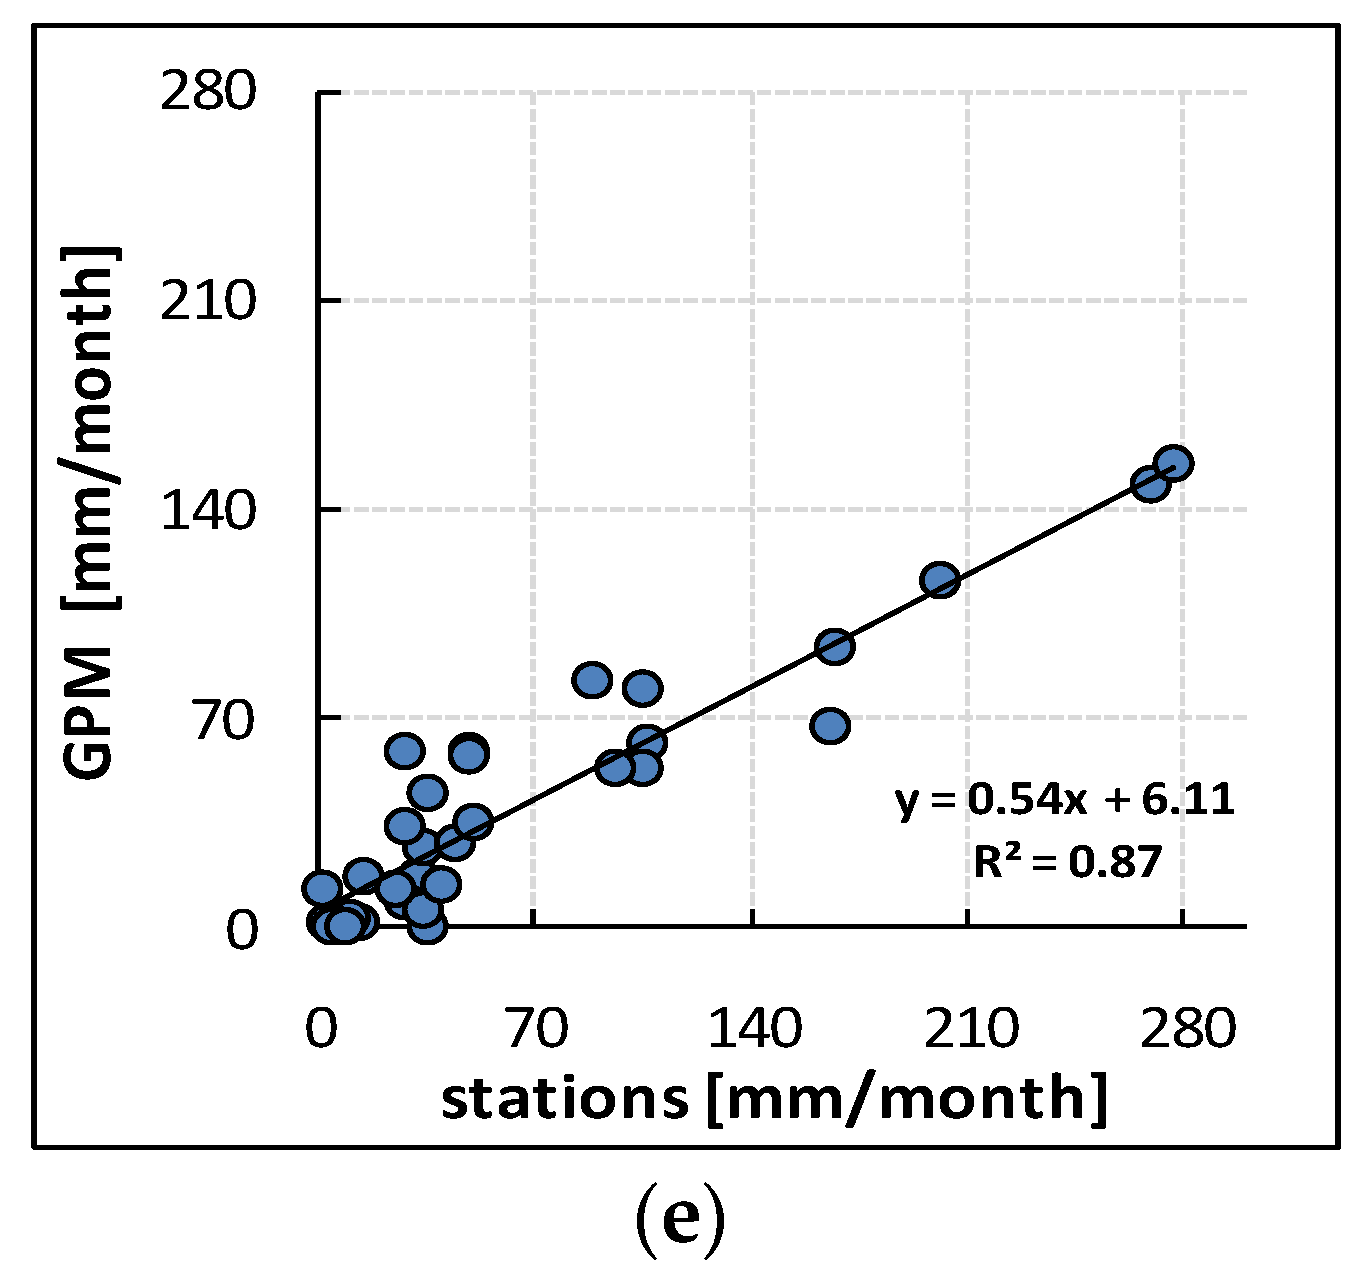
It is noticed that both IMERG and gauge data depict similar patterns in terms of monthly variation in all cases, regardless of the elevation of the stations. For the cases that elevation lower than 500 m is considered, small differences are observed, while the corresponding coefficients of determination are within the range of 0.92–0.94 (Figure 4 and Figure 5). However, when elevation higher than 500 m is considered GPM tends to underestimate precipitation with corresponding coefficients of determination of 0.92 (500–1000 m) and 0.87 for elevation higher than 1000 m. This is more evident during the wet period (December, January), where differences noticed are larger, especially in the case where elevation is higher than 1000 m.
Accordingly, the root mean squared error (RMSE) and mean absolute error (MAE) metrics were also calculated (Table 3). It is noticed that RMSE ranges from 11.82 to 48.75 and MAE from 8.62 to 30.43 when is calculated for each cell and for the whole period of study. The maximum value refers to a cell within which reside stations with elevation greater than 1100 m, while the second maximum is also in a similar cell regarding elevation. On the other hand, the minimum values of both metrics refer to a cell where a station of almost 600 m is attached.
The month with the maximum values of RMSE and MAE is December 2016 with 69.03 and 59.78 respectively, while as expected, all winter months which correspond to the wet period of the hydrological year, have high values of both metrics. On the other hand, August 2015 has the lowest values, 2.47 and 1.31 respectively, and the summer months in general have low values, as they correspond to the dry period of the year (May–August).
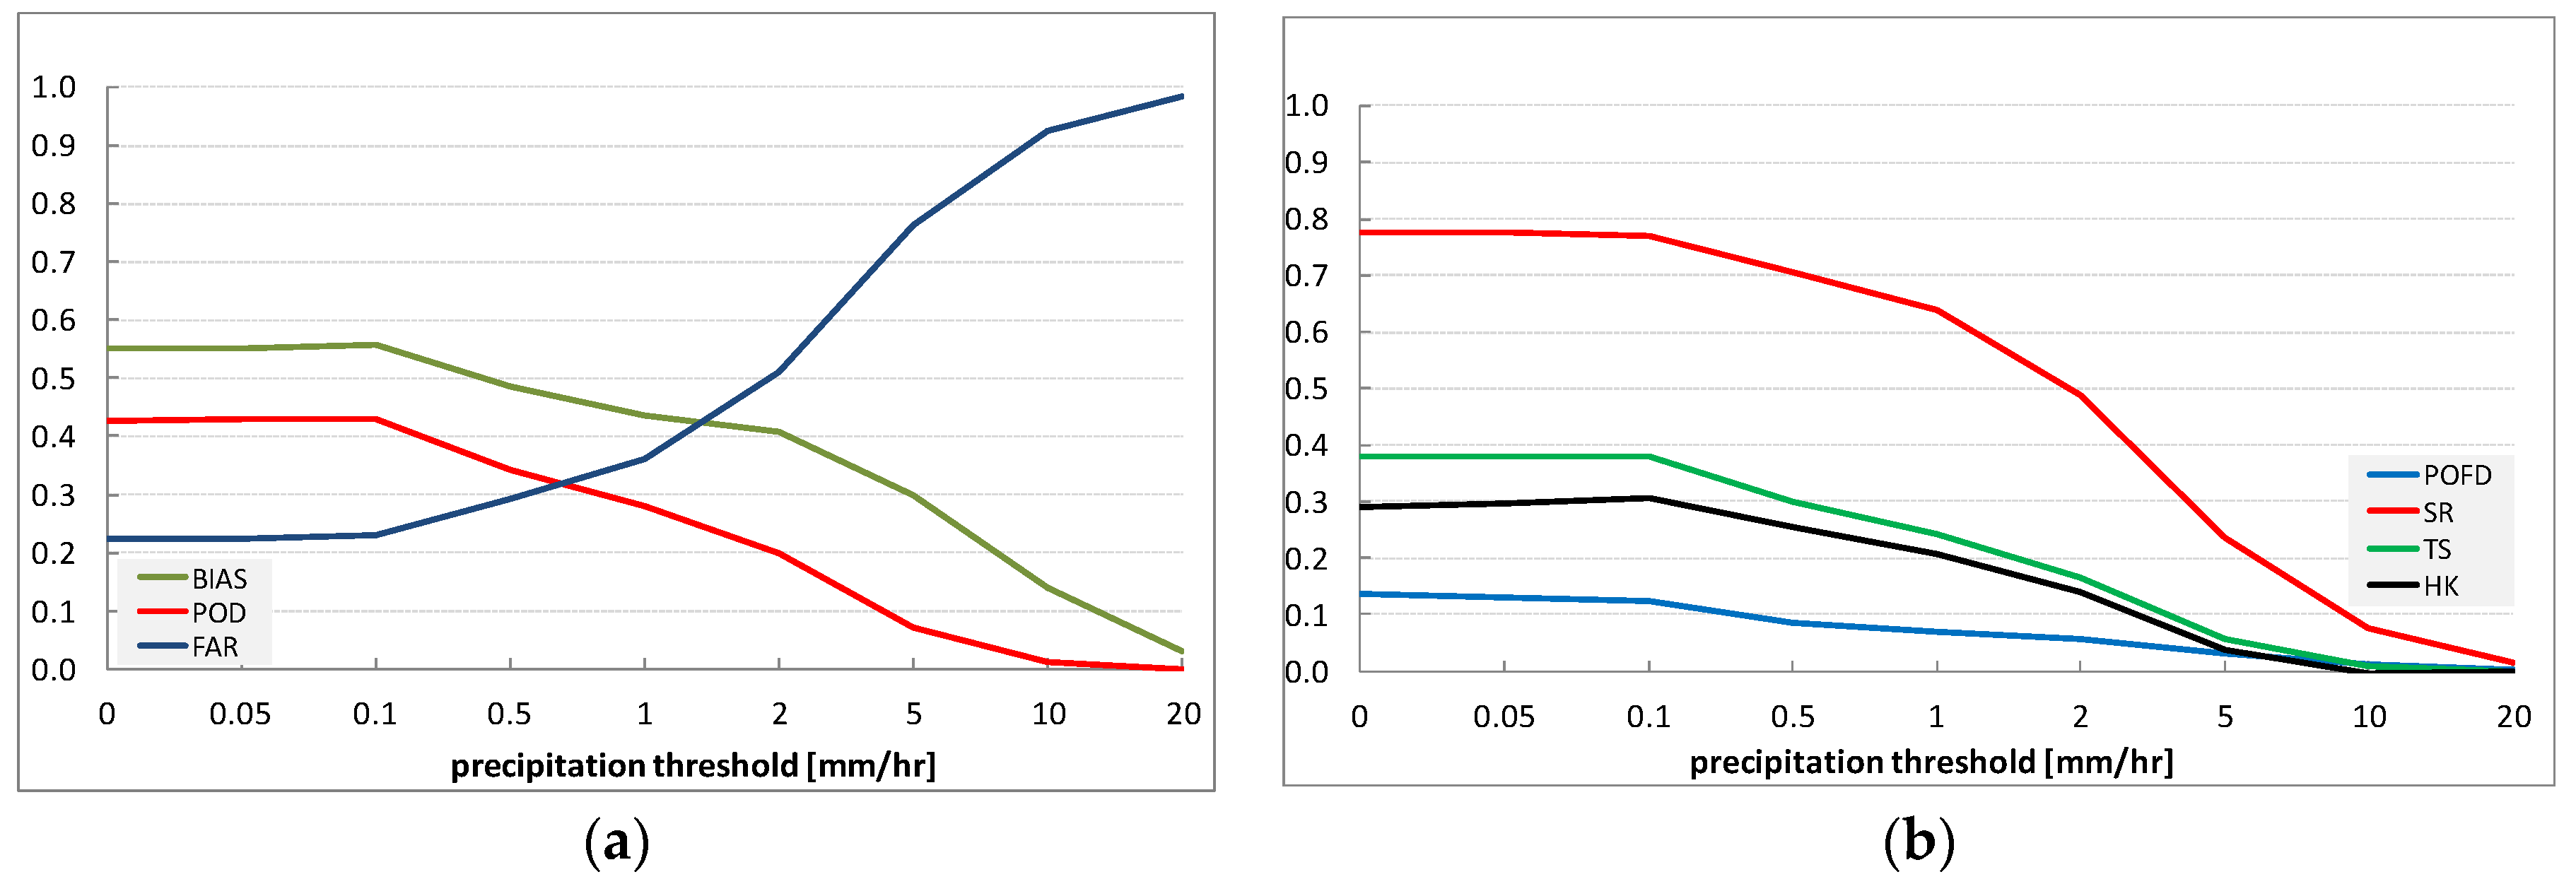
The statistical scores based on contingency tables were calculated comparing hourly values of gauge records and IMERG estimates during the study period considering that the daily (24 h) precipitation values were greater than 10 mm. Results are presented in Figure 6.
Correct negatives increase significantly as precipitation threshold increases; misses and hits are drastically decreased with increasing precipitation threshold, while false alarms are also reduced. It is noticed that for precipitation threshold within the range 0 to 0.1 mm/h, FAR is relatively low (~0.2), while POD and BIAS are at their maximum (0.4 and 0.55, respectively). Accordingly, as precipitation threshold increases, FAR also increases, while POD and BIAS decrease. On the other hand, POFD, SR, TS and HK decrease with increasing precipitation threshold.
Figure 7a illustrates the frequency distribution (bars) of the correlation coefficient values for all cases (24 h precipitation > 10 mm) recorded during the first years of GPM over Cyprus together with the cumulative frequency (line) for the same values. The pairs that are compared are the GPM grid-cells with precipitation estimates and the corresponding gauges values, both as hourly rates during the whole duration of the events, since hourly is the highest time resolution that the observations can be available.
It is obvious that there is not any value with a clear dominance since almost all coefficient values lay between 3% and 5%, however there are very few cases with negative correlation. This can be seen also at the cumulative line, where about 10% of the values are negative, 60% are greater than 0.30 and almost 30% are greater than 0.60. High values i.e., 0.75 or greater, have about 20% of the studied cases.
Figure 7b illustrates the frequency distribution of correlation coefficient values. Breaking down to 65 grid cells, the correlation coefficient values between GPM estimates and the corresponding monthly observed precipitation (by one or more gauges) vary between 0.78 and 0.96. However, the vast majority of the values is over 0.90.
3.2. Daily Validation
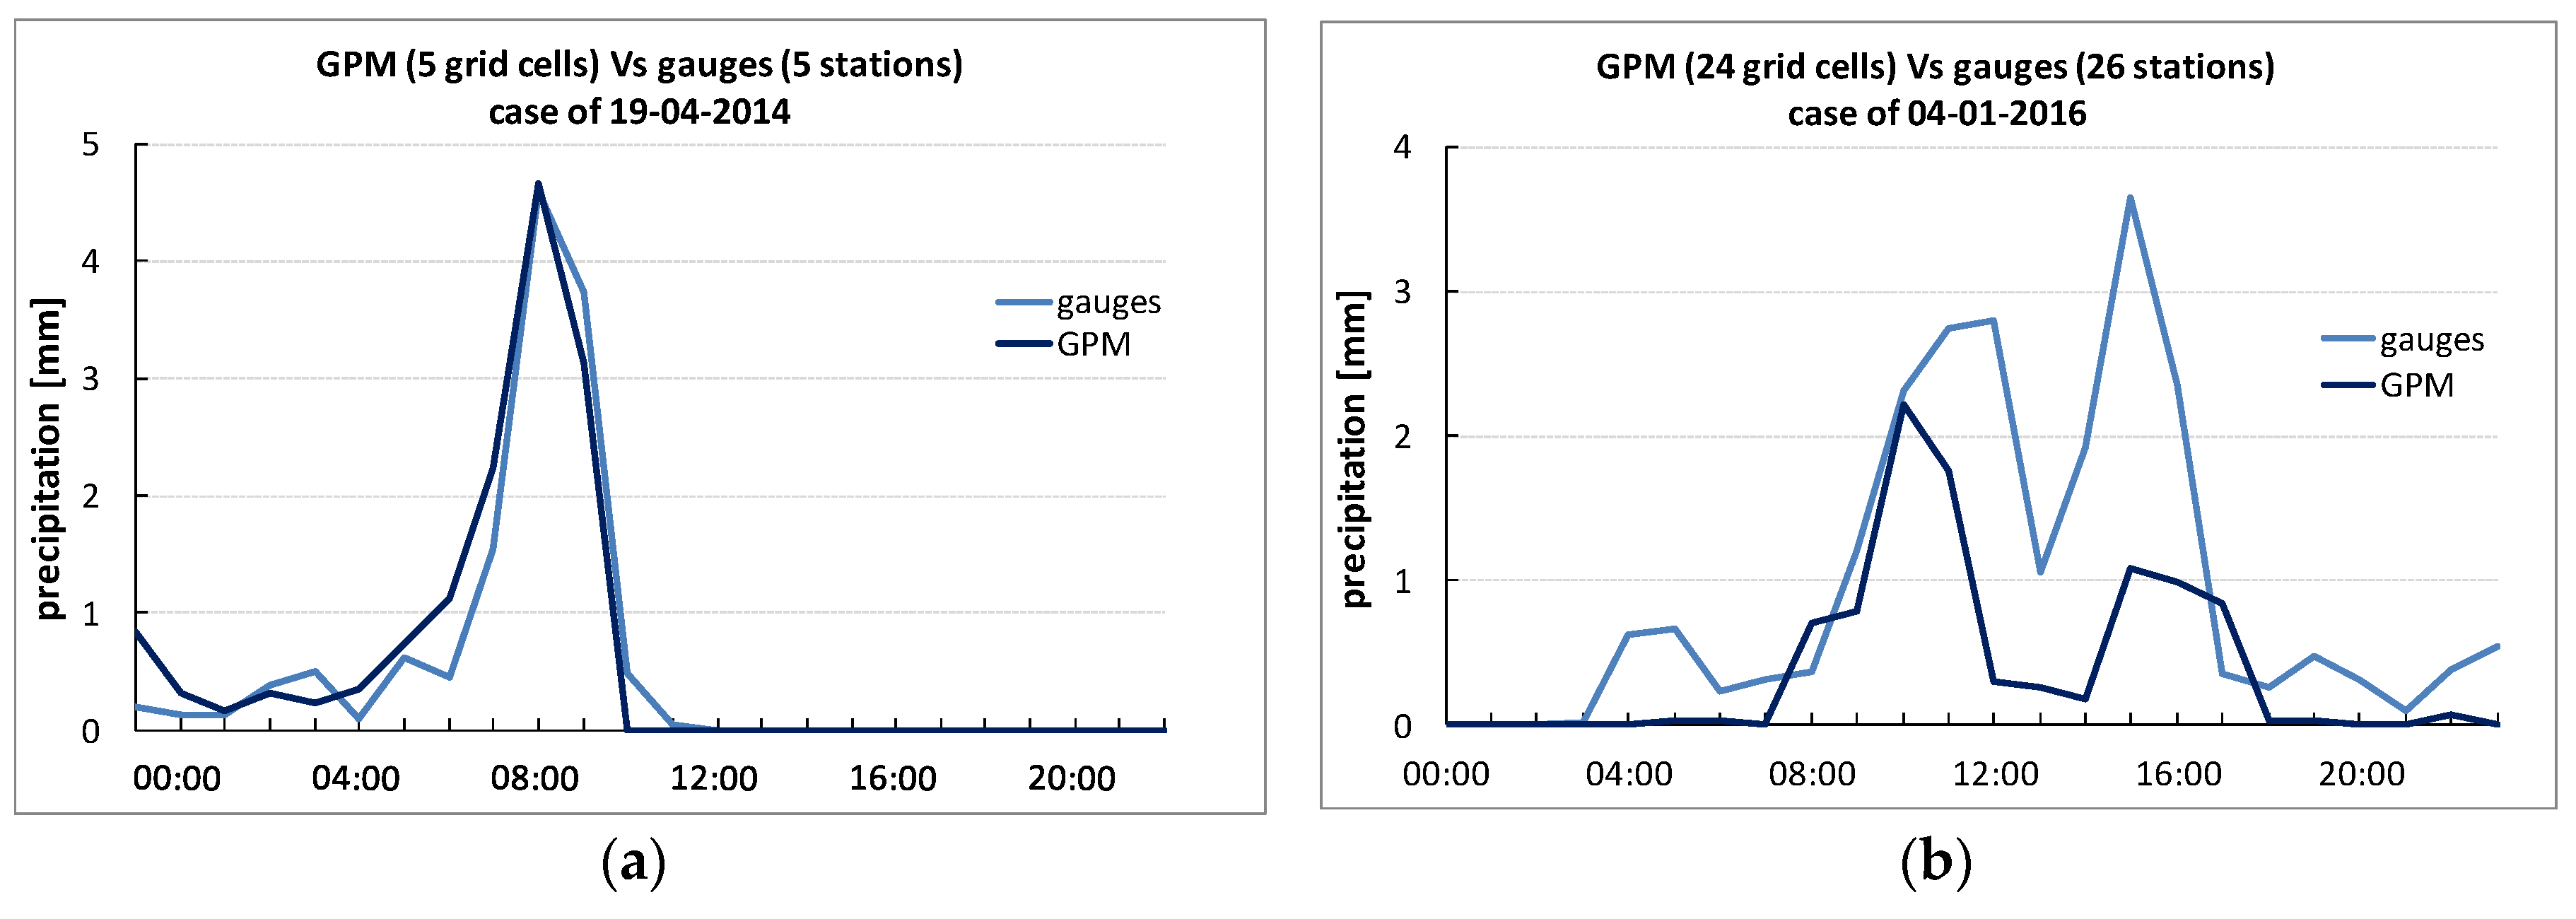
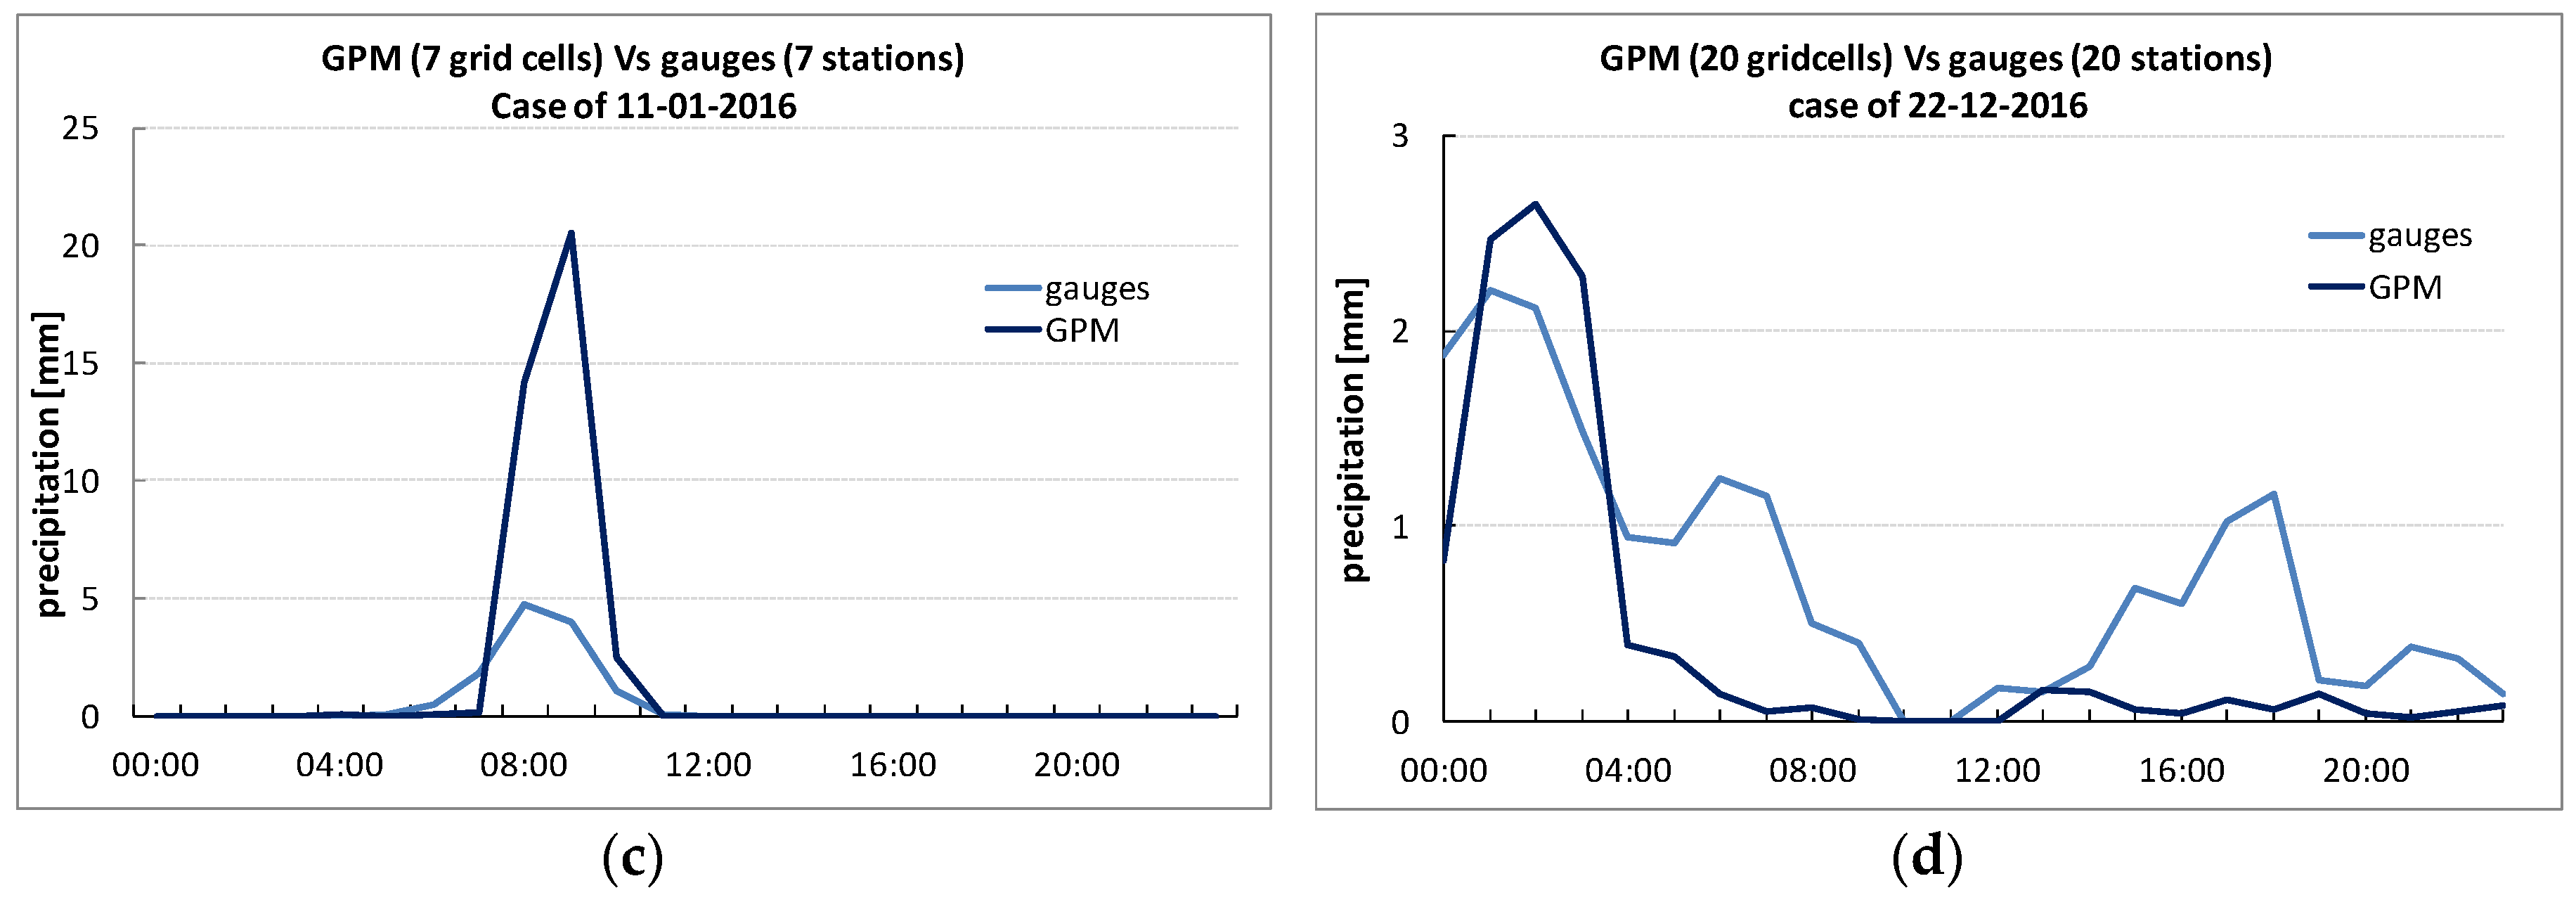
In order to study the ability of IMERG data to detect the daily variation of precipitation, we analyzed the whole dataset aiming mainly to extreme precipitation events recorded during the period of study. Accordingly, we proceed to the selection of a few case study events during the three years period. Figure 8 presents the time propagation of the precipitation measured by the stations (average value for all stations that recorded precipitation) against that estimated by the GPM (again an average value for all grid cells), for the entire duration of each event. The GPM values are converted from half-hourly to hourly, in order to match the time resolution of the station data.
The examples shown in Figure 8, illustrate that there is a case dependency in the ability of GPM to estimate precipitation on high temporal resolution. Indeed, there are cases where the IMERG estimates match excellent the recorded precipitation (Figure 8a) or follow well the time evolution but miss the height of precipitation (Figure 8b), but in most of the cases precipitation is estimated just satisfactory (Figure 8c,d).
4. Conclusions
This study, as the title indicates clearly, is a first attempt to validate a specific GPM precipitation product by using in situ surface observations over the island of Cyprus. In comparing the two datasets, neither an upscaling of the rain-gauge measurements to the GPM grid nor an interpolation of the GPM measurements to the station level was attempted. The satellite product was validated against the gauge data by simply comparing the former with the latter within each satellite cell. The limitation of the data span is not encouraging more rigorous validation approaches. Upscaling the rain-gauge measurements or interpolating the satellite product to the station sites could be an alternative as more data become available but in such a case associated issues should also be considered [26].
An evaluation of the IMERG product in daily and monthly scales against rain-gauges from the dense and reliable network operated by the Cyprus Department of Meteorology in Cyprus from April 2014 to February 2017 was performed. Based on the statistical analysis presented, it was concluded that, in overall, a very good agreement on monthly level was established, although IMERG tend to be underestimated as elevation goes higher, especially for areas higher than 1000 m elevation. Regarding daily evaluation, in terms of extreme recorded events, it seems that there exists a case dependency, while no specific correlation with elevation was established.
In summary, that accurate estimation by satellite-based precipitation products remains still a challenge. However, form this preliminary assessment on the IMERG product, it is highlighted that it could be useful for use in hydrological studies of small basins and flood studies due to its finer spatial and temporal resolution than TMPA.
The research in the field is still open. The authors aim to further evaluate the product, while implementing the new released version of TMPA product to the spatial resolution of IMERG.
Author Contributions
All authors contributed extensively to the work presented in this paper. The manuscript was prepared by A.R. and revised by D.K., F.T. and S.M., D.K. and F.T. provided and analyzed data. All authors discussed the results and implications of the manuscript at all stages.
Funding
This research received no external funding.
Acknowledgments
The authors acknowledge the provision of the rain gauge data by the Cyprus Department of Meteorology and the GPM data by the National Aeronautics and Space Administration, U.S.A.
Conflicts of Interest
The authors declare no conflict of interest.
References
- Tapiador, F.J.; Turk, F.J.; Petersen, W.; Hou, A.Y.; García-Ortega, E.; Machado, L.A.T.; Angelis, C.F.; Salio, P.; Kidd, C.; Huffman, G.J.; de Castro, M. Global precipitation measurement: Methods, datasets and applications. Atmos. Res. 2012, 104–105, 70–97. [Google Scholar] [CrossRef]
- Tapiador, F.J.; Navarro, A.; Levizzani, V.; García-Ortega, E.; Huffman, G.J.; Kidd, C.; Kucera, P.A.; Kummerow, C.D.; Masunaga, H.; Petersen, W.A.; et al. Global precipitation measurements for validating climate models. Atmos. Res. 2017, 197, 1–20. [Google Scholar] [CrossRef]
- Michaelides, S.; Levizzani, V.; Anagnostou, E.; Bauer, P.; Kasparis, T.; Lane, J.E. Precipitation: Measurement, remote sensing, climatology and modeling. Atmos. Res. 2009, 94, 512–533. [Google Scholar] [CrossRef]
- Michaelides, S.; Tymvios, F.S.; Michaelidou, T. Spatial and temporal characteristics of the annual rainfall frequency distribution in Cyprus. Atmos. Res. 2009, 94, 606–615. [Google Scholar] [CrossRef]
- Hou, A.Y.; Kakar, R.K.; Neeck, S.; Azarbarzin, A.A.; Kummerow, C.D.; Kojima, M.; Oki, R.; Nakamura, K.; Iguchi, T. The Global Precipitation Measurement Mission. Bull. Am. Meteorol. Soc. 2014, 95, 701–722. [Google Scholar] [CrossRef] [Green Version]
- Skofronick-Jackson, G.; Petersen, W.A.; Berg, W.; Kidd, C.; Stocker, E.F.; Kirschbaum, D.B.; Kakar, R.; Braun, S.A.; Huffman, G.J.; Iguchi, T.; et al. The Global Precipitation Measurement (GPM) Mission for Science and Society. Bull. Am. Meteorol. Soc. 2017, 98, 1679–1695. [Google Scholar] [CrossRef] [Green Version]
- Sharifi, E.; Steinacker, R.; Saghafian, B. Assessment of GPM-IMERG and Other Precipitation Products against Gauge Data under Different Topographic and Climatic Conditions in Iran: Preliminary Results. Remote Sens. 2016, 8, 135. [Google Scholar] [CrossRef]
- Manz, B.; Páez-Bimos, S.; Horna, N.; Buytaert, W.; Ochoa-Tocachi, B.; Lavado-Casimiro, W.; Willems, B. Comparative Ground Validation of IMERG and TMPA at Variable Spatio temporal Scales in the Tropical Andes. J. Hydrometeor. 2017, 18, 2469–2489. [Google Scholar] [CrossRef]
- Prakash, S.; Mitra, A.K.; AghaKouchak, A.; Liu, Z.; Norouzi, H.; Pai, D.S. A preliminary assessment of GPM-based multi-satellite precipitation estimates over a monsoon dominated region. J. Hydrol. 2018, 556, 865–876. [Google Scholar] [CrossRef]
- Sungmin, O.; Foelsche, U.; Kirchengast, G.; Fuchsberger, J.; Tan, J.; Petersen, W.A. Evaluation of GPM IMERG Early, Late, and Final rainfall estimates using WegenerNet gauge data in southeastern Austria. Hydrol. Earth Syst. Sci. 2017, 21, 6559–6572. [Google Scholar] [CrossRef] [Green Version]
- Tan, M.L.; Duan, Z. Assessment of GPM and TRMM Precipitation Products over Singapore. Remote Sens. 2017, 9, 720. [Google Scholar] [CrossRef]
- Asong, Z.E.; Razavi, S.; Wheater, H.S.; Wong, J.S. Evaluation of Integrated Multisatellite Retrievals for GPM (IMERG) over Southern Canada against ground Precipitation Observations: A Preliminary Assessment. J. Hydrometeor. 2017, 18, 1033–1050. [Google Scholar] [CrossRef]
- Tang, G.; Ma, Y.; Long, D.; Zhong, L.; Hong, Y. Evaluation of GPM Day-1 IMERG and TMPA Version-7 legacy products over Mainland China at multiple spatiotemporal scales. J. Hydrol. 2016, 533, 152–167. [Google Scholar] [CrossRef]
- Tian, F.; Hou, S.; Yang, L.; Hu, H.; Hou, A. How Does the Evaluation of the GPM IMERG Rainfall Product Depend on Gauge Density and Rainfall Intensity? J. Hydrometeor. 2018, 19, 339–349. [Google Scholar] [CrossRef]
- Xu, R.; Tian, F.; Yang, L.; Hu, H.; Lu, H.; Hou, A. Ground validation of GPM IMERG and TRMM 3B42V7 rainfall products over southern Tibetan Plateau based on a high-density rain gauge network. J. Geophys. Res. Atmos. 2017, 122, 910–924. [Google Scholar] [CrossRef]
- Dezfuli, A.K.; Ichoku, C.M.; Huffman, G.J.; Mohr, K.I.; Selker, J.S.; van de Giesen, N.; Hochreutener, R.; Annor, F.O. Validation of IMERG Precipitation in Africa. J. Hydrometeor. 2017, 18, 2817–2825. [Google Scholar] [CrossRef]
- Liu, Z. Comparison of Integrated Multisatellite Retrievals for GPM (IMERG) and TRMM Multisatellite Precipitation Analysis (TMPA) Monthly Precipitation Products: Initial Results. J. Hydrometeor. 2016, 17, 777–790. [Google Scholar] [CrossRef]
- Tan, M.L.; Santo, H. Comparison of GPM IMERG, TMPA 3B42 and PERSIANN-CDR satellite precipitation products over Malaysia. Atmos. Res. 2018, 202, 63–76. [Google Scholar] [CrossRef]
- Retalis, A.; Katsanos, D.; Michaelides, S. Precipitation climatology over the Mediterranean Basin—Validation over Cyprus. Atmos. Res. 2016, 169, 449–458. [Google Scholar] [CrossRef]
- Katsanos, D.; Retalis, A.; Michaelides, S. Validation of a high-resolution precipitation database (CHIRPS) over Cyprus for a 30-year period. Atmos. Res. 2016, 169, 459–464. [Google Scholar] [CrossRef]
- Katsanos, D.; Retalis, A.; Tymvios, F.; Michaelides, S. Analysis of precipitation extremes based on satellite (CHIRPS) and in-situ data set over Cyprus. Nat. Hazards 2016, 83, S53–S63. [Google Scholar] [CrossRef]
- Retalis, A.; Tymvios, F.; Katsanos, D.; Michaelides, S. Downscaling CHIRPS precipitation data: An artificial neural networks modelling approach. Int. J. Remote Sens. 2017, 38, 3943–3959. [Google Scholar] [CrossRef]
- Katsanos, D.; Retalis, A.; Tymvios, F.; Michaelides, S. Study of extreme wet and dry periods in Cyprus using climatic indices. Atmos. Res. 2018, 208, 88–93. [Google Scholar] [CrossRef]
- Michaelides, S.; Karacostas, T.; Sánchez, J.L.; Retalis, A.; Pytharoulis, I.; Homar, V.; Romero, R.; Zanis, P.; Giannakopoulos, C.; Bühl, J.; et al. Reviews and perspectives of high impact atmospheric processes in the Mediterranean. Atmos. Res. 2018, 208, 4–44. [Google Scholar] [CrossRef]
- Jolliffe, I.T.; Stephenson, D.B. Forecast Verification: A Practitioner’s Guide in Atmospheric Science; John Wiley & Sons: Chichester, UK, 2003; p. 240. [Google Scholar]
- Tyralis, H.; Koutsoyiannis, D. On the prediction of persistent processes using the output of deterministic models. Hydrol. Sci. J. 2017, 62, 2083–2102. [Google Scholar] [CrossRef]
Figure 1.
The island of Cyprus, with the location of the stations used; stations are grouped in terms of their elevation.
Figure 1.
The island of Cyprus, with the location of the stations used; stations are grouped in terms of their elevation.

Figure 2.
The annual average precipitation of Cyprus for the period 1916–2017.

Figure 3.
Monthly precipitation from GPM (average of 84 grid cells) versus gauges (average of 136 stations) from April 2014 to February 2017, for all stations (a), and the corresponding scatter plot (b). Upper and lower limits of the monthly precipitation bars refer to corresponding standard deviation.


Figure 4.
Monthly precipitation from GPM versus gauges from April 2014–February 2017, for stations with elevation from (a) 0 to 150 m; (b) 150 to 300 m; (c) 300 to 500 m; (d) 500 to 1000 m; (e) greater than 1000 m.
Figure 4.
Monthly precipitation from GPM versus gauges from April 2014–February 2017, for stations with elevation from (a) 0 to 150 m; (b) 150 to 300 m; (c) 300 to 500 m; (d) 500 to 1000 m; (e) greater than 1000 m.


Figure 5.
Scatter plots of monthly precipitation from GPM versus gauges from April 2014–February 2017, for stations with elevation from (a) 0 to 150 m; (b) 150 to 300 m; (c) 300 to 500 m; (d) 500 to 1000 m; (e) greater than 1000 m.
Figure 5.
Scatter plots of monthly precipitation from GPM versus gauges from April 2014–February 2017, for stations with elevation from (a) 0 to 150 m; (b) 150 to 300 m; (c) 300 to 500 m; (d) 500 to 1000 m; (e) greater than 1000 m.


Figure 6.
Statistical scores based on contingency tables: BIAS, POD, FAR (a); POFD, SR, TS, HK (b).

Figure 7.
Frequencies of correlation coefficients (a) and frequency distribution of correlation coefficients (b).
Figure 7.
Frequencies of correlation coefficients (a) and frequency distribution of correlation coefficients (b).

Figure 8.
Time propagation of the precipitation recorded by stations (light blue) and that estimated by GPM (dark blue), for four selected cases dated 19 April 2014 (a); 04 January 2016 (b); 11 January 2016 (c); 22 December 2016 (d).
Figure 8.
Time propagation of the precipitation recorded by stations (light blue) and that estimated by GPM (dark blue), for four selected cases dated 19 April 2014 (a); 04 January 2016 (b); 11 January 2016 (c); 22 December 2016 (d).


Table 1.
Contingency table used for calculating the statistical scores.
| Gauges | ||||
|---|---|---|---|---|
| GPM IMERG | Yes | No | Total | |
| Yes | Hits | False alarms | Forecast Yes | |
| No | Misses | Correct negatives | Forecast No | |
| Total | Observed Yes | Observed No | Total | |
Table 2.
The five classes of rain gauges. Categorization is made on the basis of the rain gauge’s elevation (see Figure 1). The number of rain gauges along with the corresponding GPM grid cells in each class are also shown.
Table 2.
The five classes of rain gauges. Categorization is made on the basis of the rain gauge’s elevation (see Figure 1). The number of rain gauges along with the corresponding GPM grid cells in each class are also shown.
| Class No. | Elevation (m) | Categorization | Number of Rain Gauges | Number of GPM Grid Cells |
|---|---|---|---|---|
| 1 | 0–150 | Coastal | 42 | 26 |
| 2 | 150–300 | Inland plain | 18 | 14 |
| 3 | 300–500 | Hilly | 25 | 17 |
| 4 | 500–1000 | Semi Mountainous | 37 | 20 |
| 5 | >1000 | Mountainous | 14 | 7 |
Table 3.
Results of RMSE and MAE.
| RMSE (Cell) | MAE (Cell) | RMSE (Month) | MAE (Month) | |
|---|---|---|---|---|
| Average | 23.80 | 15.65 | 19.86 | 15.65 |
| Minimum | 11.82 | 8.62 | 2.47 | 1.31 |
| Maximum | 48.75 | 30.43 | 69.03 | 59.78 |
© 2018 by the authors. Licensee MDPI, Basel, Switzerland. This article is an open access article distributed under the terms and conditions of the Creative Commons Attribution (CC BY) license (http://creativecommons.org/licenses/by/4.0/).
Share and Cite
MDPI and ACS Style
Retalis, A.; Katsanos, D.; Tymvios, F.; Michaelides, S. Validation of the First Years of GPM Operation over Cyprus. Remote Sens. 2018, 10, 1520. https://doi.org/10.3390/rs10101520
AMA Style
Retalis A, Katsanos D, Tymvios F, Michaelides S. Validation of the First Years of GPM Operation over Cyprus. Remote Sensing. 2018; 10(10):1520. https://doi.org/10.3390/rs10101520
Chicago/Turabian StyleRetalis, Adrianos, Dimitris Katsanos, Filippos Tymvios, and Silas Michaelides. 2018. "Validation of the First Years of GPM Operation over Cyprus" Remote Sensing 10, no. 10: 1520. https://doi.org/10.3390/rs10101520
Note that from the first issue of 2016, this journal uses article numbers instead of page numbers. See further details here.