Big Data Integration in Remote Sensing across a Distributed Metadata-Based Spatial Infrastructure


1
School of Computer Science, China University of Geoscience, Wuhan 430074, China
2
Hubei Key Laboratory of Intelligent Geo-Information Processing, China University of Geosciences Wuhan, Wuhan 430074, China
3
Institute of Remote Sensing and Digital Earth, Chinese Academy of Sciences, Beijing 100094, China
*
Authors to whom correspondence should be addressed.
Remote Sens. 2018, 10(1), 7; https://doi.org/10.3390/rs10010007
Submission received: 31 August 2017
/
Revised: 10 December 2017
/
Accepted: 20 December 2017
/
Published: 21 December 2017
Abstract
:Since Landsat-1 first started to deliver volumes of pixels in 1972, the volumes of archived data in remote sensing data centers have increased continuously. Due to various satellite orbit parameters and the specifications of different sensors, the storage formats, projections, spatial resolutions, and revisit periods of these archived data are vastly different. In addition, the remote sensing data received continuously by each data center arrives at a faster code rate; it is best to ingest and archive the newly received data to ensure users have access to the latest data retrieval and distribution services. Hence, an excellent data integration, organization, and management program is urgently needed. However, the multi-source, massive, heterogeneous, and distributed storage features of remote sensing data have not only caused difficulties for integration across distributed data center spatial infrastructures, but have also resulted in the current modes of data organization and management being unable meet the rapid retrieval and access requirements of users. Hence, this paper proposes an object-oriented data technology (OODT) and SolrCloud-based remote sensing data integration and management framework across a distributed data center spatial infrastructure. In this framework, all of the remote sensing metadata in the distributed sub-centers are transformed into the International Standardization Organization (ISO) 19115-based unified format, and then ingested and transferred to the main center by OODT components, continuously or at regular intervals. In the main data center, in order to improve the efficiency of massive data retrieval, we proposed a logical segmentation indexing (LSI) model-based data organization approach, and took SolrCloud to realize the distributed index and retrieval of massive metadata. Finally, a series of distributed data integration, retrieval, and comparative experiments showed that our proposed distributed data integration and management program is effective and promises superior results. Specifically, the LSI model-based data organization and the SolrCloud-based distributed indexing schema was able to effectively improve the efficiency of massive data retrieval.

1. Introduction
Since Landsat-1 first started to deliver volumes of pixels in 1972, the amount of archived remote sensing data stored by data centers has increased continuously [1,2]. According to incomplete statistics, the total amount of data archived by the Earth Observing System Data and Information System (EOSDIS) reached 12.1 petabytes (PBs) around the year 2015 [3]. Up until August 2017, the archived data volume of China National Satellite Meteorological Center (NSMC) reached 4.126 PBs [4], and the China Center for Resources Satellite Data and Application (CCRSDA) archived more than 16 million scenes of remote sensing images [5,6]. Such large amounts of remote sensing data have brought great difficulties in terms of data integration and management of each data center.
For data integration, due to various satellite orbit parameters and the specifications of different sensors, the storage formats, projections, spatial resolutions, and revisit periods of the archived data are vastly different, and these differences have resulted in great difficulties for data integration. In addition, the remote sensing data received by each data center arrives continuously at an ever-faster code rate. It is preferable to ingest and archive the newly received data in order to provide users with the latest data retrieval and distribution service [7]. Therefore, a unified metadata format and a well designed data integration framework are urgently needed.
For data management, the massive amounts of remote sensing data mainly result in difficulties for data retrieval, but the retrieval efficiency is mainly dependent upon the data organization model and storage system. Currently, the two most widely used data organization models are: (1) spatio-temporal recording system-based satellite orbit stripes or scene organization; and (2) globally meshed grid-based data tiling organization [8]. However, the former has obvious shortcomings for massive data retrieval and quick access; and the latter causes an increase by about one-third in the amount of data due to image segmentation, thus requiring larger data storage spaces. Hence, we should explore a reasonable spatial organization mode for massive, multi-source remote sensing data, so as to improve the efficiency of massive data retrieval. As for the data storage system, the most widely used mode is the combination of the file system (FS) and database management system (DBMS). The “DBMS-FS mixed management mode” solves both the problems of metadata management and quick retrieval, and also maintains the high read/write efficiency of a file system.
Therefore, in this paper, for data integration across a distributed data center spatial infrastructure, we firstly proposed an International Standardization Organization (ISO) 19115-based metadata transform method, and then adopted the internationally popular data system framework object-oriented data technology (OODT) [9] to complete the distributed remote sensing data integration. For data management, we proposed a logical segmentation indexing (LSI) model to achieve the organization of integrated remote sensing metadta, and chose SolrCloud to realize the distributed index and quick retrieval [10]. LSI model takes the logical segmentation indexing code as the identifier of each remote sensing data, rather than performing an actual physical subdivision. This not only increases the efficiency of data retrieval with the help of the global subdivision index, but also avoids generating numerous small files caused by the physical subdivision of data.
This paper is organized as follows: Section 2 provides an overview of the background knowledge and related work; Section 3 describes the distributed multi-source remote sensing metadata transformation and integration; Section 4 details the data management methods, including the LSI spatial organization model, full-text index construction, and distributed data retrieval; Section 5 introduces the experiments and provides an analysis of the proposed program; and Section 6 provides a summary and conclusions.
2. Background on Architectures for Remote Sensing Data Integration
This section briefly reviews the distributed integration and spatial organization model of remote sensing data, as well as the internationally popular data system framework OODT.
2.1. Distributed Integration of Remote Sensing Data
The most widely used data integration models include: [11]
- (1)
- The data warehouse (DW)-based integration model, which copies all data sources of each heterogeneous database system into a new and public database system, so as to provide users with a unified data access interface. However, due to the heterogeneity of each independent database system, vast data redundancy is generated, and a larger storage space is also required.
- (2)
- The federated database system (FDBS)-based integration model, which maintains the autonomy of each database system and establishes an association between each independent database system to form a database federation, then providing data retrieval services to users. However, this pattern can not solve the problems of database heterogeneity or system scalability [12].
- (3)
- The middleware-based integration model, which establishes middleware between the data layer and the application layer, providing a unified data access interface for the upper layer users and realizing the centralized management for the lower layer database system. The middleware not only shields the heterogeneity of each database system, providing a unified data access mechanism, but also effectively improves the query concurrency, reducing the response time. Therefore, in this paper, we will adopt the middleware-based integration mode to realize the distributed remote sensing data integration.
2.2. Spatial Organization of Remote Sensing Data
The main two models for spatial organization of multi-source remote sensing data are: (1) the satellite orbit stripe or scene organization based on the spatio-temporal recording system; and (2) data tiling organization based on the globally meshed grid [13,14].
In the first model, the original orbit data are organized according to reception time, and they are stored in a scene unit. Each scene unit is identified by upper, lower, left and right four-point latitude and longitude coordinates. This simple organization method has been adopted by remote sensing data centers around the world, such as NASA’s Earth Observing System (EOS) [15] and the CCRSDA [8]. However, due to the four-point index queries in database systems, this model has obvious shortcomings for massive data retrieval and quick access. Therefore, in this paper, we have proposed the LSI model to reduce the dimension of the query index, and this will be described in Section 4.1.
In the second model, remote sensing images are subdivided into buckets of grid shape, and each bucket is labeled by a unique geocode according to certain coding rules. This is especially useful in database systems where queries on a single index are much easier or faster than multiple-index queries. Furthermore, this index structure can be used for a quick-and-dirty proximity search: the closed points are often among the closest geocodes. The longer a shared prefix is, the closer the two buckets are [16]. This model is generally applicable to the image cache systems and map publishing systems typically used by Google Earth, Bing Maps, and Tiandi Maps of China, for example [17]. However, due to image segmentation and pyramid construction, this model means the amount of data increases by approximately one-third, so that a larger data storage space is required; it also generates a large number of small tiles, which can easily cause a single point of failure, and are not conducive to data storage and management using the distributed file system [18]. Hence, in this paper, we proposed a logical partition index and virtual mapping construction strategy for scene-based remote sensing data, and this will be also described in Section 4.1.
2.3. OODT: A Data Integration Framework
An FS or DBMS alone are not suited for the storage and management of remote sensing data. In a “DBMS–FS mixed management mode”, remote sensing images are stored in the file system and their metadata are stored and managed by the DBMS. Typical examples are the European Space Agency (ESA) [19], Tiandi Maps of China, the CCRSDA, the NSMC, the China National Ocean Satellite Application Center (NSOAS), and so on. The mixed management mode both effectively solves the quick retrieval and metadata management problems and maintains the high read/write efficiency of the file system. This has been a longtime issue addressed by NASA, whose the Office for Space Science decided to fund the OODT project in 1998.
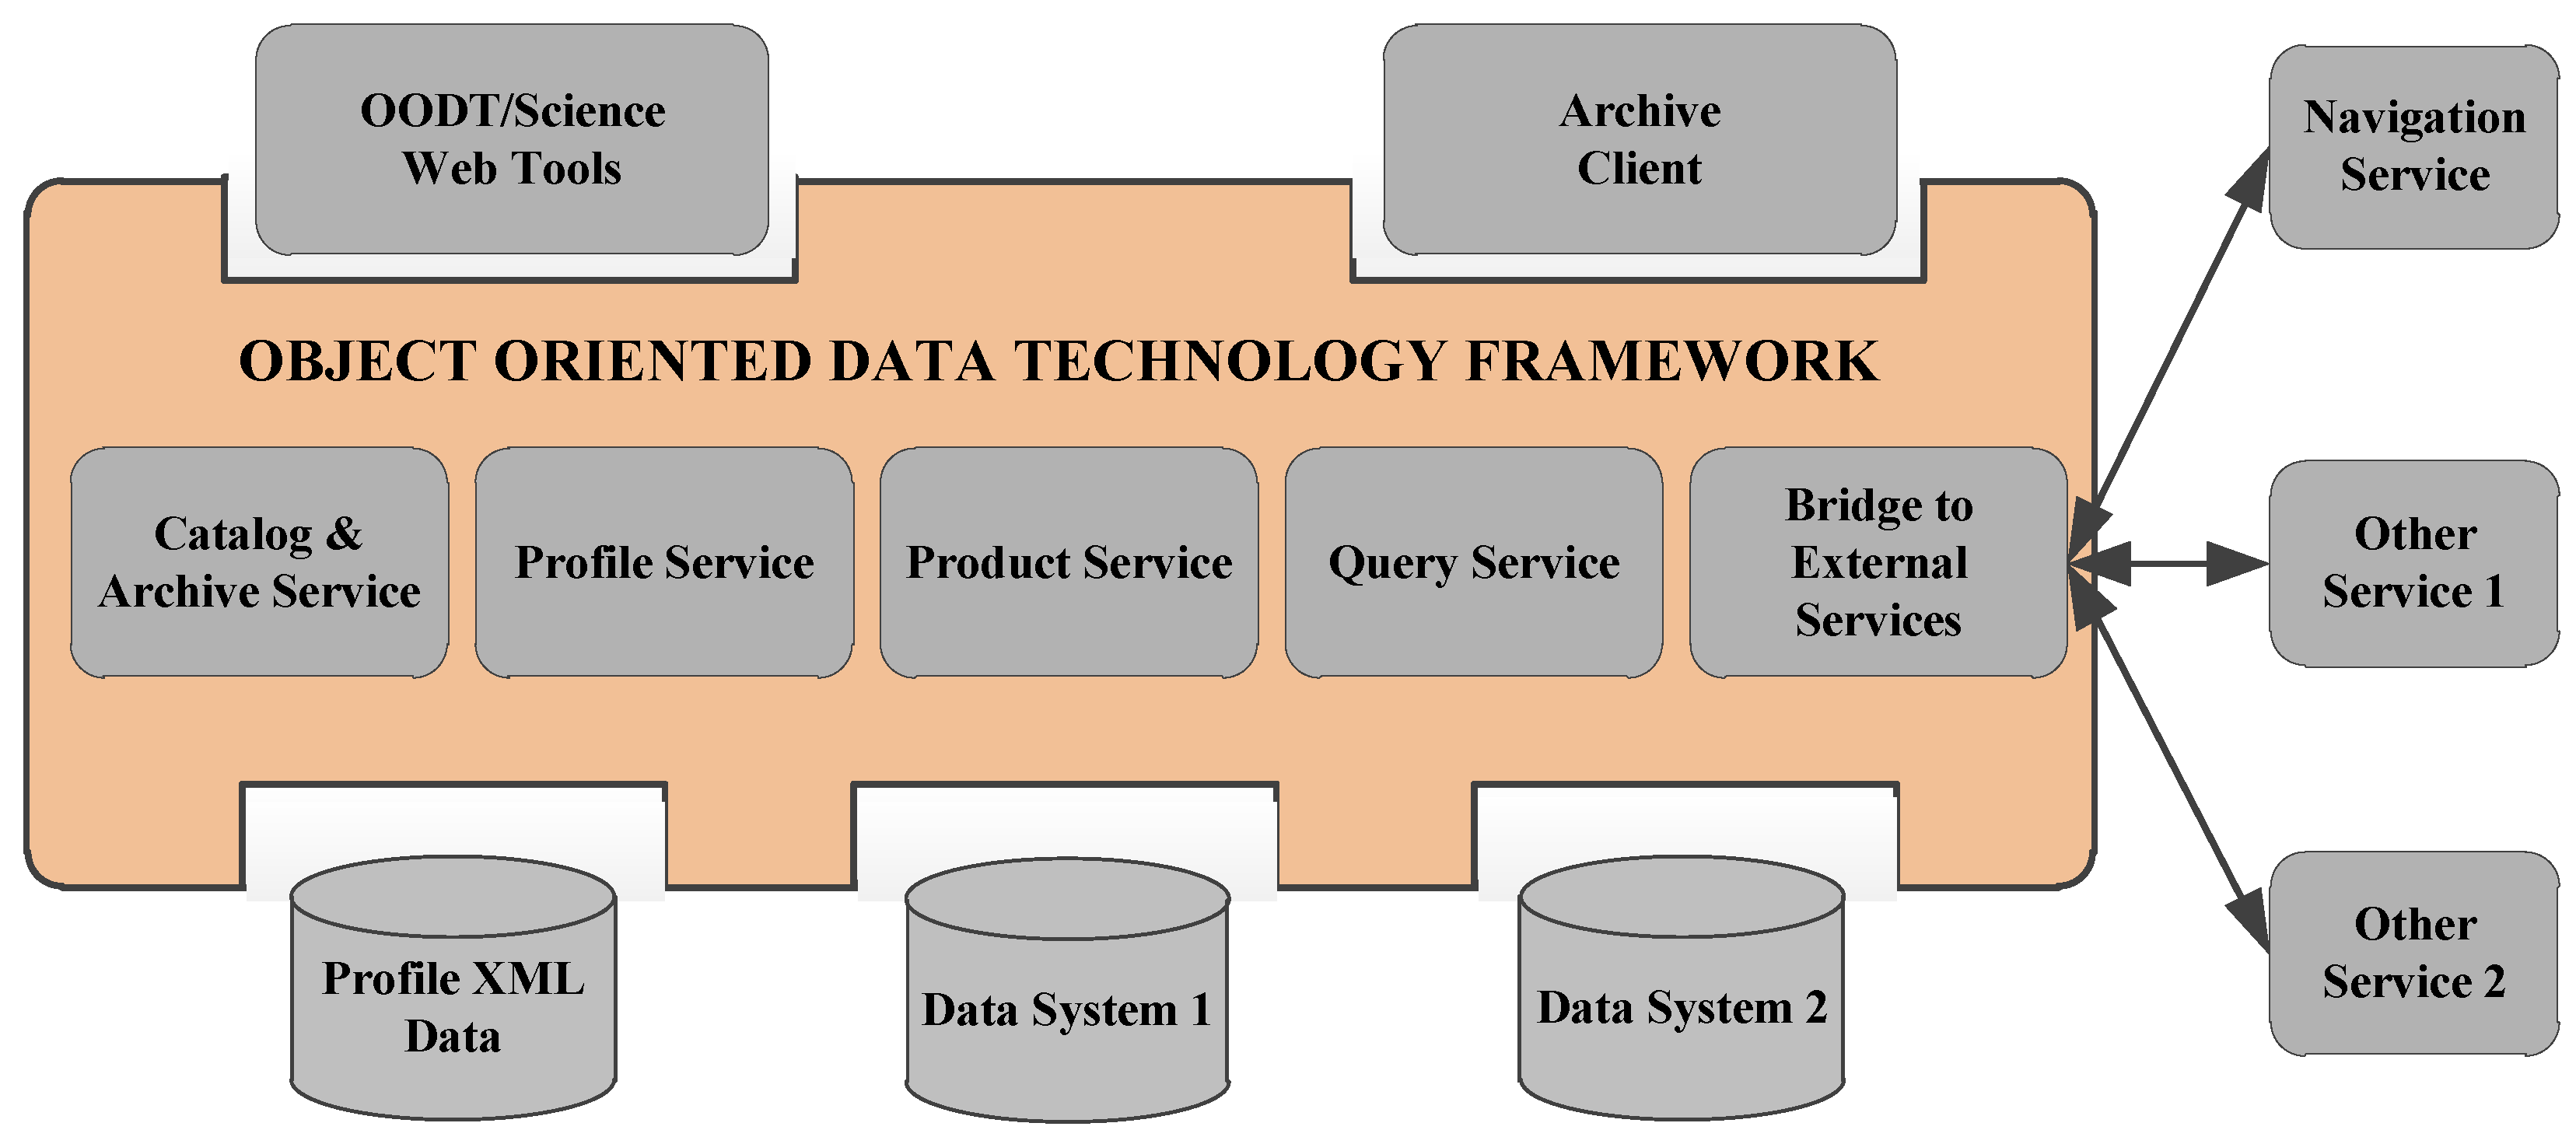
Apache OODT [20] is an open-source data system framework that is managed by the Apache Software Foundation. OODT focuses on two canonical use cases: big data processing [21] and information integration [22]. It provides three core services: (1) a file manager is responsible for tracking file locations and transferring files from a staging area to controlled access storage, and for transferring their metadata to Lucene or Solr; (2) a workflow manager captures the control flow and data flow for complex processes, and allows for reproducibility and the construction of scientific pipelines; and (3) a resource manager handles allocation of workflow tasks and other jobs to underlying resources, based on the resource monitoring information from Ganglia or other monitoring software.
In addition to the three core services, OODT provides three client-oriented frameworks that build on these services: (1) a file crawler automatically extracts metadata and uses Apache Tika or other self-defined toolkits to identify file types and ingest the associated information into the file manager; (2) a push-pull framework acquires remote files and makes them available to the system; (3) a scientific algorithm wrapper (called the Catalog and Archive Service Production Generation Executive, CAS-PGE) encapsulates scientific codes and allows for their execution, regardless of the environment, while capturing provenance, making the algorithms easily integrated into a production system (Figure 1).
3. Distributed Integration of Multi-Source Remote Sensing Data
With distributed multi-source remote sensing data integration, i.e., based on a unified standard, the remote sensing metadata in the distributed center will be gathered into the main center continuously or at regular intervals, either actively or passively. In this study, the unified satellite metadata standard refers to the ISO 19115-2:2009-based geographic information metadata standard [23]. All of the remote sensing metadata in the distributed sub-centers should be transformed into the ISO 19115-based metadata format before integration to enable uniform data retrieval and management. The distributed sub-centers are mainly responsible for the storage of remote sensing images, and provide an open access interface for the main center based on the HTTP/FTP protocols. The main center is primarily responsible for the ingestion and archiving of the metadata and thumbnails of remote sensing images, and enables the uniform query and access for the integrated remote sensing data.
3.1. The ISO 19115-Based Metadata Transformation
Remote sensing metadata represent descriptive information about remote sensing images, as well as data identification, imaging time, imaging location, product level, quality, the spatial reference system, and other characteristic information. At present, the metadata forms of different remote sensing data vary greatly. For example, Landsat 8 collects images of the Earth with a 16-day repeat cycle, referenced to the Worldwide Reference System-2 [24]. The spatial resolution of the Operational Land Imager (OLI) sensor onboard the Landsat 8 satellite is about 30 m; its collected images are stored in GeoTIFF format, with Hierarchical Data Format Earth Observation System (HDF-EOS) metadata [25,26]. The Moderate-Resolution Imaging Spectroradiometer (MODIS) instruments capture data in 36 spectral bands ranging in wavelength from 0.4 m to 14.4 m and at varying spatial resolutions (2 bands at 250 m, 5 bands at 500 m, and 29 bands at 1 km). Most of the MODIS data are available in the HDF-EOS format, and it is updated every 1 to 2 days [27]. The charge-coupled device (CCD) sensor, which is carried by the Huan Jing (HJ)-1 mini satellite constellation, has an image swath of about 360 km, with blue, green, red, and near infrared (NIR) bands, 30-m ground pixel resolution, and a 4-day revisit period. Its collected images are stored in GeoTIFF format, and their customized metadata are in eXtensible Markup Language (XML) format [28]. These different metadata formats have resulted in great difficulties for data integration and management, which could be solved by transforming them into a uniform metadata format for uniform retrieval and management [29,30].
ISO 19115-2:2009 is the geographic information metadata standard which was published by the International Standardization Organization (ISO). It mainly defines the metadata schema of geographic information and services, including the identification, quality, space range, time horizon, content, spatial reference system, distribution, and other characteristic information [31]. Currently, ISO 19115-2:2009 has been integrated into the Common Metadata Repository (CMR) as one of the most popular standards for data exchange [32], data integration, and data retrieval across international geographic information organizations and geographic data centers.
On the basis of the ISO 19115-2:2009 geographic information standard, we proposed a uniform remote sensing metadata format. All of the remote sensing metadata in the distributed sub-centers should be transformed into this uniform format before data integration. In this paper, the transformational rules we established are mainly aimed at NASA EOS HDF-EOS format metadata (Aster and Landsat series satellites included) and the customized XML-based metadata of the CCRSDA (HJ-1A/B, GF and ZY series satellites included) (see Table 1).
It should be noted that in Table 1, the struck-through (-) shows the field does not exist, and it will be assigned a null value after metadata transformation. In the ISO metadata column, the term spatialResolution describes the ability of the remote sensor to distinguish small details of an object, generally in meters, thereby making it a major determinant of image resolution. Hence, the spatialResolution is mapped to NadirDataResolution in the HDF-EOS metadata column and pixelSpacing in the CCRSDA metadata column. The terms scenePath and sceneRow are orbit parameters of the satellite in the Worldwide Reference System (WRS), just mapping to WRS_PATH and WRS_ROW in the HDF-EOS metadata column. The term imageQualityCode is a characteristic of a remote sensing image that measures the perceived image degradation, and has the same meaning as the overallQuality in the CCRSDA metadata column. The term processingLevel denotes the type of the remote sensing data, and is mapped to the DATA_TYPE in the HDF-EOS metadata column and productLevel in the CCRSDA metadata column.
3.2. Distributed Multi-Source Remote Sensing Data Integration
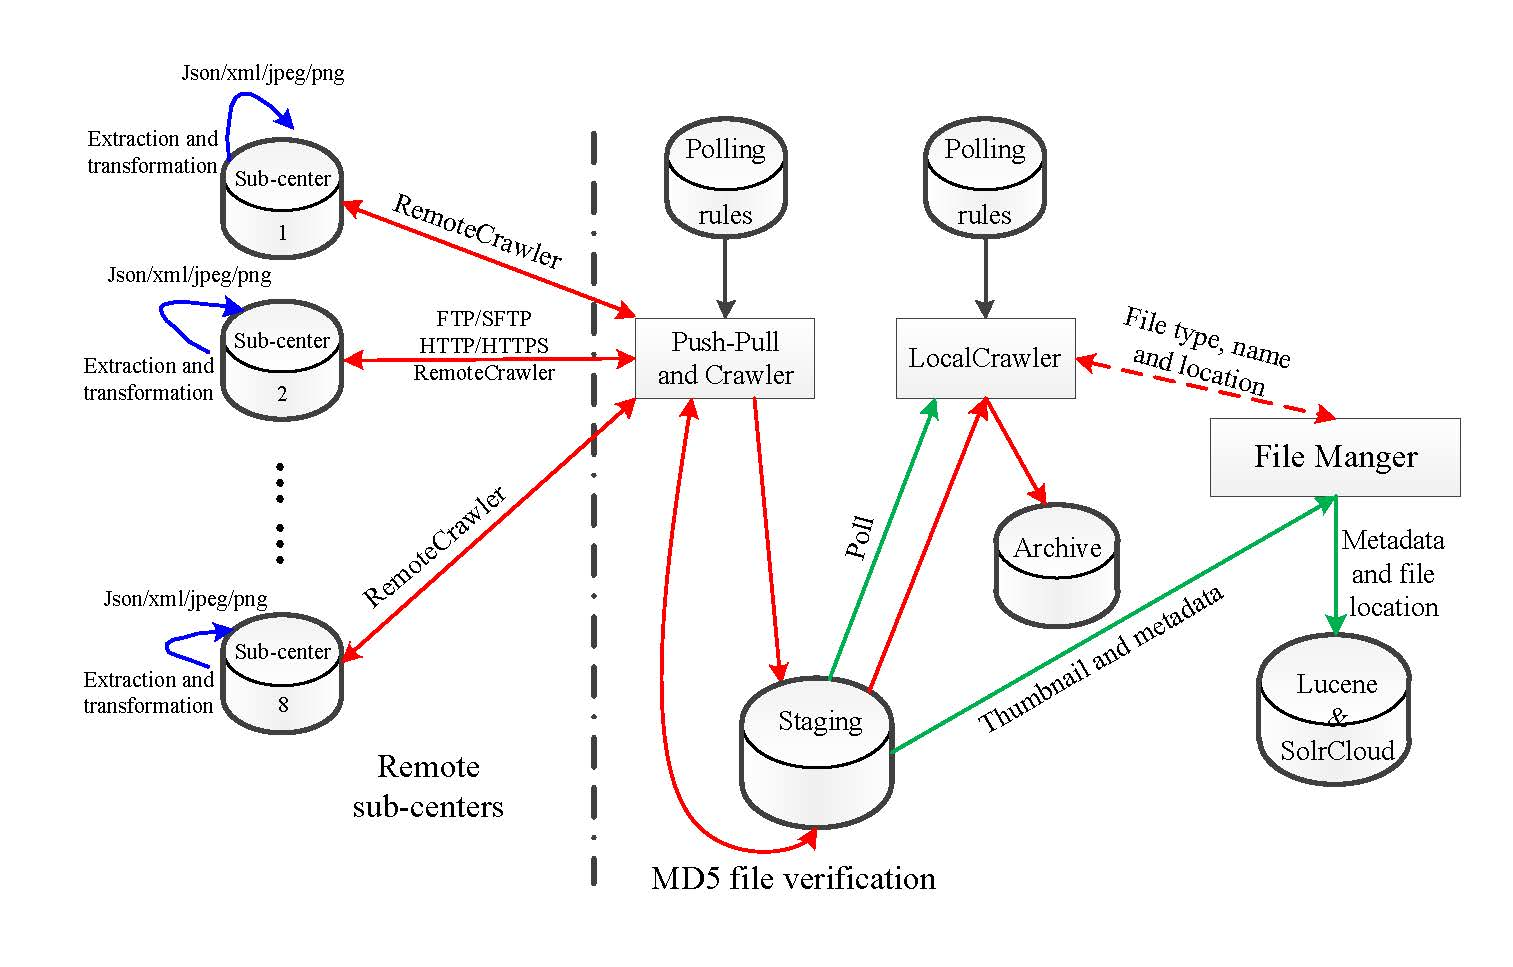
Distributed multi-source remote sensing data integration refers to the process of validating, inserting, updating, or deleting metadata in the main center metadata management system; it affects only the metadata for the distributed data providing sub-centers. The metadata management is mainly realized by the components of OODT, including the OODT crawler, OODT push-pull, and OODT file manager [33] (see Figure 2).
In the main data center, the push-pull daemon will be launched automatically by using its daemon launcher at the defined time interval. The daemon will wrap one of two processes: (1) RemoteCrawler, or (2) ListRetriever. The RemoteCrawler process crawls remote sites for files in the distributed sub-centers. Meanwhile, the RemoteCrawler process also automatically extracts metadata and transforms them into the ISO 19115-2:2009-based uniform metadata format. The ListRetriever retrieves known files from remote sites in the distributed sub-centers (that is, the path and file name to each file is known and has been specified in a property file, and a parser for that property file has been specified). After crawling or retrieval, the push-pull framework will be responsible for downloading remote content (pull), or accepting the delivery of remote content (push) to the main center for use by the LocalCrawler for ingestion into the file manager. Here, the remote content includes the metadata file and thumbnail of remote sensing data. It is worth mentioning that the LocalCrawler is developed in the main center, and is primarily responsible for crawling the local client system for files in the main center. The file manager component is responsible for tracking, ingesting, and moving metadata and thumbnails between a client system and a server system in the main center. Finally, the remote sensing metadata will be indexed by the SolrCloud, and their corresponding thumbnails will be archived in the file system.
Both the RemoteCrawler and LocalCrawler have an incremental control mechanism in order to avoid duplicate data ingestion. In the intervals between crawling and data ingestion, the RemoteCrawler executes a Message Digest 5 (MD5) file verification process between the remote sites’ files in the sub-center and the archived files in the main center. If the file has been archived in the main center, data ingestion will be stopped; otherwise, data ingestion continues. The LocalCrawler implements the second MD5 file verification process between the files in the client system (files from sub-centers downloaded to the main center) and the server system (archived files in the main center). If the files have been ingested and moved into the server system, the data ingestion will be stopped; otherwise, it continues.
In addition, there is also the DaemonManager, in which the DaemonLauncher will register each daemon it creates. The DaemonManager ensures that no two Daemons are ever running at the same time. If a daemon is running when another requests permission to run, permission will be denied and the daemon will be added to the wait queue until the current running daemon and all other daemons ahead of it in the queue complete their tasks [20].
4. Spatial Organization and Management of Remote Sensing Data
In order to achieve the rapid retrieval of integrated massive remote sensing data, we propose the LSI model for scene-based remote sensing data: First, based on the global segmentation grid, the logical partition index of each scene-based remote sensing data can be calculated. Then, the virtual mapping between the logical partition index and the scene parameters of each remote sensing data can also be established easily. Finally, based on the logical partition index and virtual mapping, as well as full-text search engine Solr/SolrCloud, quick retrieval of remote sensing data becomes possible. The LSI model-based data retrieval not only improves data query efficiency with the help of the global subdivision index encoding, but also avoids generating small files caused by the actual data subdivision. This section will describe the LSI model and SolrCloud-based remote sensing metadata management in terms of the LSI model, full-text index construction, and distributed data retrieval, etc.
4.1. LSI Organization Model of Multi-Source Remote Sensing Data
The LSI organization model is based on the Geographical Coordinate Subdividing Grid with One Dimension Integer Coding on Tree (GeoSOT) grid, which was proposed by the research group of Cheng around 2012 [34]. The main idea is expansion by three times for the latitude and longitude of Earth’s surface. The first expansion is the original Earth surface extended to ; the expanded surface is viewed in level 0 grids, with grid code 0. Then, the level 0 grid is recursively partitioned quadrilaterally until reaching the grid cell, with a total of nine subdivisions. The second expansion is processed for the grid cell, namely, extended to . The extended grid cell is recursively partitioned quadrilaterally until reaching the grid cell, with a total of 12 subdivisions. Similarly, the grid cell is recursively partitioned quadrilaterally until reaching the grid cell, with a total of 11 subdivisions.
Finally, after the three expansions and 32 subdivisions, the system is used to cover the whole world, dividing the Earth into centimeter-level units using a hierarchy grid system with whole degrees, whole minutes, and whole seconds. Taking 32-bit quaternary coding at the Z-sequence, level subdivision cells were named as 00, 01, 02, 03, and so on; the location relationship of various spatial information products in different coordinate systems can be built with these globally unique and geographically meaningful codes [35,36] (Figure 3).
Based on the GeoSOT global segmentation strategy, the logical partition indexing code of each scene-based remote sensing data was calculated first in this paper. It is worth noting that there are three cases to consider regarding the logical code in general. Firstly, when the minimum bounding rectangle (MBR) [37] of a remote sensing image is completely contained in a GeoSOT grid, the logical partition index code is the corresponding GeoSOT grid code. Secondly, when the MBR of a remote sensing image spans two grids, the two grid codes will be the logical partition index codes. Thirdly, when the MBR of a remote sensing image spans four grids, the logical partition codes will be composed of the four codes [38] (Figure 4).
After encoding each type of scene-based remote sensing data, then the virtual mapping between the logical partition indexing codes and position parameters (latitude and longitude) of each scene can be established easily (Figure 5). In fact, the logical partition indexing codes have become the form of spatial identification of each piece of scene-based remote sensing data when the virtual mapping is created. Reducing 8-index queries (latitude and longitude values of the upper, lower, left, and right four points) to no more than 4-index queries, the query speed increase in database systems is obvious. In addition, the logical partition indexing code of each scene center point is always used in the actual query process, and just one index query could be made in this situation. Therefore, based on the center point indexing code, a quick retrieval of massive remote sensing data can be realized.
4.2. Full-Text Index of Multi-Sourced Remote Sensing Metadata
After spatial organization of multi-source remote sensing data, the full-text index of metadata should be constructed to enable quick retrieval. It should be added that, as the query index of remote sensing data involves many terms, the column-oriented key-value data store, like HBase, cannot effectively handle multi-condition joint retrieval. Hence, in this paper, the multi-sourced remote sensing metadata retrieval used the full-text index, and its construction was mainly implemented by Lucene and SolrCloud. In essence, Lucene is a high-performance, full-featured text search engine library written entirely in Java, and the ready-to-use search platform provided by SolrCloud is also based on Lucene. Lucene supports the full-text index construction of static metadata fields and dynamic domain fields. However, Lucene is not a complete full-text search engine; it should be combined with Solr or SolrCloud to provide a complete search service [39].
SolrCloud supports the following features: (1) central configuration for the entire cluster; (2) automatic load balancing and failover for queries; and (3) near real-time search [40,41]. SolrCloud uses ZooKeeper to manage these locations, depending on configuration files and schemas, without a master node to allocate nodes, shards, and replicas. Each node runs one or more collections, and a collection holds one or more shards. Each shard can be replicated among the nodes. Queries and updates can be sent to any server. Solr uses the information in the ZooKeeper database to figure out which servers need to handle the request. Once the SolrCloud cluster starts, one of the nodes is selected as a leader, which is responsible for all shards [42]. In addition, there is a master controller in the cluster, called the overseer node, which is responsible for maintaining cluster state information and thereby provides for failover to the Solr cluster (Figure 6).
In this study, the distributed index based on SolrCloud/Lucene was applied on the static and dynamic metadata fields. As the name suggests, the distributed index will be used when our index collections are so large that we cannot construct an index efficiently on a single machine. The static remote sensing metadata fields are defined the by OODT file manager, and include ID, CAS.ProductId, CAS.ProductTypeName, CAS.ProductReceivedTime, and CAS.ProductTransferStatus, CAS.ProductName, CAS.ProductStructure, and so on. The dynamic domain fields mainly include the satellite type, sensor type, scanning time, and GeoSOT codes. In addition, in order for the comparative experiments, the original latitude and longitude of each image is also included in the dynamic domain fields. The static and dynamic fields’ index are as shown in Table 2. It is noted that in Table 2, the asterisk (*) denotes all of the dynamic domain fields of the remote sensing metadata.
The dynamic domain fields are implemented in Lucene by adding the ’text’ and ’text_rev’ fields to the full-text index field. These two fields are copies of all the dynamic domain fields. Their purpose is to implement multi-granularity segmentation for the dynamic domain fields. Therefore, the following configuration should be added in schema.xml of Lucene.
<copyField source=“*” dest=“text” />
<copyField source=“*” dest=“text_rev” />
4.3. Distributed Data Retrieval
After the construction of the distributed full-text index in Lucene, the index will be partitioned across several machines. Hence, data retrieval will be executed on several machines, and realized by the distributed search server SolrCloud. In the SolrCloud distributed clusters, all full-text indexes can make up a collection comprising one logical index. The collection is usually split into one or more shards, and evenly distributed on each node based on routing rules. In general, all shards in the same collection have the same configuration. Each shard usually has one or more replicas; one replica of each shard will be elected as a leader [43,44]. In this study, the collection was split into three shards, and each shard had three replicas.
In addition, there is an overseer node in the cluster that is responsible for maintaining cluster state information. It will monitor the status of each Leader node, acting as a master controller. When one shard’s leader falls offline, the overseer node will initiate the automatic disaster recovery mechanism, and another node in the same shard will be designated as the leader to provide service. Even if the overseer node fails, a new overseer node will be automatically enabled on another node, ensuring high availability of the cluster. In the meantime, the index replica on the off-line node will be automatically rebuilt and put to use on other machines.
The retrieval of distributed metadata in SolrCloud is implemented as follows: once any one of the SolrCloud nodes receives a data query request, the request will be forwarded to one of the replication nodes by the internal processing logic of the cluster. Then the replication node will launch the distributed query according to the created full-text index of remote sensing data. The distributed query will be converted into multiple sub-queries, each of which will be located on any of the replications of their corresponding shard. It is worth noting that the number of sub queries is equal to the number of shards. Finally, the results of each sub-query will be merged by the replication node that received the original query, and the merged final query results will be returned to the user. In addition, automatic load balancing is also provided by SolrCloud. If the query pressure is too large, the cluster scale can be expanded and replications increased to smooth the query pressure. The SolrCloud distributed query process is shown in Figure 7.
5. Experiment and Analysis
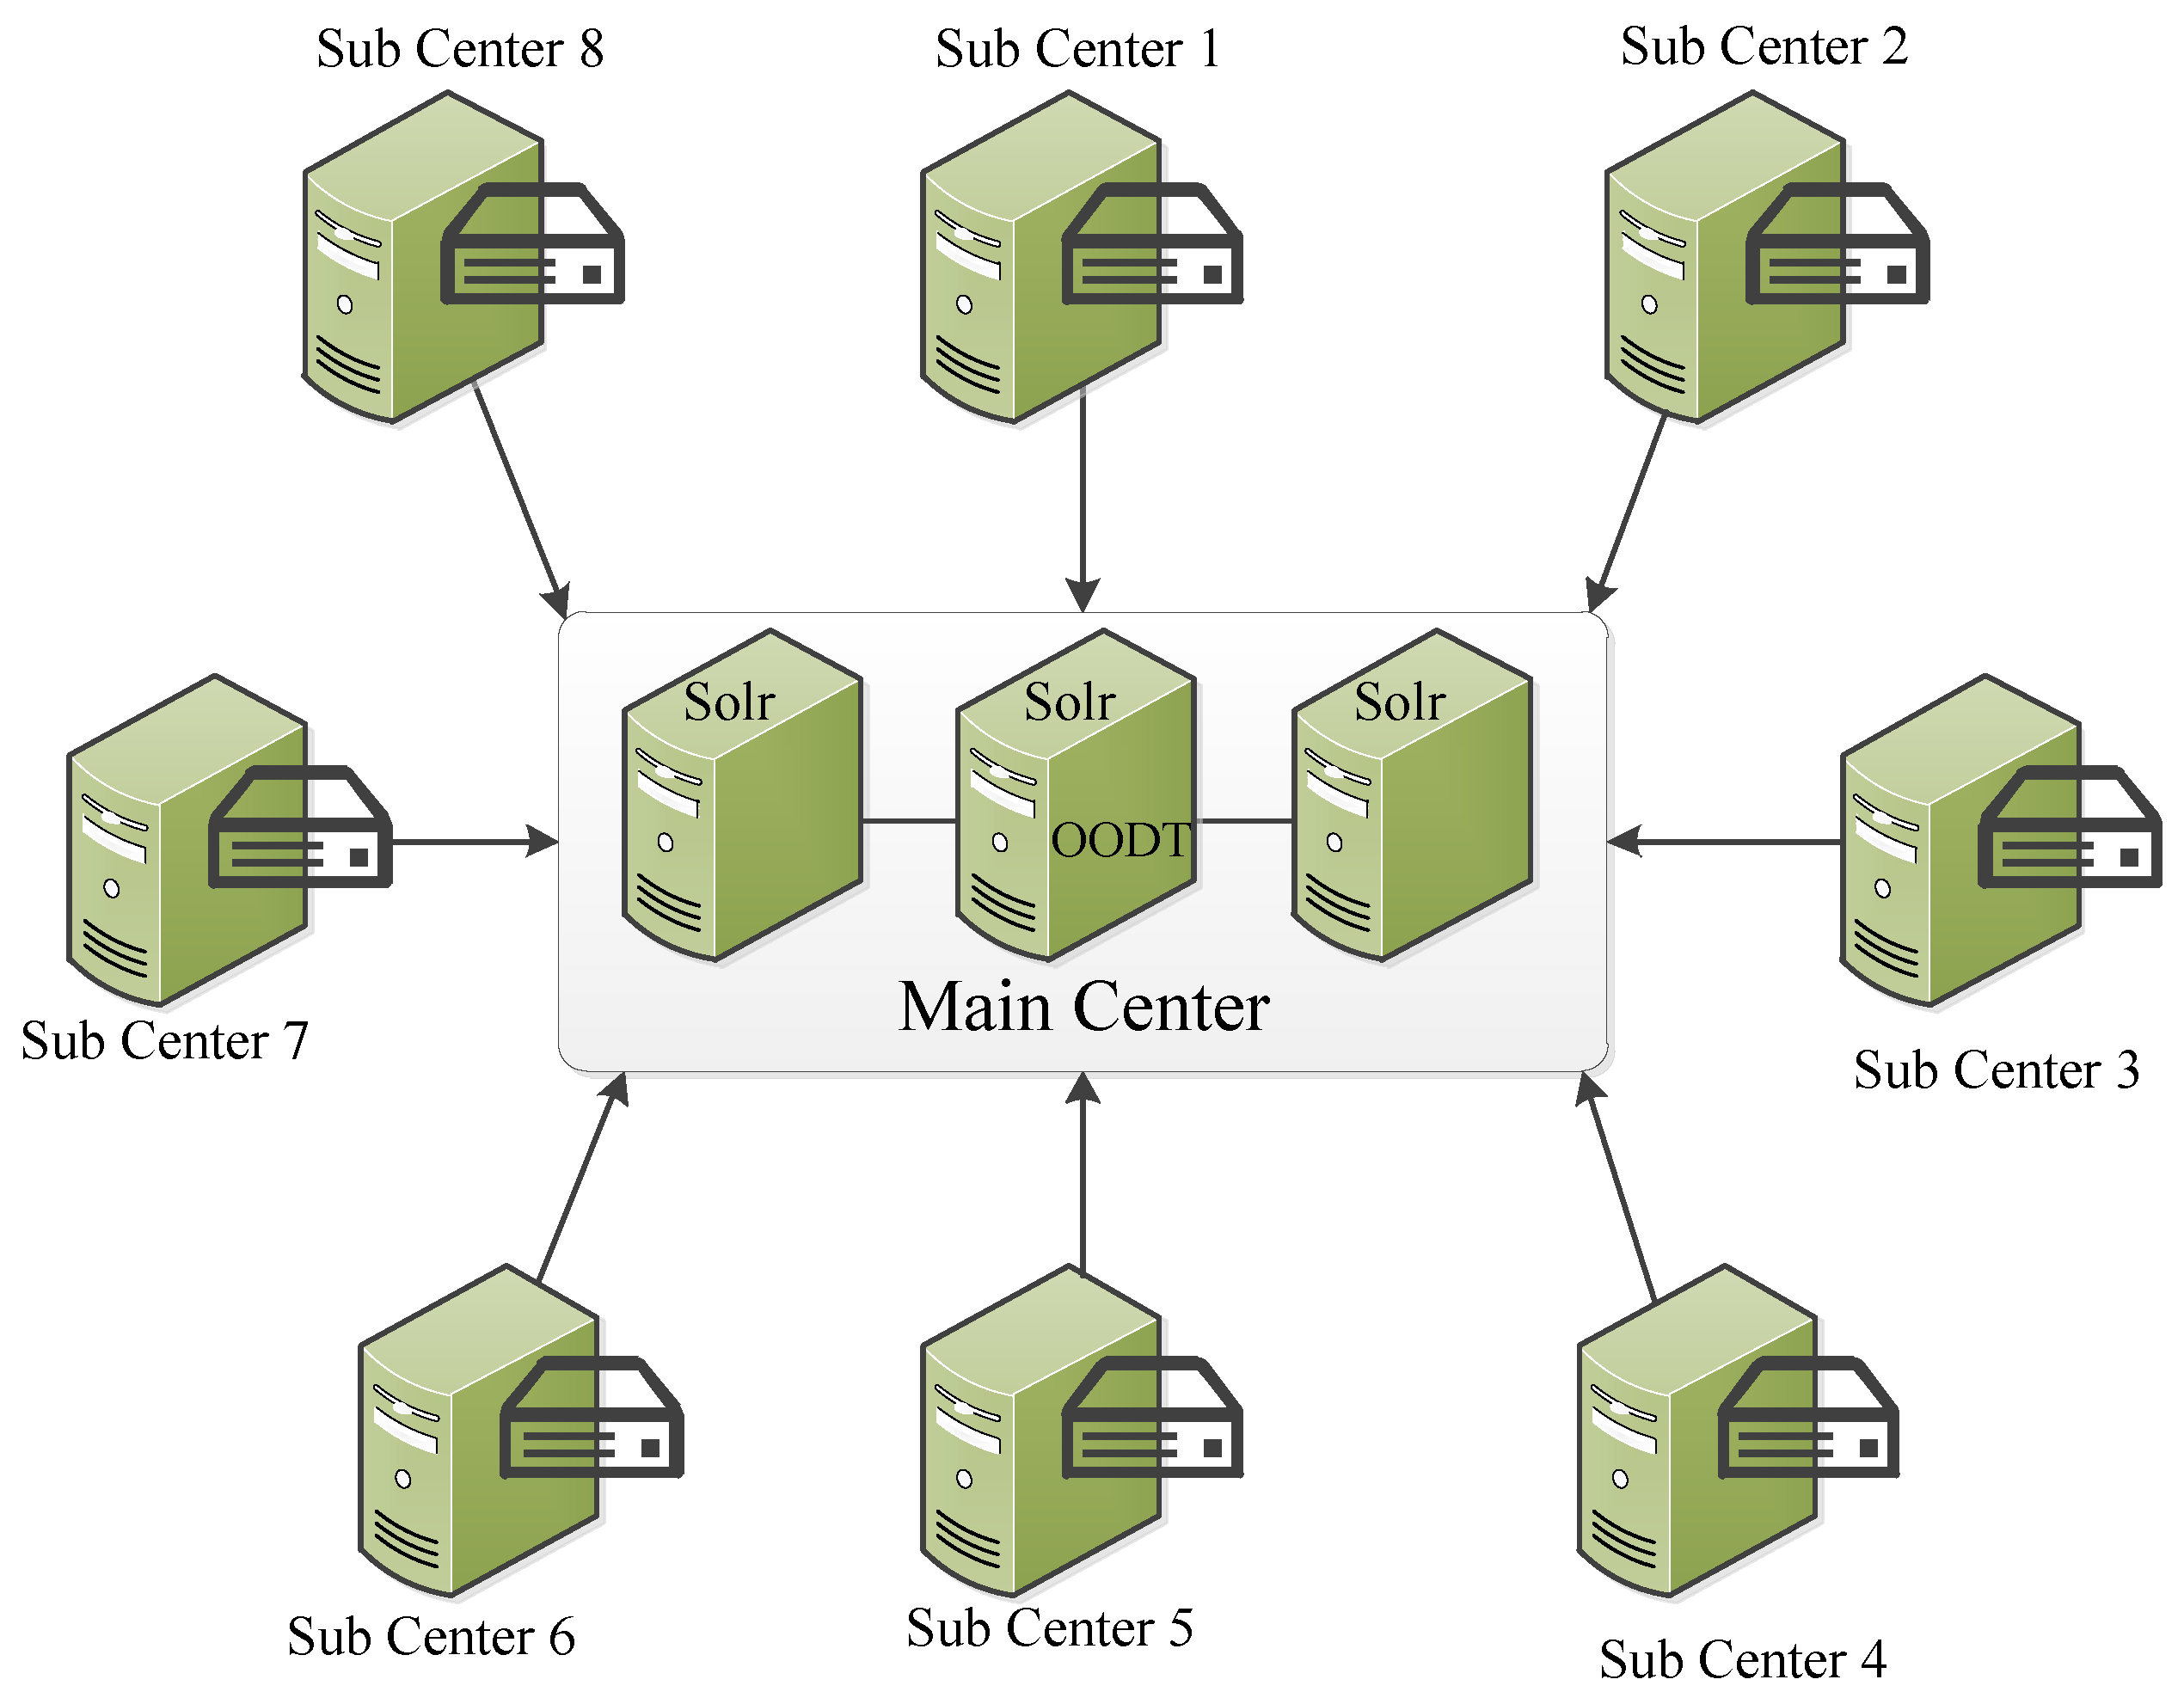
In order to verify the availability of our proposed solution, a virtual multi-data center environment was set up based on the OpenStack cloud computing framework. The main data center was composed of three Linux virtual machines. All of the three machines were developed with the SolrCloud environment, responsible for metadata index and retrieval. One of them was developed with OODT system framework, responsible for data ingestion and thumbnail archiving. The distributed sub-center was composed of eight Linux virtual machines, corresponding to eight satellite data centers. Each machine was mounted with a one-terabyte (TB) cloud drive so as to provide image storage space. In addition, all the machines in the main and sub centers were configured with 4 gigabytes (GBs) of RAM and 2 virtual processor cores. The framework of the virtual multi-data center environment is shown in Figure 8.
5.1. Distributed Data Integration Experiment
The experimental images of distributed integration test mainly include Landsat 8 OLI_TIRS, Landsat 7 ETM+, Landsat 5 TM, Landsat 1–5 MSS, Aster L1T, CEBERS-1/2 CCD, HJ-1A/B CCD, HJ-1A HSI, and FY-3A/B VIRR images, which were freely downloaded from the USGS (https://earthexplorer.usgs.gov/), NSMC (http://satellite.nsmc.org.cn/portalsite/default.aspx) and CCRSDA (http://www.cresda.com/CN) websites. A total of 3380 files were downloaded. These images were distributed in the eight sub-centers according to data type. The total number of our experimental images are shown in Table 3.
The distributed data integration experiment mainly includes remote sensing data polling, metadata extraction, thumbnail generation, file transferring, thumbnail archiving, metadata index, and other processes. The experimental results are primarily with respect to the already-crawled data volume and total time consumption from the RemoteCrawler launch to metadata being indexed by SolrCloud/Lucene. Because no two push-pull daemons ever run concurrently, the distributed data integration experiment was carried out one sub-center at a time. The experiment procedures and results are shown in Table 4.
As can be seen in Table 4, the number of main center-integrated remote sensing images is equal to the total number of each sub-center’s stored images. That is to say, there is no information lost during the process of data integration. Moreover, our designed ISO 19115-2:2009-based uniform metadata model includes all fields of integration by participating remote sensing metadata, and the SolrCloud indexed metadata can also maintain the metadata information of each remote sensing image perfectly. As for the transfer rate, it mainly depends on the window size for OODT-push–pull component. In our experiment, the window size was set at 1024 bytes, and the average transfer rate is between 9.8 and 13.8 MB/s. This is enough to satisfy the demands of metadata and thumbnail transfer across a distributed data center spatial infrastructure. Therefore, the experimental results showed that our OODT-based distributed remote sensing data integration was feasible.
5.2. LSI Model-Based Metadata Retrieval Experiment
In addition, in order to verify the retrieval efficiency for massive and multi-source remote sensing data, we also simulated about 15 million remote sensing metadata files. All of them are organized by the LSI model and imported into our metadata index and retrieval system SolrCloud. The total amount of our experimental metadata is shown in Table 5.
In order to test the retrieval capabilities for different volumes of big data, the 15 million pieces of remote sensing metadata were copied and divided into six groups, and the volumes of the groups were 1 million, 3 million, 5.5 million, 7.5 million, 10 million, and 15 million. For the follow-up experiments, each group contained only 896,981 Landsat 8 OLI_TIRS pieces of metadata. In all the following experiments, we always set the platform and sensor parameters to Landsat 8 and OLI_TIRS, respectively, with only spatial and time parameters changing.
As for the spatial query parameters, there were several: parameters within 1 GeoSOT grid, 2 GeoSOT grids, and 4 GeoSOT grids. Therefore, the retrieval experiment of each group was divided into three subgroups. As for the time query parameters, in each subgroup of experiments, the query time frames were set to one day, one month, and six months, in order to verify the performance of our proposed method thoroughly. Furthermore, in order to exclude the influence of accidental factors, 20 retrievals were executed separately in each experiment and the average query time was the final result.
In addition, taking the GeoSOT code of the center point as the spatial identification of each remote sensing data is equivalent to converting polygon queries to point queries. It will improve the efficiency of data query, but the precision will be discounted. Therefore, a second filtering process, using longitude and latitude, should be made for the query results. Since the first query had ruled out the vast majority of irrelevant data, the second filtering process took little time. Hence, the efficiency of LSI model-based data query was very high. The search conditions of each group of experiment and time consumed are as shown in Table 6.
As can be seen in Table 6, in each group and subgroup, with the increase of query time frames, the time consumed showed an upward trend as a whole. However, the increase was not obvious. This type of situation could benefit from the inverted index of SolrCloud. The small amount of time increment was mainly spent in the query results return process. As for the spatial query parameters changing, the time consumed within the 4-GeoSOT grid query was clearly greater than that of within 1 GeoSOT grid, and this gap increased with the amount of metadata. This is perfectly understandable. The 4-GeoSOT grid query was the worst condition, and the comparison with the center point GeoSOT code of each remote sensing image should be made four times. However, within a 1 GeoSOT grid query, a one-time comparison would obviously be faster. Whether it is the spatial query parameters or query time frames that are changing, the retrieval times increase linearly with the increase of metadata volume. More specifically, the times for an increase rate below 10 million are a little shorter than those for an increase rate of 10 to 15 million.
5.3. Comparative Experiments and Analysis
In order to fully prove the superiority of our proposed LSI model-based metadata retrieval method, the following comparative experiments and analysis were carried out. Each type of comparative experiment contained six groups, and each group of experiments was carried out under the same data volumes and the same query parameters as the LSI model-based metadata retrieval experiments, using 20 average response time measurements [45].
5.3.1. Comparative Experiments
- (1)
- In order to show the advantages of our proposed LSI mode, the longitude and latitude were directly used to perform a full-text search, and other parameters were the same as in the LSI model-based experiments. For simplicity, the LSI model-based metadata retrieval method is simply referred to as SolrCloudLSI, and the longitude and latitude retrieval method is referred to as SolrCloudLatLon.
- (2)
- In order to show the big data management and retrieval capabilities of SolrCloud, we built a single Solr node environment in a new virtual machine, with the same configuration as the SolrCloud nodes. The comparative experiment included two types: LSI model-based data retrieval, and the longitude- and latitude-based data retrieval on the single Solr node. The query parameters of the two types of experiments were the same as the LSI model-based data retrieval experiments. Similarly, the LSI model-based data retrieval on the single Solr node is referred to as SolrLSI, and the longitude- and latitude-based data retrieval on the single Solr node is referred to as SolrLatLon.
- (3)
- In order to show the superiority of our proposed data management scheme with respect to other existing schemes, we chose HBase as the comparison object [45]. As a column-oriented key-value data store, HBase has been idolized widely because of its lineage with Hadoop and HDFS [46,47]. Therefore, LSI model-based data retrieval and the longitude- and latitude-based data retrieval experiments in HBase clusters were carried out. The cluster was provisioned with one NameNode and two DataNodes. The NameNode and DataNodes were configured in the same way as the SolrCloud cluster, 2 virtual processor cores and 4 GB of RAM. Hadoop 2.7.3, HBase 0.98.4 and Java 1.7.0 were installed on both the NameNode and the DataNodes. The query parameters and metadata volume of comparative experiments in the HBase cluster were the same as in the above experiments. Similarly, the LSI model-based data retrieval in the HBase cluster is referred to as HBaseLSI, and the longitude- and latitude-based data retrieval is referred to as HBaseLatLon.
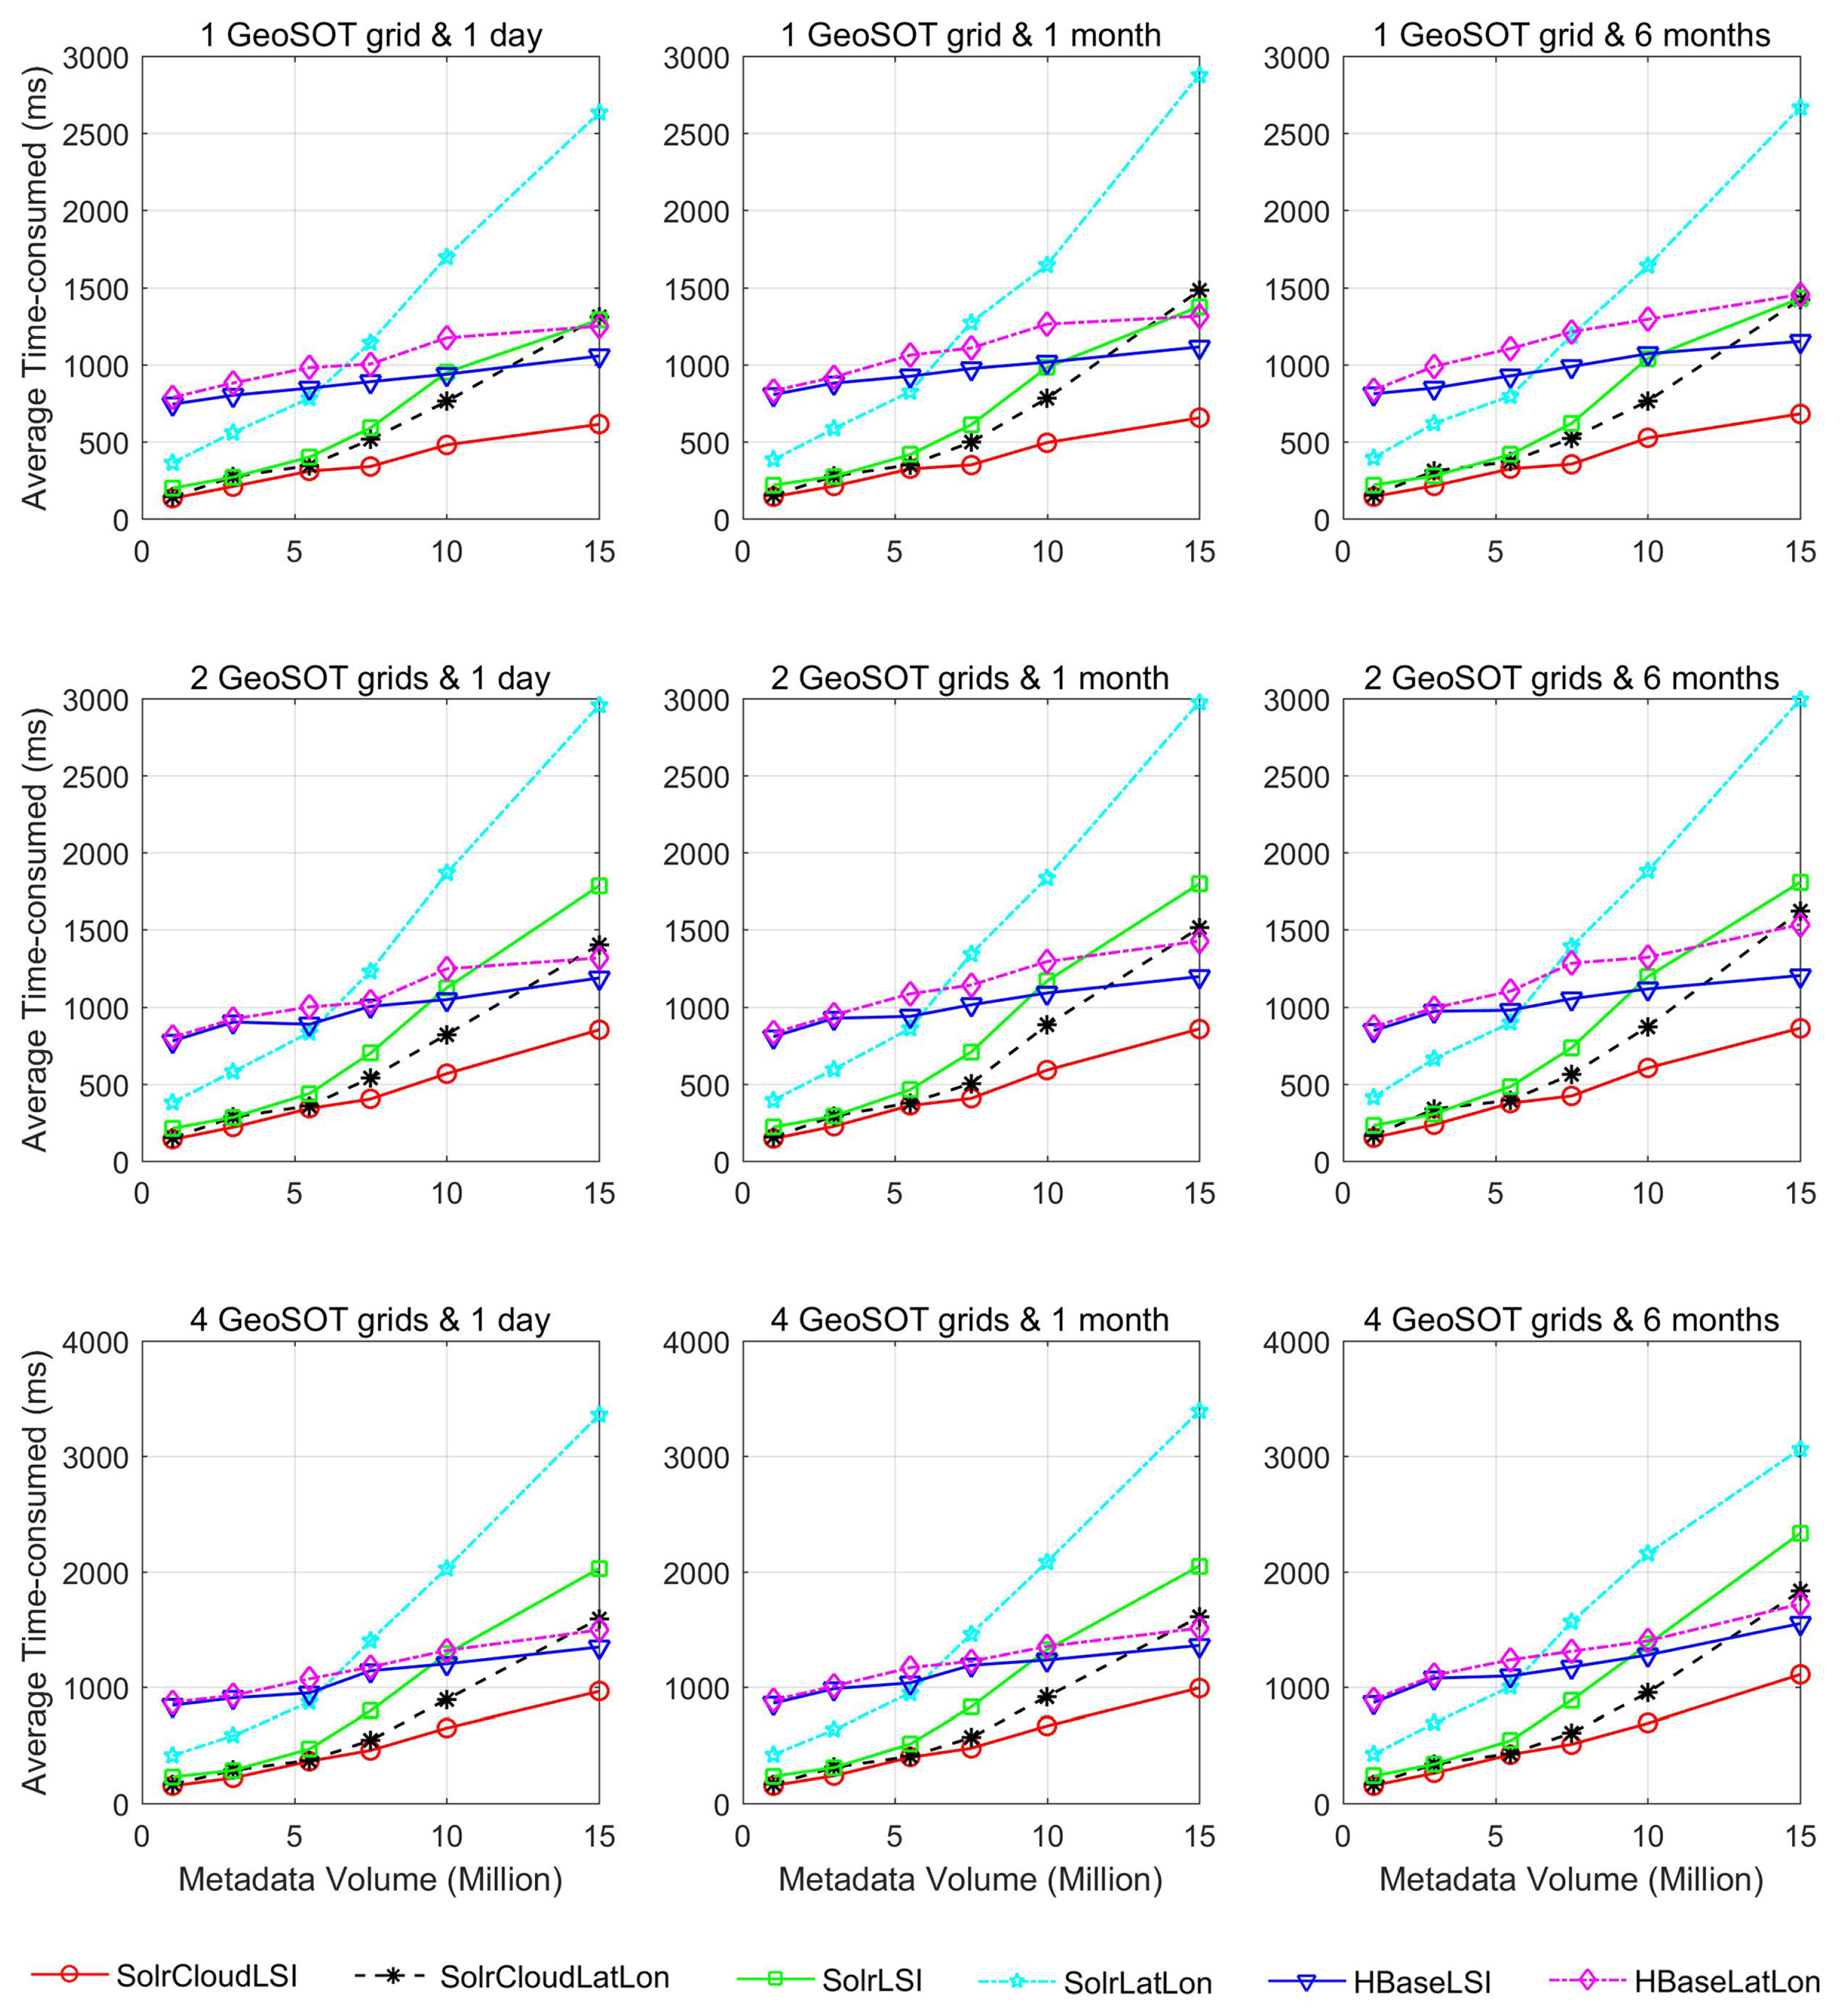
The time consumptions of all comparative experiments are shown in Figure 9.
5.3.2. Results Analysis
As can be seen in Figure 9, the following conclusions can be made.
Case 1: The spatial and time query parameters remained. In this case: (a) when the amount of metadata was less than 7.5 million items, the time consumption of the LSI model-based retrieval method was a little less than that of longitude- and latitude-based data retrieval; (b) with the increase of the metadata volume, the LSI model-based data retrieval was more efficient than the longitude- and latitude-based data retrieval; (c) when the amount of metadata was less than 5.5 million items, the time consumption of LSI model-based metadata retrieval on a single Solr node was not very different from that of SolrCloud; (d) when the metadata volume increased, the retrieval speed differences between SolrCloud and Solr became larger; (e) as for the longitude- and latitude-based data retrieval on the single Solr node, its retrieval speed was much slower than that of our proposed metadata retrieval program; and (f) although the query time increased little with the increase of metadata volume in the HBase cluster, it was still larger than that of the LSI model-based method. This may be because HBase has to manually scan the entire database to get results if we try to “filter” based on a “component” of the key or any of the values [45]. SolrCloud, on the other hand, with its inverted index, can handle queries on any of the fields in any combination, and can simply blaze them fast.
Case 2: The spatial query parameters remained but time frames changed. In this case: (a) with the increase of query time frames, the time consumed showed an upward trend as a whole, but this was not obvious, not only for SolrCloud but also in the Solr single node—this type of situation could benefit from the inverted index of SolrCloud and Solr; and (b) the query time increased little with the increase of query time frames in the HBase cluster.
Case 3: The time frames remained but spatial query parameters changed. In this case: (a) the time consumption increased with the increase of query spatial extent, regardless of using the LSI model-based metadata retrieval method or the longitude- and latitude-based data retrieval method; and (b) for both the SolrCloud/Solr and the HBase cluster, the query time growth rate of LSI model-based metadata retrieval method was greater than that of the longitude- and latitude-based data retrieval method. This may be because the comparison increased with the GeoSOT grid number increase. However, such a small flaw still did not affect the overall query efficiency of LSI model-based data retrieval method.
In short, the results of all the comparative experiments proved the superiority of our proposed data retrieval program.
6. Conclusions
In view of the current issues of remote sensing data integration and management, this paper proposed an OODT and SolrCloud-based data integration and management framework. Specifically, aiming at heterogeneous features of multi-source remote sensing data, we proposed an ISO 19115-2:2009-based metadata transform method to achieve the unity of metadata format in the distributed sub-centers. In order to achieve efficient, stable, secure and usable remote sensing data integration across a distributed data center spatial infrastructure, we adopted the OODT framework based on its stable, efficient, and easy-to-expand features, to implement remote sensing data polling, thumbnail generation, file transfer, thumbnail archiving, metadata storage, etc. Finally, for efficient retrieval problems of integrated massive data, we proposed the LSI model-based data organization approach, and took SolrCloud to realize the distributed index and quick retrieval of metadata. In addition, in order to verify the availability of our proposed program, a series of distributed data integration, retrieval, and comparative experiments were carried out. The results showed that our proposed distributed data integration and management program was effective and provided superior capabilities. In particular, the LSI model-based data organization and the SolrCloud-based distributed indexing schema could effectively improve the efficiency of massive data retrieval.
However, in this paper, the unified metadata conversion rule was pre-configured, and the metadata transformation was done manually. This was convenient and easy to operate, but less efficient. In particular, with an increase of data types, a great burden would be brought to data integration. Future studies based on deep learning algorithms using semantic matching and unified format conversion of remote sensing metadata will be performed. In addition, in this paper, the GeoSOT code length of each remote sensing image was calculated according to the image swath. This calculation is easy, and the obtained GeoSOT code is not very long. These relatively short GeoSOT codes could not bring a heavy query burden. However, despite this disadvantage, these relatively short GeoSOT codes, to a certain degree, have reduced query accuracy. Thus, future work will be focused on exploring a suitable GeoSOT code length calculation method, such as introducing the feedback control theory [48,49,50,51,52] to calculate GeoSOT code length of each type remote sensing image, so that neither the query efficiency nor accuracy will be affected.
Acknowledgments
This work is supported by the Fundamental Research Funds for the Central Universities, China University of Geosciences (Wuhan) (No. CUG170689) and the National Natural Science Foundation of China (No. 41471368, No. 41571413).
Author Contributions
All co-authors of this manuscript significantly contributed to all phases of the investigation. They contributed equally to the preparation, analysis, review and editing of this manuscript.
Conflicts of Interest
No potential conflict of interest was reported by the authors.
References
- Li, X.; Wang, L. On the study of fusion techniques for bad geological remote sensing image. J. Ambient Intell. Humaniz. Comput. 2015, 6, 141–149. [Google Scholar] [CrossRef]
- Jeansoulin, R. Review of Forty Years of Technological Changes in Geomatics toward the Big Data Paradigm. ISPRS Int. J. Geo-Inf. 2016, 5, 155. [Google Scholar] [CrossRef]
- Lowe, D.; Mitchell, A. Status Report on NASA’s Earth Observing Data and Information System (EOSDIS). In Proceedings of the 42nd Meeting of the Working Group on Information Systems & Services, Frascati, Italy, 19–22 September 2016. [Google Scholar]
- China’s FY Satellite Data Center. Available online: http://satellite.cma.gov.cn/portalsite/default.aspx (accessed on 25 August 2017).
- China Center for Resources Satellite Data and Application. Available online: http://www.cresda.com/CN/sjfw/zxsj/index.shtml (accessed on 25 August 2017).
- Yan, J.; Wang, L. Suitability evaluation for products generation from multisource remote sensing data. Remote Sens. 2016, 8, 995. [Google Scholar] [CrossRef]
- Dou, M.; Chen, J.; Chen, D.; Chen, X.; Deng, Z.; Zhang, X.; Xu, K.; Wang, J. Modeling and simulation for natural disaster contingency planning driven by high-resolution remote sensing images. Future Gener. Comput. Syst. 2014, 37, 367–377. [Google Scholar] [CrossRef]
- Lü, X.; Cheng, C.; Gong, J.; Guan, L. Review of data storage and management technologies for massive remote sensing data. Sci. China Technol. Sci. 2011, 54, 3220–3232. [Google Scholar] [CrossRef]
- Wu, D.; Zhu, L.; Xu, X.; Sakr, S.; Sun, D.; Lu, Q. Building pipelines for heterogeneous execution environments for big data processing. IEEE Softw. 2016, 33, 60–67. [Google Scholar] [CrossRef]
- Nagi, K. Bringing search engines to the cloud using open source components. In Proceedings of the 7th International Joint Conference on Knowledge Discovery, Knowledge Engineering and Knowledge Management (IC3K), Lisbon, Portugal, 12–14 November 2015; pp. 116–126. [Google Scholar]
- Yang, C.; Huang, Q.; Li, Z.; Liu, K.; Hu, F. Big Data and cloud computing: Innovation opportunities and challenges. Int. J. Digit. Earth 2017, 10, 13–53. [Google Scholar] [CrossRef]
- Luo, X.; Wang, M.; Dai, G. A Novel Technique to Compute the Revisit Time of Satellites and Its Application in Remote Sensing Satellite Optimization Design. Int. J. Aerosp. Eng. 2017, 2017, 6469439. [Google Scholar] [CrossRef]
- Wang, W.; De, S.; Cassar, G.; Moessner, K. An experimental study on geospatial indexing for sensor service discovery. Expert Syst. Appl. 2015, 42, 3528–3538. [Google Scholar] [CrossRef] [Green Version]
- He, Z.; Wu, C.; Liu, G.; Zheng, Z.; Tian, Y. Decomposition tree: A spatio-temporal indexing method for movement big data. Clust. Comput. 2015, 18, 1481–1492. [Google Scholar] [CrossRef]
- Leptoukh, G. Nasa remote sensing data in earth sciences: Processing, archiving, distribution, applications at the ges disc. In Proceedings of the 31st International Symposium of Remote Sensing of Environment, Saint Petersburg, Russia, 20–24 June 2005. [Google Scholar]
- Geohash. Available online: https://en.wikipedia.org/wiki/Geohash (accessed on 25 August 2017).
- Zhe, Y.; Weixin, Z.; Dong, C.; Wei, Z.; Chengqi, C. A fast UAV image stitching method on GeoSOT. In Proceedings of the 2015 IEEE International Geoscience and Remote Sensing Symposium (IGARSS), Milan, Italy, 26–31 July 2015; pp. 1785–1788. [Google Scholar]
- Dev, D.; Patgiri, R. Performance evaluation of HDFS in big data management. In Proceedings of the 2014 International Conference on High Performance Computing and Applications (ICHPCA), Bhubaneswar, India, 22–24 December 2014; pp. 1–7. [Google Scholar]
- Mitchell, A.; Ramapriyan, H.; Lowe, D. Evolution of web services in eosdis-search and order metadata registry (echo). In Proceedings of the 2009 IEEE International Geoscience and Remote Sensing Symposium, Cape Town, South Africa, 12–17 July 2009; pp. 371–374. [Google Scholar]
- OODT. Available online: http://oodt.apache.org/ (accessed on 25 January 2017).
- Mattmann, C.A.; Crichton, D.J.; Medvidovic, N.; Hughes, S. A software architecture-based framework for highly distributed and data intensive scientific applications. In Proceedings of the 28th international conference on Software engineering, Shanghai, China, 20–28 May 2006; pp. 721–730. [Google Scholar]
- Mattmann, C.A.; Freeborn, D.; Crichton, D.; Foster, B.; Hart, A.; Woollard, D.; Hardman, S.; Ramirez, P.; Kelly, S.; Chang, A.Y.; et al. A reusable process control system framework for the orbiting carbon observatory and npp. sounder peate missions. In Proceedings of the 2009 Third IEEE International Conference on Space Mission Challenges for Information Technology, Pasadena, CA, USA, 19–23 July 2009; pp. 165–172. [Google Scholar]
- Di, L.; Moe, K.; Zyl, T.L.V. Earth observation sensor web: An overview. IEEE J. Sel. Top. Appl. Earth Obs. Remote Sens. 2010, 3, 415–417. [Google Scholar] [CrossRef]
- Reuter, D.C.; Richardson, C.M.; Pellerano, F.A.; Irons, J.R.; Allen, R.G.; Anderson, M.; Jhabvala, M.D.; Lunsford, A.W.; Montanaro, M.; Smith, R.L. The thermal infrared sensor (tirs) on landsat 8: Design overview and pre-launch characterization. Remote Sens. 2015, 7, 1135–1153. [Google Scholar] [CrossRef]
- Wei, Y.; Di, L.; Zhao, B.; Liao, G.; Chen, A. Transformation of hdf-eos metadata from the ecs model to iso 19115-based xml. Comput. Geosci. 2007, 33, 238–247. [Google Scholar] [CrossRef]
- Khandelwal, S.; Goyal, R. Effect of vegetation and urbanization over land surface temperature: Case study of jaipur city. In Proceedings of the EARSeL Symposium, Paris, France, 31 May–3 June 2010; pp. 177–183. [Google Scholar]
- Mahaxay, M.; Arunpraparut, W.; Trisurat, Y.; Tangtham, N. Modis: An alternative for updating land use and land cover in large river basin. Thai J. For 2014, 33, 34–47. [Google Scholar]
- Zhong, B.; Zhang, Y.; Du, T.; Yang, A.; Lv, W.; Liu, Q. Cross-calibration of hj-1/ccd over a desert site using landsat etm+ imagery and aster gdem product. IEEE Trans. Geosci. Remote Sens. 2014, 52, 7247–7263. [Google Scholar] [CrossRef]
- Devarakonda, R.; Palanisamy, G.; Wilson, B.E.; Green, J.M. Mercury: Reusable metadata management, data discovery and access system. Earth Sci. Inf. 2010, 3, 87–94. [Google Scholar] [CrossRef]
- Chen, N.; Hu, C. A sharable and interoperable meta-model for atmospheric satellite sensors and observations. IEEE J. Sel. Top. Appl. Earth Obs. Remote Sens. 2012, 5, 1519–1530. [Google Scholar] [CrossRef]
- Yue, P.; Gong, J.; Di, L. Augmenting geospatial data provenance through metadata tracking in geospatial service chaining. Comput. Geosci. 2010, 36, 270–281. [Google Scholar] [CrossRef]
- Gilman, J.A.; Shum, D. Making metadata better with cmr and mmt. In Proceedings of the Federation of Earth Science Information Partners 2016 Summer Meeting, Durham, NC, USA, 19–22 July 2016. [Google Scholar]
- Burgess, A.B.; Mattmann, C.A. Automatically classifying and interpreting polar datasets with apache tika. In Proceedings of the 2014 IEEE 15th International Conference on Information Reuse and Integration (IEEE IRI 2014), Redwood City, CA, USA, 13–15 August 2014; pp. 863–867. [Google Scholar]
- Cheng, C.; Ren, F.; Pu, G. Introduction for the Subdivision and Organization of Spatial Information; Science Press: Beijing, China, 2012. [Google Scholar]
- Lu, N.; Cheng, C.; Jin, A.; Ma, H. An index and retrieval method of spatial data based on geosot global discrete grid system. In Proceedings of the 2013 IEEE International Geoscience and Remote Sensing Symposium (IGARSS), Melbourne, Australia, 21–26 July 2013; pp. 4519–4522. [Google Scholar]
- Yan, J.; Chengqi, C. Dynamic representation method of target in remote sensed images based on global subdivision grid. In Proceedings of the 2014 IEEE International Geoscience and Remote Sensing Symposium (IGARSS), Quebec City, QC, Canada, 13–18 July 2014; pp. 3097–3100. [Google Scholar]
- Happ, P.; Ferreira, R.S.; Bentes, C.; Costa, G.; Feitosa, R.Q. Multiresolution segmentation: A parallel approach for high resolution image segmentation in multicore architectures. Int. Arch. Photogramm. Remote Sens. Spat. Inf. Sci. 2010, 38, C7. [Google Scholar]
- Wang, L.; Cheng, C.; Wu, S.; Wu, F.; Teng, W. Massive remote sensing image data management based on hbase and geosot. In Proceedings of the 2015 IEEE International Geoscience and Remote Sensing Symposium (IGARSS), Milan, Italy, 26–31 July 2015; pp. 4558–4561. [Google Scholar]
- Vyverman, M.; De Baets, B.; Fack, V.; Dawyndt, P. Prospects and limitations of full-text index structures in genome analysis. Nucleic Acids Res. 2012, 40, 6993–7015. [Google Scholar] [CrossRef] [PubMed]
- SolrCloud. Available online: https://cwiki.apache.org/confluence/display/solr/SolrCloud (accessed on 25 January 2017).
- Singh, S.; Liu, Y.; Khan, M. Exploring cloud monitoring data using search cluster and semantic media wiki. In Proceedings of the 2015 IEEE 12th International Conference on Ubiquitous Intelligence and Computing and 2015 IEEE 12th International Conference on Autonomic and Trusted Computing and 2015 IEEE 15th International Conference on Scalable Computing and Communications and Its Associated Workshops (UIC-ATC-ScalCom), Beijing, China, 10–14 August 2015; pp. 901–908. [Google Scholar]
- Kassela, E.; Konstantinou, I.; Koziris, N. A generic architecture for scalable and highly available content serving applications in the cloud. In Proceedings of the 2015 IEEE Fourth Symposium on Network Cloud Computing and Applications (NCCA), Munich, Germany, 11–12 June 2015; pp. 83–90. [Google Scholar]
- Bai, J. Feasibility analysis of big log data real time search based on hbase and elasticsearch. In Proceedings of the 2013 Ninth International Conference on Natural Computation (ICNC), Shenyang, China, 23–25 July 2013; pp. 1166–1170. [Google Scholar]
- Baldoni, R.; Damore, F.; Mecella, M.; Ucci, D. A software architecture for progressive scanning of on-line communities. In Proceedings of the 2014 IEEE 34th International Conference on Distributed Computing Systems Workshops (ICDCSW), Madrid, Spain, 30 June–3 July 2014; pp. 207–212. [Google Scholar]
- Rathore, M.M.U.; Paul, A.; Ahmad, A.; Chen, B.W.; Huang, B.; Ji, W. Real-time big data analytical architecture for remote sensing application. IEEE J. Sel. Top. Appl. Earth Obs. Remote Sens. 2015, 8, 4610–4621. [Google Scholar] [CrossRef]
- Giachetta, R. A framework for processing large scale geospatial and remote sensing data in MapReduce environment. Comput. Graph. 2015, 49, 37–46. [Google Scholar] [CrossRef]
- Wang, Y.; Liu, Z.; Liao, H.; Li, C. Improving the performance of GIS polygon overlay computation with MapReduce for spatial big data processing. Clust. Comput. 2015, 18, 507–516. [Google Scholar] [CrossRef]
- Wei, Y.; Qiu, J.; Karimi, H.R. Reliable output feedback control of discrete-time fuzzy affine systems with actuator faults. IEEE Trans. Circuits Syst. I Regul. Pap. 2017, 64, 170–181. [Google Scholar] [CrossRef]
- Wei, Y.; Qiu, J.; Karimi, H.R.; Wang, M. Model reduction for continuous-time Markovian jump systems with incomplete statistics of mode information. Int. J. Syst. Sci. 2014, 45, 1496–1507. [Google Scholar] [CrossRef]
- Wei, Y.; Qiu, J.; Karimi, H.R.; Wang, M. New results on H∞ dynamic output feedback control for Markovian jump systems with time-varying delay and defective mode information. Optim. Control Appl. Methods 2014, 35, 656–675. [Google Scholar] [CrossRef]
- Wei, Y.; Qiu, J.; Karimi, H.R.; Wang, M. Filtering design for two-dimensional Markovian jump systems with state-delays and deficient mode information. Inf. Sci. 2014, 269, 316–331. [Google Scholar] [CrossRef]
- Wei, Y.; Wang, M.; Qiu, J. New approach to delay-dependent H∞ filtering for discrete-time Markovian jump systems with time-varying delay and incomplete transition descriptions. IET Control Theory Appl. 2013, 7, 684–696. [Google Scholar] [CrossRef]
Figure 1.
An object-oriented data technology (OODT) framework.

Figure 2.
The process of distributed data integration.
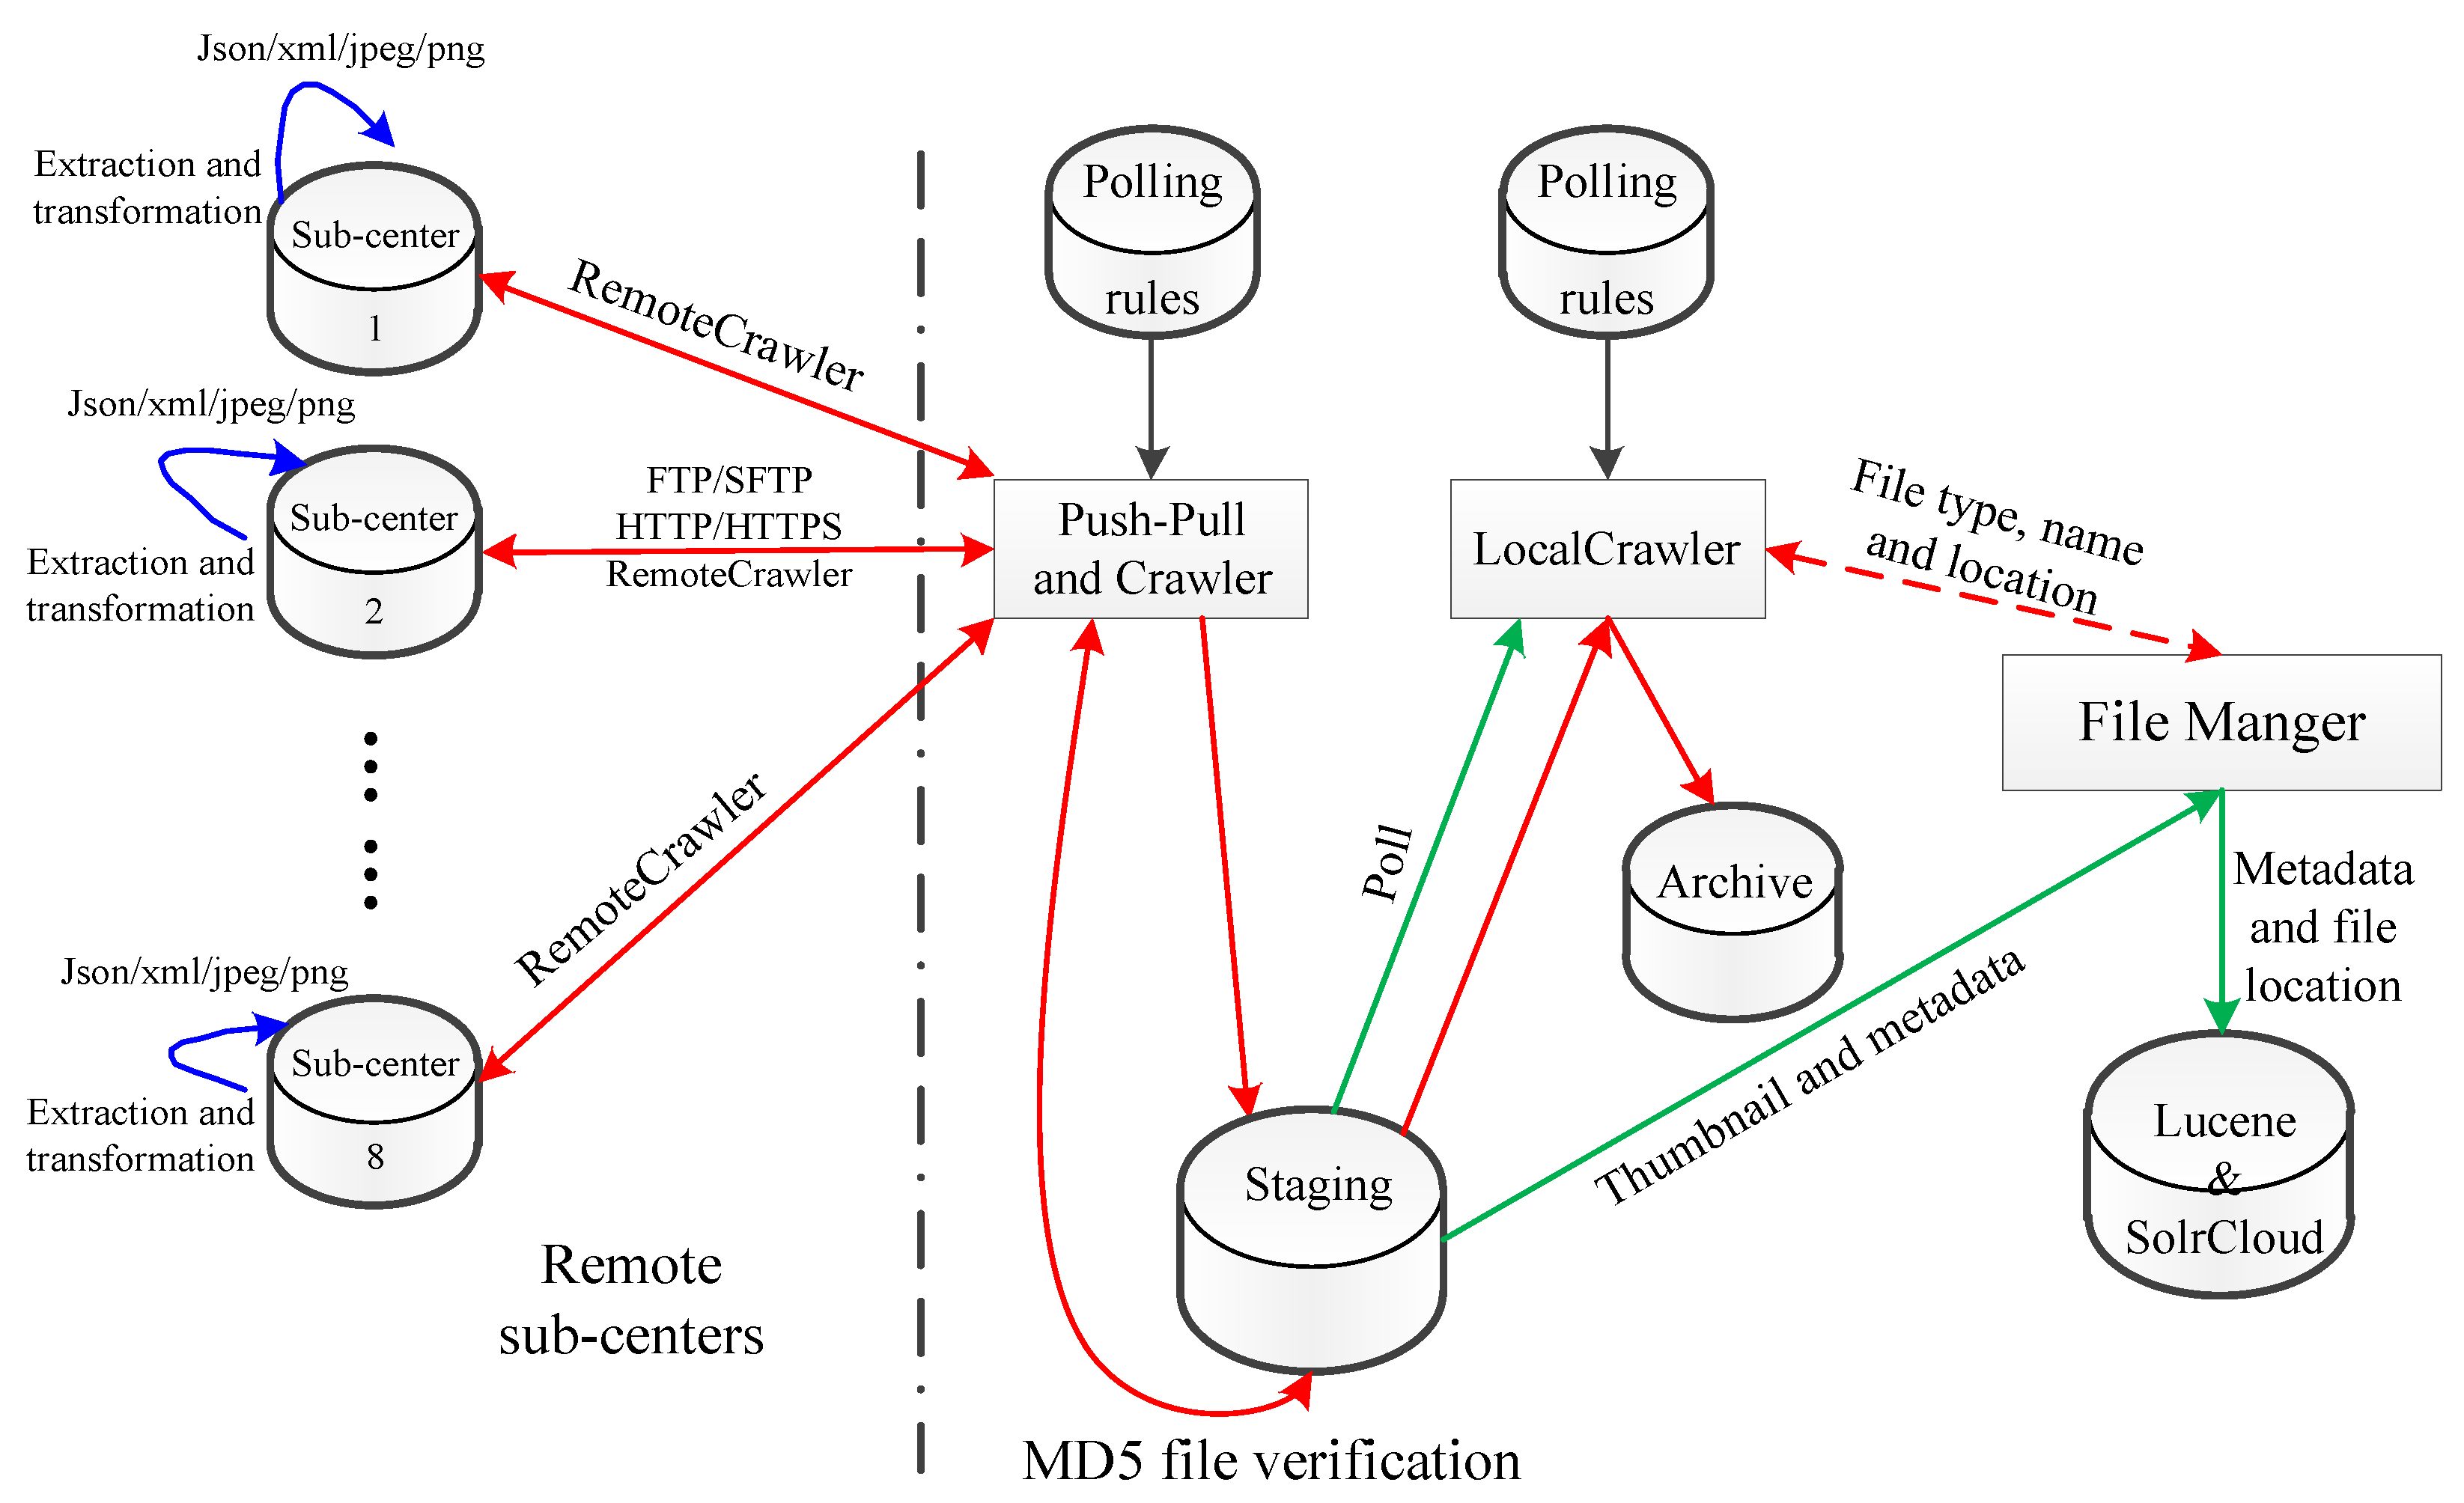
Figure 3.
Level 0–3 Geographical Coordinate Subdividing Grid with One Dimension Integer Coding on Tree (GeoSOT) grids.
Figure 3.
Level 0–3 Geographical Coordinate Subdividing Grid with One Dimension Integer Coding on Tree (GeoSOT) grids.
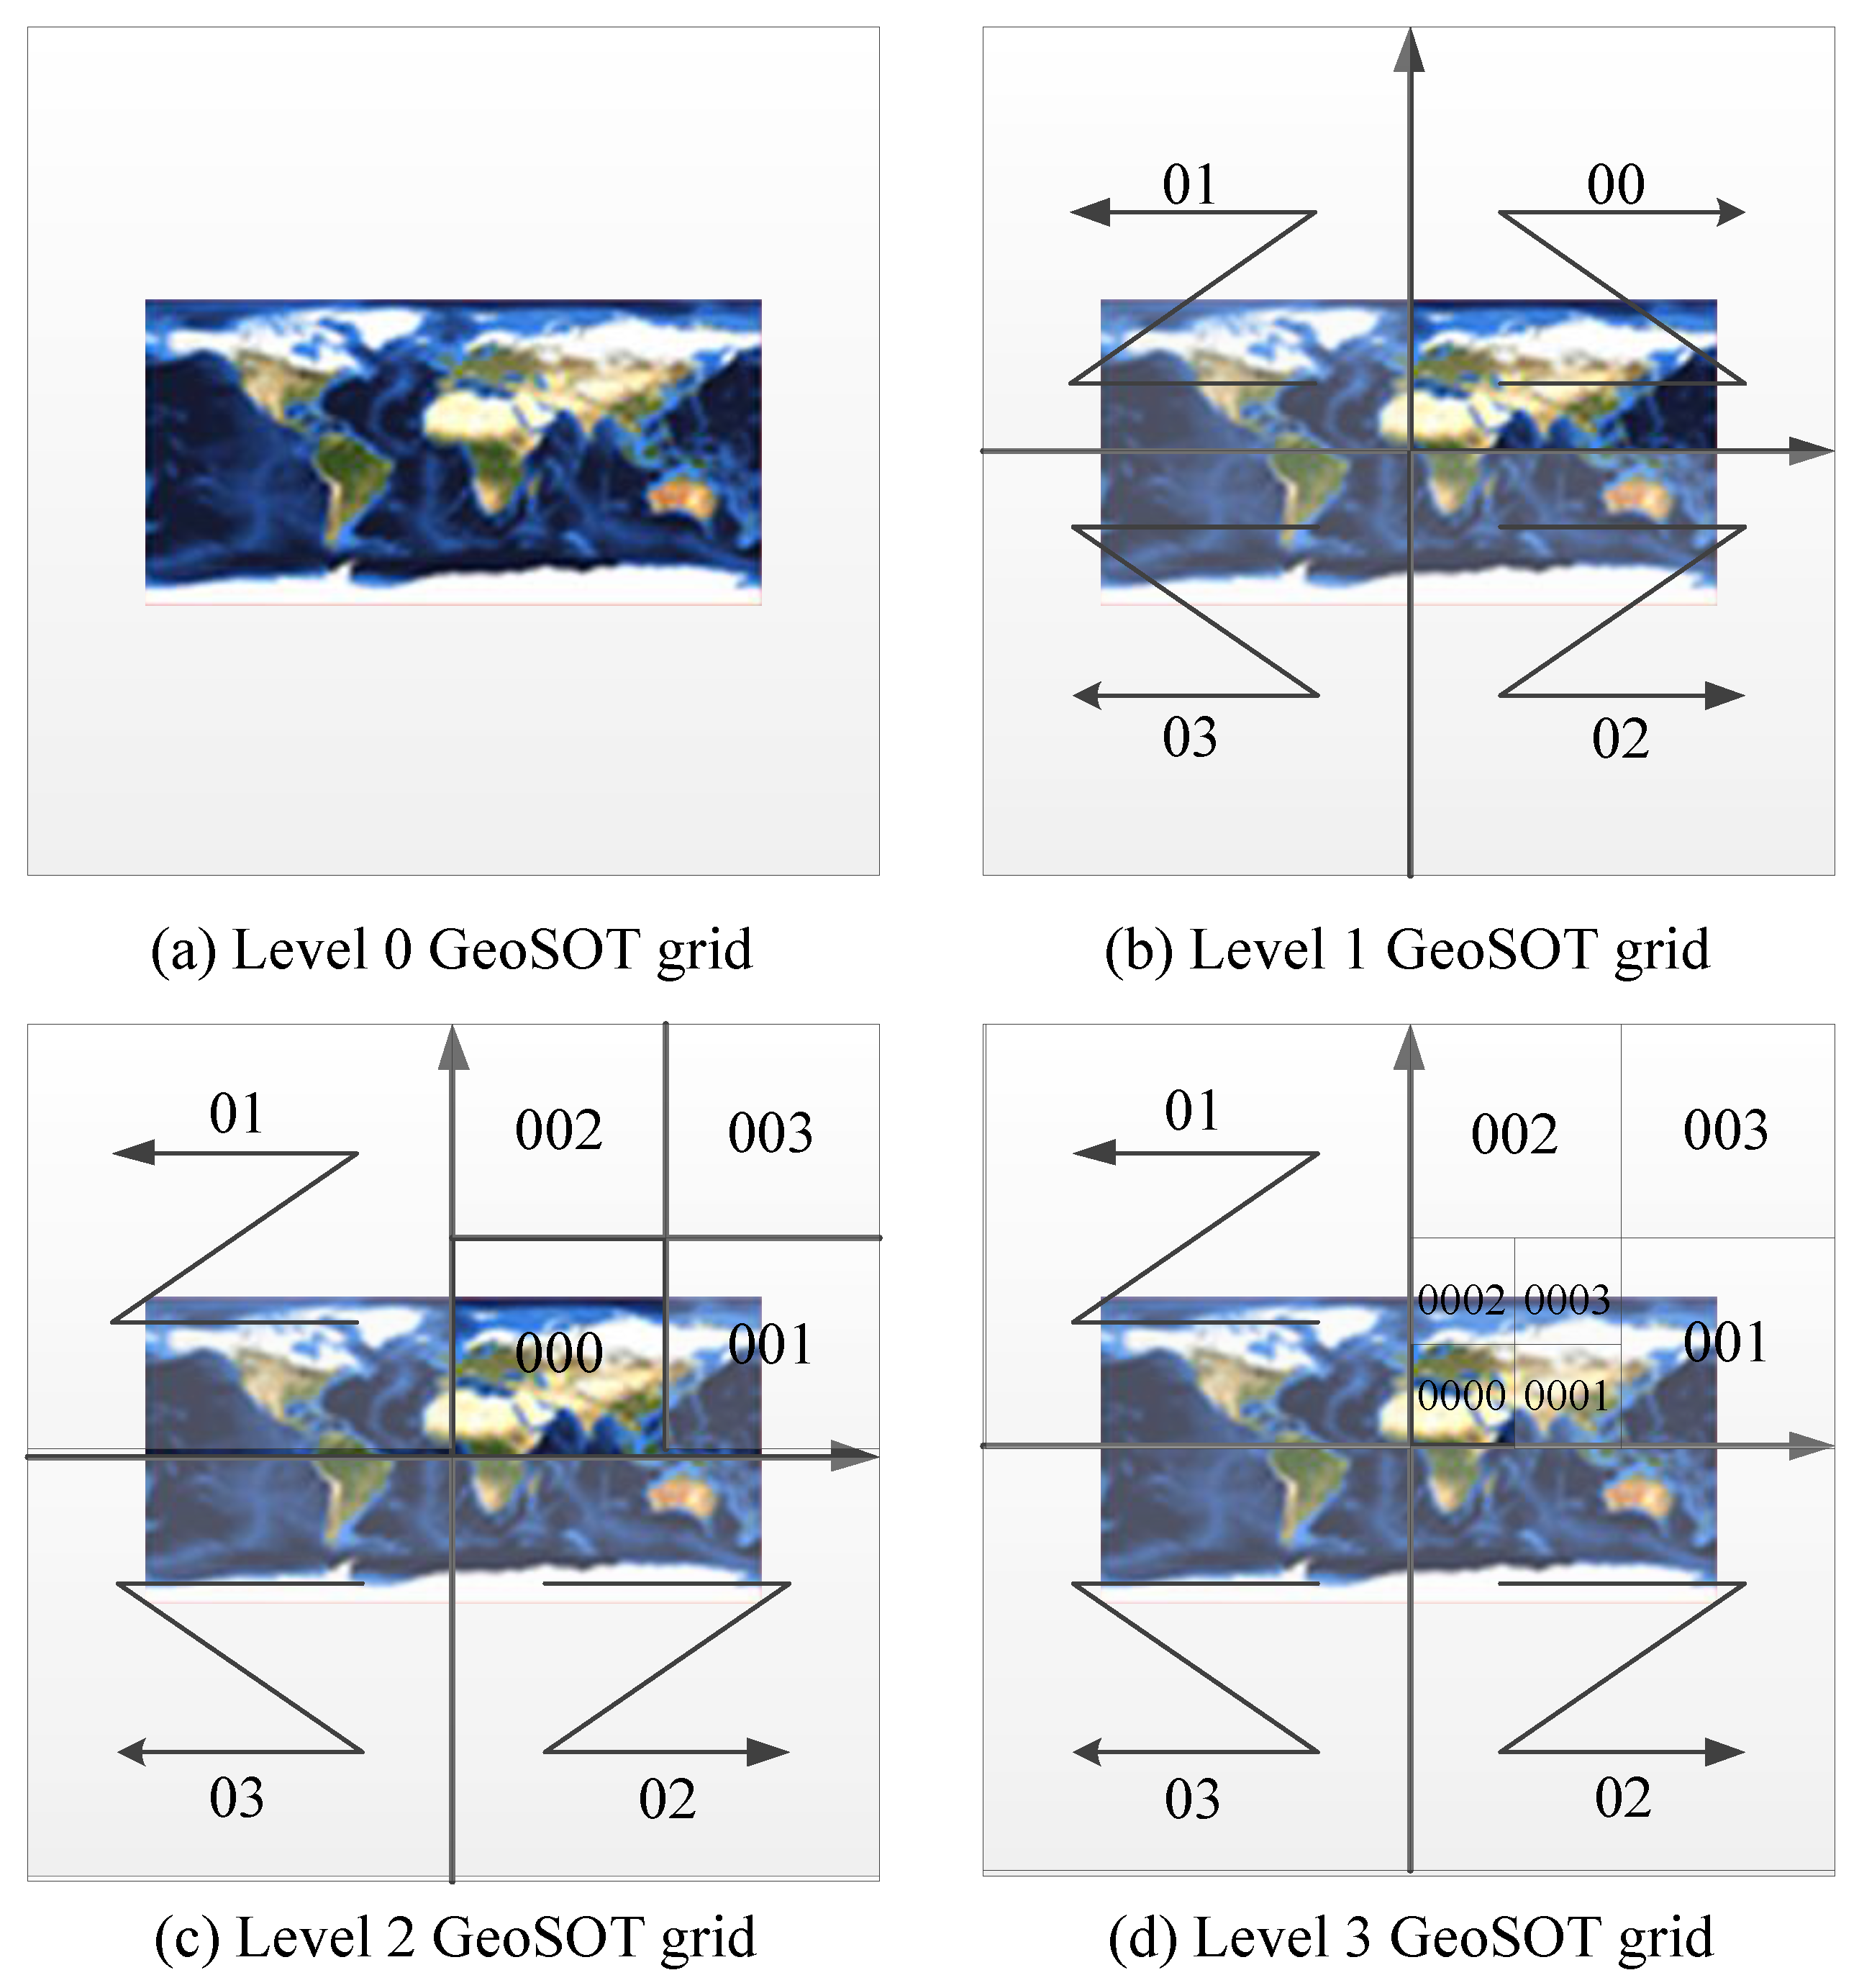
Figure 4.
Three cases with respect to the logical partition index code. MBR: minimum bounding rectangle.
Figure 4.
Three cases with respect to the logical partition index code. MBR: minimum bounding rectangle.
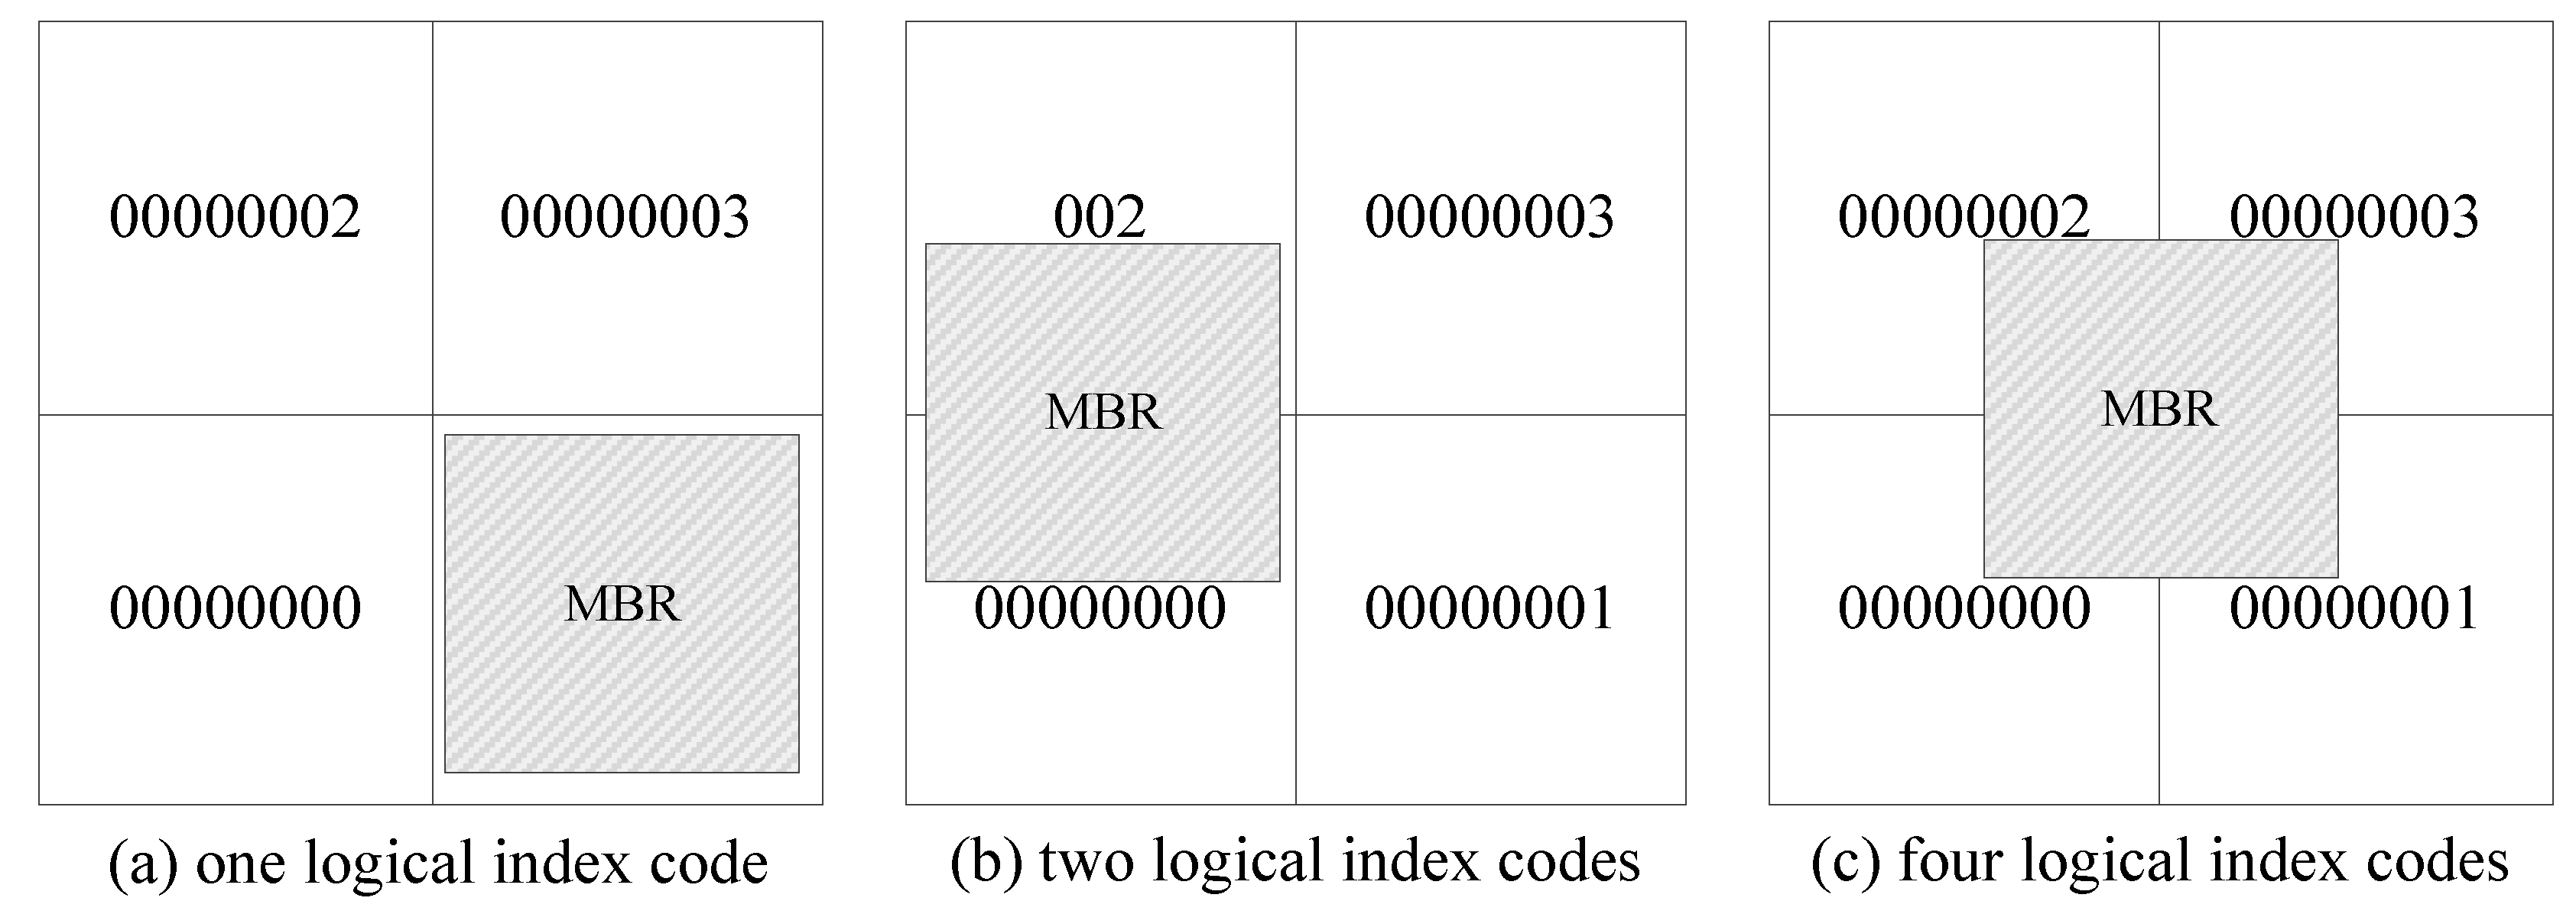
Figure 5.
The virtual mapping between the logical partition indexing and the scene parameters of remote sensing data.
Figure 5.
The virtual mapping between the logical partition indexing and the scene parameters of remote sensing data.
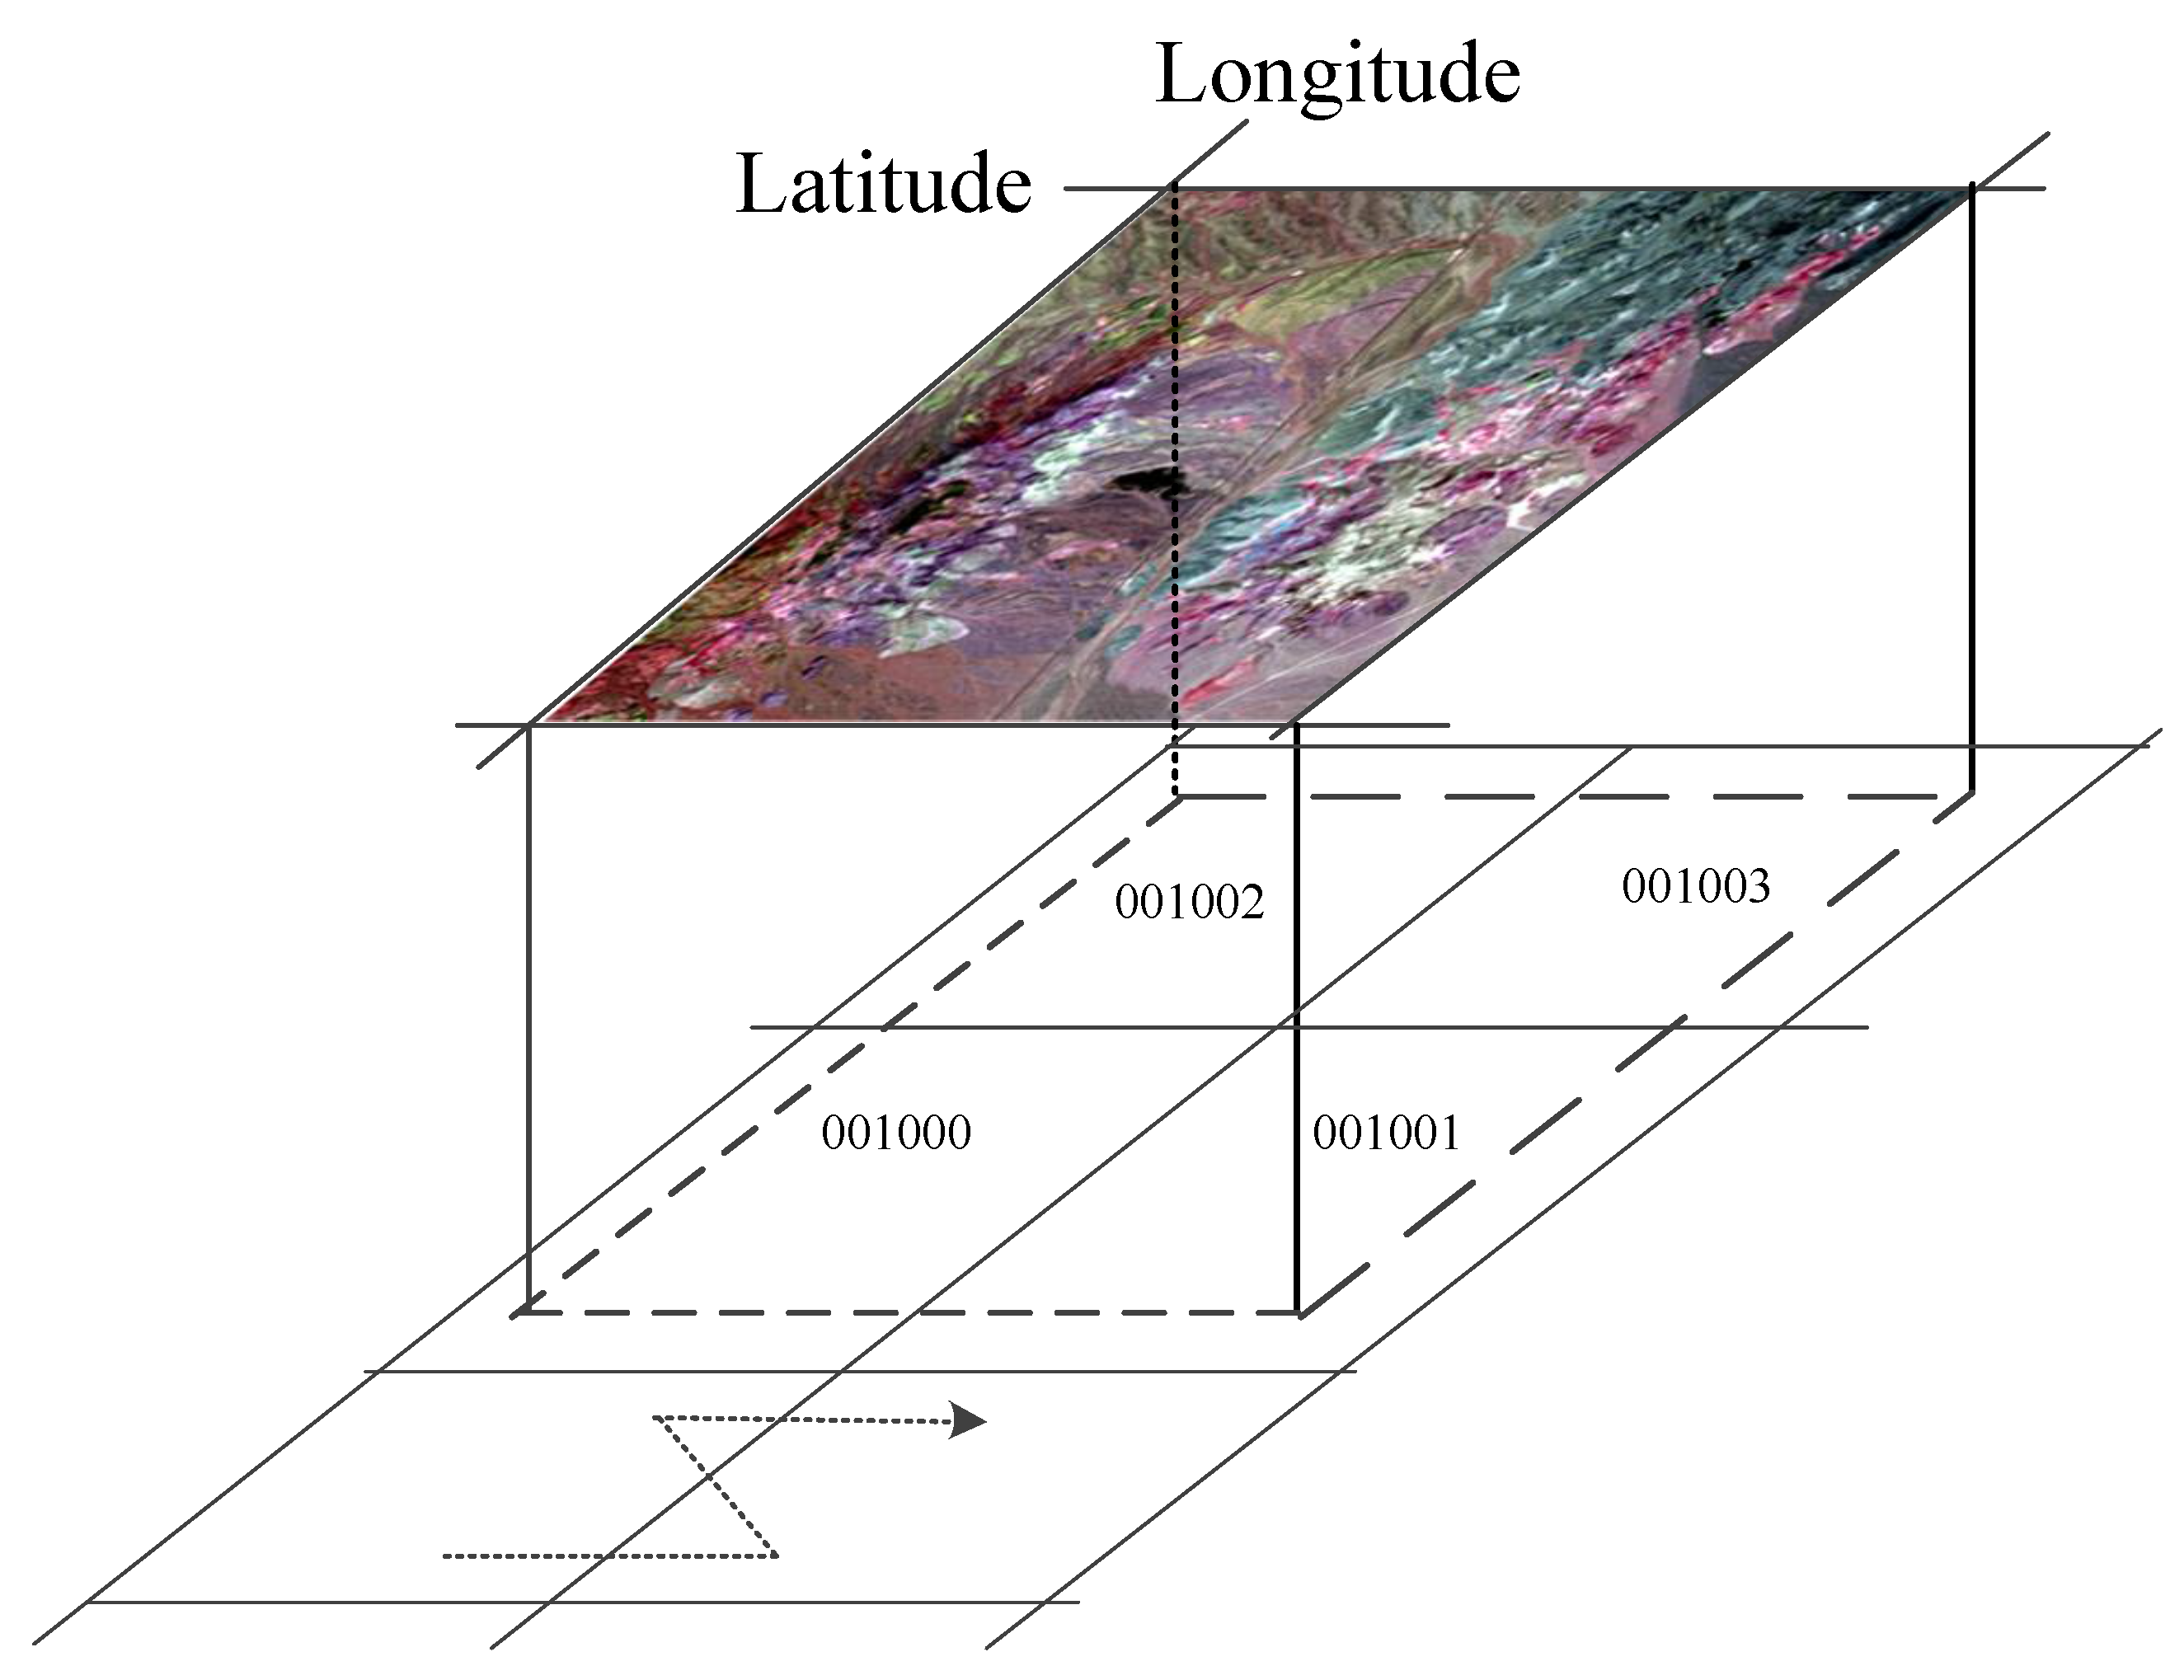
Figure 6.
SolrCloud.
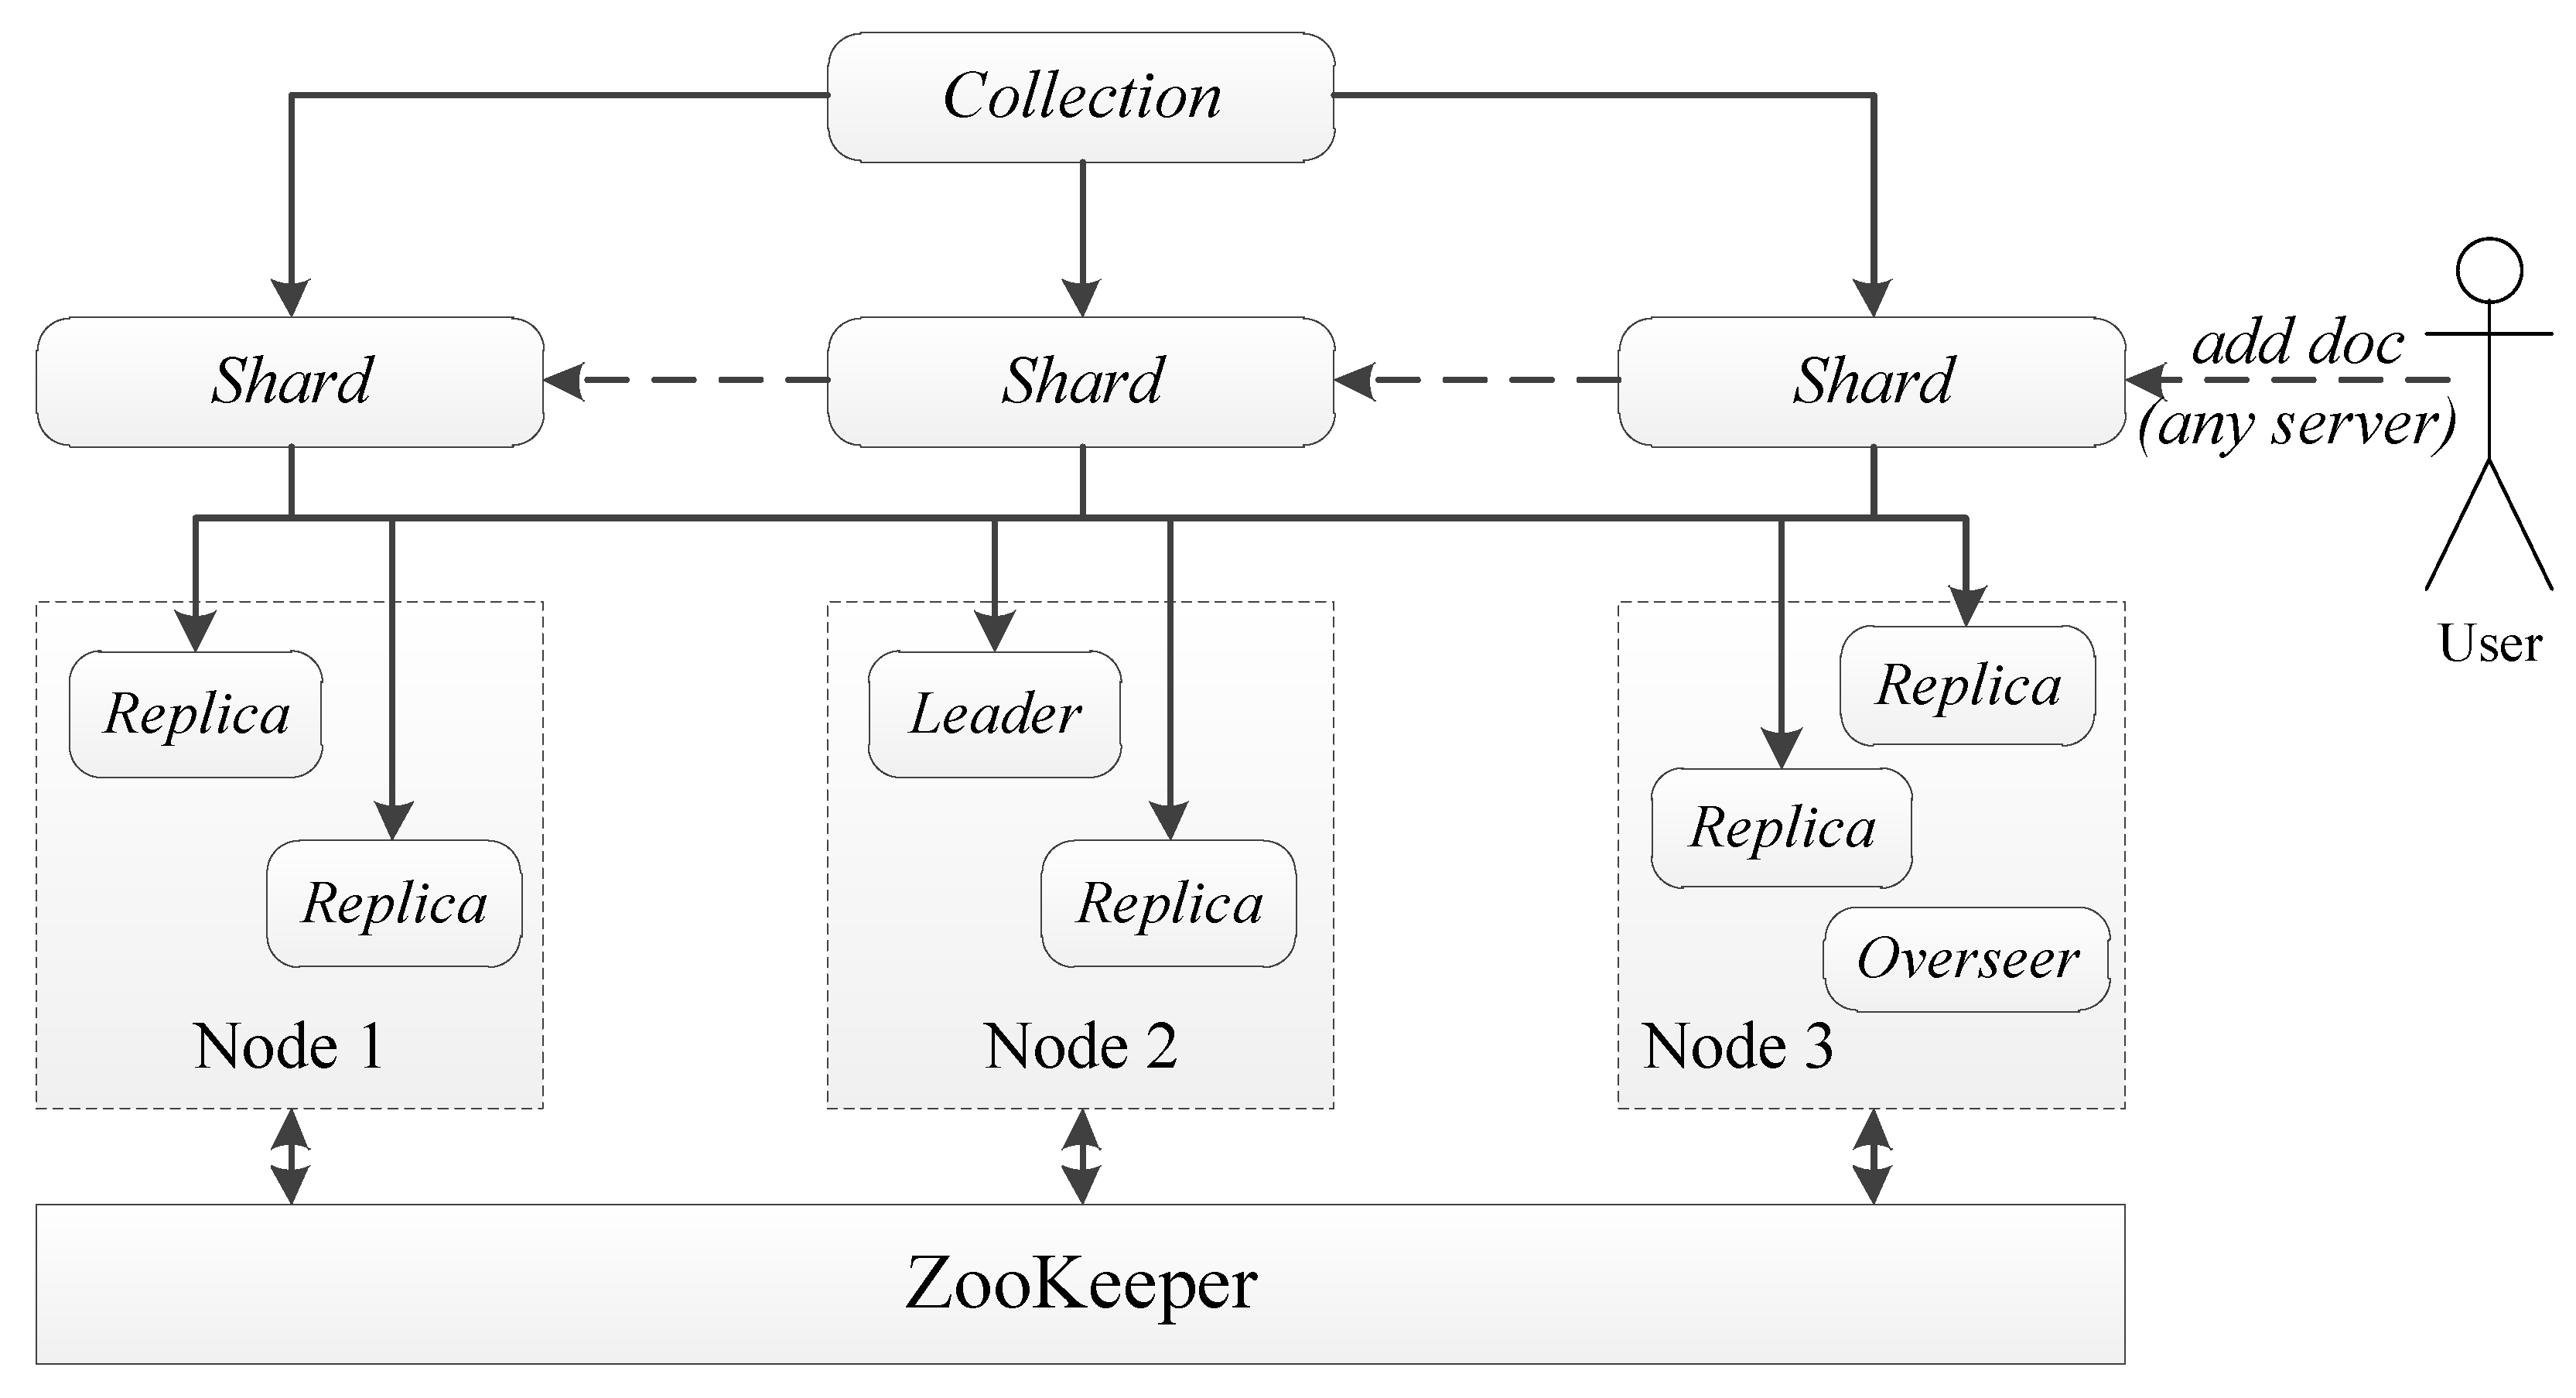
Figure 7.
The SolrCloud distributed query process. (1) The user’s data query request is sent to any one of the SolrCloud nodes, and then forwarded to one of the replication nodes; (2) The distributed query is launched and converted into multiple sub-queries, each of which is located on any of the replications; (3) Results are returned by each sub-query; and (4) sub-query results are merged and returned to users.
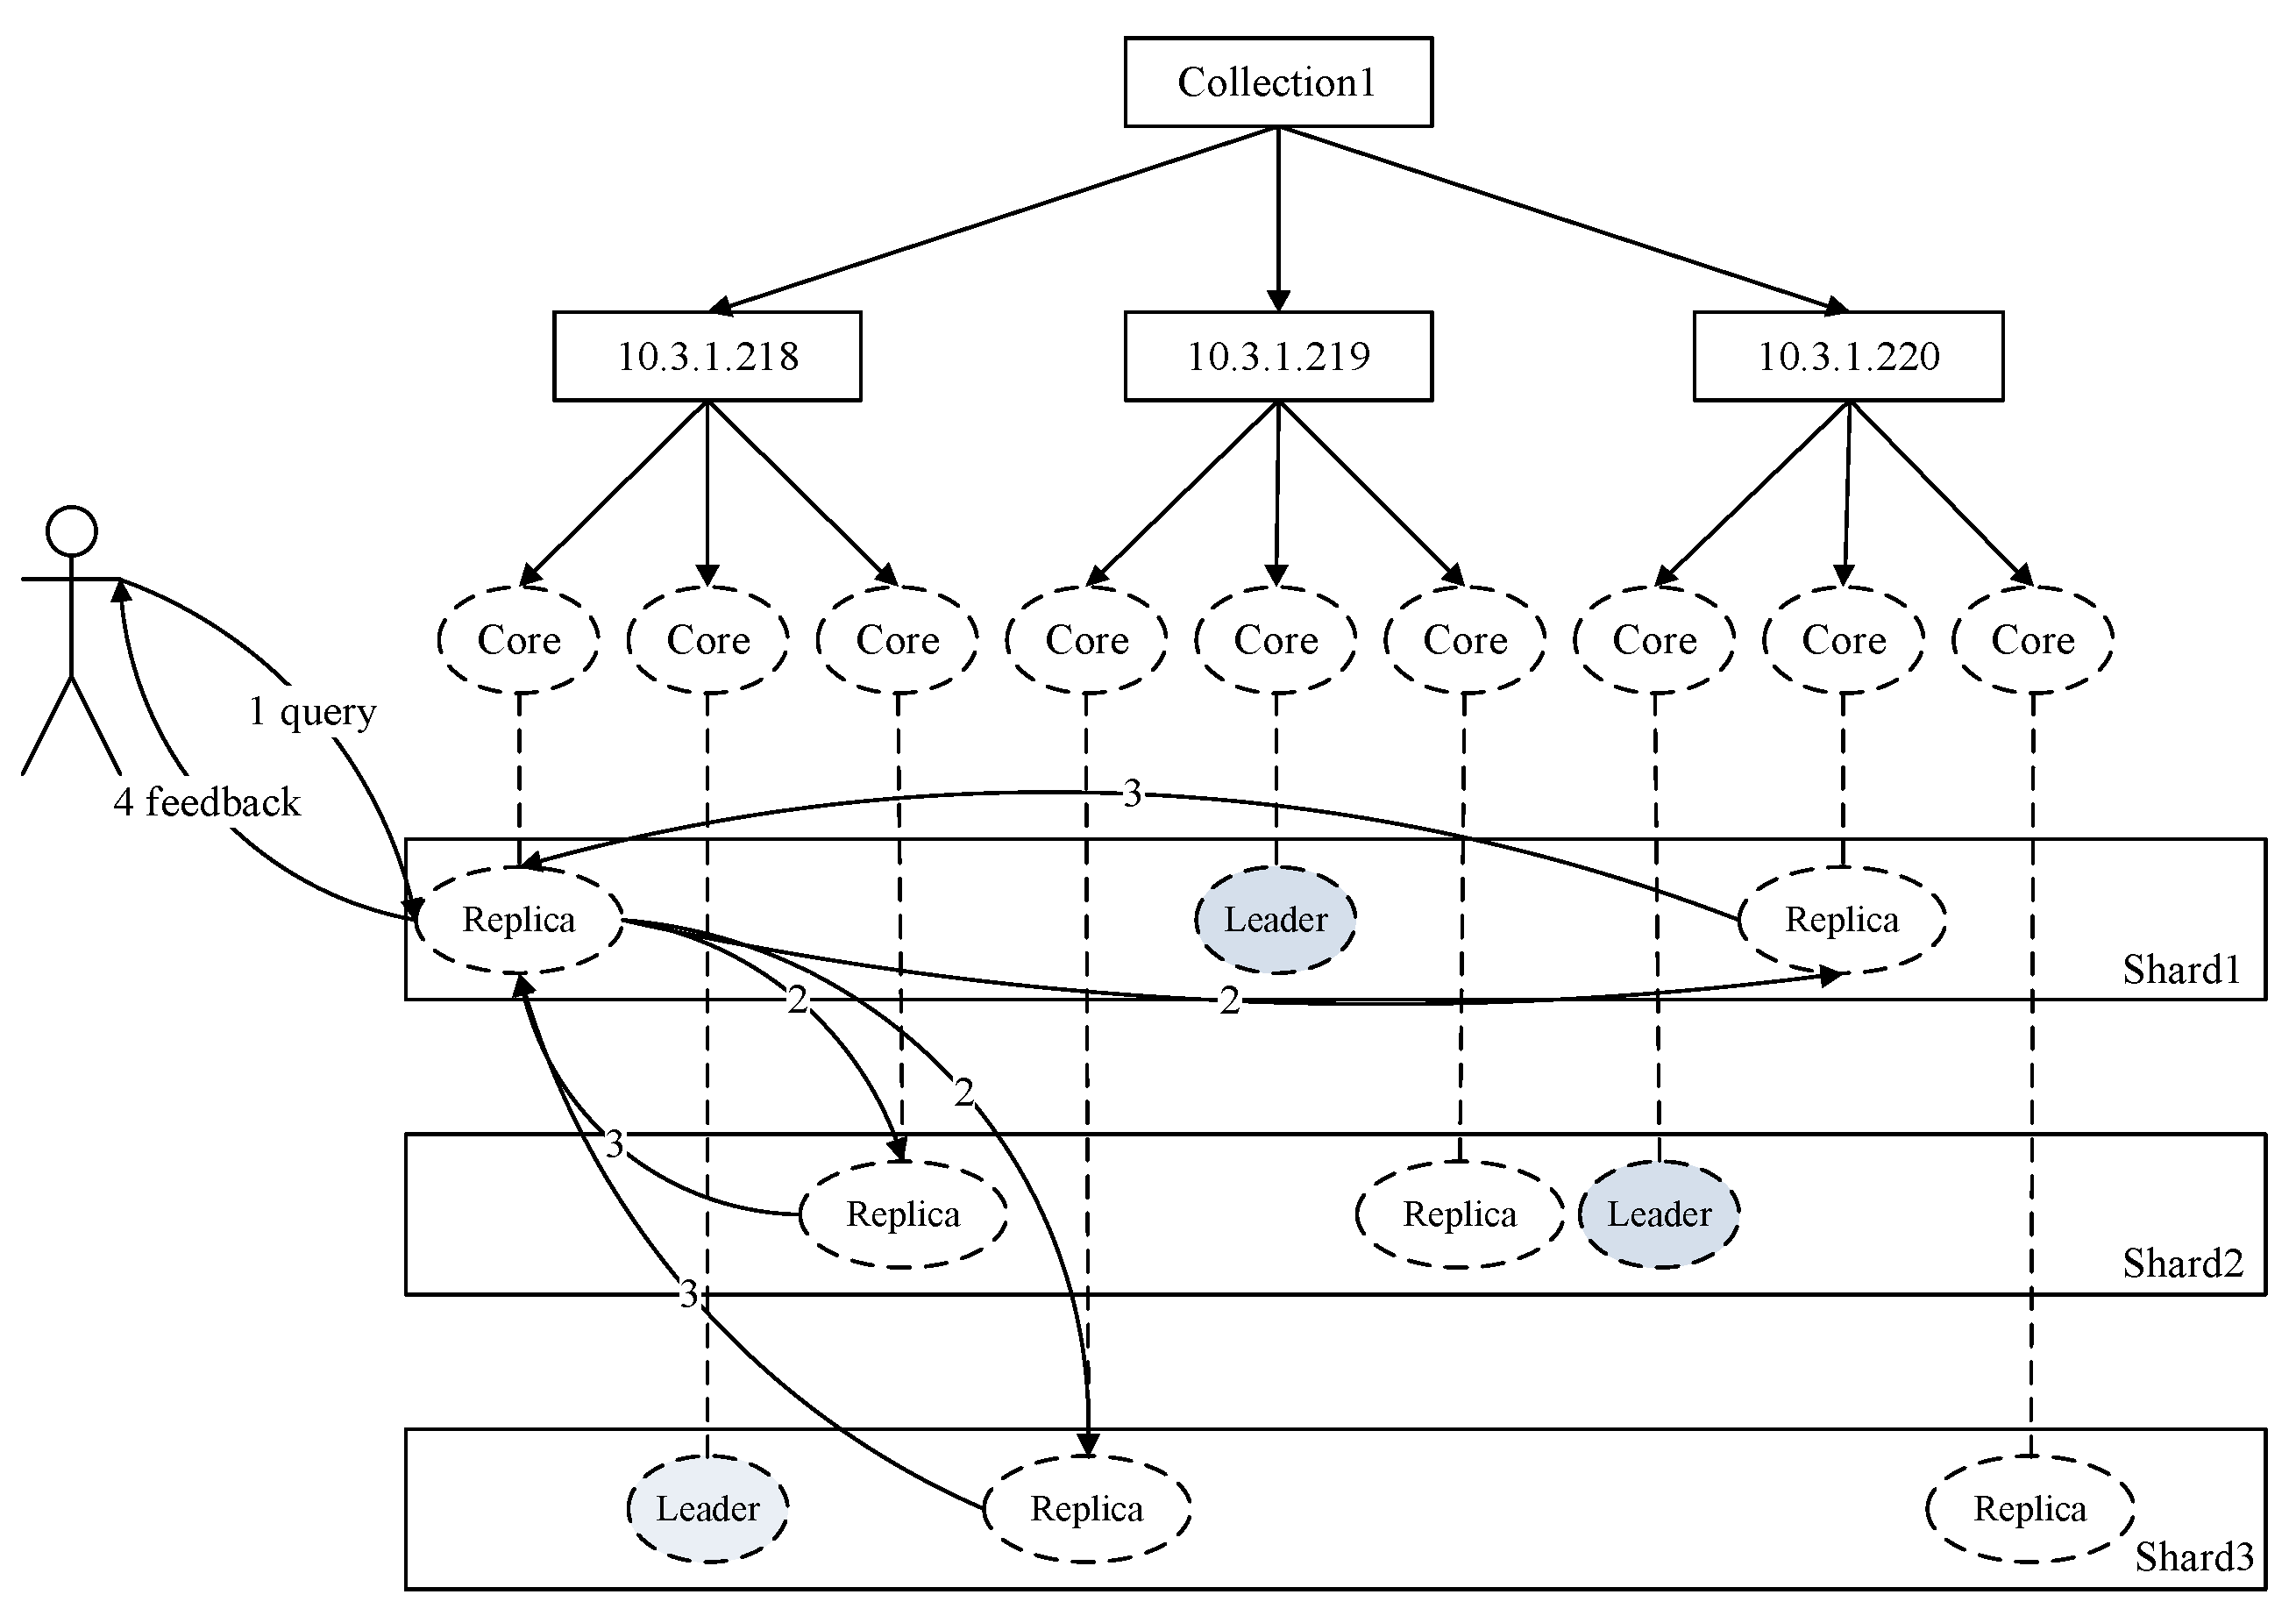
Figure 8.
The framework of the virtual multi-center data environment.

Figure 9.
The results of all comparative experiments.

Table 1.
The ISO 19115-2:2009-based uniform metadata format and transformational rules. ISO: International Standardization Organization; CCRSDA: China Center for Resources Satellite Data and Application; HDF-EOS: Hierarchical Data Format Earth Observation System.
Table 1.
The ISO 19115-2:2009-based uniform metadata format and transformational rules. ISO: International Standardization Organization; CCRSDA: China Center for Resources Satellite Data and Application; HDF-EOS: Hierarchical Data Format Earth Observation System.
| Categories | ISO Metadata | HDF-EOS Metadata | CCRSDA Metadata |
|---|---|---|---|
| Metadata information | Creation | FILE_DATE | - |
| LastRevision | - | - | |
| Image Information | MD_Identifier | LOCALGRANULEID | - |
| TimePeriod_beginposition | RangeBeginningDate + RangeBeginningTime | imagingStartTime | |
| TimePeriod_endPosition | RangeEndingDate + RangeEndingTime | imagingStopTime | |
| Platform | AssociatedPlatformShortName | satelliteId | |
| Instrument | AssociatedinstrumentShortName | - | |
| Sensor | AssociatedsensorShortName | sensorId | |
| Datacenter | PROCESSINGCENTER | - | |
| recStationId | STATION_ID | recStationId | |
| spatialResolution | NADIRDATARESOLUTION | pixelSpacing | |
| westBoundLongtude | WESTBOUNDINGCOORDINATE | productUpperLeftLong | |
| eastBoundLongtude | EASTBOUNDINGCOORDINATE | productUpperRightLong | |
| southBoundLatitude | SOUTHBOUNDINGCOORDINATE | productLowerLeftLat | |
| northBoundLatitude | NORTHBOUNDINGCOORDINATE | productUpperLeftLat | |
| centerLongtude | - | sceneCenterLong | |
| centerLatitude | - | sceneCenterLat | |
| scenePath | WRS_PATH | scenePath | |
| sceneRow | WRS_ROW | sceneRow | |
| referenceSystemIdentifier | PROJECTION_PARAMETERS | earthModel+mapProjection | |
| cloudCoverPercentage | - | cloudCoverPercentage | |
| imageQualityCode | - | overallQuality | |
| processingLevel | DATA_TYPE | productLevel |
Table 2.
The full-text index structure of multi-source remote sensing metadata.
| Index Type | Field | Field Type | Indexed |
|---|---|---|---|
| static | ID | string | true |
| CAS.ProductId | string | true | |
| CAS.ProductName | string | true | |
| CAS.ProductTypeName | date | true | |
| CAS.ProductTypeId | string | true | |
| CAS.ProductReceivedTime | string | true | |
| CAS.ProductTransferStatus | string | true | |
| CAS.ReferenceOriginal | string | true | |
| CAS.ReferenceDatastore | string | true | |
| CAS.ReferenceFileSize | long | true | |
| CAS.ReferenceMimeType | string | true | |
| dynamic | * | string | true |
Table 3.
A Summary of the Experimental Images.
| Sub-Center | Satellite | Data Type | Volume of Images | Image Format |
|---|---|---|---|---|
| 1 | Landsat 8 | OLI_TIRS | 310 | GeoTIFF |
| 2 | HJ-1A | HSI | 350 | HDF5 |
| 2 | CEBERS-1/2 | CCD | 270 | GeoTIFF |
| 3 | Landsat 7 | ETM+ | 450 | GeoTIFF |
| 4 | Landsat1-5 | MSS | 260 | GeoTIFF |
| 5 | HJ-1A/B | CCD | 710 | GeoTIFF |
| 6 | Landsat 5 | TM | 430 | GeoTIFF |
| 7 | FY-3A/B | VIRR | 450 | HDF5 |
| 8 | Aster | L1T | 150 | HDF4 |
Table 4.
Experimental results of distributed data integration.
| Satellite | Data Type | Volume of Images Stored in Sub-Center | Volume of Images Integrated by Main Center | Average Transfer Rate (MB/s) |
|---|---|---|---|---|
| Landsat 8 | OLI_TIRS | 310 | 310 | 9.8 |
| HJ-1A | HSI | 350 | 350 | 10.1 |
| CEBERS-1/2 | CCD | 270 | 270 | 11.7 |
| Landsat 7 | ETM+ | 450 | 450 | 10.5 |
| Landsat1-5 | MSS | 260 | 260 | 12.8 |
| HJ-1A/B | CCD | 710 | 710 | 9.9 |
| Landsat 5 | TM | 430 | 430 | 13.8 |
| FY-3A/B | VIRR | 450 | 450 | 11.2 |
| Aster | L1T | 150 | 150 | 10.8 |
Table 5.
A summary of experimental remote sensing metadata.
| Satellite | Data Type | Volume of Metadata | Metadata Format |
|---|---|---|---|
| Landsat 8 | OLI_TIRS | 896,981 | HDF-EOS |
| HJ-1A | HSI | 85,072 | Customized XML |
| CEBERS-1/2 | CCD | 889,685 | Customized XML |
| Landsat 7 | ETM+ | 2,246,823 | HDF-EOS |
| Landsat1-5 | MSS | 1,306,579 | HDF-EOS |
| HJ-1A/B | CCD | 2,210,352 | Customized XML |
| Landsat 5 | TM | 2,351,899 | HDF-EOS |
| FY-3A/B | VIRR | 2,343,288 | Customized HDF5-FY |
| Aster | L1T | 2,951,298 | HDF-EOS |
Table 6.
The search conditions and time consumed of each retrieval.
| Group | Subgroup | Query Time Frames | ||
|---|---|---|---|---|
| Metadata Volume (Million) | Spatial Parameters | 1 Day | 1 Month | 6 Months |
| 1 | 1 GeoSOT Grid | 133 ms | 144 ms | 145 ms |
| 2 GeoSOT Grids | 139 ms | 144 ms | 151 ms | |
| 4 GeoSOT Grids | 151 ms | 154 ms | 155 ms | |
| 3 | 1 GeoSOT Grid | 211 ms | 213 ms | 215 ms |
| 2 GeoSOT Grids | 218 ms | 224 ms | 235 ms | |
| 4 GeoSOT Grids | 220 ms | 239 ms | 261 ms | |
| 5.5 | 1 GeoSOT Grid | 310 ms | 324 ms | 325 ms |
| 2 GeoSOT Grids | 340 ms | 359 ms | 375 ms | |
| 4 GeoSOT Grids | 365 ms | 398 ms | 421 ms | |
| 7.5 | 1 GeoSOT Grid | 340 ms | 350 ms | 355 ms |
| 2 GeoSOT Grids | 401 ms | 405 ms | 421 ms | |
| 4 GeoSOT Grids | 457 ms | 476 ms | 510 ms | |
| 10 | 1 GeoSOT Grid | 480 ms | 495 ms | 525 ms |
| 2 GeoSOT Grids | 566 ms | 589 ms | 603 ms | |
| 4 GeoSOT Grids | 650 ms | 668 ms | 691 ms | |
| 15 | 1 GeoSOT Grid | 613 ms | 655 ms | 681 ms |
| 2 GeoSOT Grids | 850 ms | 856 ms | 861 ms | |
| 4 GeoSOT Grids | 965 ms | 994 ms | 1110 ms | |
© 2017 by the authors. Licensee MDPI, Basel, Switzerland. This article is an open access article distributed under the terms and conditions of the Creative Commons Attribution (CC BY) license (http://creativecommons.org/licenses/by/4.0/).
Share and Cite
MDPI and ACS Style
Fan, J.; Yan, J.; Ma, Y.; Wang, L. Big Data Integration in Remote Sensing across a Distributed Metadata-Based Spatial Infrastructure. Remote Sens. 2018, 10, 7. https://doi.org/10.3390/rs10010007
AMA Style
Fan J, Yan J, Ma Y, Wang L. Big Data Integration in Remote Sensing across a Distributed Metadata-Based Spatial Infrastructure. Remote Sensing. 2018; 10(1):7. https://doi.org/10.3390/rs10010007
Chicago/Turabian StyleFan, Junqing, Jining Yan, Yan Ma, and Lizhe Wang. 2018. "Big Data Integration in Remote Sensing across a Distributed Metadata-Based Spatial Infrastructure" Remote Sensing 10, no. 1: 7. https://doi.org/10.3390/rs10010007
Note that from the first issue of 2016, this journal uses article numbers instead of page numbers. See further details here.