A Land Product Characterization System for Comparative Analysis of Satellite Data and Products


1
NOAA/NESDIS, College Park, MD 20740, USA
2
USGS-EROS, Sioux Falls, SD 57198, USA
*
Author to whom correspondence should be addressed.
Remote Sens. 2018, 10(1), 48; https://doi.org/10.3390/rs10010048
Submission received: 21 November 2017
/
Revised: 18 December 2017
/
Accepted: 21 December 2017
/
Published: 29 December 2017
(This article belongs to the Special Issue Quantitative Remote Sensing of Land Surface Variables)
Abstract
:A Land Product Characterization System (LPCS) has been developed to provide land data and products to the community of individuals interested in validating space-based land products by comparing them with similar products available from other sensors or surface-based observations. The LPCS facilitates the application of global multi-satellite and in situ data for characterization and validation of higher-level, satellite-derived, land surface products (e.g., surface reflectance, normalized difference vegetation index, and land surface temperature). The LPCS includes data search, inventory, access, and analysis functions that will permit data to be easily identified, retrieved, co-registered, and compared statistically through a single interface. The system currently includes data and products available from Landsat 4 through 8, Moderate Resolution Imaging Spectroradiometer (MODIS) Terra and Aqua, Suomi National Polar-Orbiting Partnership (S-NPP)/Joint Polar Satellite System (JPSS) Visible Infrared Imaging Radiometer Suite (VIIRS), and simulated data for the Geostationary Operational Environmental Satellite (GOES)-16 Advanced Baseline Imager (ABI). In addition to the future inclusion of in situ data, higher-level land products from the European Space Agency (ESA) Sentinel-2 and -3 series of satellites, and other high and medium resolution spatial sensors, will be included as available. When fully implemented, any of the sensor data or products included in the LPCS would be available for comparative analysis.
Keywords:
remote sensing; characterization; calibration; validation; Landsat; MODIS; VIIRS; Sentinel; GOES
1. Introduction
The intercomparison of space-based observations has been recognized as an important effort in the pursuit of the use of these data for detection, quantification, and long-term monitoring of the Earth’s environment, land processes, and changes in land cover or features [1]. As stated within their conclusions [1], “the most crucial aspect of monitoring activities using EO (Earth Observation) satellites is the continuity and consistency of measurements through time”. Recommendations related to assuring the consistency of measurements through time include various levels of detail and dependencies when comparing observations from multiple sensors, including (i) traceability of measurements; (ii) sampling differences between sensor spectral, spatial, or radiometric resolutions; and (iii) scene variability [1].
Several international efforts are underway related to the intercomparison of sensors, including those within the Global Space-Based Inter-Calibration System [2] and the Committee on Earth Observation Satellites (CEOS) Working Group on Calibration and Validation (WGCV) [3]. The CEOS WGCV includes a land product validation (LPV) subgroup that specifically focuses on the assessment of land products, including bidirectional reflectance/albedo, vegetation index, and land surface temperature [4].
Often there are specific “test sites” identified for sensor comparisons that are dependent on the data or products under review. For example, the National Aeronautics and Space Administration (NASA) Earth Observing System Land Validation effort includes a set of “Core Sites”, which often includes a flux tower and measurement of terrestrial biophysical processes over a diverse range of land covers [5]. The On Line Validation Exercise (OLIVE), which is a web-based system for validation of land products including leaf area index (LAI), fraction of Absorbed Photosynthetically Active Radiation Absorbed (FAPAR), and Vegetation Cover Fraction (FCOVER), includes two primary networks of test sites that include surface-based observations [6].
The goal of the LPCS is to provide land data and products to the community of individuals interested in validating space-based land products by comparing them with similar products available from other sensors or surface-based observations. The LPCS is designed to provide readily comparable land data and products from multiple sensors for user-defined global locations. The LPCS processing options allow flexibility based on user requirements for product comparisons and evaluations. Thus, LPCS users can make intercomparisons of satellite products at locations of established surface-based observations, or other requirements, e.g., spatial representativeness of a location. The LPCS architecture and functionality are described, followed by an example of the data search, inventory, selection, processing options, and output products currently available.
2. LPCS Architecture and Functionality
The LPCS is a web-based system [7] that includes data search, inventory, access, and analysis functions that will permit data and products to be easily identified, retrieved, co-registered, and nominally compared through a single interface (Figure 1). The output products include each selected scene (single- or multi-image products for a specific geographic area, sensor, and time). The scenes are processed to user specifications, with tabular and plotted summaries of the data and products. The system currently is designed to retrieve data archived in the U.S. Geological Survey’s Earth Resources Observation and Science (EROS) Center; however, additional data access opportunities, e.g., the Open-source Project for a Network Data Access Protocol (OPeNDAP) [8], are under review.
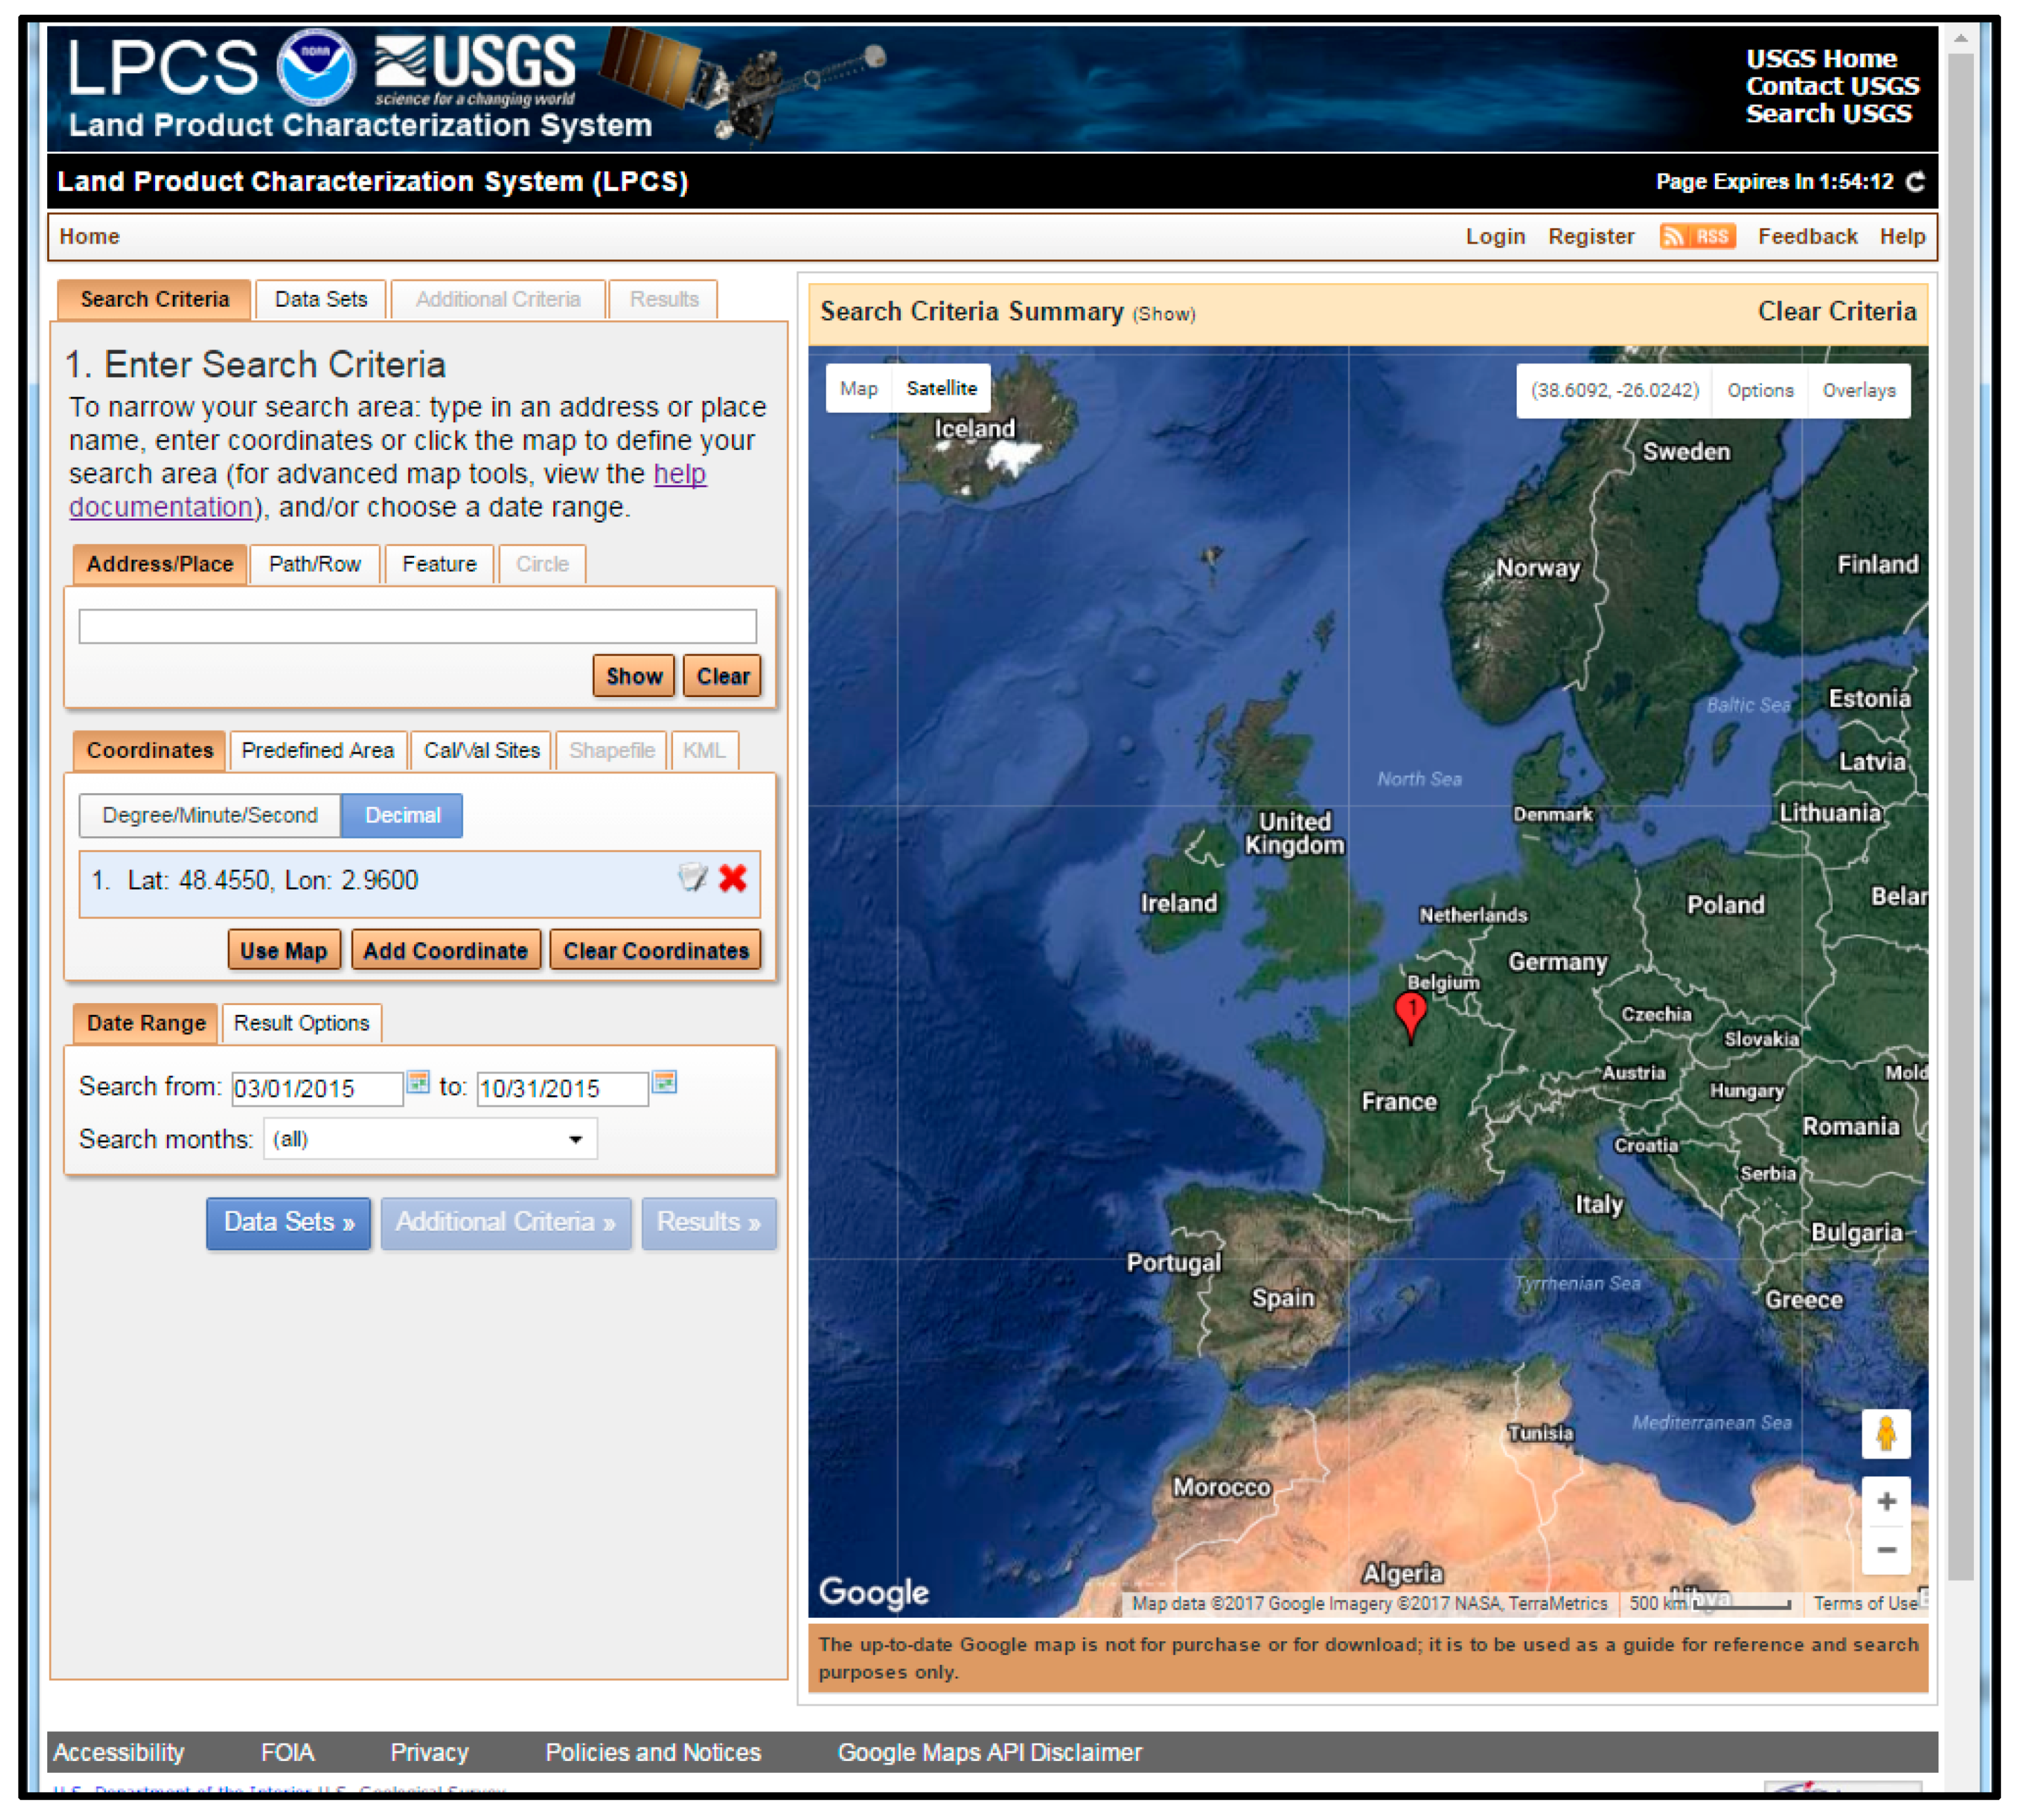
The LPCS data search and ordering functionality is facilitated through a web-based interface (Figure 2) that includes options for user-selected data sets and search criteria. Data may be searched by selection of the “Search Criteria” tab. Data searches are based on user input of address or place name (e.g., “Grand Morin, France”) or latitude and longitude coordinates. Search options also include predefined geographic areas, calibration/validation (Cal/Val) sites, and user-defined map-based point or area selection. A range of dates may be identified as well as specific months within a range of dates. The Grand Morin, France, an Earth Observing System Land Validation core site [9], was selected as an example for a search of available satellite sensor data from the searchable list of Cal/Val sites (Figure 2).
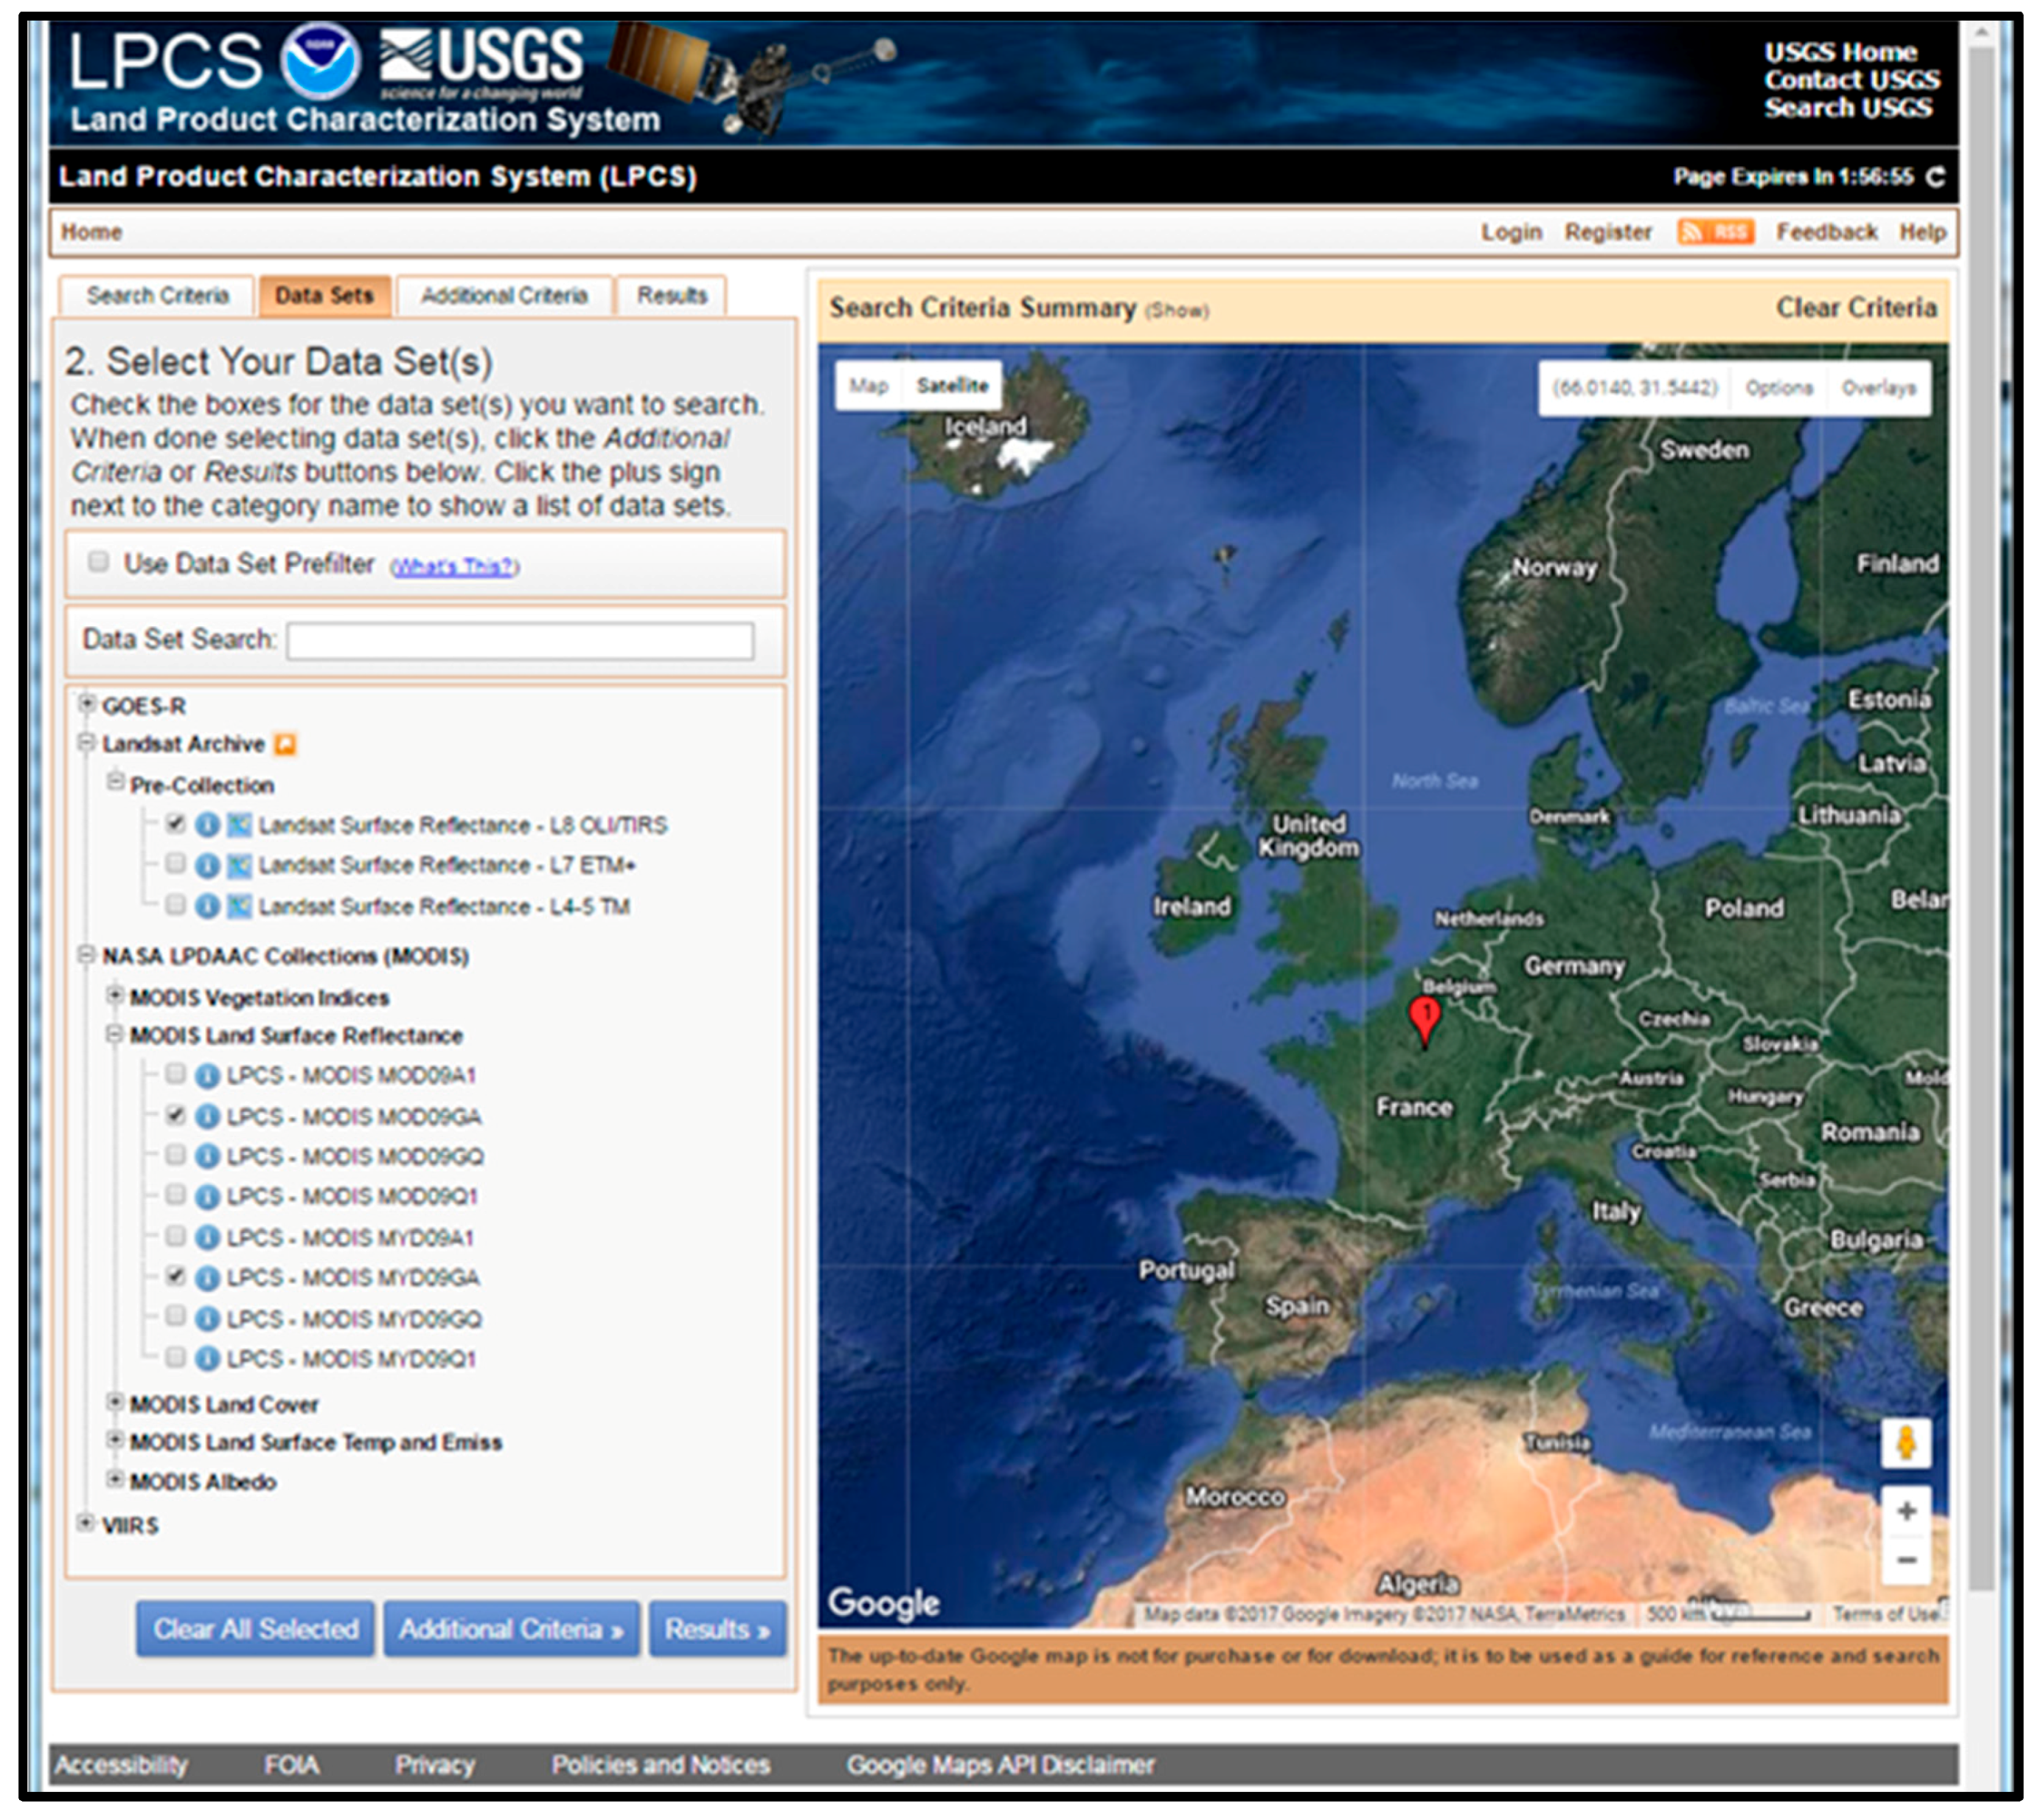
The selection of specific data sets for the dates and locations identified within the Search Criteria (Figure 2) is completed through the Data Sets page (Figure 3). Current data sets and products available (Table 1) include Landsat 4 through 8 Top of Atmosphere (TOA) and surface reflectance (SR), Terra and Aqua MODIS SR and vegetation indices, simulated GOES-16 ABI TOA normalized difference vegetation index, and several vegetation index examples from the VIIRS sensor. The LPCS data policy is to include the most recent version of publically distributed data and products available for each sensor. Currently available Landsat data includes Analysis Ready Data [10] and Collection 1 data [11]. MODIS Terra and Aqua data include Version 6 data [12].
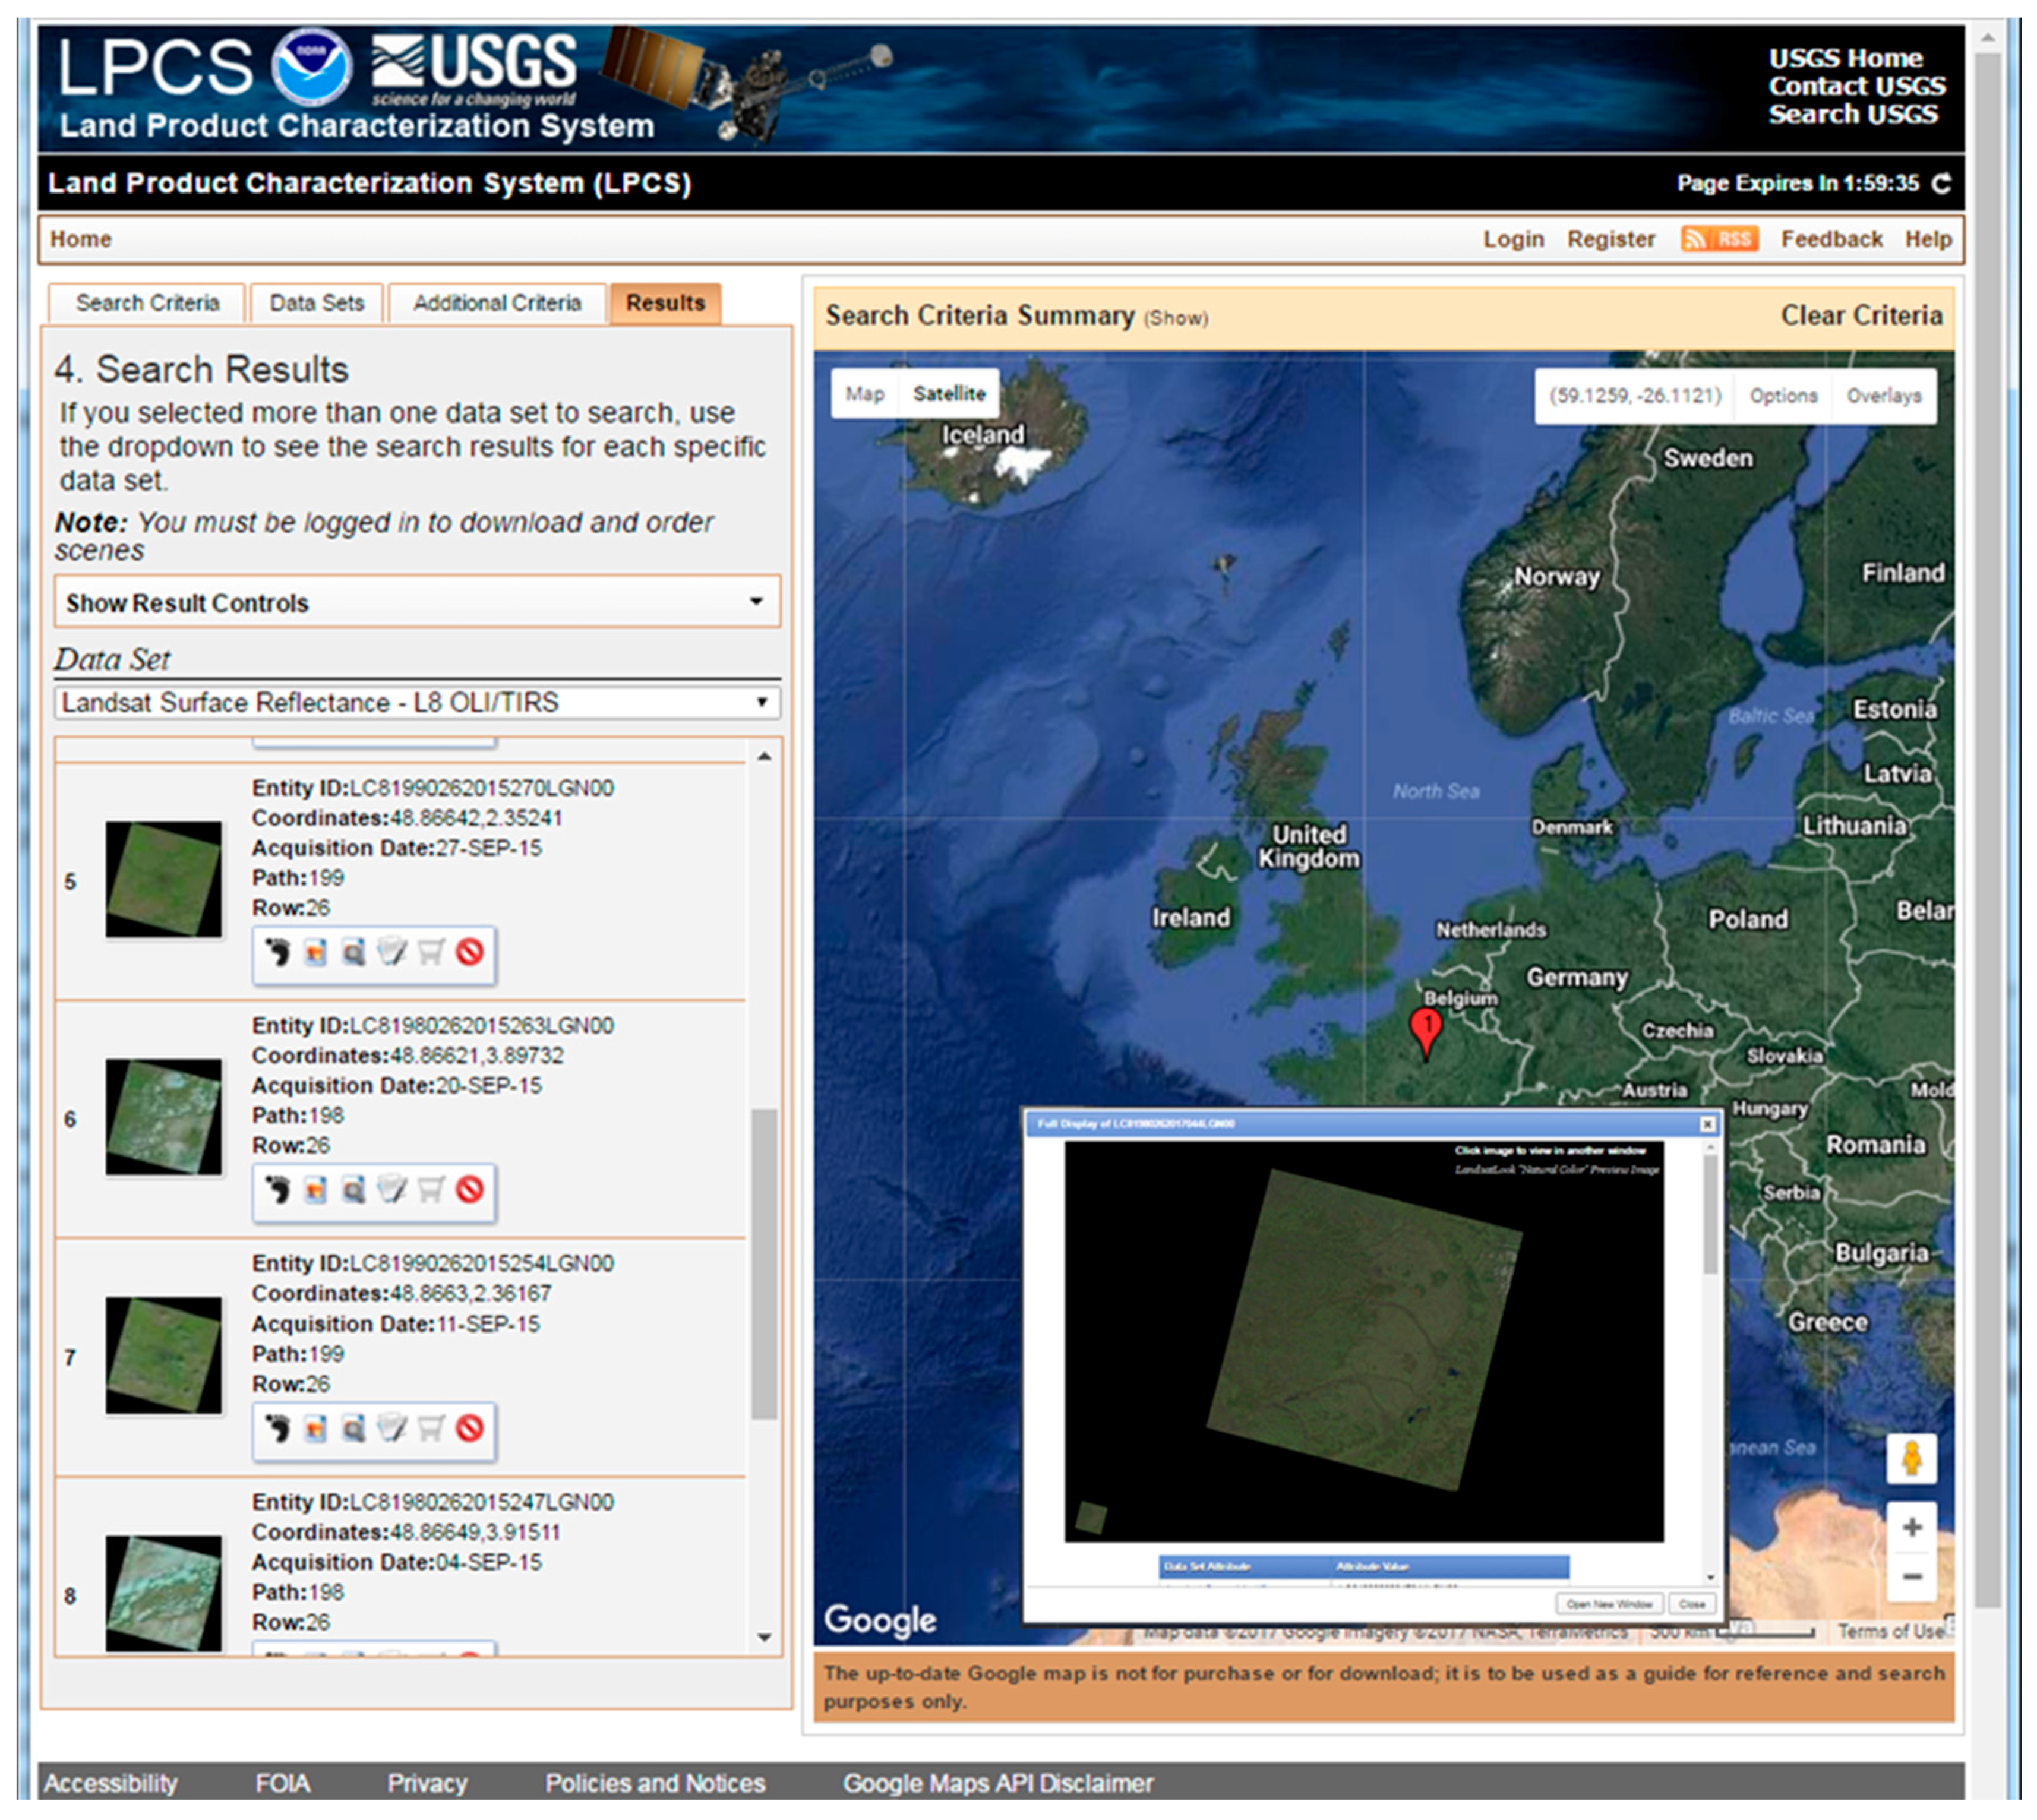
Once the search criteria options are entered and data sets selected, the search results are obtained through selection of the “Results” tab. Images of the selected data sets (when available) are displayed (Figure 4). Several options are available with each image displayed.
The options are selected from the icons (Figure 5) within the image description. The options include the image footprint, an enlarged display of the image (Figure 4), several other images for comparison, metadata, and options to preview the image in a separate window, order the scene (shopping cart), and exclude the scene from the results, respectively.
Scenes are selected for additional processing through selection of the shopping cart associated with the image options (Figure 5). Once scenes are ordered, the processing options are available. The processing options available include selection of the output map projection, the geographic extent of output images, the pixel size, the data resampling method, and the output data format of the ordered scenes (Table 2). The images are processed using the Earth Resources Observation and Science (EROS) Center Science Processing Architecture (ESPA) [13]. The Geospatial Data Abstraction Library (GDAL) [14] software is utilized for the image reprojection within the ESPA. Additional processing options include availability of figures that display general statistics (mean, standard deviation, minimum, and maximum values) for the selected scenes.
3. LPCS Output Products
The resulting output products include image products for all scenes selected, based on the selected processing options. Additionally, several summary tables and figures are produced based on the selected image processing options.
3.1. Image Products
Example data ordered for Grand Morin included Terra and Aqua MODIS, and Landsat-8 scenes. The Landsat-8 data include Bands 1–7, Band 9 (originally a 30 m spatial resolution), Band 8 (a 15 m resolution), and Bands 10 and 11 (a 100 m resolution). The Terra (MOD09GA) and Aqua (MYD09GA) MODIS product ordered includes data on Bands 1 and 2 (a 500 m spatial resolution). Based on a review of the cloud cover within the preview images (Figure 4), a total of 10 Landsat-8 scenes and 15 MODIS scenes were ordered.
Output image products were produced based on the selected options available (Table 2). The output images for Grand Morin were specified (Output Image Extent processing option) as a 54 (E-W) × 58 (N-S) km image area centered on the Grand Morin Cal/Val location. A 250 m pixel size (spatial resolution, e.g., Figure 6) was selected for the product output. The data were projected to an Albers Conical Equal Area projection with Nearest Neighbor option selected for resampling. The image data were output to a GeoTiff format. Data access is provided through an email message that includes a webpage where the data are available for download.
Landsat-8 data routinely processed through LPCS include top of atmosphere reflectance or temperature for Bands 1–11. Surface reflectance (Bands 1–7) and the normalized difference vegetation index (NDVI) are additional options offered for Landsat data selected for processing. The Band-5 (near-IR, 850 to 880 nm) surface reflectance products for the 10 Landsat-8 images ordered for the Grand Morin area are displayed in Figure 7.
A Landsat-8 near-IR image and similar MODIS Aqua and Terra images acquired on the same date (Day 110, 20 April 2015) are displayed in Figure 8. Since all images are mapped to a common projection and spatial resolution the images are readily available for additional comparative analyses. The images displayed in Figure 8, however, represent an example of the complexities of sensor intercomparisons. The coarseness in the appearance of the MODIS images is a result of relatively large sensor zenith angles for the MODIS Terra (mean sensor zenith angle = 55.7 degrees) and Aqua (57.2 degrees) images displayed (Figure 8). The sensor zenith angle information is routinely provided by LPCS for MODIS products.
3.2. Additional Output Data and Products
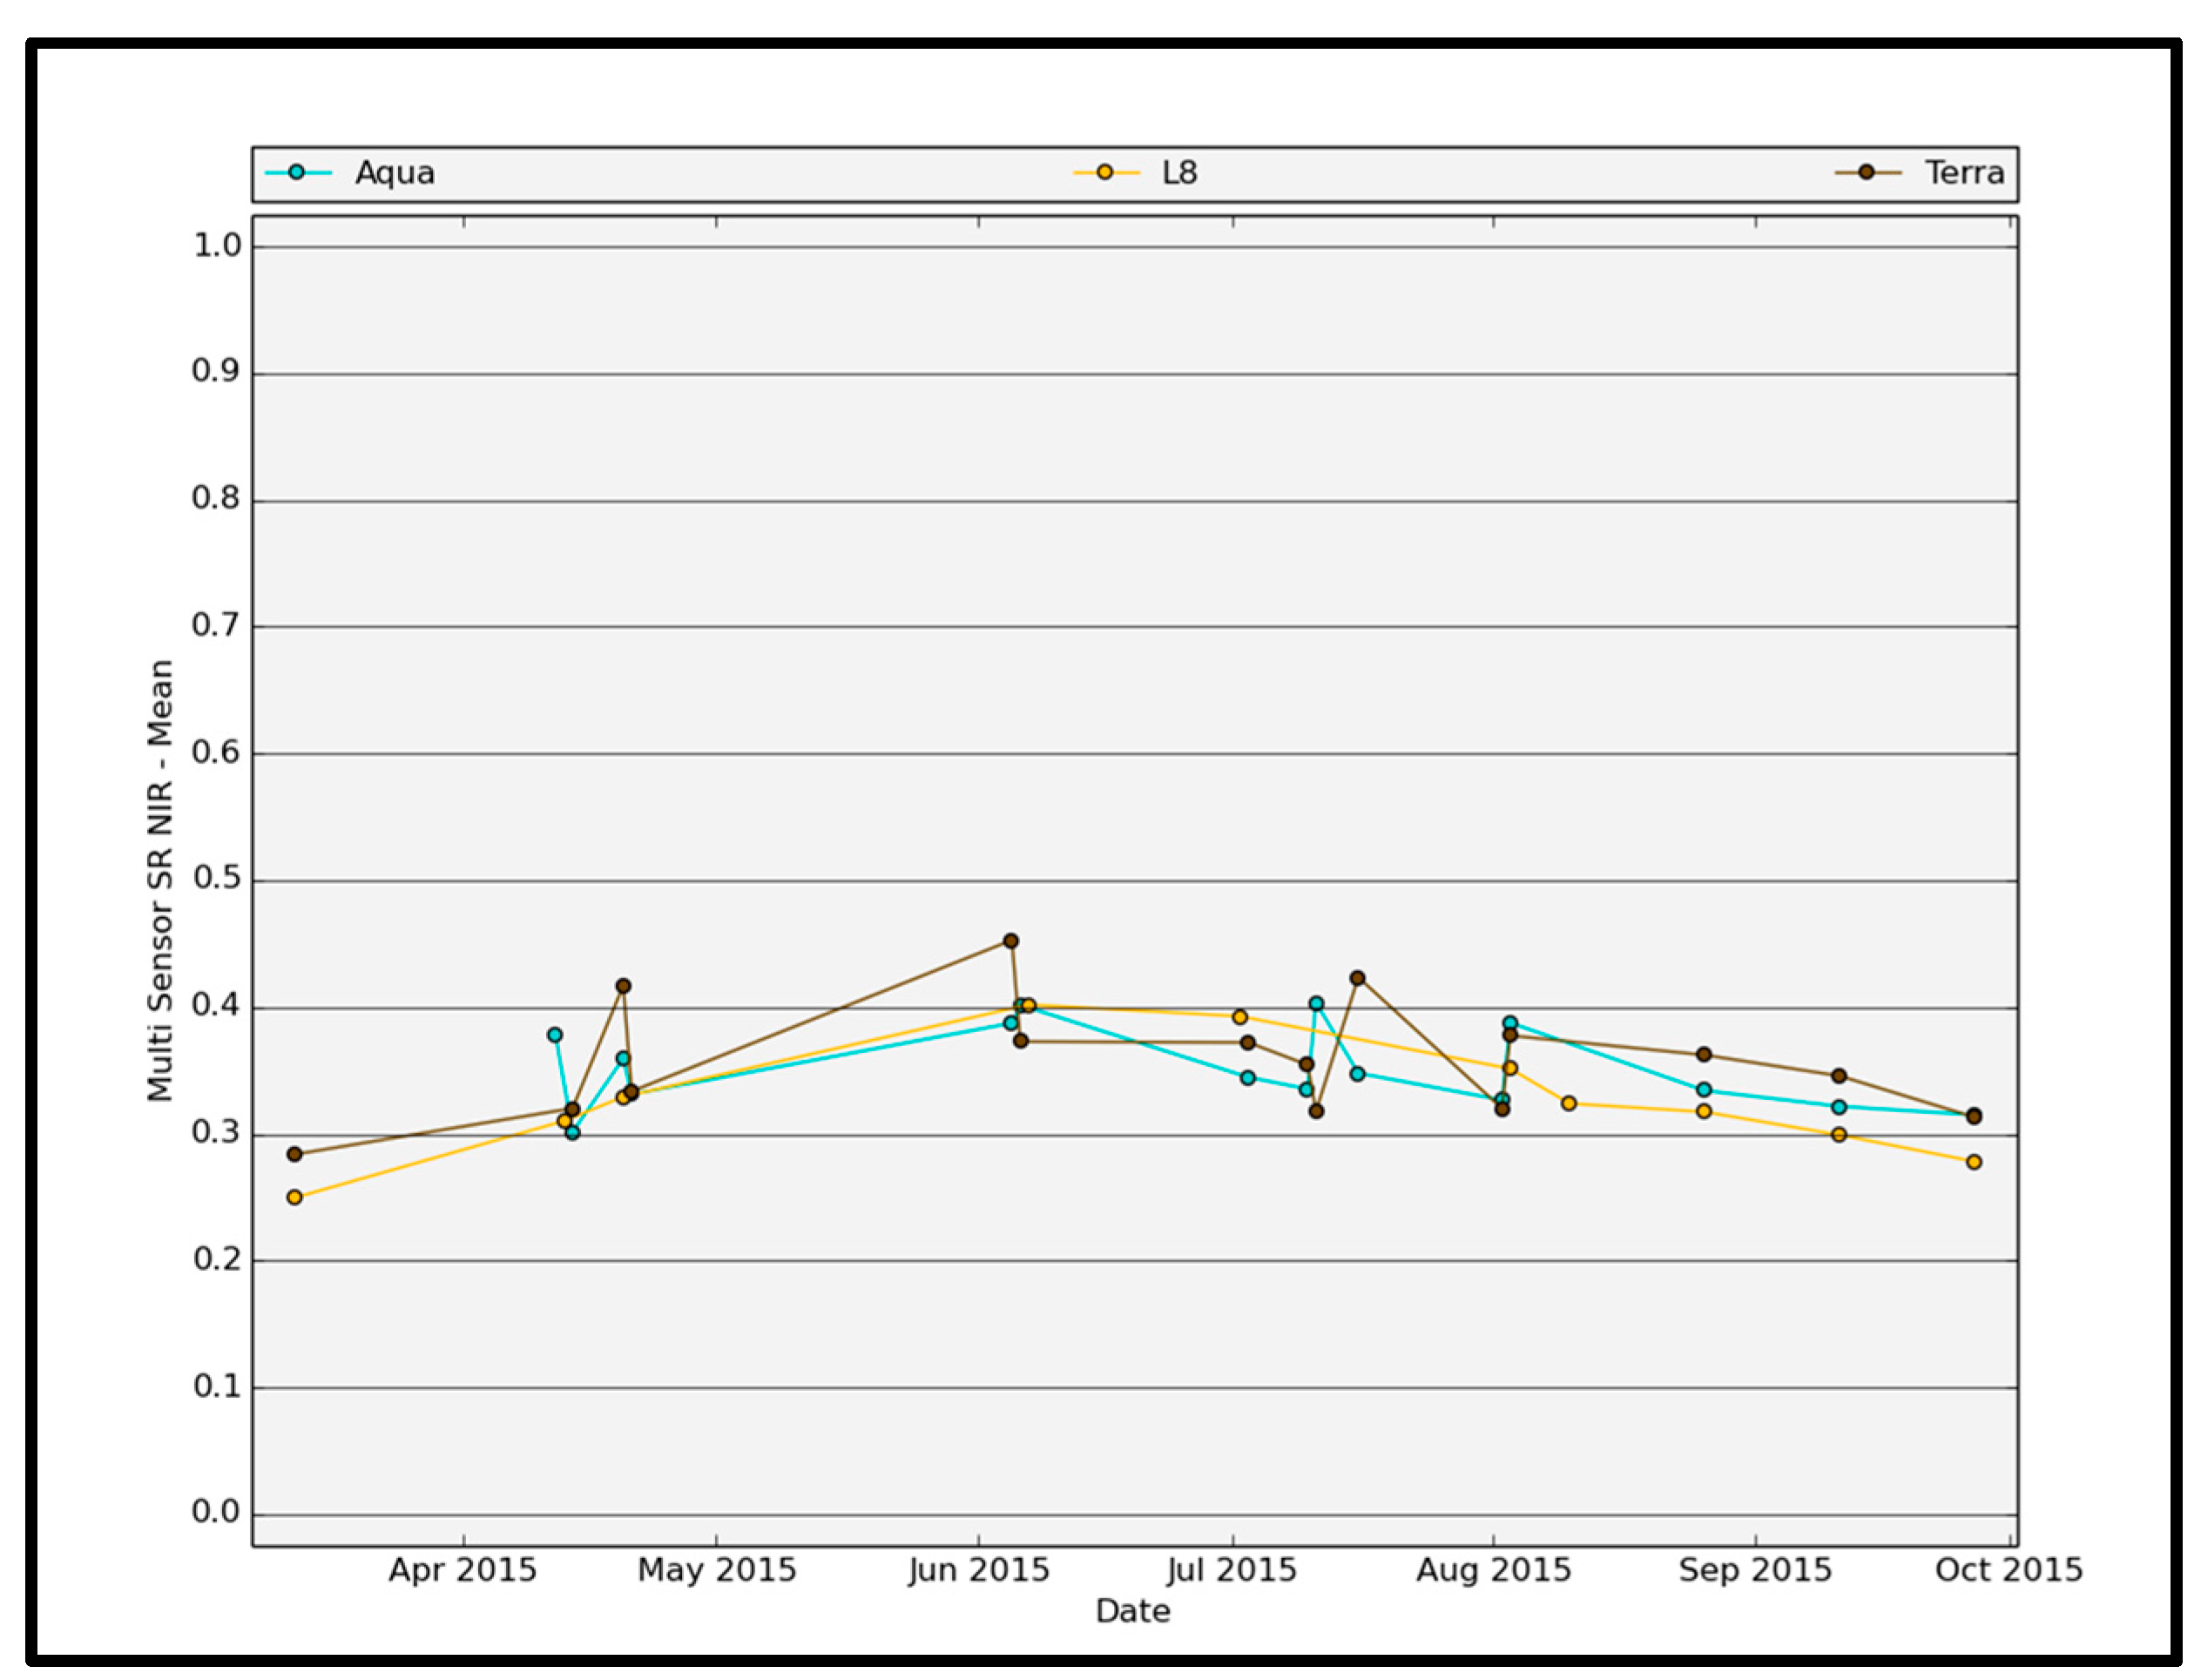
Time-series plots of data, based on the extent of the image defined in the processing options, are available for individual sensors or all sensors included in the LPCS order. The time-series of near-IR surface reflectance data for Grand Morin, for the Landsat-8, Aqua, and Terra MODIS sensors, is displayed in Figure 9. The figures are pre-defined and provided to allow users a relatively quick review of the data to determine whether anomalies are observed and whether more intensive analysis of the individual images provided for each sensor is required.
Tabular data, provided in a comma-separated value (CSV) format file, are additional output products of the LPCS. The summary data included in the file is based on the spatial extent of the image defined in the processing options and includes the raw data extracted from each of the image products ordered for each sensor. The summary data are available for most visible, near-IR, and short-wave near-IR bands of each sensor. The data files include the image acquisition date, and the minimum, maximum, mean, and standard deviation values for the sensor bands for the spatial extent of the output image selected from the available LPCS processing options (Table 2). The tabular data readily permits LPCS users to produce figures and charts in addition to those provided.
4. Future System Enhancements
Future planned enhancements to LPCS include additional higher-level land products (e.g., land surface temperature) and additional sensors (e.g., Sentinel-2, the Multispectal imager, and Sentinel-3, the Sea and Land Surface Temperature Radiometer, and the Ocean and Land Colour Instrument) as they become available. Enhancements also include the addition of in situ data (e.g., surface reflectance, NDVI, and land surface temperature) that would provide characterization information complementary to similar satellite sensor data and products.
As a result of internal and external reviews of LPCS, there are several functionality-related enhancements that are also planned which include automated mosaicking of adjacent images acquired on the same date, the optional application of product cloud masks if available, and additional data included within tabular files.
5. Conclusions
The Land Product Characterization System (LPCS) includes data search, inventory, access, and analysis functions that permit data to be easily identified, retrieved, co-registered, and compared statistically through a single interface. The LPCS currently includes access to 3943.6 TB of higher-level land data and products. The data and products currently available include those from Landsat 4 through 8, Terra and Aqua MODIS, Suomi National Polar-Orbiting Partnership (S-NPP)/Joint Polar Satellite System (JPSS) Visible Infrared Imaging Radiometer Suite (VIIRS), and simulated data for the GOES-16 Advanced Baseline Imager (ABI). In addition to future inclusion of in situ data and products from current sensor systems, the higher-level land products from the ESA Sentinel-2 and -3 series of satellites, and other high and medium spatial resolution sensors, will be included as available. When fully implemented, any of the sensor data or products included in the LPCS would be available to all individuals interested in validating space-based land products by comparing them with similar products available from other sensors or surface-based observations.
Acknowledgments
The LPCS was collaboratively developed by the National Oceanic and Atmospheric Administration (NOAA) and the U.S. Geological Survey (USGS) and supported by the NOAA GOES-R Program, the NOAA JPSS Algorithm and Data Products Program, and the USGS Land Remote Sensing Program. The assistance of Calli Jenkerson, Linda Owen, and Steven Foga with LPCS system development is acknowledged. The manuscript’s contents do not constitute a statement of policy, decision, or position on behalf of NOAA or the U.S. Government.
Author Contributions
Kevin Gallo is the NOAA LPCS Project Scientist and prepared the manuscript, Greg Stensaas is the USGS-EROS Remote Sensing Technologies Project Manager, John Dwyer is the USGS-EROS Chief of the Science and Applications Branch, and Ryan Longhenry is the USGS-EROS Long Term Archive Project Manager.
Conflicts of Interest
The authors declare no conflict of interest.
References
- Chander, G.; Hewison, T.; Fox, N.; Wu, X.; Xiong, X.; Blackwell, W. Overview of Intercalibration of satellite instruments. IEEE Trans. Geosci. Remote Sens. 2013, 51, 1056–1080. [Google Scholar] [CrossRef]
- GSICS Global Space-Based Inter-Calibration System. Available online: http//gsics.wmo.int/ (accessed on 16 March 2017).
- CEOS Working Group on Calibration and Validation (WGCV). Available online: http://ceos.org/ourwork/workinggroups/wgcv/ (accessed on 18 December 2017).
- CEOS Working Group on Calibration and Validation (WGCV) Land Product Validation (LPV) Subgroup. Available online: https://lpvs.gsfc.nasa.gov/ (accessed on 18 December 2017).
- NASA EOS Land Validation Core Sites. Available online: https://landval.gsfc.nasa.gov/coresite_gen.html/ (accessed on 18 December 2017).
- Weiss, M.; Baret, F.; Block, T.; Koetz, B.; Burini, A.; Scholze, B.; Lecharpentier, P.; Brockmann, C.; Fernandes, R.; Plummer, S.; et al. On Line Validation Exercise (OLIVE): A Web Based Service for the Validation of Medium Resolution Land Products. Application to FAPAR Products. Remote Sens. 2014, 6, 4190–4216. [Google Scholar] [CrossRef] [Green Version]
- Land Product Characterization System (LPCS). Available online: https://landsat.usgs.gov/lpcs (accessed on 21 March 2017).
- Open-Source Project for a Network Data Access Protocol. Available online: https://www.opendap.org/ (accessed on 18 December 2017).
- EOS Land Validation Core Sites, Grand Morin. Available online: https://landval.gsfc.nasa.gov/coresite.php?SiteID=73 (accessed on 27 December 2017).
- U.S. Landsat Analysis Ready Data (ARD). Available online: https://landsat.usgs.gov/ard (accessed on 14 December 2017).
- Landsat Collections. Available online: https://landsat.usgs.gov/landsat-collections (accessed on 14 December 2017).
- An Introduction to MODIS Version 6 Data. Available online: https://www.usgs.gov/media/videos/introduction-modis-version-6-data (accessed on 14 December 2017).
- Earth Resources Observation and Science (EROS) Center Science Processing Architecture (ESPA). Available online: https://landsat.usgs.gov/sites/default/files/documents/espa_odi_userguide.pdf (accessed on 18 December 2017).
- Geospatial Data Abstraction Library (GDAL). Available online: http://www.gdal.org/ (accessed on 18 December 2017).
Figure 1.
Example of general functionality within the Land Product Characterization System (LPCS) (https://landsat.usgs.gov/lpcs).
Figure 1.
Example of general functionality within the Land Product Characterization System (LPCS) (https://landsat.usgs.gov/lpcs).
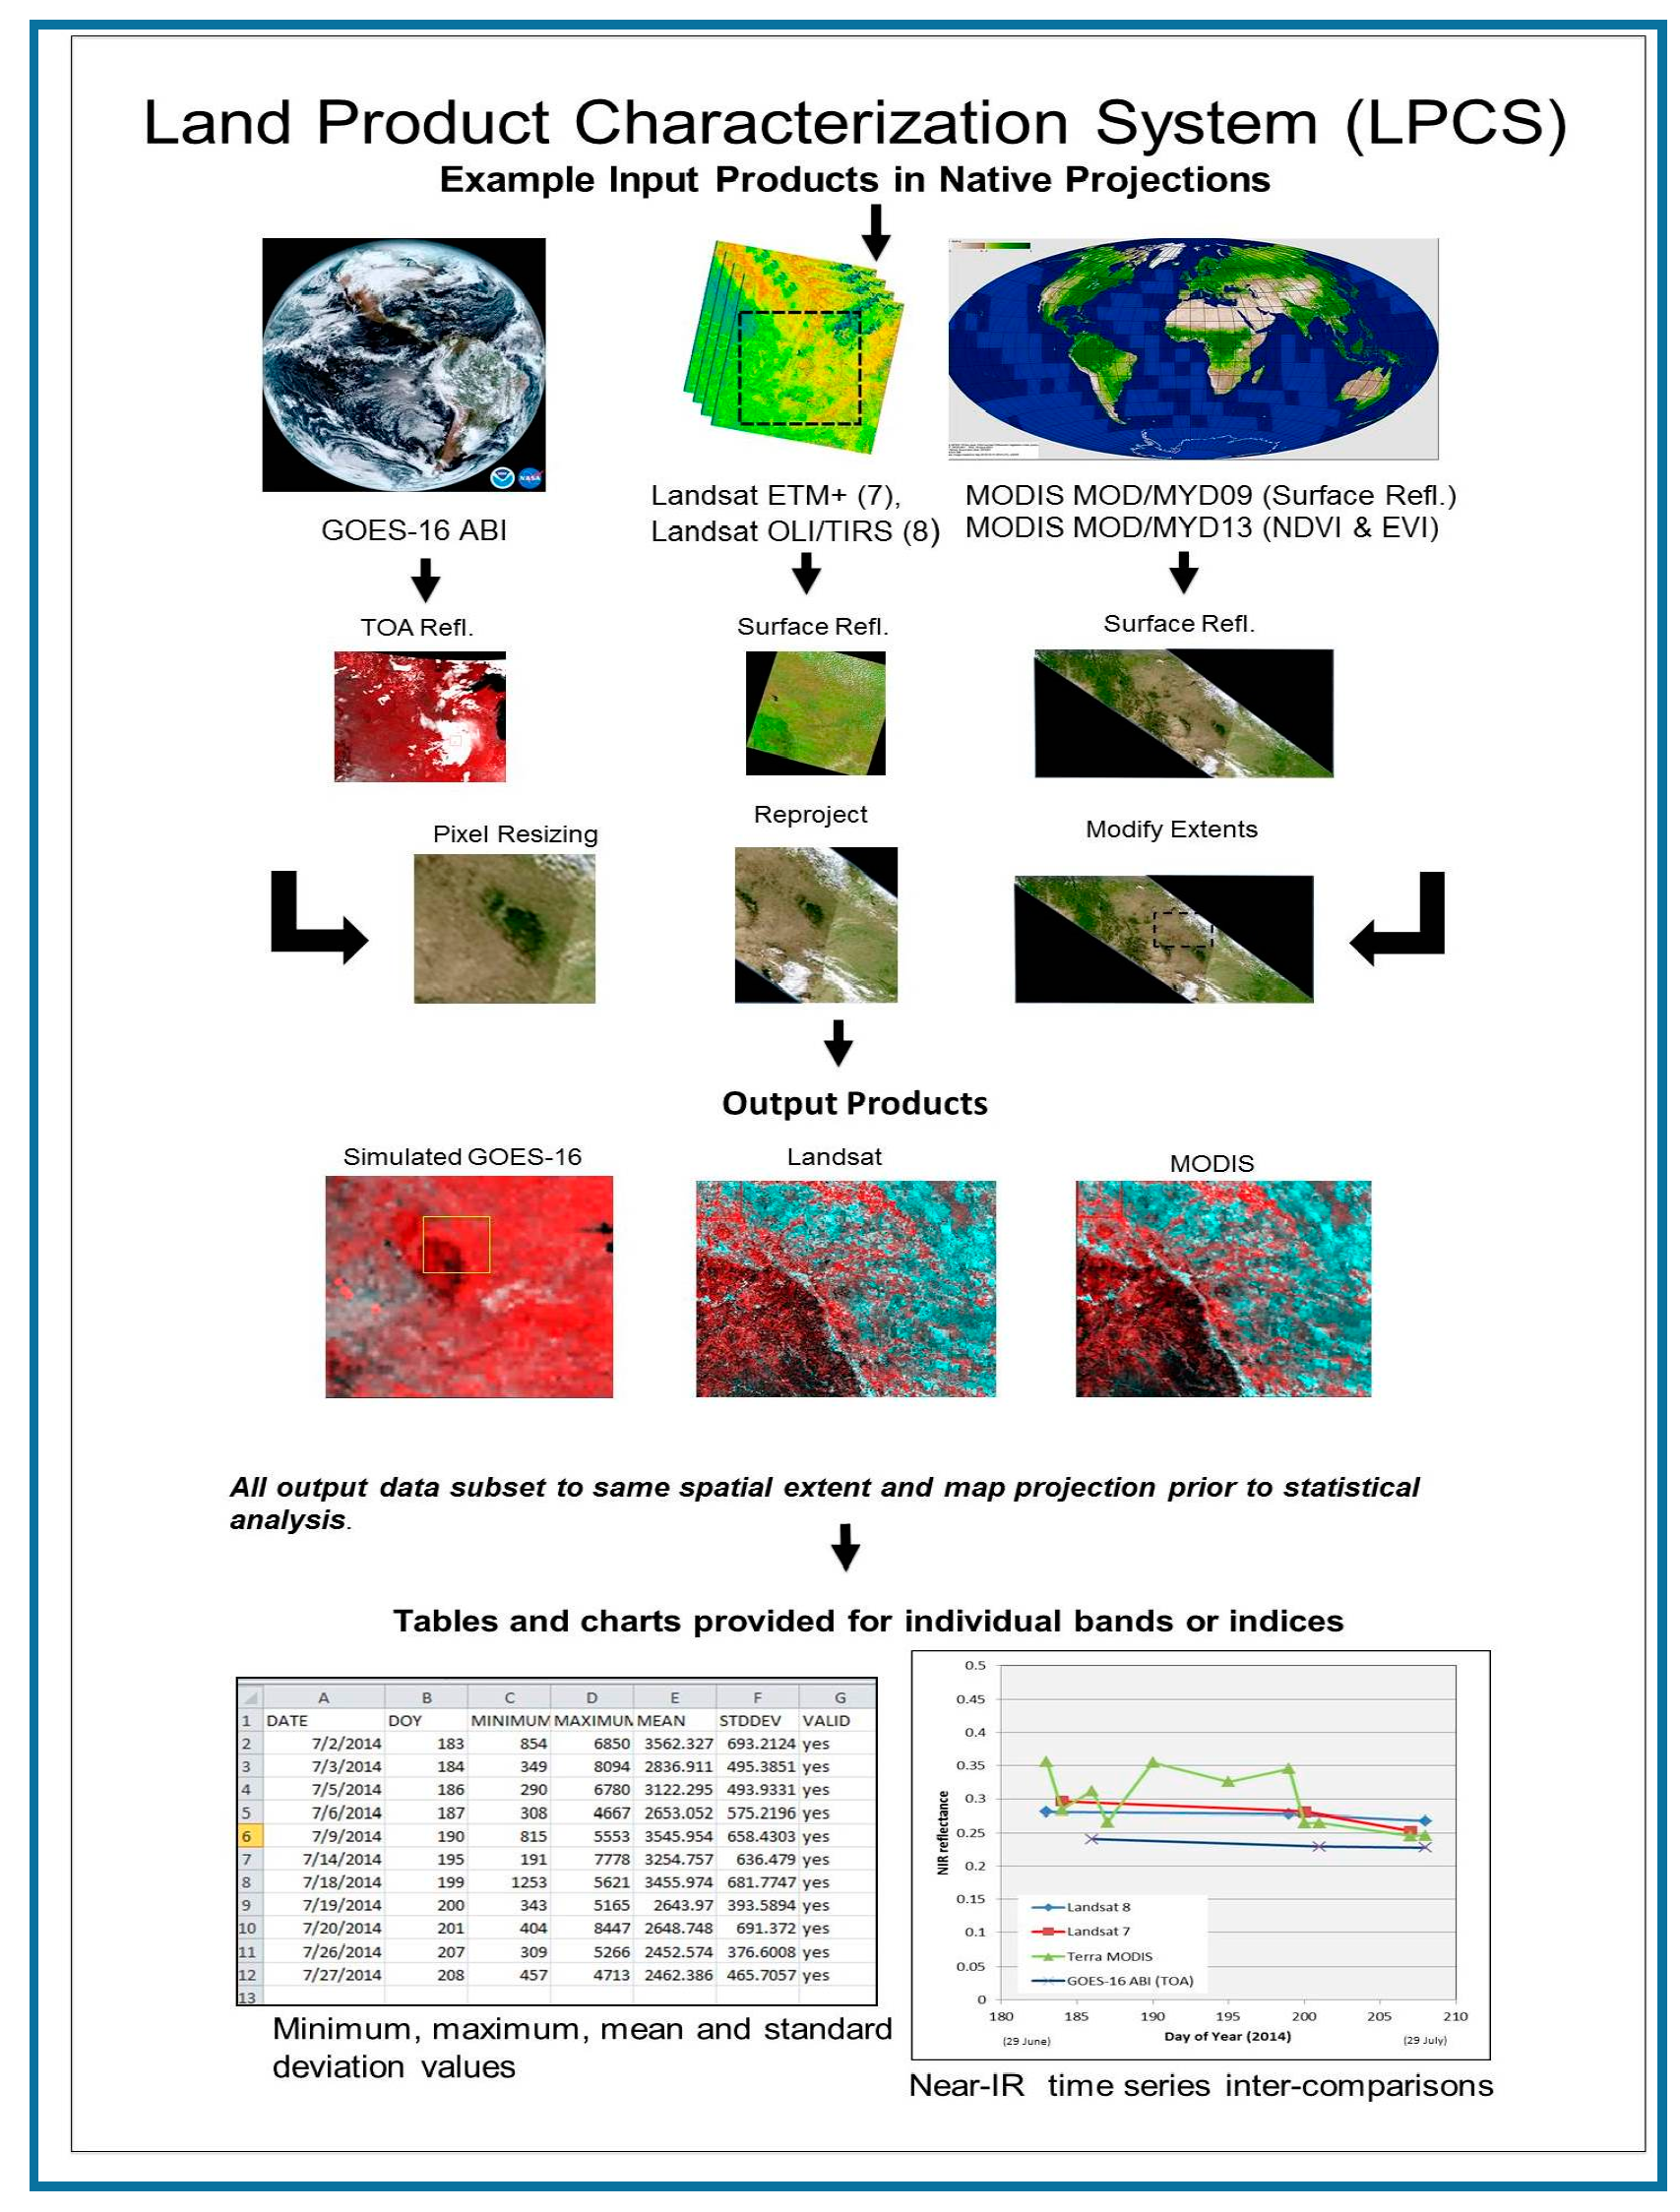
Figure 2.
Screenshot of the Search Criteria page.

Figure 3.
Screenshot of the Data Set selection page and current options.

Figure 4.
Screenshot of the Results page with an example of an enlarged preview image.

Figure 5.
Icons associated with image and scene options.
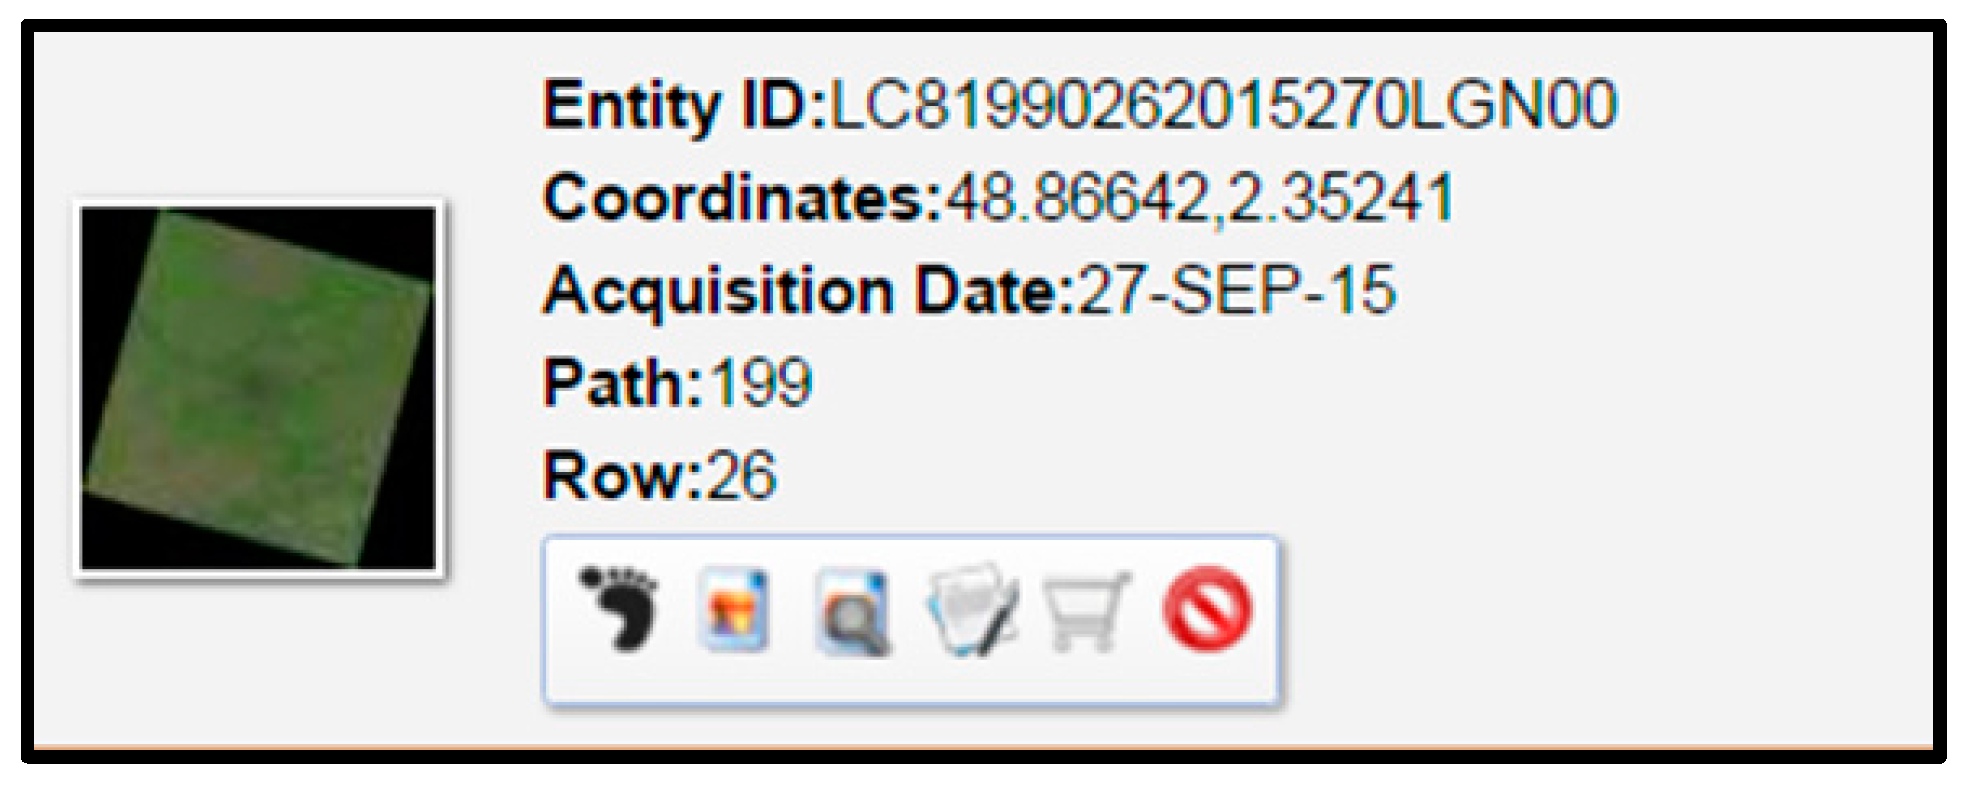
Figure 6.
Example of Landsat 8 image product (band 5) produced for Grand Morin Cal/Val location (day 110, 20 April 2015). The output image map projection (Albers Conical Equal Area), image extent, pixel size (250 m), geographic coordinates, and output format, are applicable to all images ordered with the same processing options (Table 2).
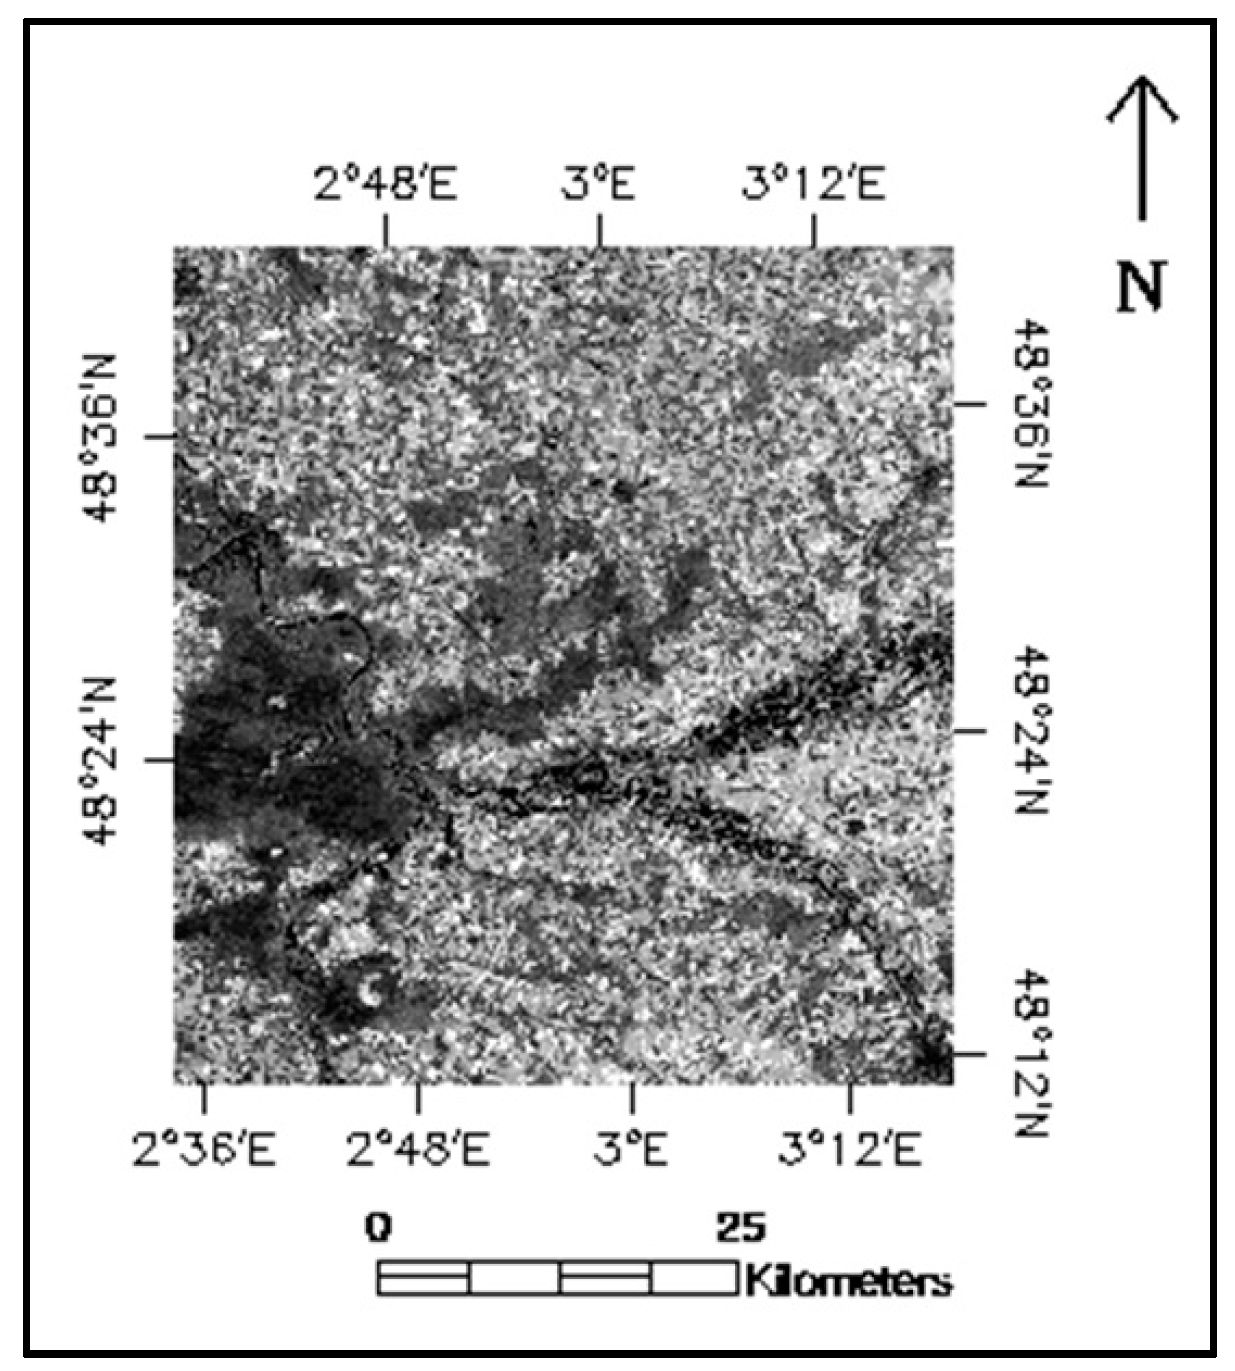
Figure 7.
Surface reflectance products for Band 5 of Landsat 8, acquired on Days 71, 103, 110, 158, 183, 215, 222, 238, 254, and 270 of 2015, respectively, for Grand Morin, France. Images were processed through LPCS with identical processing options. The image map coordinate information for each individual image is identical to those displayed in Figure 6.
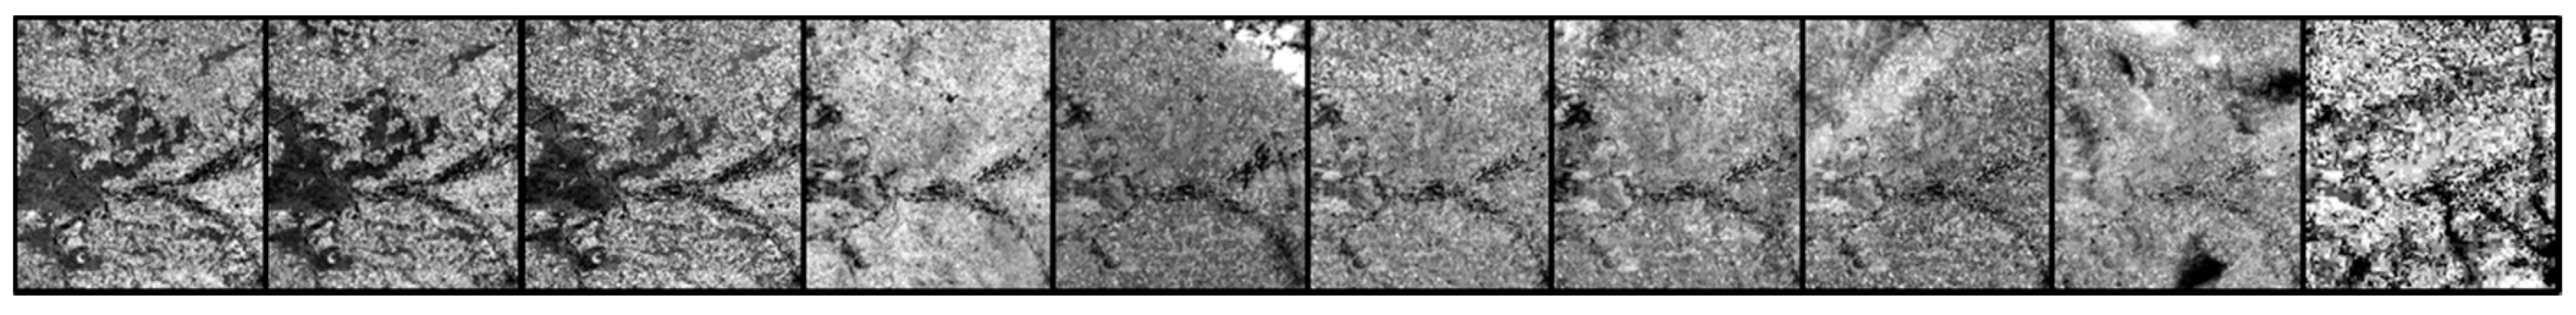
Figure 8.
Surface reflectance products for Band 5 (near-IR, 850 to 880 nm) of Landsat 8 (left image) and Band 2 (near-IR, 841 to 876 nm) of Terra (center) and Aqua (right) MODIS acquired on Day 110 (20 April 2015). Image map coordinates and processing options are identical to images displayed in Figure 6.

Figure 9.
Mean near-IR (NIR) Terra and Aqua MODIS, and Landsat 8 surface reflectance values for scenes selected for Grand Marin.
Figure 9.
Mean near-IR (NIR) Terra and Aqua MODIS, and Landsat 8 surface reflectance values for scenes selected for Grand Marin.


Table 1.
Current data sets included in the LPCS and available dates of data.
| LPCS Data Sets with Full Processing Available | Available Dates of Data |
| Landsat Surface Reflectance L4 TM Landsat Surface Reflectance L5 TM Landsat Surface Reflectance L7 ETM+ Landsat Surface Reflectance L8 OLI/TIRS Terra MODIS Surface Reflectance and Vegetation Indices (various products) Aqua MODIS Surface Reflectance and Vegetation Indices (various products) | July 1982 to December 1993 March 1984 to May 2012 July 1999 to present April 2013 to present February 2000 to present July 2002 to present |
| LPCS Data Sets with Limited Processing Capabilities | |
| GOES-R ABI Simulated TOA Vegetation Index VIIRS sample Vegetation Index MODIS annual Land Cover Type MODIS Albedo Terra MODIS Land Surface Temperature and Emissivity Aqua MODIS Land Surface Temperature and Emissivity | 31 May, 3 June, 26 June 2013 30 May to 29 June 2013 2001 to 2013 February 2000 to present March 2000 to present July 2002 to present |
Table 2.
Processing options available for scenes ordered within the LPCS.
| Map Projection Options Albers Equal Area, Universal Transverse Mercator, Geographic, Sinusoidal, Polar Stereographic |
| Output Image Extent Original scene extent (x and y size) can be modified to a reduced geographic area based on input of corner coordinates desired for output images |
| Pixel Resizing Options 30.0 to 5000.0 m |
| Data Resampling Method Nearest Neighbor, Bilinear Interpolation, Cubic Convolution |
| Output Format GeoTiff, ENVI, HDF-4(EOS2 version), NetCDF |
© 2017 by the authors. Licensee MDPI, Basel, Switzerland. This article is an open access article distributed under the terms and conditions of the Creative Commons Attribution (CC BY) license (http://creativecommons.org/licenses/by/4.0/).
Share and Cite
MDPI and ACS Style
Gallo, K.; Stensaas, G.; Dwyer, J.; Longhenry, R. A Land Product Characterization System for Comparative Analysis of Satellite Data and Products. Remote Sens. 2018, 10, 48. https://doi.org/10.3390/rs10010048
AMA Style
Gallo K, Stensaas G, Dwyer J, Longhenry R. A Land Product Characterization System for Comparative Analysis of Satellite Data and Products. Remote Sensing. 2018; 10(1):48. https://doi.org/10.3390/rs10010048
Chicago/Turabian StyleGallo, Kevin, Greg Stensaas, John Dwyer, and Ryan Longhenry. 2018. "A Land Product Characterization System for Comparative Analysis of Satellite Data and Products" Remote Sensing 10, no. 1: 48. https://doi.org/10.3390/rs10010048
Note that from the first issue of 2016, this journal uses article numbers instead of page numbers. See further details here.