Design of a Novel Spectral Albedometer for Validating the MODerate Resolution Imaging Spectroradiometer Spectral Albedo Product


1
The State Key Laboratory of Remote Sensing Science, Jointly Sponsored by Beijing Normal University and Institute of Remote Sensing and Digital Earth of Chinese Academy of Sciences, Beijing 100875, China
2
Beijing Engineering Research Center for Global Land Remote Sensing Products, Institute of Remote Sensing Science and Engineering, Faculty of Geographical Science, Beijing Normal University, Beijing 100875, China
3
Department of Geographical Sciences, University of Maryland, College Park, MD 20742, USA
*
Author to whom correspondence should be addressed.
Remote Sens. 2018, 10(1), 101; https://doi.org/10.3390/rs10010101
Submission received: 27 November 2017
/
Revised: 6 January 2018
/
Accepted: 10 January 2018
/
Published: 12 January 2018
(This article belongs to the Special Issue Advances in Quantitative Remote Sensing in China – In Memory of Prof. Xiaowen Li)
Abstract
:Land surface shortwave broadband albedo is a key parameter in general circulation models and surface energy budget models. Multispectral satellite data are typically used to generate broadband albedo products in a three-step process: atmospheric correction, for converting the top-of-atmosphere observations to surface directional reflectance; angular modeling, for converting the surface directional reflectance to spectral albedo of each individual band; and finally, narrowband-to-broadband conversion, for transforming the spectral albedos to broadband albedos. Spectroradiometers can be used for validating surface directional reflectance products and pyranometers or broadband albedometers, for validating broadband albedo products, but spectral albedo products are rarely validated using ground measurements. In this study, we designed a new type of albedometer that can measure spectral albedos. It consists of multiple interference filters and a silicon detector, for measuring irradiance from 400–1100 nm. The linearity of the sensors is 99%, and the designed albedometer exhibits consistency up to 0.993, with a widely-used commercial instrument. A field experiment for measuring spectral albedo of grassland using this new albedometer was conducted in Yudaokou, China and the measurements are used for validating the MODerate Resolution Imaging Spectroradiometer (MODIS) spectral albedos. The results show that the biases of the MODIS spectral albedos of the first four bands are −0.0094, 0.0065, 0.0159, and −0.0001, respectively. This new instrument provides an effective technique for validating spectral albedos of any satellite sensor in this spectral range, which is critical for improving satellite broadband albedo products.

1. Introduction
The land surface albedo is a key input parameter required in current general circulation models. It is relevant to radiation balance, atmospheric dynamics, and climate characteristics [1]. Accurate surface albedo estimates are a prerequisite for the accurate retrieval of other surface parameters [2,3,4]; an absolute accuracy of 0.02–0.05 is required for any effective climate modeling study [1]. Satellite remote sensing is the only feasible means to obtain reliable and accurate estimates of the global surface albedo [5,6]. An array of remote sensing surface albedo products exists [7,8,9,10,11]; the precise validation of these products is important because their accuracy is critical to the scientific community for various applications. Any feedback from the process of validation can also help improve the design, implementation, and very generation of these products [12].
The basic validation of remote sensing albedo products is primarily centered on the broadband products, which are compared directly against field measurements, using a combination of pyranometers or albedometers [2,13,14]. Consider the MODerate Resolution Imaging Spectroradiometer (MODIS) albedo product (MCD43) as an example—it includes three visible bands (460, 555, and 659 nm), four near-infrared bands (865, 1240, 1640, and 2130 nm), and three broadband albedos (visible, near-infrared, and shortwave). The broadband albedo products are linear combinations of the spectral albedos [15,16,17]. Most MODIS albedo product validation work involves comparing the three broadband albedos with field measurements, using broadband pyranometers and albedometers, but the spectral albedos are seldom validated. The band integration and band inconsistencies also create erroneous disparities between the remote sensing albedo products and field instruments, which are generally not taken into consideration, though they inevitably result in errors in the accuracy assessment.
In fact, in addition to broadband albedo products, spectral albedo products are also important for land energy budget research. There are many advantages to spectral albedo products, compared to broadband albedo products—they represent a more fine-tuned understanding of the land surface, for example, and they include more spectral information [18]. When they are retrieved directly from spectral observations, using a Bidirectional Reflectance Distribution Function (BRDF) model, the retrieval model can be accurately assessed by evaluating the spectral albedo product accuracy. Spectral albedos are also critical for the retrieval of other land surface parameters. Cheng and Liang [19] used the MODIS spectral albedo product to estimate thermal-infrared emissivity, where the accuracy of the spectral albedo is critical to the final estimation. Picard, Libois [18] also used spectral albedo measurements to accurately estimate a near-surface snow specific surface area.
However, the scarcity (or absence) of spectral albedometers means that spectral albedo products have not yet been effectively validated. In recent years, researchers have sought various methods to remedy this. Wuttke, Seckmeyer [20] used a scanning spectroradiometer with a shaped Teflon diffuser to conduct spectral albedo measurements, in order to describe Antarctic radiation conditions. Wright, Bergin [21] compared independent MODIS spectral to high resolution spectral measurements in Greenland with an Analytical Spectral Device (ASD) Fieldspec Pro spectroradiometer, using ASD Remote Cosine Receptor (RCR) foreoptics. Similar measurements were gathered in Antarctica [22,23,24]. The use of spectroradiometers with the Cosine Receptor allows scientists to obtain accurate narrow band albedos; however, this is time- and labor-consuming and does not yield the time series observations which are vital for long-term climate change research. Spectrometers can also be used to measure spectral albedo, by integration over the BRF. They may even more accurate than measuring with albedometers, but apply only to smaller areas.
To this effect, there is urgent demand for a new instrument, which can directly observe spectral albedo in supplying time series observations. Our goal in conducting the present study was to design and validate the performance of a set of automatic spectral albedometers. In the pursuit of this goal, we also established a novel method to directly obtain spectral albedo time series measurements. We used a customized interference filter and silicon detector to realize the spectral albedo detection of MODIS’s visible bands (460, 555, and 659 nm) and near-infrared band (865 nm). The system design and materials used are introduced in Section 2, and the experiments performed indoors and on a grassland site in Yudaokou, China, are discussed in Section 3. Section 4 reports our results, and Section 5 provides concluding remarks.
2. Spectral Albedometer Design
2.1. Theoretical Foundation
The broadband land surface albedo is the ratio of the amount of radiation traveling upwards and downwards from the Earth’s surface [1]. It serves as an indicator of the energy capacity for surface reflection over the entire shortwave spectral range. In contrast, the spectral albedo depicts the capacity for reflection of the land surface over a smaller, specific spectral range [25]. To obtain the latter, it is necessary to measure the upward and downward irradiance over the desired spectral range. According to the definition of the surface albedo, the spectral albedo is obtained by Equation (1)
where λ is a typical spectra, from wavelength to ; and are the hemispherical incidence and exitance in the λ band, which are functions of radiation energy and the spectral response of the sensors.
where Iλ is the incident irradiance of the sensor and fi is the spectral response function. We designed a MODIS-corresponding spectral albedometer in this study, so is the spectral response function of the MODIS bands.
2.2. Spectral Albedometer Design
Two sensors were included in each spectral albedometer: one upwards and one downwards. The upwards sensor was used to measure downwelling radiation ( in Equation (1)), and the downwards sensor was used to measure the upwelling radiation ( in Equation (1)). The spectral albedometer structure is shown in Figure 1. The spectral albedometer for each band consists of a shell, mounting stem, two domes, and two sensors.
The upwards and downwards sensors are the same for each albedometer; each is composed of a cosine corrector, filter, photoelectric detector, and signal output port (Figure 2).
2.2.1. Dome and Cosine Corrector
A customized quartz glass dome was designed, according to the sensor’s size and installed, to protect the probe against intrusions from the external environment. The dome was fixed to the up and down surfaces of the sensor with O-rings to ensure it was waterproof and easy to replace. The dome mainly serves to isolate the radiometer from long wave radiation [26]. Here, all sensors take into account only the MODIS bands with wavelengths <1100 nm, so the glass cover in our design mainly protects the sensor [20].
The accuracy of the radiation detection sensor is affected by many factors, including the incidence angle, equipment temperature, equipment installation inclination, proportion of direct light, and degree of linearity in the sensor’s response [27]. We used polytetrafluoroethylene (TeflonTM) as a cosine corrector, to minimize the effects of incidence angle on observation accuracy. Its optical properties remain constant over a wide range of wavelengths, from UV up to near-infrared, and it is widely used for radiation sensor cosine correction [28,29,30]. Light transmitted through the diffuser radiates, according to Lambert’s cosine law. The cosine corrector, which has a thickness of 5 mm and diameter of 14 mm, was manufactured at the photoelectric instrument factory of Beijing Normal University. The designed thickness was tested to ensure it had the optimal cosine response [30].
2.2.2. Interference Filter
We used an interference filter, customized to the MODIS band spectral response function, to guarantee the consistency in the detected wavelength range. This allowed us to obtain the upwards and downwards incident radiation in the same range as the MODIS band, and thus obtain the spectral albedo using Equation (1). The interference filter is a high-precision band-pass filter, commonly included in optical sensors [31,32]. It is possible to obtain the maximum transmittance of light in the required spectral bands by using the interference effect of dielectric and metallic multi-layers, while light beyond the band range is totally blocked. We used the first four bands of MODIS as an example and designed the interference filter according to the MODIS band by setting the filter transmittance to be identical to the MODIS spectral response function value. The central wavelength and full width at half maximum (FWHM) of the first four MODIS bands is provided in Table 1.
2.2.3. Silicon Photoelectric Detector
Incident light passing through the interference filters was detected with a silicon photoelectric detector, installed directly behind the filter, which was then converted into a current signal that was proportional to the incident irradiance (W/m2). The silicon photoelectric detector has high sensitivity, a wide spectral response, and strong stability; it is widely used in optical instrumentation [27,33]. The 2DU10 photoelectric detector was purchased from Shenzhen Jeking Micro Electronic Technology Co., Ltd., (Shenzhen, China) and has a very large sensitivity area of 100 mm2 and a high photo-responsivity of 0.55 A/W; its operating temperature range is also very wide, from −20 to +60 °C, and it can measure radiation in a wavelength range from 320 to 1100 nm. The proposed spectral albedometer design is shown in Figure 3.
The output signal of the photoelectric detector is a current, which is directly proportional to the incident radiance determined by the sensitivity area and photo responsivity. Thus, for a downward radiance of 1000 W/m2, the output current is:
We used a two-stage amplifying circuit to preserve the accuracy of the output signal. The output current was first amplified with a high precision amplifier (ICL7650SCPDZ) manufactured by Intersil Americas incorporated company (Milpitas, CA, USA). A 1.5 KΩ resistor was connected to the ICL7650SCPDZ amplifier to reduce the DC error, and a 1000 pf capacitor was connected parallel to the resistor as a filter condenser to stabilize the signal. The second-stage amplifier is a wide bandwidth single Junction Field-effect Transistor (JFET) operational amplifier (LF351) manufactured by Fairchild Semiconductor Corporation (Phoenix, AZ, USA), which we connected in its typical configuration. We used an isolation transmitter (ISO-U8-P3-O4) purchased from Anfu century electronics limited company (Shenzhen, China) to detect the sensor’s signal transceiver and collected the output with a data logger. For ease of operation, we installed the amplifying circuit alongside the data logger and data transfer system with a single power supply. The amplifying circuit in this design is operational, but not unique. The data, as-collected, were transferred back to a local computer, via the General Packet Radio Service (GPRS) network.
3. Results
3.1. Interference Filter Transmittance
To ensure that the radiation obtained by the sensor is comparable to that measured by the MODIS sensor, the interference filters must have transmittance equal to the MODIS band spectral response function value. Filter transmittance characterization was carried out at the State Key Laboratory of Remote Sensing Science, Beijing Normal University. The field spectroradiometer SVC-HR1024 came from the Spectra Vista Corporation (New York, NY, USA) and the LI-COR1800 integrating sphere came from LI-COR (Lincoln, NE, USA). The spectral resolution of SVC-HR1024 exceeds 3.5 nm in the 300–1000 nm range, which can satisfactorily describe the spectral variation characteristics of surface features. The integrating sphere was equipped with a standard halogen lamp. To measure the filter transmittance, first, source light was injected directly into the integrating sphere and measured. Next, the filter was carefully placed onto a sample stage in the integrating sphere using clean tweezers and light was shined into the integrating sphere through the filter. We then measured the intensity of the transmitted light and calculated the filter transmittance, according to Equation (4):
where is the filter transmittance; I and are the direct light intensity and light intensity through the filter, respectively (i.e., the digital number values in the experiment), and λ is the band wavelength.
The band consistency of the proposed albedometer with the MODIS sensors is the premise of the direct validation of the spectral albedo product. Figure 4 shows a comparison of the filter transmittance and MODIS band response function value for each band. As shown in Figure 4, the customized interference filter transmittance has close consistency with the MODIS band response function. Table 2 shows the key indicators of center wavelength and FWHM of the customized interference. In comparison to the values shown in Table 1, the customized interference filter has the same center wavelength of each band as the MODIS band, and the FWHMs are nearly the same; deviations range from 1–5 nm, which is about 5.0–10.0% of the FWHM.
3.2. Calibration
Theoretically, it is only necessary to ensure the consistency of the upwards and downwards sensors to obtain an accurate albedo measurement. That is, it is only necessary to make relative radiometric calibrations of the sensor. In this study, we carried out absolute calibrations of the sensor, in order to verify the spectral net radiation measurement at the same time: (1) we ensured the upward and downward sensors were consistent with each other; and (2) we obtained the absolute radiation and net radiation corresponding to each band. The sensors were subjected to absolute radiation calibration at the photoelectric instrument factory in Beijing Normal University, where the light source system and standard radiometer used for calibration were a standard source transferred from the National Institute of Metrology (NIM).
A standard radiometer is often used as a reference for general broadband radiometer calibration. First, we put the standard radiometer under standard light and read the standard radiometer value (), then we removed the standard radiometer and put the detector to be calibrated at the same position. The distance between the detector and the standard light source was kept identical to the standard radiometer and light source. We recorded the current readings () of the detector sensor to be calibrated, then turned the downward detector upwards and recorded the current readings () of the other side of the detector sensor to be calibrated with the same method. We changed the light intensity several times and obtained the corresponding readings of the standard radiometer and the to-be-calibrated sensors (). We obtained the calibration coefficients of both sensors by respectively fitting and .
A large disparity emerged in the band response range between the standard radiometer and the spectral albedometer when calibrating the spectral albedometer, so we used a spectral radiometer to calibrate the spectral albedometer instead of a broadband standard radiometer. The RAYSPHERE spectrum radiation meter (American Ocean Optics Company, Dunedin, FL, USA) can measure 350–1100 nm spectral irradiance with 1.9 nm spectral resolution. The total irradiance of a given band can be calculated using Equation (2), according to the band response functions of the sensors to be calibrated. The correction coefficient of the upwards and downwards sensors were obtained via the same stepwise process as the broadband sensor calibration. The calibration results are shown in Figure 5.
The linearity of a given sensor is a key specification of the instrument. We calibrated a total of 80 sensors to quantify the linearity of the selected sensors with five different light intensities: 0, 250, 500, 750, and 1000 W/m2 for the broadband range (300–1100 nm). The spectral light intensities of each band were measured with the RAYSPHERE spectrum radiation meter, described above, and integrated using Equation (2). The worst-fitting line of the sensor, corresponding to MODIS band 1, is shown in Figure 6.
The sensor’s reading had a very close linear correlation with the incoming light intensity. The coefficient of determination (R2) was calculated to be 0.9996, which indicates that the linearity of the sensor is very good. We used the non-linear error (Equation (5)) to quantify the linearity of all the sensors:
where δ is the nonlinearity of the sensor (non-dimensional), is the maximum deviation between the actual response curve and the fitting line, and and are the maximum and minimum response values, respectively.
Again, we calibrated 80 sensors in total. Figure 7 shows a nonlinearity histogram of the sensor calibration results, where more than 40% of the sensors are absolutely linear and 78% of the sensors have a linearity better than 99.9% (non-linear error less than 0.001). All of the sensors have linearity exceeding 99%, which fully satisfies the detection requirements.
Figure 8 shows the coefficients of determination of the linear fitting of the calibration results, which exceed 0.999 for all of the sensors we tested.
3.3. Comparison with Commercial Instrument
The designed albedometer was then compared with the widely-used commercial instrument CNR4 net radiometer from Kipp & Zonen, Delft, The Netherlands [34]. The CNR4 net radiometer consists of two pyranometers for measuring downward and upward solar shortwave radiation, and two pyrgeometers for measuring upward and downward thermal longwave radiation. The designed albedometer was mounted alongside the CNR4 radiometer at the same height. Downward radiation was collected from 6:00 hr to 16:00 hr on 19 June 2014. Figure 9 shows a comparison of band radiation against the CNR4 pyranometers’ measurements. The spectral albedometer measurement has close consistency with the CNR4 measurement, with coefficients of determination of 0.9966 for the 465 nm sensor, 0.9979 for the 550 nm sensor, 0.9984 for the 650 nm sensor, and 0.993 for the 860 nm sensor, respectively.
3.4. MODIS Spectral Albedo Product Validation
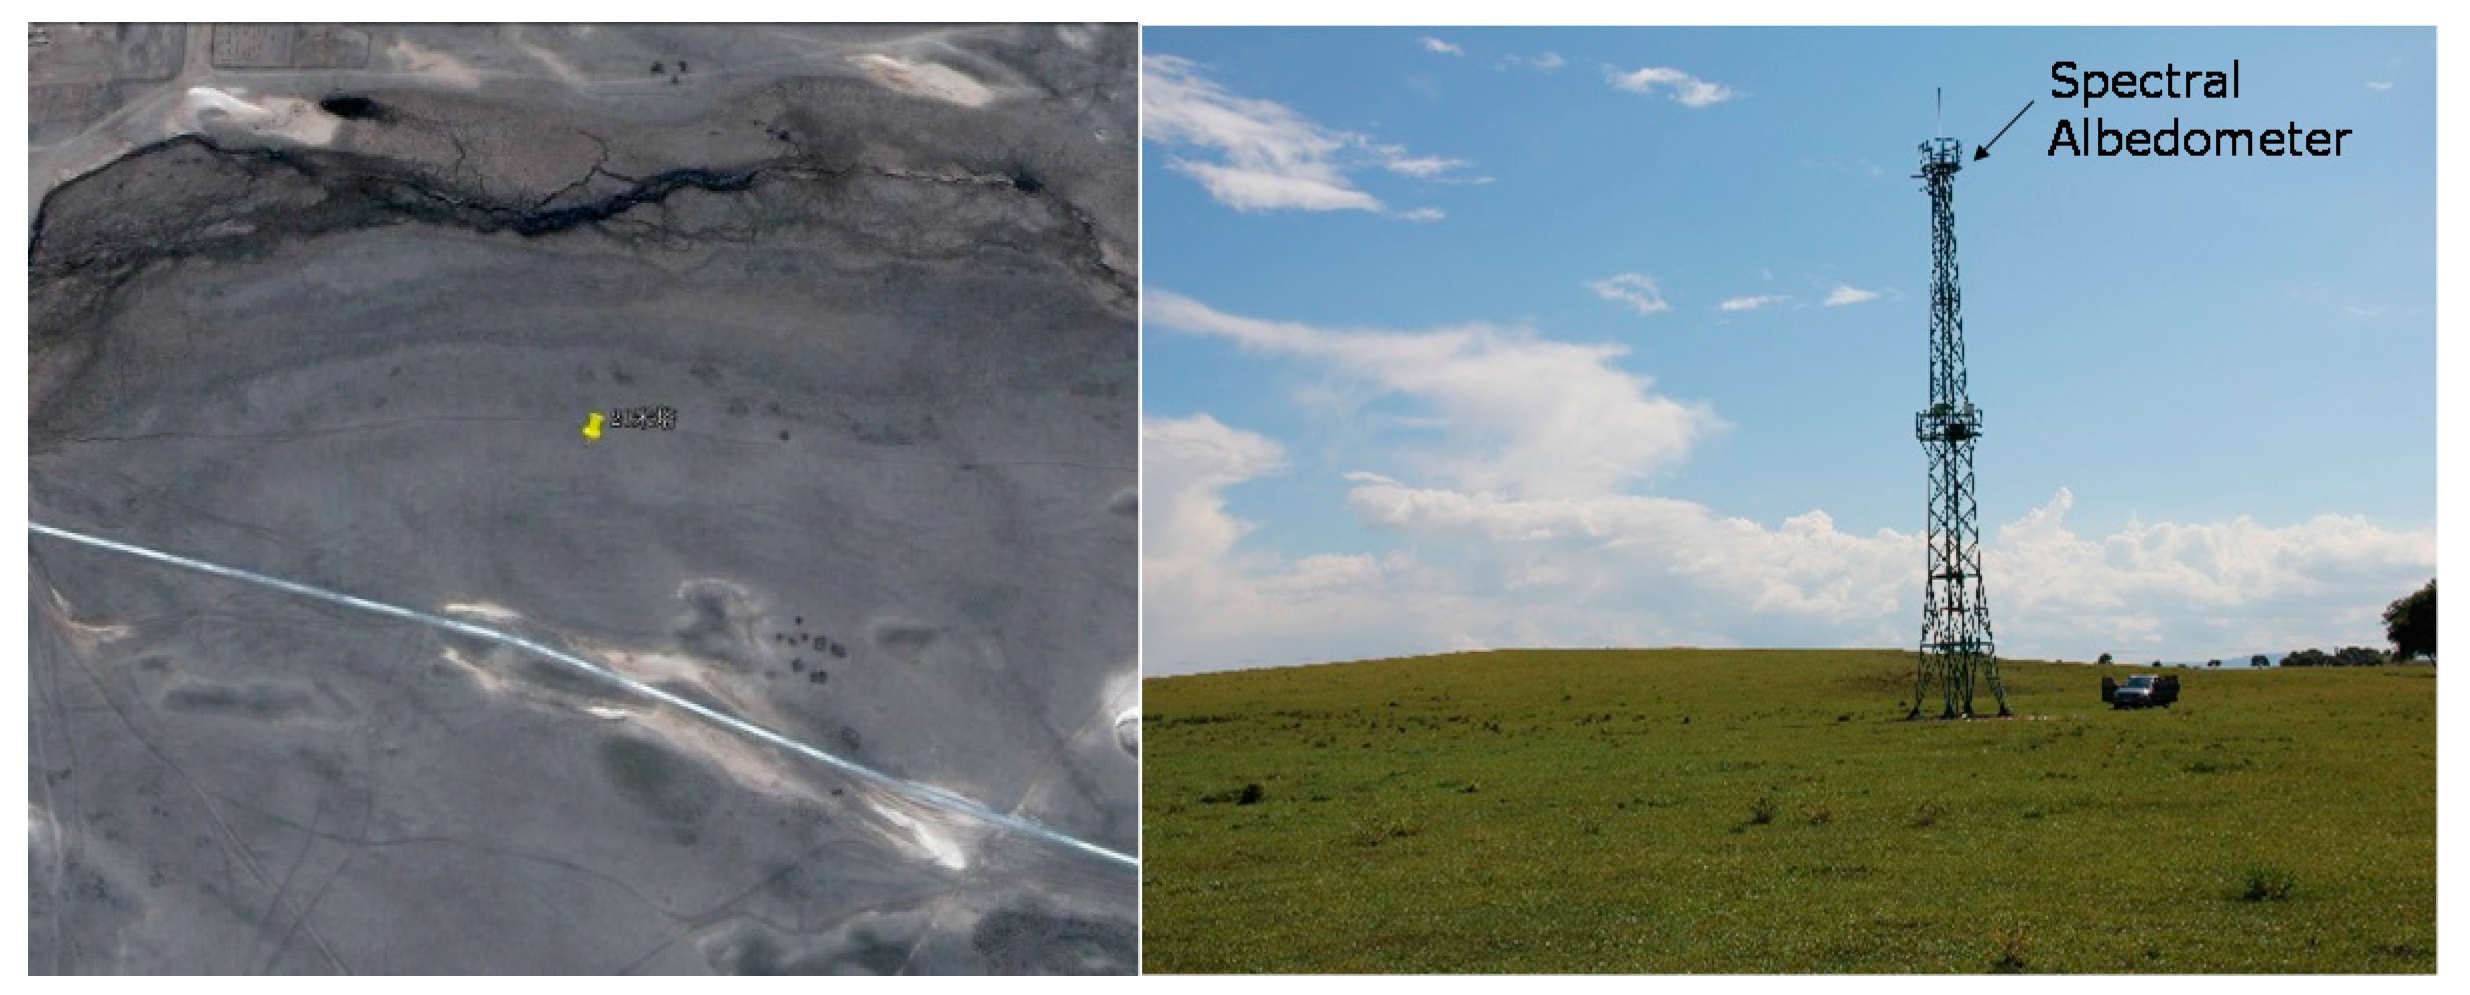
After the spectral albedometers were absolutely calibrated, we conducted a series of field experiments in Yudaokou, Hebei, China (42.24°N, 117.07°E). The land cover type at the study area is entirely grassland. Spectral albedometers were set up atop a 20-m tower and covered an area of about 150 × 150 m (Figure 10). The surface is uniform, so we took the tower observations as the true ground measurement values of a MODIS 500 × 500 m image element, to directly validate the MODIS spectral albedo products.
Field measurements were performed from October 2014, to May 2015. The continuous upwards and downwards spectral radiation intensities of the grassland were recorded and the spectral albedo was calculated with Equation (1) for each band. The standard 500-m gridded MODIS V006 BRDF/albedo product (MCD43A3) was then validated using the field observations. Black sky albedo and white sky albedo were generated by integrating the BRDF calculated from the three retrieved parameters [3,7,35,36]. Blue sky albedo, which encompasses both diffuse and direct radiation, was calculated, as follows [37]:
where is the proportion of diffuse irradiation at a certain solar zenith angle, [35]. The optical depth of the study area was extracted from the MODIS aerosol product (MOD08) [38], and was calculated with the Look Up Table (LUT), according to Remer, Tanre [39], with the optical depth of the area at 0.55 micron from MOD08 and the solar zenith angle calculated based on the site location and observation time.
The spectral albedo time series was directly compared against the MODIS spectral band albedo products, to validate the remote sensing spectral albedo products. Considering the homogeneity of the landscape, the field observations were compared directly with the 500 m MODIS albedo product (MCD43A3).
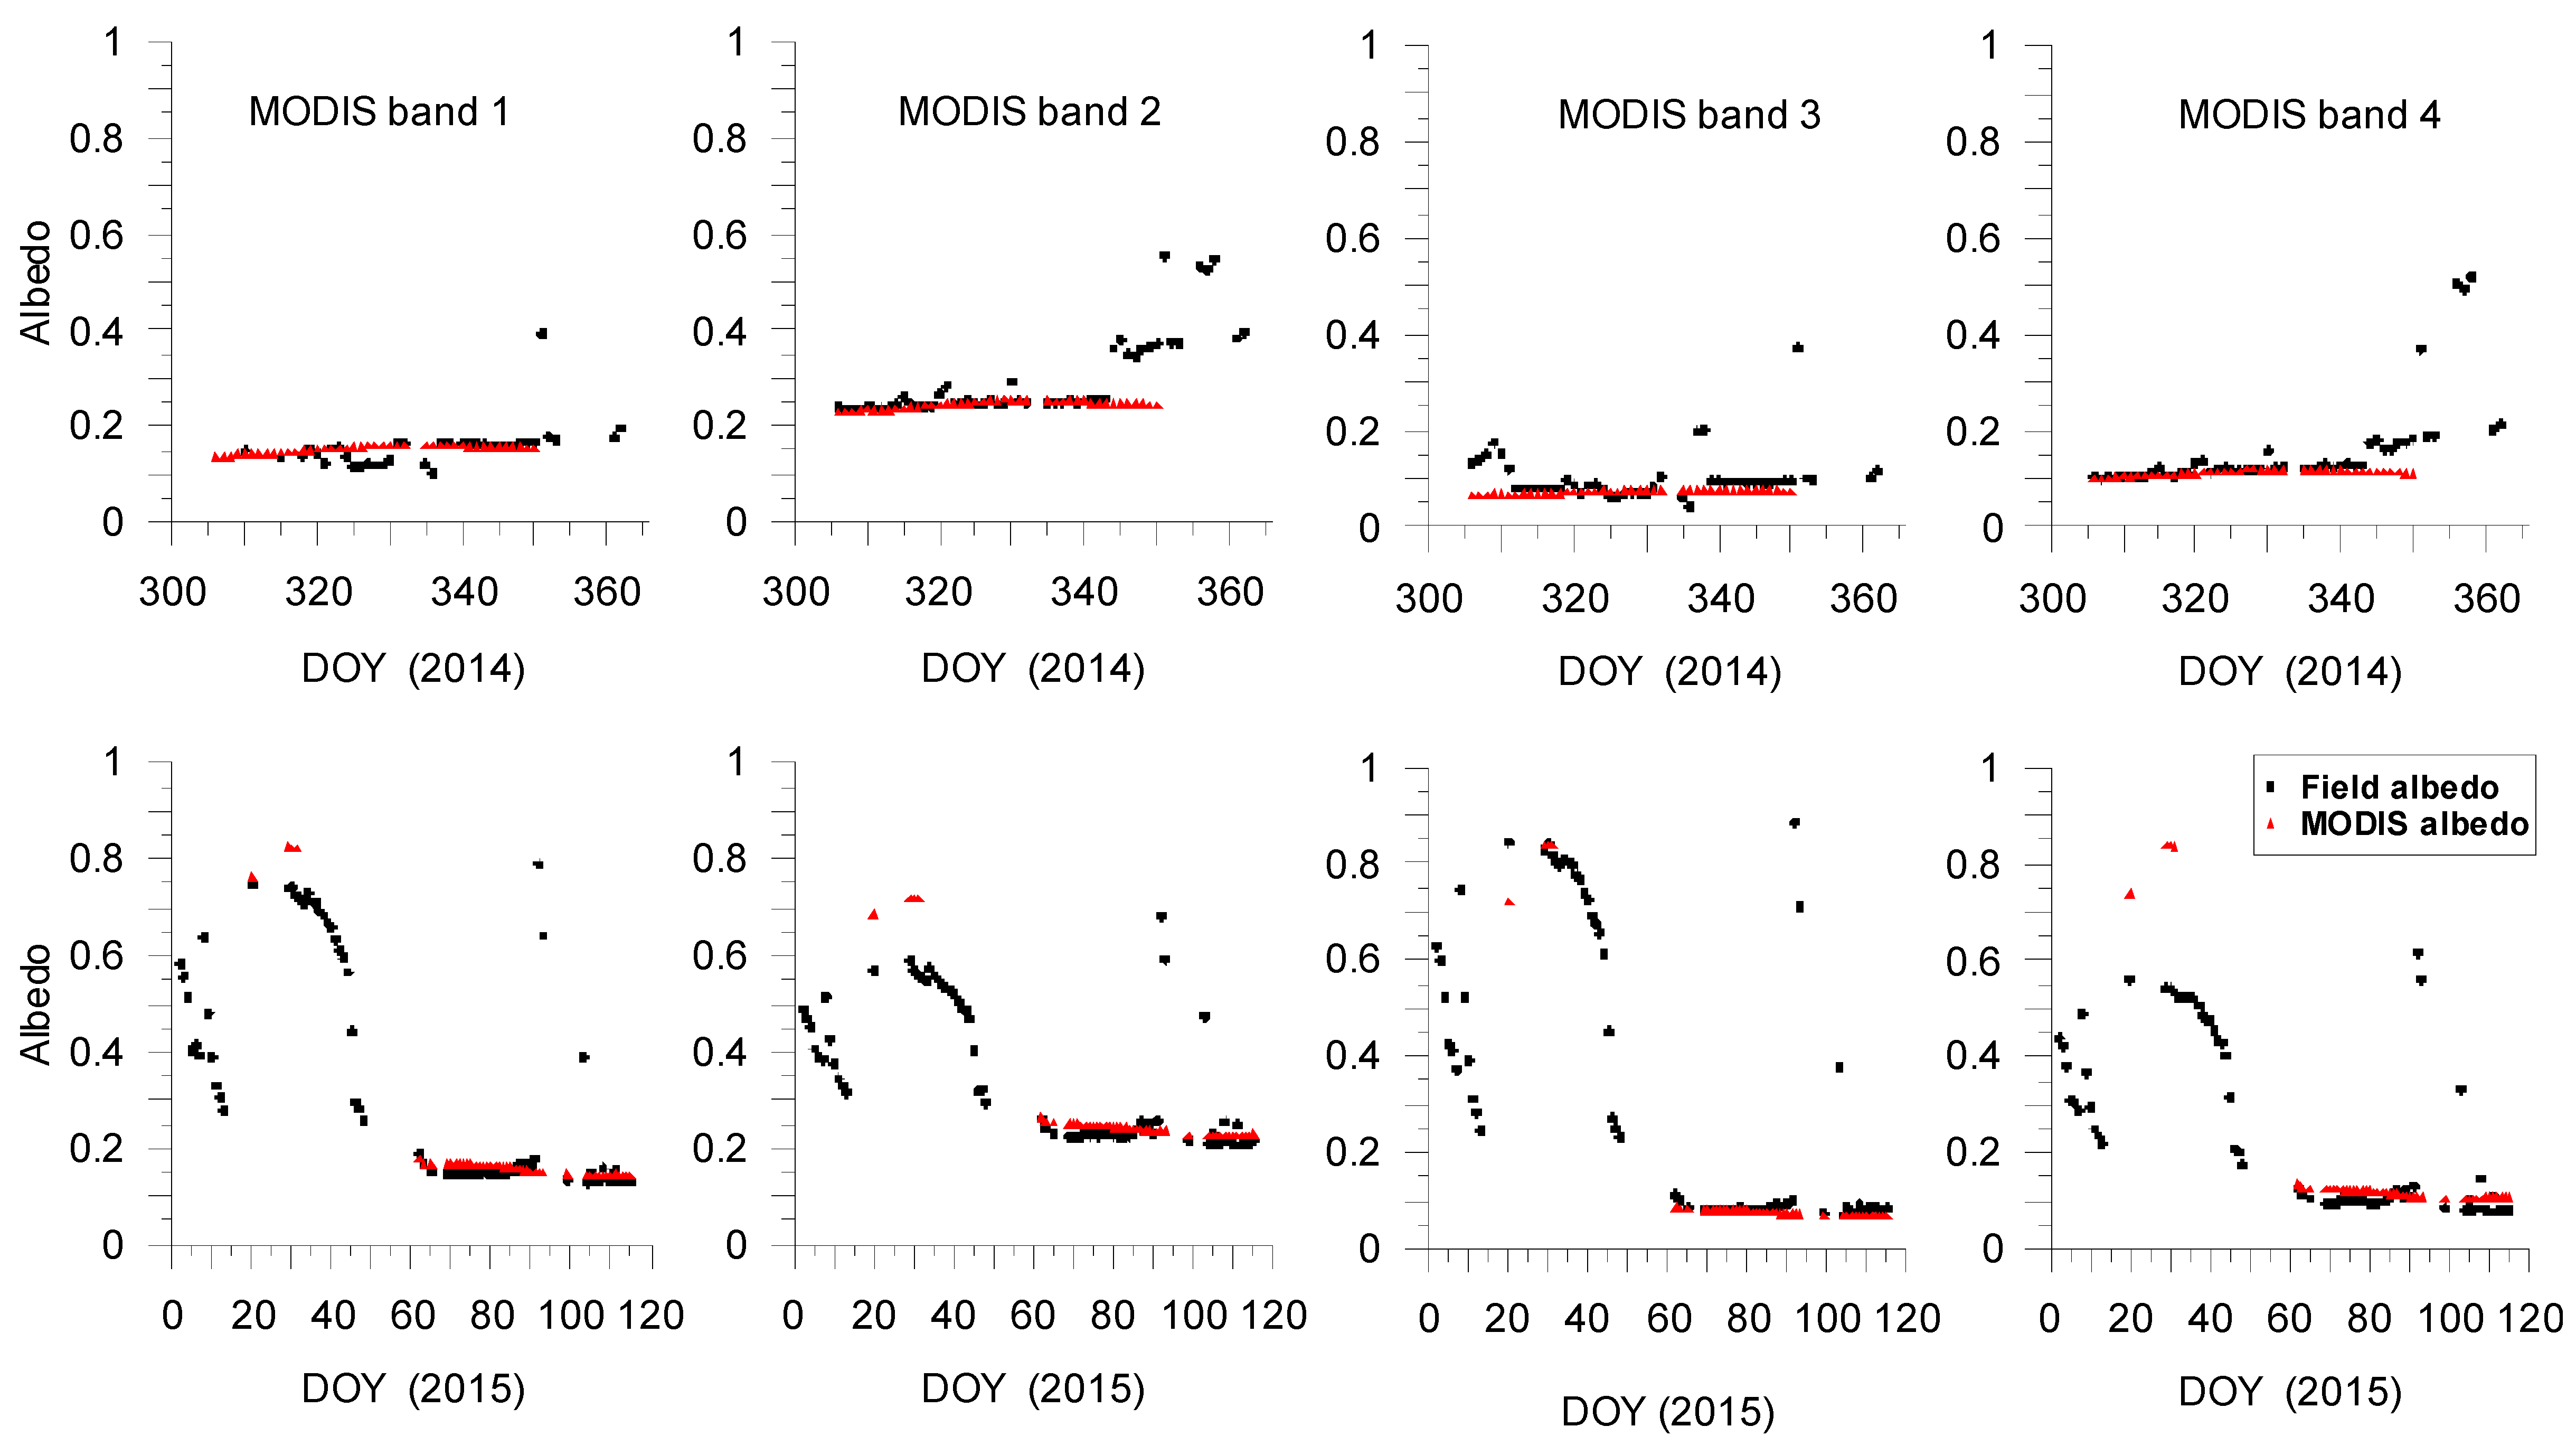
Figure 11 shows the direct validation of the MODIS spectral albedo product with the spectral albedometer measurements. The MODIS albedo product is a combination of a 16-day observation, with weight as a function of the quality; the observation coverage and temporal distance from the day of interest represents the daily value at noon [36]. The spectral albedometer measurements, from 11:45 hr to 12:15 hr of each day were averaged to generate the daily noon value.
Figure 11 shows where the MODIS spectral albedo was in close accordance with our field observations during snow-free periods; the MODIS product is highly continuous and stable. During snowy periods, there is some missing data in the MODIS product, due to retrieval failure (Figure 11), i.e., a failure to capture snow events, such as on day of year (DOY) 92, 2015. There were also some missing data in the field observations in late 2014, due to a low battery in the data transfer system. The statistical results of the direct comparison of the MODIS spectral albedo and spectral albedometer measurements during snow-free periods are listed in Table 3.
Table 3 shows where the accuracy of the MODIS spectral albedo products at our experimental site is relatively high. Compared to the field measurements, the root mean square errors (RMSE) of the four bands are 0.019, 0.0368, 0.0317, and 0.0244 and the biases are −0.0094, 0.0065, 0.0159, and −0.0001, respectively.
4. Discussion
Calleja, Recondo [40] found that inaccuracy in the MODIS albedo product is partly due to narrow to broadband conversion. Thus, assessing the remote sensing spectral albedo product is the best way to verify the retrieval algorithm. The designed spectral albedometer provides a novel approach for obtaining field time series observations, which are critical for remote sensing spectral albedo product validation.
4.1. Errors Induced by the Spectral Albedometer Design
There are some error sources in the spectral albedometer design discussed here. The first is a discrepancy between the customized interference transmittance and the MODIS spectral response function. The deviations in FWHM range from 1–5 nm, which induce about 5.0–10.0% of the observation error. The MODIS spectral response also has a considerably different ‘top’ than the customized filter shown in Figure 4, which means that the weighted spectral average of the ground hyperspectral image could conceivably be different between the two systems and thus introduce error. Though accurate calibration can reduce some error, it is impossible to remove all of it.
The second source of error may have been induced by albedometer body temperature. The silicon photoelectric detector is temperature-dependent [41]: the output increases as the device’s temperature goes up. The general means of accurate observation is temperature control [30]. In our design, the upward and downward radiation is divided, to yield a spectral albedo for each band. The temperature dependence is reduced when the division is performed, so no temperature control system needs to be added to the system.
4.2. Land Surface Homogeneity
Field observation was conducted at a Yudaokou grassland site and directly compared with the remote sensing product, under the assumption that the land surface was sufficiently homogeneous. In actuality, land surface homogeneity varies with time. We analyzed the land surface homogeniety of the research area with a Landsat 8 OLI data-derived albedo [42], according to the literature [3,43], during dormant and growing seasons. The fitted sill values were both less than 0.001 [44], which indicates that the land surface is indeed homogeneous enough for direct comparison.
4.3. Capability of Simultaneous Multi-Parameter Observation
We designed and tested albetometers for four bands in this study. It is possible to obtain different band combinations using different filters, such as visible band (400–700 nm) radiation detection. By mounting one albedometer under canopy and one over canopy, the visible band albedo and Fraction of Absorbed Photosynthetically Active Radiation (FAPAR) can be simultaneously obtained, fairly easily. The multi-parameter combined observation has significant value in regards to its efficiency and physically-consistent parameter estimations.
5. Conclusions
In this study, we designed a measuring system that allowed us to accurately obtain spectral albedos corresponding to satellite sensors. Our design effectively avoids errors associated with traditional broadband surface albedo product verification due to wavelength conversion and band mismatch; it also mitigates the defects in spectroradiometer measurements, which are labor- and time-consuming to gather and are difficult to use when conducting regional-scale time-series observations. We conducted a series of experiments in the Yudaokou grasslands to demonstrate that the proposed device can feasibly and effectively provide spectral albedo time series observations. Other important characteristics of the proposed device can be summarized as follows.
- Strong linear response of the sensor: The sensor utilizes an interference filter equipped with sophisticated technology to gather incident radiation measurements over specific wavelength ranges. We used a highly sensitive photoelectric detector in our design which is simple and reliable, with a >99% linear response that fully satisfies the requirements for precise albedo detection, with an absolute accuracy of 0.02–0.05 [1].
- Flexibility in the sensor design: We ran a successful spectral albedo test using the MODIS band set as an example. Our design can be easily extended to other satellite sensors and other bands. A wide range of photodetectors can also be used for the direct measurement of broadband surface albedos with multi-band combinations.
- Applicability to multi-point observation layouts: Compared to other currently available radiometers, the materials necessary for our design are relatively inexpensive. To this effect, our sensor can realize multi-point layouts in a given heterogeneous area to resolve issues with single-point observations in representing remote sensing pixel values.
We designed our sensor to apply to spectral albedos over the 400–1000 nm range, but not the broadband shortwave range (300–2800 nm), as the silicon-sensitive photoelectric detector cannot detect incident light with wavelengths >1100 nm. The broadband albedo is significant in regards to scientific use [6], so it is necessary to design additional spectral albedometers that can operate at ranges between 1100 and 2800 nm. The thermopile detector is often applied to broadband radiation detection, which may be useful in this regard [45,46]. We will focus on the design and performance of the spectral albedometer design at wavelengths greater than 1100 nm, and will continue to carry out observation experiments tailored to heterogeneous surfaces.
Acknowledgments
This work was supported by the Key research and development program of China 2016YFB0501404, 2016YFB0501502, the Chinese 973 Program under grant 2013CB733403, and the National Natural Science Foundation of China under grant 41171263.
Author Contributions
Hongmin Zhou, Jindi Wang, and Shunlin Liang conceived and designed the experiments; Hongmin Zhou performed the experiments and analyzed the data; Hongmin Zhou wrote the paper; Jindi Wang and Shunlin Liang revised the paper.
Conflicts of Interest
The authors declare no conflict of interest.
References
- Dickinson, R.E. Land surface processes and climate surface albedos and energy-balance. Adv. Geophys. 1983, 25, 305–353. [Google Scholar]
- Wang, K.; Liang, S.; Schaaf, C.L.; Strahler, A.H. Evaluation of Moderate Resolution Imaging Spectroradiometer land surface visible and shortwave albedo products at FLUXNET sites. J. Geophys. Res. Atmos. 2010, 115. [Google Scholar] [CrossRef]
- Wang, Z.; Schaaf, C.B.; Strahler, A.H.; Chopping, M.J.; Román, M.O.; Shuai, Y.; Woodcock, C.E.; Hollinger, D.Y.; Fitzjarrald, D.R. Evaluation of MODIS albedo product (MCD43A) over grassland, agriculture and forest surface types during dormant and snow-covered periods. Remote Sens. Environ. 2014, 140, 60–77. [Google Scholar] [CrossRef]
- Wang, Z.; Zeng, X. Evaluation of snow albedo in land models for weather and climate studies. J. Appl. Meteorol. Climatol. 2010, 49, 363–380. [Google Scholar] [CrossRef]
- Lewis, P.; Disney, M.; Barnsley, M.; Muller, J.-P. Deriving albedo maps for HAPEX-Sahel from ASAS data using kernel-driven BRDF models. Hydrol. Earth Syst. Sci. Discuss. 1999, 3, 1–11. [Google Scholar] [CrossRef]
- Liang, S. Narrowband to broadband conversions of land surface albedo I: Algorithms. Remote Sens. Environ. 2000, 76, 213–238. [Google Scholar] [CrossRef]
- Schaaf, C.B.; Gao, F.; Strahler, A.H.; Lucht, W.; Li, X.; Tsang, T.; Strugnell, N.C.; Zhang, X.; Jin, Y.; Muller, J.-P.; et al. First operational BRDF, albedo nadir reflectance products from MODIS. Remote Sens. Environ. 2002, 83, 135–148. [Google Scholar] [CrossRef]
- Pinty, B.; Roveda, F.; Verstraete, M.M.; Gobron, N.; Govaerts, Y.; Martonchik, J.V.; Diner, D.J.; Kahn, R.A. Surface albedo retrieval from Meteosat: 1. Theory. J. Geophys. Res. Atmos. 2000, 105, 18099–18112. [Google Scholar] [CrossRef]
- Wang, D.; Liang, S.; He, T.; Yu, Y. Direct estimation of land surface albedo from VIIRS data: Algorithm improvement and preliminary validation. J. Geophys. Res. Atmos. 2013, 118, 577–586. [Google Scholar] [CrossRef]
- Wang, D.; Liang, S.; He, T.; Yu, Y.; Schaaf, C.; Wang, Z. Estimating daily mean land surface albedo from MODIS data. J. Geophys. Res. Atmos. 2015, 120, 4825–4841. [Google Scholar] [CrossRef]
- He, T.; Liang, S.; Wang, D. Direct Estimation of Land Surface Albedo From Simultaneous MISR Data. IEEE Trans. Geosci. Remote Sens. 2017, 55, 2605–2617. [Google Scholar] [CrossRef]
- Liang, S.; Fang, H.; Chen, M.; Shuey, C.J.; Walthall, C.; Daughtry, C.; Morisette, J.; Schaaf, C.; Strahler, A. Validating MODIS land surface reflectance and albedo products: Methods and preliminary results. Remote Sens. Environ. 2002, 83, 149–162. [Google Scholar] [CrossRef]
- Wang, K.; Liu, J.; Zhou, X.; Sparrow, M.; Ma, M.; Sun, Z.; Jiang, W. Validation of the MODIS global land surface albedo product using ground measurements in a semidesert region on the Tibetan Plateau. J. Geophys. Res. Atmos. 2004, 109. [Google Scholar] [CrossRef]
- Cescatti, A.; Marcolla, B.; Santhana Vannan, S.K.; Pan, J.Y.; Román, M.O.; Yang, X.; Ciais, P.; Cook, R.B.; Law, B.E.; Matteucci, G.; et al. Intercomparison of MODIS albedo retrievals and in situ measurements across the global FLUXNET network. Remote Sens. Environ. 2012, 121, 323–334. [Google Scholar] [CrossRef]
- Song, J.; Gao, W. An improved method to derive surface albedo from narrowband AVHRR satellite data: Narrowband to broadband conversion. J. Appl. Meteorol. 1999, 38, 239–249. [Google Scholar] [CrossRef]
- Valiente, J.; Nunez, M.; Lopez-Baeza, E.; Moreno, J. Narrow-band to broad-band conversion for meteosat-visiible channel and broad-band albedo using both AVHRR-1 and-2 channels. Remote Sens. 1995, 16, 1147–1166. [Google Scholar] [CrossRef]
- Lucht, W.; Hyman, A.H.; Strahler, A.H.; Barnsley, M.J.; Hobson, P.; Muller, J.-P. A comparison of satellite-derived spectral albedos to ground-based broadband albedo measurements modeled to satellite spatial scale for a semidesert landscape. Remote Sens. Environ. 2000, 74, 85–98. [Google Scholar] [CrossRef]
- Picard, G.; Libois, Q.; Arnaud, L.; Verin, G.; Dumont, M. Development and calibration of an automatic spectral albedometer to estimate near-surface snow SSA time series. Cryosphere 2016, 10, 1297–1316. [Google Scholar] [CrossRef] [Green Version]
- Cheng, J.; Liang, S. Estimating the broadband longwave emissivity of global bare soil from the MODIS shortwave albedo product. J. Geophys. Res. Atmos. 2014, 119, 614–634. [Google Scholar] [CrossRef]
- Wuttke, S.; Seckmeyer, G.; König-Langlo, G. Measurements of spectral snow albedo at Neumayer, Antarctica. Ann. Geophys. 2006, 24, 7–21. [Google Scholar] [CrossRef] [Green Version]
- Wright, P.; Bergin, M.; Dibb, J.; Lefer, B.; Domine, F.; Carman, T.; Carmagnola, C.; Dumont, M.; Courville, Z.; Schaaf, C.; et al. Comparing MODIS daily snow albedo to spectral albedo field measurements in Central Greenland. Remote Sens. Environ. 2014, 140, 118–129. [Google Scholar] [CrossRef]
- Grenfell, T.C.; Warren, S.G.; Mullen, P.C. Reflection of solar radiation by the Antarctic snow surface at ultraviolet, visible, and near-infrared wavelengths. J. Geophys. Res. Atmos. 1994, 99, 18669–18684. [Google Scholar] [CrossRef]
- Hudson, S.R.; Warren, S.G.; Brandt, R.E.; Grenfell, T.C.; Six, D. Spectral bidirectional reflectance of Antarctic snow: Measurements and parameterization. J. Geophys. Res. Atmos. 2006, 111. [Google Scholar] [CrossRef]
- Marks, A.; Fragiacomo, C.; Macarthur, A.; Zibordi, G.; Fox, N.; King, M.D. Characterisation of the HDRF (as a proxy for BRDF) of snow surfaces at Dome C, Antarctica, for the inter-calibration and inter-comparison of satellite optical data. Remote Sens. Environ. 2015, 158, 407–416. [Google Scholar] [CrossRef]
- Feister, U.; Grewe, R. Spectral albedo measurements in the UV and visible region over different types of surfaces. Photochem. Photobiol. 1995, 62, 736–744. [Google Scholar] [CrossRef]
- Angström, A. The albedo of various surfaces of ground. Geogr. Ann. 1925, 7, 323–342. [Google Scholar]
- King, D.L.; Myers, D.R. Silicon-photodiode pyranometers: Operational characteristics, historical experiences, and new calibration procedures. In Proceedings of the Conference Record of the Twenty Sixth IEEE Photovoltaic Specialists Conference—1997, Anaheim, CA, USA, 29 Septemebr–3 October 1997. [Google Scholar]
- Michalsky, J.; Harrison, L.; Berkheiser Iii, W. Cosine response characteristics of some radiometric and photometric sensors. Sol. Energy 1995, 54, 397–402. [Google Scholar] [CrossRef]
- Lowry, J.H.; Mendlowitz, J.S. Optical characteristics of Teflon AF fluoroplastic materials. Opt. Eng. 1992, 31, 1982–1985. [Google Scholar] [CrossRef]
- Martínez, M.A.; Andújar, J.M.; Enrique, J.M. A new and inexpensive pyranometer for the visible spectral range. Sensors 2009, 9, 4615–4634. [Google Scholar] [CrossRef] [PubMed]
- Apfel, J.H. Infra-Red Interference Filter. U.S. Patent 3,682,528 A, 8 August 1972. [Google Scholar]
- Yokota, S.; Sugiyama, M.; Kawagoe, N.; Miyaura, T. Spectral Sensor with Interference Filter. U.S. Patent 4,822,998A, 18 April 1989. [Google Scholar]
- Ndukwe, I. Measurement of solar energy radiation at Okigwe using silicon solar cell. Energy Convers. Manag. 2000, 41, 189–197. [Google Scholar] [CrossRef]
- Xu, Z.; Liu, S.; Li, X.; Shi, S.; Wang, J.; Zhu, Z.; Xu, T.; Wang, W.; Ma, M. Intercomparison of surface energy flux measurement systems used during the HiWATER-MUSOEXE. J. Geophys. Res. Atmos. 2013, 118. [Google Scholar] [CrossRef]
- Lucht, W.; Schaaf, C.B.; Strahler, A.H. An algorithm for the retrieval of albedo from space using semiempirical BRDF models. IEEE Trans. Geosci. Remote Sens. 2000, 38, 977–998. [Google Scholar] [CrossRef]
- Shuai, Y. Tracking Daily Land Surface Albedo and Reflectance Anisotropy with MODerate-Resolution Imaging Spectroradiometer (MODIS); Boston University: Boston, MA, USA, 2010; p. 118. [Google Scholar]
- Lewis, P.; Barnsley, M.J. Influence of the sky radiance distribution on various formulations of the Earth surface albedo. In Proceedings of the International Symposium on Physical Measurements & Signatures in Remote Sensing Isprs, Val d’Isere, France, 17–24 January 1994. [Google Scholar]
- Hubaks, P.; Platnik, S.; King, M.; Ridgway, B. MODIS Atmosphere L3 Gridded Product Algorithm Theoretical Basis Document (ATBD) & Users Guide; MODIS Algorithm Theoretical Basis Document No. ATBD-MOD-30. Available online: https://modis-atmos.gsfc.nasa.gov/_docs/L3_ATBD_C6_2015_05_06.pdf (accessed on 9 January 2018).
- Remer, L.A.; Tanre, D.; Kaufman, Y.J.; Levy, R.; Mattoo, S. Algorithm for Remote Sensing of Tropospheric Aerosol from MODIS: Collection 005. Natl. Aeronaut. Space Admin. Available online: https://pdfs.semanticscholar.org/566d/19c074f199963abba848ad53b77062d1333d.pdf (accessed on 9 January 2018).
- Calleja, J.F.; Recondo, C.; Peón, J.; Fernández, S.; De La Cruz, F.; González-Piqueras, J. A New Method for the Estimation of Broadband Apparent Albedo Using Hyperspectral Airborne Hemispherical Directional Reflectance Factor Values. Remote Sens. 2016, 8, 183. [Google Scholar] [CrossRef]
- Degenhardt, C.; Prescher, G.; Frach, T.; Thon, A.; De Gruyter, R.; Schmitz, A.; Ballizany, R. The digital silicon photomultiplier—A novel sensor for the detection of scintillation light. In Proceedings of the 2009 IEEE Nuclear Science Symposium Conference Record (NSS/MIC), Orlando, FL, USA, 24 October–1 November 2009. [Google Scholar]
- He, T.; Liang, S.; Wang, D.; Cao, Y.; Gao, F.; Yu, Y.; Feng, M. Evaluating land surface albedo estimation from Landsat MSS, TM, ETM+, and OLI data based on the unified direct estimation approach. Remote Sens. Environ. 2018, 204 (Suppl. C), 181–196. [Google Scholar] [CrossRef]
- Wang, Z.; Schaaf, C.B.; Chopping, M.J.; Strahler, A.H.; Wang, J.; Román, M.O.; Rocha, A.V.; Woodcock, C.E.; Shuai, Y. Evaluation of Moderate-resolution Imaging Spectroradiometer (MODIS) snow albedo product (MCD43A) over tundra. Remote Sens. Environ. 2012, 117, 264–280. [Google Scholar] [CrossRef]
- Burakowski, E.A.; Ollinger, S.V.; Lepine, L.; Schaaf, C.B.; Wang, Z.; Dibb, J.E.; Hollinger, D.Y.; Kim, J.; Erb, A.; Martin, M. Spatial scaling of reflectance and surface albedo over a mixed-use, temperate forest landscape during snow-covered periods. Remote Sens. Environ. 2015, 158, 465–477. [Google Scholar] [CrossRef]
- Proctor, D.; Trickett, E. An improved pyranometer. Sol. Energy 1982, 29, 189–194. [Google Scholar] [CrossRef]
- Beaubien, D.; Bisberg, A.; Beaubien, A. Investigations in pyranometer design. J. Atmos. Ocean. Technol. 1998, 15, 677–686. [Google Scholar] [CrossRef]
Figure 1.
Spectral albedometer structure. For each band, upwards and downwards sensors are mounted back-to-back, to receive downwards and upwards radiation, respectively.
Figure 1.
Spectral albedometer structure. For each band, upwards and downwards sensors are mounted back-to-back, to receive downwards and upwards radiation, respectively.

Figure 2.
Sensor design. The first layer is a Teflon TM diffuser, the second is an interference filter, the third is a silicon photoelectric detector. Two sensors are included in each band’s albedometer: one for and one for .
Figure 2.
Sensor design. The first layer is a Teflon TM diffuser, the second is an interference filter, the third is a silicon photoelectric detector. Two sensors are included in each band’s albedometer: one for and one for .
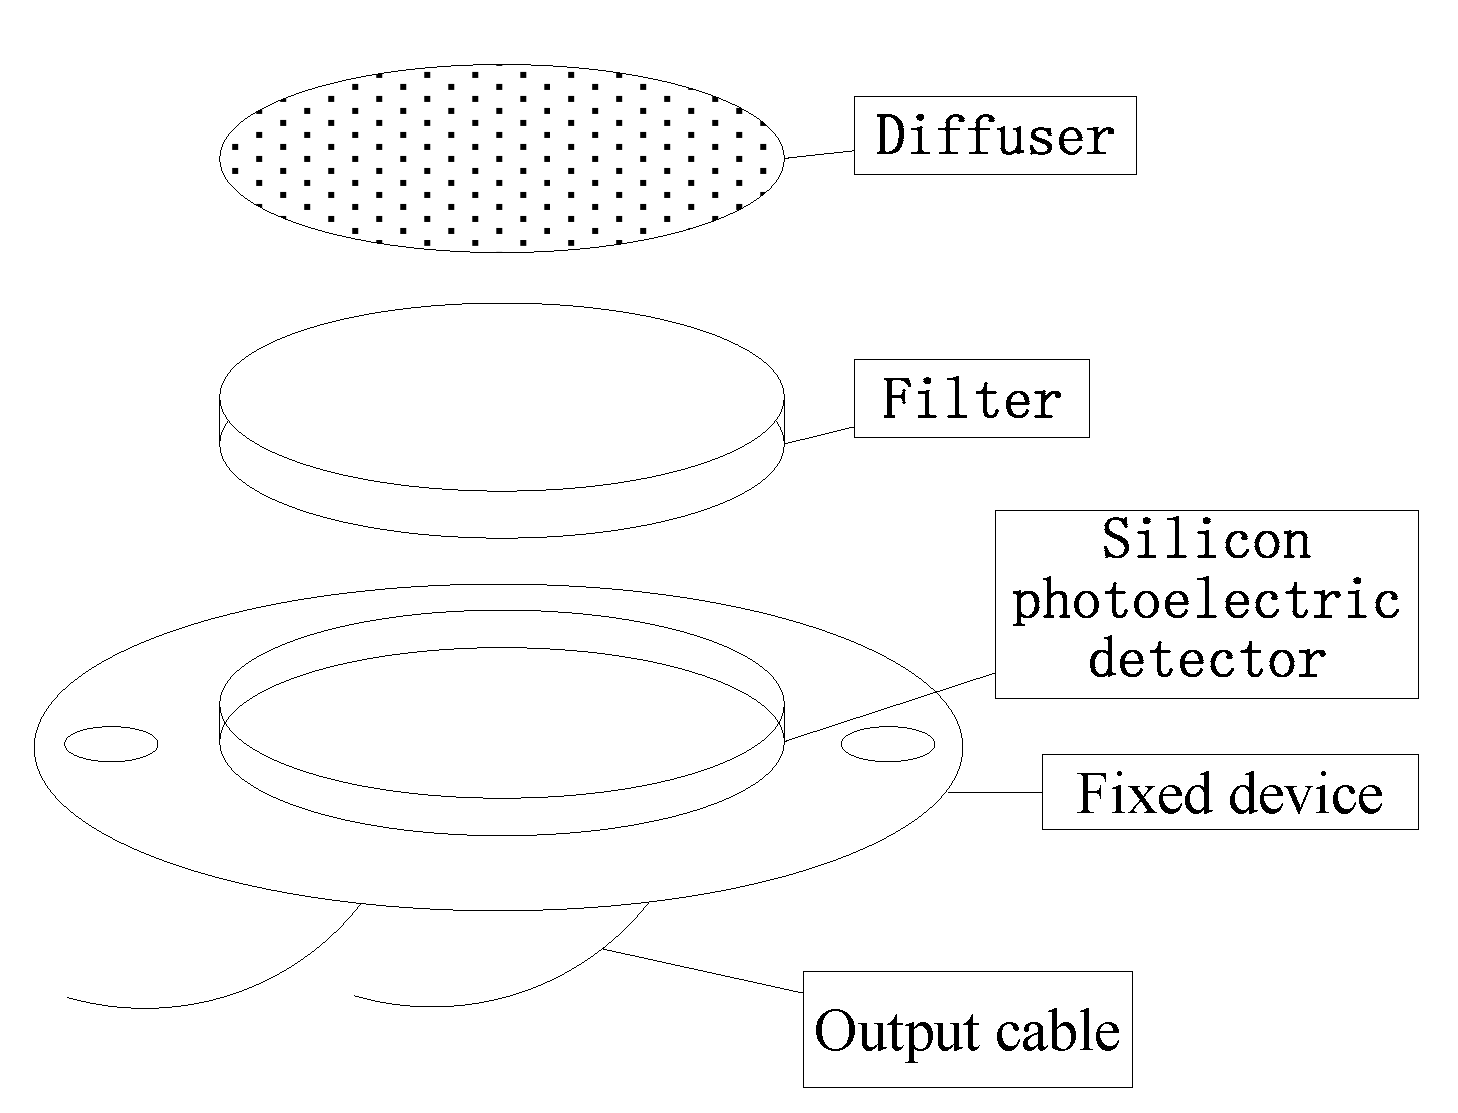
Figure 3.
Developed spectral albedometer for one band.

Figure 4.
Customized interference filter transmittance versus MODIS band response functions. The top figure of each column is the transmittance of the customized interference filter; the bottom figure is the spectral response function of the MODIS band.
Figure 4.
Customized interference filter transmittance versus MODIS band response functions. The top figure of each column is the transmittance of the customized interference filter; the bottom figure is the spectral response function of the MODIS band.

Figure 5.
Spectral albedometer calibration. (a) Incident light is first measured by the spectral albedometer and the radiation of each band is integrated; (b) Incident light is then measured by the spectral albedometer sensor. The upward and downward sensors are calibrated independently.
Figure 5.
Spectral albedometer calibration. (a) Incident light is first measured by the spectral albedometer and the radiation of each band is integrated; (b) Incident light is then measured by the spectral albedometer sensor. The upward and downward sensors are calibrated independently.

Figure 6.
Calibration result of the worst-fitting sensor in the total of 80 calibrated sensors, with coefficient of determination of 0.9996.
Figure 6.
Calibration result of the worst-fitting sensor in the total of 80 calibrated sensors, with coefficient of determination of 0.9996.
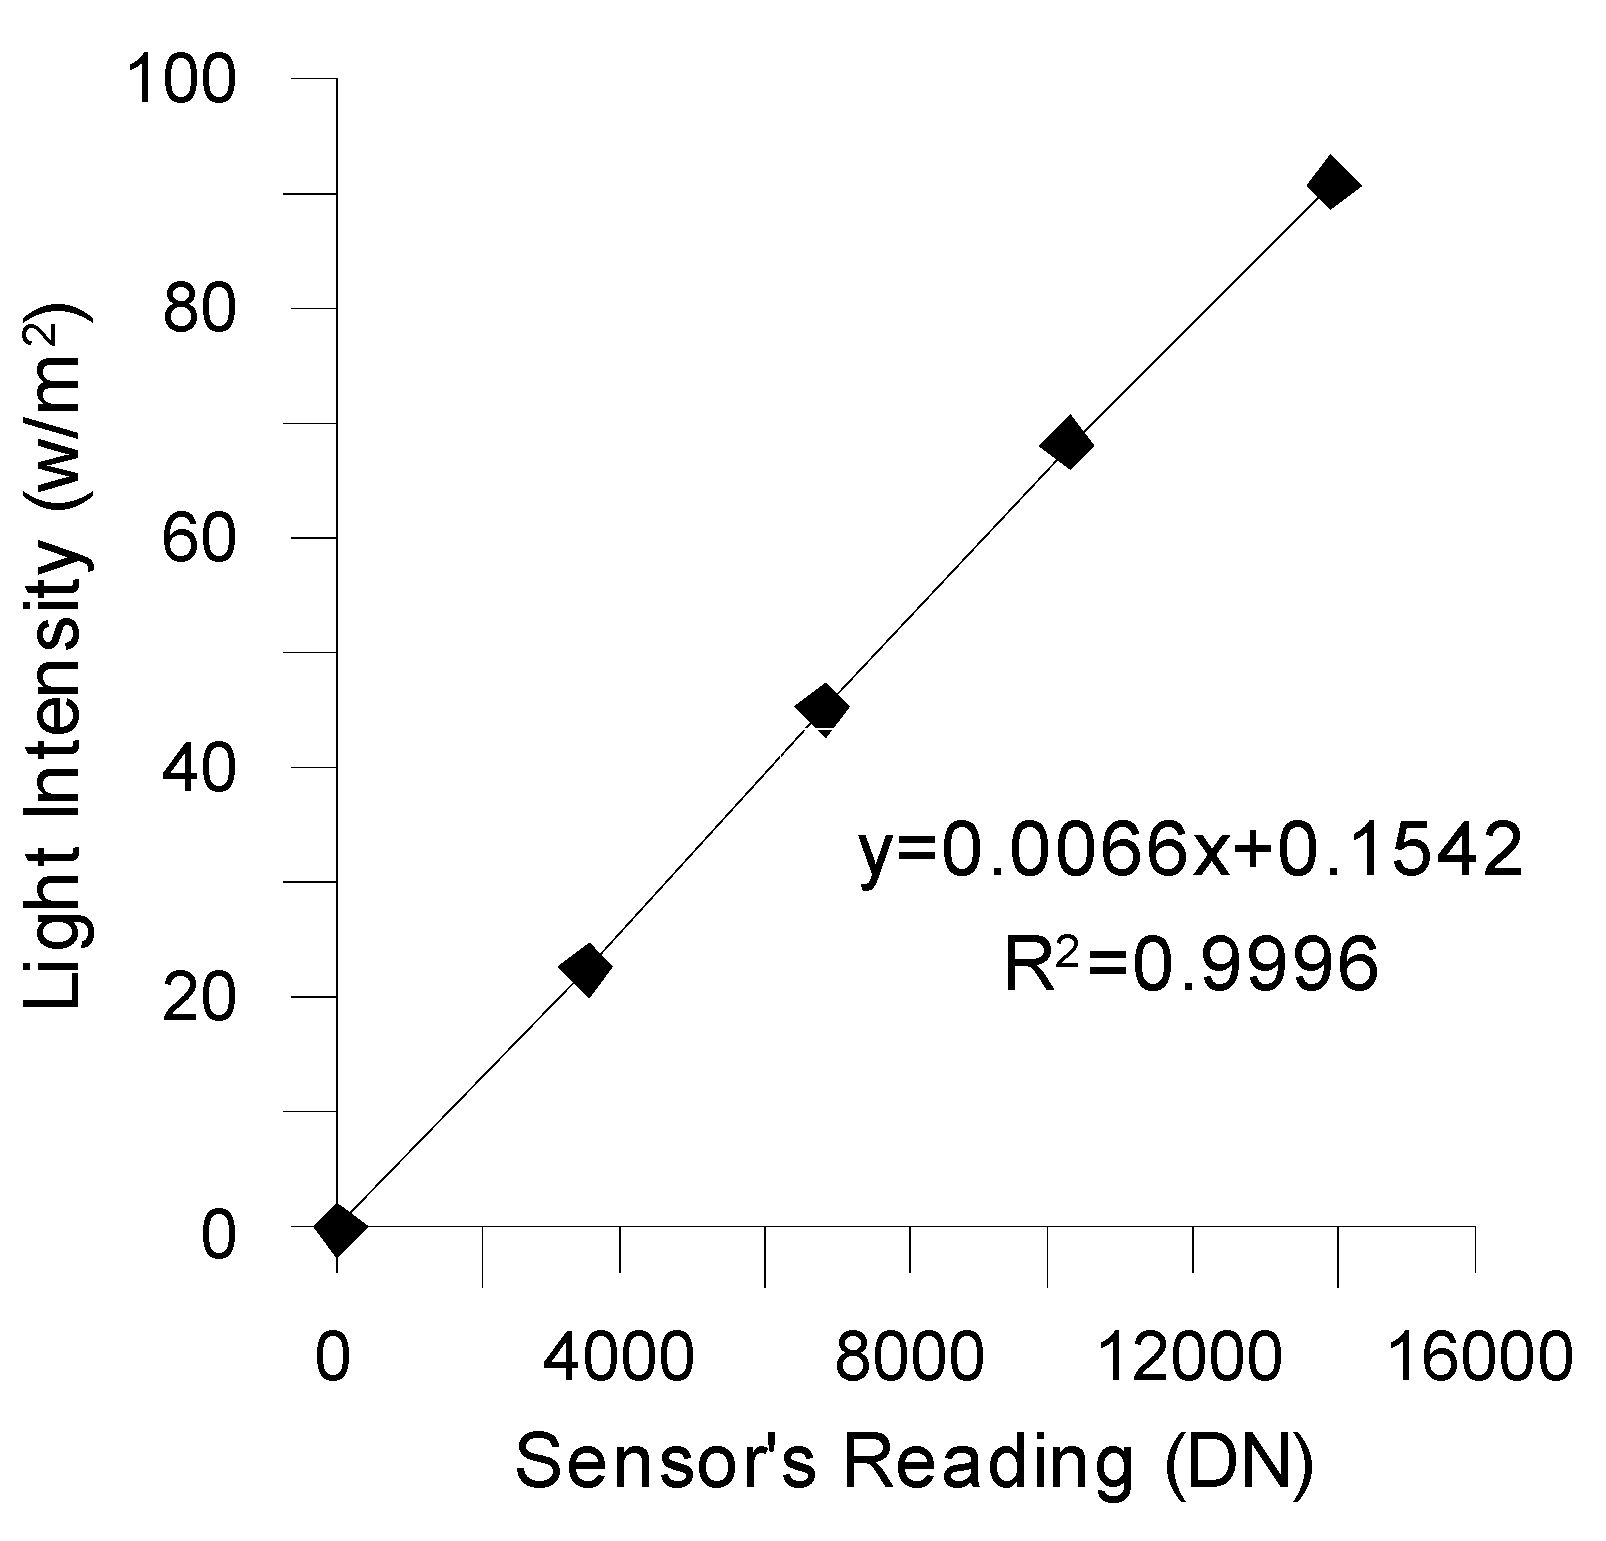
Figure 7.
Non-linear error histogram of 80 calibrated sensors. More than 40% of the sensors are absolutely linear, with a non-linear error of 0; all sensors’ non-linear error is below 0.01.
Figure 7.
Non-linear error histogram of 80 calibrated sensors. More than 40% of the sensors are absolutely linear, with a non-linear error of 0; all sensors’ non-linear error is below 0.01.

Figure 8.
Coefficients of determination of linear fitting results.

Figure 9.
Spectral albedometer compared with CNR4 radiometer.
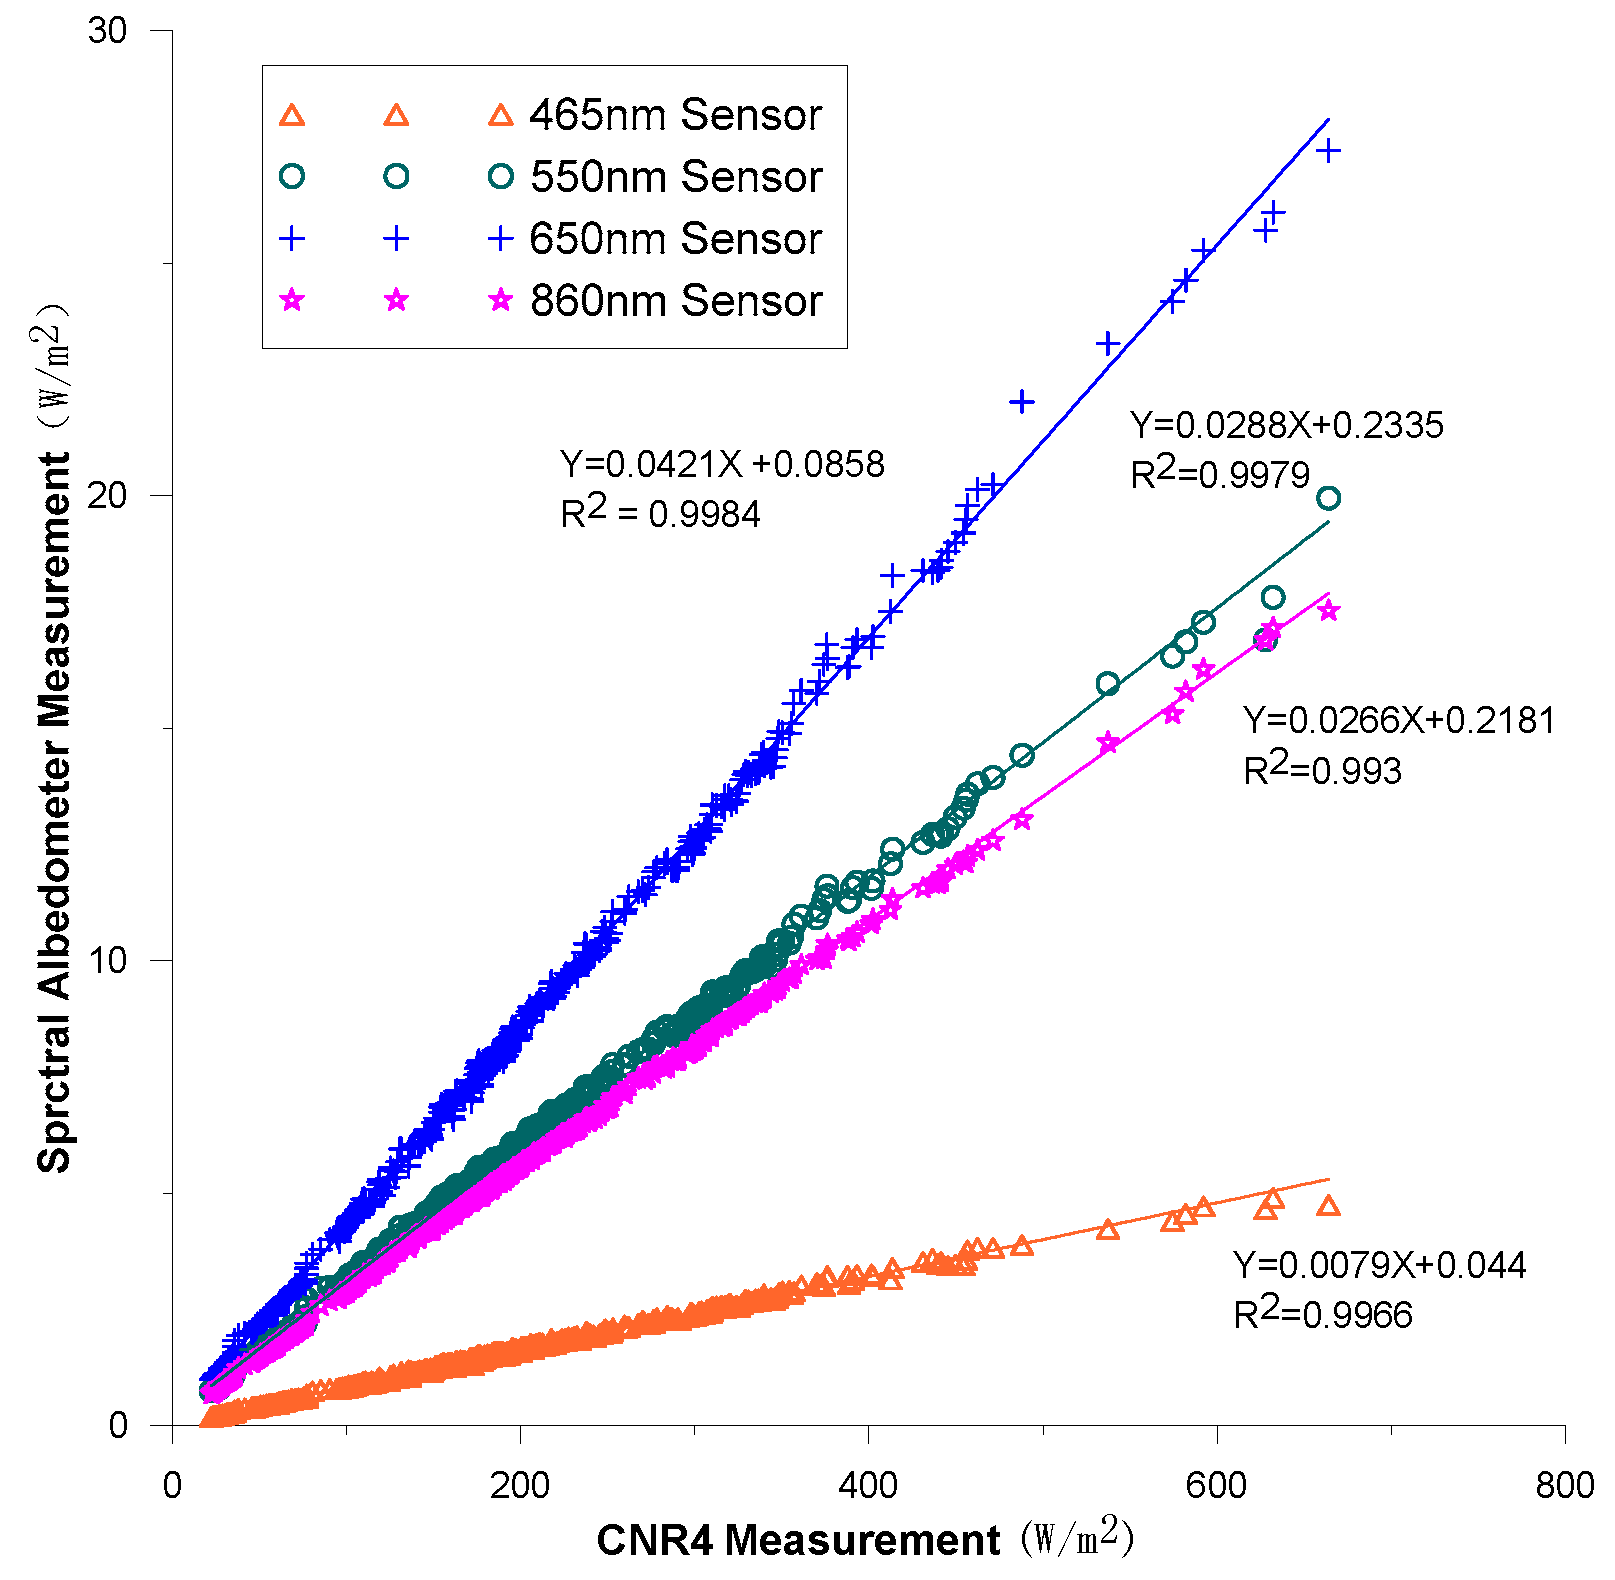
Figure 10.
Field observation of the designed spectral albedometer. The left side shows the tower location from Google Earth on 30 April 2013. The site is homogeneous grassland, except for a road passing through the area. The right figure is the 20-m tower. The designed spectral albedometers are mounted atop the tower.

Figure 11.
Direct validation of MODIS spectral albedo (bands 1 to 4) with spectral albedometer measurements. The first row are results for 2014 and the second row are results for 2015.
Figure 11.
Direct validation of MODIS spectral albedo (bands 1 to 4) with spectral albedometer measurements. The first row are results for 2014 and the second row are results for 2015.

Table 1.
Band information of first four MODerate Resolution Imaging Spectroradiometer (MODIS) bands.
Table 1.
Band information of first four MODerate Resolution Imaging Spectroradiometer (MODIS) bands.
| Band 1 | Band 2 | Band 3 | Band 4 | |
|---|---|---|---|---|
| Central wavelength (nm) | 645 | 858.5 | 469 | 555 |
| Full width at half maximum (FWHM) (nm) | 50 | 35 | 20 | 20 |
Table 2.
Characteristics of the customized interference filter.
| Band 1 | Band 2 | Band 3 | Band 4 | |
|---|---|---|---|---|
| Central wavelength (nm) | 645 | 858.5 | 469 | 555 |
| FWHM (nm) | 45 | 38 | 22 | 21 |
Table 3.
Statistical results of direct comparison of MODIS spectral albedo and spectral albedometer measurements.
Table 3.
Statistical results of direct comparison of MODIS spectral albedo and spectral albedometer measurements.
| RMSE | BIAS | |
|---|---|---|
| Band 1 | 0.019 | −0.0094 |
| band 2 | 0.0368 | 0.0065 |
| band 3 | 0.0317 | 0.0159 |
| band 4 | 0.0244 | −0.0001 |
© 2018 by the authors. Licensee MDPI, Basel, Switzerland. This article is an open access article distributed under the terms and conditions of the Creative Commons Attribution (CC BY) license (http://creativecommons.org/licenses/by/4.0/).
Share and Cite
MDPI and ACS Style
Zhou, H.; Wang, J.; Liang, S. Design of a Novel Spectral Albedometer for Validating the MODerate Resolution Imaging Spectroradiometer Spectral Albedo Product. Remote Sens. 2018, 10, 101. https://doi.org/10.3390/rs10010101
AMA Style
Zhou H, Wang J, Liang S. Design of a Novel Spectral Albedometer for Validating the MODerate Resolution Imaging Spectroradiometer Spectral Albedo Product. Remote Sensing. 2018; 10(1):101. https://doi.org/10.3390/rs10010101
Chicago/Turabian StyleZhou, Hongmin, Jindi Wang, and Shunlin Liang. 2018. "Design of a Novel Spectral Albedometer for Validating the MODerate Resolution Imaging Spectroradiometer Spectral Albedo Product" Remote Sensing 10, no. 1: 101. https://doi.org/10.3390/rs10010101
Note that from the first issue of 2016, this journal uses article numbers instead of page numbers. See further details here.