Economic and Environmental Cost Analysis of Incineration and Recovery Alternatives for Flammable Industrial Waste: The Case of South Korea


Business School, Kwangwoon University, Seoul 01897, Korea
*
Author to whom correspondence should be addressed.
Sustainability 2017, 9(9), 1638; https://doi.org/10.3390/su9091638
Submission received: 9 August 2017
/
Revised: 11 September 2017
/
Accepted: 12 September 2017
/
Published: 15 September 2017
(This article belongs to the Special Issue Sustainability in Solid Waste Management)
Abstract
:As the generation of industrial wastes increases, waste treatment is steadily becoming a serious economic and environmental issue. Existing waste has mainly been treated by landfilling after incineration. A shortage of landfill sites necessitates waste management alternatives other than traditional incineration and landfill. This paper focuses on a cost-benefit analysis that evaluates the economic and environmental performances of five treatment strategies for flammable industrial wastes: incineration, refuse plastic fuel (RPF) boiler, RPF cement furnace, cement furnace after shredding of wastes, and paper incineration after shredding of wastes. For such purposes, our model considered the entire process of each waste treatment, which involves collection, transportation, treatment, recovery, and the disposal of flammable industrial wastes that pose risks to their surroundings. Case studies of each treatment processes are reviewed, and a cost-benefit analysis is performed to evaluate and identify the selection of treatment and disposal facilities, along with an allocation of flammable industrial wastes and waste residues from generators to treatment and disposal facilities and transportation routes, in order to achieve the minimum economic and environmental costs.
1. Introduction
The continual increase of industrial wastes is forcing the government and related companies to actively explore ways to effectively utilize the generated waste. In particular, a comprehensive analysis is required that considers the treatment and environmental costs and pollution emissions of the various treatments of incinerating or recycling industrial wastes produced nationwide [1].
In particular, flammable industrial wastes were normally incinerated and placed into landfills, but incinerating wastes and recovering their residual heat for recycling has become common. However, wastes are preferably recycled as fuels for boilers, or as substitute fuels in the cement and paper manufacturing industries through conversion into solid fuels, such as refuse plastic fuel (RPF) [2,3].
However, some scholars and industries have indicated that there are no significant advantages to recovering wastes as RPF or as fuel for cement furnaces or paper manufacturing boilers compared with energy recovery through incineration. This result occurs because the boilers for cement and paper manufacturing are concentrated in particular areas and may generate greater transportation costs, while the incineration facilities are widely spread nationwide. Thus, this study was conducted to compare the two techniques using a cost-benefit analysis that involves the construction and operational costs of each facility in the entire treatment process, as well as transportation costs between facilities and the recovering, disposal, and environmental costs accrued from air pollution emissions during treatment.
Recently, many studies have evaluated the economic and environmental effects of the entire processes for waste management. Morrissey and Browne [4] reviewed the types of decision-making models that are being used in municipal waste management. These authors divided reviewed papers into three categories: models based on cost-benefit analysis, those based on life cycle assessment, and those based on multi-criteria decision making. In addition, these authors argued that waste models must consider environmental, economic, and social aspects. Suh and Rousseaux [5] evaluated the resource consumptions and pollutant emissions, and the consequent environmental impacts of alternative sewage sludge treatment scenarios during operation in the European Union (EU). Tarantini et al. [6] evaluated the potential environmental burdens of waste management in the industrial area of 1st Macrolotto, one of the eight areas of the Sustainable Industrial Area Model (SIAM) project. Villeneuve et al. [7] presented a process-based analysis simulating the waste management system in a collection basin in Paris. A detailed analysis of a waste management system using local data of waste streams and treatment units provides technical indicators of system efficiency, such as recycling rates, energy recovery, emission fluxes, and related costs. Lee et al. [8] examined individual treatment systems, including landfill, incineration, composting, and feed manufacturing using data collected from 1997 to 2005. These authors indicated that landfills are the main contributors to human toxicity and global warming. Cherubini [9] analyzed the environmental effect on biogas-recovering landfill sites, city waste classification facilities, and incineration facilities as a waste control strategy. Wittmaier et al. [10] compared and analyzed the environmental effects of the landfill and incineration methods in northern Germany. Mendes et al. [11] compared three types of incineration treatment methods (incineration facilities equipped with sludge landfill facilities, those equipped with sludge-melting facilities, and brick productions with sludge-melting facilities) and two landfill methods (whether to recycle energy) using the city wastes that are produced in Sao Paulo, Brazil as the subjects. Cleary [12] arranged the characteristics, common issues, purposes, and evaluation contents of the effects of each thesis into more manageable shapes by selecting 20 theses that compared and analyzed waste treatment measures. Samanlioglu [13] developed a new multi-objective location-routing model to decide on: the locations of treatment centers utilizing different technologies to route different types of industrial hazardous wastes to compatible treatment centers, the locations of recycling centers and the routing of hazardous waste and waste residues to those centers, and the locations of disposal centers and the routing of waste residues there. A few papers have used the environmental damage costs to conduct a cost-benefit analysis of air pollution [14,15]. The environmental damage cost analysis considers the costs associated with flows of pollutants such as CO, CO2, SOx, NOx and PM. The environmental damage cost is expressed in terms of the total pollution damage cost due to pollutants by multiplying their flow rates by their corresponding unit damage cost.
The majority of the research has focused on incorporating the cost of environmental damage due to the air pollution emissions that are produced by each treatment facility, while many different theses have created various scenarios involving waste control measures, and have analyzed these scenarios using pretreatment techniques. There has been no research, however, involving a quantitative cost analysis of all of the treatment paths considering the waste transportation in each treatment method, and the environmental damage costs accrued from the air pollution emissions during treatment.
2. Overview of Waste Treatment Methods
The severity of the threat rising from rapid changes in the global climate and the accelerated depletion of natural resources is demanding urgent transition to low-carbon energy sources and low-energy consumption systems. The need for clean energy sources with limited emissions of greenhouse gas and environmental pollution is emerging as one of the key factors determining the future of a country’s economy. The acquisition of clean energy sources is both a constraint and an opportunity factor for a country’s economic development [16,17].
Among various possibilities, the development and distribution of waste resource energy-related technology development and distribution is being pursued vigorously worldwide. Since the early 2000s, the EU has made many efforts to develop and commercialize waste resource and biomass energy-related technology through green papers on waste resource and biomass energy action plans. For example, the “Landfill Directive”, issued in 1999, prohibits and in turn has continuously decreased direct landfill of recyclable and reclaimable wastes [18,19,20].
Germany possesses world-class waste energy technology capability. From 78 domestic facilities, 7.2 million tons of waste is turned into three million tons of RPF. These are used as the main/auxiliary fuel in RPF power generation facilities, thermal power plants, and cement furnaces [21].
In the United States (US), waste is regulated as an important source of energy, and many policies are continuously driven to vitalize technology development and facilitate implementation. Through the rapid development and invigoration of the European RPF technology, over 25 manufacturing facilities and over 30 RPF–coal dual fuel power plants are in operation. In addition, electricity and heat generation energy facilities are in operation by changing traditional incineration processes into thermal treatment processes [22].
In Japan, the major waste treatment method is incineration, and the number of incinerators was 1173 in 2013. However, small-to-medium sized incinerators in Japan have been replaced by RPF facilities since the mid-1990s. Manufactured RPF are gathered at RPF power generation facilities for large-scale process. There are over 60 municipal waste RPF facilities and five RPF power generation facilities in operation [23,24].
In Korea, the continuous increase of industrial waste reflects the progressive growth of the Korean economy. In 2014, 9.4% of the overall waste (including both municipal and industrial waste) was landfilled, 6.1% was incinerated, 83.9% was recycle/reused, and 0.4% was discharged into the ocean. The rate of incineration is gradually increasing, the rate of recycle/reuse had changed from increasing to decreasing, and rate of landfill had been declining greatly since 2005 [25,26].
The number of incineration facilities for municipal and industrial waste in Korea was 476, and the overall incineration capacity was 32,007 tons/day (2014). Among numerous waste-to-energy sources, the energy production from municipal/industrial waste incineration heat collection facilities amounted to 1.666 million TOE and accounted for 14.4%. There were 32 landfill facilities, and throughput was 4.4 million tons/year. Total landfill capacity was 40.9 million m3, of which 56.2% had been used. The amount of RPF usage was 880 thousand tons, which was a 63% increase from the previous year’s 540 thousand tons.
As of 2014, there were 243 RPF production facilities, 770 thousand tons of RPF were produced, and the amount was steadily increasing. There were 137 RPF utilization facilities, including 35 power plants and 21 paper manufacturing plants. There were 11 combustible waste energy production facilities, and 586 thousand TOE was produced, which accounted for 5.1% of the total waste-to-energy production.
Figure 1 shows Korea’s waste treatment status in 2010. The 8950 tons/day of wastes produced nationwide by the treatment method shows that 48.0% of the wastes were treated by incineration, and 48.8% were recycled. Special recycling-shredding companies processed 2573 tons, of which 403 tons were processed to manufacture RPF, 474 tons were sent to paper-manufacturing incinerators, and 1690 tons were used as cement furnace fuel. In addition, 302 tons were used as boiler fuel after RPF manufacturing, and 107 tons as cement furnace fuel mixed with RPF.
The current treatment methods for industry-produced wastes are largely classified into incineration and recovering, as shown in Table 1. Recovering includes four different treatment methods, according to RPF manufacturing and the application of recycled waste fuels.
Table 2 gives an overview of the treatment methods, with the different treatment paths and the characteristics of each treatment paths.
We considered two cases to analyze the economic and environmental impacts by treatment method. Case 1 presents a scenario where an economic and environmental cost analysis is conducted, assuming that the entire quantity is treated and not considering the flow of the actual materials in each treatment path, using the wastes produced for 30 days as subjects. Case 2 explains the other scenario, where an economic and environmental cost analysis is based on the actual waste treatment quantity by treatment method for the current industrial wastes, as shown in Figure 1.
3. Cost Analysis by Treatment Path
The economic analysis in each treatment method focuses on the construction and operation costs for incineration and energy recovery facilities in the individual treatment path of wastes, and the costs arising from the transport between facilities. Moreover, the environmental damage costs were calculated considering the air pollution emissions arising in the treatment paths—i.e., the stationary pollution sources produced in the treatment facilities and the mobile pollution sources caused during transport. Figure 2 shows the procedure of the cost analysis by treatment method.
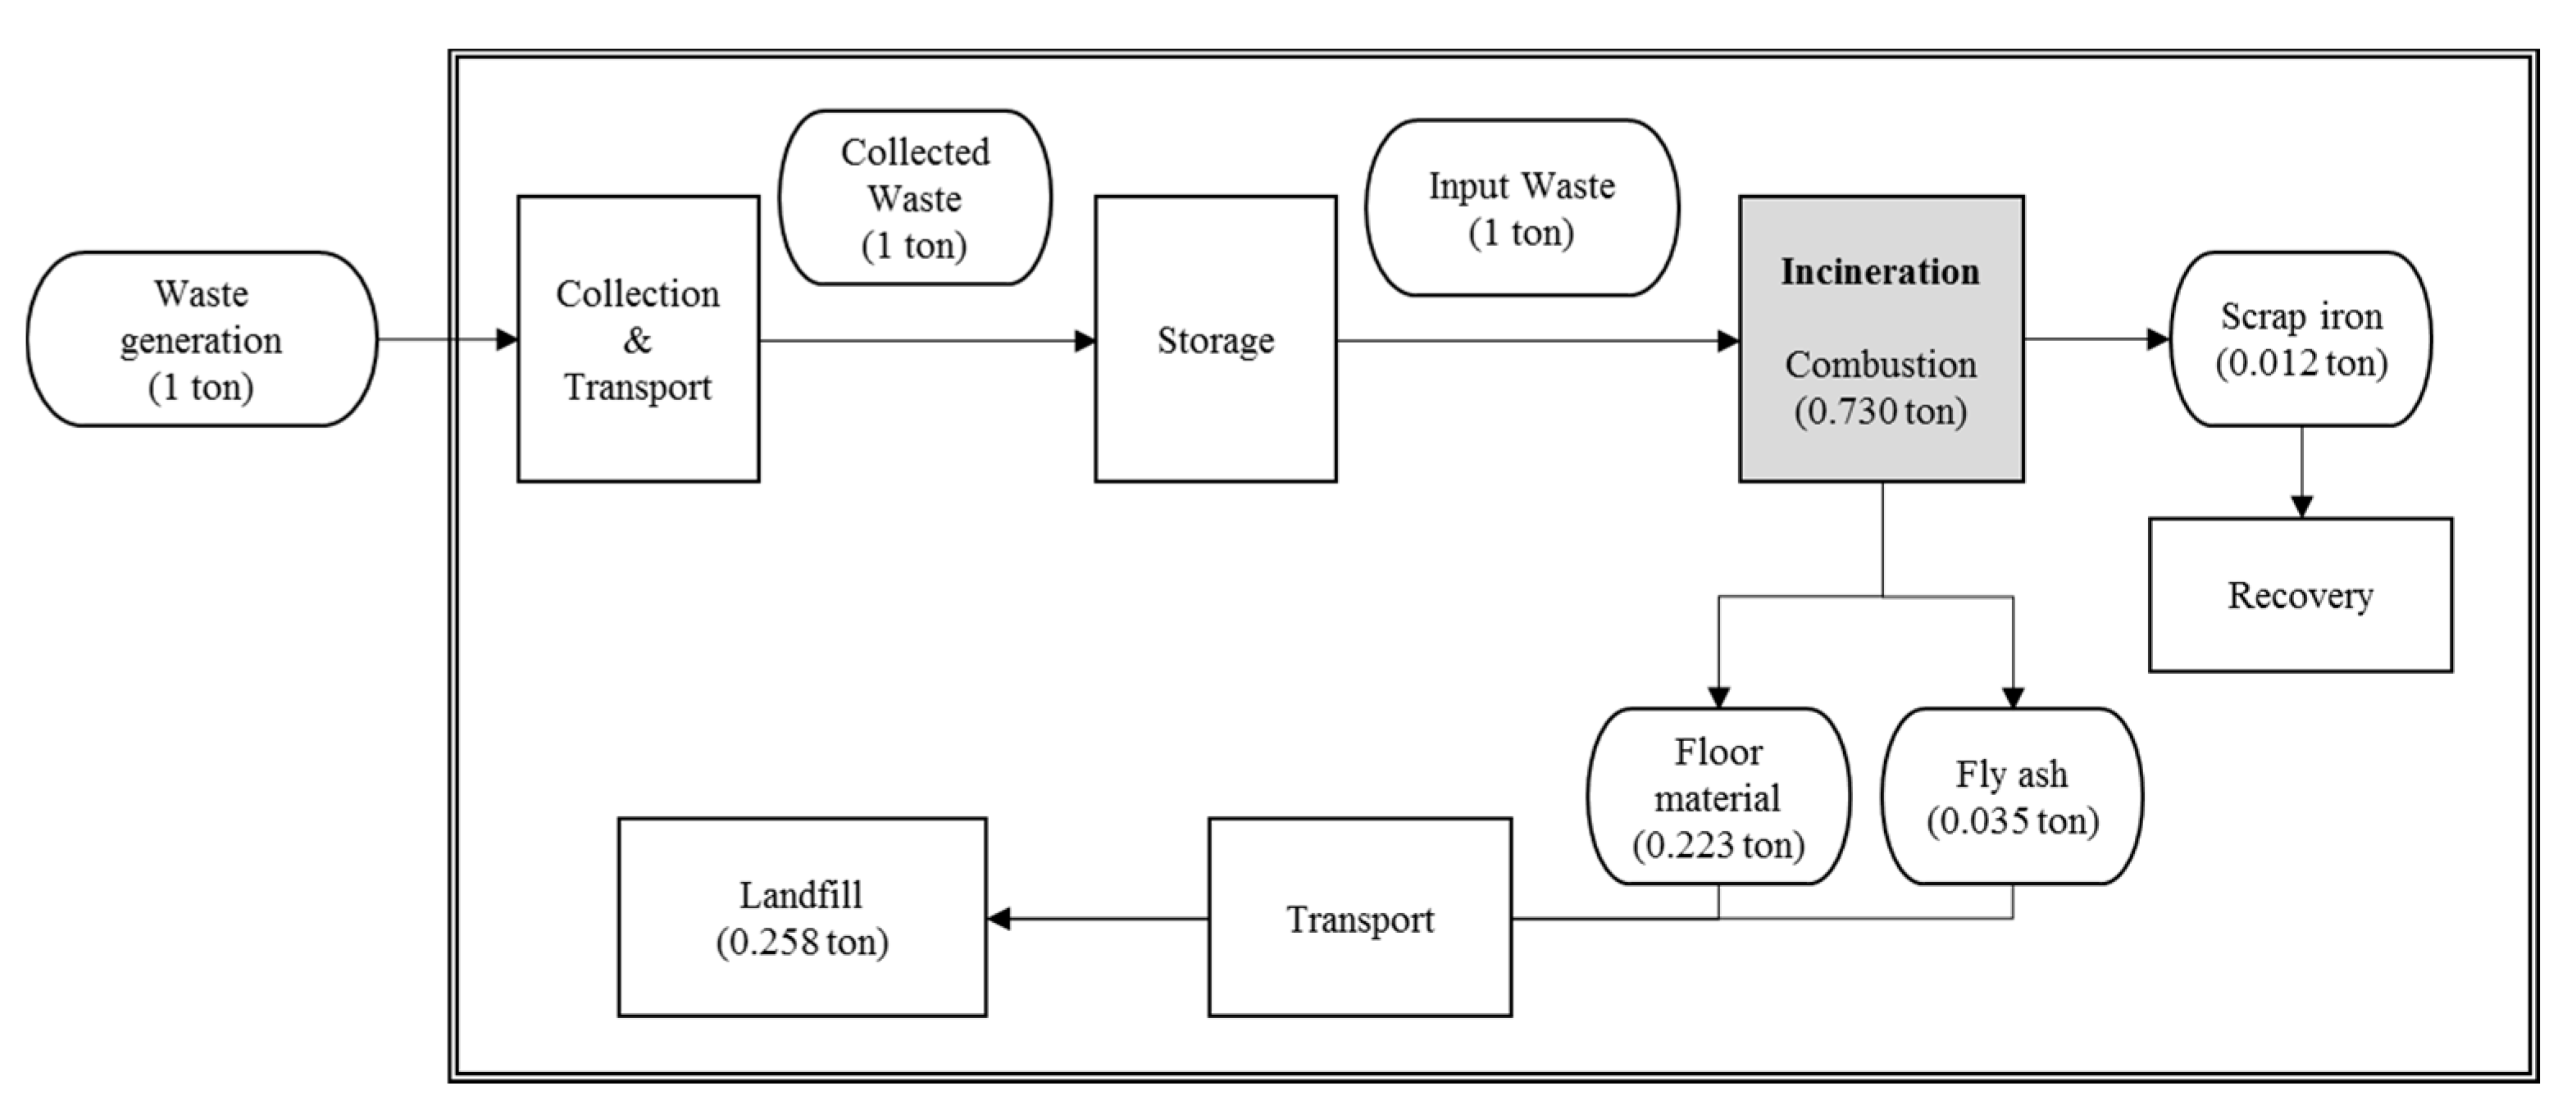
Figure 3 shows the material balance flow of the incineration treatment method. The rest of material balance flows of all other methods are referred in Appendix A. For example, the treatment path of industrial wastes using an incinerator is restricted within the boundary from collecting and transporting from the industrial waste sources, incinerating the delivered wastes, and reclaiming the incineration residues and recovering the valuables; as well as determining the material balance in each treatment path’s treatment quantity, the residue quantity (e.g., fly ashes and floor materials), and the quantity of recovered valuables. These factors were based on the results of surveys from 14 incineration companies in Korea. The description of the material balance flow of the incineration method is as follows. One ton of industrial waste is collected and transported to storage. The amassed waste is sent to the incinerator, where 0.730 ton is combusted, and 0.258 ton of residue and 0.012 ton of scrap iron is left. The combustion residues (0.223 ton of floor material and 0.035 ton of fly ash) are landfilled, and the scrap iron is recovered.
3.1. Investigation of Industrial Waste Production
For the analysis, an investigation was conducted on the 2007 industrial waste production status by region. Due to the difficulty of reflecting the locations of all of the businesses nationwide, the waste sources were grouped by region, and the locations of the city or provincial governments in all of the regions were assumed as the source footholds. Table 3 shows the data regarding the nationwide waste production status [27].
3.2. Investigation of Waste Treatment Companies
The status of each treatment method and waste treatment company was investigated, including the licensed capacity, annual waste treatment quantity, licensed capacity by facility location, and treatment quantity and location. A distribution matrix between the treatment facilities was used to determine the treatment and transportation quantities by facility. The determination of the distribution quantity between the waste production regions and incineration companies was made by allocating the quantity of each incineration company (1) within the same area; and (2) by additionally allocating the emissions of the neighboring regions to those companies without full capacities. The recycling treatment method also determined the distribution quantities, from the emission sources to the shredding companies, and from the shredding companies to the RPF manufacturers, in the same way as with incineration.
3.3. Calculation of the Construction and Operation Costs for Each Facility in the Treatment
Fixed unit cost is a fixed recurring cost according to the total investment of the facilities, and is composed of capital costs and depreciation costs. Regarding capital costs, if the total construction cost is expected to be recovered within the facility’s lifespan, the cost can be calculated from the capital recovery factor (CRF), which converts the current value into annual equivalence plus the depreciation rate, which is a loss cost of assets without cash payment. Moreover, the capital recovery factor can be calculated from a power plant’s total lifetime and interest rate (Equation (1)). The rate of depreciation (D) is shown by the straight line method, as mentioned above (Equation (2)). The capital rate can be represented as the depreciation rate subtracted from the CRF and, therefore, can be equated as below (Equation (3)).
where : Discount rate; : Facility lifespan; : Capital recovery factor; : Depreciation rate; and : Capital ratio.
The operation maintenance cost was calculated by dividing the amount obtained by applying the price index to the operation maintenance cost with the initial investment.
where : Operation maintenance cost and : Initial investment.
It is necessary to equalize the costs irregularly occurring by year and the waste treatment quantity in order to compare the alternatives whose costs vary every year and whose waste treatment quantities differ. The levelized cost of overall operation calculates the facility operation unit price using the cost and treatment quantity. This method was used to calculate the unit price of the operation of the incineration and furnace facilities by treatment path.
where : Fixed cost; : Operation maintenance cost; : Fuel expenses; : Facility capacity; : Facility consumption ratio; : Facility use rate; : Operating hours; : Operation year; : Lifespan; : Inflation rate; and : Discount rate (%).
3.4. Transporation Route Design and Calculation of Transportation Costs for Each Treatment
In this research, the transportation quantity was determined from the “from-to matrix” between treatment facilities based on the location information of each treatment company, and the number of required vehicles was estimated based on 20 tons per vehicle. The GPS distance data were used to measure the distance between two locations, and the average value obtained through a survey of three companies was used as the transportation unit price. In addition, the loading costs of as much as 100,000 Korean won per vehicle were added considering the forklift rental. Below are the transportation costs of the two treatment facilities.
where : Number of required vehicles; : Distance between and ; : Transportation unit price between and ; and : Loading cost per vehicle.
3.5. Economic and Environmental Cost and Benefit Analysis for Each Treatment
Industrial waste treatment and energy recovery facilities substitute wastes for the bituminous coal or Bunker C oil that should be used, produce substitution effects, and generate revenues if the steam can be sold. As such, these factors are additionally reflected. Accordingly, the steam or RPF sale revenues and the energy substitution effects generated by the industrial waste recovery that can be expected in each treatment path were calculated. Table 4 shows the calculation process of the fuel substitution effects, assuming an RPF consumption of 100 tons/day.
The mobile pollution emission costs produced while the waste transportation vehicles are running, and the stationary pollutant emission costs produced by combustion at the waste treatment facilities, were considered when analyzing the environmental costs accrued from the pollutant emissions in each treatment method. Stationary emission occurs at a fixed location surrounded by buildings, infrastructure, and population. Therefore, the environmental cost for stationary emission should consider all of these factors (cost of environmental impacts, or health costs, or damage to infrastructure and buildings) [28]. It is physically difficult to estimate the damage to a specific building or people by mobile emission. Therefore, we calculated the environmental cost caused by transportation based on the maintenance cost method recommended in the United Nations (UN) System of Environmental-Economic Accounting (SEEA) handbook [29]. The environmental cost of mobile emission was obtained by multiplying the pollutant cost per km between two facilities after investigating the air pollution cost per unit according to the travel distance by vehicle type, as shown in Table 5 [30]. The pollutant emission costs that accrued from the stationary sources were calculated using the environmental damage costs incurred by the pollutant emissions, such as total suspended particulate (TSP), CO, SOx, and NOx, based on the treatment quantity of each treatment company.
Table 6 shows the quantity of air pollutant discharged per ton of emission material from the facilities, and the damage cost. As the United Nations Environmental Program (UNEP) calculates the weight according to the population of the emission facility construction area in the analysis of the environmental damage effects of air pollutants and advises the application of the values in the calculation of the environmental damage costs that accrued from the pollutant emissions, this research reflects these values.
The air pollutant emission quantities that were produced by the incineration facilities and furnaces were obtained from their own measurement data, and the emission densities of the incinerators and furnaces are presented in Table 7. Moreover, the actual emission quantities of each facility were calculated by multiplying the values of the waste material balance delivered into each facility with the average air pollutant emission quantity of the incinerators and furnaces.
4. Experimental Results
In this research, two cases analyzing the economic and environmental costs were investigated, as previously introduced. The results were converted to tons, and the parameters used for the analysis are as shown in Table 8.
4.1. Economic Cost Results
Table 9 shows that the lowest-cost method in case 1 used cement furnaces after shredding (201,202 won/ton), and the next lowest-cost method used the incinerators of intermediate treatment companies that consider the economic and environmental treatment costs (excluding the effects of fuel substitution and revenue generation). In case 2, the lowest-cost method also used cement furnaces after shredding (201,839 won/ton), and the second lowest-cost method used the incinerators of intermediate treatment companies (208,114 won/ton). Both cases 1 and 2 show that the lowest economic methods used the RPF boiler after manufacturing RPF, which is possibly because this treatment path is complicated, the transportation cost is high, and the facility operation cost is large.
4.2. Environmental Cost Results
The environmental costs by treatment path are presented in Table 10, in which the lowest-cost method used the paper manufacturing incinerator after shredding (57,445 won/ton) in case 1, and the treatment method expected to incur the highest environmental cost used the cement furnace. The cement furnace showed lower environmental feasibility regardless of RPF manufacturing, because its pollutant emission quantity is largely generated from stationary sources. Especially, CO and NOx played a major role in increasing the environmental costs. Notwithstanding long travel distance, transportation has little impact.
Case 2, as with case 1, showed the highest environmental feasibility in the method that used the paper-manufacturing incinerator after shredding. The analysis also showed that the highest environmental costs were incurred in the method using waste as fuel for the cement furnace after shredding in case 2.
4.3. Profit Analysis by Treatment Method
Table 11 shows a summary of the RPF and steam sales profits, as well as fuel substitution effects, by treatment method. This table presents the same results in cases 1 and 2; using the RPF boiler appeared to be associated with the highest profits (255,004 won/ton), and the lowest were associated with the method using the cement furnace.
4.4. Discussion
As shown in Table 12, the economic feasibility was greatest in the method that used incineration in case 1, because the simpler treatment path contributes to economic convenience and benefits regarding the treatment costs, and the sales profit and fuel substitution effects were excellent when the incineration residual heat was sold.
The environmental cost-benefit analysis results showed that population weight differences led to paper incinerators having 55,000 won/ton less than regular incinerators in stationary emission cost. As for mobile emission cost, paper incinerator costs more than incinerator due to the added step of semi-shredding. Combining both stationary and mobile emission costs, the paper incinerator showed better environmental feasibility than the regular incinerator.
The summary of the analysis results based on case 2, as with case 1, shows the superiority of the use of incineration regarding the economic costs and of the use of paper incinerators regarding the environmental costs and waste sale revenues. The path using the paper incinerators showed a 75% energy recovery rate and presented greater efficiency in fossil fuel substitution effects (the value of wastes) due to the increased substitution quantity for Bunker C. However, the path using the cement furnace after RPF manufacturing tended to generally show low-cost indices due to the increased transportation costs that accrued from the complicated treatment path and the greater air pollutant emission.
5. Conclusions
The main focus of waste incineration in the past was on the diminishment of the overall waste volume and hygienic treatment. Now, incineration plays a major role in waste energy production through heat energy recovery. Even though negative views in the past has led to a continual decrease in waste incineration rate, its recycling rate for use in RPF, fuel for cement furnace, and fuel for paper manufacturing furnaces is gradually increasing. However, both academia and the industry have argued that the overall feedstock recycle of RPF manufacture, cement, and paper production lacks preponderance compared with regular incineration, from both economic and environmental points of view. Further, there are increased treatment costs rising from the waste undergoing both shredding and reuse processes.
It has also been asserted that the waste energy production that includes waste shredding as well as its treatment at recycle facilities will incur inevitable cost increases in waste treatment, and lead to a certain decline in the recycle rate. To resolve such argument, this research will take an in-depth look at waste treatment in Korea. An objective and quantitative analysis of the economic and environmental benefits will include combustible industrial waste collection, transportation, and final heat energy treatment, as well as the use of waste-generated fuel for cement and paper manufacturing.
Comprehensive implications for each type of waste treatment are as follows. Incineration as the simplest treatment shows the highest economic benefit; high profit and effective fuel replacement prove its overall economic value. However, it has a low energy recovery rate of 50%, and displays relatively low evaluation of waste value and environmental benefits in comparison with paper incinerators with shredding. To improve the environmental benefits, expanded investment in energy recovery equipment is required.
The use of cement furnaces with shredding displays economic advantages, with low treatment costs due to its utilization of existing equipment. Nevertheless, long transportation and a greater emission of air pollutants incurs high environmental costs, and with a low fossil fuel replacement effect, the estimation of relative effectiveness is low. Additional installation of post-treatment facilities will ameliorate environmental damage. RPF manufacturing induces high transportation and operation costs. It requires the use of RPF-dedicated boilers and a simplification of treatment path.
The major contribution of this research is that it presents a model with numeric indices that can be used to compare different waste treatment methods. This enables a shift from qualitative to qualitative analysis evaluation, with consideration to both economic and environmental benefits.
With the acquisition of detailed information on waste flow quantity and the operation costs for each waste treatment path, and the inclusion of additional facilities that reflect possible changes in both regional and governmental policy, more precise and objective results will be made possible. Such outcomes will serve as scientific base data that can be utilized to draft future environment and energy-related policies.
Acknowledgments
The present research has been conducted by the Research Grant of Kwangwoon University in 2011. This work was supported by the Ministry of Education of Republic of Korea and the National Research Foundation of Korea (NRF-2016R1C1B1016054).
Author Contributions
Jihyun Kim developed the model and performed the experiments. He also drafted the experimental discussion presented in the paper. Sukjae Jeong was responsible for the ideation of the study and devised the basic outline of the paper.
Conflicts of Interest
The authors declare no conflicts of interest.
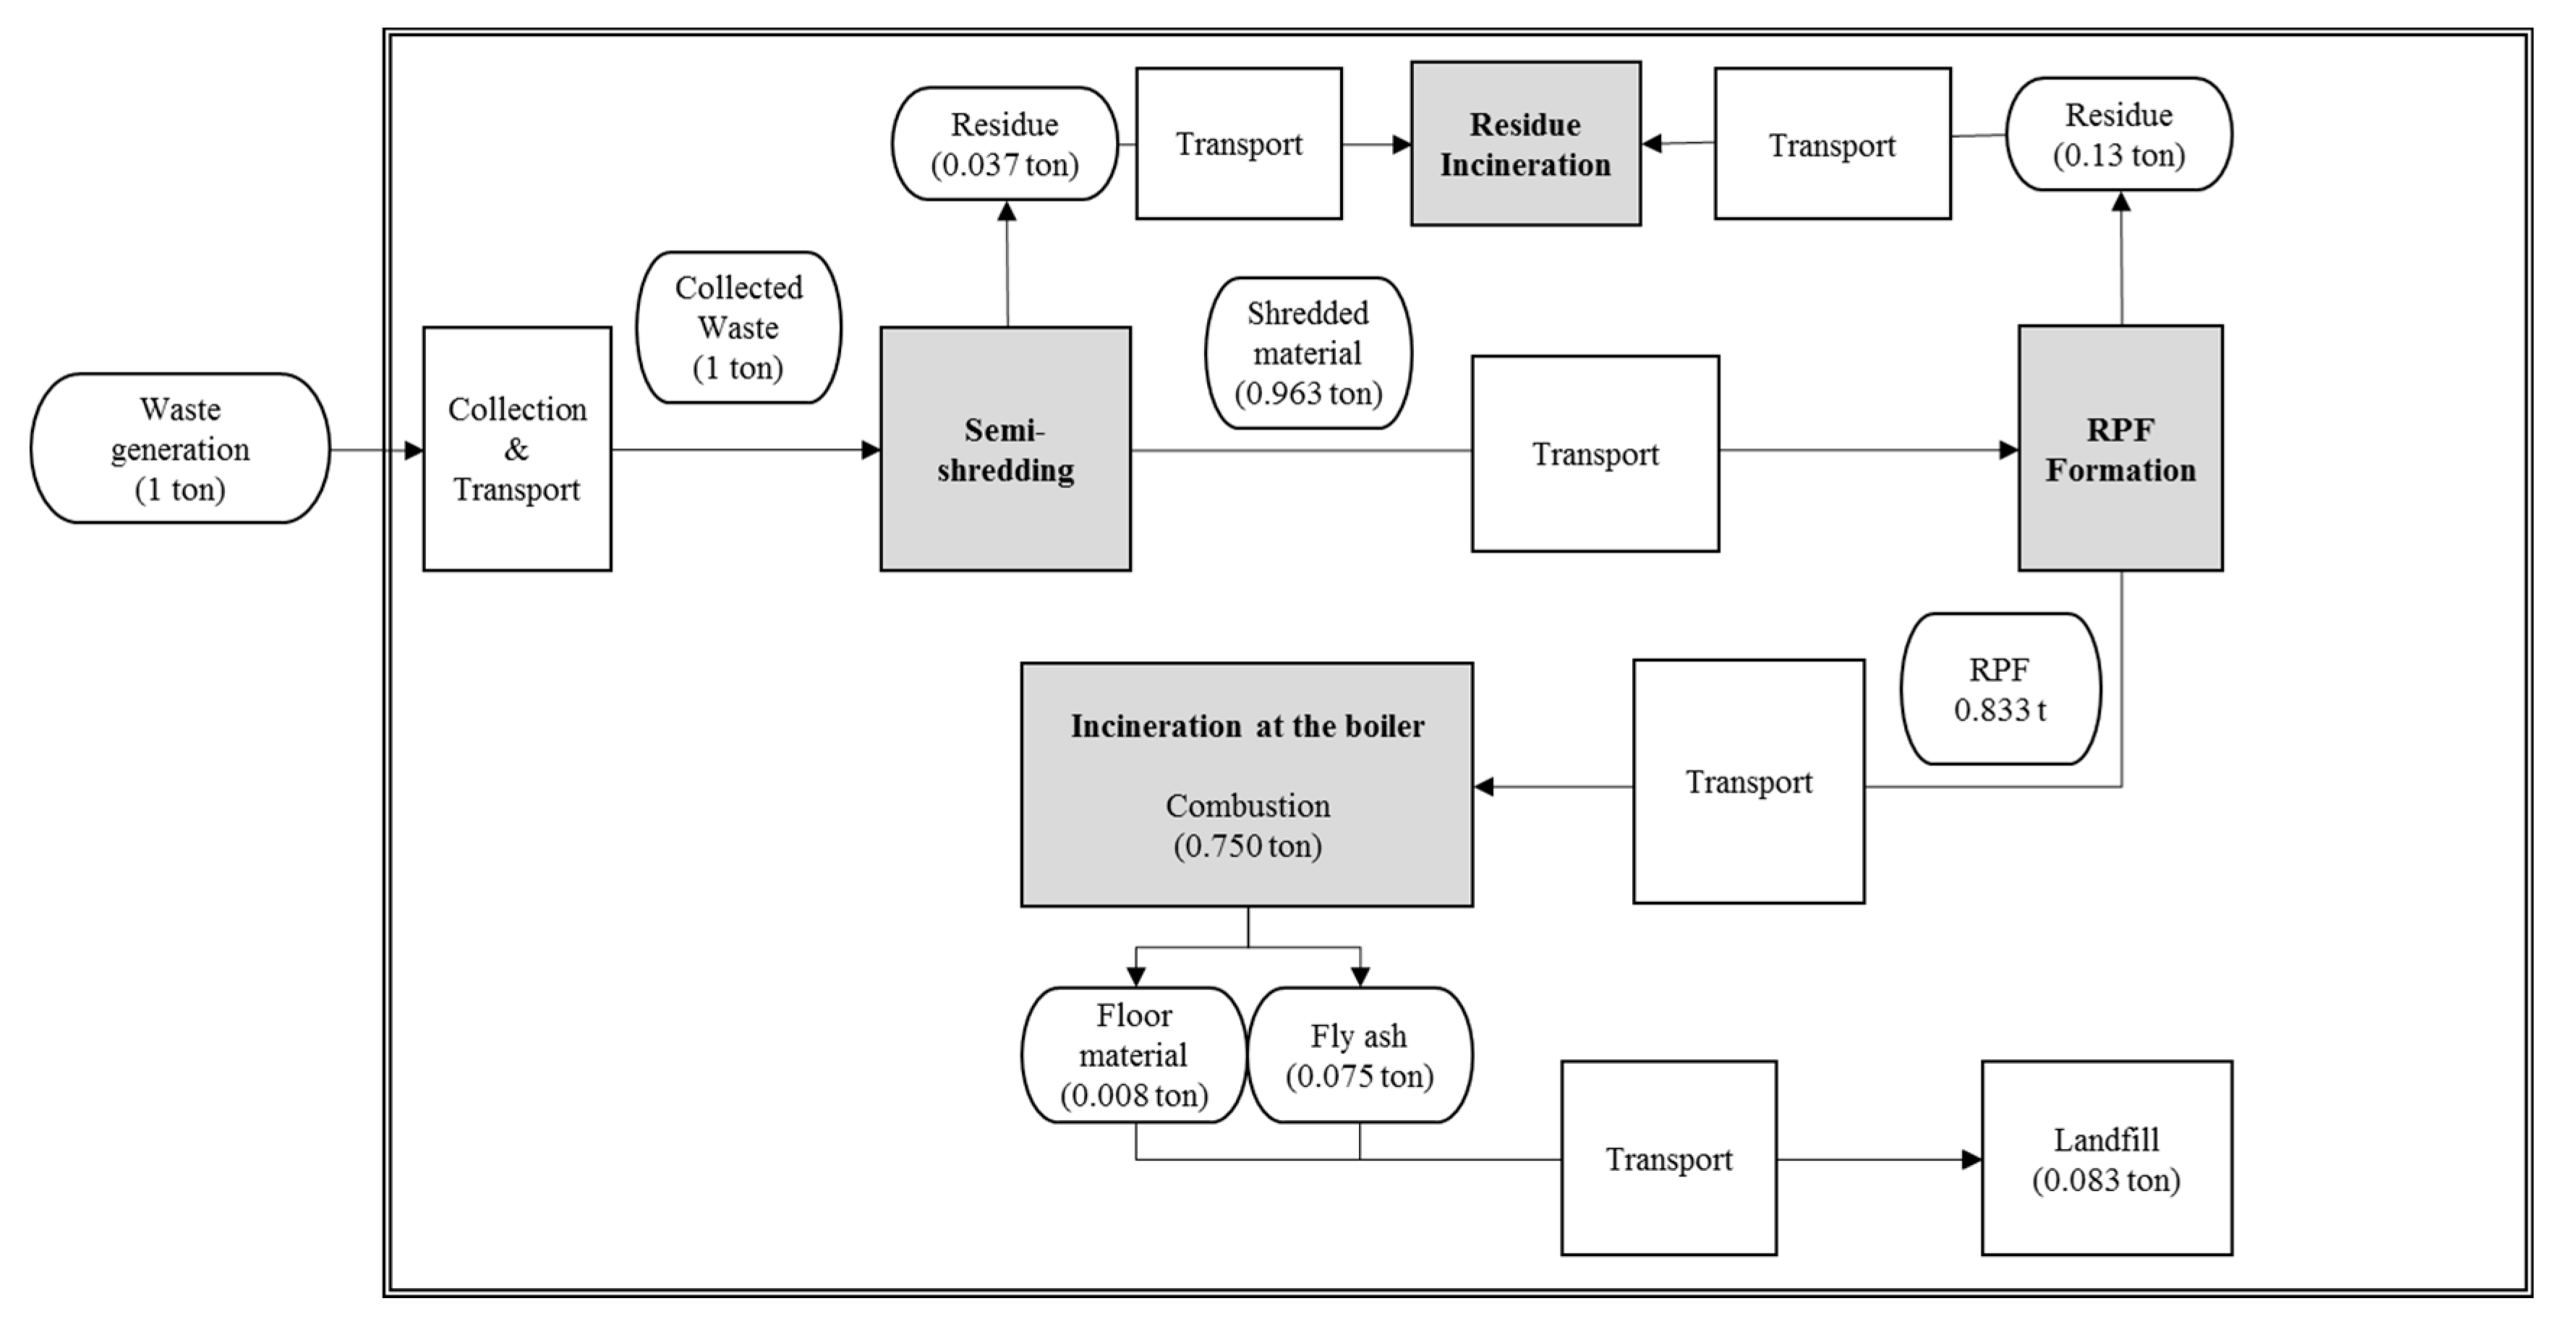
Appendix A
Figure A1.
Material balance flow per ton of RPF boiler treatment method.

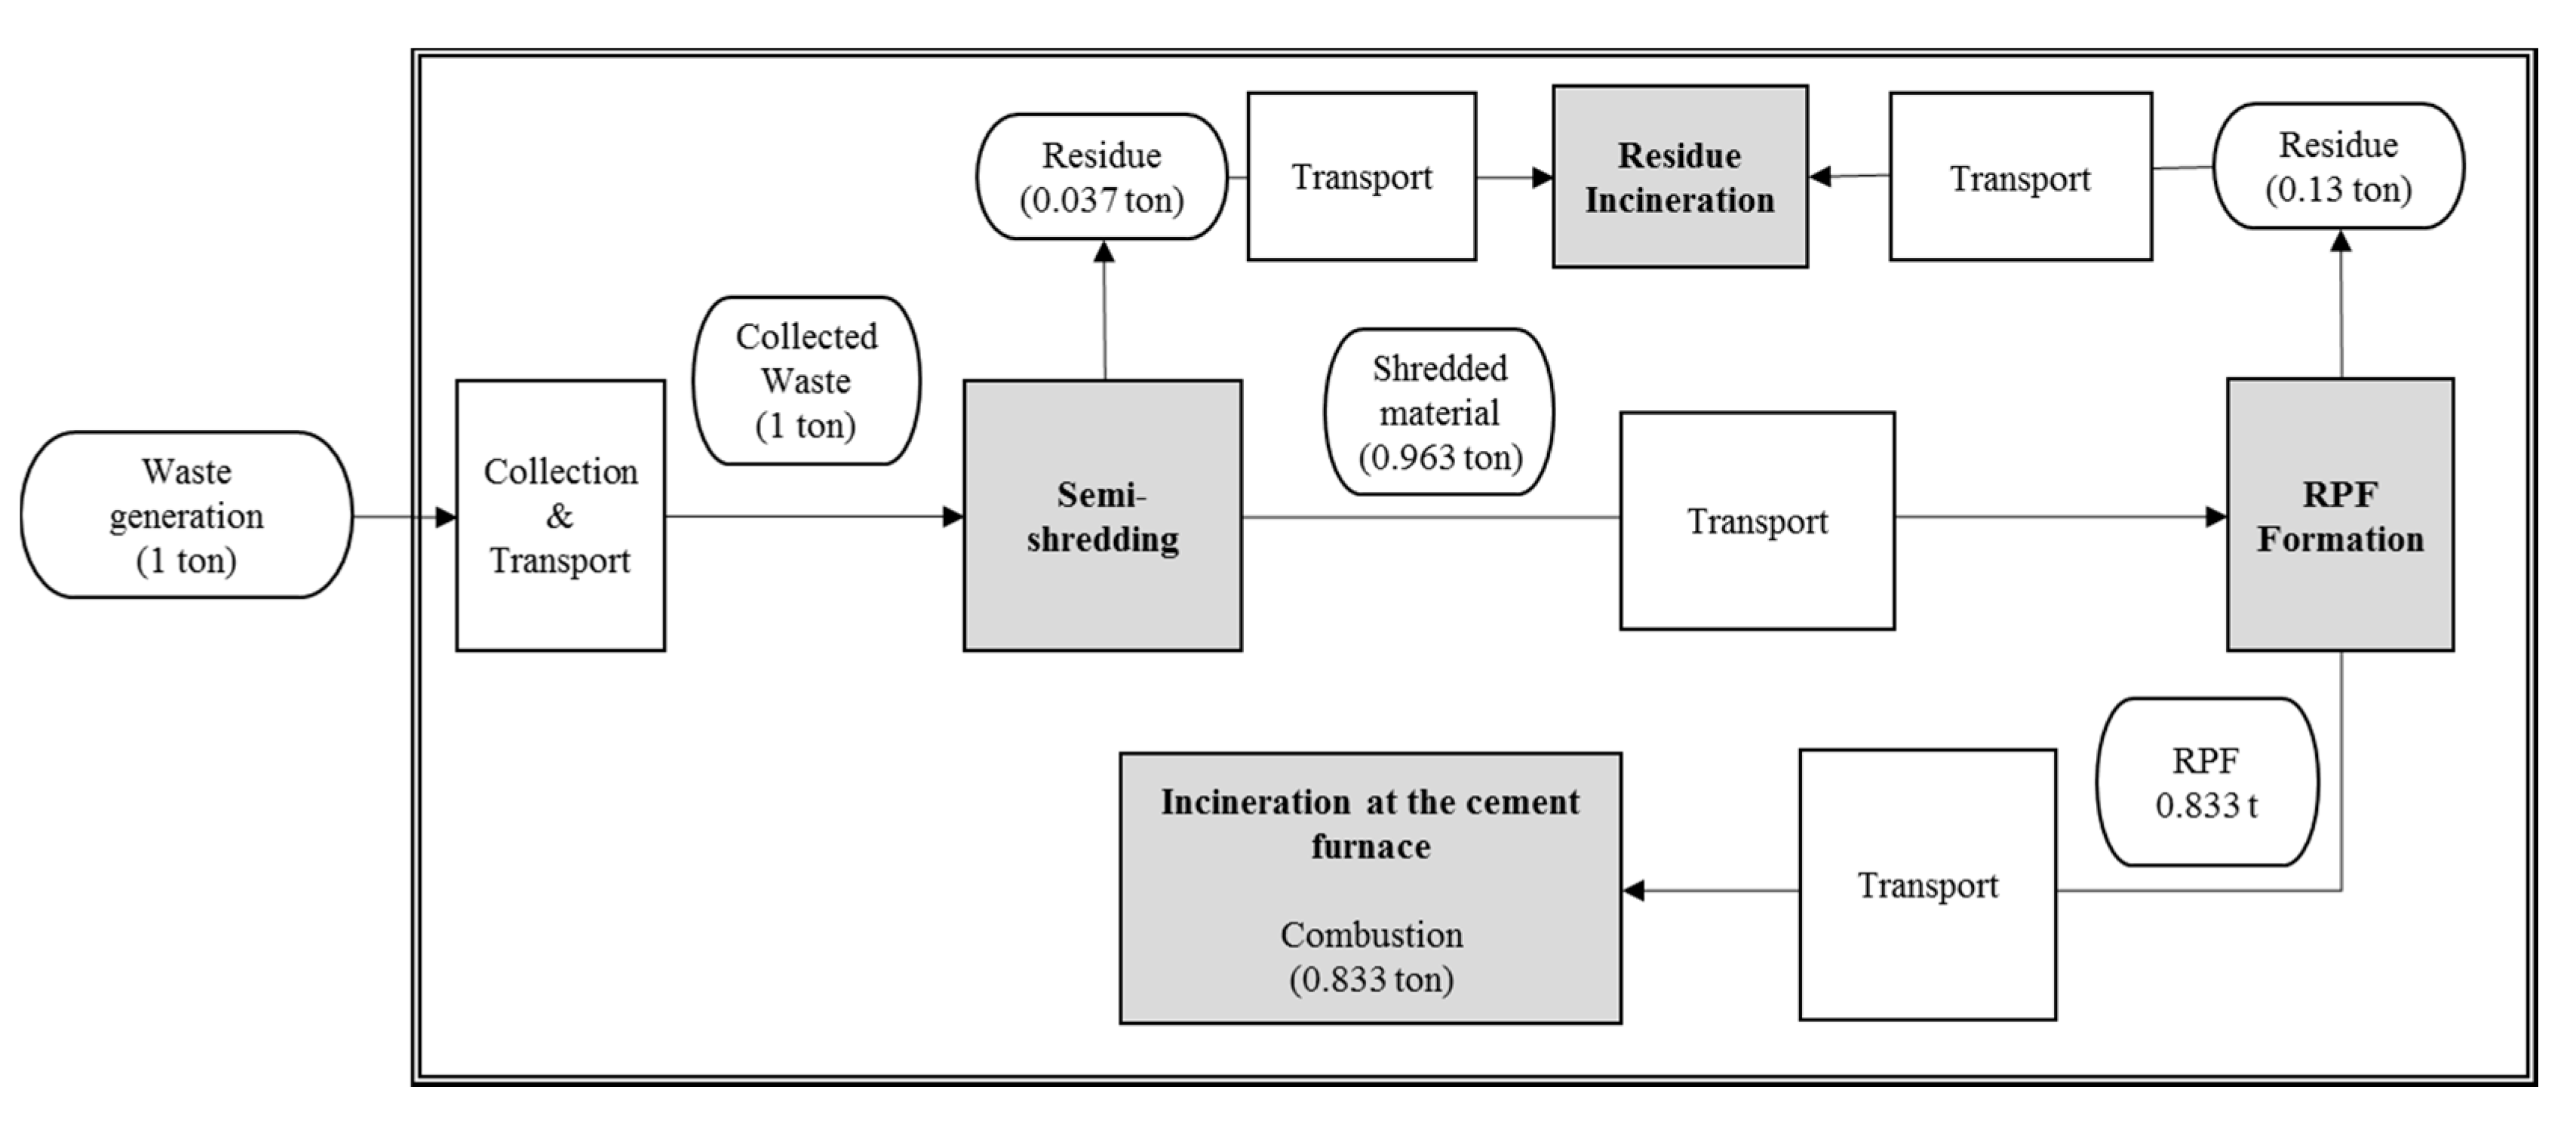
Figure A2.
Material balance flow per ton of RPF furnace treatment method.

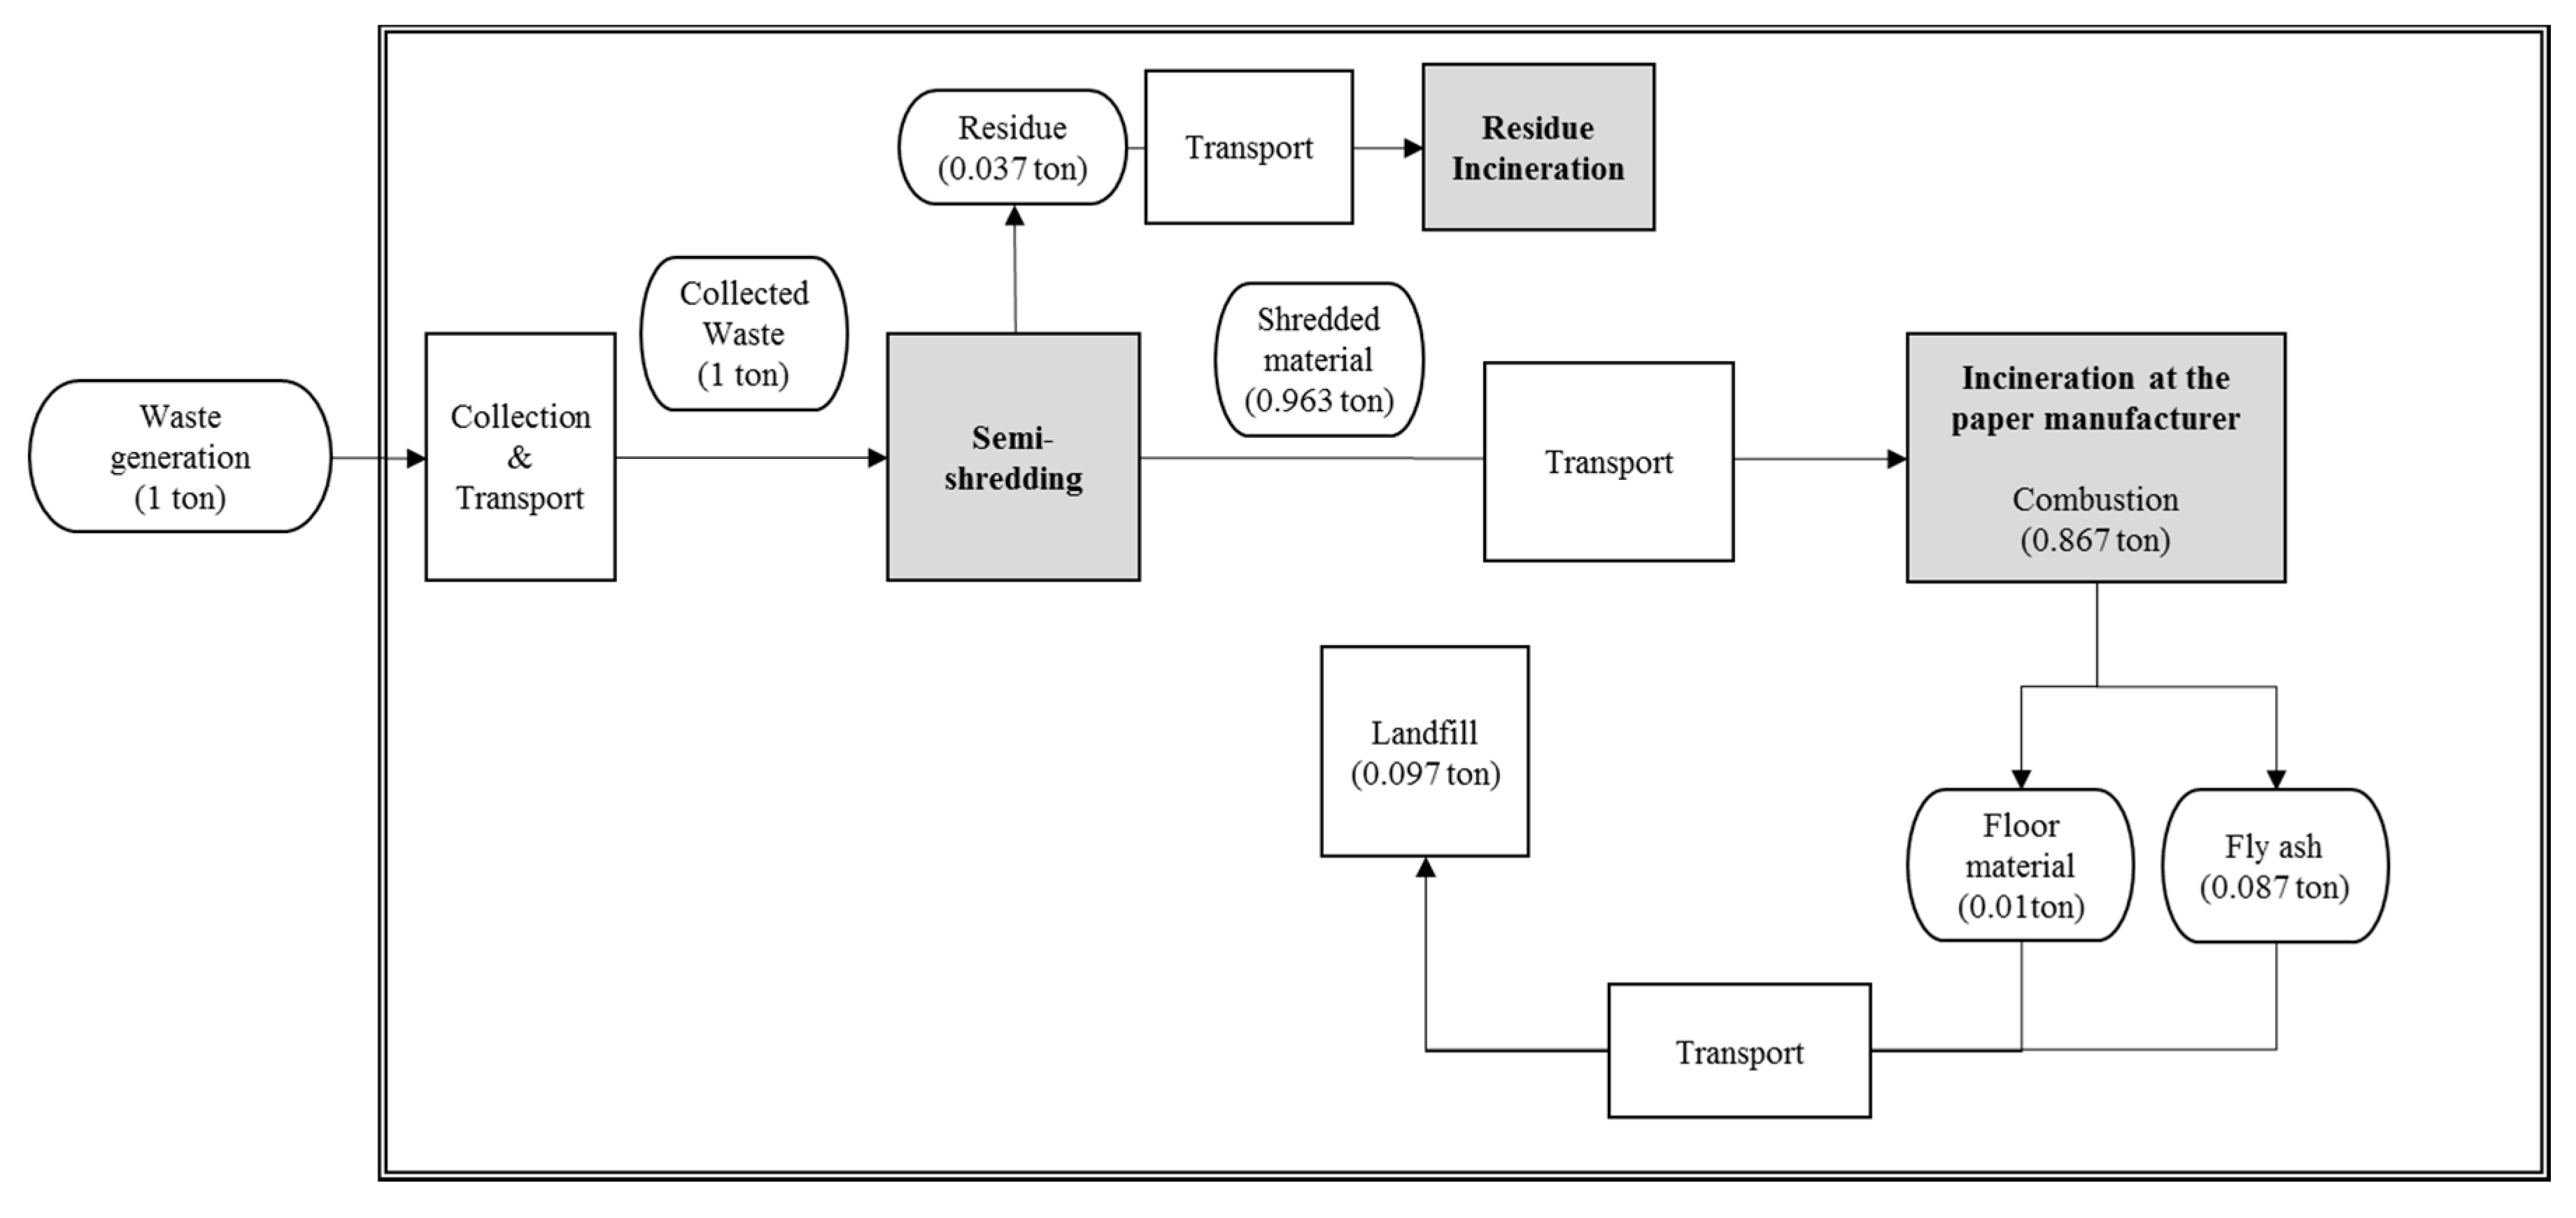
Figure A3.
Material balance flow per ton of paper incinerator treatment method.

Figure A4.
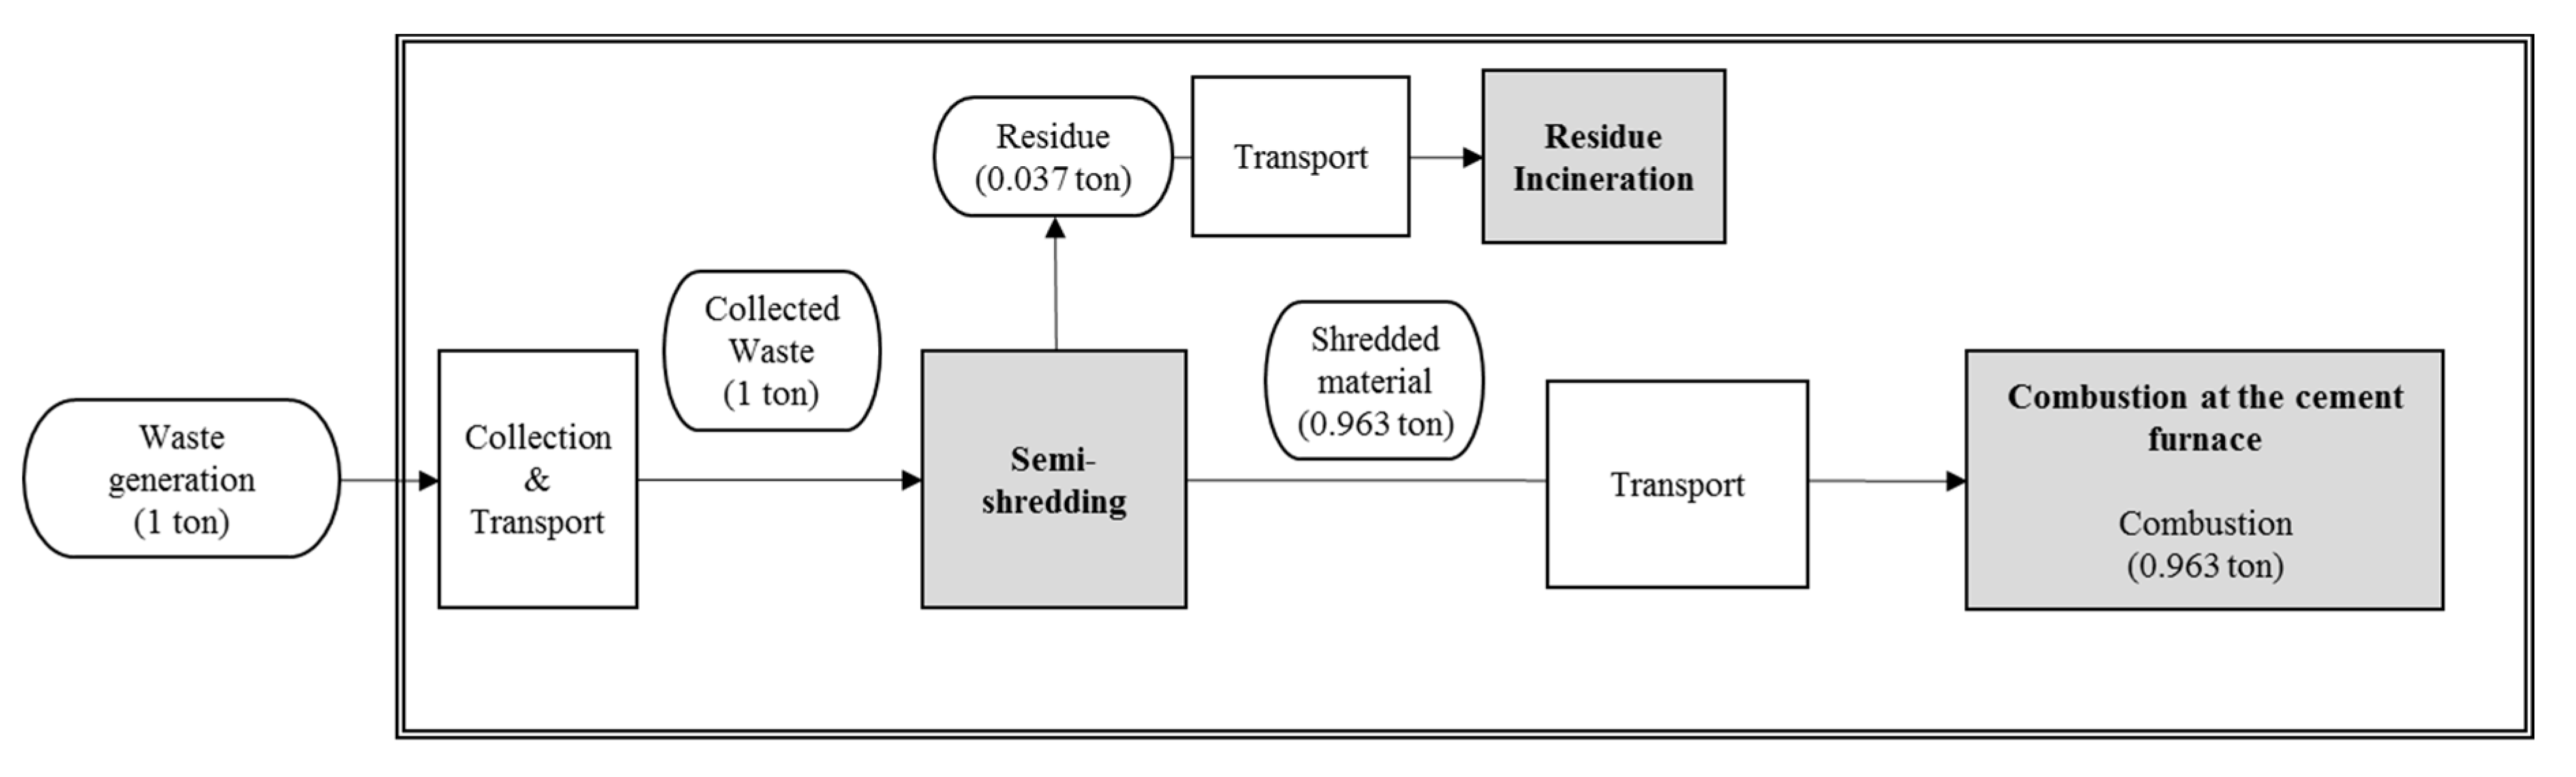
Material balance flow per ton of cement furnace treatment method.
References
- Kneese, A.V.; Ayres, R.U.; d’Arge, R.C. Economics and the Environment: A Materials Balance Approach; Routledge: Abingdon, UK, 2015. [Google Scholar]
- Sadef, Y.; Nizami, A.S.; Batool, S.A.; Chaudary, M.N.; Ouda, O.K.M.; Asam, Z.Z.; Habib, K.; Rehan, M.; Demirbas, A. Waste-to-energy and recycling value for developing integrated solid waste management plan in Lahore. Energy Sources Part B 2016, 11, 569–579. [Google Scholar] [CrossRef]
- Ripa, M.; Fiorentino, G.; Giani, H.; Clausen, A.; Ulgiati, S. Refuse recovered biomass fuel from municipal solid waste. A life cycle assessment. Appl. Energy 2017, 186, 211–225. [Google Scholar] [CrossRef]
- Morrissey, A.J.; Browne, J. Waste management models and their application to sustainable waste management. Waste Manag. 2004, 24, 297–308. [Google Scholar] [CrossRef] [PubMed]
- Suh, Y.J.; Rousseaux, P. An LCA of alternative wastewater sludge treatment scenarios. Resour. Conserv. Recycl. 2002, 35, 191–200. [Google Scholar] [CrossRef]
- Tarantini, M.; Loprieno, A.D.; Cucchi, E.; Frenquellucci, F. Life Cycle Assessment of waste management systems in Italian industrial areas: Case study of 1st Macrolotto of Prato. Energy 2009, 34, 613–622. [Google Scholar] [CrossRef]
- Villeneuve, J.; Michel, P.; Fournet, D.; Lafon, C.; Menard, Y.; Wavrer, P.; Guyonnet, D. Process-based analysis of waste management system: A case study. Waste Manag. 2009, 29, 2–11. [Google Scholar] [CrossRef] [PubMed]
- Lee, J.; Kim, J.; Park, I.; Kwon, O.; Lee, W. Comparative Analysis of Waste Incineration Methods and Its Application in Kyonggi-Do; Kyonggi Research Institute: Suwon, Korea, 2007. [Google Scholar]
- Cherubini, F.; Bargigli, S.; Ulgiati, S. Life cycle assessment (LCA) of waste management strategies: Landfilling, sorting plant and incineration. Energy 2009, 34, 2116–2123. [Google Scholar] [CrossRef]
- Wittmaier, M.; Langer, B.; Sawilla, S. Possibilities and limitations of life cycle assessment (LCA) in the development of waste utilization systems: Applied example for a region in Northern Germany. Waste Manag. 2009, 29, 1732–1738. [Google Scholar] [CrossRef] [PubMed]
- Mendes, M.R.; Aramaki, T.; Hanaki, K. Comparison of the environmental impact of incineration and landfilling in Sao Paulo City as determined by LCA. Resour. Conserv. Recycl. 2004, 41, 47–63. [Google Scholar] [CrossRef]
- Cleary, J. Life cycle assessment of municipal solid waste management systems: A comparative analysis of selected peer-reviewed literature. Environ. Int. 2009, 35, 1256–1266. [Google Scholar] [CrossRef] [PubMed]
- Samanlioglu, F. A multi-objective mathematical model for the industrial hazardous waste location-routing problem. Eur. J. Oper. Res. 2013, 226, 332–340. [Google Scholar] [CrossRef]
- Faizal, M.; Saidur, R.; Mekhilef, S.; Alim, M.A. Energy, economic and environmental analysis of metal oxides nanofluid for flat-plate solar collector. Energy Convers. Manag. 2013, 76, 162–168. [Google Scholar] [CrossRef]
- Balli, O.; Hepbasli, A. Exergoeconomic, sustainability and environmental damage cost analyses of T56 turboprop engine. Energy 2014, 64, 582–600. [Google Scholar] [CrossRef]
- Sen, S.; Ganguly, S. Opportunities, barriers and issues with renewable energy development—A discussion. Renew. Sustain. Energy Rev. 2017, 69, 1170–1181. [Google Scholar] [CrossRef]
- Heidari, N.; Pearce, J.M. A review of greenhouse gas emission liabilities as the value of renewable energy for mitigating lawsuits for climate change related damages. Renew. Sustain. Energy Rev. 2016, 55, 899–908. [Google Scholar] [CrossRef]
- Proskurina, S.; Sikkema, R.; Heinimö, J.; Vakkilainen, E. Five years left—How are the EU member states contributing to the 20% target for EU’s renewable energy consumption; the role of woody biomass. Biomass Bioenergy 2016, 95, 64–77. [Google Scholar] [CrossRef]
- Brennan, R.B.; Healy, M.G.; Morrison, L.; Hynes, S.; Norton, D.; Clifford, E. Management of landfill leachate: The legacy of European Union Directives. Waste Manag. 2016, 55, 355–363. [Google Scholar] [CrossRef] [PubMed]
- Lombardi, L.; Carnevale, E.; Corti, A. A review of technologies and performances of thermal treatment systems for energy recovery from waste. Waste Manag. 2015, 37, 26–44. [Google Scholar] [CrossRef] [PubMed]
- Cecere, G.; Martinelli, A. Drivers of knowledge accumulation in electronic waste management: An analysis of publication data. Res. Policy 2017, 46, 925–938. [Google Scholar] [CrossRef]
- Psomopoulos, C.S.; Bourka, A.; Themelis, N.J. Waste-to-energy: A review of the status and benefits in USA. Waste Manag. 2009, 29, 1718–1724. [Google Scholar] [CrossRef] [PubMed]
- Themelis, N.J.; Mussche, C. Municipal solid waste management and waste-to-energy in the United States, China and Japan. In Proceedings of the 2nd International Academic Symposium on Enhanced Landfill Mining, Houthalen-Helchteren, Belgium, 14–16 October 2013. [Google Scholar]
- Ohnishi, S.; Fujii, M.; Fujita, T.; Matsumoto, T.; Dong, L.; Akiyama, H.; Dong, H. Comparative analysis of recycling industry development in Japan following the Eco-Town program for eco-industrial development. J. Clean. Prod. 2016, 114, 95–102. [Google Scholar] [CrossRef]
- Korea Ministry of Environment (2005–2016) 2004–2015 Waste Statistics. Available online: http://www.recycling-info.or.kr (accessed on 17 July 2017).
- Yi, S.; Jang, Y.C. Life cycle assessment of solid refuse fuel production from MSW in Korea. J. Mater. Cycles Waste Manag. 2016. [Google Scholar] [CrossRef]
- Environmental Statistics Yearbook 2014. Available online: http://eng.me.go.kr/eng/web/index.do?menuId=29&findDepth=1 (accessed on 21 November 2016).
- Holland, M.; Watkiss, P. Estimates of Marginal External Costs of Air Pollution in Europe. 2002. Available online: http://ec.europa.eu/environment/enveco/air/pdf/betaec02a.pdf (accessed on 13 September 2017).
- United Nations Statistics Division (UNSD). Integrated Environmental and Economic Accounting: An Operational Manual. Available online: https://unstats.un.org/unsd/publication/SeriesF/SeriesF_78E.pdf (accessed on 11 September 2017).
- Korea Energy Agency. Available online: http://www.energy.or.kr/renew_eng/pr/pr/campaign.aspx (accessed on 21 November 2016).
- Markandya, A. The Indirect Costs and Benefits of Greenhouse Gas Limitations Handbook Reports: Economics of Greenhouse Gas Limitations; UNEP: Nairobi, Kenya, 2002. [Google Scholar]
Figure 1.
Treatment status of industrial waste in Korea (2010). RPF: Refuse plastic fuel.
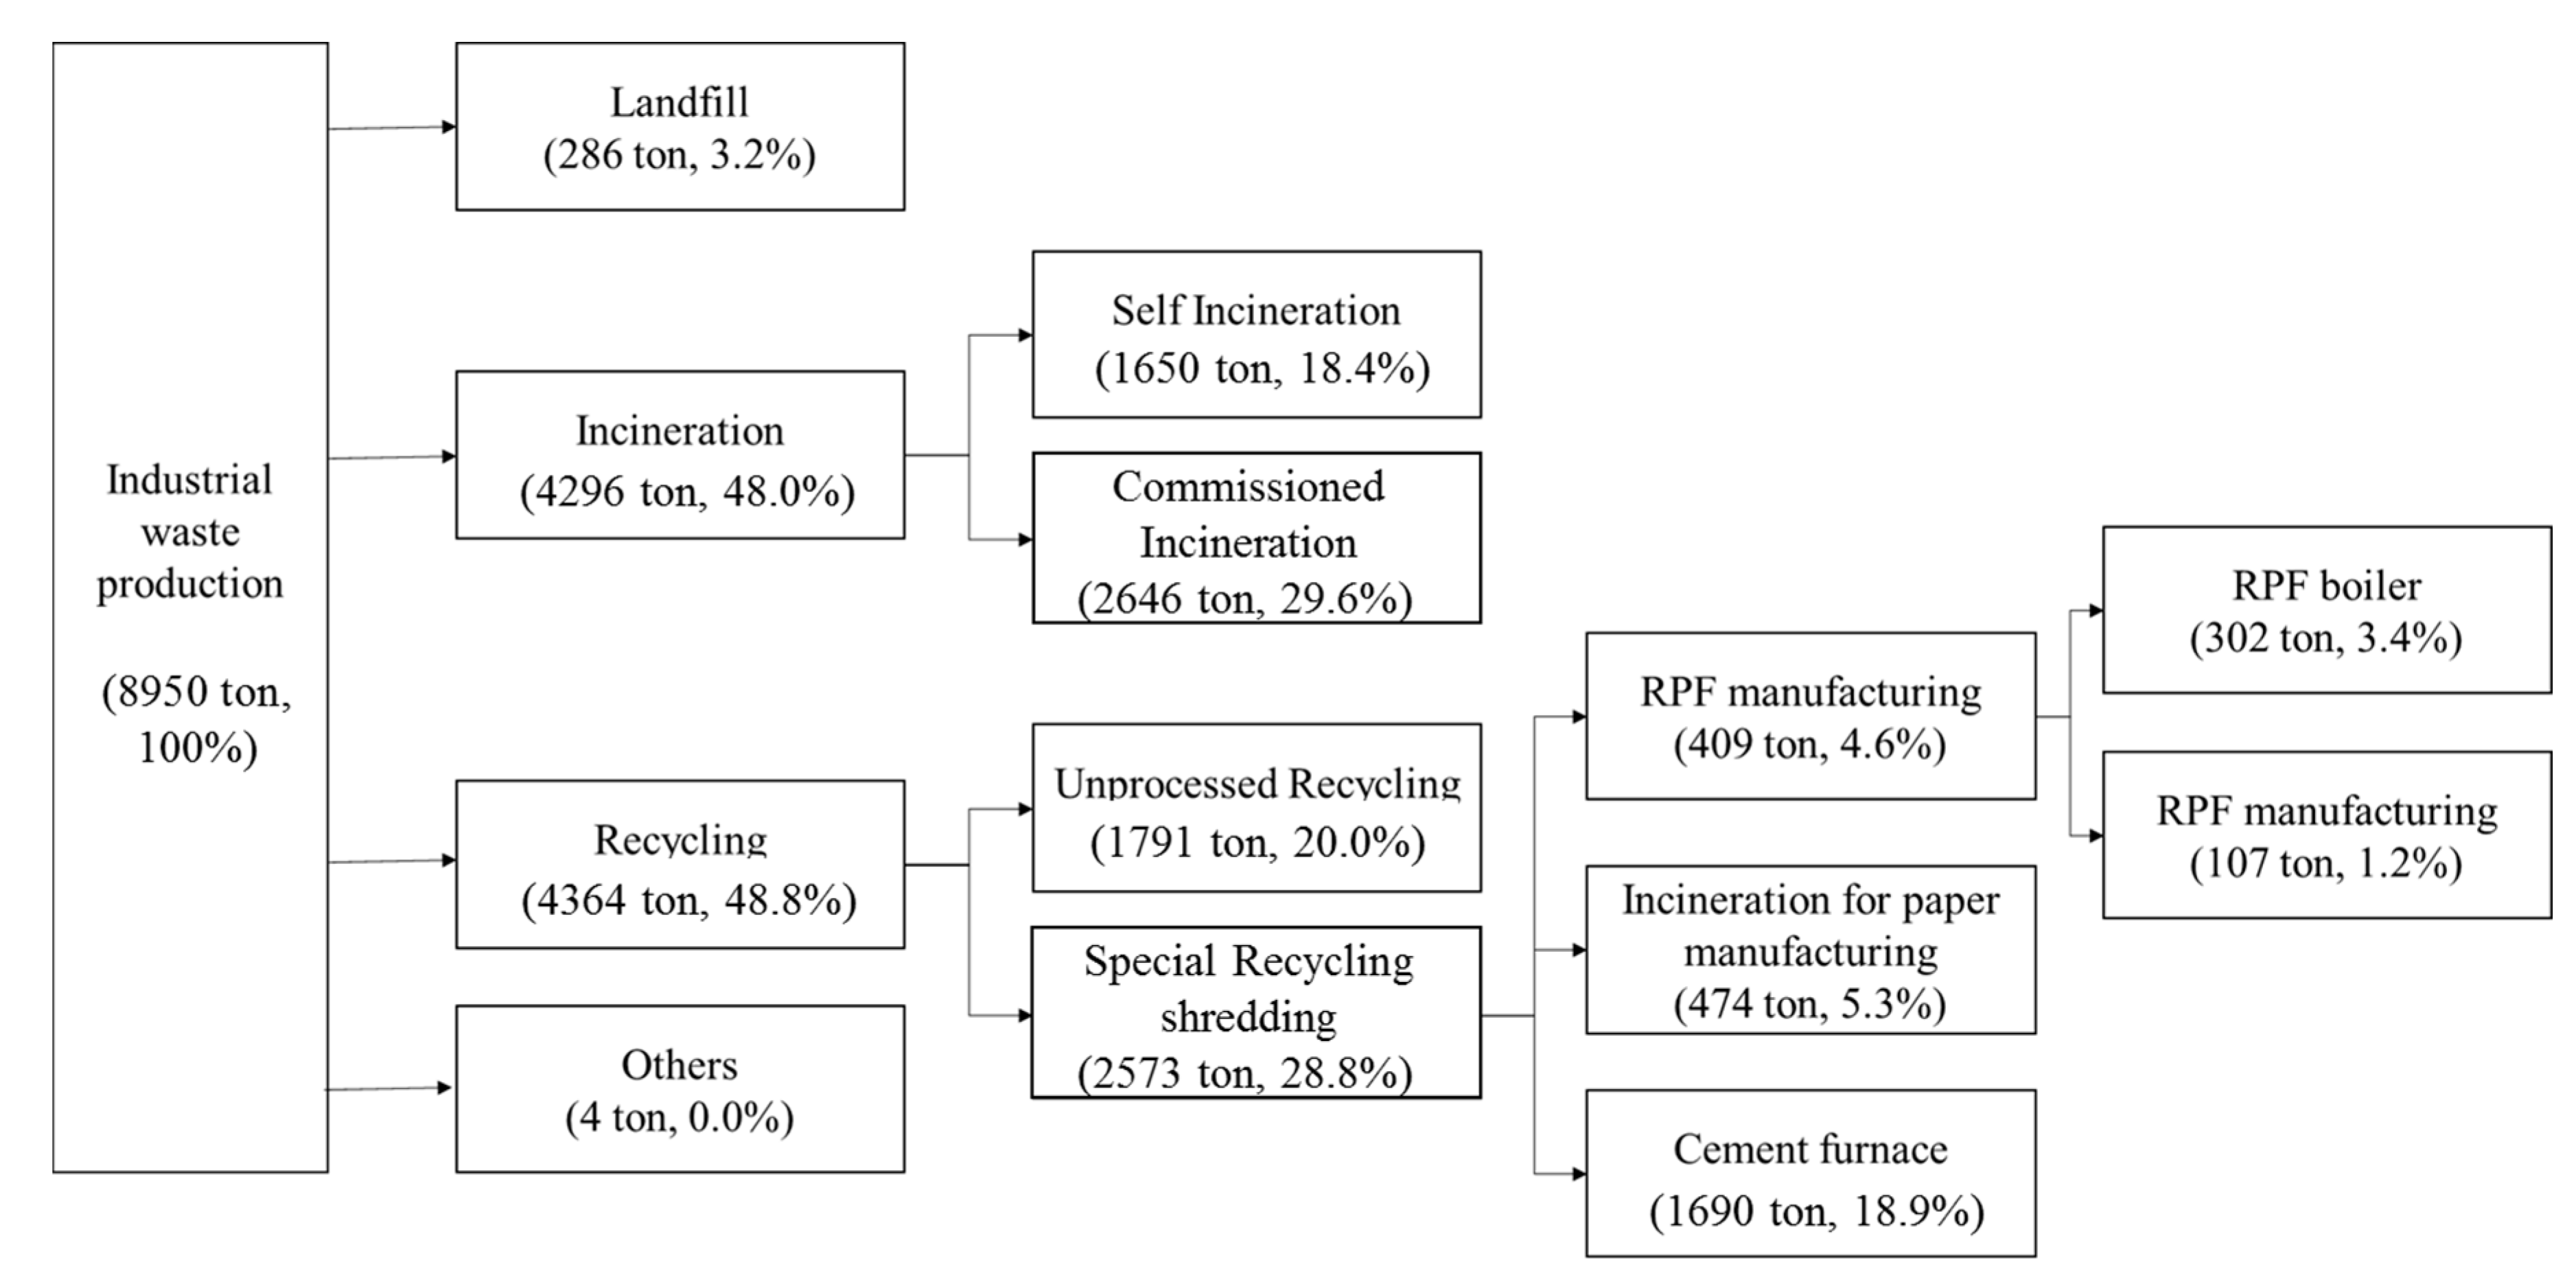
Figure 2.
Analysis procedure by treatment method.
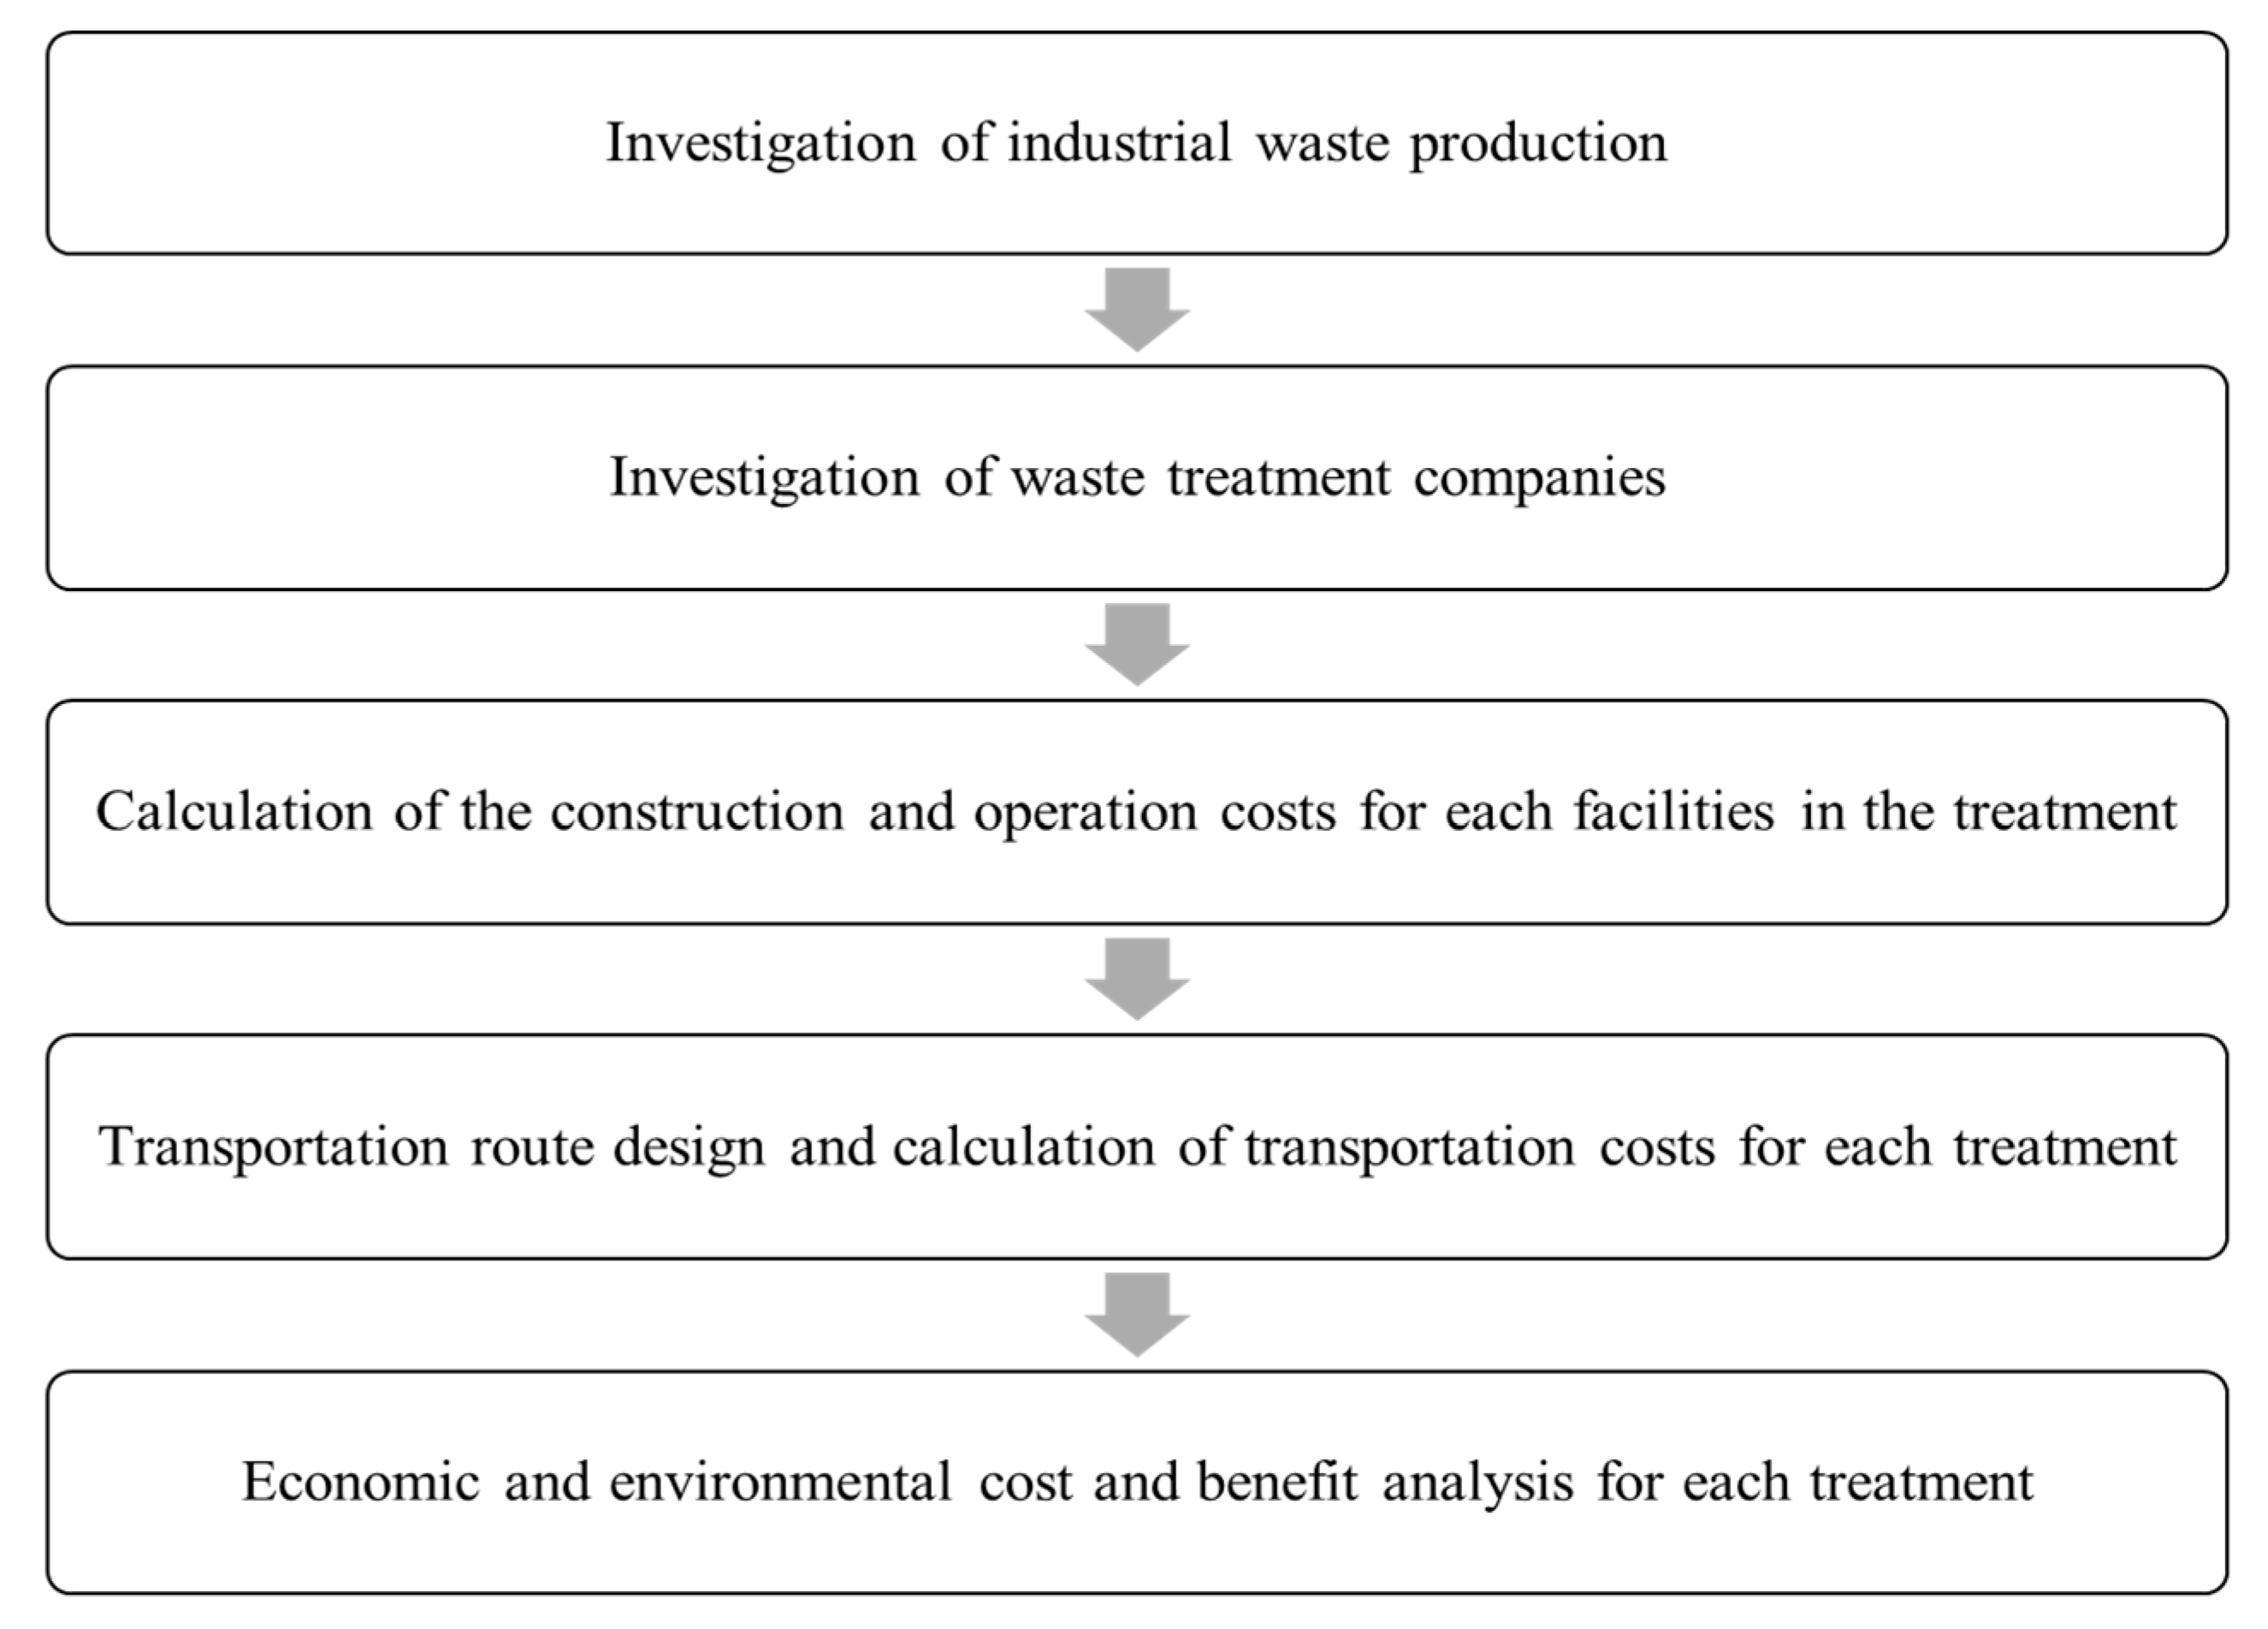
Figure 3.
Material balance flow per ton of incineration treatment method.

Table 1.
Industrial waste treatment methods.
| Classification | Details | |
|---|---|---|
| Incineration | Landfill after incineration treatment by intermediate processing companies (hereinafter referred to as “landfill after incineration”) | |
| Recovering | RPF manufacturing | Reuse as boiler fuel only after RPF manufacturing (hereinafter referred to as “RPF boiler”) |
| Reuse as cement furnace fuel after RPF manufacturing (hereinafter referred to as “RPF furnace”) | ||
| RPF non-manufacturing | Reuse as paper incinerator fuel after shredding the wastes (hereinafter referred to as “Paper incinerator”) | |
| Reuse as cement furnace fuel after shredding the wastes (hereinafter referred to as “Cement furnace”) | ||
Table 2.
Treatment paths and characteristics of waste treatment methods.
| Treatment Method | Treatment Path and Detailed Characteristics | |
|---|---|---|
| Incineration | Treatment path | Workplace → incineration company → landfill site |
| Path characteristics |
| |
| RPF boiler | Treatment path | Workplace → semi-shredding company → micro-shredding company → RPF manufacturer → RPF boiler → landfill site |
| Path characteristics |
| |
| RPF furnace | Treatment path | Workplace → semi-shredding company → micro-shredding company → RPF manufacturer → cement furnace |
| Path characteristics |
| |
| Paper incinerator | Treatment path | Workplace → semi-shredding company → paper incinerator → landfill site |
| Path characteristics |
| |
| Cement furnace | Treatment path | Workplace → semi-shredding company → cement furnace |
| Path characteristics |
| |
Table 3.
Industrial waste production status in Korea by region.
| City & Province | Total (Ton/Day) | Industrial Wastes (Ton/Day) | |||||
|---|---|---|---|---|---|---|---|
| Paper Wastes | Timber Wastes | Highly Synthetic Polymerized Compound Wastes | |||||
| Textile Wastes | Synthetic Resin Wastes | Synthetic Rubber Wastes | Leather Wastes | ||||
| Total | 8950.5 | 402.9 | 1665.7 | 232.0 | 6176.5 | 372.9 | 100.5 |
| Seoul | 28.8 | 1.9 | 1.4 | 0.4 | 25.0 | 0.1 | 0.0 |
| Busan | 287.6 | 4.1 | 17.4 | 5.9 | 241.2 | 10.3 | 8.7 |
| Daegu | 238.1 | 22.8 | 9.0 | 15.2 | 172.8 | 18.3 | 0.0 |
| Inchon | 643.6 | 32.8 | 267.5 | 28.4 | 304.7 | 8.4 | 1.8 |
| Gwangju | 98.4 | 21.7 | 9.0 | 10.1 | 34.3 | 23.3 | 0.0 |
| Daejeon | 200.6 | 1.3 | 3.2 | 1.7 | 174.0 | 19.9 | 0.5 |
| Ulsan | 455.5 | 63.8 | 116.0 | 17.2 | 234.8 | 23.4 | 0.3 |
| Gyeonggi | 2494.1 | 91.4 | 243.9 | 24.8 | 2059.8 | 37.4 | 36.8 |
| Gangwon | 42.6 | 1.5 | 7.8 | 2.7 | 28.5 | 2.0 | 0.1 |
| Chungbuk | 1074.0 | 16.9 | 121.8 | 23.0 | 809.4 | 88.7 | 14.2 |
| Chungnam | 669.2 | 41.5 | 117.6 | 10.5 | 486.3 | 13.0 | 0.3 |
| Jeonbuk | 687.5 | 19.5 | 286.0 | 5.9 | 339.0 | 1.6 | 35.6 |
| Jeonnam | 232.8 | 4.8 | 46.2 | 0.0 | 176.3 | 5.5 | 0.0 |
| Gyeongbuk | 644.8 | 20.0 | 75.3 | 68.7 | 451.5 | 27.8 | 1.5 |
| Gyeongnam | 1090.9 | 34.7 | 311.2 | 17.5 | 634.4 | 92.4 | 0.7 |
| Jeju | 62.0 | 24.3 | 32.5 | 0.0 | 4.5 | 0.7 | 0.0 |
Table 4.
Calculation of fuel substitution effect.
| Criteria | Formula |
|---|---|
| RPF Purchasing Cost (A) | 100 (tons/day) × 40,000 (won/ton) = 4,000,000 (won/day) |
| RPF Combustion Heat Energy (B) | 100 (tons/day) × 8 (Gcal/ton) = 800 (Gcal/day) |
| Bunker C Oil Substitution (C) | (B) ÷ 9.79 (Gcal/kL) = 81.72 (kL/day) |
| Fuel Substitution (won/day) (D) | (C) × 499,500 (won/kL) = 40,819,140 (won/day) |
| Fuel Substitution Effects (won/day) | (D) − (A) = 36,819,140 (won/day) |
Table 5.
Air pollution costs according to the travel distance by vehicle type (Unit: won/km).
| Vehicle Type | CO | HC | NOx | PM | Total |
|---|---|---|---|---|---|
| Heavy-duty truck | 5.395 | 9.757 | 9.874 | 9.757 | 34.783 |
| Medium-duty truck | 5.725 | 6.152 | 2.461 | 8.858 | 23.195 |
| Small-duty truck | 4.593 | 4.935 | 1.974 | 7.106 | 18.608 |
Table 6.
Environmental cost per unit of air pollution substances.
| Emission Quantities of Air Pollutants | |||||
|---|---|---|---|---|---|
| TSP | CO | SOx | NOx | Total | |
| Emission quantity per ton (g/ton) | 47 | 56 | 85 | 1868 | - |
| Environmental damage (won/ton) | 5050 | 1532 | 3142 | 61,474 | 71,197 |
Note 1: United Nations Environmental Program (UNEP), Economics of greenhouse gases (GHG) Limitations: The Indirect Costs and Benefits of GHG Limitations. Note 2: The above table is based on a city with a population of 100,000. The Benefits Table (BeTa) database developed by Netcen applies the weight of 5 for a city with a population of half a million, and 15 for a city with a population of one million or more. Note 3: Exchange rate: 1 USD = 929.2 won; 1 Euro = 1272.72 (based on the 2007 basic exchange rate) [31].
Table 7.
Air pollutant emission data of incineration facilities and furnaces.
| Treatment Facility | Type | Unit | Average |
|---|---|---|---|
| Incineration facility | TSP | mg/m3 | 2.455 |
| CO | ppm | 2.993 | |
| SOx | ppm | 1.442 | |
| NOx | ppm | 46.183 | |
| NH3 | ppm | 0.794 | |
| HCl | ppm | 2.337 | |
| Furnace | Dust | mg/m3 | 4.034 |
| CO | ppm | 876.777 | |
| SOx | ppm | 4.518 | |
| NOx | ppm | 268.882 | |
| NH3 | ppm | 9.414 | |
| HCl | ppm | 1.181 |
The pollutant measurement data used the O2 12% correction value, and the oil amount and TSP used the average value of the measurement results.
Table 8.
Parameters used in this study.
| Parameters | Values | |
|---|---|---|
| Economic | Base period | 2007 year |
| Lifespan | 15 year | |
| Discount rate | 3% | |
| Inflation rate | 5% | |
| Capital ratio | 80% | |
| Facility consumption ratio | 5% | |
| Fuel substitution | Unit price of steam | 15,000 won/ton |
| Unit price of RPF sales | 40,000 won/ton | |
| Unit price of Bunker-C | 499,500 won/kL | |
| Unit price of bituminous coal | 73,700 won/ton | |
| Round-trip transportation | Greater than 400 km | 1,100,000 won/truck |
| 400–200 km | 916,667 won/truck | |
| 200–100 km | 733,333 won/truck | |
| 100–70 km | 428,333 won/truck | |
| 70–50 km | 332,833 won/truck | |
| 50–30 km | 290,833 won/truck | |
Table 9.
Economic costs by treatment method.
| Type | Case 1 (Won/Ton *) | Case 2 (Won/Ton *) |
|---|---|---|
| Incineration | −207,893 | −208,114 |
| RPF boiler | −418,959 | −420,002 |
| RPF furnace | −323,985 | −323,718 |
| Paper manufacturing | −310,955 | −314,523 |
| Cement furnace | −201,202 | −201,839 |
−: Expenditures (negative); * Unit: won/ton (costs incurred by 1 ton industrial waste first delivered).
Table 10.
Environmental costs by treatment method.
| Type | Case 1 (Won/Ton *) | Case 2 (Won/Ton *) |
|---|---|---|
| Incineration | −112,261 | −112,262 |
| RPF boiler | −73,490 | −73,771 |
| RPF furnace | −327,398 | −328,031 |
| Paper incinerator | −57,445 | −57,471 |
| Cement furnace | −417,638 | −417,843 |
−: Expenditures (negative); * Unit: won/ton (costs incurred by 1 ton industrial waste first delivered).
Table 11.
Profit analysis results by treatment method.
| Type | Cases 1 and 2 (Won/Ton) | |||
|---|---|---|---|---|
| Fuel Substitution | Steam Sales | RPF Sales | Total | |
| Incineration | +167,861 | +74,660 | 0 | +242,521 |
| RPF boiler | +221,684 | 0 | +33,320 | +255,004 |
| RPF furnace | +42,239 | 0 | +33,320 | +75,559 |
| Paper incinerator | +218,227 | 0 | 0 | +218,227 |
| Cement furnace | +71,847 | 0 | 0 | +71,847 |
+: Revenues (positive).
Table 12.
Total costs analysis by treatment method.
| Cases | Classifications | Incineration | RPF Boiler | RPF Furnace | Paper Incinerator | Cement Furnace | |
|---|---|---|---|---|---|---|---|
| Case 1 | Economic benefits | Treatment cost | −207,893 | −418,959 | −323,985 | −310,955 | −201,202 |
| Profit (RPF and stream sales + fuel substitution) | +242,521 | +255,004 | +75,559 | +218,227 | +71,847 | ||
| Sub total | +34,628 | −163,955 | −248,426 | −92,728 | −129,355 | ||
| Environmental costs | −112,261 | −73,490 | −327,398 | −57,445 | −417,638 | ||
| Total | −77,633 | −237,445 | −575,824 | −150,173 | −546,993 | ||
| Case 2 | Economic benefits | Treatment costs | −208,114 | −420,002 | −323,718 | −314,523 | −201,839 |
| Profit (RPF and stream sales + fuel substitution) | +242,521 | +255,004 | +75,559 | +218,227 | +71,847 | ||
| Sub total | +34,407 | −164,998 | −248,159 | −96,296 | −129,992 | ||
| Environmental costs | −112,262 | −73,771 | −328,031 | −57,471 | −417,843 | ||
| Total | −77,855 | −238,769 | −576,190 | −153,767 | −547,835 | ||
−: Expenditures (negative); +: Revenues (positive).
© 2017 by the authors. Licensee MDPI, Basel, Switzerland. This article is an open access article distributed under the terms and conditions of the Creative Commons Attribution (CC BY) license (http://creativecommons.org/licenses/by/4.0/).
Share and Cite
MDPI and ACS Style
Kim, J.; Jeong, S. Economic and Environmental Cost Analysis of Incineration and Recovery Alternatives for Flammable Industrial Waste: The Case of South Korea. Sustainability 2017, 9, 1638. https://doi.org/10.3390/su9091638
AMA Style
Kim J, Jeong S. Economic and Environmental Cost Analysis of Incineration and Recovery Alternatives for Flammable Industrial Waste: The Case of South Korea. Sustainability. 2017; 9(9):1638. https://doi.org/10.3390/su9091638
Chicago/Turabian StyleKim, Jihyun, and Sukjae Jeong. 2017. "Economic and Environmental Cost Analysis of Incineration and Recovery Alternatives for Flammable Industrial Waste: The Case of South Korea" Sustainability 9, no. 9: 1638. https://doi.org/10.3390/su9091638
Note that from the first issue of 2016, this journal uses article numbers instead of page numbers. See further details here.