Key Factors Affecting the Price of Airbnb Listings: A Geographically Weighted Approach


1
Department of Civil and Environmental Engineering, The University of Tennessee, Knoxville, TN 37996-2313, USA
2
Center for Sustainable Business and Development, The University of Tennessee, 311 Conference Center Building, Knoxville, TN 37996-4134, USA
3
Department of Civil and Environmental Engineering, 319 John D. Tickle Building, The University of Tennessee, Knoxville, TN 37996-2313, USA
*
Authors to whom correspondence should be addressed.
Sustainability 2017, 9(9), 1635; https://doi.org/10.3390/su9091635
Submission received: 7 August 2017
/
Revised: 5 September 2017
/
Accepted: 12 September 2017
/
Published: 14 September 2017
(This article belongs to the Section Economic and Business Aspects of Sustainability)
Abstract
:Airbnb has been increasingly gaining popularity since 2008 due to its low prices and direct interactions with the local community. This paper employed a general linear model (GLM) and a geographically weighted regression (GWR) model to identify the key factors affecting Airbnb listing prices using data sets of 794 samples of Airbnb listings of business units in Metro Nashville, Tennessee. The results showed that the GWR model performs better than the GLM in terms of accuracy and affected variable selections. Statistically significant differences varied across regions in Metro Nashville. The coefficients illustrate a decreasing trend while there is an increase in the distance from the listed units to the convention center, which indicates that Airbnb listing prices are more sensitive to the distance from the convention center in the central area than in other areas. These findings can also provide implications for stakeholders such as Airbnb hosts to gain a better understanding of the market situation and formulate a suitable pricing strategy.
1. Introduction
In recent years, the sharing economy has gained popularity in many business sectors [1] such as transportation (e.g., Uber, Lyft) and accommodation (e.g., Airbnb, HomeAway). The sharing economy can be defined as “peer-to-peer-based activity of obtaining, giving, or sharing the access to goods and services, coordinated through community-based online services” [2]. In the peer-to-peer (P2P) accommodation industry, Airbnb is a prominent example, enabling owners to offer their unoccupied houses or rooms for short-term rental [3]. Founded in 2008, Airbnb has been increasing and growing dramatically and has served more than 150 million guests through over 3 million listings in more than 190 countries in less than a decade [4]. The keys to the success of Airbnb include low costs and direct interactions with local community that provides guests with unique stay experiences [5].
Price is often considered as one of the key factors that impacts clients’ selection of lodgings. Past studies have investigated numerous factors affecting hotel price, identifying a set of price determinants such as brand name, star rating, location, hotel age, number of rooms, amenities, and so forth [6,7,8,9]. Airbnb is a recent lodging concept that differs from traditional hotels in terms of booking systems, facilities, website designs, and customer service. Because of the growing demand for Airbnb, several studies have focused on identifying price determinants of Airbnb listings [10,11]. Recently, global regression models (GLM) such as OLS regression and quantile regression are the most commonly adopted methods to investigate factors affecting Airbnb listing prices in current studies.
Due to their spatial autocorrelation, the global regression models explore only the relationships between an independent variable and a set of dependent variables, masking spatial heterogeneity in the relations [7,12] by ignoring the existence of local variations. To better understand the determinants of Airbnb listings prices and how the relationships can be affected by location details, the geographically weighted regression (GWR) model is implemented to investigate the effects of local factors on Airbnb listing prices. The GWR model allows estimated parameters to vary across regions to accommodate potential spatial dependencies [12]. Therefore, this study aims to adopt a GWR model to explore the spatial variation in the relationship between Airbnb listing prices and their price determinants, and to compare the model performance and estimation results between the GLM and GWR model in order to contribute to the literature. The rest of this paper is organized as follows: Section 2 discusses prior research, and Section 3 presents the data and methods used in this paper; next, in Section 4 we present the main estimated model results and their implications, and conclusions and suggestions are presented in Section 5.
2. Literature Review
2.1. Airbnb
Since the advent of Airbnb in 2008, it has grown exponentially. This Airbnb phenomenon has attracted scholarly attention, and many studies have explored a variety of topics related to Airbnb. Numerous studies have focused on Airbnb’s advantages, challenges [5,13,14], and legal issues [15,16]. For example, Guttentag [5] analyzed the Airbnb issues through the lens of disruptive innovation theory, and pointed out that the main strength of Airbnb are its relatively low cost and various benefits associated with staying in a local residence, while the potential threats to Airbnb’s future growth are widespread illegality, potential crackdown from landlords and condo boards, and safety issues. Edelman and Geradin [16] reported that new regulatory frameworks should be established to allow software platforms such as Uber and Airbnb to operate legally so that both service providers and consumers can enjoy the convenience and efficiency these platforms provide.
Several past studies have focused on Airbnb’s impacts on the hotel industry, including hotel revenue [17,18] and tourism industry employment [3]. For instance, Zervas, Proserpio and Byers [17] found that the entry of Airbnb into the Texas market had a quantifiable negative impact on local hotel revenues, showing that a 1% increase in Airbnb listings in Texas resulted in a 0.05% decrease in quarterly hotel revenues. Using the data of a total of 657 distinct listings for Idaho, USA, Fang, Ye and Law [3] investigated the effect of the sharing economy (Airbnb) on the tourism industry, and found that the sharing economy would generate new job positions and benefit the entire tourism industry, but the marginal effect decreases as the size of the sharing economy increases. Past studies have examined the impact of Airbnb on housing cost [15,19]. Barron, Kung and Proserpio [19] studied the impact of Airbnb businesses on house prices and rental rates. Their results showed that a 0.39% increase in rental rates and a 0.64% increase in house prices resulted in a 10% business increase in Airbnb listings.
Scholars explored how guests would trust and rate Airbnb, and how an Airbnb listing achieves a high reputation. Their findings concluded that Airbnb listing’s reputation or guests’ trust in Airbnb listing can be affected by “Superhost” status [20], geolocated Airbnb rental images [21], Airbnb hosts’ personal photos [22], perceived authenticity, electronic word-of-mouth, price sensitivity [23], and/or perceived brand personality [24]. Several studies have investigated how customers’ experience and service quality impacted Airbnb’s business reputation [25,26,27,28,29] that paved the way for the success of Airbnb. To have an in-depth understanding of customer experiences with Airbnb, Brochado, Troilo, and Shah [25] summarized 1776 reviews from 24 Airbnb listings across three countries using content analyses and identified eight themes that showed a convergent trend of consumer experience towards Airbnb listing uses and lodging services. Mody, Suess and Lehto [26] developed a model to identify factors affecting customers’ experience in the hospitality industry and tested their model in shared economy settings. Priporas et al. [28] investigated the relationships among service quality, satisfaction, and consumers’ loyalty towards Airbnb, indicating that service quality was positively correlated with consumers’ satisfaction and loyalty.
2.2. Airbnb Listing Price
Price is a vital topic in the hospitality industry [6], for a proper pricing strategy can lead a company or enterprise to the next level of financial success [8]. Price plays an important role in the shared economy in the hospitality industries such as Airbnb because price impacts guests’ lodging selection and also significantly impacts hosts’ profits [13]. Thus, knowing factors affecting the price is of great value, and can help hosts ask a reasonable price so that both the hosts and guests can benefit from the sharing economy. Limited studies have been conducted to identify what factors affect the price of Airbnb listings (Table 1). For example, Ikkala and Lampinen [10] reported that the reputation of Airbnb listings is correlated with their price. Using Airbnb listings information from 33 cities, Wang and Nicolau [11] identified five price-determinant categories of Airbnb listings, including host attributes, site and property attributes, amenities and services, rental rules, and online review ratings. Li et al. [30] proved the effects of distance to the nearest landmark, the impact of facility, and nearest landmark popularity on Airbnb listing prices. A high rating score can be converted to a price in the hospitality industry, and one empirical study reported that rating visibility leads to an increase in price by 2.69 € [31].
Though few studies have been conducted on Airbnb listings prices, a series of studies have explored the price determinants of hotels. Serval important factors affecting the hotel room price have been identified such as location [6,7], hotel category [32,33], customer ratings [34,35], hotel amenities and services [36,37], market accessibility [38], and proximity of competitors [33]. Previous empirical studies often employed a global regression model, considering only the relationship between hotel room price and explanatory variables on a global level. GWR has been widely used in many fields, and has proven to be a useful tool to capture the spatial variations in relations [7,39,40].
In summary, there are only a few studies on price determinants of Airbnb listings, which need to be extended. The purpose of this study is to identify the factors affecting Airbnb listing prices. Considering that the relationship between Airbnb listing prices and their factors can vary from location to location, the GWR method is selected to investigate the factors affecting Airbnb listing prices locally rather than globally.
3. Data and Method
3.1. Study Area and Data
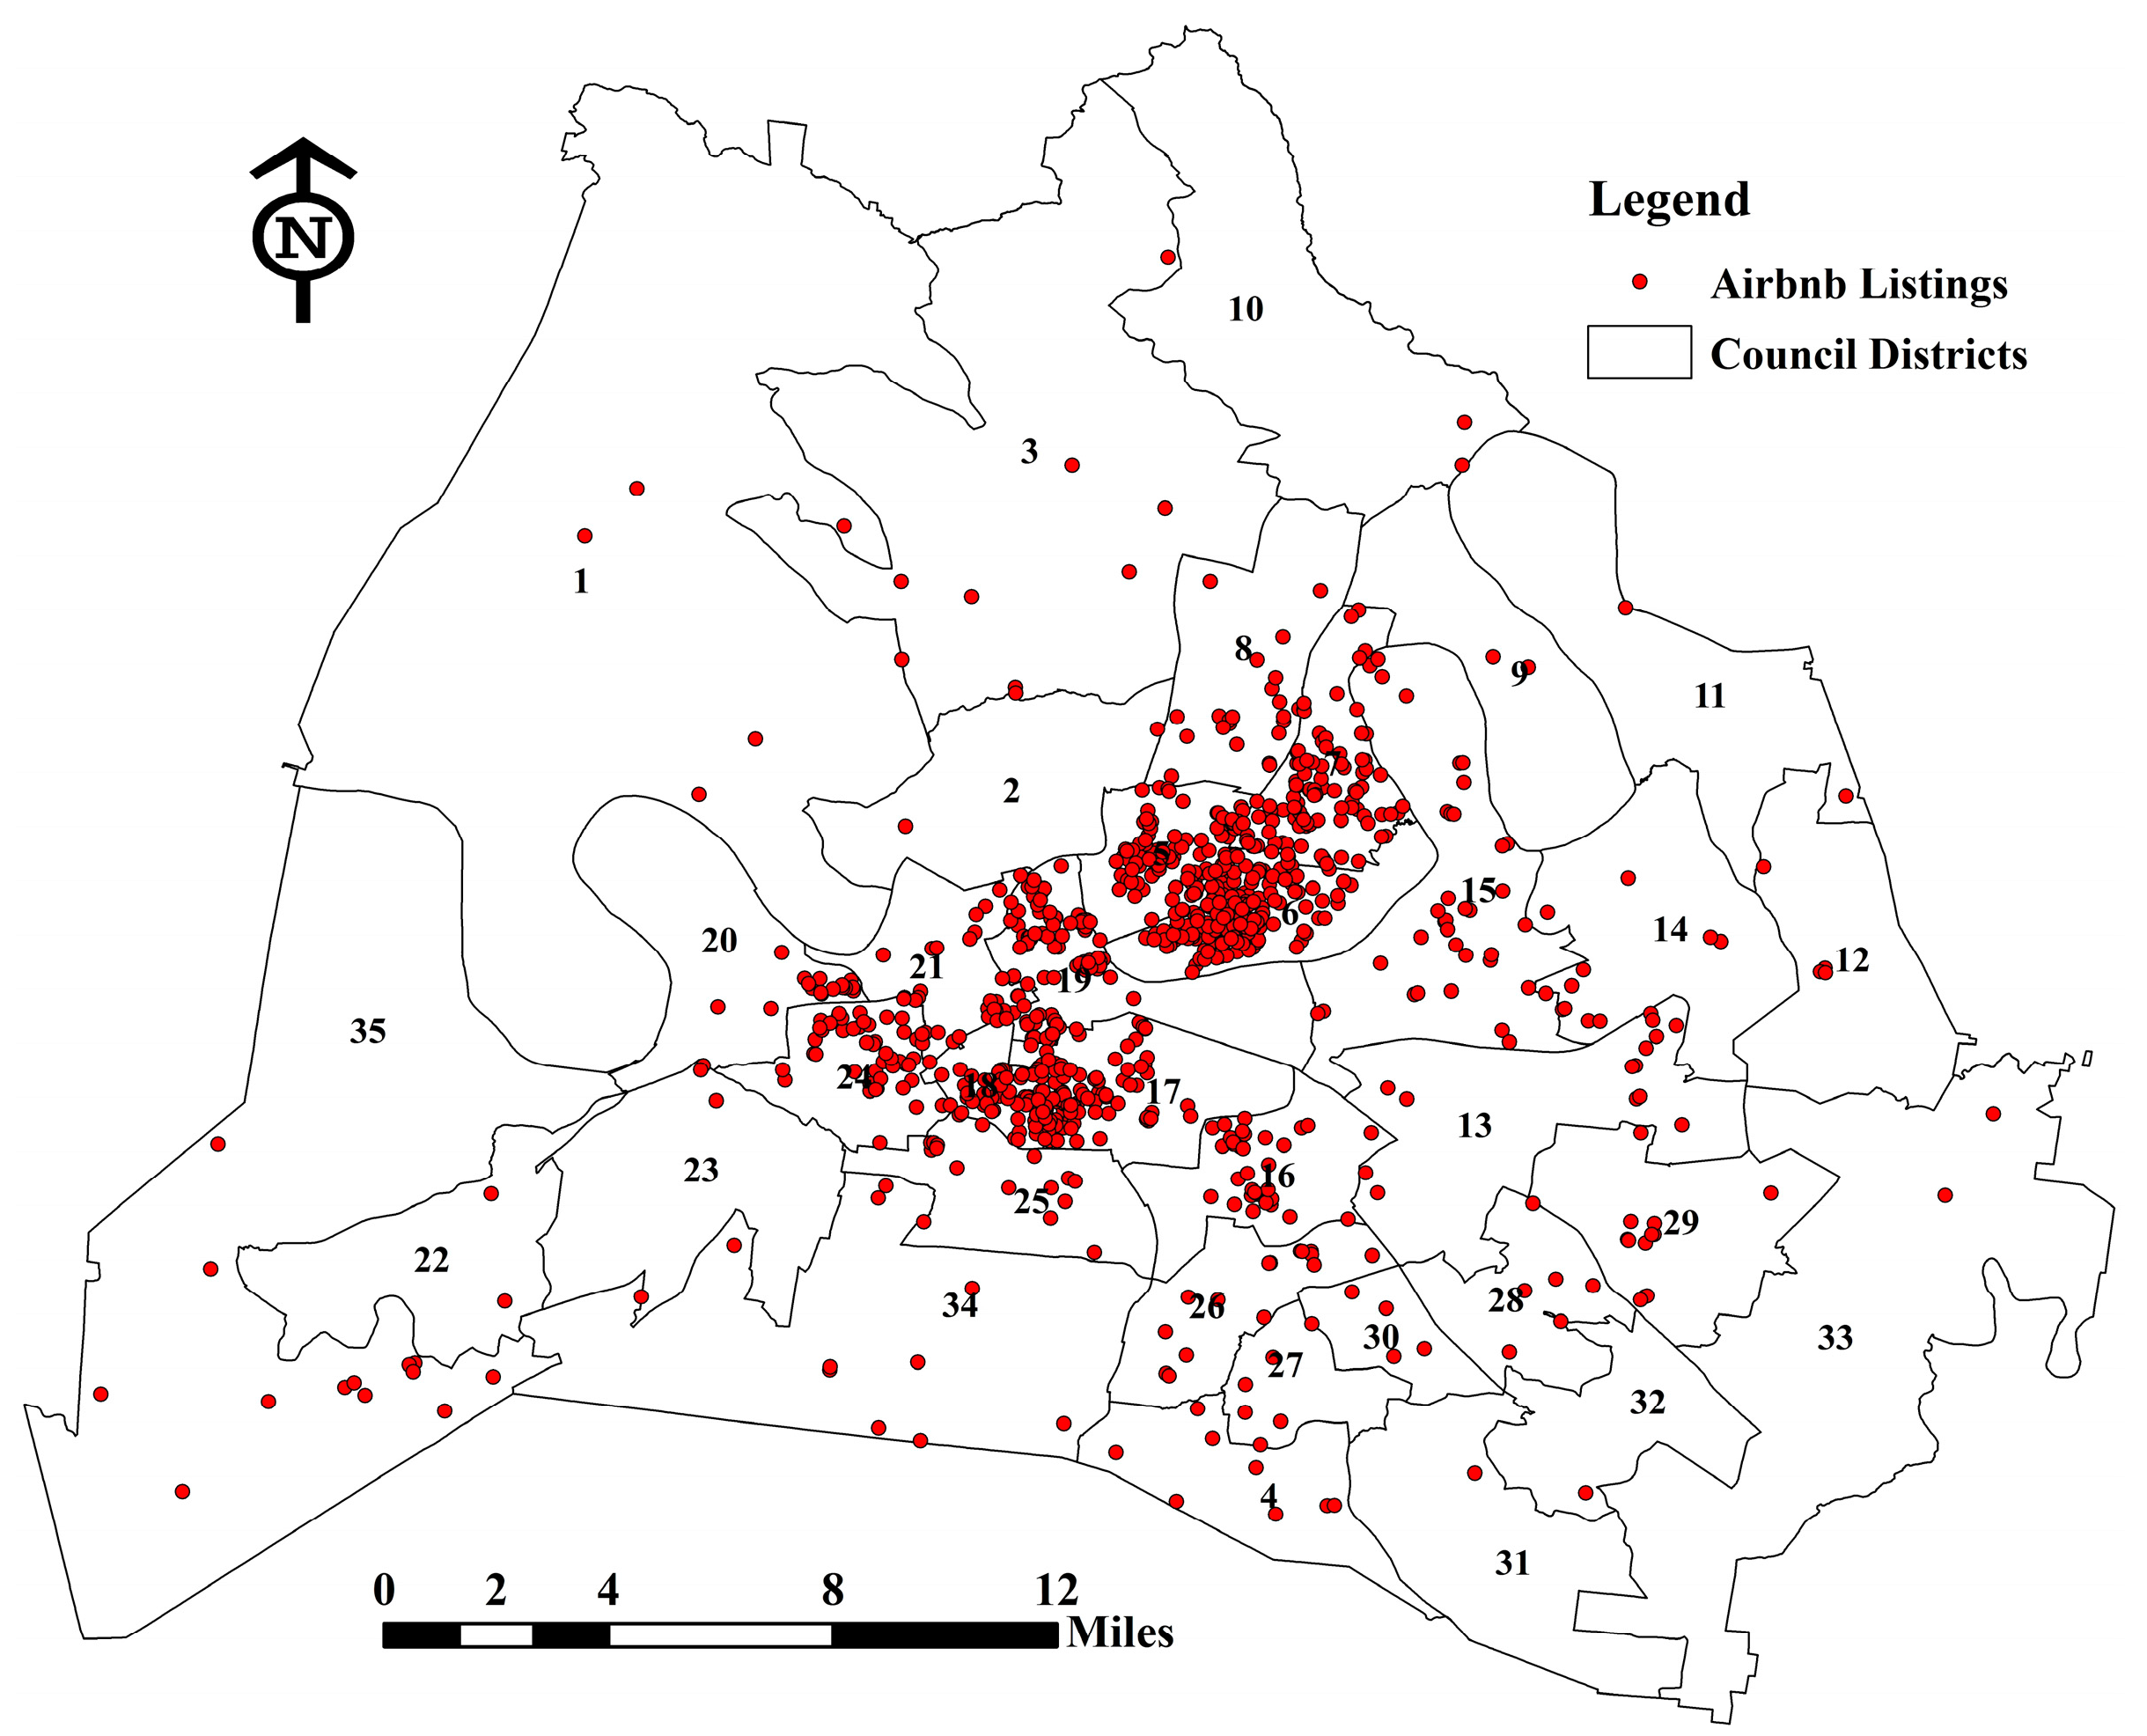
In this paper, Metro Nashville (Davidson County), Tennessee, was chosen as the study site. The government of the City of Nashville and Davidson County merged in 1963. The county and city government is known as the “Metropolitan Government of Nashville and Davidson County”, or “Metro Nashville” for short. Metro Nashville was divided into 35 districts under the legislative authority of the Metropolitan Government of Nashville and Davidson County, Metropolitan Council. The shape format layer data of Metro Nashville, including road networks, council districts, and boundaries, were obtained from the U.S. Census Bureau, and the Planning Department of Metropolitan, Government of Nashville, and Davidson County.
The data of Airbnb listings for Metro Nashville were collected and analyzed. The data were obtained from the website [4], which provides Airbnb listing information drawn from Airbnb.com. Considering that some Airbnb listings did not have any transactions or were just listed but not well managed, we selected the listings with a super host status, namely, experienced hosts who are passionate about making guests’ trips memorable. Finally, 974 samples of Airbnb listings from Metro Nashville were retrieved. Figure 1 shows the spatial distribution of Airbnb listings in Metro Nashville, and as shown, the Airbnb listings are mainly in the central area.
Table 2 depicts the variables selected as possible predictors of Airbnb listing prices based on the review of literature above. Location is a commonly accepted factor proven to affect Airbnb listing prices. Location can be represented as distance from the city center, highways, or local attractions [7]. Since Metro Nashville is not a huge city and the major attractions are in the downtown area, H-Distance and C-Distance were adopted to investigate the effect of location on Airbnb listing price in this study. Reviews and ratings are also important factors in Airbnb listing prices. Both higher ratings and more numerous reviews can lead to a higher price [10,31]. Thus, the number of reviews (Reviews) and the ratings (Ratings) of Airbnb listings are categorized as explanatory variables in this study. “Age” can partly account for hotel pricing behavior [6]. In this study, the “Age” variable, namely, the duration of time since the listing was established, was selected as a factor affecting Airbnb listing prices. Given that Airbnb is a newly founded company, the month is desirable as the unit of age to better perceive the influence of age on price. Finally, the dependent variable (Price) used in this study is list prices, which may be a suitable substitute due to lack of access to the actual transaction price. Meanwhile, the variable price is the ratio of listed price per night over the maximum guests.
3.2. General Linear Model (GLM)
In a GLM model, the dependent variable is estimated with a set of dependent variables globally. The model specification is expressed as:
where denotes the ith observation of dependent variable, ) are the coefficients of the predictors estimated in the model, and is the random error.
3.3. Geographically Weighted Regression (GWR)
In the GWR model, the dependent variable is predicted by a series of explanatory variables in which the estimated parameters can vary spatially. The basic GWR model is shown below [40].
where denotes the dependent variable at location , denotes the value of kth explanatory variable at location , and ) are the coefficients of the predictors estimated in the model. denotes the coordinates of location , and is the random error at location .
The at location is estimated using weighted least square, and can be expressed as:
where denotes an by diagonal spatial weighted matrix. denotes the explanatory variables data matrix. denotes the vector of dependent variable.
For spatial weighted matrix , several methods are compiled. The Gaussian and bi-square functions are commonly adopted to calculate the weighted matrix. In this study, the Gaussian function is employed, which can be expressed as:
where denotes the distance between location and observed point , denotes the distance bandwidth. A given distance or a fixed number of neighborhoods can be used to define the bandwidth. The selection of optimal bandwidth can be determined by selecting the model with lowest Akaike Information Criterion (AIC) score; the model with the lowest AIC is the optimal model [39].
4. Results
4.1. GLM Estimation
This paper investigated the relationships between the dependent variable (Airbnb listing price) and the independent variables (Reviews, Age, H-Distance, C-Distance, Ratings) using the GLM. Note that this study did not focus on comparing the Airbnb listings with the types of listing properties such as a whole house, a shared room, or a single room. Logically, the price of a listed whole house is always higher than a listed shared room due to its higher capacity for more customers. Therefore, price per maximum number of guests was utilized as a dependent variable in this study. Various factors affecting the Airbnb listing price have been explored and identified in the literature. In this study, we focused on exploring spatial factors and examining relationships between identified spatial factors (for example, distance related) and price. The attributes of an Airbnb property affect listing price and are treated as dummy variables that can be easily modelled within a linear regression model, but those dummy variables may not be suitable for inclusion in a GWR model due to potential multicollinearity issues.
In a GWR model, we analyzed the relationship between price and location of each Airbnb listing. The price attribute of a specific Airbnb listing is treated as a dependent variable, not by using the average price of those districts. The 35 districts in Metro Nashville are not completely related to the GWR modelling procedures; therefore, certain districts were included selectively in this study. The results concluded that the relationship between price and rating is statistically significant in districts 5, 6, and 19, while there is no significant relationship between the spatial factor and Airbnb listings in other included districts. The Airbnb concept is still at an early stage in Tennessee. Airbnb’s listings in the studied city present a strategy by offering a comparatively lower price to entice customers as one of Airbnb’s business strategies to promote its services in the region. It is plausible that Airbnb in Nashville is receiving an average or above average rating due to a comparative low price offered in the market, which is appreciated by the majority of customers who stayed overnight in that studied region.
Table 3 shows the estimated results modeled by GLM. The Reviews and C-Distance are significantly correlated with Airbnb listing prices, and these two variables affected Airbnb listing prices negatively. For example, the coefficient of Reviews is −0.051, which means one unit increase in the number of reviews can lead to 5.1% decrease in Airbnb listing price. Also, the coefficient of C-Distance is −1.524, which means one unit increase in the distance to a convention center will decrease the Airbnb listing price by 152.4%. The coefficient of Rating is −0.073, and one unit increase in Rating can decrease the Airbnb listing price by 7.3%. In summary, the number of reviews, the review scores, and the distance to convention center are negatively related to the Airbnb listing price, and the influence of the distance to the convention center on price is the biggest. However, the Airbnb established date and the distance to the nearest highway do not significant affect the Airbnb listing price.
4.2. GWR Estimation
Summaries of parameter estimates in the GWR are shown in Table 4. The dataset used here is the same as with the GLM. Considering the large sample size, six descriptive parameters estimates were summarized in the table, which are the mean, minimum, lower quartile, median, upper quartile, and maximum values. Table 4 shows that the estimated parameter coefficients vary significantly.
The effect of explanatory variables on Airbnb listing prices are shown in Figure 2, Figure 3, Figure 4, Figure 5 and Figure 6. Significant spatial heterogeneity exists in the explanatory variables across the region, indicating that GWR may be a better choice to investigate the key factors affecting the Airbnb listing prices in-depth. The distance to the convention center and the number of reviews are negatively related to the Airbnb listing price, while the distance to the nearest highway, the review ratings, and the age of the listing can be either positively or negatively correlated with Airbnb listing prices.
In Figure 2, significant negative correlations between the distance to the convention center and Airbnb listing price exist in most of all regions except for the small west central area (districts 18,24) in Metro Nashville. It is understandable that the downtown area offers much more convenience in accessing transportation, attractions, and entertainment facilities, resulting in a higher lodging price. It can be applied to the Airbnb listing price, specifically, the closer the listing is to the convention center, the higher its price. The coefficients illustrate a decreasing trend while there is an increase in the distance from the listed units to the convention center, which indicates that the Airbnb listing price is more sensitive to the distance from the convention center in the central area than in other areas.
Figure 3 shows the effects of the distance to the nearest highway on Airbnb listing prices. The central Metro Nashville (districts 5,6,18,19) shows a significant effect. The distance is positively affecting the price; the farther the distance to the nearest highway, the higher the price. The interstate highways are away from the Nashville downtown, which means the listings away from the highway are closer to downtown in central Metro Nashville. Thus, it seems logical that the closer it is to downtown, the higher the Airbnb price will be listed.
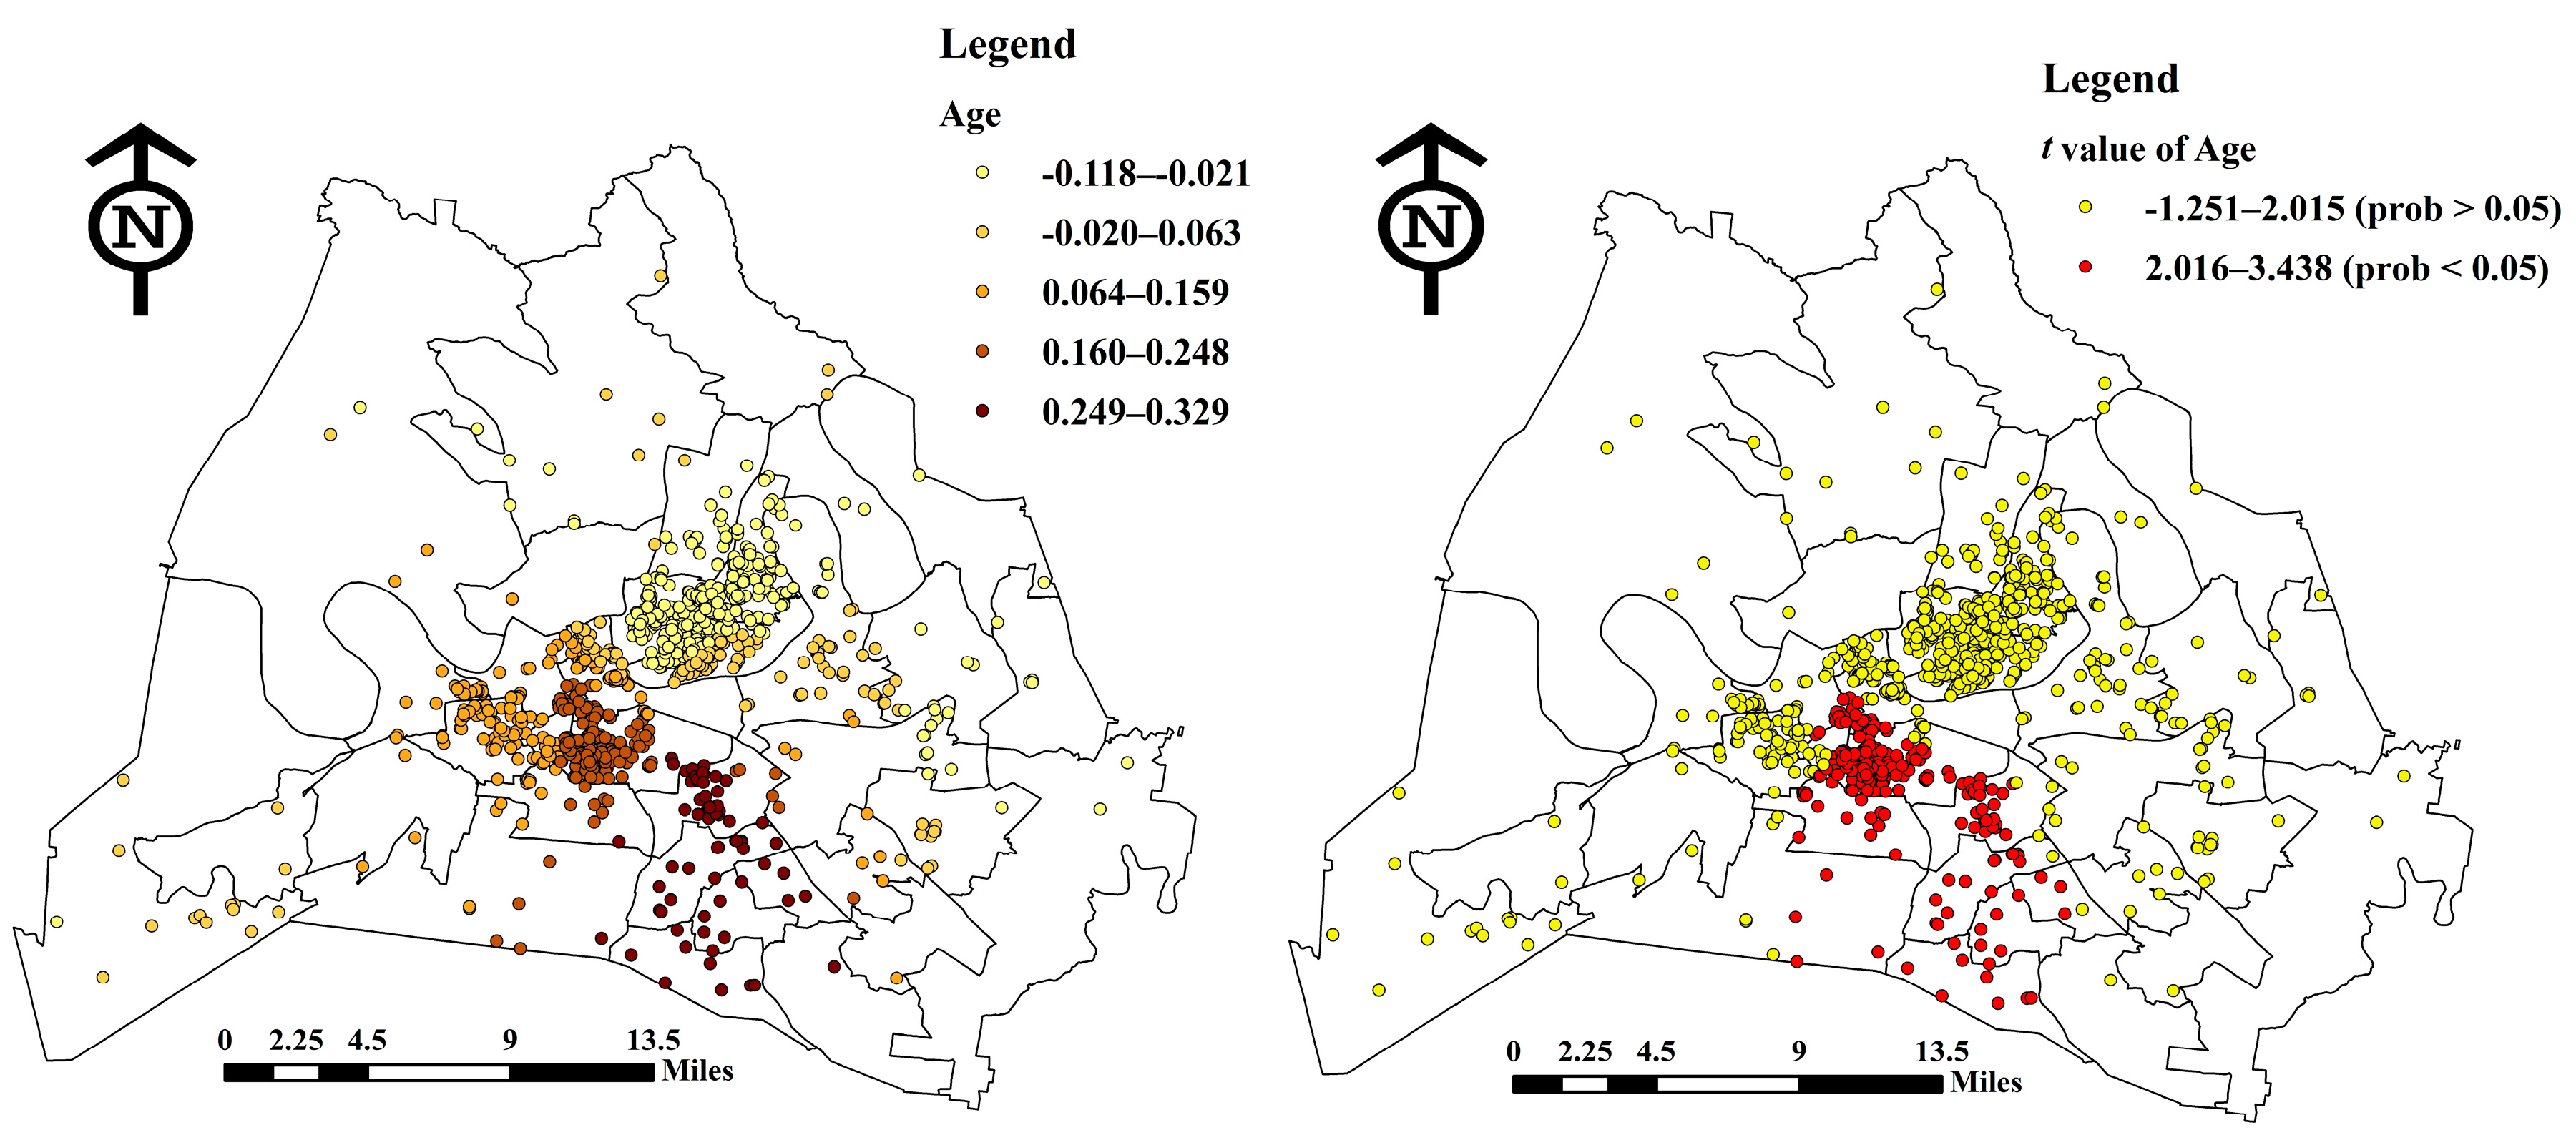
In Figure 4, it clearly shows that the effects of the established date of a listing on Airbnb listing prices are significant mainly in southern Metro Nashville (districts 16–18,25–27,30), and the effect on price is positive, indicating that the earlier the Airbnb listing is established, the higher the Airbnb listing price. It seems that the older Airbnb listings tend to charge more partly because the lodging places that have been listed through Airbnb with a longer period are more experienced, and those hosts are aware of why their guests are more likely to trust previous experiences in terms of safety and service quality.
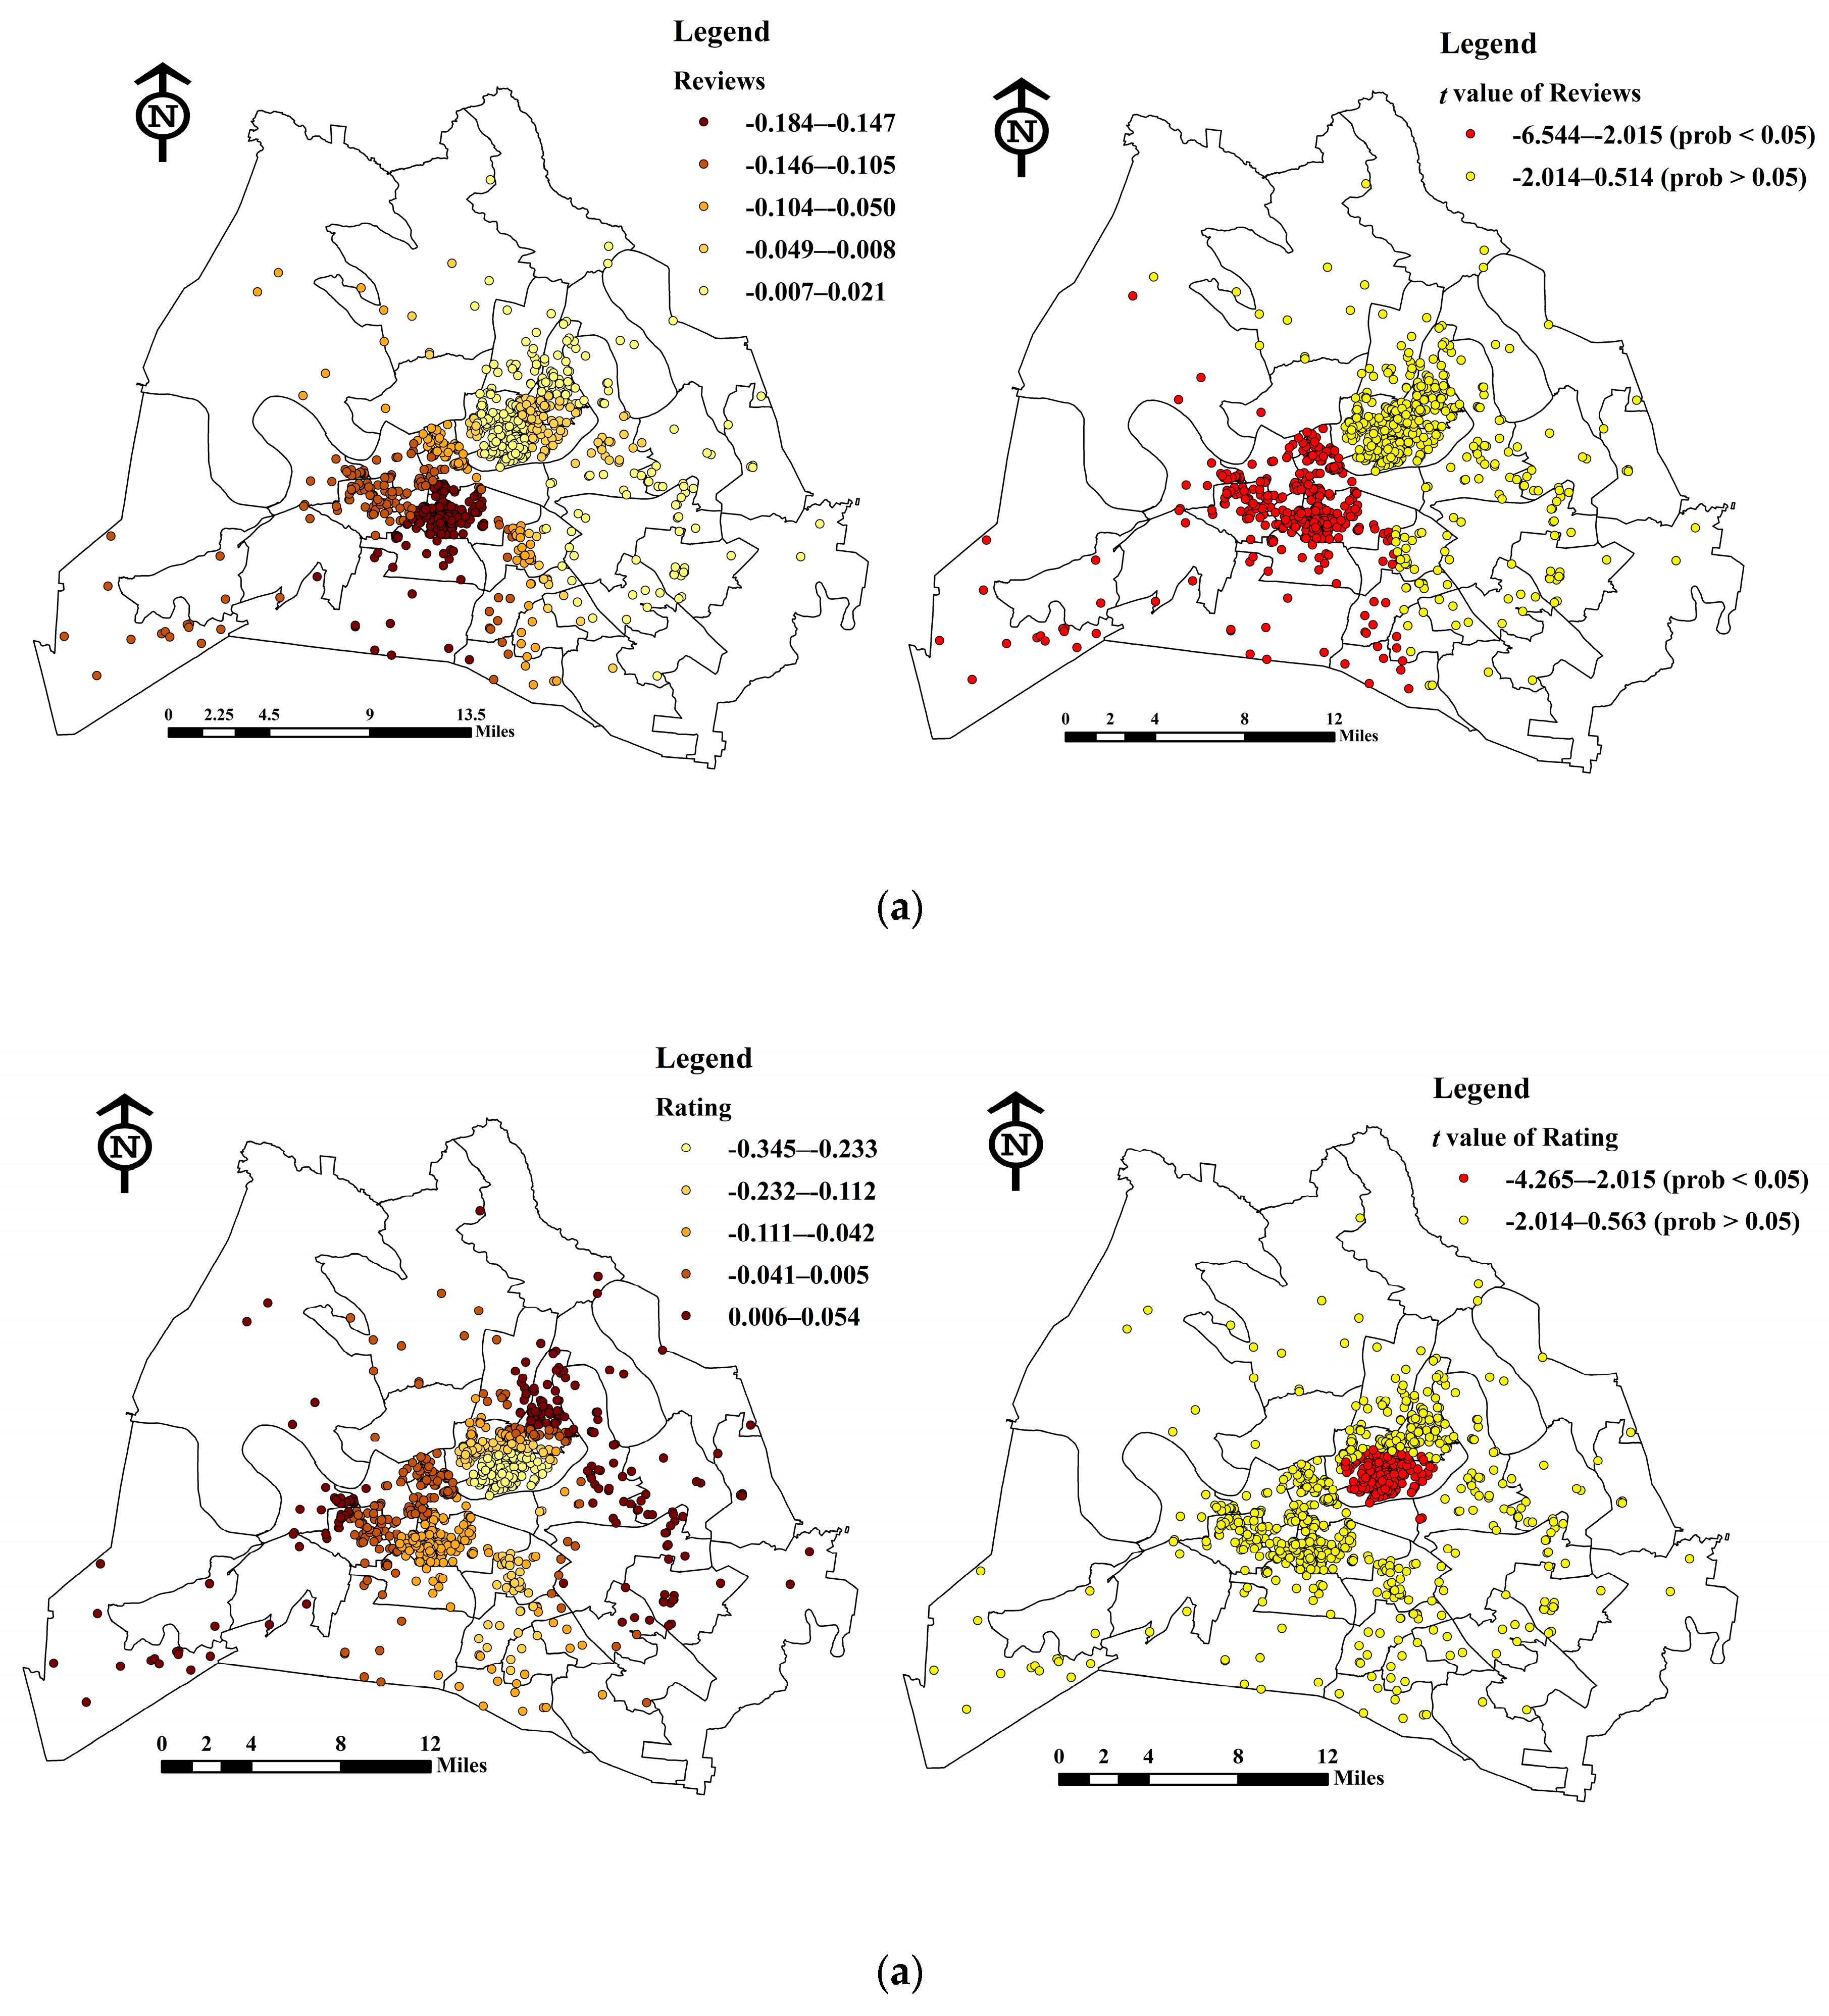
In Figure 5a, significant negative correlations between number of reviews and price exist primarily in west Metro Nashville (districts 18,20–25,34). The negative correlations indicate that the more reviews the listing has, the lower the price, which is inconsistent with previous studies [11]. In Metro Nashville, guests tend to choose lower price listings, and then Airbnb hosts would be more likely to lower their price in order to attract more guests. For Metro Nashville, the reviews have not proven to be correlated to the price.
For Figure 5b, significant negative correlations between review rating scores and Airbnb listing price exist primarily in a small central area of Metro Nashville (districts 5,6,19). The negative correlations suggest that the higher the rating score, the lower the price, which is inconsistent with the previous study [10,31]. This may be due to the phenomenon that the average ratings on Airbnb are dramatically more positive than those on other platforms [17]. In terms of lower price correlated to a higher satisfaction rating, we speculate that it is partly because guests might have lower expectations of an Airbnb listing with a low price; then they can be easily satisfied and are more likely to give a high rating. Currently, satisfaction rating outcomes have not been reflected in the price in this study, as the outcomes of previous studies’ findings that higher price results in higher satisfaction ratings.
4.3. Comparison between GWR Model and GLM
The comparison between the estimated results of the GWR model and the GLM was conducted. In the global model, some factors did not show any significant effects on Airbnb listing prices, but did significantly relate to the price in some specified area in GWR model, which indicates that the GWR model can achieve better performance.
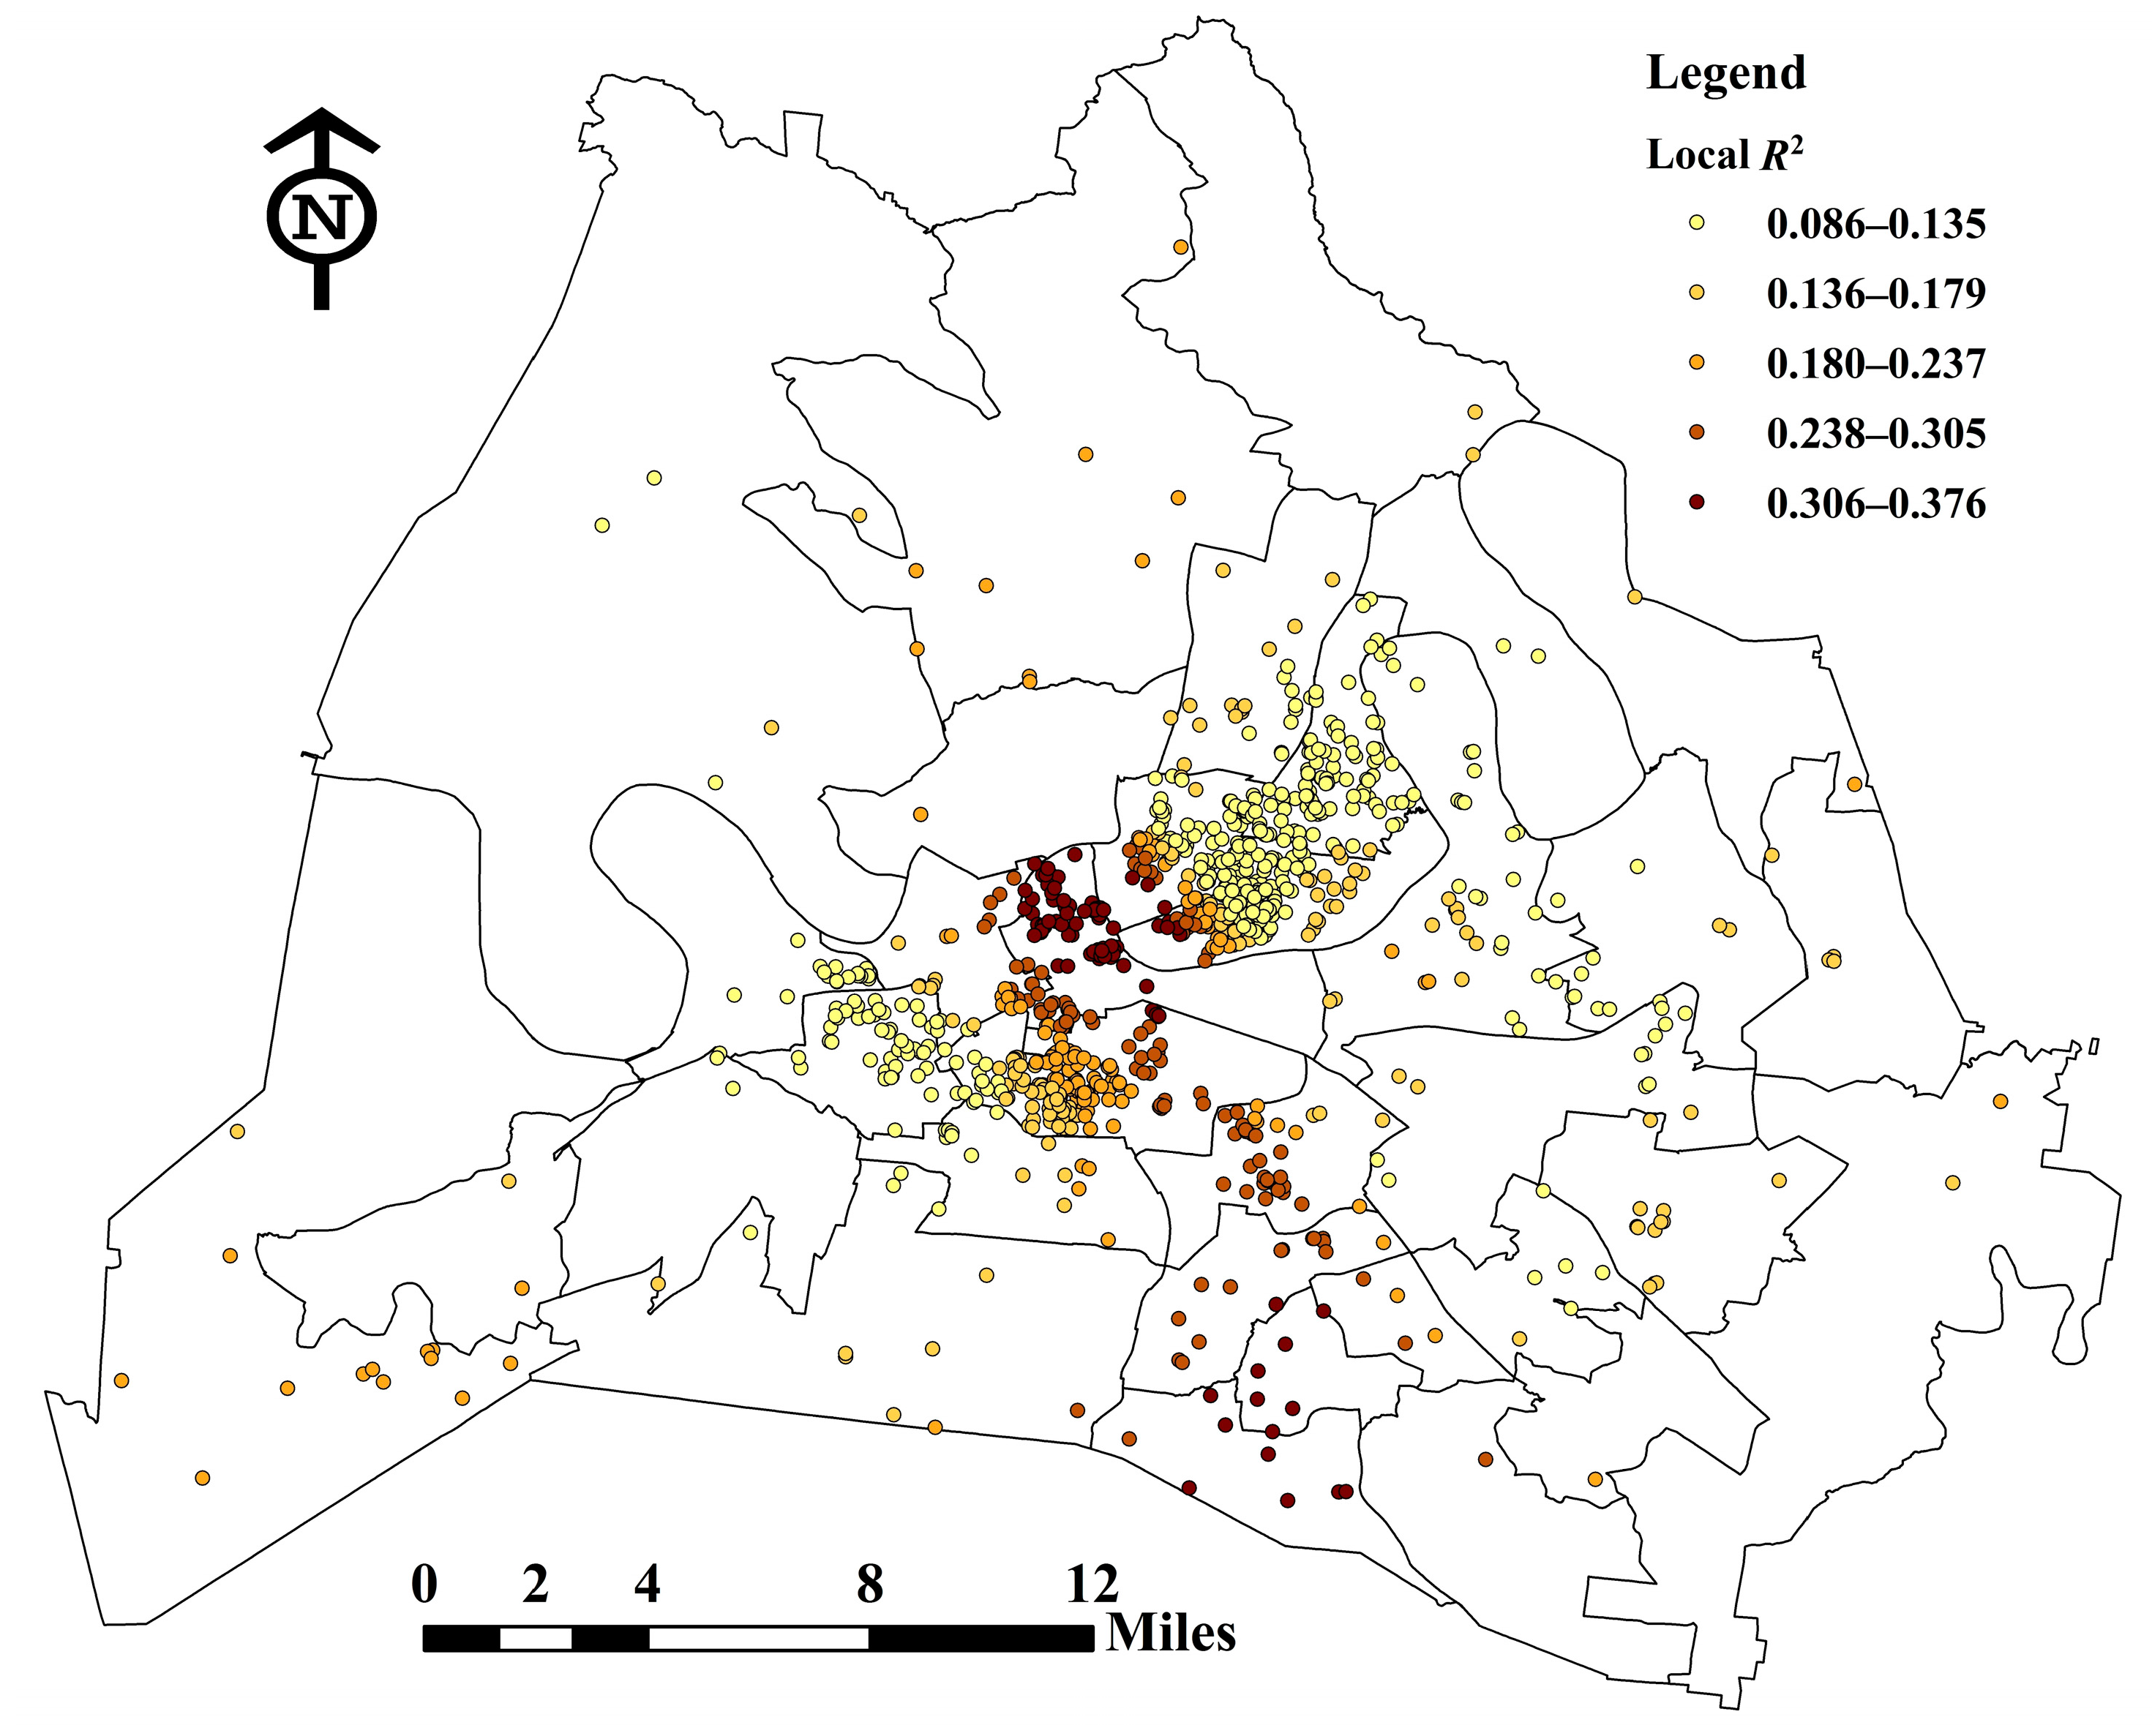
Table 5 shows the comparison of the performance of the GWR model and the GLM. R2 and adjusted R2 obtained using GWR were much higher than that using the GLM; also, the AIC related to the GWR model were also lower. These all suggest considerable improvement using the GWR model compared with the GLM.
Figure 6 shows the spatial variation of the model’s explanatory power (Local R2) produced by GWR model. R2 varied from 0.086 to 0.376 across the regions, and the bigger R2 are primarily located in central and northern Metro Nashville. It should be noted that although the overall R2 was improved by the GWR model, there are still some local R2 lower than 0.12, which should be explored to improve its explanatory power.
5. Conclusions and Future Work
This study investigated the key factors affecting Airbnb listing prices based on a sample of 974 Airbnb listings in Metro Nashville using both the GLM and the GWR model. GLM analysis suggested that the distance to the convention center (C-Distance), the number of reviews (Reviews) and the review rating scores (Rating) are significantly connected with the Airbnb listing price. While the GLM is unable to explore the spatial variation across regions, the GWR model was capable of capturing spatial heterogeneity in price-determinant relationships.
The GWR modeling results showed that the GWR model successfully captured the spatial non-stationary correlations between Airbnb listing prices and the explanatory variables. According to the GWR modelling results, several factors were identified as being strongly related to Airbnb listing prices, and the parameters of variables in the GWR model varied dramatically across regions. For example, the distance to the convention center had a significant negative effect on Airbnb listing price, and the effect in central Metro Nashville was much bigger than for the more remote areas of Metro Nashville. The effects of the established date of listing on an Airbnb listing price mainly are significant in northern Metro Nashville. Additionally, some interesting findings have been highlighted in this study: the number of reviews and the rating score negatively affect the Airbnb listing price, which may result from the fact that Airbnb in Metro Nashville is in an early stage of development, causing the hosts to lower their prices to attract more guests. Thus, the reviews and ratings have not translated into profit.
By comparing the results of the GLM and the GWR model, the GWR model proved to be a better technique for investigating the Airbnb listing price determinants. The explanatory power of the GWR model is much stronger than the GLM, and the coefficient of determination seemed to be higher for the GWR model than for the GLM. In addition, the GWR model achieved a better prediction accuracy than the global model. It appears that the negative coefficients are higher for those Airbnb units that are closer to the city center than those located outside of the city center. It would suggest that after a certain distance (outside the city center), the magnitude of the effect of distance becomes less critical than for those in the city center, where even a small distance away can have a larger negative impact on price due to sensitive crime rate and safety concerns.
The study provided a comprehensive understanding of price determinant relationships in the sharing economy, such as Airbnb. The estimation results of GWR demonstrated the advantages of the GWR method and empirically proved its usefulness for Airbnb or even the sharing economy as a whole. Moreover, this study not only identifies the key factors affecting Airbnb listing prices, but also explores the spatial variation in relationships from location to location. Theoretically, this study sheds light on the relationship between Airbnb listing prices and their price determinants. Practically, these findings can also provide implications for stakeholders such as Airbnb hosts to gain a better understanding of the market situation and formulate a suitable pricing strategy.
There are several limitations in this study. First, the R2 of both the GLM and the GWR model are relatively low, indicating that the factors affecting Airbnb listing prices have not been fully explored. Future studies should explore the influence of other factors on Airbnb listing prices, like the attributes of an Airbnb listing (amenities, interior design, etc.). Second, this study selected Metro Nashville as a case study to investigate the impact of various variables on Airbnb listing prices and explore the spatial heterogeneity across the studied districts. However, variations between cities or even regions have not been explored fully. It should be noted that the price determinant relationships vary significantly across the cities because of the variation in city types, city economics, and the extent of the development of Airbnb, which is of great importance and is worthy of continuous investment in the future.
Acknowledgments
We appreciate the journal reviewers’ feedback.
Author Contributions
Zhihua Zhang provided literature reviews and quantitative analyses. Rachel J. C. Chen guided the project with direction and ideas, added value to methods and recommendations, and edited the manuscript. Lee D. Han guided the project with ideas and added value to recommendations. Lu Yang helped Zhihua Zhang collect information.
Conflicts of Interest
The authors declare no conflict of interest.
References
- Tussyadiah, I.P.; Pesonen, J. Impacts of peer-to-peer accommodation use on travel patterns. J. Travel. Res. 2016, 55, 1022–1040. [Google Scholar] [CrossRef]
- Hamari, J.; Sjöklint, M.; Ukkonen, A. The sharing economy: Why people participate in collaborative consumption. J. Assoc. Inf. Sci. Technol. 2016, 67, 2047–2059. [Google Scholar] [CrossRef]
- Fang, B.; Ye, Q.; Law, R. Effect of sharing economy on tourism industry employment. Ann. Tour. Res. 2016, 57, 264–267. [Google Scholar] [CrossRef]
- Airbnb. About Airbnb. Available online: https://www.airbnb.com/about/about-us (accessed on 7 August 2017).
- Guttentag, D. Airbnb: Disruptive innovation and the rise of an informal tourism accommodation sector. Curr. Issues Tour. 2015, 18, 1192–1217. [Google Scholar] [CrossRef]
- Bull, A.O. Pricing a Motel’s Location. Int. J. Contemp. Hosp. Manag. 1994, 6, 10–15. [Google Scholar] [CrossRef]
- Zhang, H.; Zhang, J.; Lu, S.; Cheng, S.; Zhang, J. Modeling hotel room price with geographically weighted regression. Int. J. Hosp. Manag. 2011, 30, 1036–1043. [Google Scholar] [CrossRef]
- Hung, W.-T.; Shang, J.-K.; Wang, F.-C. Pricing determinants in the hotel industry: Quantile regression analysis. Int. J. Hosp. Manag. 2010, 29, 378–384. [Google Scholar] [CrossRef]
- Balaguer, J.; Pernías, J.C. Relationship between spatial agglomeration and hotel prices. Evidence from business and tourism consumers. Tour. Manag. 2013, 36, 391–400. [Google Scholar] [CrossRef]
- Ikkala, T.; Lampinen, A. Defining the price of hospitality: networked hospitality exchange via Airbnb. In Proceedings of the Companion Publication of the 17th ACM Conference on Computer Supported Cooperative Work & Social Computing, Baltimore, MD, USA, 15–19 February 2014; pp. 173–176. [Google Scholar]
- Wang, D.; Nicolau, J.L. Price determinants of sharing economy based accommodation rental: A study of listings from 33 cities on Airbnb.com. Int. J. Hosp. Manag. 2017, 62, 120–131. [Google Scholar] [CrossRef]
- Chiou, Y.-C.; Jou, R.-C.; Yang, C.-H. Factors affecting public transportation usage rate: Geographically weighted regression. Transport. Res. Pol. Pract. 2015, 78, 161–177. [Google Scholar] [CrossRef]
- Lampinen, A.; Cheshire, C. Hosting via Airbnb: Motivations and financial assurances in monetized network hospitality. In Proceedings of the 2016 CHI Conference on Human Factors in Computing Systems, San Jose, CA, USA, 7–12 May 2016; pp. 1669–1680. [Google Scholar]
- Meleo, L.; Romolini, A.; de Marco, M. The Sharing Economy Revolution and Peer-to-peer Online Platforms. The Case of Airbnb. In Proceedings of the International Conference on Exploring Services Science, Bucharest, Romania, 25–27 May 2016; Volume 247, pp. 561–570. [Google Scholar]
- Lee, D. How Airbnb Short-Term Rentals Exacerbate Los Angeles’s Affordable Housing Crisis: Analysis and Policy Recommendations. Available online: http://blogs.ubc.ca/canadianliteratureparkinson/files/2016/06/How-Airbnb-Short-term-rentals-disrupted.pdf (accessed on 11 September 2017).
- Edelman, B.G.; Geradin, D. Efficiencies and regulatory shortcuts: How should we regulate companies like Airbnb and Uber? Stan. Tech. L. Rev. 2015, 19, 293–328. [Google Scholar]
- Zervas, G.; Proserpio, D.; Byers, J.W. The rise of the sharing economy: Estimating the impact of Airbnb on the hotel industry. J. Market. Res. 2017. [Google Scholar] [CrossRef]
- Neeser, D.; Peitz, M.; Stuhler, J. Does Airbnb Hurt Hotel Business: Evidence from the Nordic Countries. Available online: https://www.heartland.org/publications-resources/publications/does-airbnb-hurt-hotel-business-evidence-from-the-nordic-countries (accessed on 11 September 2017).
- Barron, K.; Kung, E.; Proserpio, D. The Sharing Economy and Housing Affordability: Evidence from Airbnb. Available online: https://papers.ssrn.com/sol3/papers.cfm?abstract_id=3006832 (accessed on 11 September 2017).
- Liang, S.; Schuckert, M.; Law, R.; Chen, C.-C. Be a “Superhost”: The importance of badge systems for peer-to-peer rental accommodations. Tour. Manag. 2017, 60, 454–465. [Google Scholar] [CrossRef]
- Rahimi, S.; Liu, X.; Andris, C. Hidden Style in the City: An Analysis of Geolocated Airbnb Rental Images in Ten Major Cities. In Proceedings of the 2nd Acm Sigspatial Workshop on Smart Cities and Urban Analytics, Burlingame, CA, USA, 31 October–3 November 2016; pp. 1–7. [Google Scholar]
- Ert, E.; Fleischer, A.; Magen, N. Trust and reputation in the sharing economy: The role of personal photos in Airbnb. Tour. Manag. 2016, 55, 62–73. [Google Scholar] [CrossRef]
- Liang, L.J.; Choi, H.C.; Joppe, M. Understanding repurchase intention of Airbnb consumers: Perceived authenticity, electronic word-of-mouth, and price sensitivity. J. Travel Tour. Market. 2017. [Google Scholar] [CrossRef]
- Lee, S.; Kim, D.-Y. Brand personality of Airbnb: Application of user involvement and gender differences. J. Travel Tour. Market. 2017. [Google Scholar] [CrossRef]
- Brochado, A.; Troilo, M.; Shah, A. Airbnb customer experience: Evidence of convergence across three countries. Ann. Tour. Res. 2017, 63, 210–212. [Google Scholar] [CrossRef]
- Mody, M.A.; Suess, C.; Lehto, X. The accommodation experiencescape: A comparative assessment of hotels and Airbnb. Int. J. Contemp. Hosp. Manag. 2017. [Google Scholar] [CrossRef]
- Bae, S.J.; Lee, H.; Suh, E.-K.; Suh, K.-S. Shared experience in pretrip and experience sharing in posttrip: A survey of Airbnb users. Inform. Manag. 2016, 54, 714–727. [Google Scholar] [CrossRef]
- Priporas, C.-V.; Stylos, N.; Vedanthachari, L.N.; Santiwatana, P. Service quality, satisfaction, and customer loyalty in Airbnb accommodation in Thailand. Int. J. Tour. Res. 2017. [Google Scholar] [CrossRef]
- Priporas, C.-V.; Stylos, N.; Rahimi, R.; Vedanthachari, L. Unraveling the diverse nature of service quality in a sharing economy: A social exchange theory perspective of Airbnb accommodation. Int. J. Contemp. Hosp. Manag. 2017. [Google Scholar] [CrossRef]
- Li, Y.; Pan, Q.; Yang, T.; Guo, L. Reasonable price recommendation on Airbnb using Multi-Scale clustering. In Proceedings of the 2016 35th Control Conference (CCC), Chengdu, China, 27–29 July 2016; pp. 7038–7041. [Google Scholar]
- Gutt, D.; Herrmann, P. Sharing Means Caring? Hosts’ Price Reaction to Rating Visibility. Available online: http://aisel.aisnet.org/cgi/viewcontent.cgi?article=1053&context=ecis2015_rip (accessed on 11 September 2017).
- Chen, C.F.; Rothschild, R. An application of hedonic pricing analysis to the case of hotel rooms in Taipei. Tour. Econ. 2010, 16, 685–694. [Google Scholar] [CrossRef]
- Becerra, M.; Santaló, J.; Silva, R. Being better vs. being different: Differentiation, competition, and pricing strategies in the Spanish hotel industry. Tour. Manag. 2013, 34, 71–79. [Google Scholar] [CrossRef]
- Thrane, C. Examining the determinants of room rates for hotels in capital cities: The Oslo experience. J. Revenue Pricing Manag. 2007, 5, 315–323. [Google Scholar] [CrossRef]
- Lee, S.K.; Jang, S. Premium or discount in hotel room rates? The dual effects of a central downtown location. Cornell Hosp. Q. 2012, 53, 165–173. [Google Scholar] [CrossRef]
- Schamel, G. Weekend vs. midweek stays: Modelling hotel room rates in a small market. Int. J. Hosp. Manag. 2012, 31, 1113–1118. [Google Scholar] [CrossRef]
- Masiero, L.; Nicolau, J.L.; Law, R. A demand-driven analysis of tourist accommodation price: A quantile regression of room bookings. Int. J. Hosp. Manag. 2015, 50, 1–8. [Google Scholar] [CrossRef]
- Yang, Y.; Mueller, N.J.; Croes, R.R. Market accessibility and hotel prices in the Caribbean: The moderating effect of quality-signaling factors. Tour. Manag. 2016, 56, 40–51. [Google Scholar] [CrossRef]
- Fotheringham, A.S.; Brunsdon, C.; Charlton, M. Geographically Weighted Regression: The Analysis of Spatially Varying Relationships, 1st ed.; John Wiley & Sons: Hoboken, NJ, USA, 2002. [Google Scholar]
- Fotheringham, A.S.; Charlton, M.E.; Brunsdon, C. Geographically weighted regression: A natural evolution of the expansion method for spatial data analysis. Environ. Plan. 1998, 30, 1905–1927. [Google Scholar] [CrossRef]
Figure 1.
Spatial distribution of Airbnb listings in Metro Nashville.

Figure 2.
Spatial distribution of estimated coefficients and t values of the distance to convention center.
Figure 2.
Spatial distribution of estimated coefficients and t values of the distance to convention center.
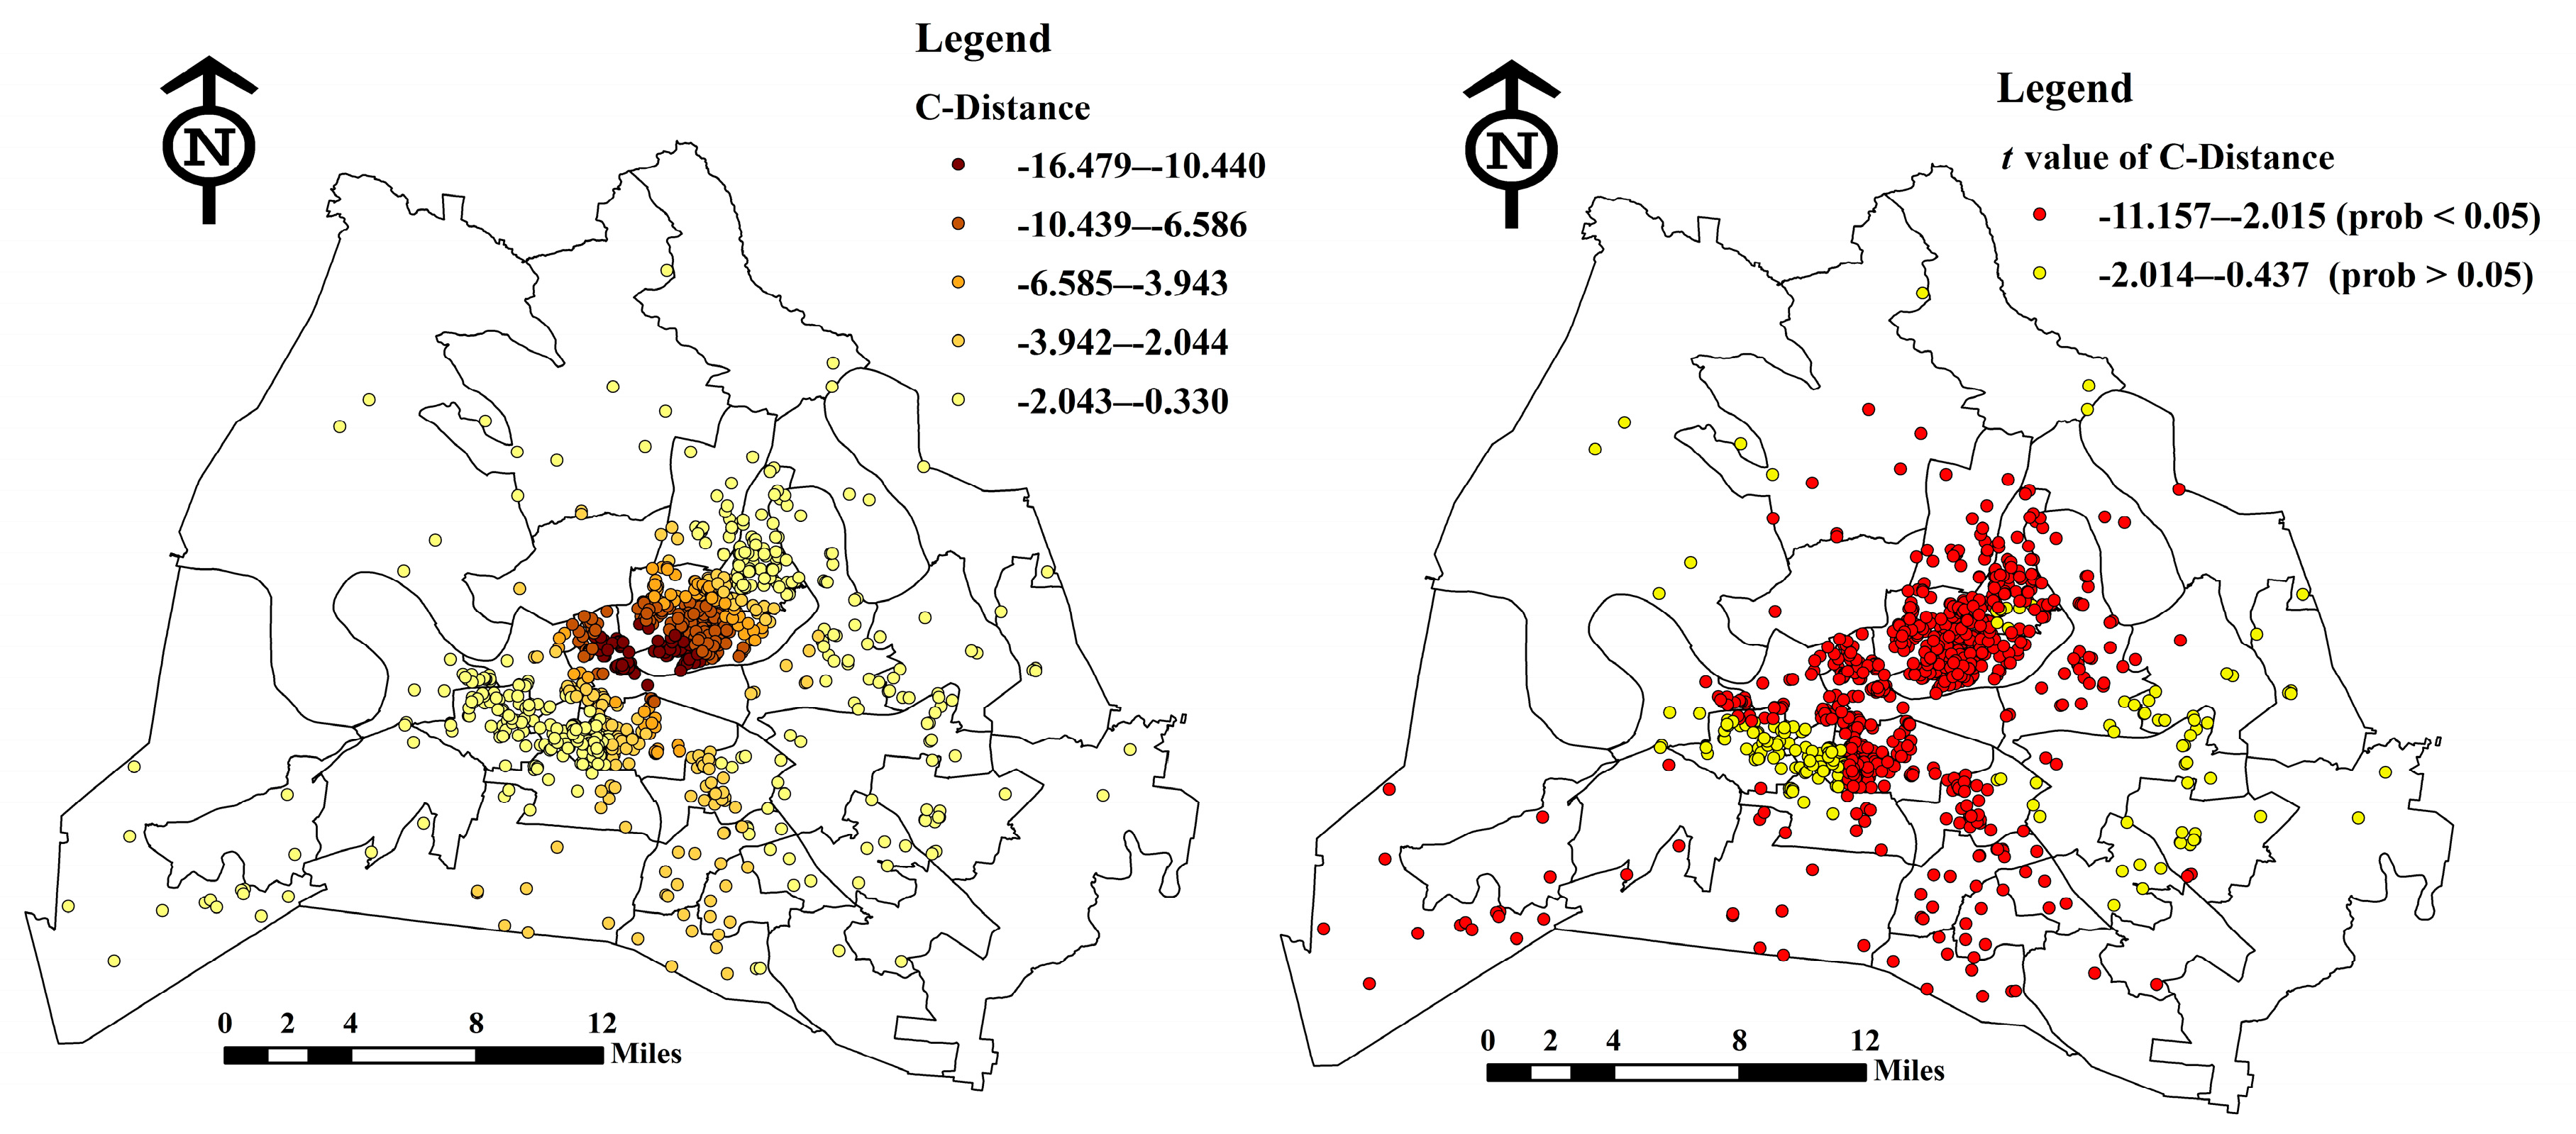
Figure 3.
Spatial distribution of estimated coefficients and t values of the distance to the nearest highway.
Figure 3.
Spatial distribution of estimated coefficients and t values of the distance to the nearest highway.
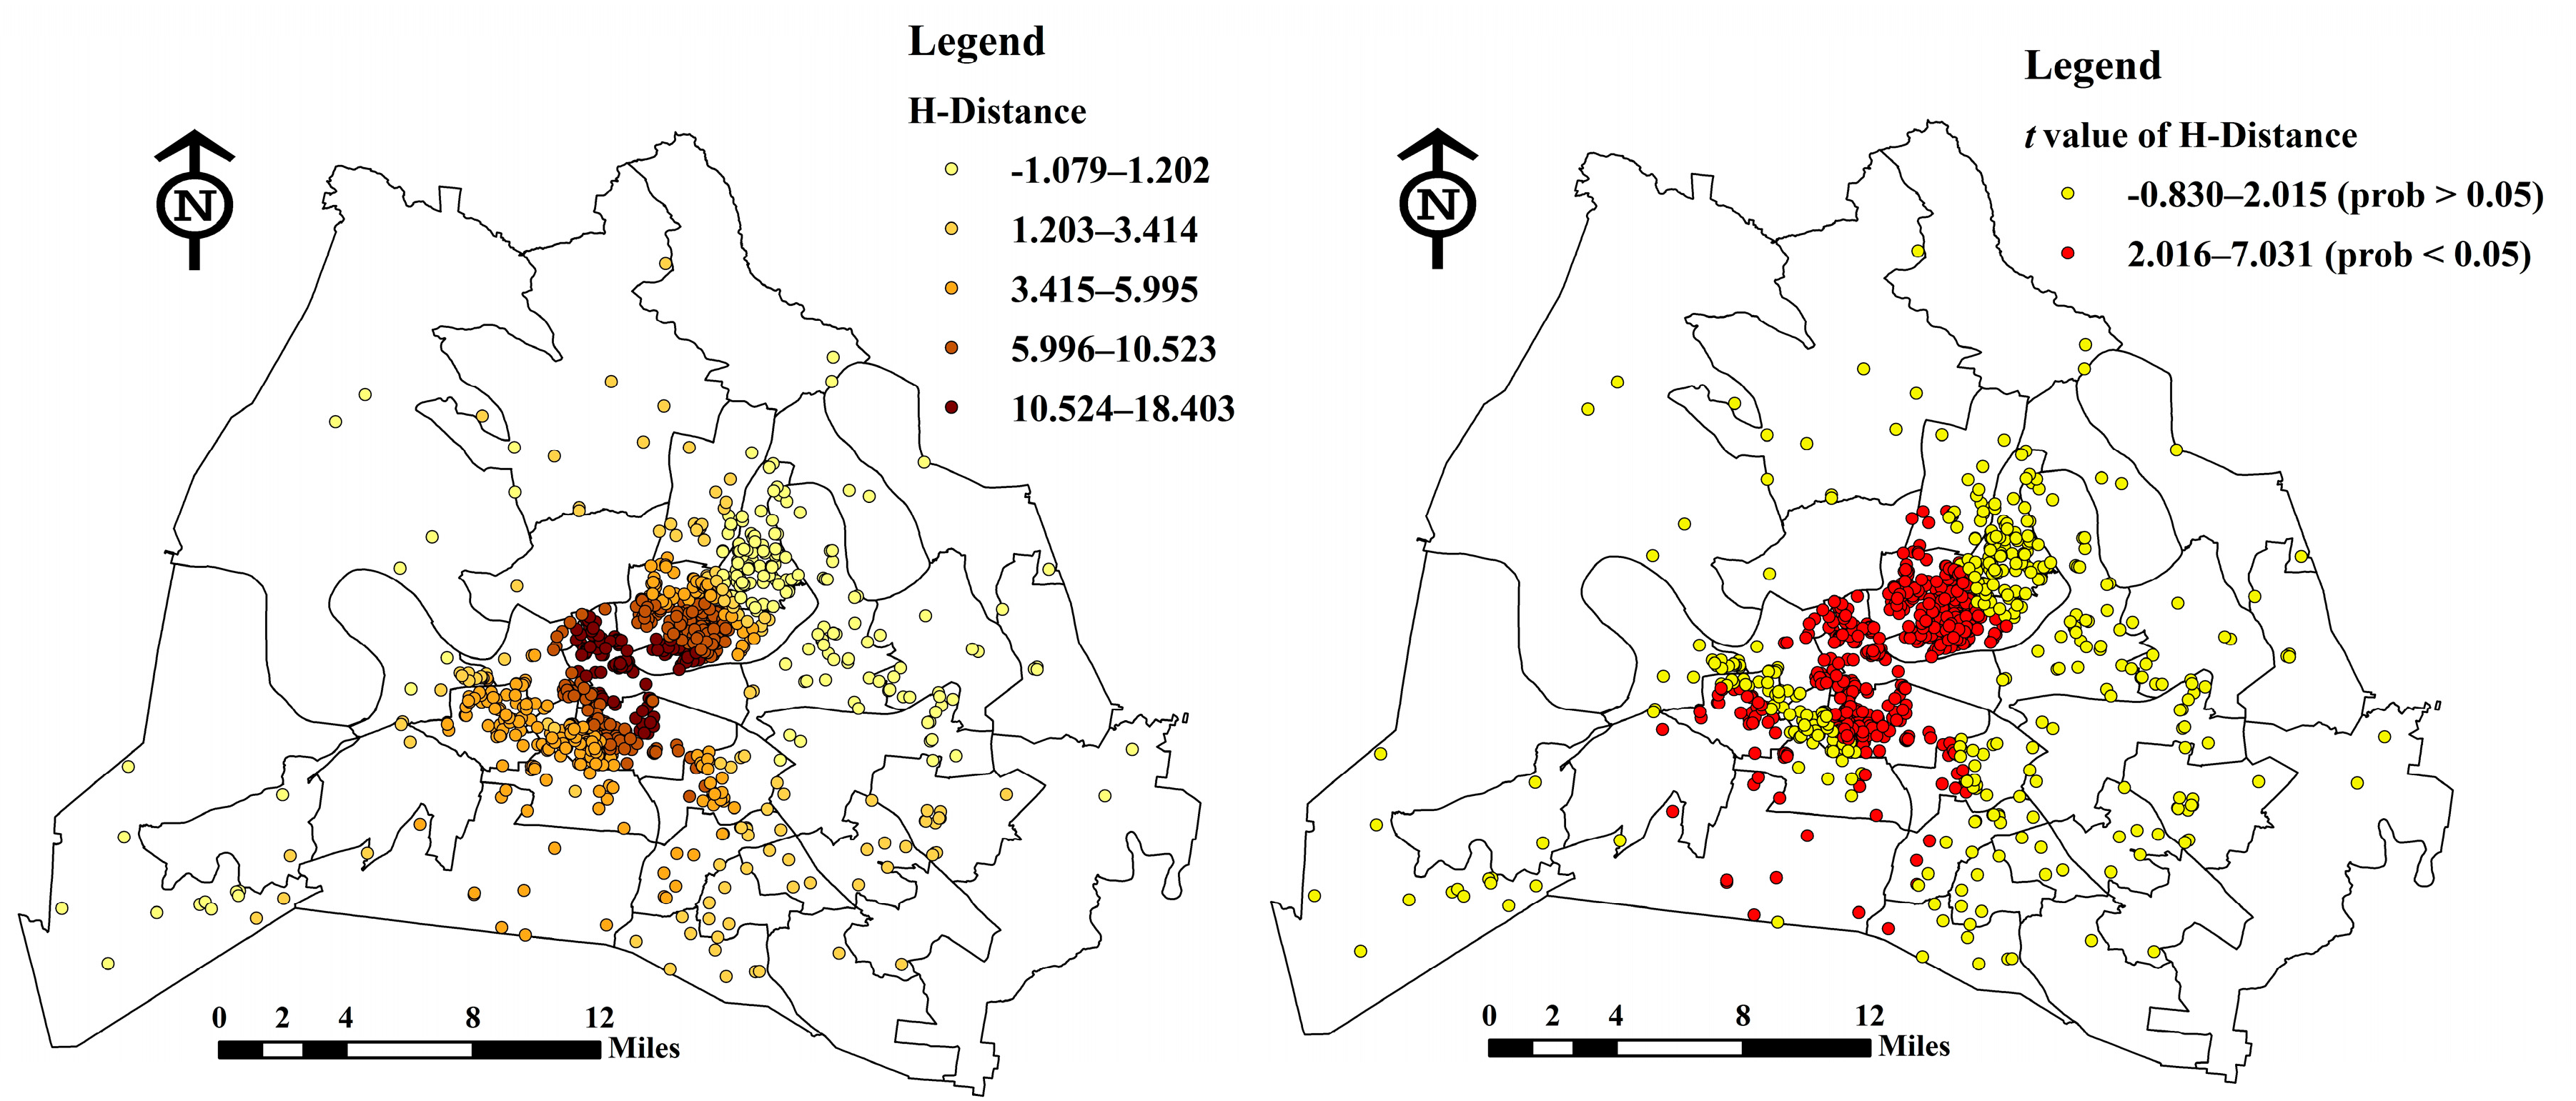
Figure 4.
Spatial distribution of estimated coefficients and t values of age.

Figure 5.
Spatial distribution of estimated coefficients and t values of Reviews (a) and Rating (b).
Figure 5.
Spatial distribution of estimated coefficients and t values of Reviews (a) and Rating (b).

Figure 6.
Spatial distribution of the power of explanatory variables (Local R2).

Table 1.
Overview of reviewed studies on Airbnb’s price determinants.
| Literature | Determinants | Effects | Details |
|---|---|---|---|
| Ikkala and Lampinen [10] | Reputation (positive reviews) | Positive | Qualitative study, 11 in-depth semi-structured interviews with Airbnb hosts |
| Gutt and Herrmann [31] | Rating visibilities (more than three reviews) | Positive | Rating visibility leads to an increase in price by 2.69 € |
| Li et al. [30] | Facility Distance to nearest landmarks | Positive Positive | Multi-Scale Affinity Propagation (MSAP) method to cluster; Linear Regression model with Normal Noise (LRNN) to predict the reasonable price |
| Wang and Nicolau [11] | Host attributes Site and property attributes Amenities and services Rental rules Online review ratings | Mixed | OLS regression and quantile regression Data of Airbnb listing information form 33 cities |
Table 2.
Variables and brief descriptions.
| Variable | Description |
|---|---|
| Price | The ratio of listed price per night over the maximum guests (U.S. dollars). |
| Reviews | Number of reviews of Airbnb listings. |
| H-Distance | The Euclidean distance to nearest highway (km). |
| C-Distance | The Euclidean distance to the Nashville Convention Center (km). |
| Age | Months since the listing was established. |
| Rating | The overall rating score of Airbnb listings. |
Table 3.
Summary of estimation results of the general linear model (GLM).
| Variable | Coefficient | Standard Error | t-Value | p-Value | 95% Confidence Limits | |
|---|---|---|---|---|---|---|
| Intercept | 56.32561 ** | 3.78106 | 14.90 | <0.0001 | 48.90558 | 63.74563 |
| H-Distance | −0.36897 | 0.45514 | −0.81 | 0.4178 | −1.26215 | 0.52421 |
| C-Distance | −1.52435 ** | 0.17030 | −8.95 | <0.0001 | −1.85855 | −1.19016 |
| Reviews | −0.05080 ** | 0.01303 | −3.90 | 0.0001 | −0.07637 | −0.02524 |
| Age | 0.02233 | 0.03803 | 0.59 | 0.5572 | −0.05229 | 0.09695 |
| Rating | −0.07317 * | 0.03662 | −2.00 | 0.0460 | −0.14502 | −0.00131 |
Notes: ** = p < 0.01; * = p < 0.05.
Table 4.
Estimated geographically weighted regression (GWR) coefficients.
| Variable | Mean | Min | First Quartile | Median | Third Quartile | Max |
|---|---|---|---|---|---|---|
| Intercept | 59.794 | 26.863 | 47.879 | 57.155 | 71.177 | 96.336 |
| Reviews | −0.063 | −0.184 | −0.128 | −0.016 | −0.003 | 0.021 |
| Rating | −0.096 | −0.345 | −0.167 | −0.051 | −0.005 | 0.054 |
| Age | 0.064 | −0.118 | −0.039 | 0.013 | 0.168 | 0.329 |
| H-Distance | 5.580 | −1.079 | 2.292 | 4.964 | 7.425 | 18.403 |
| C-Distance | −4.542 | −16.479 | −7.599 | −2.536 | −1.487 | −0.330 |
Table 5.
The comparison of the performance of the GWR model and the GLM
| Performance | GLM Model | GWR Model |
|---|---|---|
| R2 | 0.12 | 0.30 |
| Adjusted R2 | 0.11 | 0.25 |
| AIC | 8482.355540 | 8351.141298 |
| Number of parameters | 6 | 6 |
| Residuals sum of squares | 340,382.548324 | 272,217.960172 |
© 2017 by the authors. Licensee MDPI, Basel, Switzerland. This article is an open access article distributed under the terms and conditions of the Creative Commons Attribution (CC BY) license (http://creativecommons.org/licenses/by/4.0/).
Share and Cite
MDPI and ACS Style
Zhang, Z.; Chen, R.J.C.; Han, L.D.; Yang, L. Key Factors Affecting the Price of Airbnb Listings: A Geographically Weighted Approach. Sustainability 2017, 9, 1635. https://doi.org/10.3390/su9091635
AMA Style
Zhang Z, Chen RJC, Han LD, Yang L. Key Factors Affecting the Price of Airbnb Listings: A Geographically Weighted Approach. Sustainability. 2017; 9(9):1635. https://doi.org/10.3390/su9091635
Chicago/Turabian StyleZhang, Zhihua, Rachel J. C. Chen, Lee D. Han, and Lu Yang. 2017. "Key Factors Affecting the Price of Airbnb Listings: A Geographically Weighted Approach" Sustainability 9, no. 9: 1635. https://doi.org/10.3390/su9091635
Note that from the first issue of 2016, this journal uses article numbers instead of page numbers. See further details here.