Article

Integrated Methodologies (SWOT, TOWS, LCA) for Improving Production Chains and Environmental Sustainability of Kiwifruit and Baby Kiwi in Italy

Department of Agricultural, Forest and Food Sciences (DISAFA), University of Torino, Largo Paolo Braccini 2–Grugliasco, 10095 Torino, Italy
*
Author to whom correspondence should be addressed.
Sustainability 2017, 9(9), 1621; https://doi.org/10.3390/su9091621
Submission received: 3 August 2017 / Revised: 6 September 2017 / Accepted: 8 September 2017 / Published: 12 September 2017

Abstract

:
Italy’s kiwifruit growers are considered to be world-leading players of the past 20 years. However, with this success come its challenges. In the last five years, a bacterial canker of kiwifruit known as Pseudomonas syringae pv. actinidiae (Psa) has caused a dramatic reduction in the size of the areas cultivated, leading to several experienced Piedmontese Actinidia deliciosa growers beginning to cultivate the A. arguta. To better understand the potential for replacing the common kiwifruit in Italy’s Piedmont region with plantations of A. arguta and to attain a systematic approach and support for decision situations; we assessed the environmental impact of the two production chains (field and storage) from a technical-operational perspective. The assessment was conducted through interviews with producers, field and warehouse technicians and sales managers in order to reveal the strengths and weaknesses of the two systems. The work presented below considers the application of the Life Cycle Assessment (LCA) method for the field system (two different phases of the plantation) and the SWOT (Strengths, Weaknesses, Opportunities, Threats) analysis for the entire supply chain (field and warehouse management). Finally, a TOWS analysis (Threats, Opportunities, Weakness, Strengths) integrated the results of both LCA and SWOT analyses and permitted to highlight the development strategies for A. arguta in Piedmont. The total orchard cycle for A. arguta presents an impact of 0.14 kg CO2 eq (GWP) and for A. deliciosa an impact of 0.11 kg CO2 eq (GWP). Based on the synthesis of results from our TOWS analysis, we identified the following development strategies to help to shape the future A. arguta supply chain in Piedmont: Large-scale oriented; Berry fruits oriented; Export and organic oriented and Niche oriented.

1. Introduction

Actinidia is a genus of berry-bearing shrubs and vines native to East Asia. In the first half of the twentieth century the cultivar ‘Hayward’ of Actinidia deliciosa (A. Chev.) Liang and Ferguson, was developed in New Zealand and still accounts for more than 90% of the total international market volume of kiwifruit. The global production of commercial kiwifruit now exceeds 2.4 million tonnes a year. China produces about half of the total international production, but only 1% of its volume is destined for export. Italy, New Zealand, Chile and Greece are jointly responsible for about 80% of all kiwis produced outside of China with most of their fruit destined for export [1]. A small part of the world production is made up of golden kiwifruit (A. chinensis Planch.). ‘Hort 16 A’ and ‘Jintao’ are the yellow-fleshed cultivar currently present on the market. They are protected cultivars, meaning that their cultivation is restricted to license holders. The marketing of the fruit is controlled by a consortia. Other yellow-fleshed selections are likely to become important. They differ from green-fleshed A. deliciosa by having smooth skin, yellow-coloured flesh and lower storage stability. Other Actinidia species are of minor economic importance, including the hardy kiwi A. arguta (Siebold and Zucc.) Planch. ex Miq., also referred to as kiwi berry, baby kiwi or cocktail kiwi [2]. The hardy kiwifruit is clearly smaller than A. deliciosa and A. chinensis fruit and grows only to the size of dessert grapes. Its skin is thin and smooth and, depending on the variety, may be green, brown or purple. Hardy kiwifruit can be eaten whole with the peel included. Its short shelf life limits the commercial potential, but the plants have gained increasing popularity in the last five years. A major factor contributing to the popularity of hardy kiwifruit is its aroma [3].
Another factor that contributes to the successful expansion of the cultivation of A. arguta is that, following experiments, it has been included in the group of species (Leiocarpae-A. macrosperma. A. valvata. A. polygama. A. melanandra) which have shown resistance to (or tolerance of) Pseudomonas syringae pv. actinidiae (Psa) [4]. One of the most recent problems at the international level linked to the cultivation of kiwifruit has been the spread of the PSA bacteria, which causes kiwigreen bacterial canker. PSA first occurred in Japan in the 1980s [5] with subsequent isolated outbreaks in South Korea [6] and Italy [7]. From 2008–2011 there was a rapid spread of the PSA bacterial canker [8,9] due to dissemination between the plantations caused by bacterial exudates, formed by cankers during the autumn-winter seasons and often carried by wind [10,11,12].
This situation has led to a drop in production and invested surface of the classic varieties, particularly in the production of A. chinensis (Hort 16 A) in New Zealand, where it significantly declined from 92,200 tonnes in 2010 to 37,500 tonnes in 2013. Bacteriosis also concerns other important producer countries and has interrupted international production growth of kiwifruit. For example, from 2008 to the present day, Italy reduced the invested surface and led to a decline in production between 2010 and 2013 of about 15% [13]. The situation is slowly recovering today, with about 25,000 hectares of Actinidia cultivars cultivated in Italy. To mitigate PSA in Italy’s Piedmont region, around 1,000 hectares of plantations have been cut down in the last five years. This action was declared in the recent Regional Plan of Action, a decree passed in 2013 by the Italian Ministry of Agriculture [14].
At the moment, international research is exploring solutions that producers can implement in the short term. On one hand, a series of products such as copper-based compounds, plant extracts and biological control agents (BCAs) are being tested in vitro, in greenhouse and in the field [15,16]. As highlighted, it is hoped that a combined strategy can be found which will consider the treatment and correct management of pruning (including the disinfection of tools and the protection of pruning incisions), fertilization and irrigation [17].
Research is also being pursued in other directions such as photo-selective nets being tested in Italy and plastic canopies on trial in New Zealand [18]. In New Zealand, particular attention is paid to obtaining and cultivating new varieties as Gold 3 and Gold 9 [18].
Although no information on the differences in susceptibility of new cultivars of kiwi or other species of kiwi has been released up to now, in all the research relating to the resistance/susceptibility of the different species of Actinidia, A. arguta is discovered to be the least affected by bacterium canker, both in Europe and in New Zealand [19]. This is why one of the alternative proposals to Actinidia deliciosa in Italy could be the cultivation of A. arguta.
Today, two new commercial kiwi cultivars, ‘Hortgem Tahi®’ and ‘Hortgem Rua®’, are being grown in Italy, France and Portugal. They have been sold in European retail stores under the Nergi® brand since 2013. The challenge is to have similar plantations from an operational point of view but with kiwis that are very different from the common species (A. deliciosa and A. chinensis), namely A. arguta kiwis that are smaller (max. 15–20 g), bright green and smooth so that they can be eaten whole, without peeling, a lot like berry fruits.
To better understand the potential for replacement of the common kiwifruit in Piedmont with plantations of A. arguta and to attain a systematic approach and a support for decision making, we assessed the environmental impact of the two production chains (field and storage), also from a technical-operational perspective.
The assessment was conducted through interviews with producers, field and warehouse technicians and sales managers in order to reveal the strengths and weaknesses of the two systems. The work presented here considers the application of the Life Cycle Assessment (LCA) method for the field system (two different phases of the plantation: young plants and adult plants in full production) and the SWOT analysis for the entire supply chain (field and warehouse management). The combined interpretation of the results with the TOWS analysis, different arrangements of the words Strengths, Weakness, Opportunities and Threats compared to SWOT analysis, permitted to highlight the development strategies for A. arguta in Piedmont. The ability of SWOT is the matching of specific internal (strengths and weaknesses) and external (threats, opportunities) factors, which provides a strategic matrix (Weihrich 1982) [20]. It is essential to note that the internal factors are within the control of the A. arguta system, such as filed operations, marketing, and other areas. On the other hand, the external factors are out of the system’s control, such as the macroeconomic and political factors, new technologies, and competition [21]. The interpretation of the TOWS matrix, permitted to develop alternatives strategies on the basis of relationships between threats, opportunities, weaknesses and strengths indicated from SWOT [22] including, between the internal factors the impacts obtained by LCA analysis. Figure 1 shows the flowchart used in conceptual framework.

2. Materials and Methods

It is necessary for all stakeholders, from primary producer to buyer, to be involved in the processes related to strategic planning for the kiwifruit industry. This includes identifying current and potential issues. To achieve this, it is important to identify appropriate tools. Thus, after defining the common goal and scope among stakeholders, a performance assessment was conducted based on the parallel application of the Life Cycle Assessment (LCA), SWOT and TOWS analyses with a common purpose but applied independently. To achieve this aim, the study pursued two paths starting in 2015.
The first path developed a quantitative analysis evaluating the efficiency of the agricultural and warehouse system in terms of environmental sustainability with the LCA approach. The second step involved a qualitative analysis through semi-structured interviews. In total, 29 questionnaires (administered to producers and other stakeholders) were filled out during face-to-face interviews and on-site visits. The interviews included questions about field production, warehouse management and sales management.

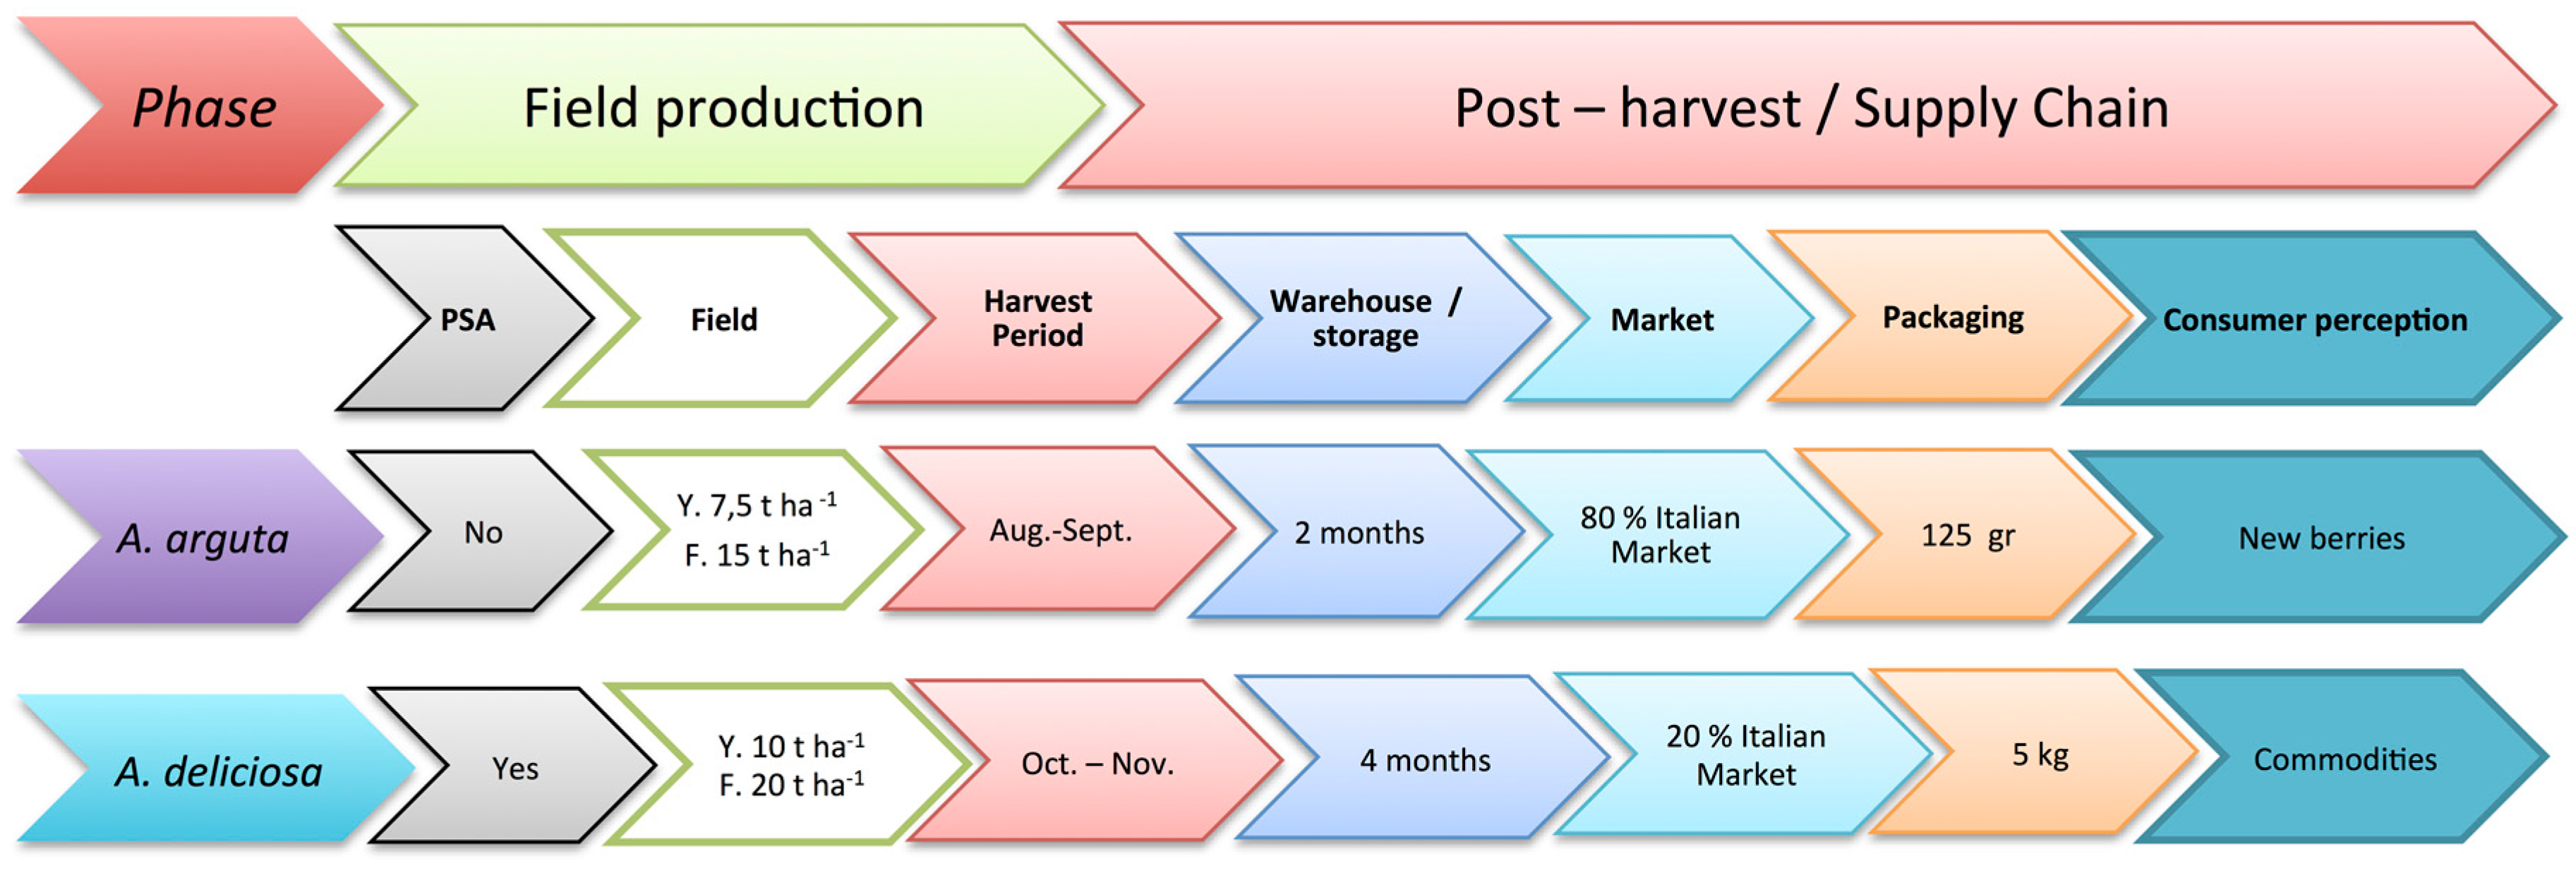
2.1. Geographical Context

Regarding production and dissemination of kiwifruits throughout Italy, Piedmont is the second largest region after Lazio, with approximately 5300 hectares distributed throughout the provinces of Cuneo and Turin, and accounting for over 20% of Italian production [13]. With 10,800 fruit farms, Piedmont’s fruit production occupies an area of 51,273 hectares, representing 5% of the region’s total agricultural land and weighing 15% in terms of production at basic prices (480 million euro estimated in 2007) [23]. Piedmont is strongly specialized in exports, providing approximately 40% of all kiwifruit production in Italy (the rest coming from the Lazio region and Southern Italy).
In terms of territorial characteristics, the climate is continental both in the plains and in the hills; winters are cold (with temperatures falling to −10 °C) and long, while summers are hot (up to +35 °C) and short. Rainfall is concentrated mainly in the spring and autumn (annual average 1114 mm) [24].

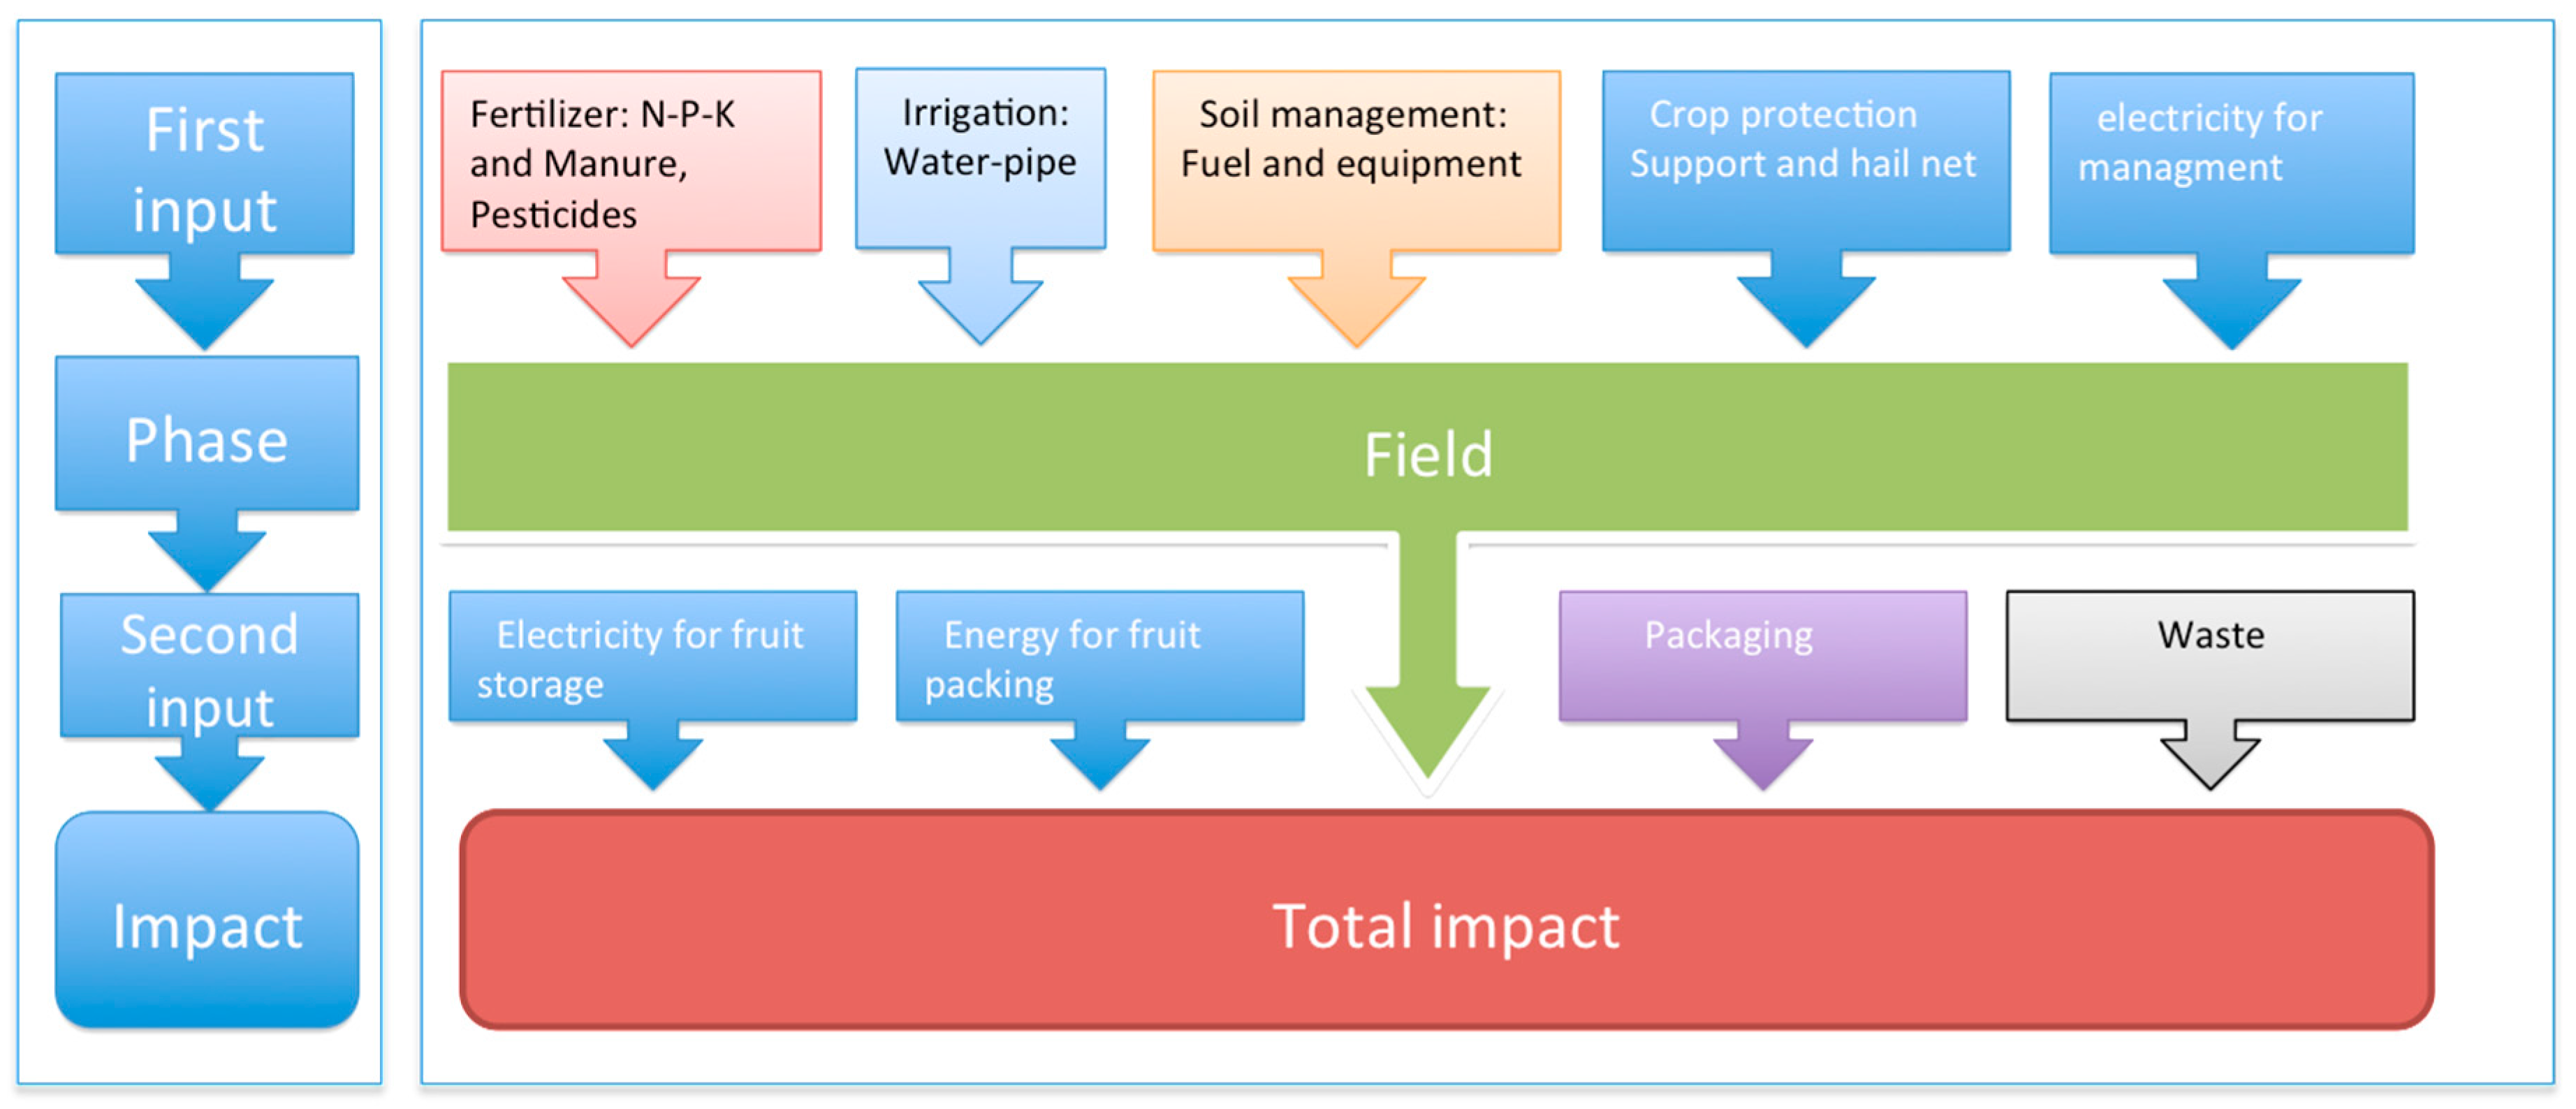
2.2. LCA Goal and Scope

The life cycle assessment (LCA) method was applied to this work and followed the guidelines of the International Organization for Standardization (ISO)’s 14040:2006 (ISO 2006). The LCA method has also been successfully applied in farming and agri-food systems [25,26,27,28].
The aim of this LCA was to assess the environmental impact of the production of 1 kg of A. arguta (cv ‘Hortgem Tahi®’ and ‘Hortgem Rua®’) and the production of 1 kg of A. Deliciosa (cv Hayward), in the field phase (I input, Figure 2) and in the field + warehouse phase (II input, Figure 2).
The impacts of the entire field cycle were calculated for both crop species, taking into consideration the young phase of the field and then added to the subsequent adult productive phase [29,30].
For both crop species, the young phase lasts 4 years and the productive phase lasts 20 years (for a total cycle of 24 years). Regarding A. deliciosa, a production level of 10 t ha−1 in the young phase and of 20 t ha−1 in the productive phase was considered. For A. arguta the production levels considered were 7.5 t ha−1 in the young phase and 15 t ha−1 in the productive phase (grower’s data).
This approach is based on the principle that the fruit sold can come from both the young and adult phases. This means that kiwifruits can come from a determined production phase of the field proportionate to the yield accumulated during that phase [30].
The impact on the entire life cycle (calculated using the Orchard cycle impact, Equation (1)) was obtained by weighing the various phases in relation to production (Yield contribution, Equation (2)) and was calculated as follows:
Orchard   cycle   impact   j , k   =   i = 1 2 impact j , k , i   x   yield   contribution   k , i
With the weighting factor “yield contribution”:
yield   contribution   k , i =   lifespan k , i   x   yield k , i i = 1 2 lifespan k , i   x   yield k , i
whereby:
  • impactj,k,i = annual median impact per kg for orchard production phase i, impact category j and production system k;
  • yieldk,i = median yield obtained in orchard production phase i and production system k;
  • lifespank,i = lifespan of orchard production phase i and production system k.

2.3. Life Cycle Inventory (LCI)

System Boundaries and Data Collection

The data used to carry out the field LCA were acquired through questionnaires filled out by 20 producers from 2015 to 2016. They all belonged to a producers’ organisation located in Piedmont and produced both kiwifruit species. In addition to the interviews with producers, the field-books of each farm were analysed to quantify the resources used in cultivation. This permitted the study to obtain data from an average area of about 70 ha for both crops. In the case of A. arguta, this surface represents the totality of hectares currently in production. Regarding the aspects linked to the nursery phase, the figures were acquired from two plant nurseries which supply the plants to the farms. The information relating to the post-harvest phase was supplied by technical staff (3 people) of the fruit warehouse where the product is processed (Table 1).
All the processes necessary for crop management and the post-harvest phase were considered, including the associated auxiliary processes, such as transportation of materials and the waste generated in each phase. The consumption phase and transportation from the point of sale (market) to the end consumer were not considered. However, the disposal of packaging materials was included in the analysis.
The main differences between A. arguta and A. deliciosa are summarized in Figure 3. Both are climbing lianas.
Some of the major differences between both species are the weight, skin type and harvesting seasons. In the case of A. deliciosa, the fruit has a hairy skin and an average weight of 100 g and has hairy, inedible skin. Conversely, the weight of A. arguta varies between 15 and 20 g and has smooth, edible skin. A. deliciosa is harvested in Piedmont in late October-early November. A. arguta is harvested in the first ten days of September. Both are harvested by hand, but for A. arguta the operators have to wear gloves to prevent damage to the fruit’s skin. The fruit of A. deliciosa are placed in plastic bins with a volume of half a cubic meter (300 kg) before going to the processing warehouses (post-harvest) where they are kept for an average of 4 months. Then the fruit is calibrated, divided by size, and any imperfect fruit is discarded. The fruit of A. arguta is particularly delicate, so they are harvested into plateaux containing an average of 10 kg of product. After harvesting, the product is sent to the warehouses, where they are calibrated and placed into PET punnets with lids (125 g) and kept for a maximum of 2 months, without being further handled.

2.4. Life Cycle Impact Assessment (LCIA)

The environmental footprint of the products and relative International Life Cycle Data (ILCD) develops through 16 categories of impact, as declared by Goossens et al. (2017) [30]. In our case, we based our selection of impact categories on literature [26,31,32] and focused our analysis on global warming potential (GWP) according to the Intergovernamental Panel on Climate Change (IPCC GWP 100a kg CO2 eq), and non-renewable energy (MJ primary). The choice of these impact categories was related to the need of providing an impact evaluation of the examined production in relation to climate change that can be readily communicated and understood by stakeholders. The non-renewable energy source category was selected to provide a view of the impacts in relation to emissions and also to consumption; the latter is considered as one of the most critical issues in the primary sector.
To analyse the data collected during the Life Cycle Inventory, we used SimaPro 7.3 software and subsequent upgrades [33]. The software allowed the monitoring and analysis of the life cycles, systematically and transparently, following the ISO standards of the 14040 (2006) [34]. A cut-off was applied at the 2% mark and all of the data registering below this percentage were grouped together in the “other” category. The databases used for the inventory are present in Ecoinvent 2.2 and LCA alimentary DK [35].

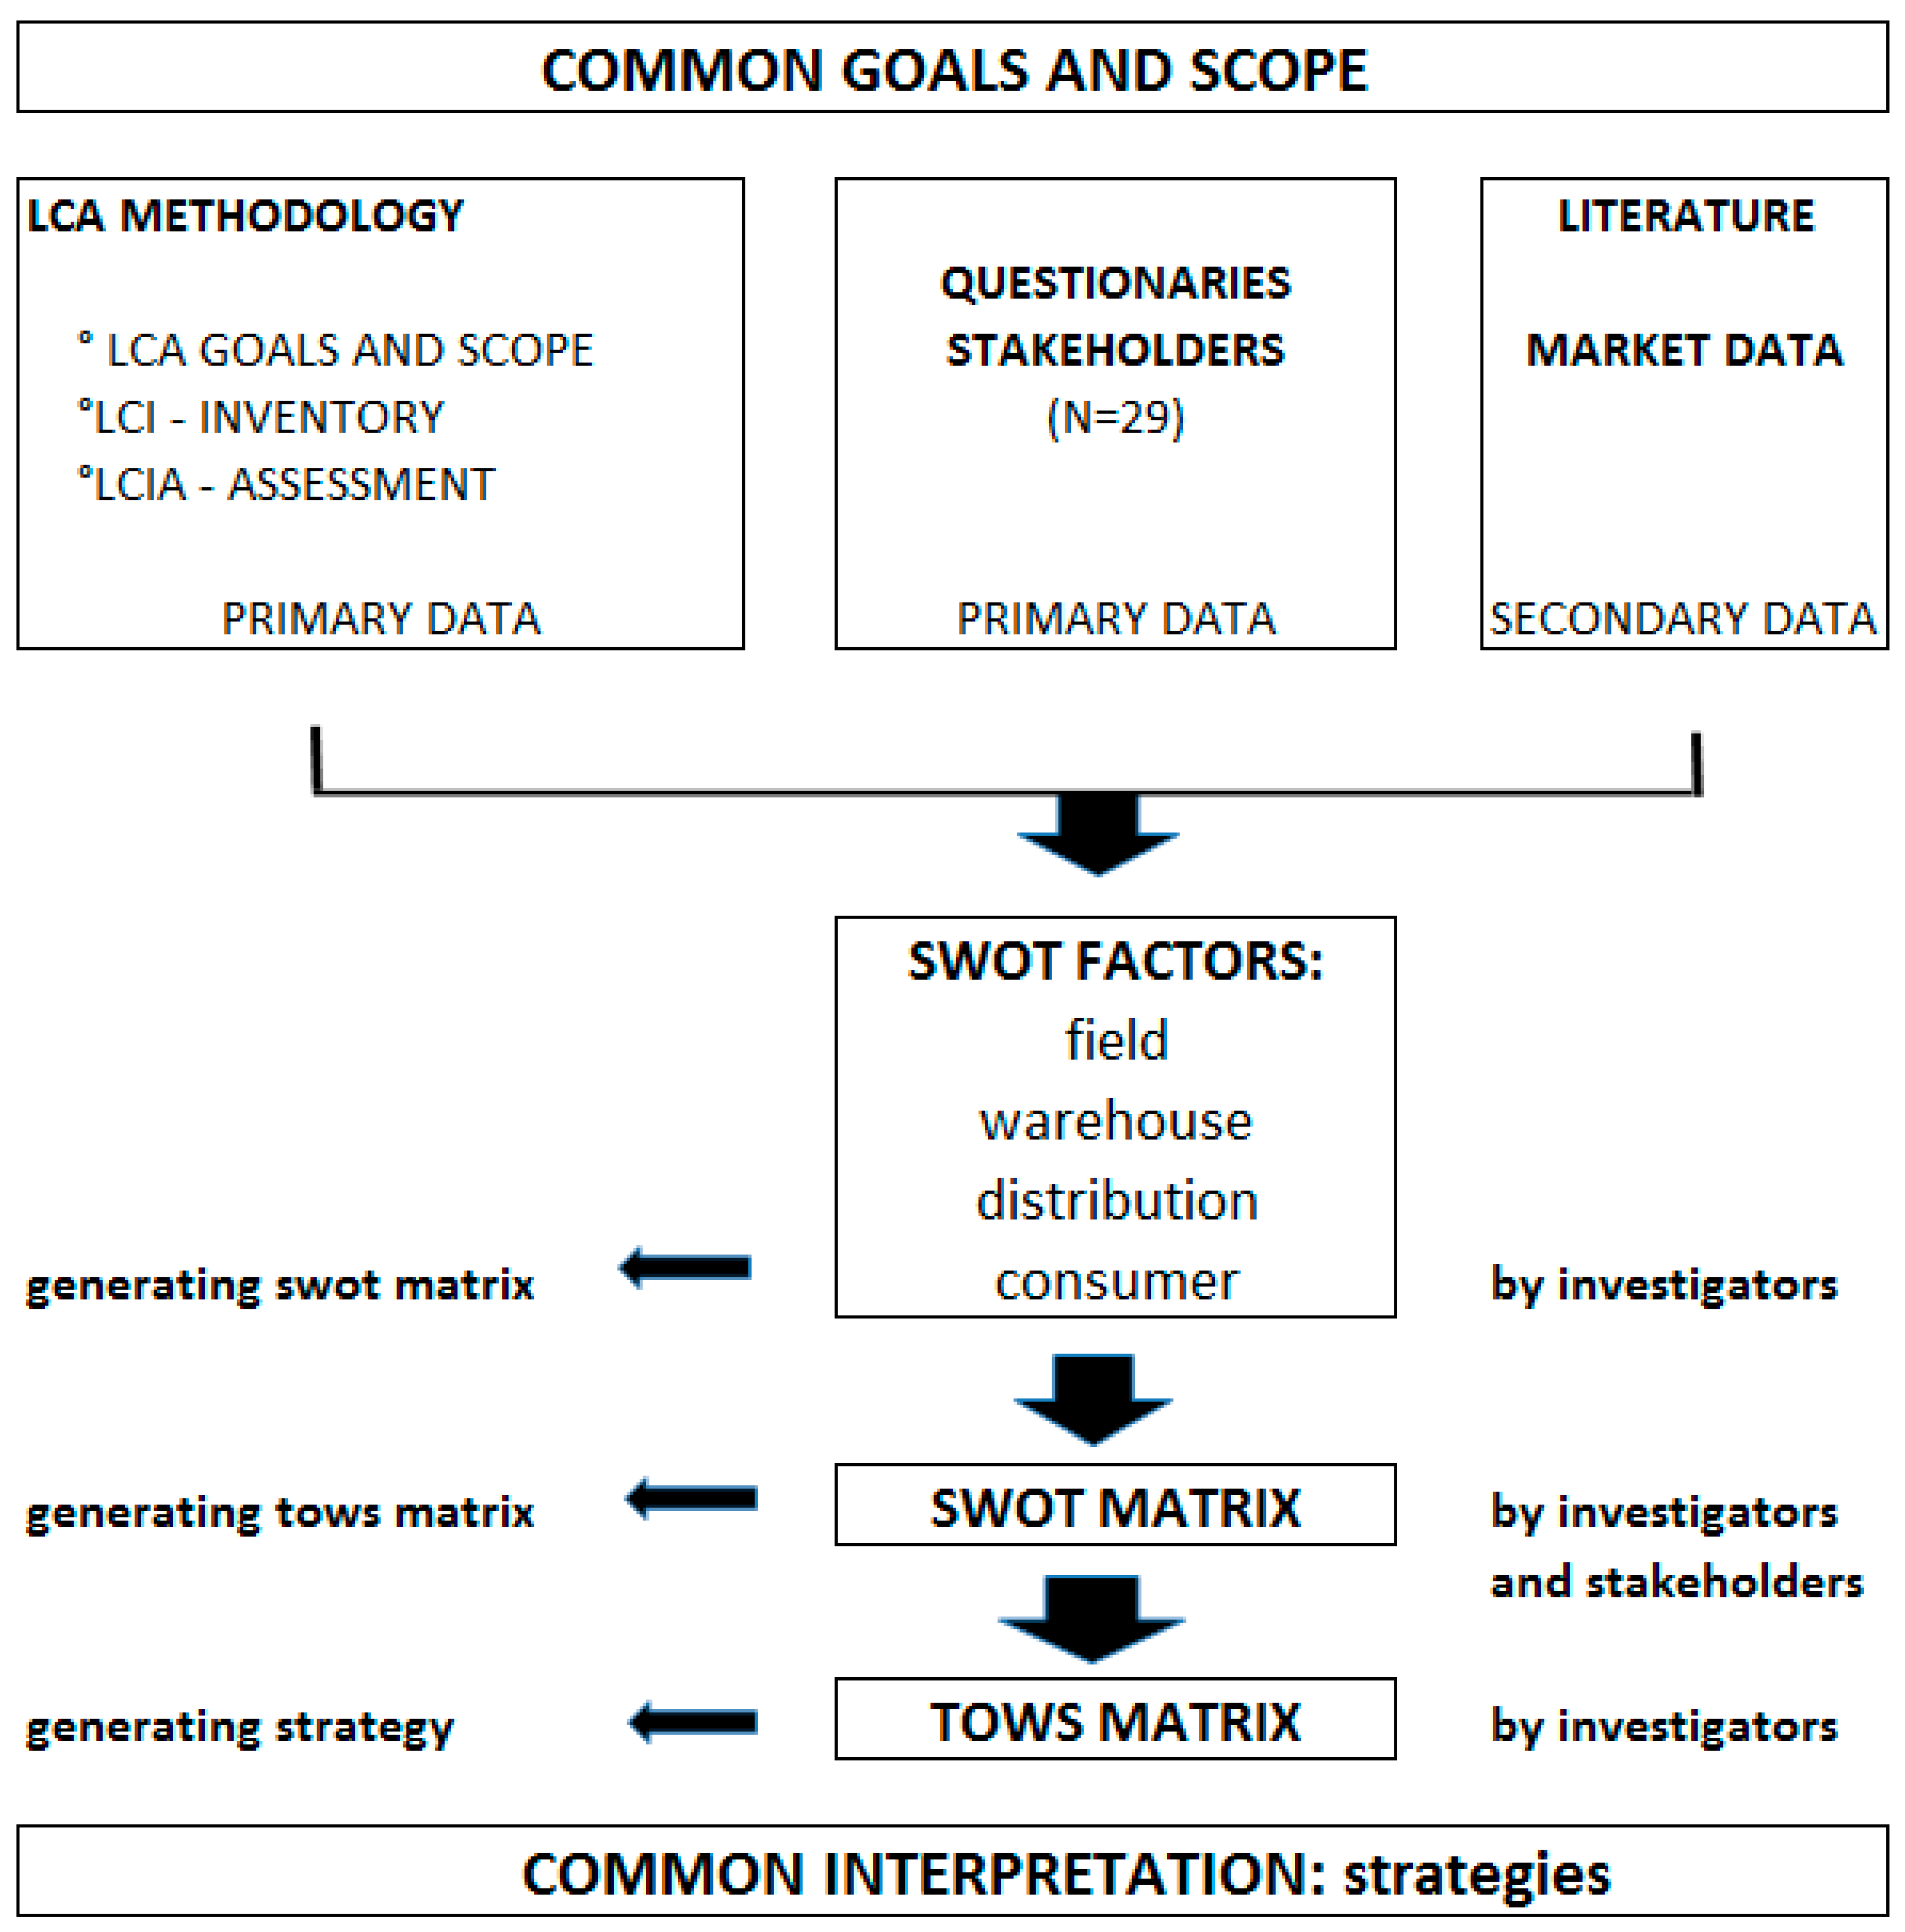
2.5. SWOT and TOWS Analyses

Through recommendations made by international literature [36,37,38,39,40] we decided to use the SWOT analysis as an important base to think strategically about developing the A. arguta production chain in Piedmont. Analogously to Demont and Rutsaert (2017) [41] when elaborating the SWOT matrix, the favourable and unfavourable aspects were established regarding the development of A. arguta in the area, while distinguishing the internal (strengths, weaknesses) and external (opportunities threats) variables. To overcome the objections raised in relation to the use of the SWOT analysis [42] in its simplistic and subjective nature, primary data were collected by authors through field observations and in-depth interviews with key stakeholders. The data include meetings and questionnaires filled in by 10 producers of A. arguta, 10 producers of A. deliciosa, 3 technicians, 3 sales department managers and 3 mass retail buyers. Moreover, following the suggestions of Lozano and Valles (2007) [38], secondary data were collected from related publications and documents issued by the competent institutions (National Institute of Statistics, Fruit Growers Associations, Agriculture Ministry, Regional government of Piemonte). The official statistics on trends in production, market and consumption of kiwifruits, berry fruits and other general fruits in Italy and the world was also included in the analysis [1,16,43]. Lastly, sections in the SWOT matrix have been distinguished by field, warehouse, distribution and consumer, which represent the main steps of the Fresh Fruit Supply Chain [44].
After the creation of the SWOT matrix, the TOWS matrix was developed to provide alternative strategies on the basis of relationships between threats, opportunities, weaknesses and strengths indicated by SWOT [20]. The TOWS analysis can also be applied to the development of tactics necessary to implement strategies and to find more specific actions that support these tactics. The analysis examines threats and opportunities first, followed by weaknesses and strengths. According to Weihrich (1982) [20], TOWS involves four possible types of strategy:
  • WT strategies employ the principle of minimising both threats and drawbacks (Min–Min), reducing threats and overcoming shortcomings;
  • WO strategies use the principle of minimising drawbacks and maximising opportunities (Min–Max), decreasing weaknesses and using opportunities;
  • ST strategies use the principle of maximising strengths and minimising threats (Max–Min), strengthening advantages and averting risks;
  • SO strategies use the principle of maximising both strengths and opportunities (Max–Max), enhancing merits and taking advantage of opportunities.

3. Results and Discussion

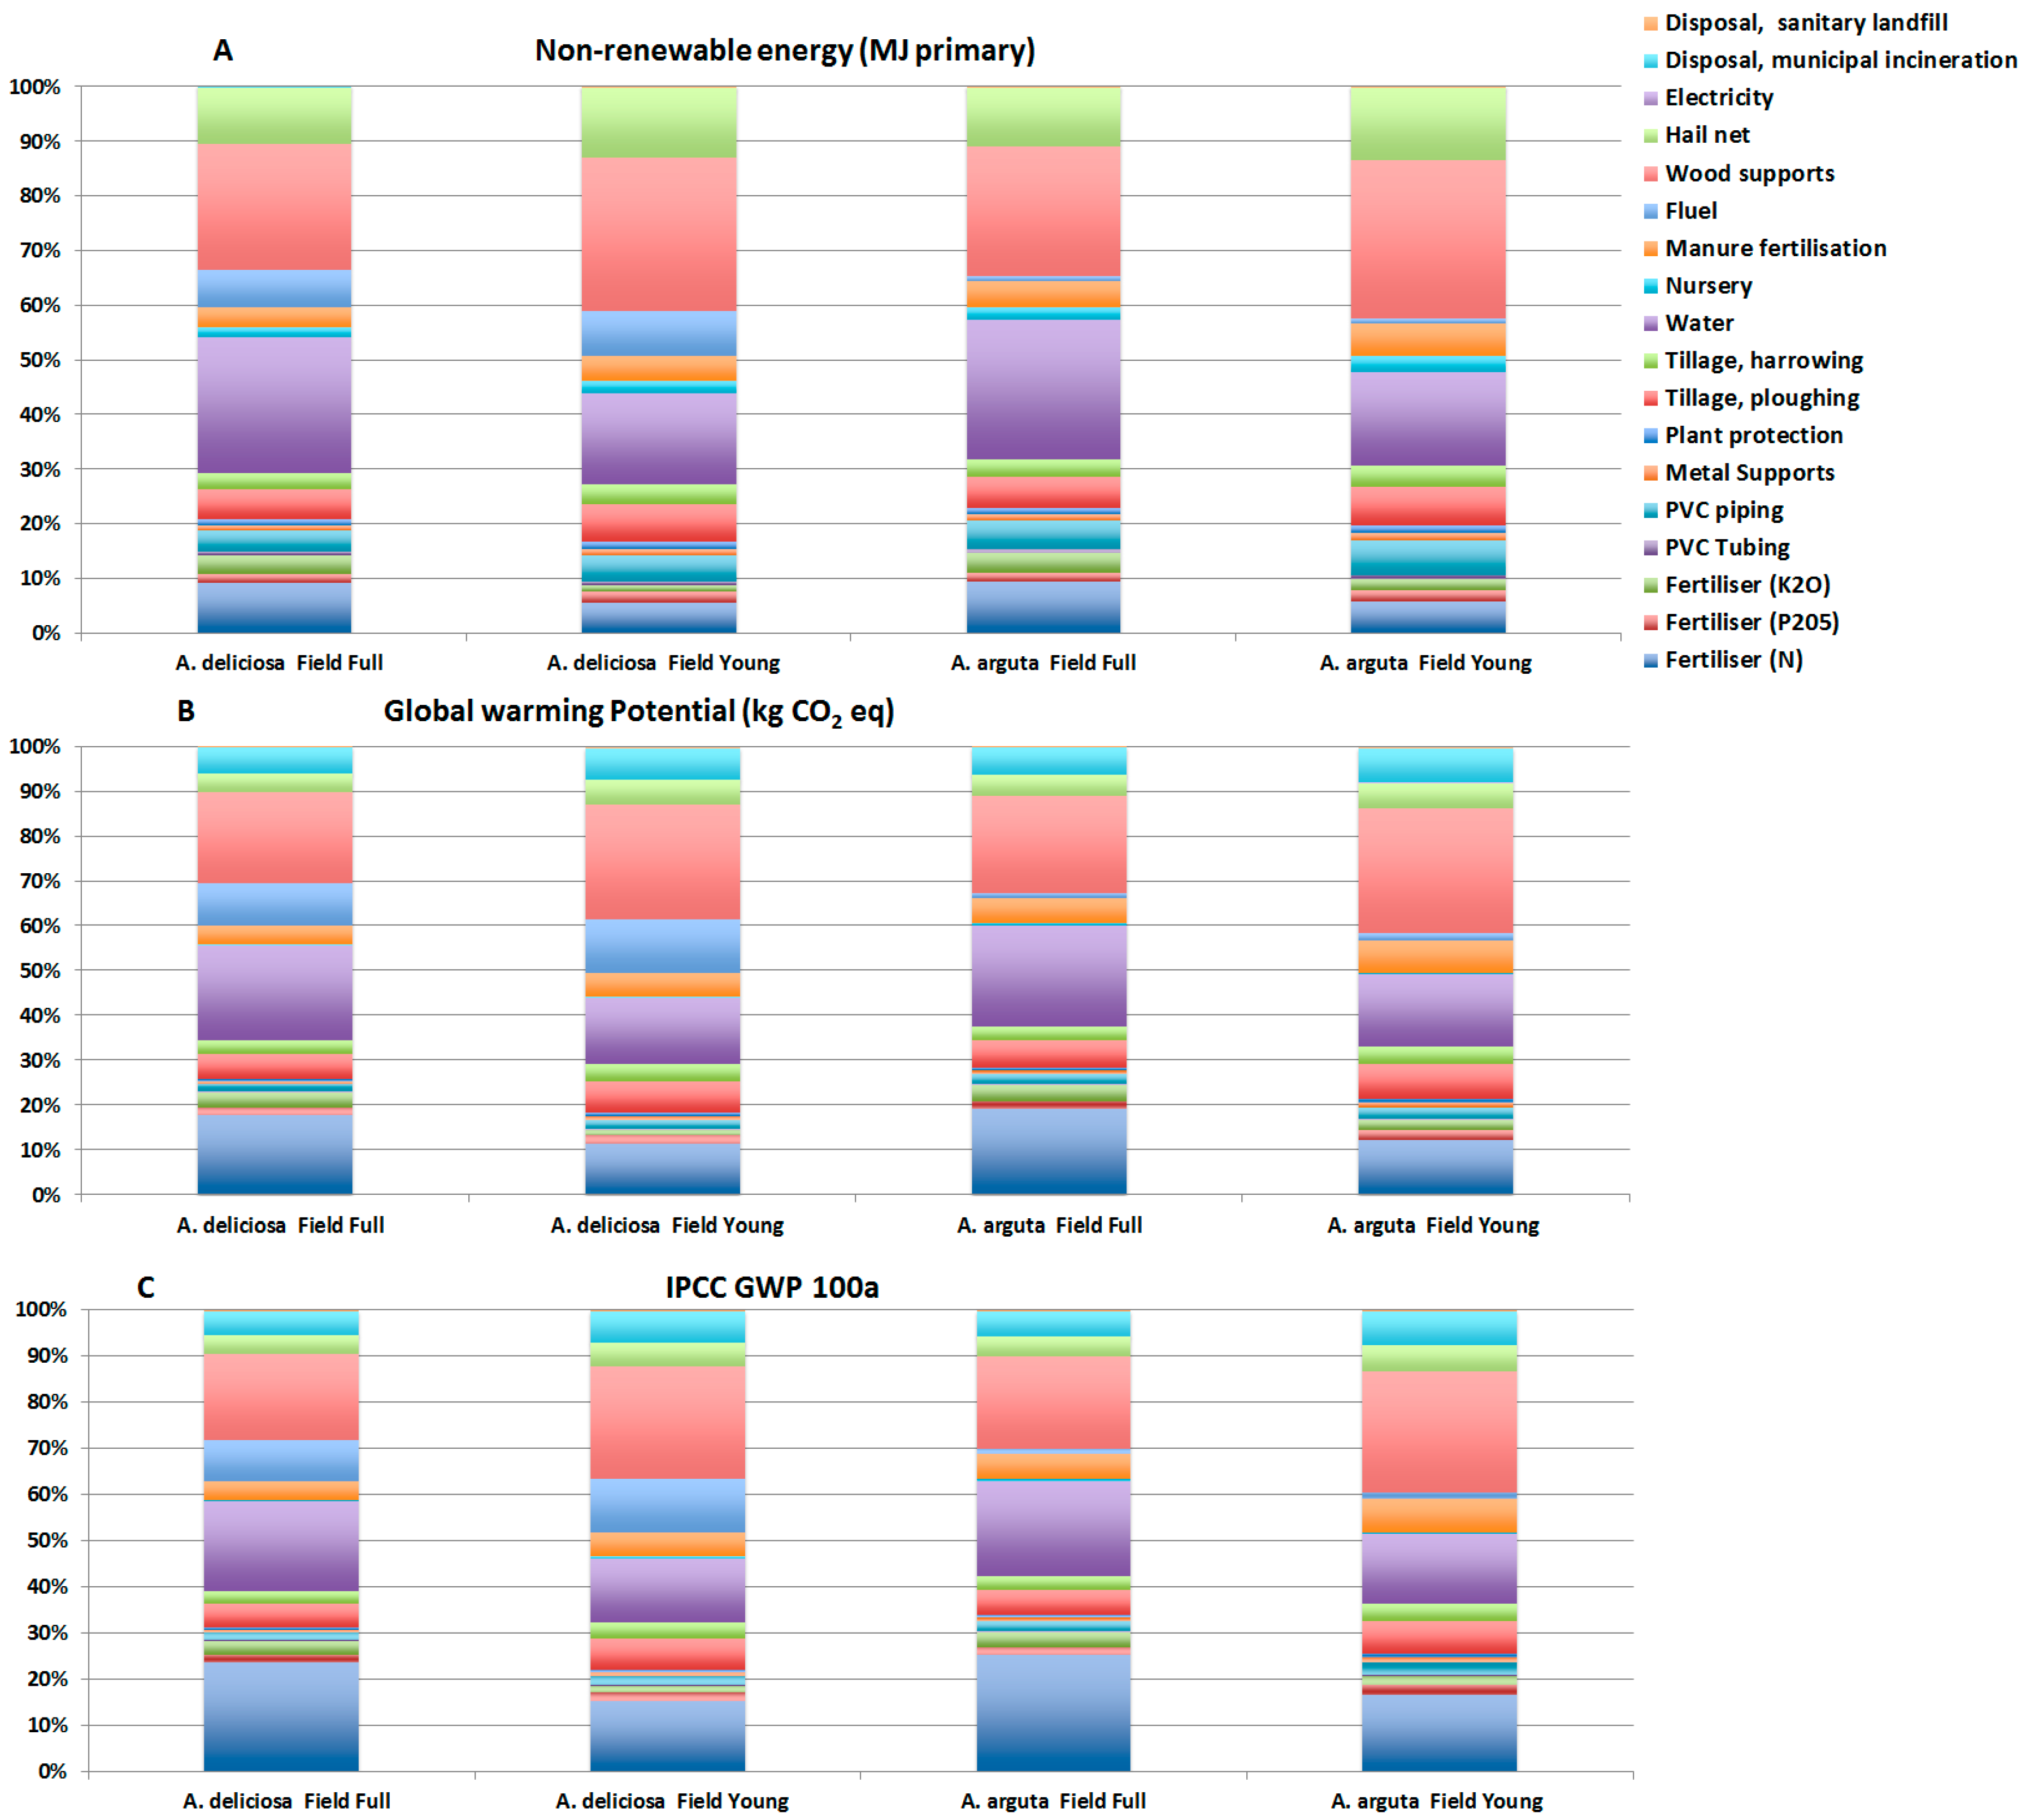
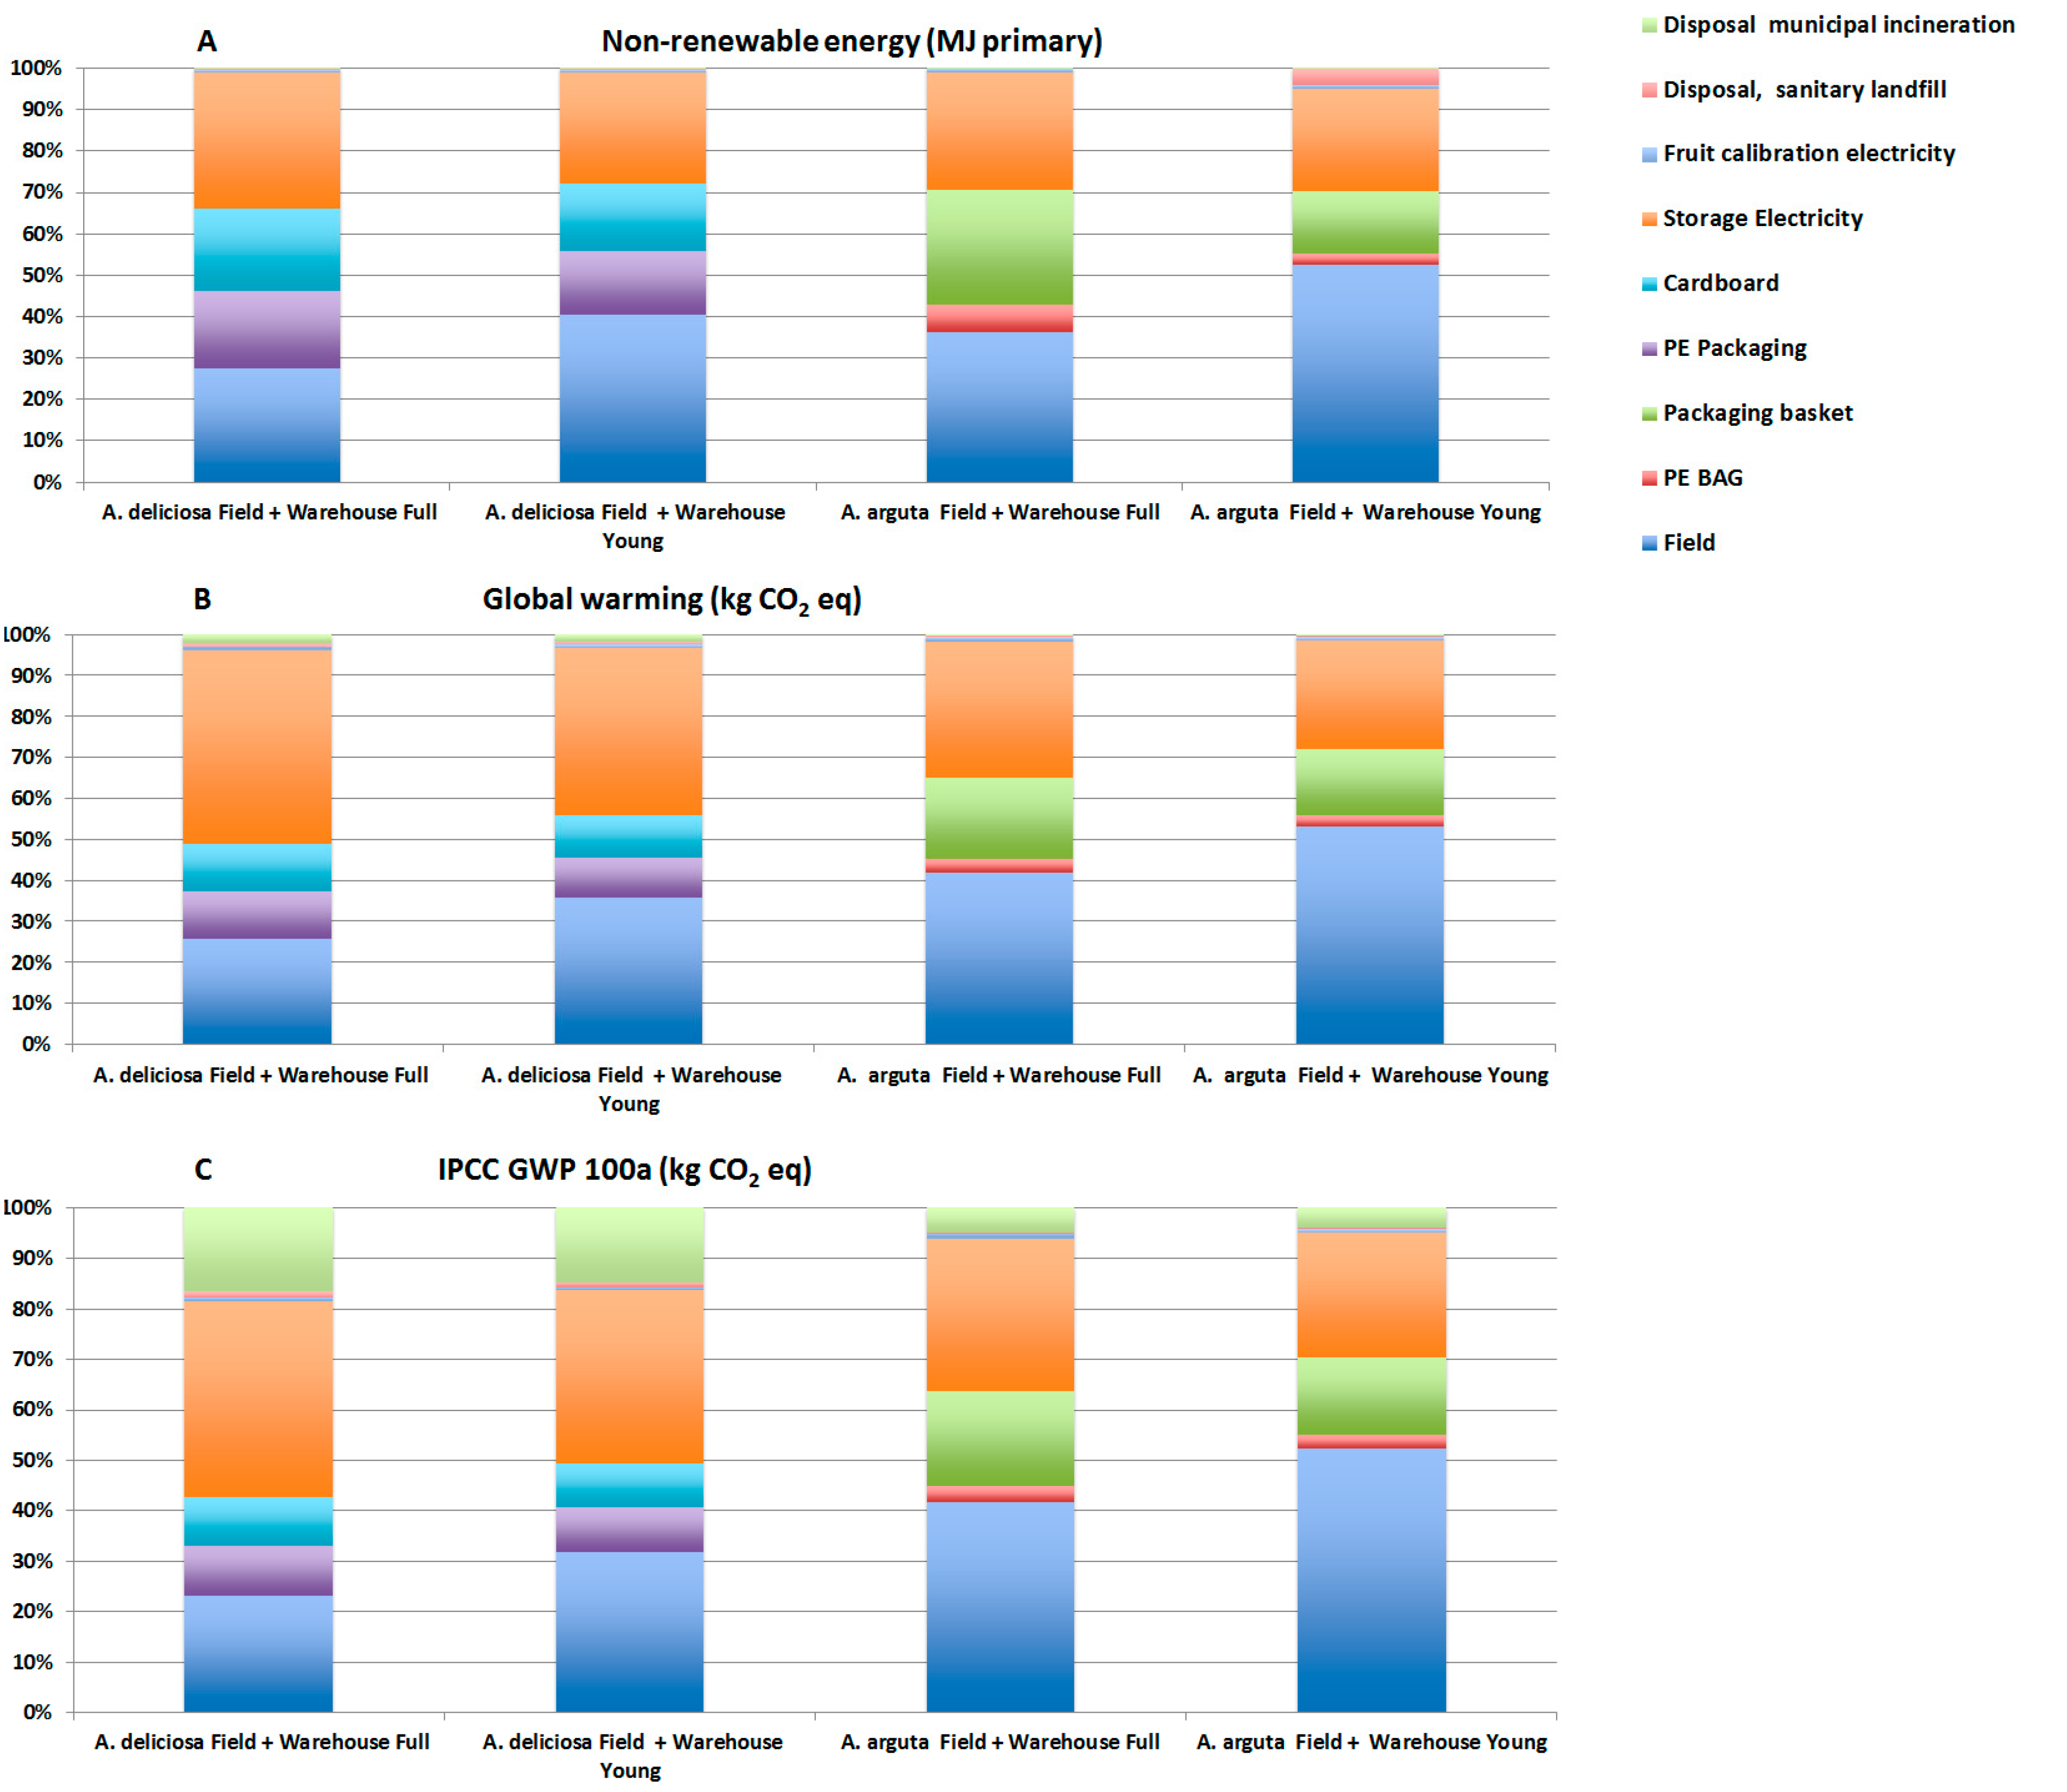
3.1. LCIA Field Production System

Table 2 lists the annual average impacts per kilogram of A. arguta and A. deliciosa within each orchard phase and the impact of the total field production cycle as represented by Goossens et al. (2017) [30]. The full production phase has the highest yield contribution while the young trees have the lowest yield contribution. Based on these yield contributions and on the annual average impact values, it is evident that the two orchard phases have contributed to the orchard cycle impacts in different ways. This affirms that the contribution of the young production phase to the orchard cycle impact is higher than the full production phase. This occurs for both species (A. arguta and A. deliciosa) although it is more evident in the case of A. arguta. The young production phase of A. arguta is 0.21 kg CO2 eq (GWP) and the full phase is 0.13 kg CO2 eq (GWP). With regards to the total orchard cycle, A. arguta presents an impact of 0.14 kg CO2 eq (GWP) and A. deliciosa presents an impact of 0.11 kg CO2 eq (GWP), both lower than that highlighted by Nikkhah et al. (2016) [45] in a case study from the Guilan province of Iran where npk fertilizer levels are higher. The greater impact of A. arguta also in terms of IPCC is due to the higher input for the disease protection of the crop [18]. For NRE, the situation is exactly the opposite because there is a higher impact for the cultivation of green-fleshed kiwifruits (2.86 MeJ). This data item can be traced back to the higher number of agronomical practices and plant treatments that have been carried out in the orchards to mitigate PSA bacterium [18]. It is worth noting that the young phase value is always higher than the full phase, similarly in the case of apples [30].
Figure 4 examines how the various crop inputs influenced the different impacts (A: non-renewable energy, B: global warming potential, C: IPCC GWP 100a). The main input is nitrogen fertilisation (15–20%) for both A. arguta and A. deliciosa, as already highlighted by Muller et al. (2015) [46] in a study performed in New Zealand. Another input from our study that has a consistent impact is water, accounting for about 20–25% for both species and for all impact categories. A study developed in Greece by Michos et al. [47] analyses production coefficient in field in term of energy (MJ ha−1), indicate irrigation as having the one with the greatest impact (47.3%) in organic kiwifruit orchards. From our system in Italy, the most consistent impact comes from the anti-hail system, consisting of numerous wooden supports and an anti-hail net. This situation reflects the outcome of numerous life cycle assessment (LCA) studies in fruit and vegetable species where the greenhouse structure is considered [26,48]. This protection is essential for Actinidia in order to guarantee high-quality production and to protect the plant against stress in case of hailstorms according to Muller et al. (2015) [46] chain (field and warehouse systems).
The results of the impact of the entire production phase (field + warehouse) are recorded in Table 3. Based on all three categories of impact (non-renewable energy, global warming potential (GWP), and IPCC GWC 100a), the A. deliciosa production chain shows higher values than A. arguta, and in line with New Zealand supply chain [49]. Analysing Figure 5 relating to the single inputs, it is interesting to note that in all the production chains and in every orchard cycle (young and full) the field phase covers 20% to 50% of impact of the entire chain. 50% refers to the input field in the case of the A. arguta young phase which, as already pointed out, presents very low yields. 20% refers to the A. deliciosa full phase.
According to studies developed for Zespri® International Ltd. in Tauranga, New Zealand, energy use for pack-house and cooled store activities represents the highest input of about 45% for A. deliciosa [50].
Figure 5 also analyses how both crop inputs influence the various impacts (non-renewable energy, global warming potential, and IPCC GWC 100a). In the case of A. arguta, storage energy is a significant input (35%) but still lower than the field input (40%). Our study did not consider transportation to final markets because the assessment of the impacts is functional to the accomplishment of territorial strategies for the expansion of the A. arguta chain. The impact of packaging is not particularly high (20%) but could be further mitigated by replacing the materials used at present with bio-based materials [50,51]. In this case, packaging could be fundamental for an eco-branding strategy [52].

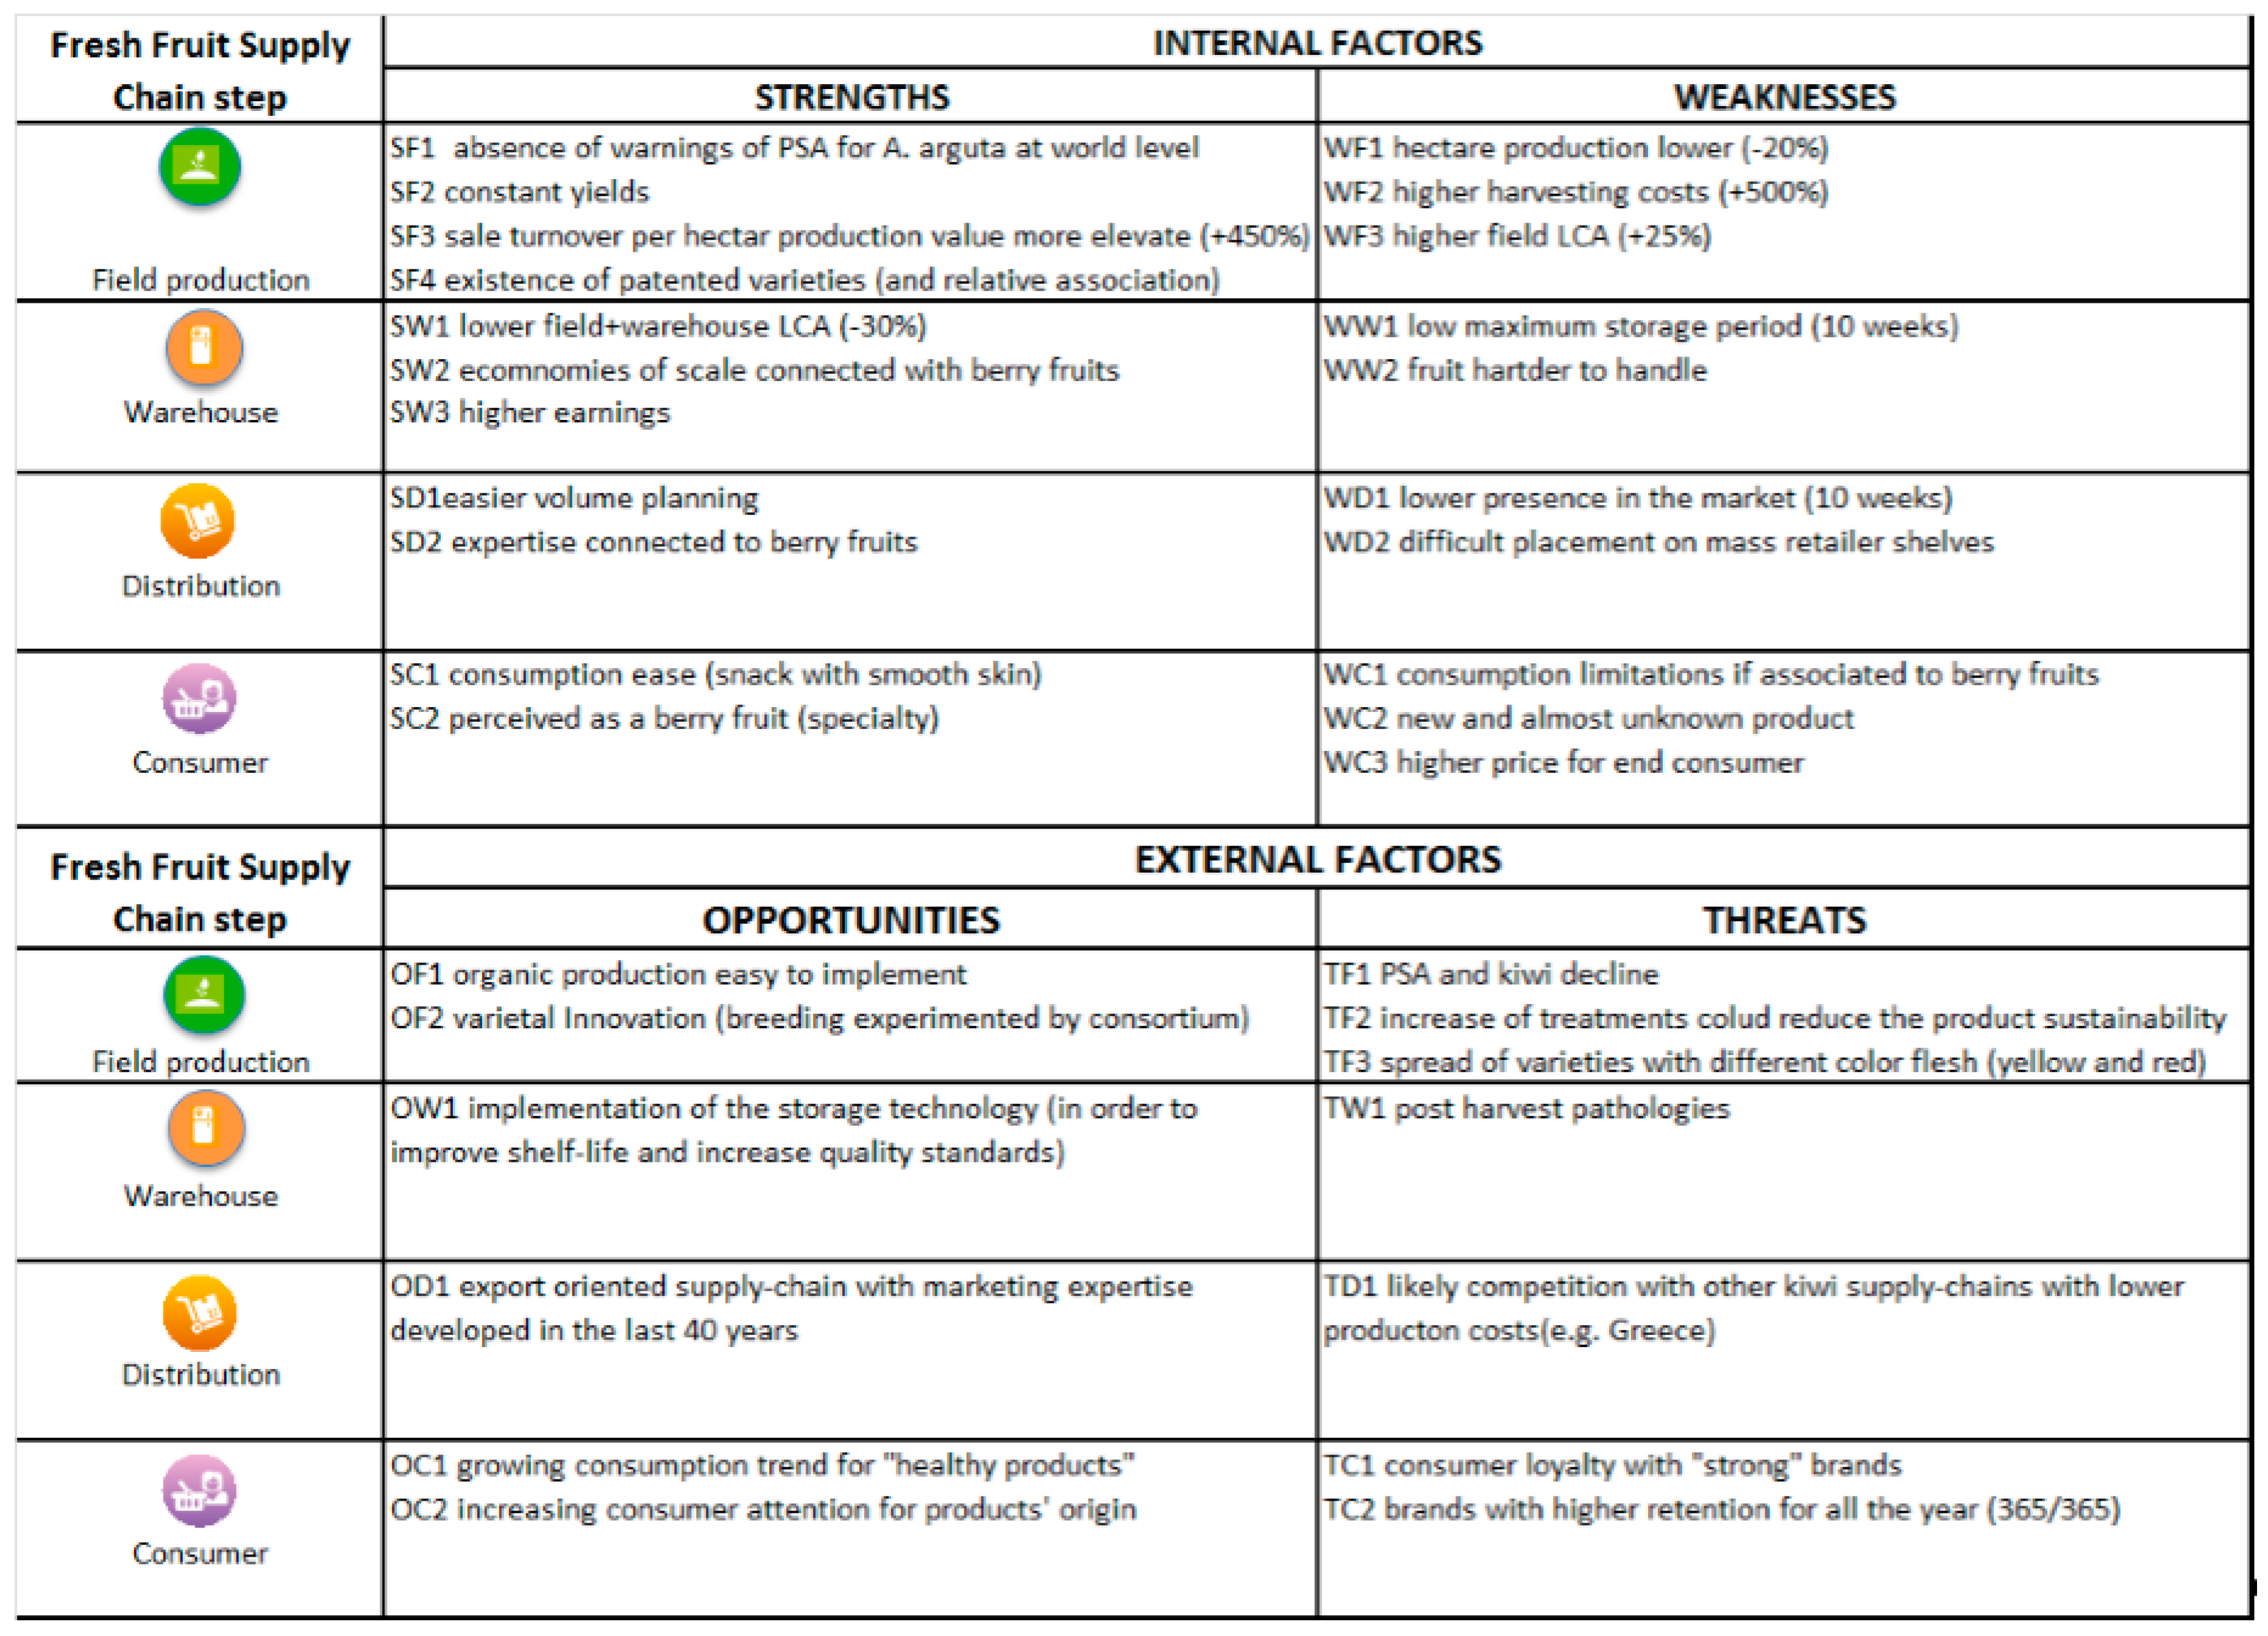
3.2. SWOT and TOWS Analyses

The basic parameters of the following SWOT analysis, which are common for this kind of research, are divided into the two general categories: internal and external [53].
The term strengths (internal factors) comprises of the subsidies and benefits that emerge in the cultivation of cv Thai® (A. arguta) vs. cv Hayward (A. deliciosa) [54]. Similarly, the weaknesses (internal factors) include the factors and elements that represent an obstacle for the development of a production chain of A. arguta in Piedmont.
The opportunities (external factors) represent the benefits and what happens generally in the Piedmontese kiwi production chain (A. chinensis, A. deliciosa, A. arguta). Lastly, the threats (external factors) contain the problems that arise and the potential obstacles to avoid for Piedmontese kiwifruits. This analysis generates a series of interesting issues which simplify the debate on future strategies.
In our case (Figure 6), the findings are analysed with separate consideration of the four Fresh Fruit Supply Chain steps (from farm to fork). The strengths, weaknesses, opportunities and threats are included in the point of the production chain where they have been reported by the stakeholders, and often influence the other steps.

3.2.1. Internal Parameters

Strengths

It is significant to highlight that there have been no reports of PSA bacterium and kiwi decline in A. arguta, unlike in A. deliciosa [4,10,55]. The answers from the stakeholders also show constant yields per hectare with A. arguta compared to consistent fluctuations in the production of A. deliciosa over the past 10 years. The sales turnover per hectare is much higher (+450%) for producers. Additionally, in the case of A. arguta, the cv. ‘Hortgem Tahi®’ analysed in the present study is a patented variety. Its production and sale are part of a European programme managed by the Nergi® Consortium, which protects farmers from the risks of supply market excesses [56,57].
Regarding warehouse storage, A. arguta allows for economies of scale if processing and conditioning take place using the technical equipment already used for other fruits in other seasons, such as berry fruits [58]. Moreover, the environmental impact is calculated using the life cycle assessment (LCA) method; the values in the overall production chain of A. arguta are lower than for A. deliciosa (-30% GWP) with reference to the energy consumption during storage. Stakeholders have also reported higher earnings due to easier placement within the European fruit market. A major strength of the A. arguta species for both warehouse and distribution is the possibility to provide quantities to market throughout the year. Additionally, the A. arguta supply chain has the possibility to exploit the expertise already developed by berry fruit producers. Certainly one of A. argutas main characteristic strengths is its ready-to-eat quality (small, smooth, ripe), which is considerably different from A. deliciosa [2,54]. Stakeholders have also emphasised that A. arguta belongs rightfully to the category of specialties, like berry fruits [36], giving it prioritised placement in the point of sale.

Weaknesses

In the first stage (field), A. arguta retains lower unitary production volumes than A. deliciosa (−20%). Harvesting costs (labour + accessory costs) are much higher (+500%). The calculation of the A. arguta environmental impact with the LCA method are about 25% higher for GWP compared to A. deliciosa. In the second stage (warehouse), the limits highlighted by the stakeholders interviewed are twofold: short storage time and high predisposition to mechanical damage, which can make it harder to handle. For distribution operators, the limitations of A. arguta are mainly represented by a short sale period (2.5 months) and the difficulty in identifying the correct placement on the shelf [59]. At the third stage (consumption), challenges are represented by the lack of knowledge about the product. For example, customers tend to confuse A. arguta with other similar looking products such as olives. Furthermore, as with most specialty products, A. arguta could be considered unsuitable for everyday purchase due to its high price [60,61].

3.2.2. External Parameters

Opportunities

The characteristics of the kiwifruit production chain in Piedmont provide an easy opportunity for implementation of sustainable fruit farming models, namely organic production [62,63].
There are additional opportunities in the years to come based on outcomes of national and international breeding programmes that could lead to the cultivation of cultivar with different levels of sensitivity to PSA and kiwi decline [4]. As the level of technological innovation continues to improve, new post-harvesting technologies will be able to achieve improved storage times and overall quality of the fruits [64]. During the distribution stage, the expertise developed over the years by Piedmontese distributors represents a positive aspect for further increase of exports in new markets like Russia, Brazil and India [23].
In the final step of the Fresh Fruit Supply Chain, the constant development and advocacy for “healthy products” represents a growth opportunity for the whole Piedmontese kiwifruit sector, as well as a greater attention payed by consumers to the origin of bought products.

Threats

Despite reporting a reduction in PSA bacterium outbreaks, the problem relating to this pathology and the kiwi decline is far from being solved by the replacement of Actinidia with other fruit species. Compared to the non-PSA growing seasons of the Actinidia variety in Italy, there has been a need in field management, to increase the use of pesticides to cope with increasingly critical situations with the consequent reduction of the system’s environmental and economic sustainability [46].
The arrival of new selections and cultivars on the market with different coloured flesh (yellow and red), as well as different soil and climatic requirements (new production areas), could lead to an increase in competition. Although technological innovation in recent years has limited post-harvest alterations during long-term storage, Botrytis and Phyalophora spp. still represent a threat and a real possibility to increase waste.
During the distribution stage, stakeholders in Piedmont have expressed concern that Piedmontese production can suffer due to competition of kiwifruits with lower production cost (e.g., Greek products). Lastly, the biggest challenge comes from consumers who often become loyal to international brands such as Chiquita® and Zespri® since Piedmontese products displayed in points of sale are often unrecognisable [65]. The presence of these international brands at point-of-sale shelves every day of the year limits opportunities for market growth of Piedmontese brands.
Results from the SWOT analysis can be used to develop the A. arguta system in Piedmontese strategies using the TOWS matrix (Table 4). Deciding on a strategy is important, especially when it comes to the marketing of products [66]. The TOWS matrix allows producers to use their strengths to take advantage of opportunities and avoid any potential threats [67]. They can use the opportunities to overcome weaknesses and develop a defence strategy to help minimize weaknesses and avoid threats. As described earlier in more detail, the strategies can be divided into 4 groups i.e., SO, ST, WO and WT (Table 4).
Regarding the SO strategy identified by investigators in Table 4, large-scale development of A. arguta is made possible by the absence of PSA and by the practicality of consumption of the fruit (ready to eat). It is also possible to exploit the positive trend of consumption linked to health and environmental aspects. This strategy also makes it possible to exploit economies of scale.
The ST strategy aims to characterise the fruit of A. arguta associating with berry fruit references (i.e., baby kiwi). The similarity with this category of product is also linked to the practicality of consumption through the small size of the fruits, as well as their aromatic qualities and taste.
The WO strategy envisages the development of an export oriented chain focusing on countries with consumers who are environmentally conscious and who are willing to pay higher prices for organically produced products.
Lastly, the WT strategy is linked to a differentiation guided by the placement on a niche market of the Nergi® brand, with consequent considerable investments in marketing.

4. Conclusions

This study contributes to a more systematic understanding of the factors, that are important drivers and constraints in the advancement of A. arguta and its possible acceptance as a new fruit system in the Piedmont region. Our analysis serves as a vehicle to solicit the opinions of those involved with the kiwifruit industry in Piedmont as a means to identify, clarify and offer potential solutions to current enviro-socio-economic issues. Furthermore, our analysis aims to foster a more comprehensive dialogue about the options available in terms of future species and varieties among local stakeholders. The life cycle assessment (LCA) helped us to conclude that the potential replacement of A. deliciosa with A. arguta would not change the current environmental impact of the cultivation of kiwifruits in the area. From an economic point of view, this crop, despite being labour intensive, is considered by the stakeholders involved as a good possibility due to its high and stable earnings. It should be noted that there are converging opinions among those interviewed in the different groups of interest (growers, technicians, distributors, mass retail buyers). This, in turn, demonstrates the ability for kiwifruit industry stakeholders in Piedmont to work harmoniously and foreshadows a successful management programme for A. arguta.
Based on synthesis of results from our TOWS analysis, we recommend the following development strategies to help to shape the future A. arguta supply chain in Piedmont:
  • Large-scale oriented;
  • Berry fruits oriented;
  • Export and organic oriented;
  • Niche oriented.
Given the current crisis of the kiwifruit industry in Italy, we believe that we have provided useful next steps in the strategic planning by identifying current and potential future issues, with perspectives and options offered by the supply chain stakeholders. The methods used in the study described here are subject to limitations. Nonetheless, we believe that the chosen methods are suitable for identifying the relevant propensities with respect to the substitution of A. deliciosa with A. arguta in the Piedmont region. We emphasise that the results of this study may not be applied to other regions as most of the relevant circumstances (e.g., climatic conditions, socio-economic environment, and entrepreneurial skill) significantly differ from the area in which our analysis is focused. It will be necessary in the short term to carry out a detailed economic assessment, which can lead to the definition of a cost-benefit analysis of the replacement. Lastly, this assessment can help investigate matters with a more technical-agronomical perspective, or confirmation of the possible resistance of A. arguta to PSA bacterium.

Acknowledgments

We would like to thank all of the producers, professionals, operators, colleagues and collaborators who actively participated in the research project. The authors are also grateful to native English speaker Winston Gilcrease–(UNESCO Chair, University of Turin) for his assistance in editing the final version of this paper.

Author Contributions

Cristiana Peano and Claudio Baudino designed the research. Cristiana Peano, Claudio Baudino and Stefano Massaglia interpreted results and wrote the paper. Rossella Briano, Nicole Giuggioli and Claudio Baudino collected data, collaborated in the literature review, performed research and checked results, analysed the data and participated jointly in the discussion. All authors have read and approved the final manuscript.

Conflicts of Interest

The authors declare no conflict of interest.

Founding Source

Research developed into the program ALTA FORMAZIONE IN APPRENDISTATO 2011-2013. Regione Piemonte (Art. 50—D. Lgs. N. 276/2003 s.m.i.).

References

  1. FAOSTAT. 2016. Available online: www.fao.org (accessed on 28 July 2017).
  2. Ferguson, A.R. Kiwifruit: The wild and the cultivated plants. Adv. Food Nutr. Res. 2013, 68, 15–32. [Google Scholar] [PubMed]
  3. Lindhorst, A.; Steinhaus, M. Aroma-active compounds in the fruit of the hardy kiwi (Actinidia arguta) cultivars Ananasnaya, Bojnice, and Dumbarton Oaks: Differences to common kiwifruit (Actinidia deliciosa ‘Hayward’). Eur. Food Res. Technol. 2016, 242, 967–975. [Google Scholar] [CrossRef]
  4. Datson, P.; Nardozza, S.; Manako, K.; Herrick, J.; Martinez-Sanchez, M.; Curtis, C.; Montefiori, M. Monitoring the actinidia germplasm for resistance to Pseudomonas syringae pv. Actinidiae. Acta Hortic. 2015, 1095, 181–184. [Google Scholar] [CrossRef]
  5. Takikawa, Y.; Serizawa, S.; Ichikawa, T.; Tsuyumu, S.; Goto, M. Pseudomonas syringae pv. actinidiae pv. nov. Jpn. J. Phytopathol. 1989, 55, 437–444. [Google Scholar] [CrossRef]
  6. Koh, Y.J.; Chung, H.J.; Cha, B.J.; Lee, D.H. Outbreak and spread of bacterial canker in kiwifruit. Korean J. Plant Pathol. 1994, 10, 68–72. [Google Scholar]
  7. Balestra, G.M.; Mazzaglia, A.; Quattrucci, A.; Renzi, M.; Rossetti, A. Current status of bacterial canker spread on kiwifruit in Italy. Aust. Plant Dis. 2009, 4, 34–36. [Google Scholar]
  8. Froud, K.J.; Everett, K.R.; Tyson, J.L.; Beresford, R.M.; Cogger, N. Review of the risk factors associated with kiwifruit bacterial canker caused by Pseudomonas syringae pv. Actinidiae. N. Z. Plant Prot. 2015, 68, 313–327. [Google Scholar]
  9. Ferrante, P.; Scortichini, M. Identification of Pseudomonas syringae pv. actinidiae as causal agent of bacterial canker of yellow kiwifruit (Actinidia chinensis Planchon) in central Italy. J. Phytopathol. 2009, 157, 768–770. [Google Scholar]
  10. Nardozza, S.; Martinez-Sanchez, M.; Curtis, C.; Datson, P.M.; Montefiori, M. Screening Actinidia germplasm for different levels of tolerance, or resistance, to Psa (Pseudomonas syringae pv. actinidiae). Acta Hortic. 2014, 1096, 351–355. [Google Scholar] [CrossRef]
  11. Serizawa, S.; Ichikawa, T. Epidemiology of bacterial canker of kiwifruit. Jpn. J. Phytopathol. 1993, 59, 460–468. [Google Scholar] [CrossRef]
  12. Vanneste, J.; Poliakoff, F.; Audusseau, C.; Cornish, D.; Paillard, S.; Rivoal, C.; Yu, J. First report of Pseudomonas syringae pv. actinidiae the causal agent of bacterial canker of kiwifruit on Actinidia deliciosa in France. Plant Dis. 2011, 95, 1311. [Google Scholar]
  13. CSO. 2016. Available online: www.csoservizi.com (accessed on 30 July 2017).
  14. Ministry of Agriculture. Ministerial Decree of 15 March 2014, No 62, Misure per Impedire L’introduzione e la Diffusione di Pseudomonas syringae pv. Actinidiae Takikawa. Serizawa. Ichikawa. Tsuyumu & Goto nel Territorio della Repubblica Italiana; Ministrry of Agricuture: Roma, Italy, 2014.
  15. Monchiero, M.; Gullino, M.L.; Pugliese, M.; Spadaro, D.; Garibaldi, A. Efficacy of different chemical and biological products in the control of Pseudomonas syringae pv. actinidiae on kiwifruit. Australas. Plant Pathol. 2015, 44, 13–23. [Google Scholar] [CrossRef]
  16. Collina, M.; Donati, I.; Bertacchini, E.; Brunelli, A.; Spinelli, F. Greenhouse assays on the control of the bacterial canker of kiwifruit (Pseudomonas syringae pv. actinidiae). J. Berry Res. 2016, 6, 407–415. [Google Scholar] [CrossRef]
  17. Scortichini, M. Field efficacy of a zinc-copper-hydracid of citric acid biocomplex compound to reduce ozing from winter cankers caused by Pseudomonas syringae pv. actinidiae to Actinidia spp. J. Plant Pathol. 2016, 98, 651–655. [Google Scholar]
  18. Black, M.Z.; Casonato, S.; Bent, S. Opportunities for environmental modification to control Pseudomonas syringae pv. actinidiae in kiwifruit. Acta Hortic. 2015, 1105, 353–360. [Google Scholar] [CrossRef]
  19. Vanneste, J.L.; Cornish, D.A.; Yu, J.; Stokes, C.A. First report of Pseudomonas syringae pv. actinidiae the causal agent of bascterial canker of kiwifruit on Actinidia arguta vines in New Zealand. Plant Pathol. 2017, 66, 140–149. [Google Scholar]
  20. Weihrich, H. The TOWS matrix—A tool for situational analysis. Long Range Plan. 1982, 15, 54–66. [Google Scholar] [CrossRef]
  21. Ghazinoory, S.; Abdi, M.; Azadegan- Mehr, M. SWOT methodology: A state-of-the-art review for past, a framework for future. J. Bus. Econ. Manag. 2011, 12, 24–48. [Google Scholar] [CrossRef]
  22. Aslan, I.; Bozkurt, R. Strategic Sustainable Development and Creating Strategies from TOWS Matrix at Kipas Group. In Proceedings of the 2nd International Symposium on Sustainable Development, Sarajevo, Bosnia and Herzegovina, Sarajevo, Bosnia-Herzegovina, 8–9 June 2010; pp. 120–128. [Google Scholar]
  23. Regione Piemonte. 2016. Available online: www.regione.piemonte.it (accessed on 21 July 2017).
  24. ARPA. 2016. Available online: www.arpal.gov.it (accessed on 25 July 2017).
  25. De Luca, A.I.; Iofrida, N.; Leskinen, P.; Stillitano, T.; Falcone, G.; Strano, A.; Gulisano, G. Life cycle tools combined with multi-criteria and participatory methods for agricultural sustainability: Insights from a systematic and critical review. Sci. Total Environ. 2017, 595, 352–370. [Google Scholar] [CrossRef] [PubMed]
  26. Girgenti, V.; Peano, C.; Bounous, M.; Baudino, C. A life cycle assessment of non-renewable energy use and greenhouse gas emissions associated with blueberry and raspberry production in northern Italy. Sci. Total Environ. 2013, 458, 414–418. [Google Scholar] [CrossRef] [PubMed]
  27. Cecchini, L.; Torquati, B.; Paffarini, C.; Barbanera, M.; Foschini, D.; Chiorri, M. The Milk Supply Chain in Italy’s Umbria Region: Environmental and Economic Sustainability. Sustainability 2016, 8, 728. [Google Scholar] [CrossRef]
  28. Falcone, G.; De Luca, A.I.; Stillitano, T.; Strano, A.; Romeo, G.; Gulisano, G. Assessment of Environmental and Economic Impacts of Vine-Growing Combining Life Cycle Assessment, Life Cycle Costing and Multicriterial Analysis. Sustainability 2016, 8, 793. [Google Scholar] [CrossRef]
  29. Cerutti, A.K.; Beccaro, G.L.; Bruun, S.; Bosco, S.; Donno, D.; Notarnicola, B.; Bounous, G. Life cycle assessment application in the fruit sector: State of the art and recommendations for environmental declarations of fruit products. J. Clean. Prod. 2014, 73, 125–135. [Google Scholar] [CrossRef]
  30. Goossens, Y.; Geeraerd, A.; Keulemans, W.; Annaert, B.; Mathijs, E.; De Tavernier, J. Life cycle assessment (LCA) for apple orchard production systems including low and high productive years in conventional, integrated and organic farms. Agric. Syst. 2017, 153, 81–93. [Google Scholar] [CrossRef]
  31. I Canals, L.M.; Romanya, J.; Cowell, S.J. Method for assessing impacts on life support functions (LSF) related to the use of ‘fertile land’in life cycle assessment (LCA). J. Clean. Prod. 2007, 15, 1426–1440. [Google Scholar] [CrossRef]
  32. Sessa, F.; Marino, M.; Montanaro, G.; Dal Piaz, A.; Zanotelli, D.; Mazzetto, F.; Tagliavini, M. Life Cycle Assessment of apples at a country level: The case study of Italy. In Proceedings of the 9th International Conference on Life Cycle Assessment in the Agri-Food Sector (LCA Food 2014), San Francisco, CA, USA, 8–10 October 2014; Schenck, R., Huizenga, D., Eds.; ACLCA: Vashon, WA, USA, 2014; pp. 1244–1248. [Google Scholar]
  33. PRé Consultants Database Manual Ecoinvent Overview. The Netherlands. 2007. Available online: http://www.pre-sustainability.com/content/databases#SimaProdatabases (accessed on 28 July 2017).
  34. ISO. Environmental Management–Life Cycle Assessment–Principles and Framework; International Organization for Standardization (ISO): Geneva, Switzerland, 2006. [Google Scholar]
  35. Database Ecoinvent 3.3. The Netherlands. Available online: http://www.ecoinvent.org (accessed on 28 July 2017).
  36. Bernroider, E. Factors in SWOT analysis applied to micro, small-to-medium and large software enterprises: An Austrian Study. Eur. Manag. J. 2002, 20, 562–573. [Google Scholar] [CrossRef]
  37. Doratli, N.; Hoskara, S.O.; Fasli, M. An analytical methodology for revitalization strategies in historic urban quarters: A case study of the Walled City of Nicosia, North Cyprus. Cities 2004, 21, 329–348. [Google Scholar] [CrossRef]
  38. Lozano, M.; Vallés, J. An analysis of the implementation of an environmental management system in a local public administration. J. Environ. Manag. 2007, 82, 495–511. [Google Scholar] [CrossRef] [PubMed]
  39. Jackson, S.E.; Joshi, A.; Erhardt, N.L. Recent research on team and organizational diversity: SWOT analysis and implications. J. Manag. 2003, 29, 801–830. [Google Scholar]
  40. Srivastava, P.K.; Kulshreshtha, K.; Mohanty, C.S.; Pushpangadan, P.; Singh, A. Stakeolder-based SWOT analysis for successful municipal solid waste management in Lucknow, India. Waste Manag. 2005, 25, 531–537. [Google Scholar] [CrossRef] [PubMed]
  41. Demont, M.; Rutsaert, P. Restructuring the Vietnamese Rice Sector: Towards Increasing Sustainability. Sustainability 2017, 9, 325. [Google Scholar] [CrossRef]
  42. Panagiotou, G.; Van Wijnen, R. The “telescopic observations” framework: An attainable strategic tool. Mark. Intell. Plan. 2005, 23, 155–171. [Google Scholar] [CrossRef]
  43. ISTAT. 2016. Available online: www.istat.it (accessed on 29 July 2017).
  44. Peano, C.; Girgenti, V.; Baudino, C.; Giuggioli, N.R. Blueberry Supply Chain in Italy: Management, Innovation and Sustainability. Sustainability 2017, 9, 261. [Google Scholar] [CrossRef]
  45. Nikkhah, A.; Emadi, B.; Soltanali, H.; Firouzi, S.; Rosentrater, K.A.; Allahyari, M.S. Integration of life cycle assessment and Cobb-Douglas modeling for the environmental assessment of kiwifruit in Iran. J. Clean. Prod. 2016, 137, 843–849. [Google Scholar] [CrossRef]
  46. Müller, K.; Holmes, A.; Deurer, M.; Clothier, B.E. Eco-efficiency as a sustainability measure for kiwifruit production in New Zealand. J. Clean. Prod. 2015, 106, 333–342. [Google Scholar] [CrossRef]
  47. Michos, M.C.; Menexes, G.C.; Kalburtji, K.L.; Tsatsarelis, C.A.; Anagnostopoulos, C.D.; Mamolos, A.P. Could energy flow in agro-ecosystems be used as a “tool” for crop and farming system replacement? Ecol. Indic. 2017, 73, 247–253. [Google Scholar] [CrossRef]
  48. Perrin, A.; Basset-Mens, C.; Gabrielle, B. Life cycle assessment of vegetable products: A review focusing on cropping systems diversity and the estimation of field emissions. Int. J. Life Cycle Assess. 2014, 19, 1247–1263. [Google Scholar] [CrossRef]
  49. Mithraratne, N.; McLaren, S.; Barber, A. Carbon Footprinting for the Kiwifruit Supply Chain—Report on Methodology and Scoping Study; Landcare Research Contract Report LC0708/156; New Zealand Ministry of Agriculture and Forestry: Wellington, New Zealand, 2008; Volume 61.
  50. Robertson, K.; Garnham, M.; Symes, W. Life cycle carbon footprint of the packaging and transport of New Zealand kiwifruit. Int. J. Life Cycle Assess. 2014, 19, 1693–1704. [Google Scholar] [CrossRef]
  51. Tecco, N.; Baudino, C.; Girgenti, V.; Peano, C. Innovation strategies in a fruit growers association impacts assessment by using combined LCA and s-LCA methodologies. Sci. Total Environ 2016, 568, 253–262. [Google Scholar] [CrossRef]
  52. Peano, C.; Baudino, C.; Tecco, N.; Girgenti, V. Green marketing tools for fruit growers associated groups: Application of the Life Cycle Assessment (LCA) for strawberries and berry fruits ecobranding in northern Italy. J. Clean. Prod. 2015, 104, 59–67. [Google Scholar] [CrossRef]
  53. Nikolaou, I.E.; Evangelinos, K.I. A SWOT analysis of environmental management practices in Greek Mining and Mineral Industry. Resour. Policy 2010, 35, 226–234. [Google Scholar] [CrossRef]
  54. Ferguson, A.R. Botanical Description. In The Kiwifruit Genome; Springer: Basel, Switzerland, 2016; pp. 1–13. [Google Scholar]
  55. Abelleira, A.; Ares Yebra, A.; Aguín Casal, O.; Mansilla Vázquez, P. Method for the detection of Pseudomonas syringae pv. actinidiae (Psa) in asymptomatic branches of Actinidia sp. Revista Ciências Agrárias (Portugal) 2015, 38, 206–212. [Google Scholar]
  56. NERGI. 2016. Available online: www.nergi.info (accessed on 28 July 2017).
  57. Girgenti, V.; Massaglia, S.; Mosso, A.; Peano, C.; Brun, F. Exploring Perceptions of raspberries and blueberries by Italian consumers. Sustainability 2016, 8, 1027. [Google Scholar] [CrossRef]
  58. Zijm, H.; Klumpp, M. Future Logistics: What to expect, how to adapt. In Dynamics in Logistics; Springer: Basel, Switzerland, 2017; pp. 365–379. [Google Scholar]
  59. Wang, R.C.; Zeng, Z.L.; Pang, L.P.; Yang, X.X.; Shi, H. Effects of postharvest treatments on storability of actinidia argute kiwifruit. Acta Hortic. 2014, 1096, 461–466. [Google Scholar] [CrossRef]
  60. Jaeger, S.R.; Harker, F.R. Consumer evaluation of novel kiwifruit: Willingness-to-pay. J. Sci. Food Agric. 2005, 85, 2519–2526. [Google Scholar] [CrossRef]
  61. Hu, W.; Woods, T.; Bastin, S. Consumer acceptance and willingness to pay for blueberry products with nonconventional attributes. J. Agric. Appl. Econ. 2009, 41, 47–60. [Google Scholar] [CrossRef]
  62. Antonio, E.; De Pascale, S.; Inglese, P. Modelli colturali sostenibili per le produzioni orto-floro-frutticole di qualità. Ital. J. Agron. 2008, 3, 143–154. [Google Scholar] [CrossRef]
  63. Page, G.; Kelly, T.; Minor, M.; Cameron, E. Modeling carbon footprints of organic orchard production systems to address carbon trading: An approach based on life cycle assessment. Hortscience 2011, 46, 324–327. [Google Scholar]
  64. Latocha, P.; Krupa, T.; Jankowski, P.; Radzanowska, J. Changes in postharvest physicochemical and sensory characteristics of hardy kiwifruit (Actinidia arguta and its hybrid) after cold storage under normal versus controlled atmosphere. Postharvest Biol. Technol. 2014, 88, 21–33. [Google Scholar] [CrossRef]
  65. Brunori, G.; Massai, R. Sviluppo rurale e caratteristiche dei mercati frutticoli nell’economia globalizzata. In Effetti. Potenzialità e Limiti Della Globalizzazione; Brunori, G., Massai, R., Eds.; Springer: Heidelberg, Germany, 2007; pp. 83–100. [Google Scholar]
  66. Morris, L. Developing a collaborative marketing strategy for sheep farmers in Namibia. Agrekon 2013, 52, 118–132. [Google Scholar] [CrossRef]
  67. Dyson, R.G. Strategic development and SWOT analysis at the University of Warwick. Eur. J. Oper. Res. 2004, 152, 631–640. [Google Scholar] [CrossRef]
Figure 1. Flowchart conceptual model.
Sustainability 09 01621 g001
Figure 2. Impacts diagram for the production of Actinidia arguta and Actinidia deliciosa.
Sustainability 09 01621 g002
Figure 3. Principal differences in field production and warehouse from farm to fork management between A. arguta and A. deliciosa.
Sustainability 09 01621 g003
Figure 4. Orchard cycle impacts for producing 1 kg of A. arguta and A. deliciosa: relative contributions of 2 orchard production phases for each production system ((A): non-renewable energy; (B): global warming potential; (C): IPCC GWC 100a).
Sustainability 09 01621 g004
Figure 5. Field and warehouse impacts for 1 kg of salable product of A. arguta and A. deliciosa. ((A): Non-renewable energy; (B): global warming potential; (C): IPCC GWC 100a).
Sustainability 09 01621 g005
Figure 6. Strengths, Weaknesses, Opportunities, Threats (SWOT) analysis of A. arguta.
Sustainability 09 01621 g006
Table 1. Principal inputs involved in the analysis of the field production and distribution chain for A. arguta and A. deliciosa.
PhaseOperation or InputA. deliciosaA. arguta
Material or MachineMaterial or Machine
NurseryRootingSubstratum300 L ha−1Substratum300 L ha−1
MulchingBlack PE400 kg ha−1Black PE400 kg ha−1
CoveringWhite PE6.7 kg ha−1White PE6.7 kg ha−1
CoveringMetal supports7.5 kg ha−1Metal supports7.5 kg ha−1
Fertigation systemPVC piping46 kg ha−1PVC piping46 kg ha−1
Fertigation systemPVC tubing46 kg ha−1PVC tubing46 kg ha−1
FertigationCompost mix300 kg ha−1Compost mix300 kg ha−1
FertigationWater40 m3 ha−1Water40 m3 ha−1
Cold storageElectrical energy35 kWh m3Electrical energy35 kWh m3
FilelSoil preparationPlough or cultivator1 h ha−1Plough or cultivator1 h ha−1
Soil preparationHarrow1 h ha−1Harrow1 h ha−1
Irrigation systemPVC piping379.1 kg ha−1PVC piping379.1 kg ha−1
Irrigation systemPVC tubing52.8 kg ha−1PVC tubing52.8 kg ha−1
IrrigationWater1440 m3 ha−1Water1500 m3 ha−1
Base fertilizationManure40 t ha−1Manure50 t ha−1
FertilizationN60 kg ha−1N60 kg ha−1
FertilizationP30 kg ha−1P30 kg ha−1
FertilizationK110 kg ha−1K120 kg ha−1
Coveringhail net600 kg ha−1hail net600 kg ha−1
CoveringWood supports700 kg ha−1Wood supports700 kg ha−1
Plant supportsMetal supports300 kg ha−1Metal support300 kg ha−1
Plant protection treatmentsp.a.2.5 kg ha−1p.a.1.5 kg ha−1
Total processesDiesel consumption400 kg ha−1Diesel consumption220 kg ha−1
Post-harvestingRefrigeration/storageElectrical energy0.33 kwh kg−1Electrical energy0.17 kwh kg−1
fruit calibrationElectrical energy0.006 kwh kg−1Electrical energy0.005 kwh kg−1
PackagingPE0.02 kg kg−1PE0.019 kg kg−1
PackagingCardboard0.080 kg kg−1PE bag0.004 kg kg−2
Table 2. Annual average impacts per kg di A. arguta and A. deliciosa within each orchard phase (young and adult) for the three impact categories under examination (global warming, non-renewable energy and Intergovernamental Panel on Climate Change (IPCC) global warming potential (GWP) 100a). The values between brackets for the young productive phases indicate how these phases perform compared to the full productive phase: positive values refer to the lower productive phase having a higher environmental impact than the full production phase, while negative values refer to a lower environmental impact for the young productive phase. The last column lists the impacts associated with a full orchard cycle.
A. argutaA. deliciosa
Impact CategoryUnitYoung PhaseFull PhaseTotalYoung PhaseFull PhaseTotal
OrchardOrchard
CycleCycle
Global Warmingkg CO2 eq0.210.130.140.1720.110.11
(+58%) (+59%)
Non-renewable energyMJ primary3.582.172.34.742.672.86
(+65) (+78%)
Ipcc GWP 100akg CO2 eq0.230.150.160.190.120.13
(+54%) (+56%)
Table 3. Annual average impacts per kg di A. arguta and A. deliciosa within each orchard phase (young and adult) plus the warehouse for the three impact categories under examination (global warming, non-renewable energy and IPCC GWP 100a). The values between brackets for the young productive phases indicate how these phases perform compared to the full productive phase: positive values refer to the lower productive phase having a higher environmental impact than the full production phase, while negative values refer to a lower environmental impact for the young productive phase. The last column lists the impacts associated with a full orchard cycle.
Impact CategoryUnitA. argutaA. deliciosa
Young PhaseFull PhaseTotal Orchard + Warehouse CycleYoung PhaseFull PhaseTotal Orchard + Warehouse Cycle
Global Warmingkg CO2 eq0.390.320.330.530.470.48
(+23%) (+13%)
Non-renewable energyMJ primary7.055.705.8211.209.219.39
(+24%) (+22%)
IPCC GWP 100°kg CO2 eq0.420.340.350.560.500.50
(+22%) (+13%)
Table 4. Application of Threats, Opportunities, Weakness, Strengths (TOWS) matrix to the A. arguta system. The first letter of the acronyms reported in TOWS matrix, as codified in Figure 6, refers to one of the 4 tipologies of factors analysed in SWOT (Strengths, Weaknesses, Opportunities, Threats) the second letter indicates one of the four steps of the Fresh Fruit supply chain (Field, Warehouse, Distribution, Consumer).
SO Strategy (Max–Max)WO Strategy (Min–Max)
1. large scale oriented3. export and organic oriented
SF1, SW1, SD1, SC1WD2, WC1, WW1
OF1, OW, OC1, OC2OF1, OC1, OC2, OF1, OD1
ST Strategy (Max–Min)WT Strategy (Min–Min)
2. berry-fruit market oriented4. niche oriented
SF1, SF4, SW3, SC2, SW1WF1, WW1, WD1, WD2, WC1, WC3
TF1, TW1, TD1, TC1TF3, TW1, TD1, TC1

