A Research on Electricity Generation from Wind Corridors of Pakistan (Two Provinces): A Technical Proposal for Remote Zones

 ,
,
Abstract
:1. Introduction
2. Energy Outlooks
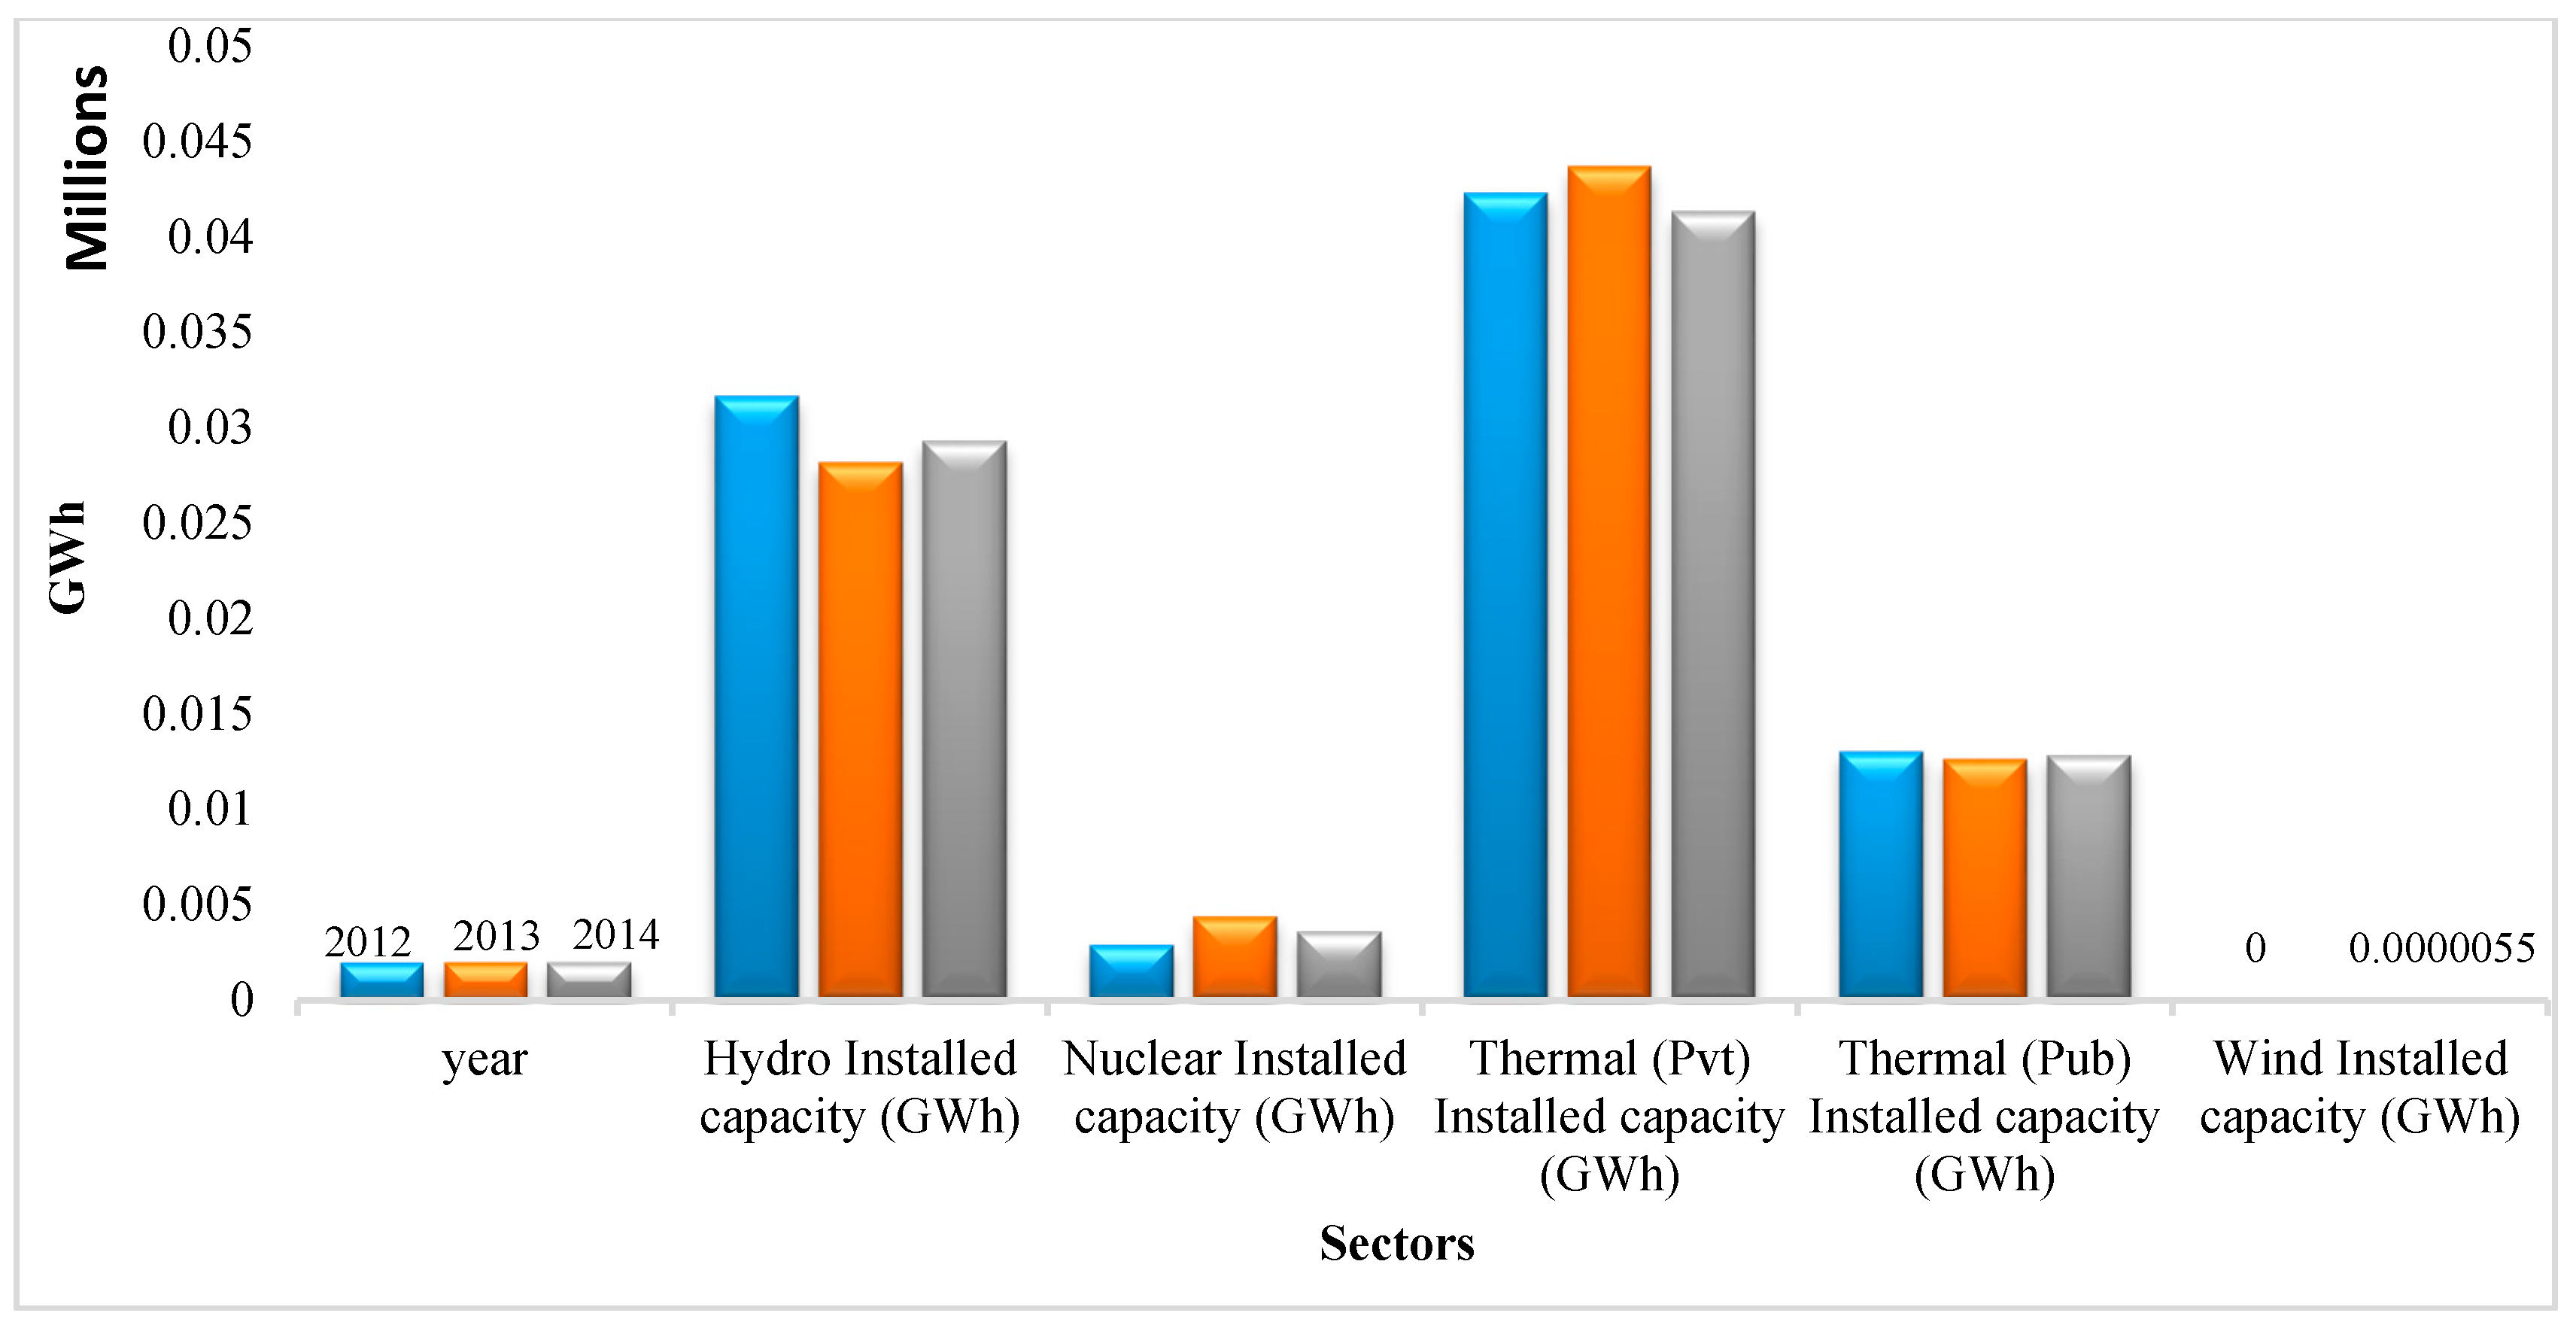
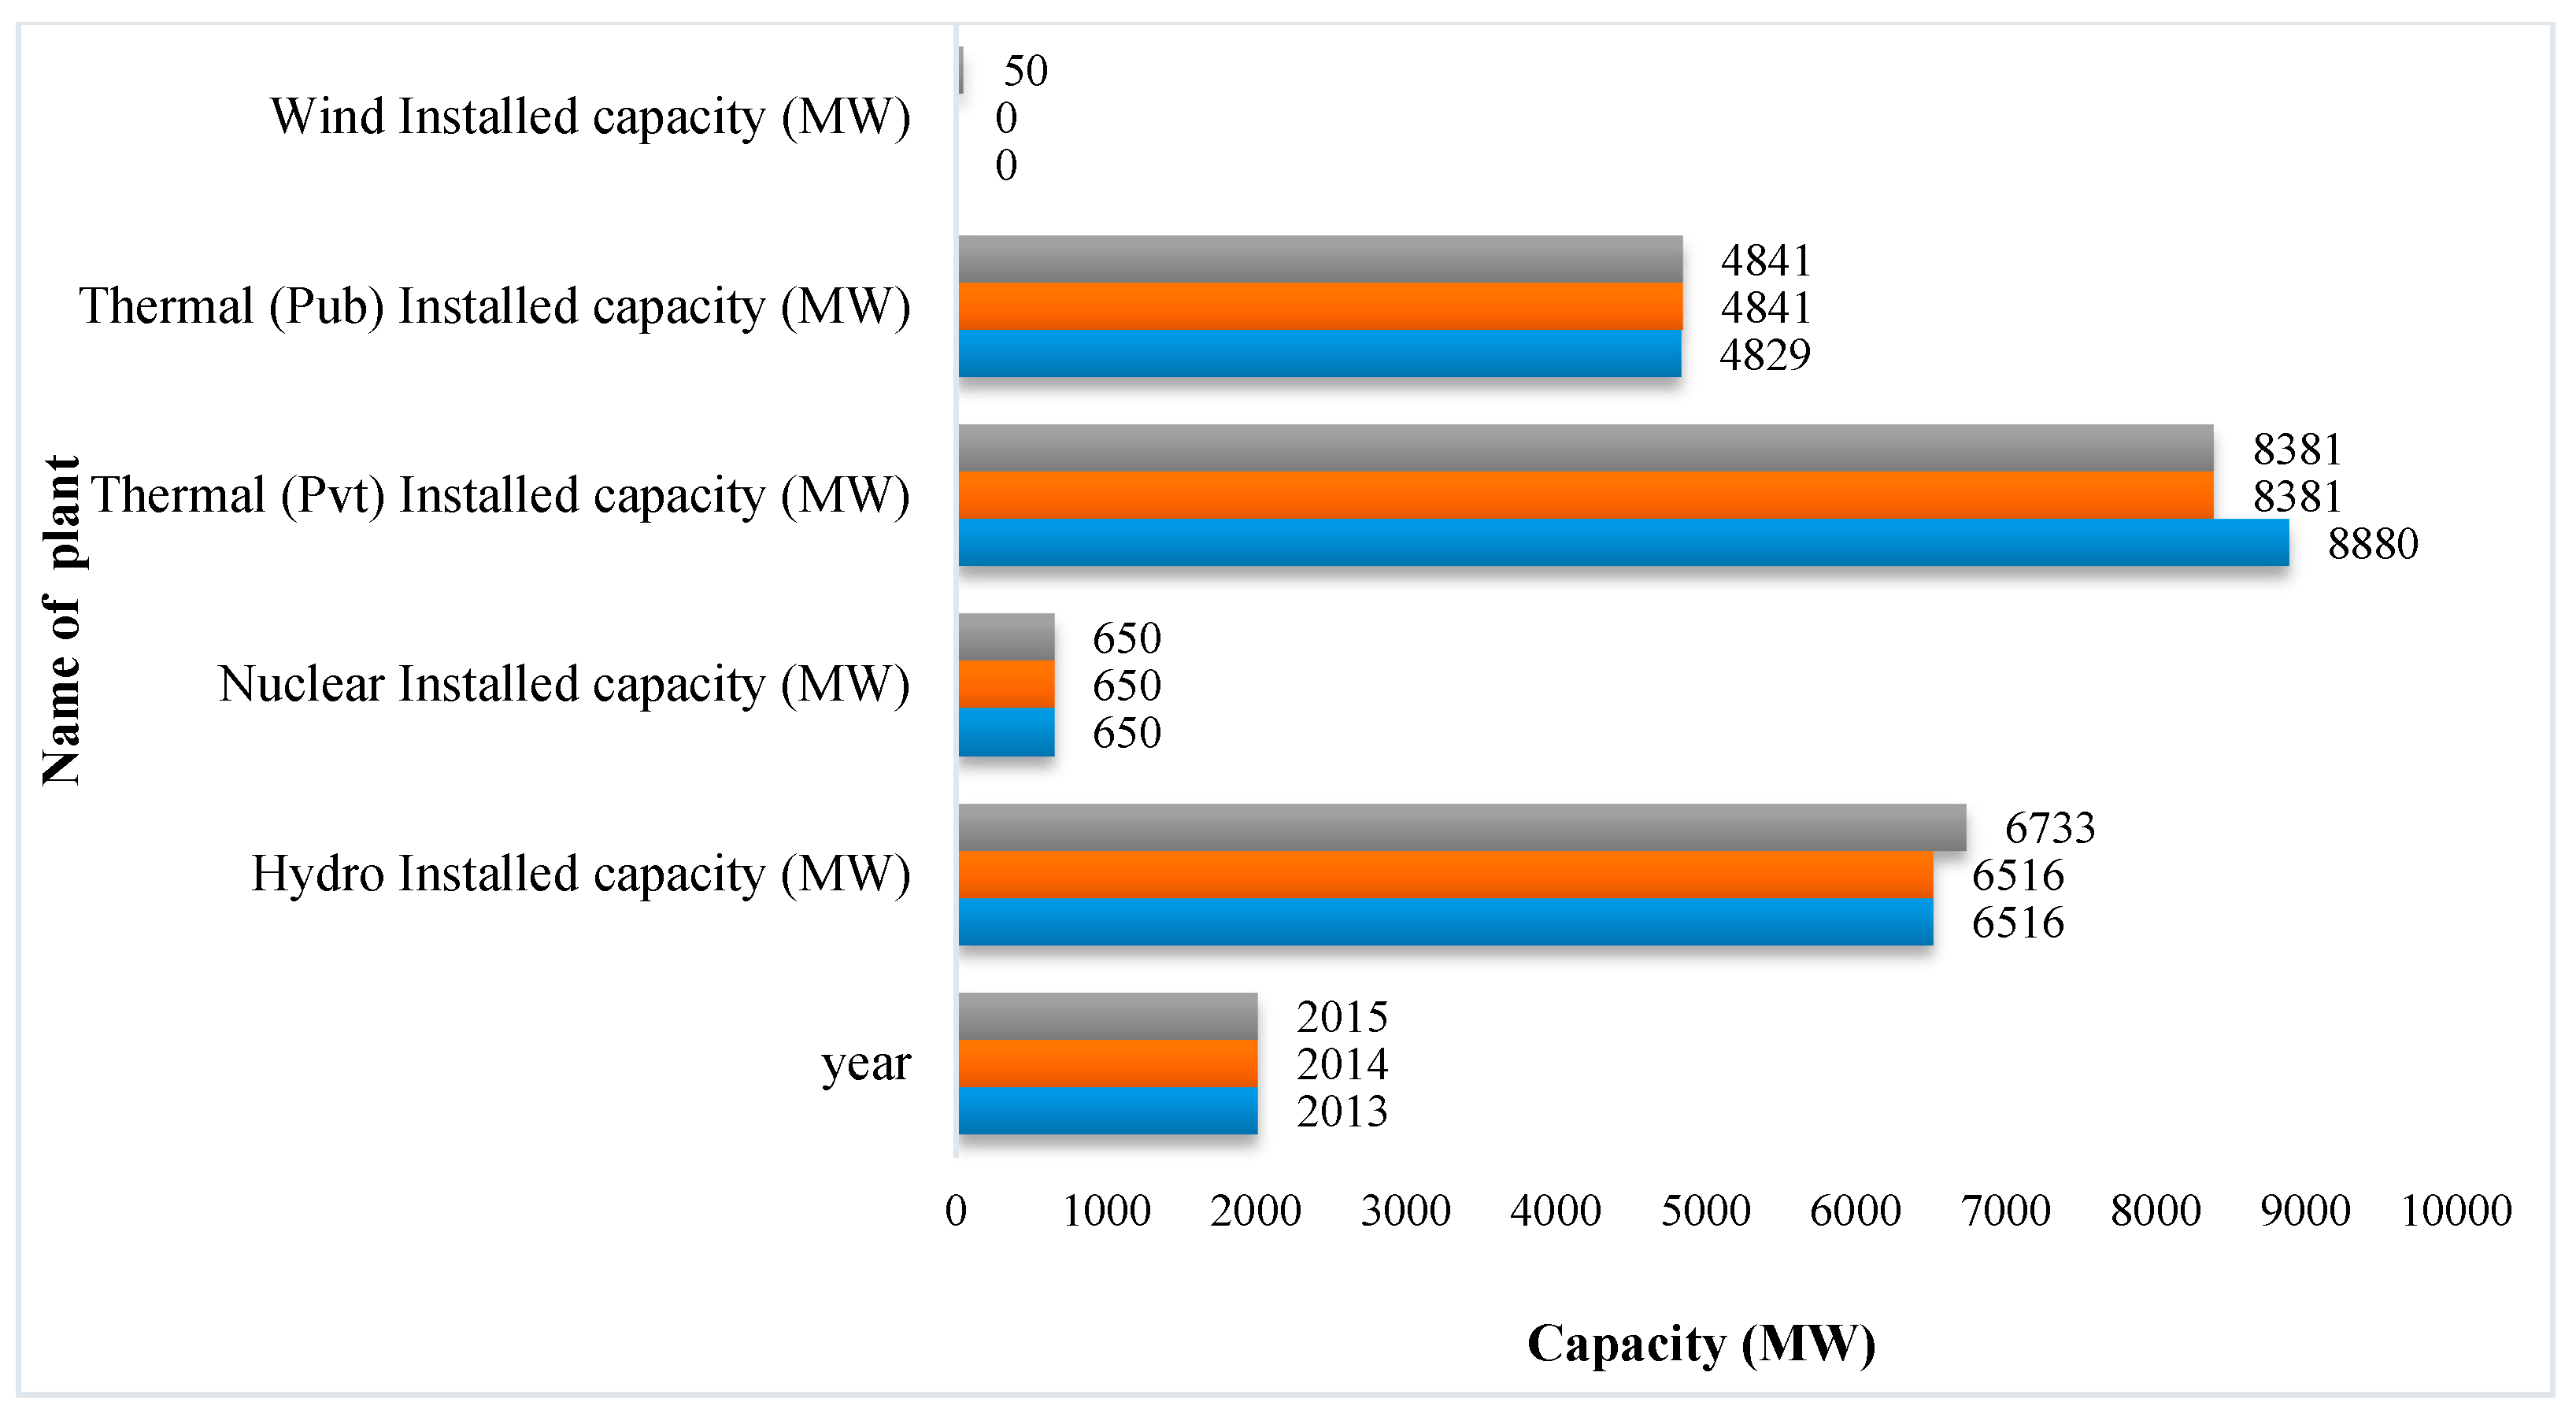
2.1. Installed Power Generators
2.2. Sector Wise Power Generation
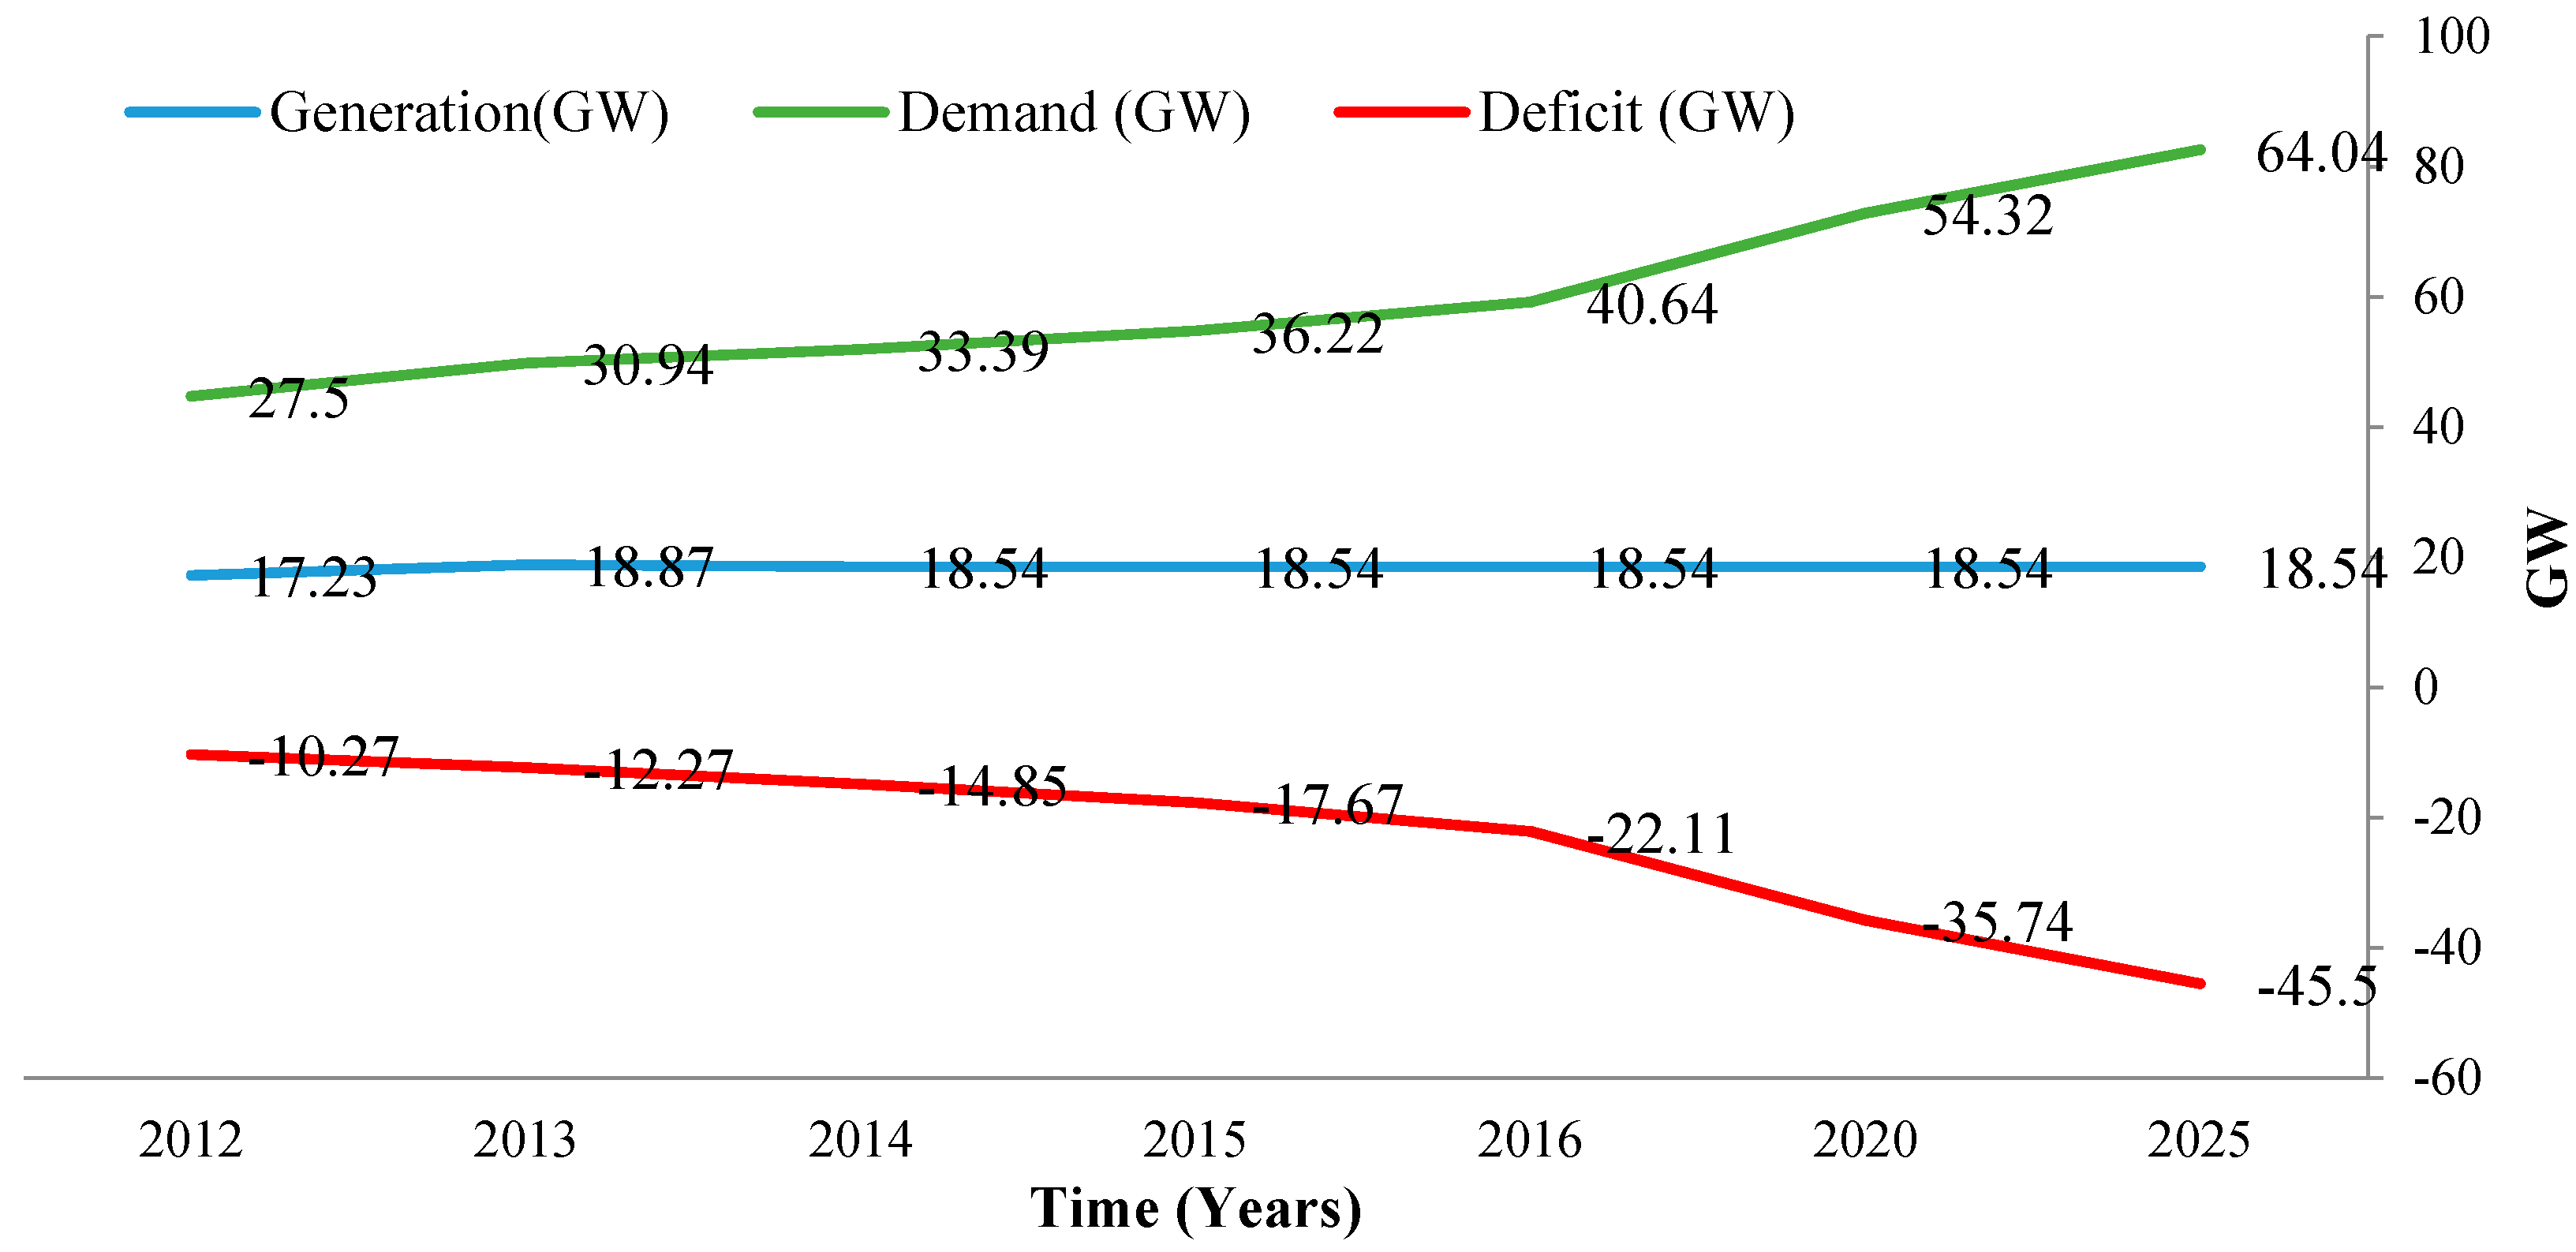
2.3. Power Electricity Generation, Demand and Deficit Forecasts
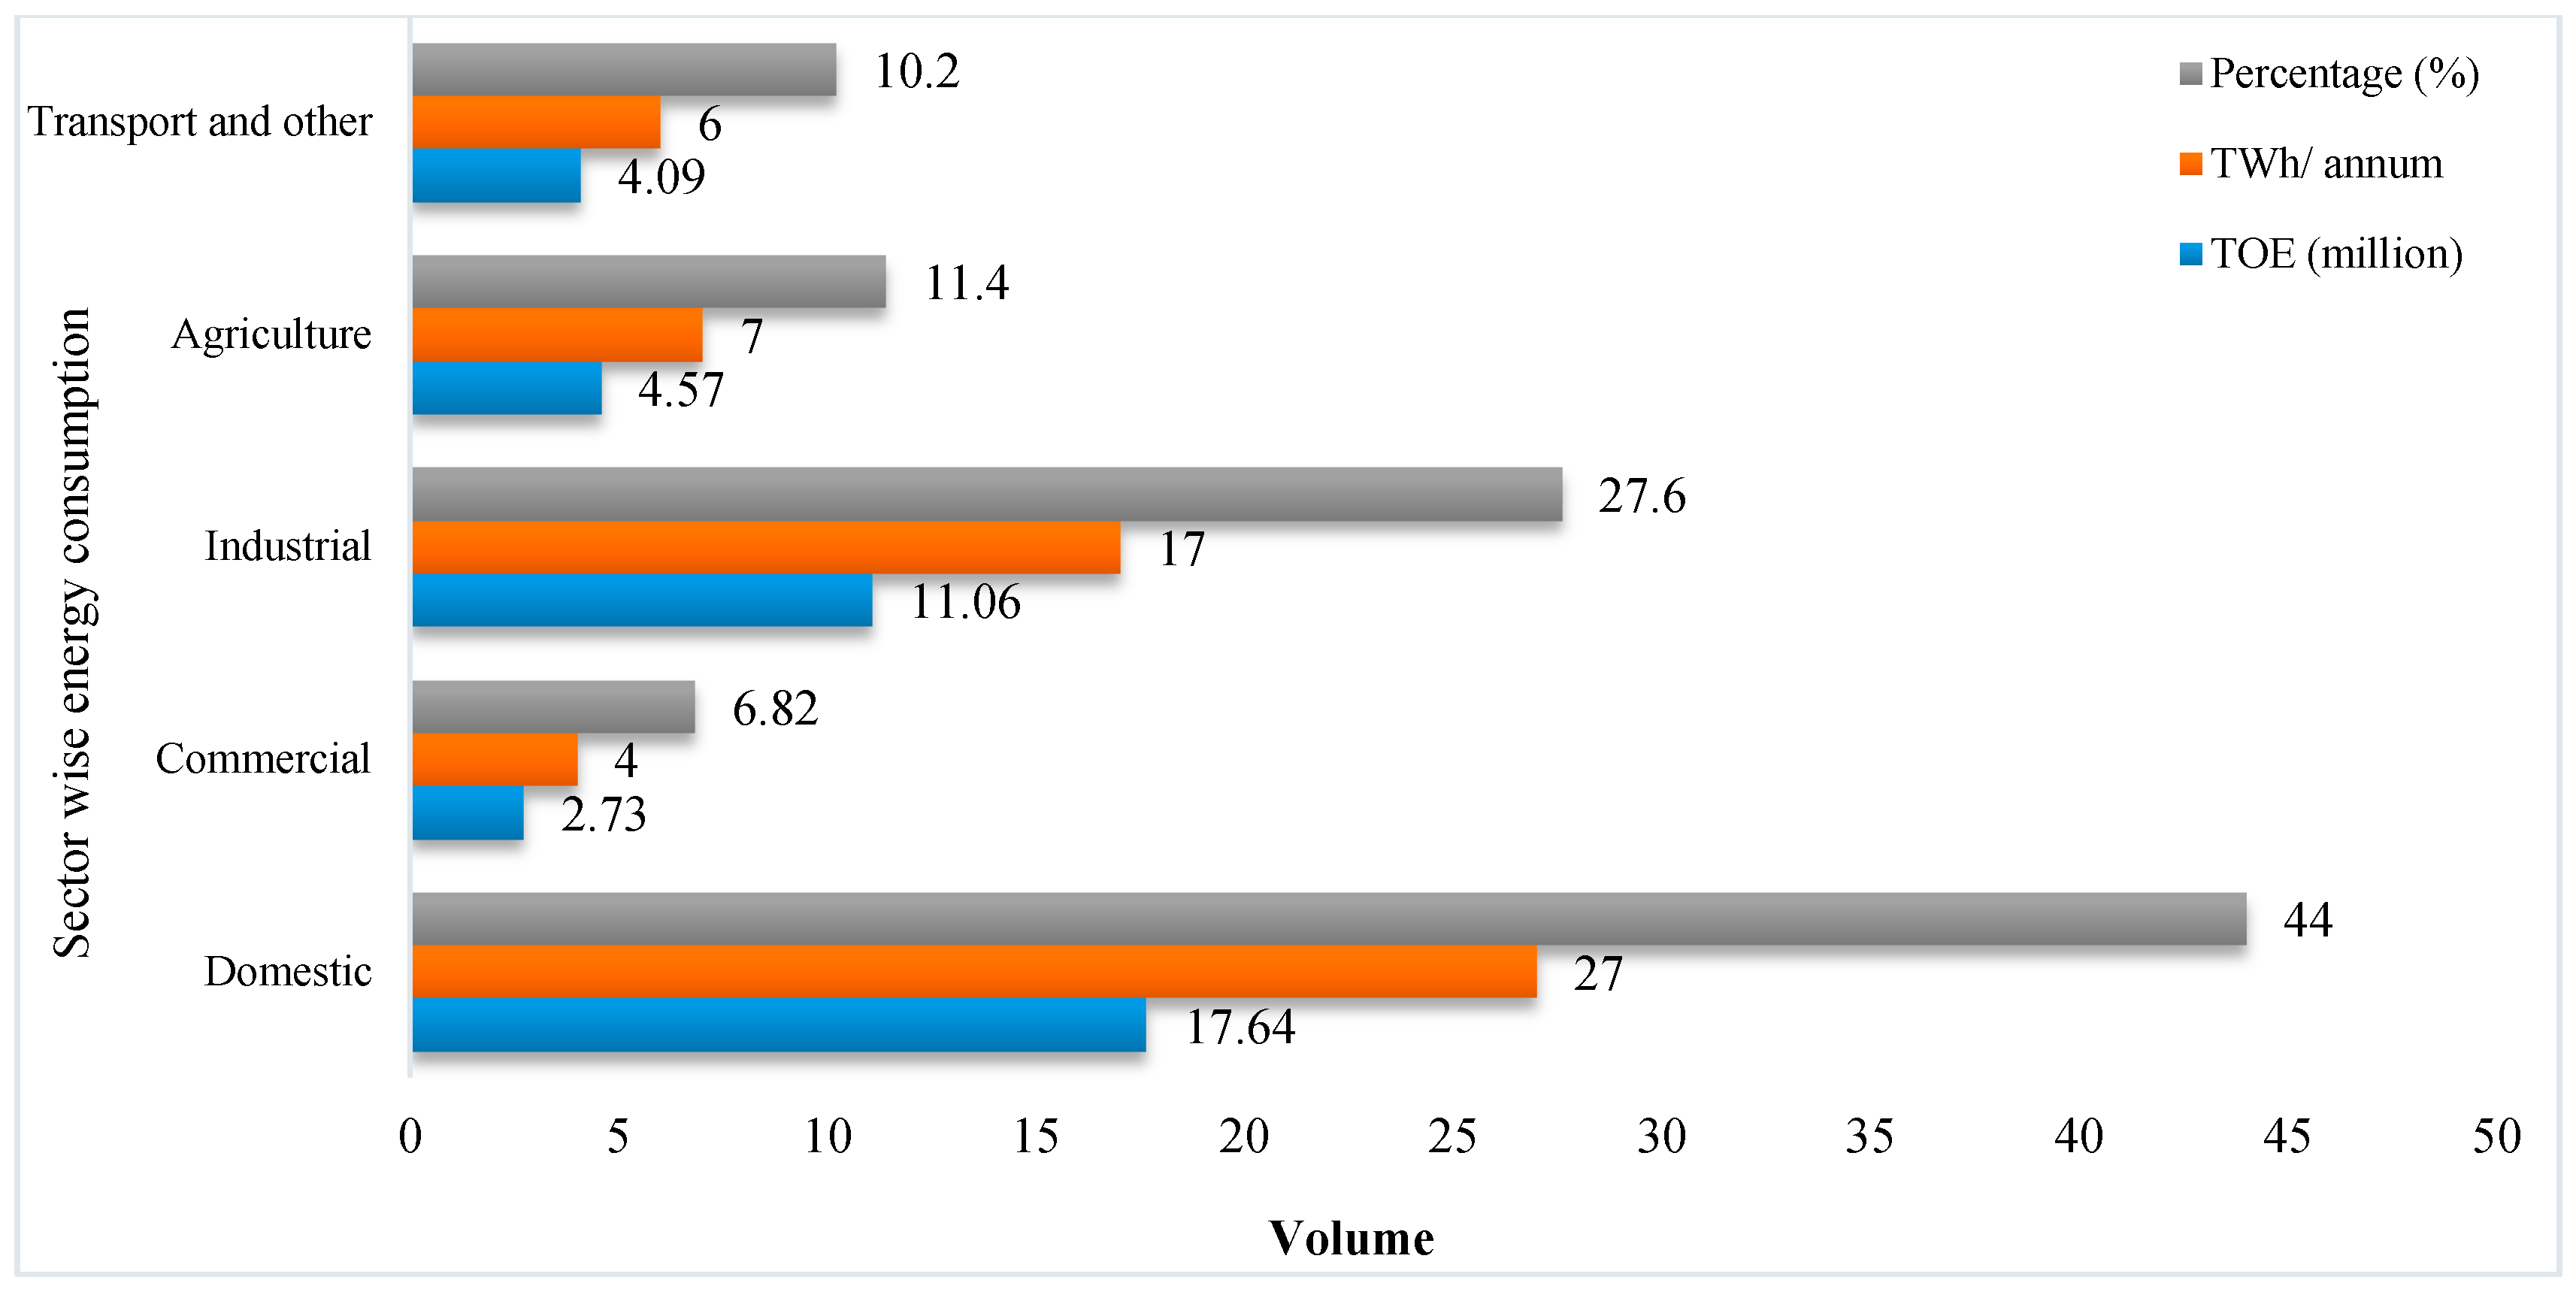
2.4. Sector Wise Energy Consumption
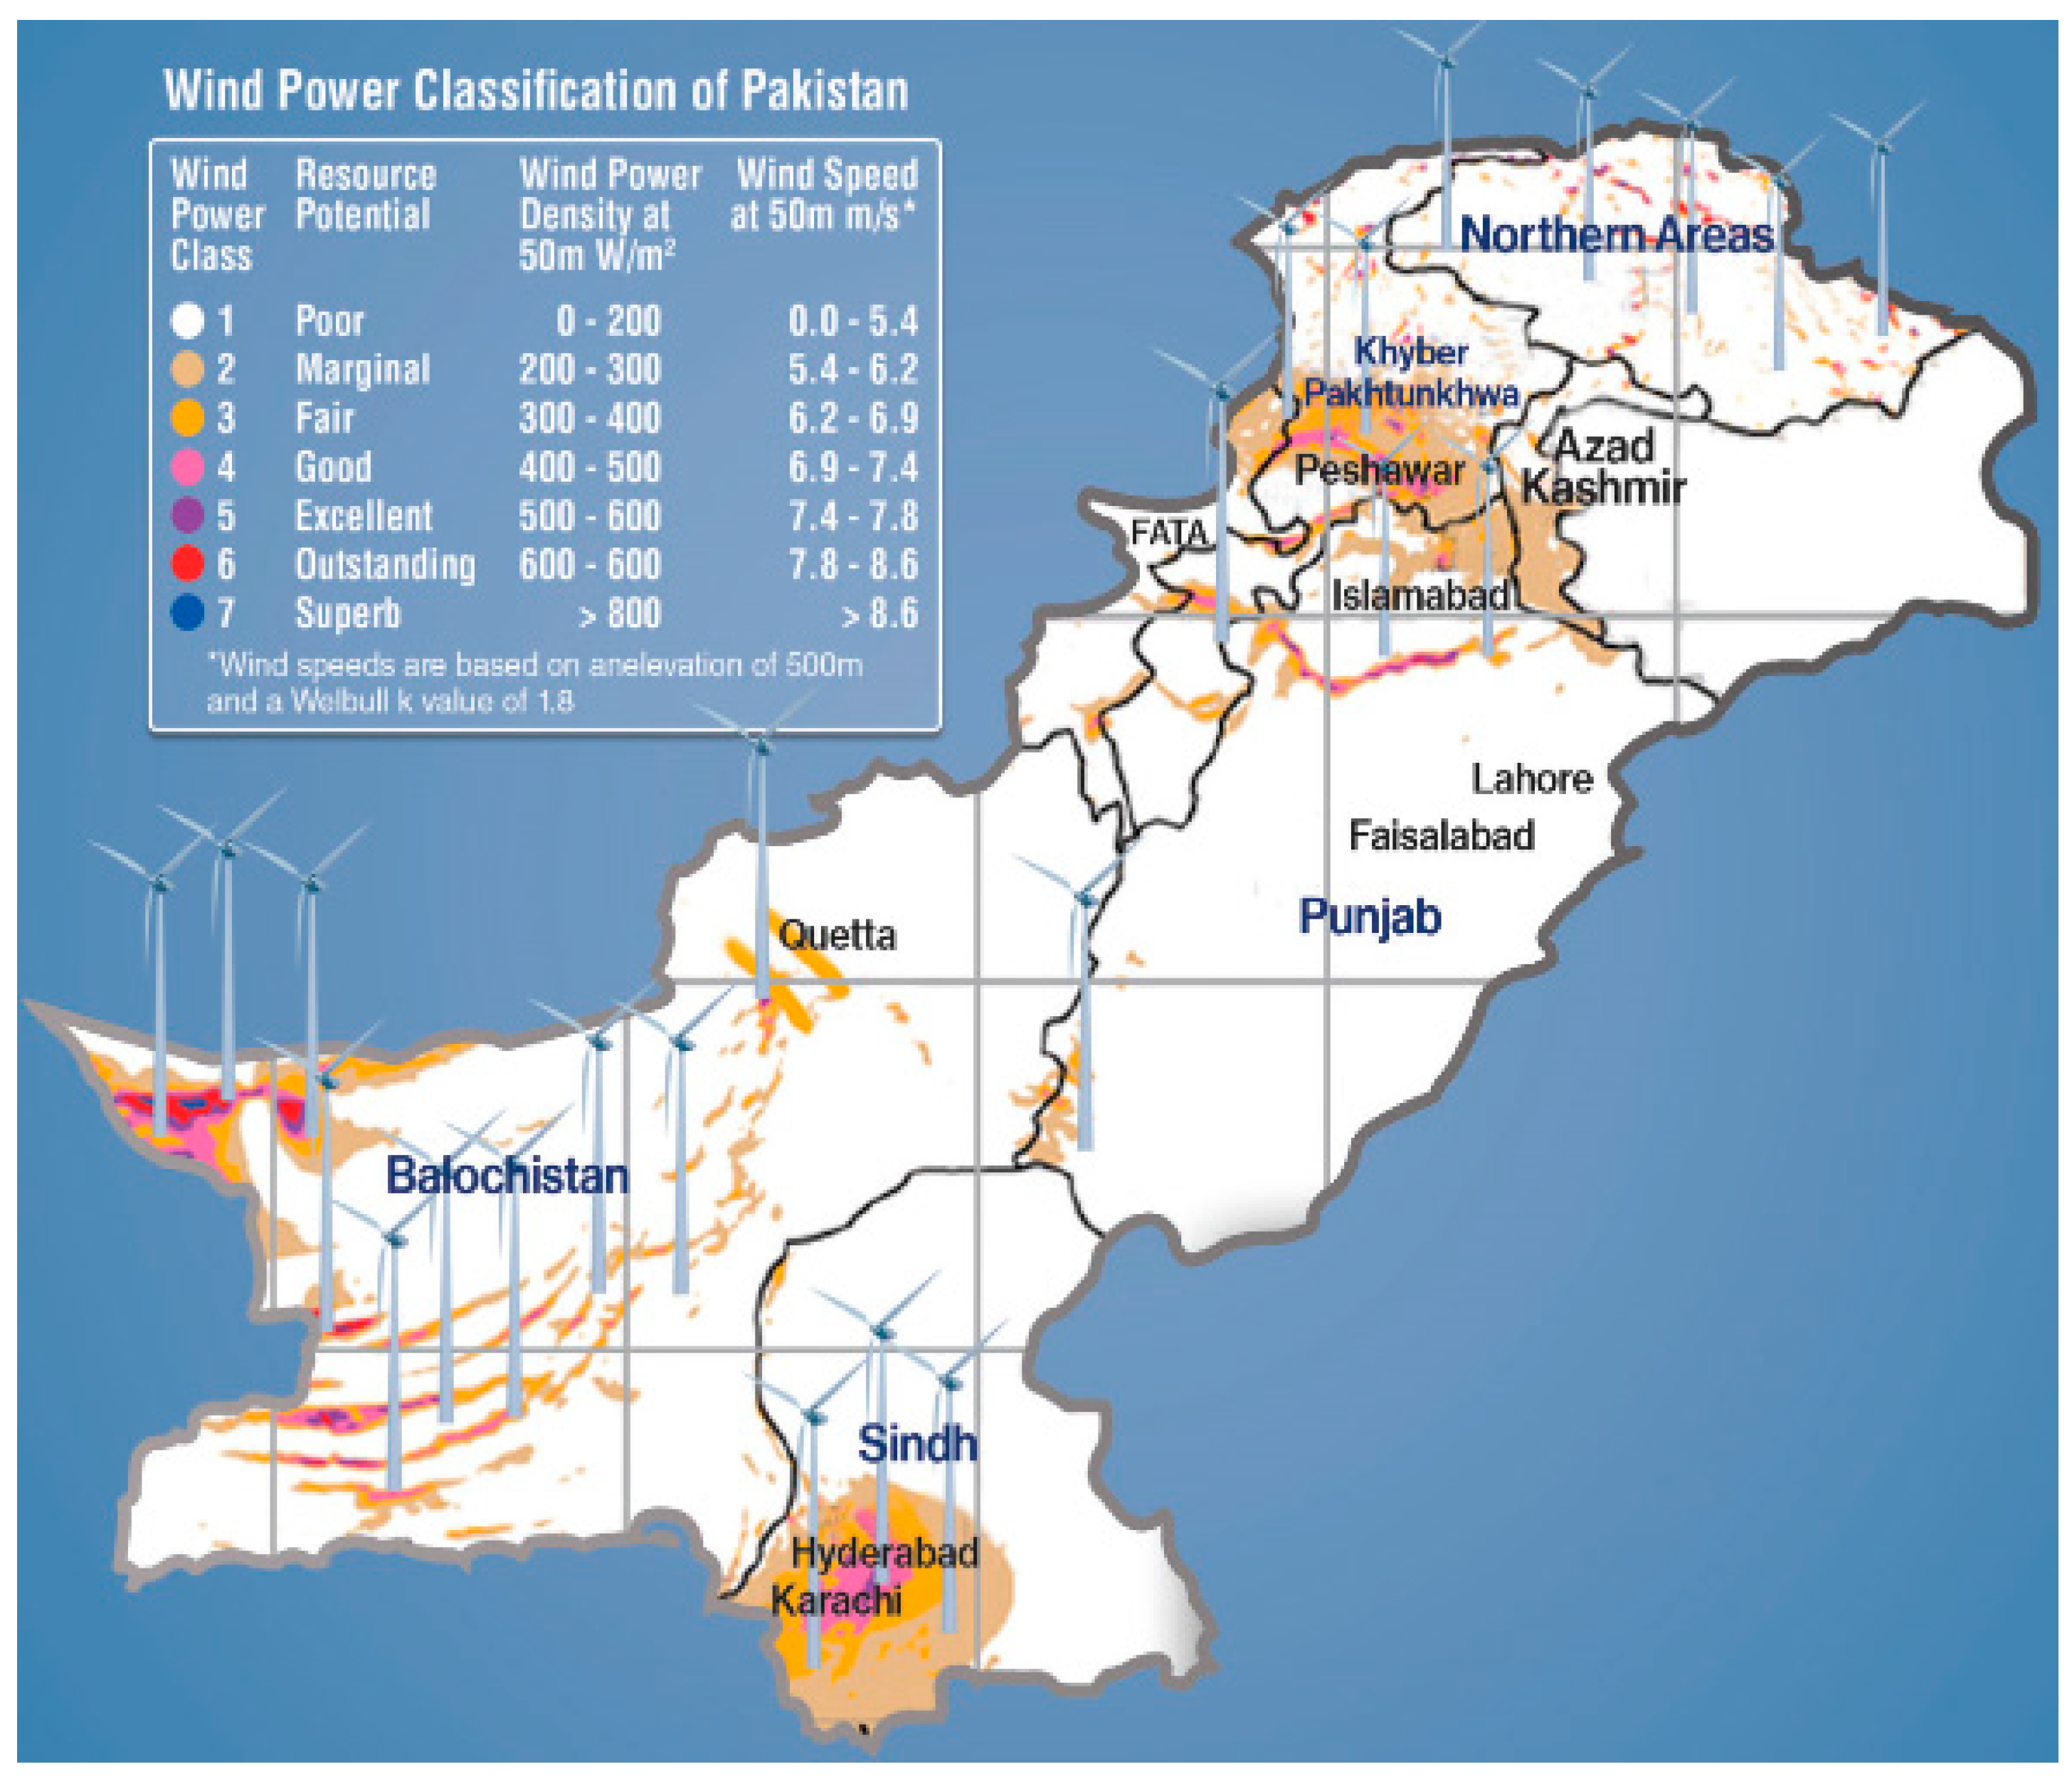
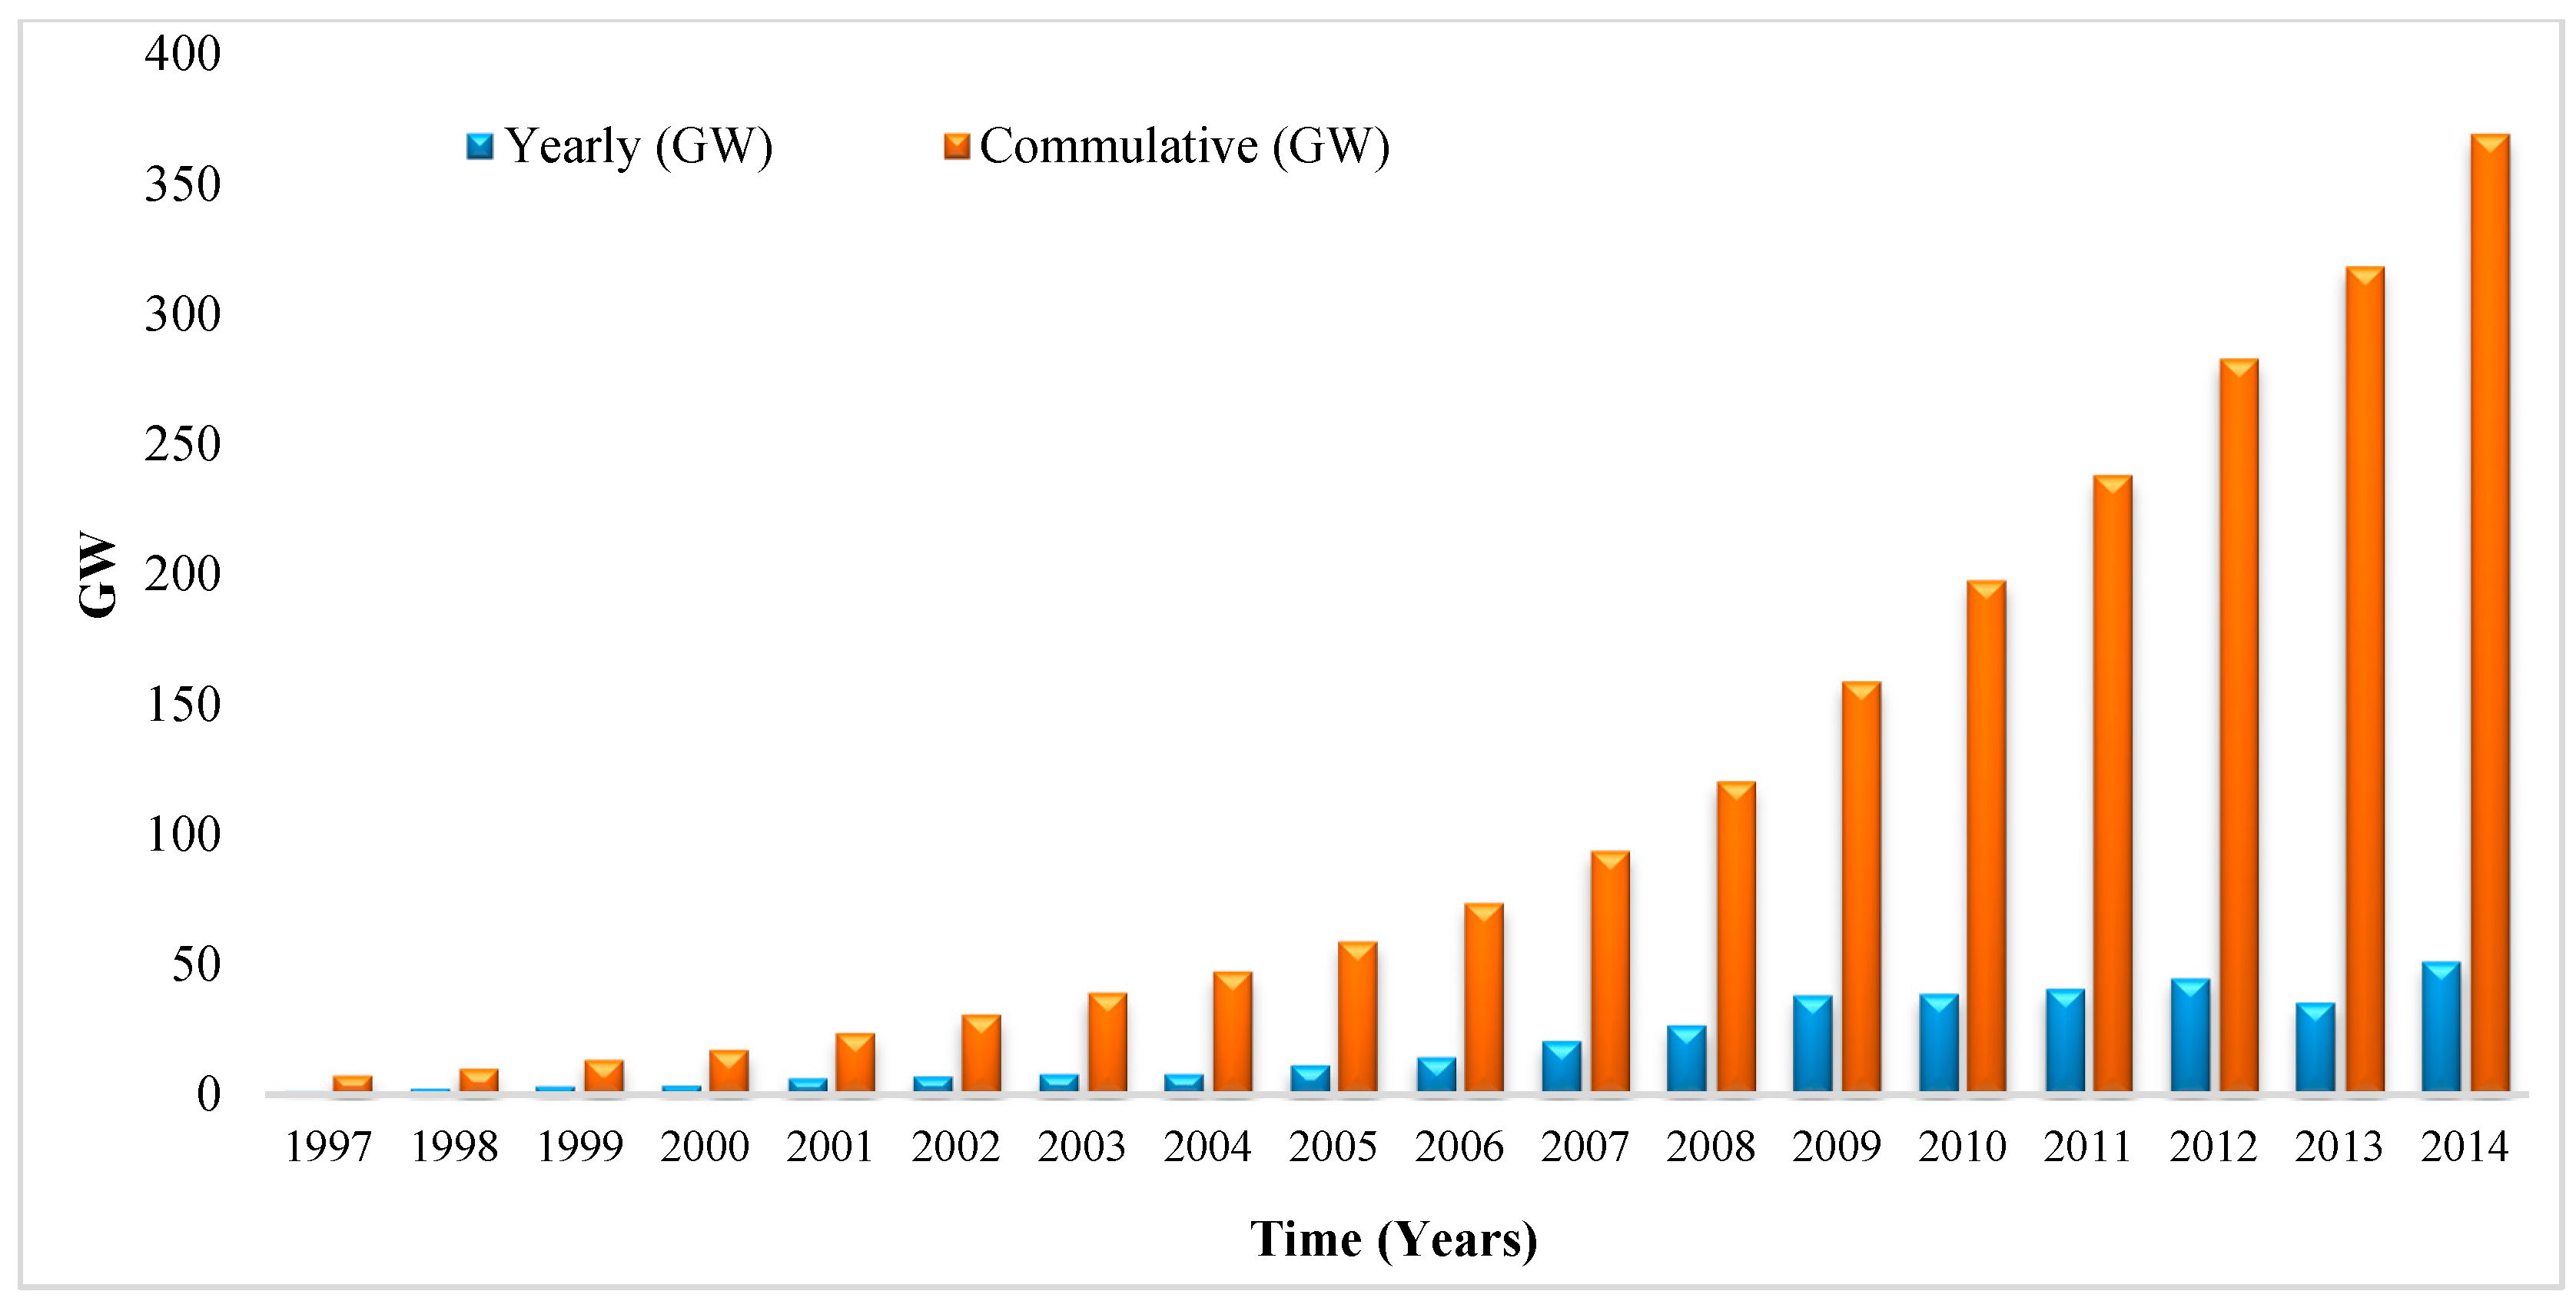
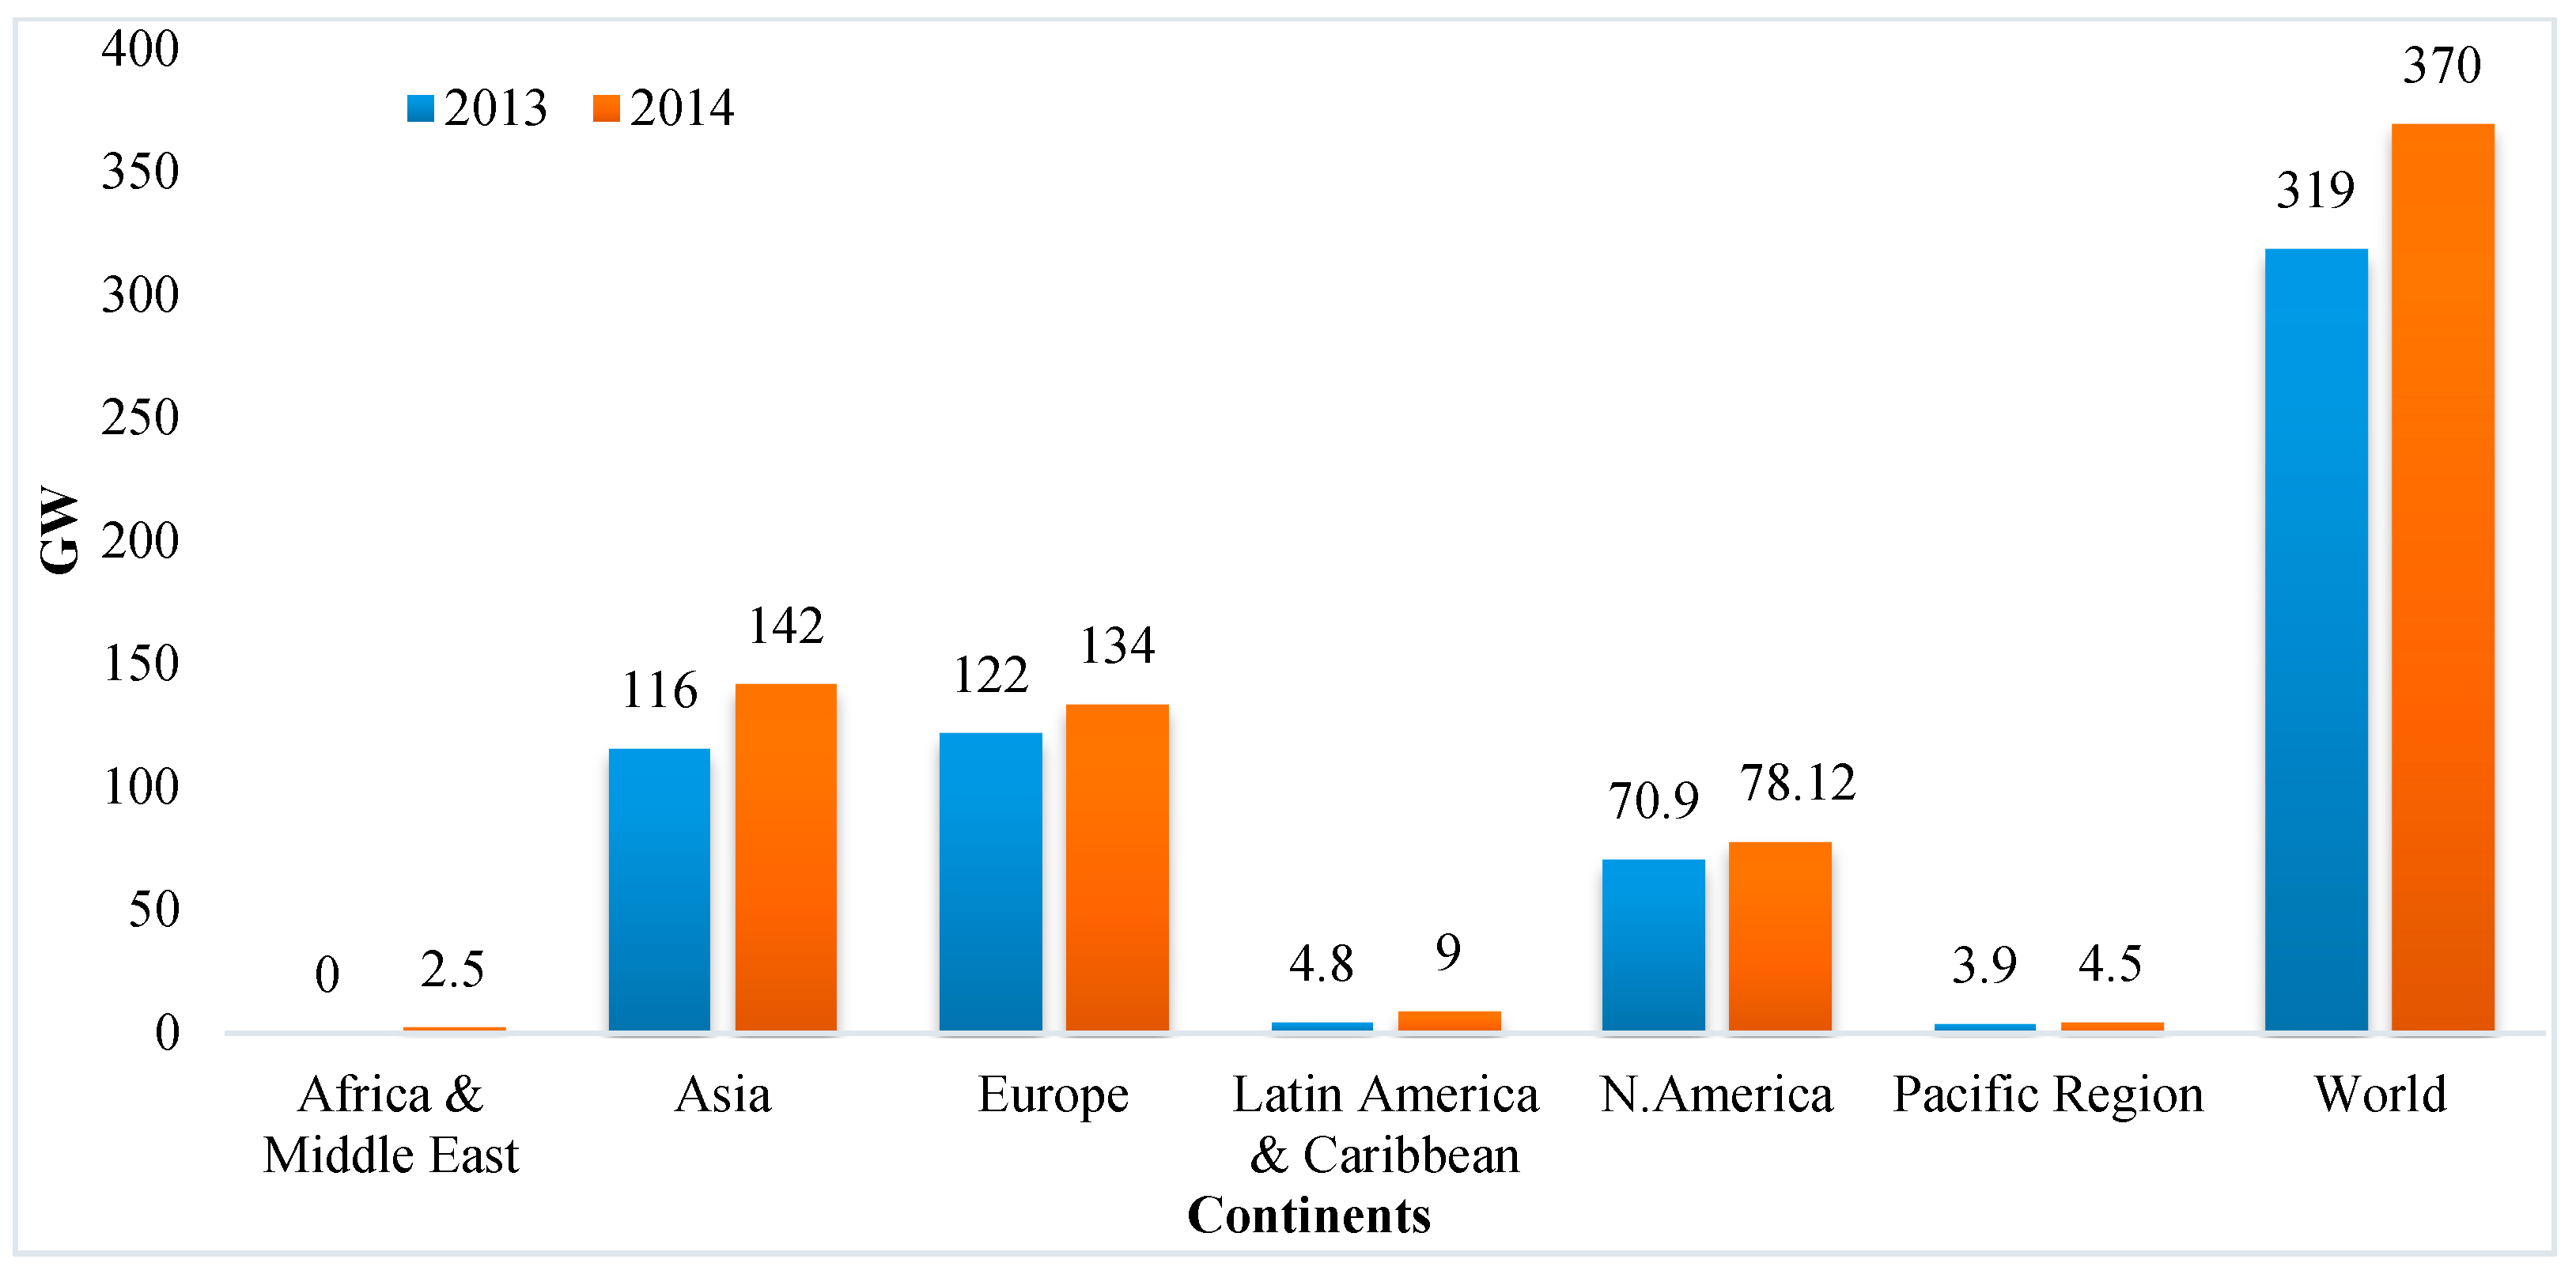
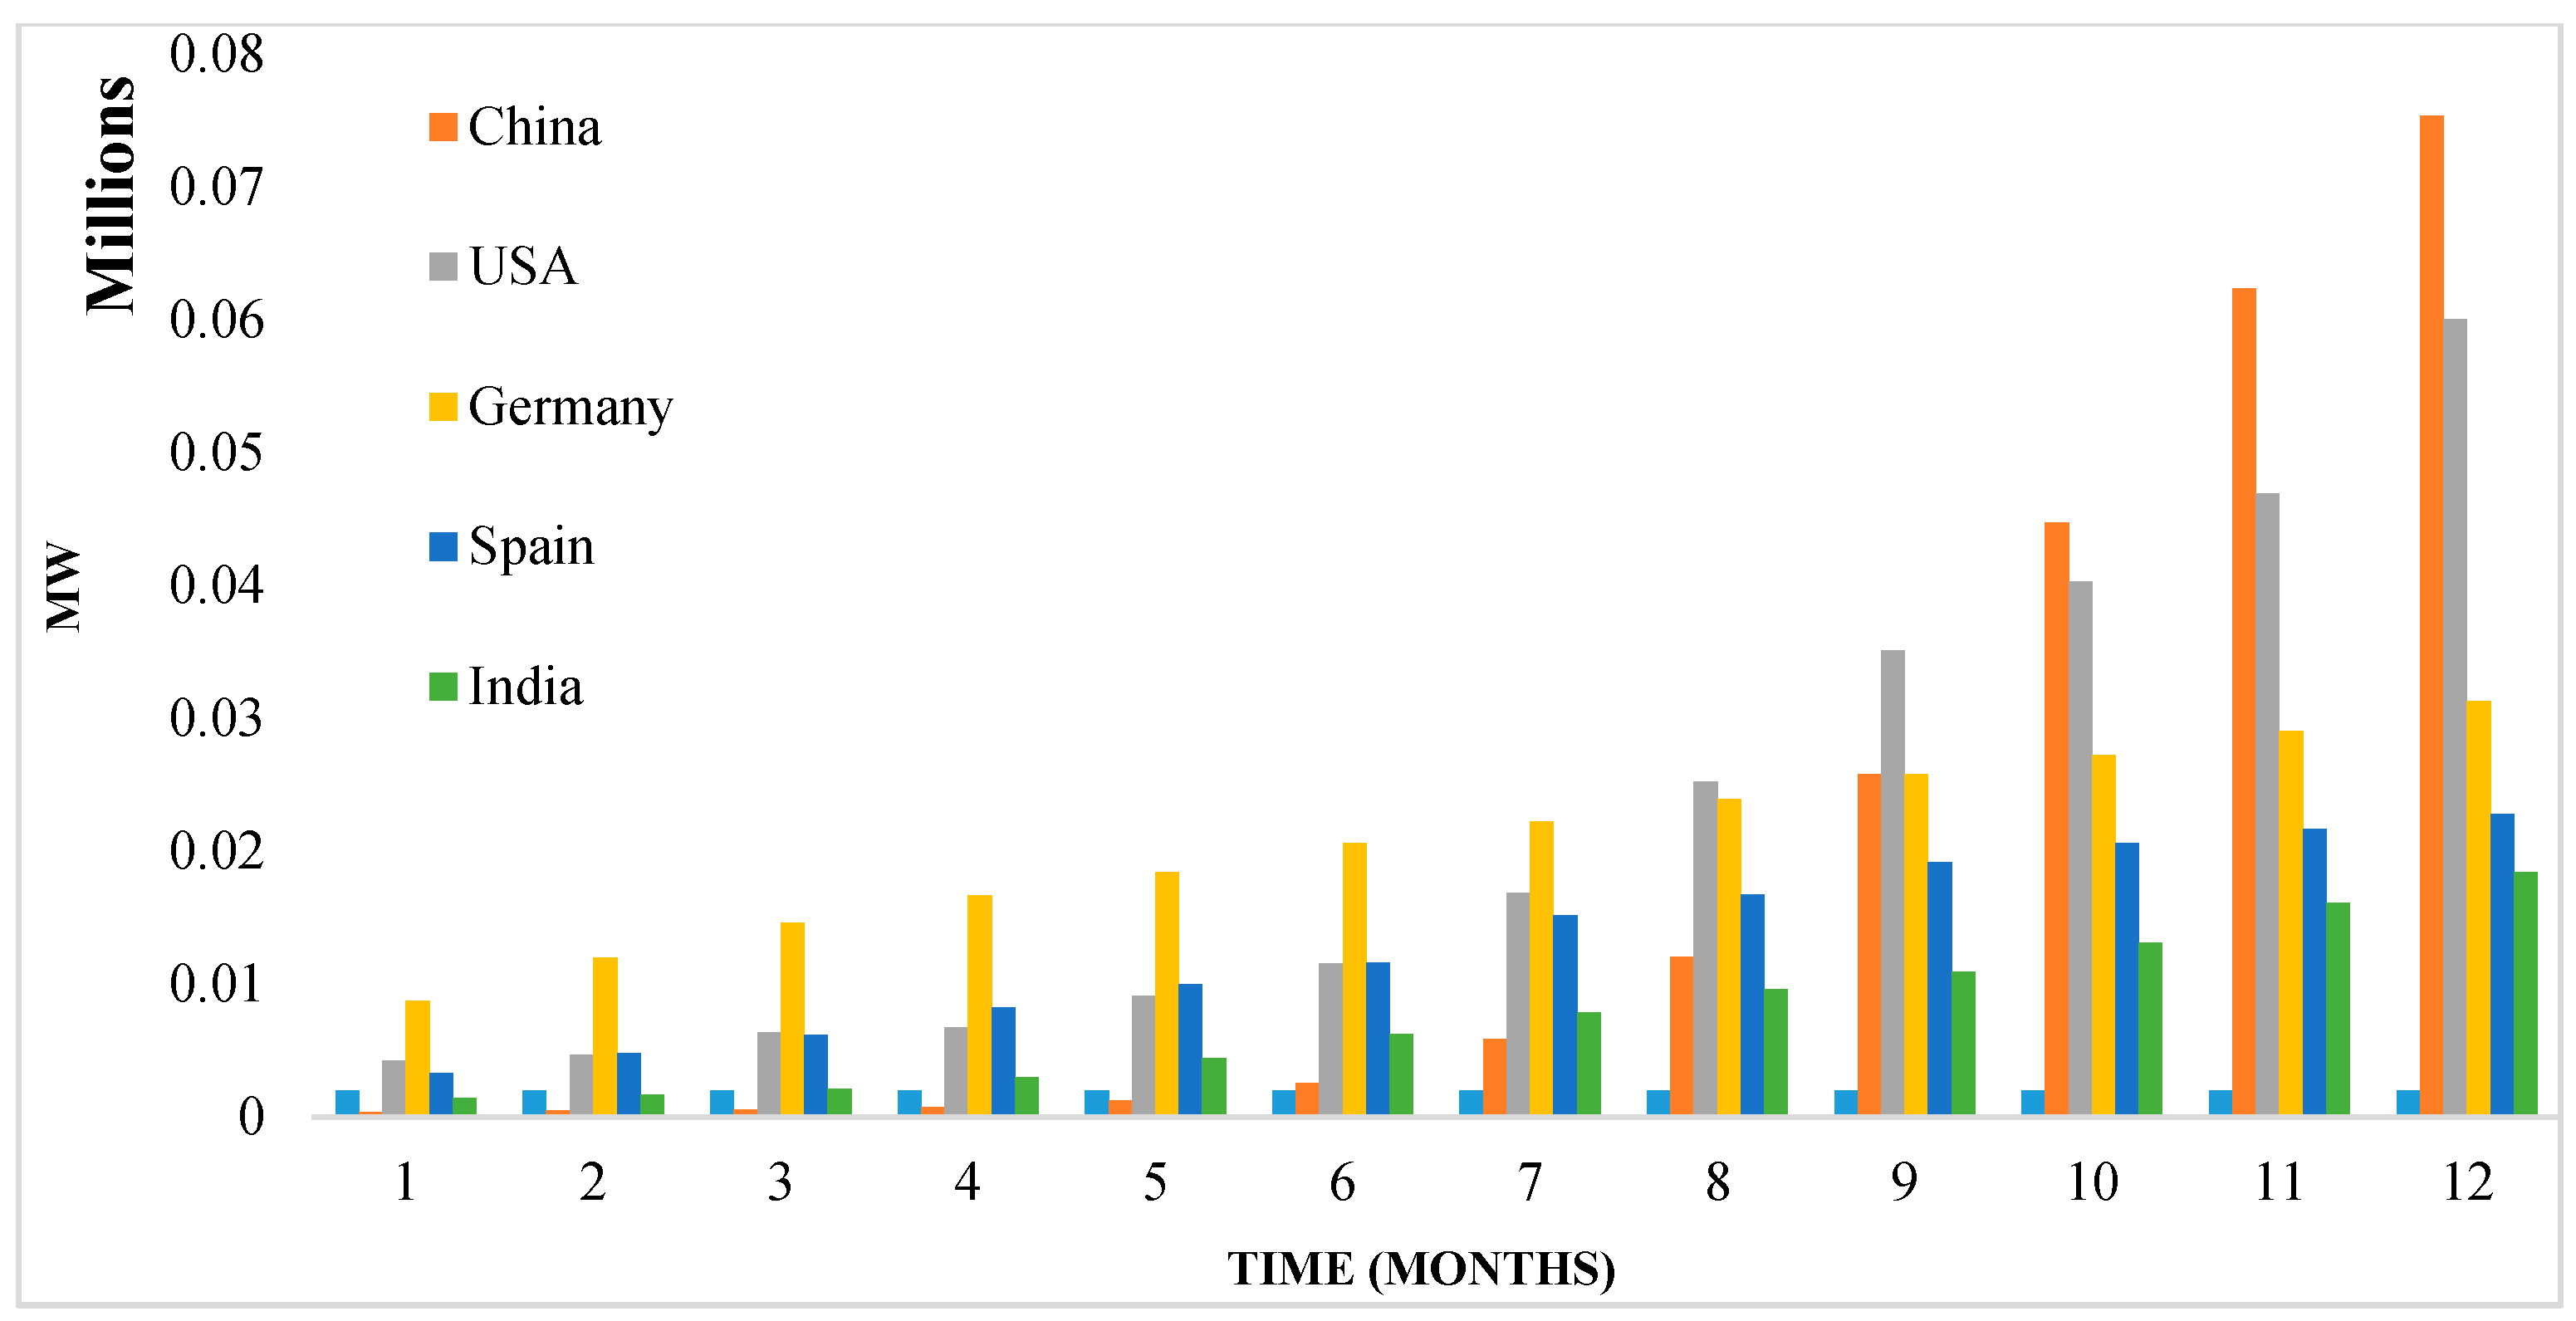
2.5. Wind Energy Outlooks
2.6. Energy Strategy Outlooks
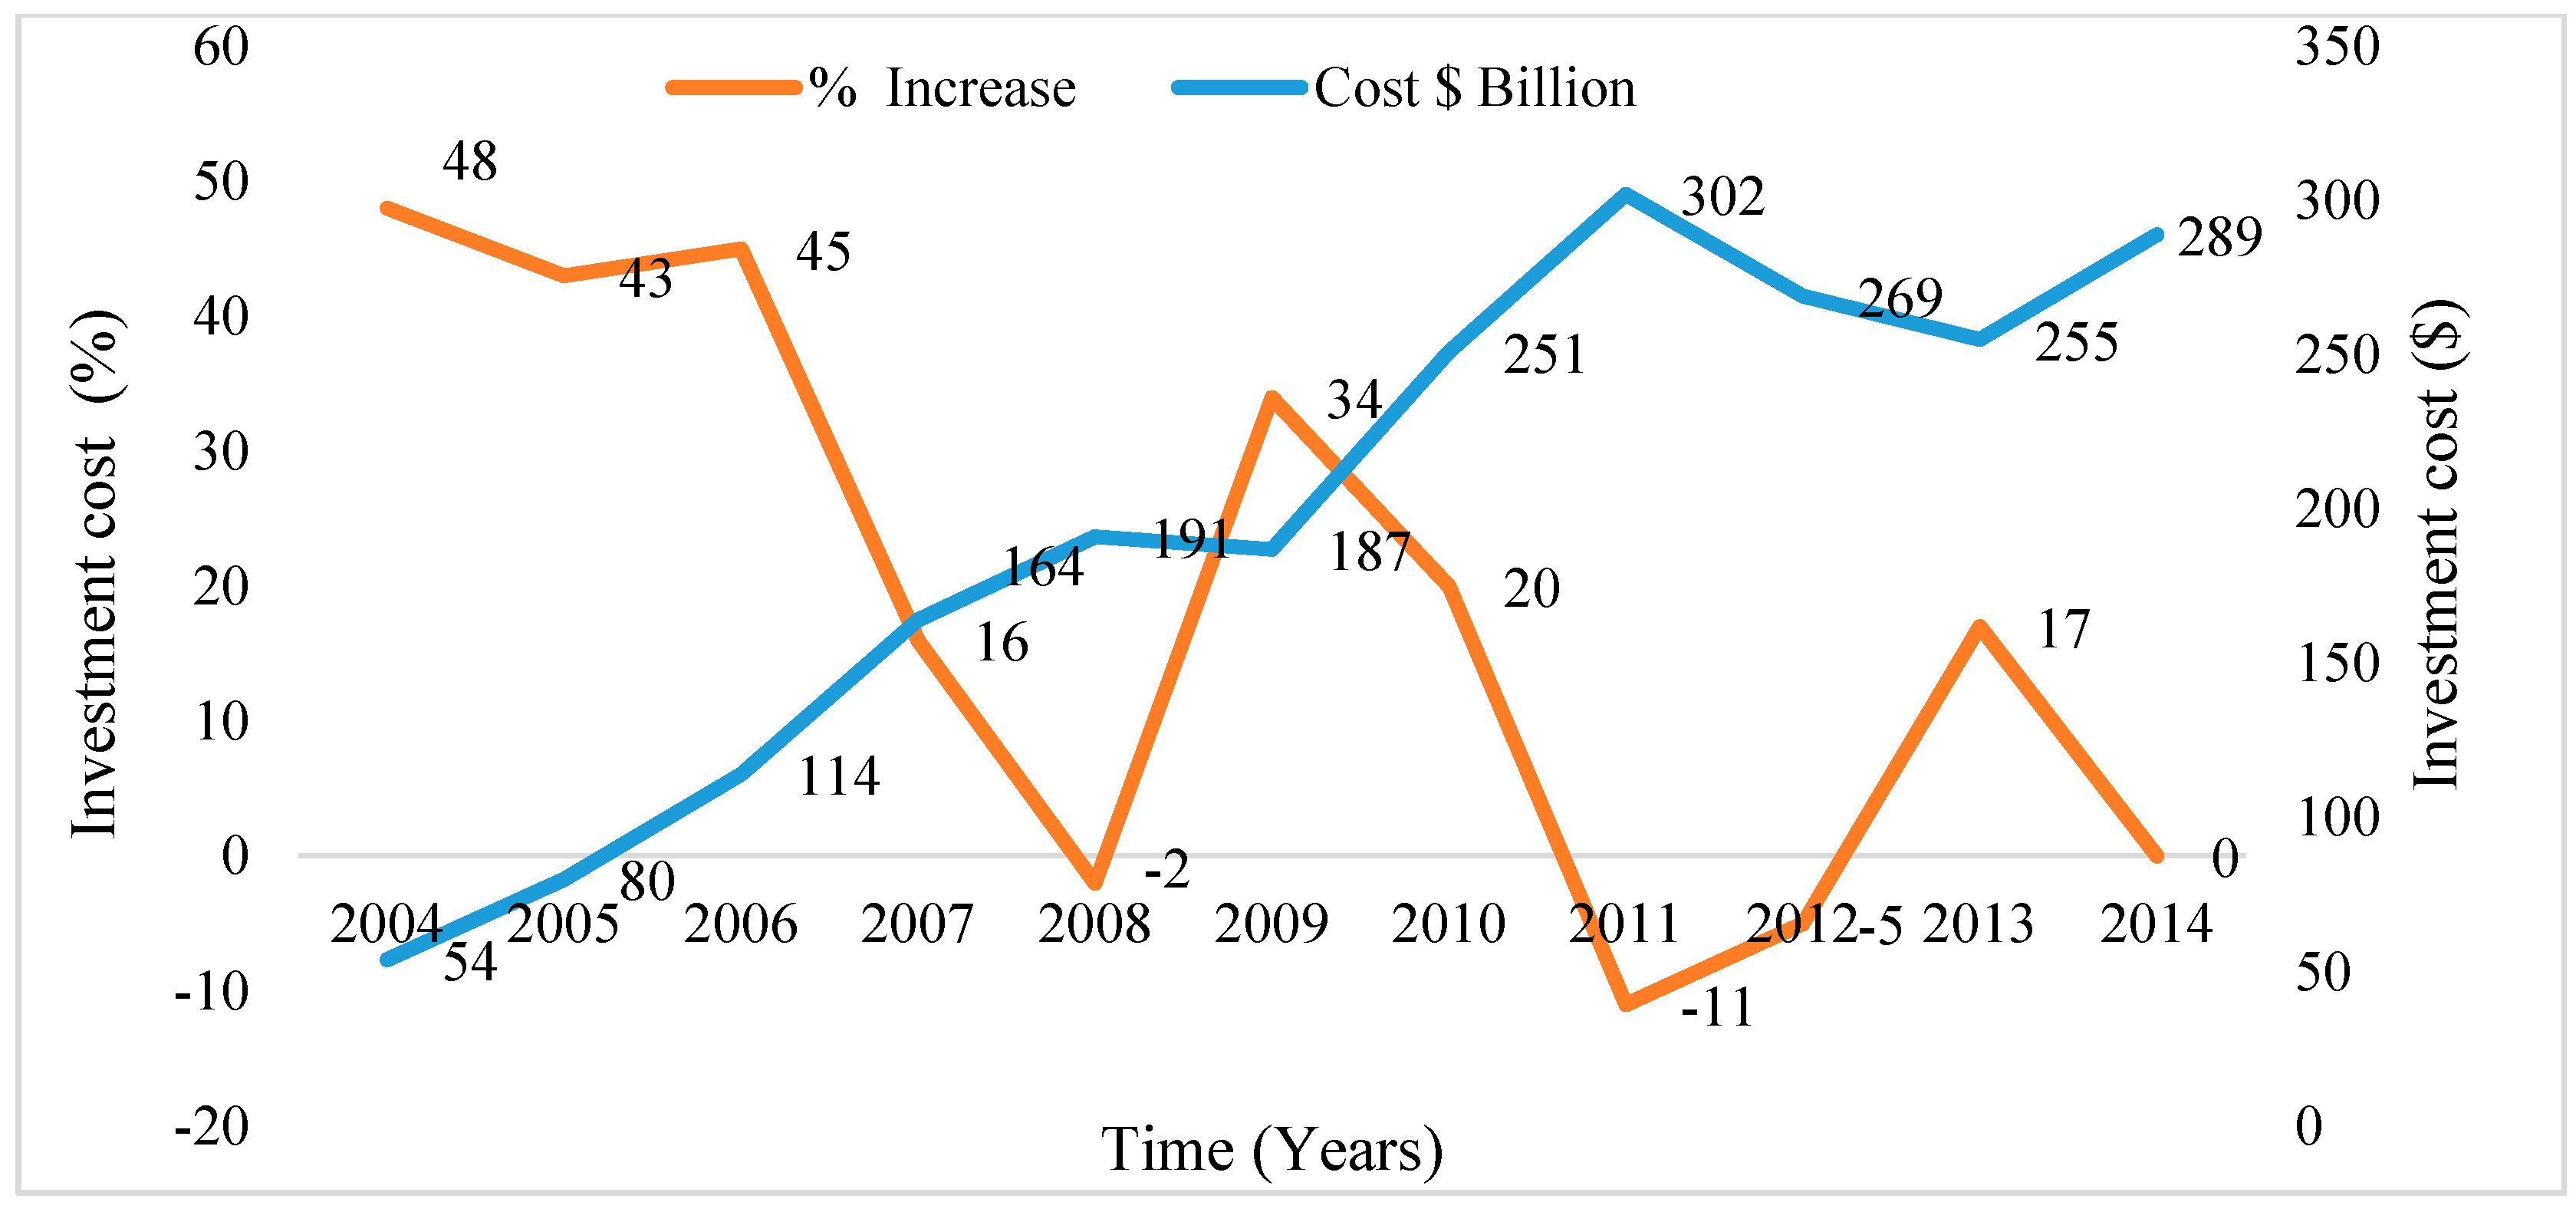
3. Global Investment in Green Energy
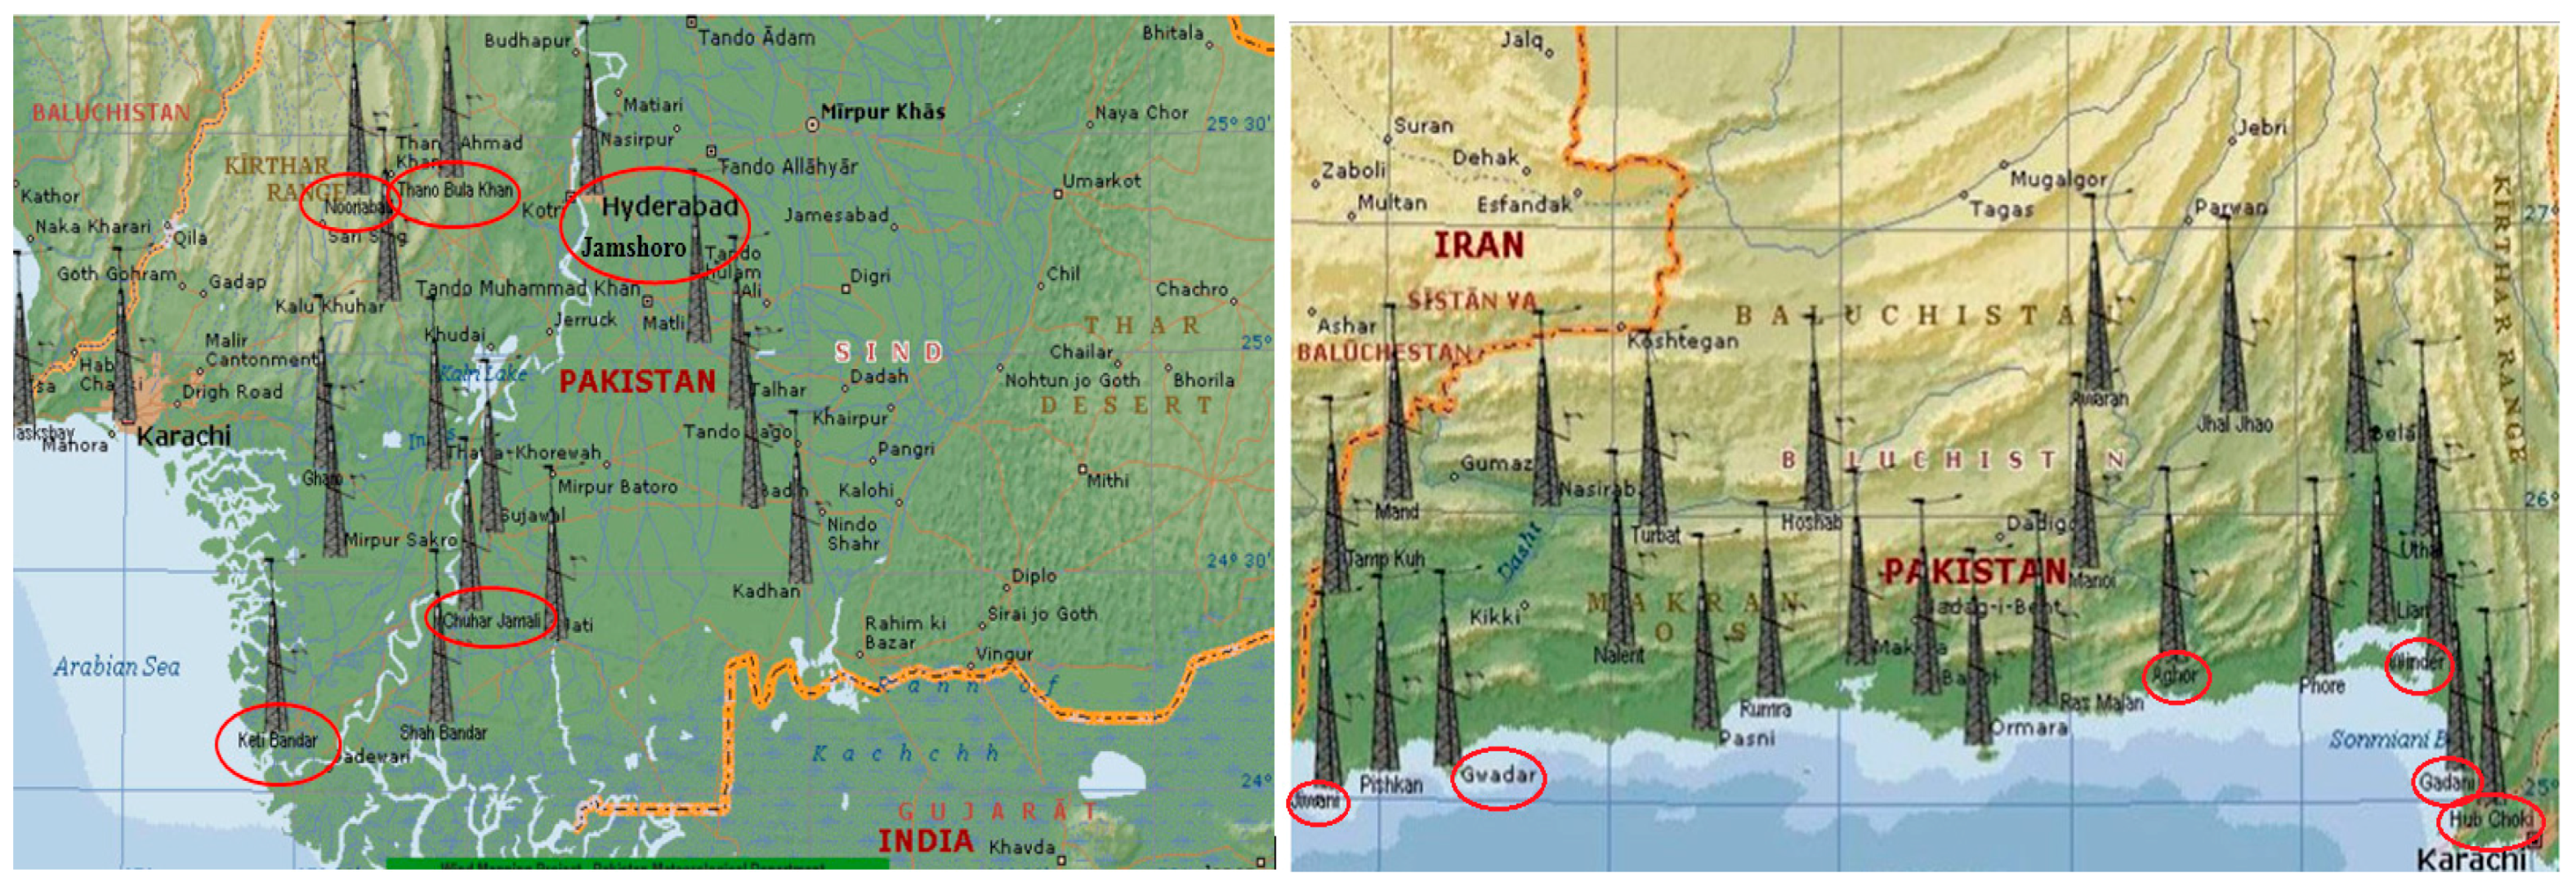
4. Proposed Sites for Wind Turbine Installation
- ❖
- The wind tower should be kept far away from the local barrier to the wind,
- ❖
- The selected area should be in the greater part of the zone regarding wind energy.
5. Theoretically Studies
5.1. Wind Potential Model
5.2. Average Wind Speed Deviation Model
5.3. Wind Power Density Model
5.4. International Standards of Wind Power Classification
5.5. Comparative Study of Proposed Sites with International Standards of Wind Power
5.6. Hypothetical Study of Wind Power
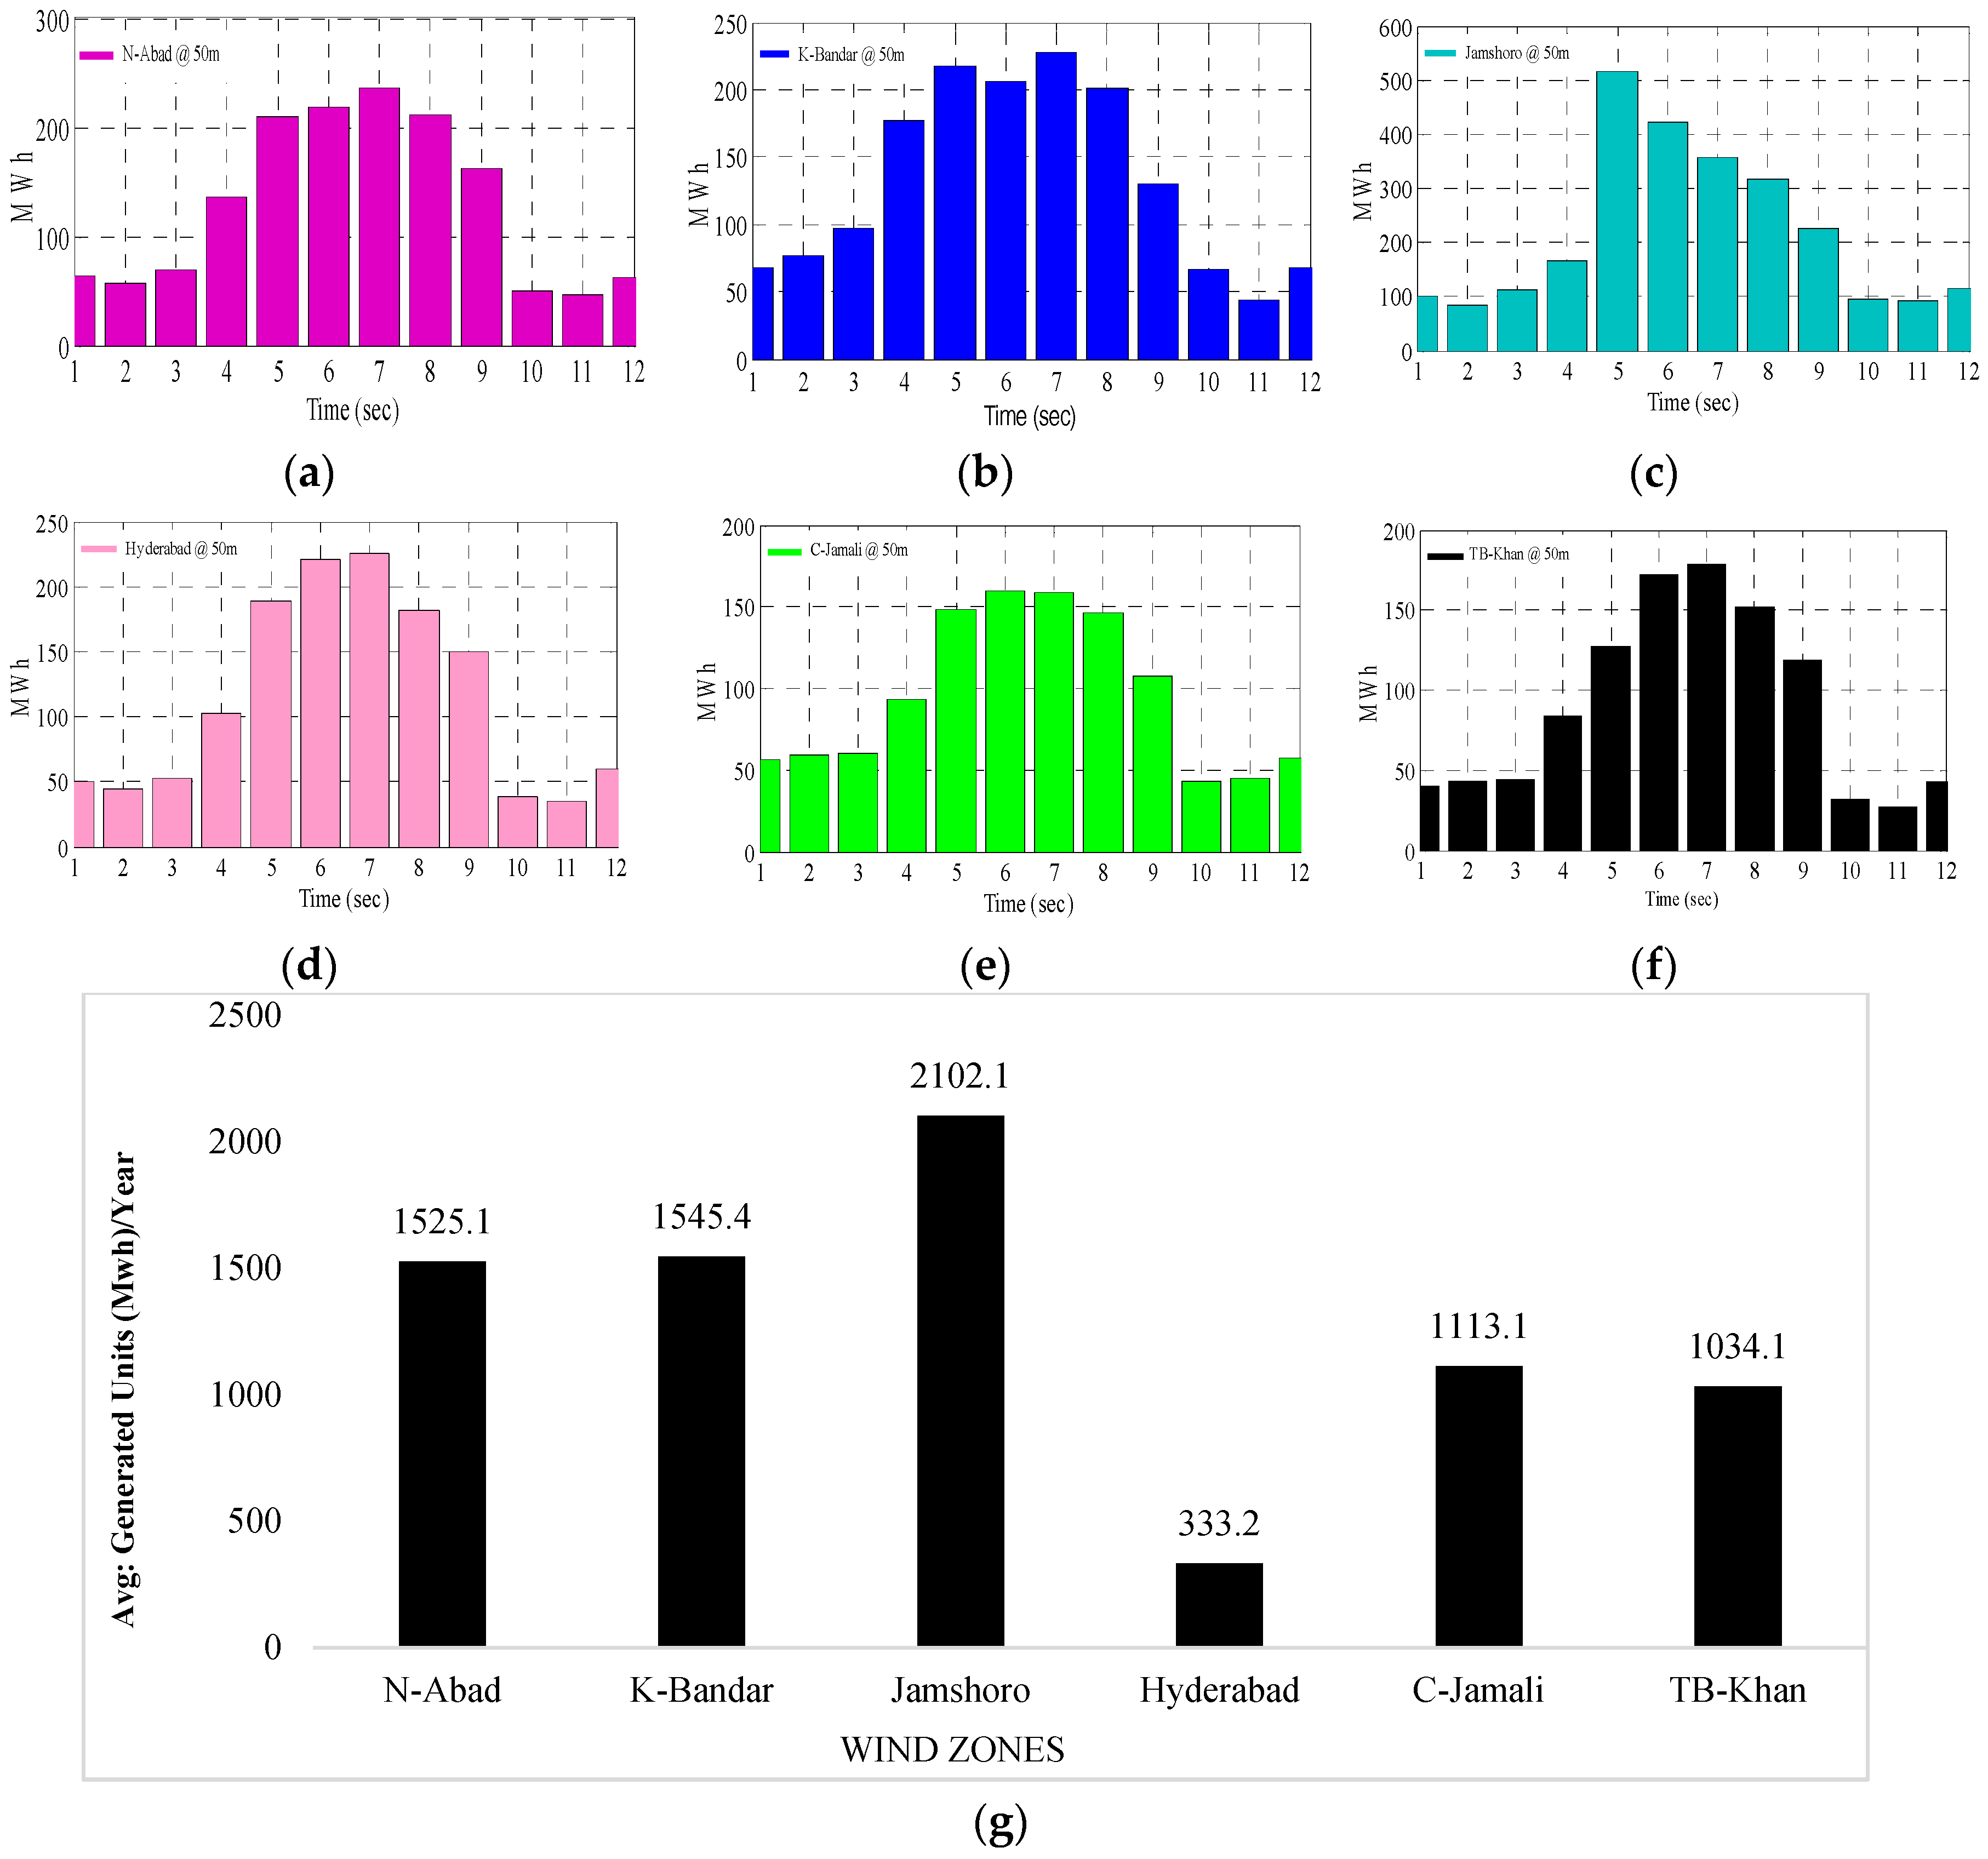
6. Result and Discussions
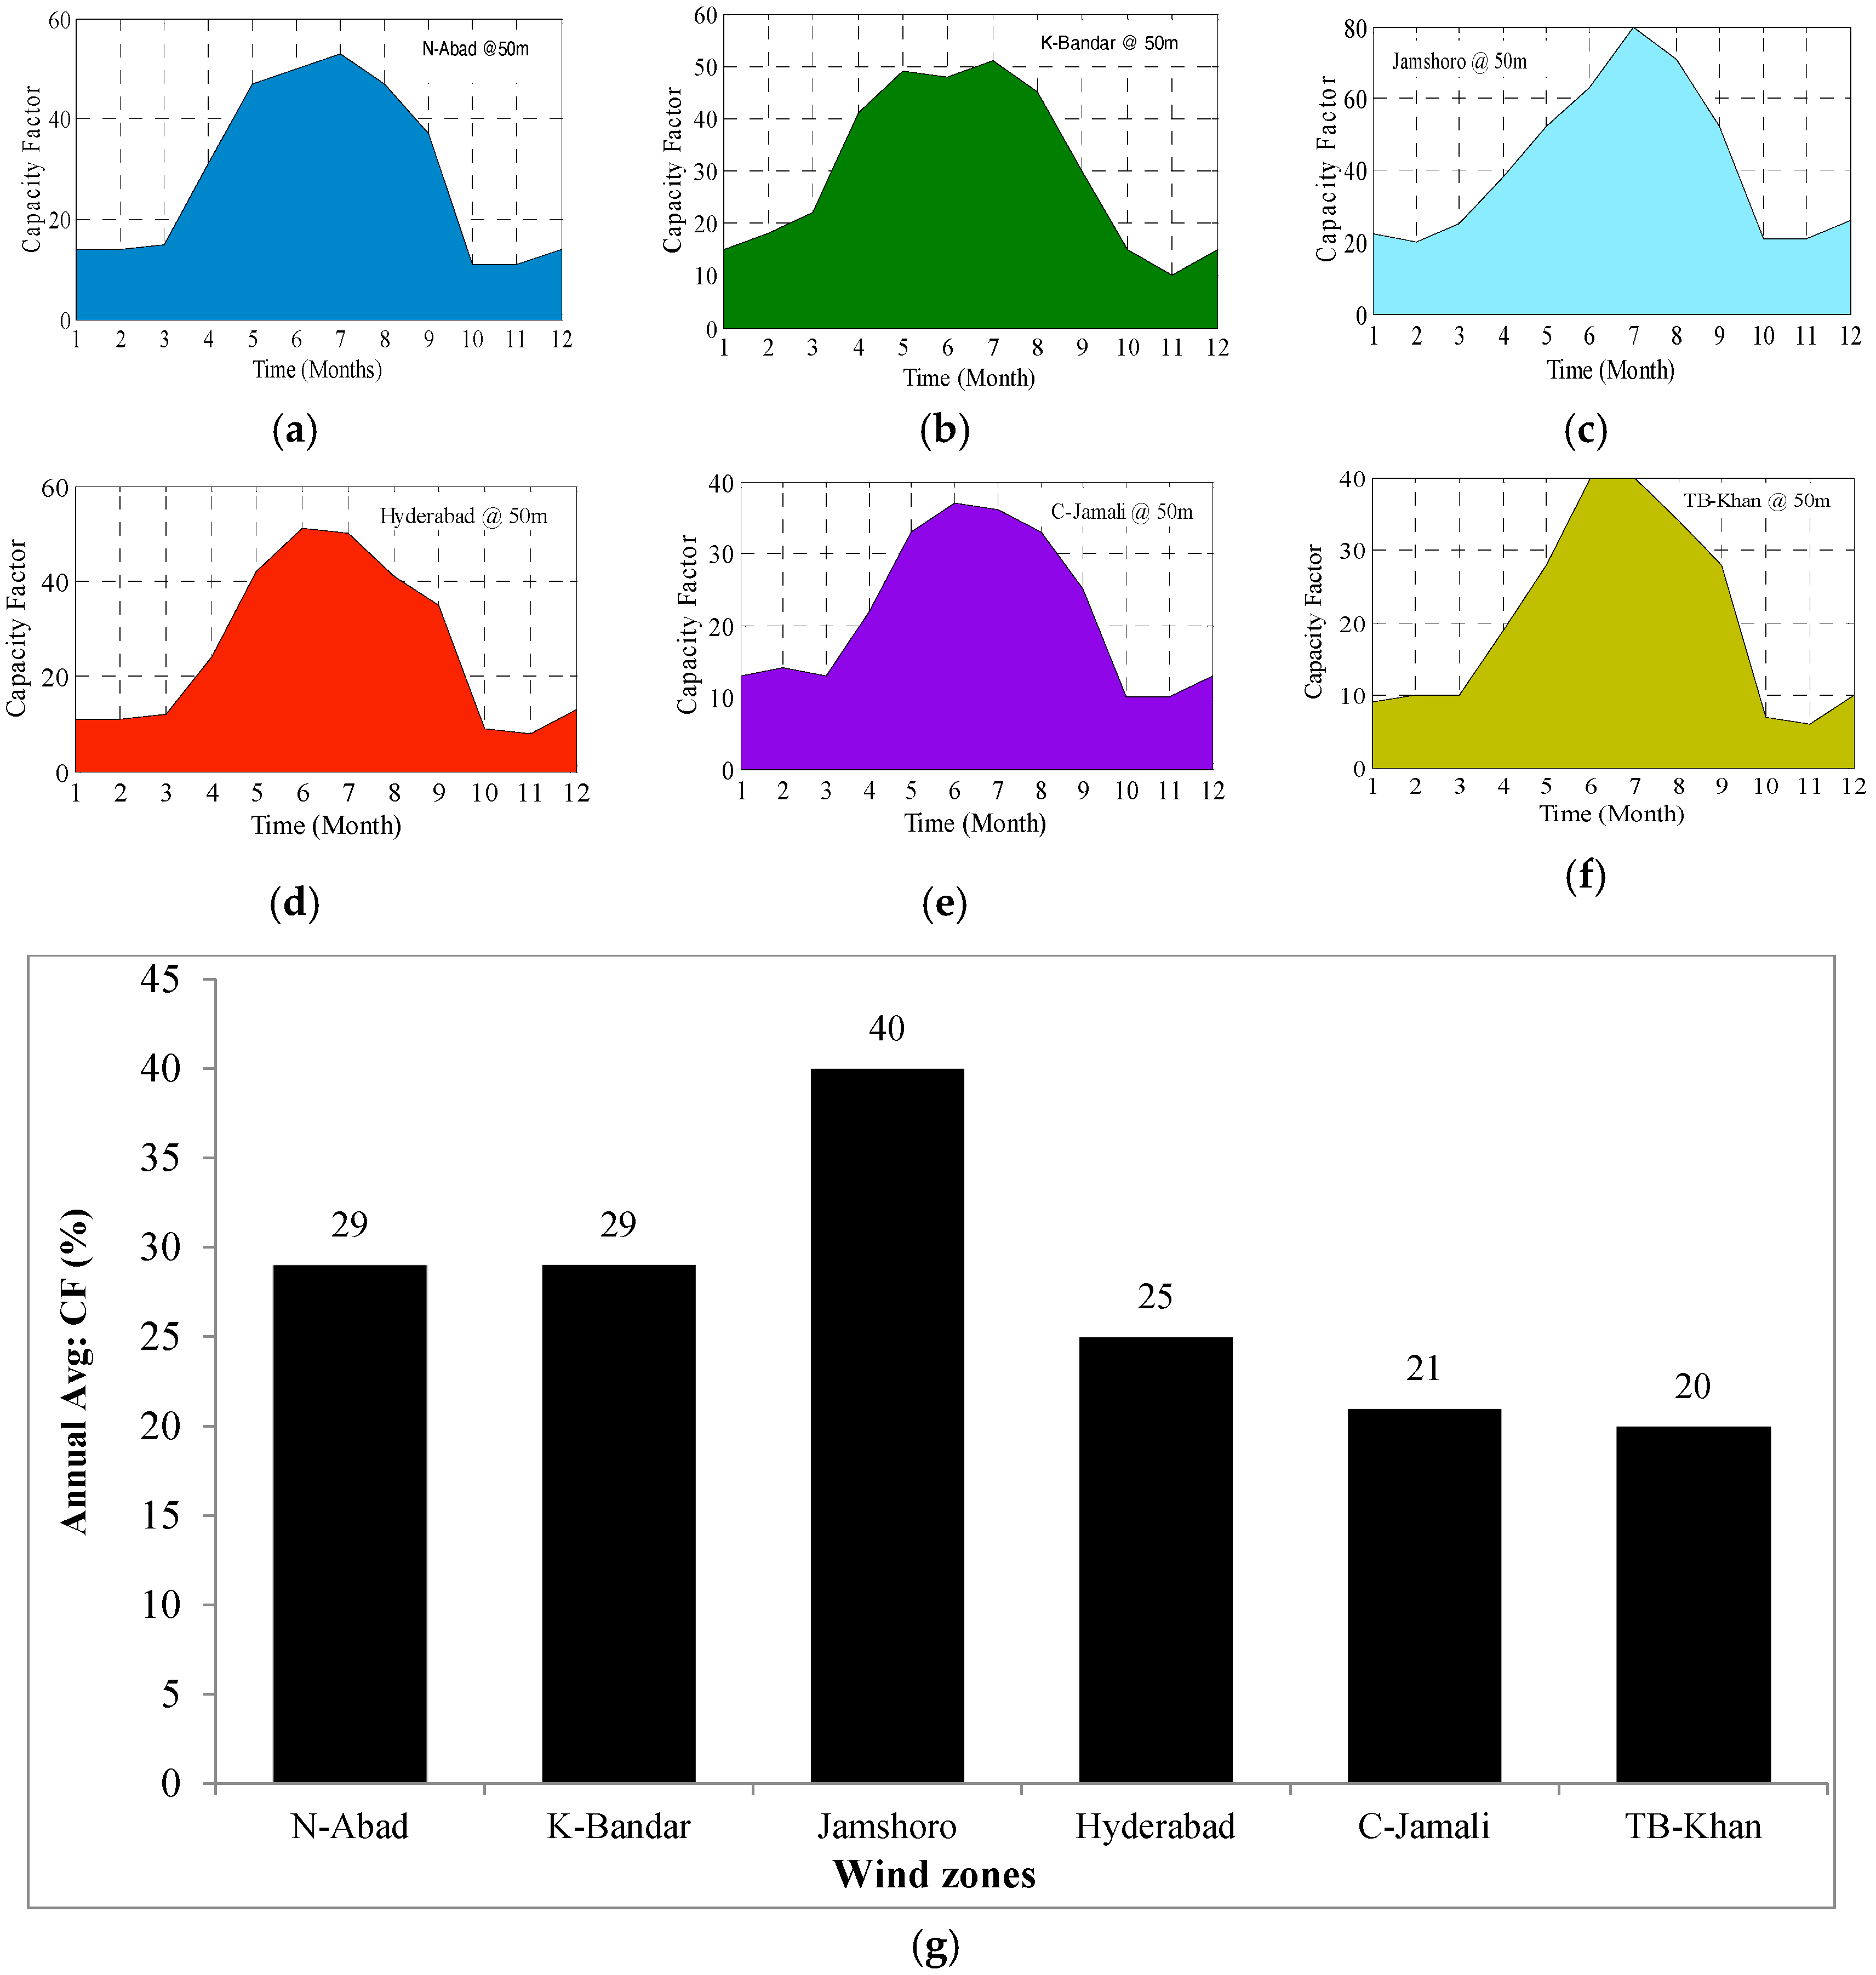
6.1 Proposed Site 1: Sindh
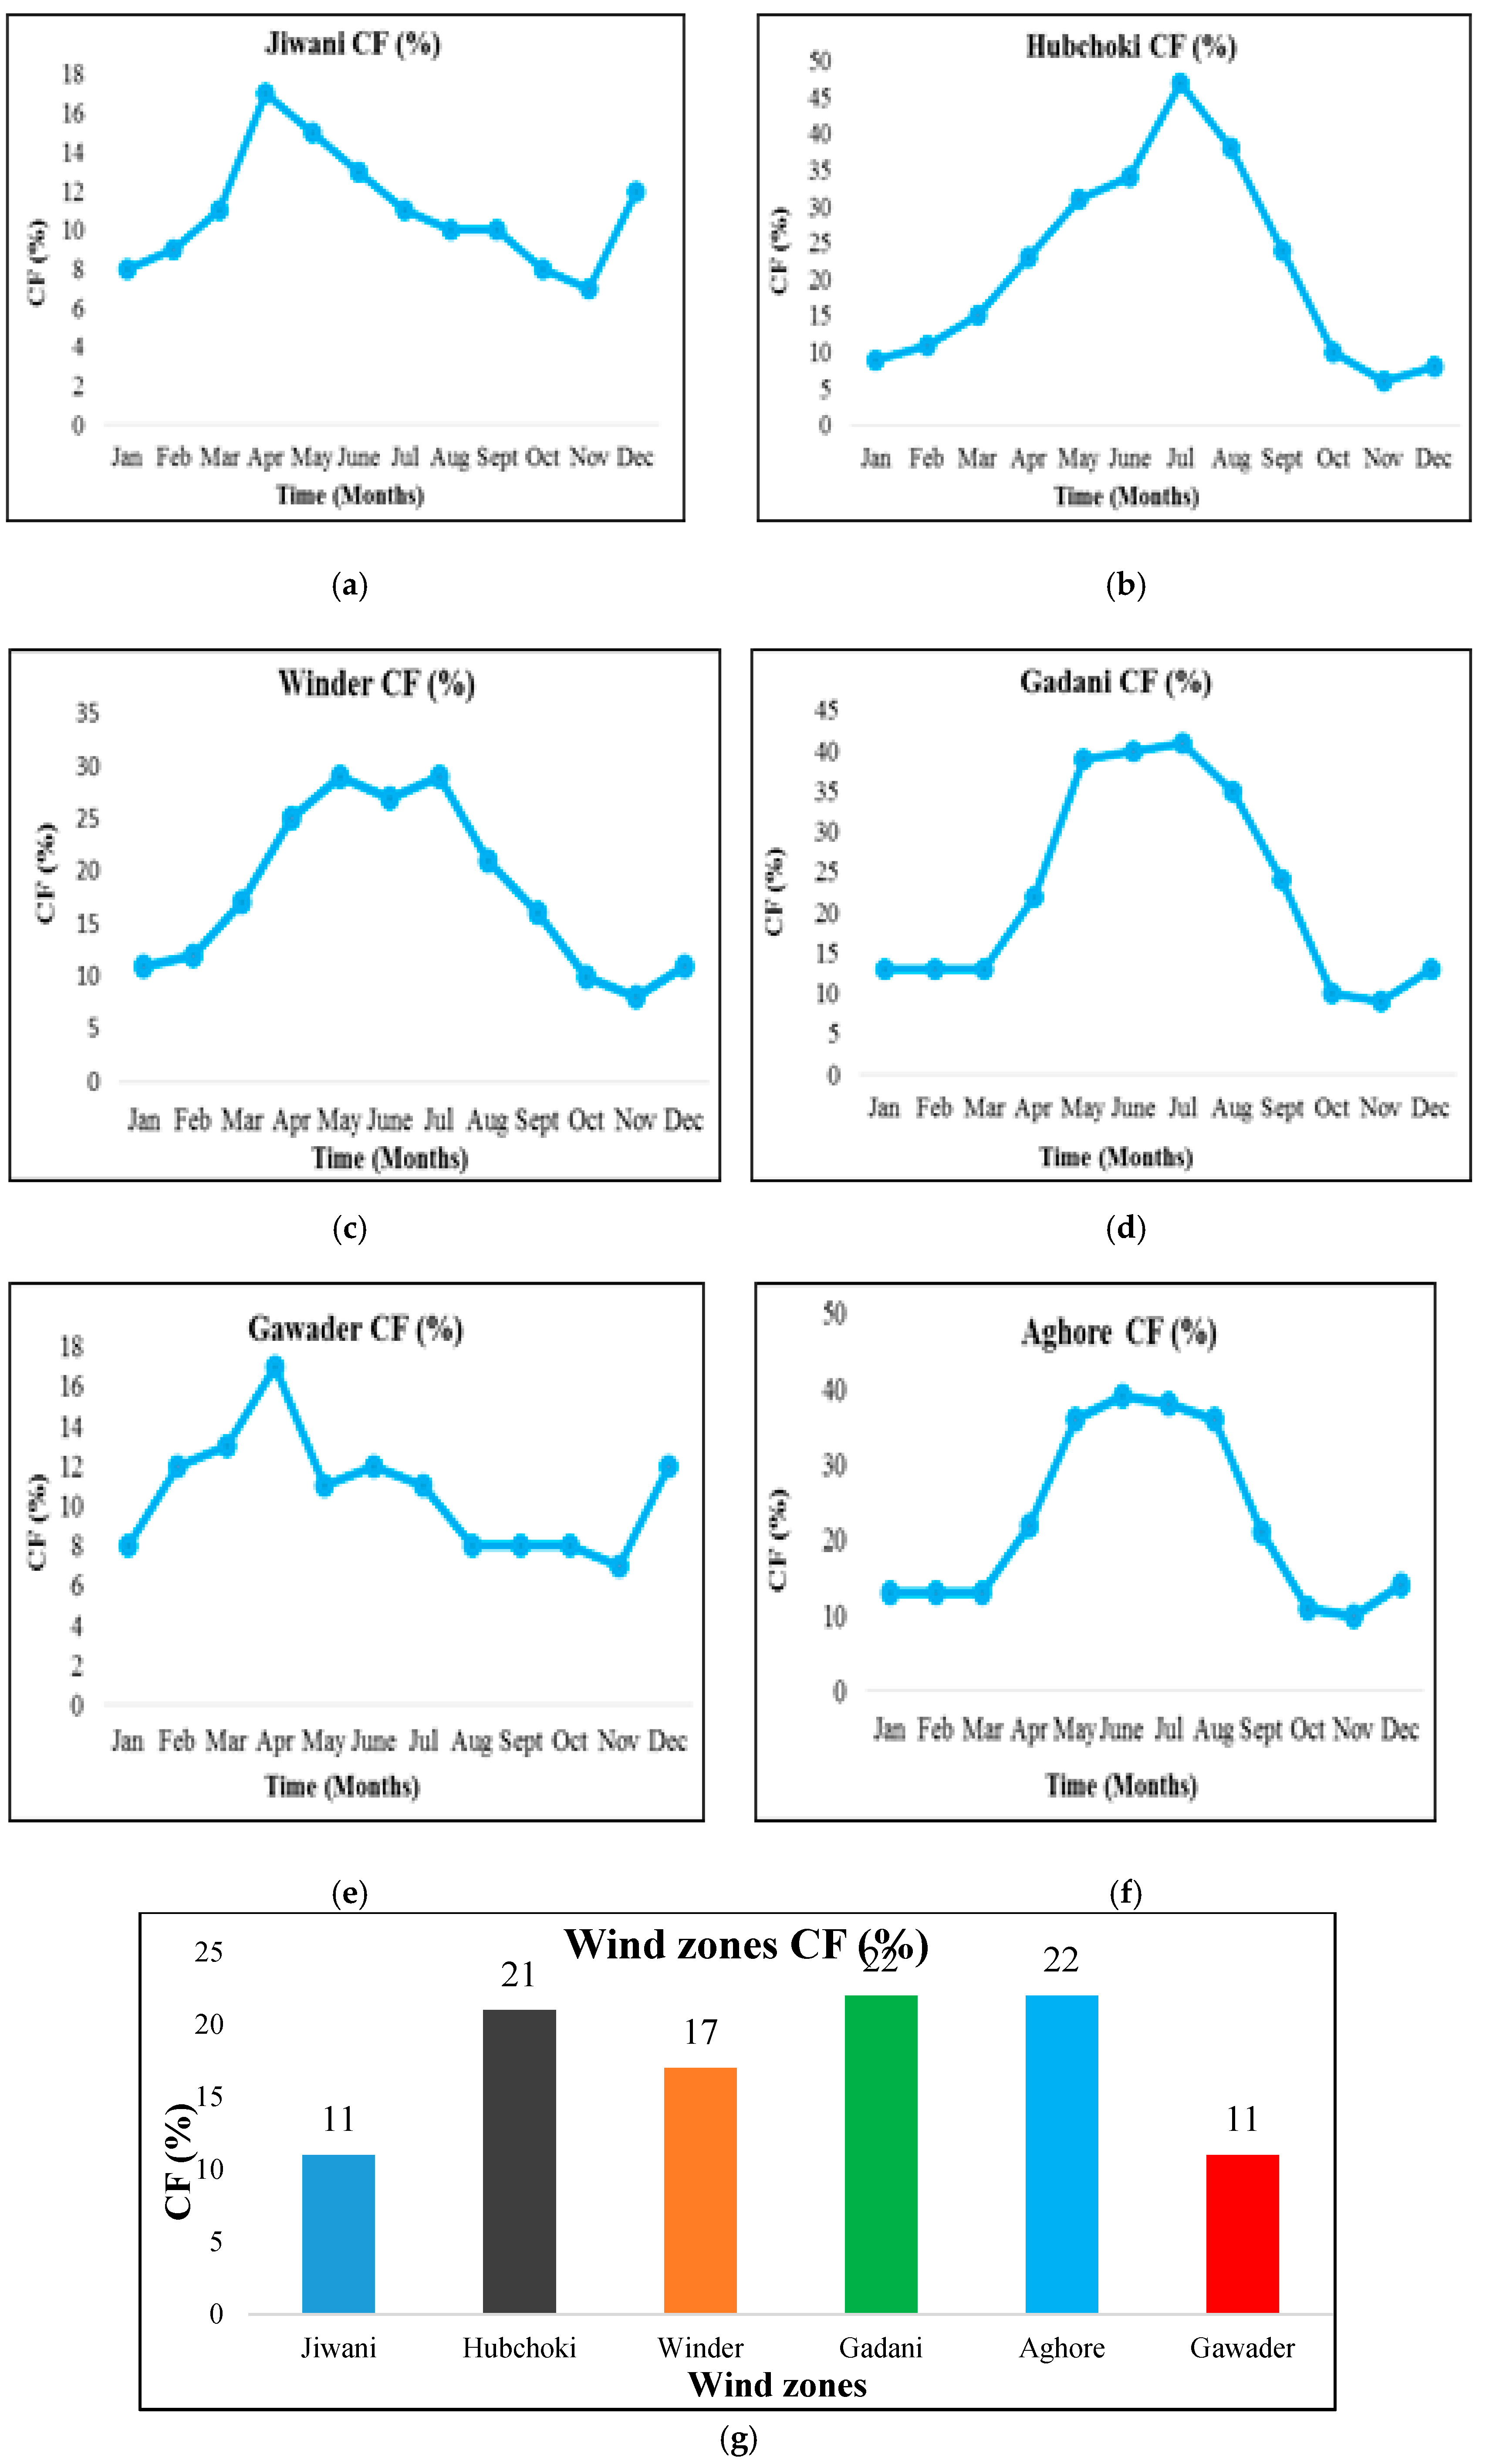
6.2 Proposed Sites 2: Baluchistan
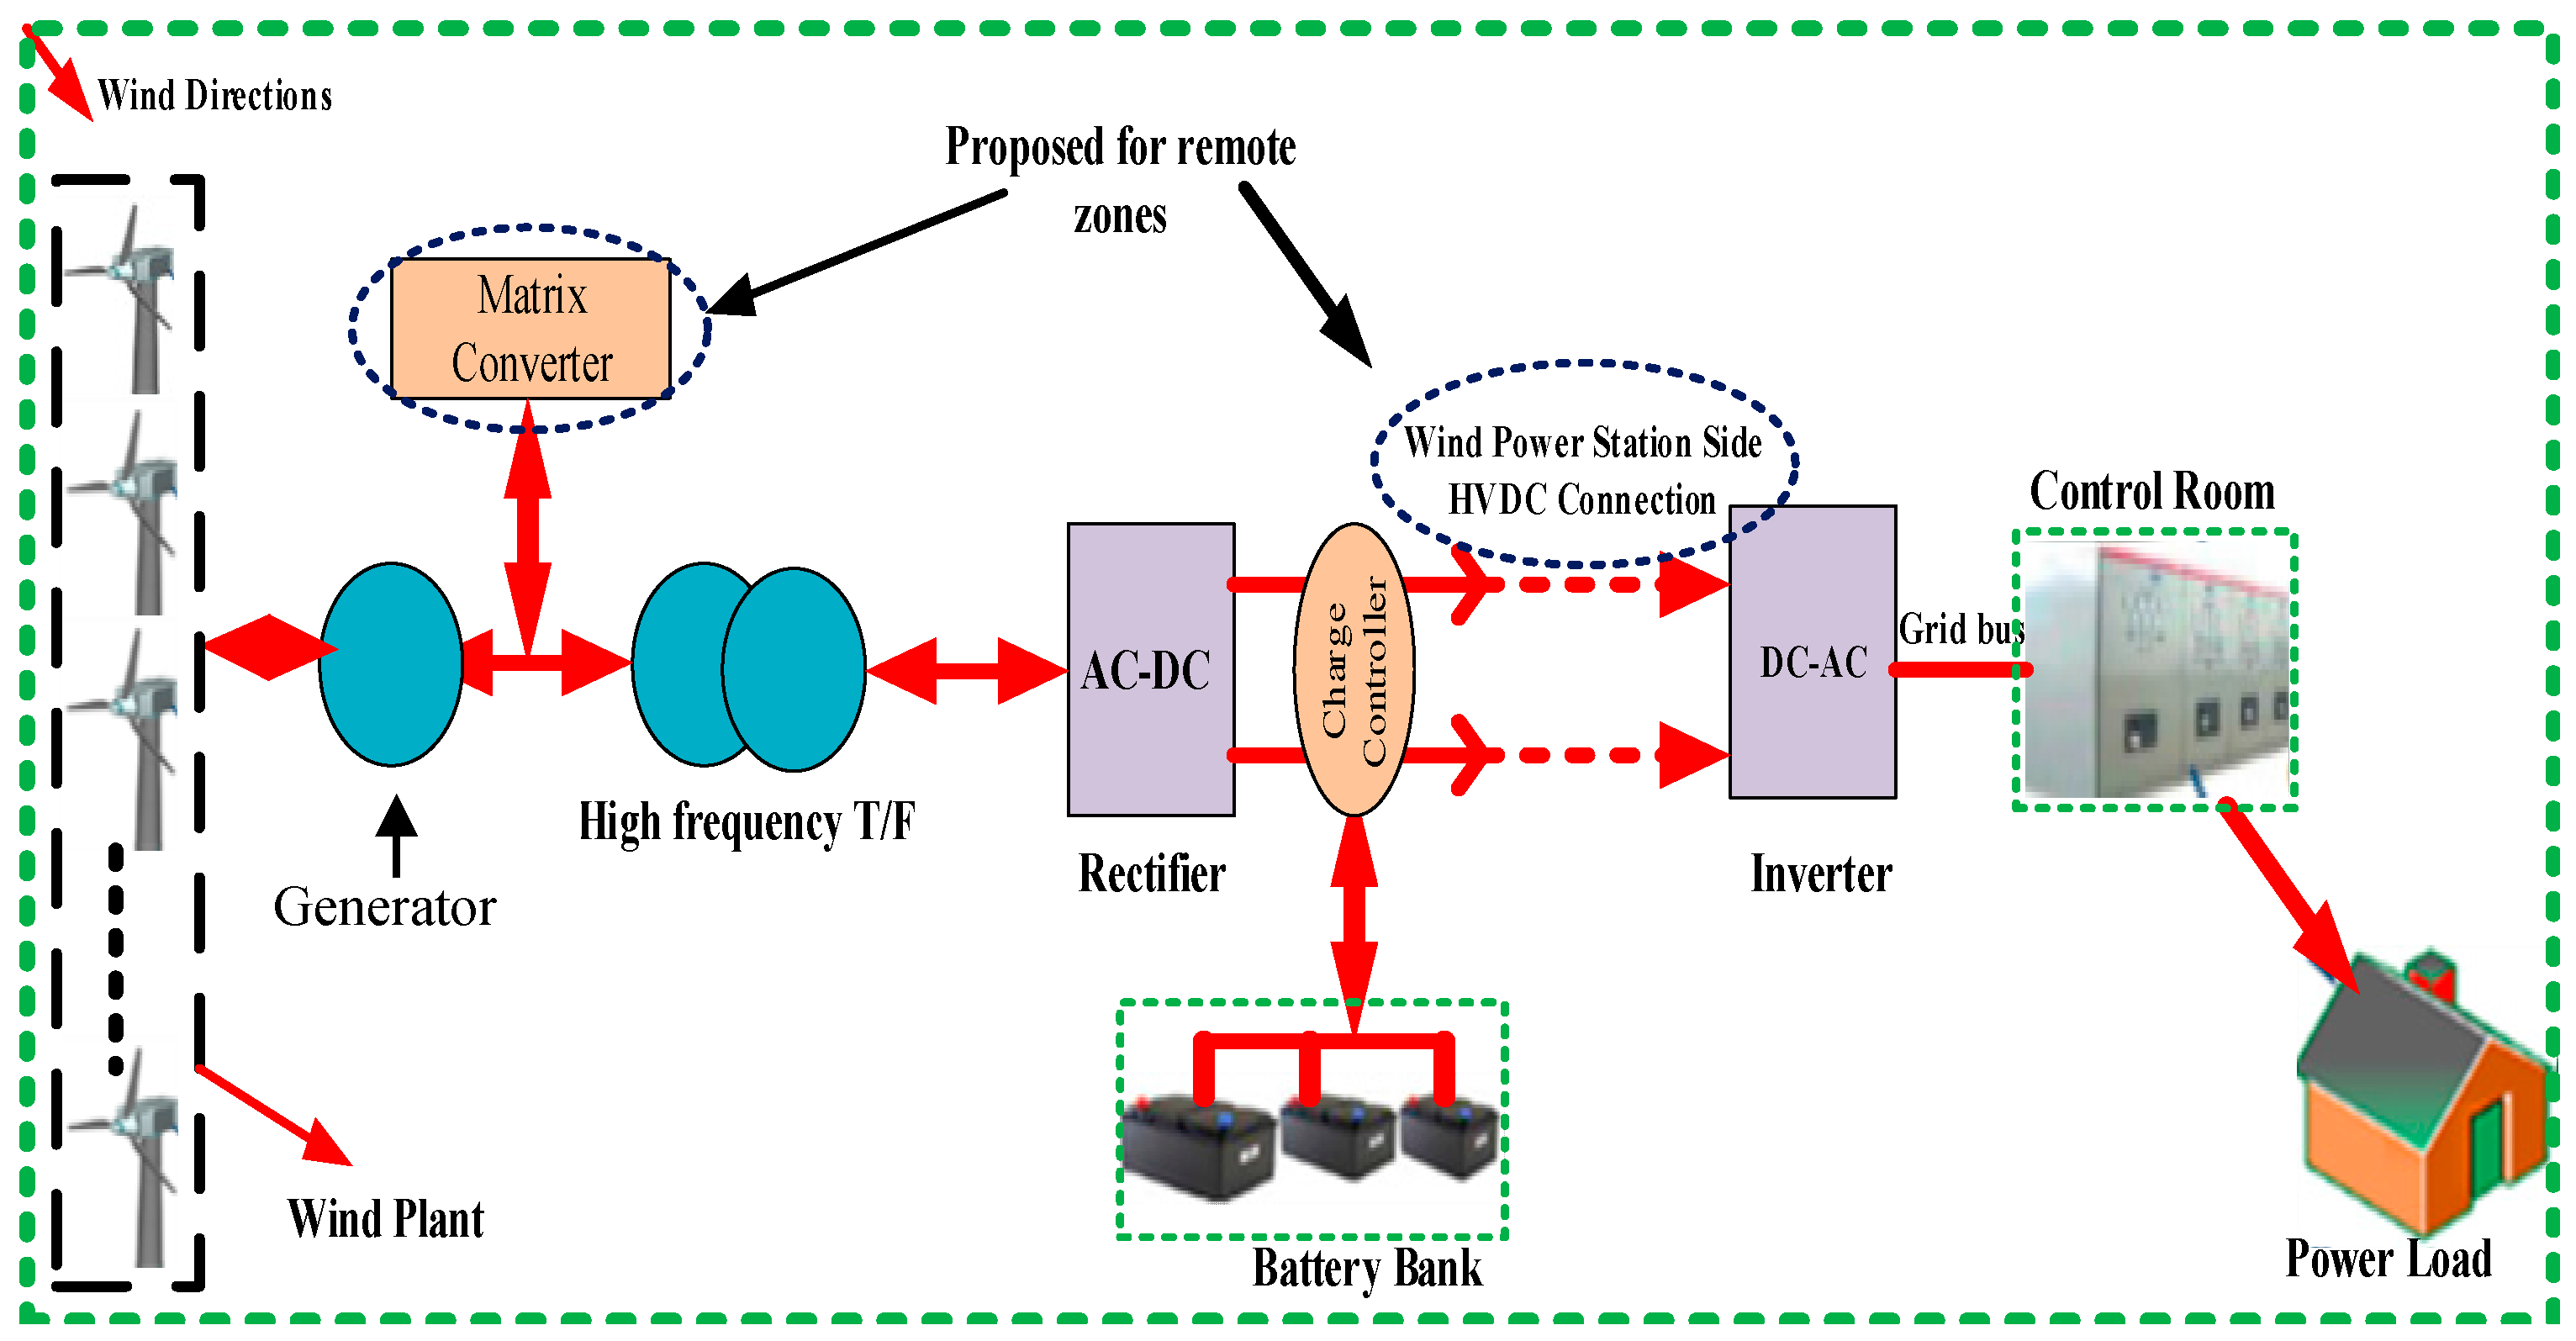
7. Proposing High Voltage Direct Current Transmission System for Remote Zones
8. The Proposed Wind Model Integration with a Country Central Power Network
9. Challenges Faced During Implementing of Wind Turbines
9.1. Initial Investment
9.2. Suitable Site Selection
9.3. Wind Output Power Quality
9.4. Low Frequency Noise
9.5. Benefits to the Electric Power Distribution Company (HESCO & QESCO) and Utility Consumers
- A rise in power production capacity.
- Reducing power losses in transmission lines.
- Reduced CO2 emission.
- Fresh and pollution restricted air.
- Extra trustworthy power.
- Decrease in electricity tariffs.
- A roadmap to the smart/micro network.
10. Various Incentives for Foreign Companies
- The available land for the eligible investors with an annual rent of 102 Pak Rs. (~1 US dollar)/sq. Yard/annum for the directly impacted area.
- A straight tariff rate of 16 Pak Rs. (~13.2 US cents) per electricity unit should be set for all investors, who are willing to complete their given tasks/projects in 1.5 years.
- A 20 years agreements for the power purchaser, i.e., water and power development authority (WAPDA) by GoP through Implementation Agreement & Sovereign Guarantee (IASG).
- A complete wide-range exposure to investors against the risk of change in rules through Force Majeure provisions and political risk.
- 5 years wind speed data is available from several GoP sources such as, PMD, that estimates the accurate performance, direction, density, and power of wind energy output.
- The implementation of complete wide-ranging tariff reles on a cost rated basis.
- Fiscal incentive/motivation through zero income tax, in which the solitary involvement of local exchequer will be given a 7.5% withholding tax on dividends declared across the life of the project.
11. Conclusions and Recommendations
- Monthly and annual average wind speed data from different wind stations are shown in Table A1 Considering WT classification, if the speed of wind of a given location is from 7.2 to 8 m/s and from 8 to 8.8 m/s at 30 m and 50 m hub-heights, respectively, such l location would excellent for the installation of WTs. It has been observed that the most suitable wind zone is the Jamshoro zone where the extreme and slightest speed of wind reaches approximately 13.9 m/s and 5 m/s at 50 m hub-heights.
- Electrical units generated from the six selected wind zones from both proposed sites are enough to overcome the electricity shortfall situation in the country which is around 6 GW.
- On an urgent basis, the GoP must focus on national energy strategy projects that are low cost and requires minimum completion time to tackle the electricity crisis issues and furnish the required power of the country.
- Conventional power plants are too old and have a power generation efficiency of 15%; thus, they should be maintained, and possible retrofits should be provided to enhance the power yield and to prevent technical and non-technical losses.
- Governing body systems of power companies (GENCO’S, NTDC, DISCOs) should be improved.
- Power theft and other non-technical losses on the electricity distribution side must be reduced.
- The GoS should coordinate with the GoP and related institutions to implement small home based windmill units in windy zones, especially in rural areas.
- 20% to 30% of losses are observed owing to the old and inefficient substructure of the power-grid, power-plants, and transmission/distribution lines, were observed. Following the global standards, these losses should be minimized.
- The GoP, should motivate and provide suitable incentives to foreign companies/investors to focus on time-based completion of, for example, wind and solar projects.
- The GoP should introduce research and development funds for alternative energy projects so that top-ranking national institutions and organisations can determine the best option in terms of introducing and disseminating the exploitation of alternative resources.
12. Future Research Directions
- Important future developments in the research must require an effective strategy of evaluating the accuracy of wind energy generation systems.
- Significant methods should be developed for predicting the wind speed.
- Various up-to-date algorithms for software based probabilistic interpretation is needed for future research objectives.
- More advanced software tools for sculpting, drawing, development, analysis, testing and justification of the abilities and modularity of a wind energy system should be integrated with the power-grid.
12.1. Proposed Solutions for Future Recommendation
12.1.1. Short-Term Solutions
- On an immediate basis, wind power plants must be installed. Because of their quick installation time and immense capacity in Southern Pakistan, a smooth flow of energy can be assured, and slight increases in the supply-demand gap can be prevented.
- Many power stations in the country are currently non-operational due to because of minor faults. These can be made operational by, with the help of a little investment, refitting and making technical enhancements. The immediate need is to revive these units to save the economy from destruction.
- Apart from the supply side, consumers also need to play their role in exterminating the crisis. In this context, the commercial sector must place limits on commercial centres, i.e., shopping malls, to close at 10 p.m. Energy saved in this way might transmit to other sectors of the economy.
- Power theft is correspondingly a major cause of electricity shortfall and needs immediate measures must be taken for its eradication.
- In agricultural and industrial sectors awareness campaigns should be initiated to adopt innovative and proficient techniques for conserving water and power utilization.
12.1.2. Long Term Solutions
- Pakistan ranks 3rd in the world in terms of coal assets, which are located in the southeastern region of Thar Desert (Sindh). Estimates suggest that that 33.0 trillion tons of coal is available in the Thar Desert. Pakistan’s electricity crisis can be overcome by exploiting coal reserves for electricity generation. This can be a long-term solution for electricity generation. This power production is more economical as compared to thermal power production based on other imported fuels. The analysis also depicts that a more 0.2% usage of Thar coal can generate 20 GW of electricity.
- To meet the increasing demand, another long-term measure is to construct more hydroelectric projects and nuclear plants in Pakistan. Several Chinese and Norwegian companies have asked the government to provide technical experts for consultation regarding the construction of dams. Apart from electricity generation, the creation of new water reservoirs would also be beneficial in terms of cutting-edge water storage, alleviating and growing problem of water shortage in the country.
- The foreign policy of the country should be managed according to its economic and energy requirements. As it plays a vital role in long-term planning and goals. The government of Pakistan needs to improve the relations and establish ties with energy-rich countries for technical advancement and financial investment in the power sector.
12.1.3. Renewable Energy Potential Solutions
- Biogas: Pakistan is primarily an agronomic state with adequate livestock. Therefore, the country has the prodigious potential for energy production from biogas. The assessed possibility of power generation by biogas is nearly 8.8 to 17.2 billion m3 (almost equals 55–106 TWh of energy, for meeting Pakistan’s existing overall power necessities). This demonstrates that approximately 5700 GWh, i.e., 6.6% of Pakistan existing power generation of electricity could be generated through biogas.
- Wind potential: Total potential for wind power generation is above 300,000 MW. To increase the generation of electricity and for meeting the demand, wind energy potential can be effectively exploited.
- Hydropower potential: The hydro power potential of Pakistan, documented until July 2016, is approximately 51,700 MW which is comprised of large hydropower sources.
- Solar Photo Voltaic potential: Pakistan is blessed with efficient insolation. Average solar radiation in Pakistan is 5 to 7 kWh per m2 per day; this solar irradiation is one of the best figures in the world in terms of solar power generation. Pakistan can produce over a million MW of photovoltaic (solar PV) electricity via integration with the country’s national grid of Pakistan, provided that there is suitable space for solar panel installation.
Acknowledgments
Author Contributions
Conflicts of Interest
Nomenclature
| kWh | Kilo watt hour |
| MWh | Megawatt hour |
| GWh | Gigawatt hour |
| HVDC | High voltage direct current |
| HVAC | High voltage alternating current |
| WECS | Wind energy conversion system |
| km | Kilo meter |
| GW | Gega watt |
| KESC | Karachi electric supply company |
| PEPCO | Pakistan electric power company |
| WAPDA | Water and power development company |
| NTDC | National transmission and dispatch company |
| IPPs | Independent power producers |
| GENCOS | Generation companies |
| DISCOS | Distribution companies |
| KANUPP | Karachi nuclear power plant |
| HESCO | Hyderabad electric supply company |
| QESCO | Quetta electric supply company |
| C02 | Carbon die emission |
| MW | Mega Watt |
| ADB | Asian development bank |
| TOE | Tonne of oil equivalent |
| TWh | Tera watt hour |
| NREL | National renewable energy laboratory |
| AET’s | Alternate energy technologies |
| VV | Variable voltage |
| VF | Variable frequency |
| VSC | Voltage source converter |
| IEC | International electro-technical commission |
| PMD | Pakistan metrological department |
| WT | Wind turbine |
| GoS | Government of Sindh |
| GoP | Government of Pakistan |
Appendix A

| Study Zones | January | February | March | April | May | June | July | August | September | October | November | December | Annual Avg |
|---|---|---|---|---|---|---|---|---|---|---|---|---|---|
| Table A1 (a) N-Abad @ 50 m Height | |||||||||||||
| Wind Speed (m/s) | 4.9 | 4.8 | 5 | 7.3 | 9.3 | 10.6 | 10.4 | 9.7 | 8.1 | 4.2 | 4.4 | 4.9 | 7 |
| Standard Deviation | 2.9 | 2.8 | 3 | 3.6 | 4 | 4.7 | 4.3 | 4 | 3.5 | 2.8 | 2.6 | 2.8 | 4.1 |
| Wind Power Density | 160 | 150 | 179 | 421 | 773 | 1028 | 981 | 784 | 508 | 130 | 116 | 153 | 454 |
| N-Abad @ 30 m Height | |||||||||||||
| Wind Speed (m/s) | 4.2 | 4.3 | 4.4 | 6.6 | 8.6 | 9.7 | 9.5 | 8.8 | 7.5 | 3.7 | 3.7 | 4.2 | 6.2 |
| Standard Deviation | 2.6 | 2.5 | 2.7 | 3.4 | 3.8 | 4.5 | 4.1 | 3.8 | 3.3 | 2.5 | 2.2 | 2.5 | 3.9 |
| Wind Power Density | 110 | 105 | 128 | 319 | 617 | 859 | 792 | 634 | 402 | 89 | 74 | 104 | 361 |
| N-Abad @ 10 m Height | |||||||||||||
| Wind Speed (m/s) | 3 | 3.2 | 3.3 | 5.3 | 7.2 | 7.9 | 7.8 | 7.3 | 6.3 | 2.6 | 2.5 | 2.9 | 5 |
| Standard Deviation | 2.4 | 2.3 | 2.5 | 2.9 | 3.2 | 3.7 | 3.3 | 3 | 2.7 | 2.2 | 2 | 2.4 | 3.4 |
| Wind Power Density | 69 | 67 | 83 | 183 | 366 | 500 | 454 | 360 | 240 | 52 | 43 | 69 | 221 |
| Table A1 (b) K-Bandar @ 50 m Height | |||||||||||||
| Wind Speed (m/s) | 4.9 | 5.7 | 6.2 | 8.4 | 9.3 | 9.3 | 10.2 | 8.8 | 7.2 | 5.1 | 4.4 | 5 | 7 |
| Standard Deviation | 3 | 3 | 2.7 | 2.7 | 3.4 | 3.6 | 4.3 | 3 | 2.6 | 3 | 2.4 | 2.9 | 3.6 |
| Wind Power Density | 172 | 207 | 240 | 494 | 711 | 716 | 930 | 583 | 336 | 171 | 103 | 169 | 360 |
| K-Bandar @ 30 m Height | |||||||||||||
| Wind Speed (m/s) | 4.1 | 4.7 | 5.1 | 7.4 | 8.3 | 8.4 | 9.1 | 8 | 6.5 | 4.2 | 3.5 | 4.2 | 6.1 |
| Standard Deviation | 2.5 | 2.6 | 2.3 | 2.6 | 3.2 | 3.3 | 4.1 | 2.7 | 2.4 | 2.7 | 1.8 | 2.5 | 3.4 |
| Wind Power Density | 103 | 131 | 137 | 336 | 522 | 534 | 724 | 429 | 235 | 112 | 51 | 103 | 281 |
| K-Bandar @ 10 m Height | |||||||||||||
| Wind Speed (m/s) | 2.8 | 3.1 | 3 | 5.5 | 6.9 | 7.1 | 7.3 | 6.4 | 5 | 2.6 | 1.8 | 2.8 | 4.5 |
| Standard Deviation | 2.2 | 2.4 | 2.4 | 2.4 | 2.6 | 3.1 | 3.3 | 2.2 | 2.1 | 2.4 | 1.6 | 2.3 | 3.1 |
| Wind Power Density | 56 | 67 | 67 | 160 | 292 | 343 | 389 | 218 | 123 | 67 | 20 | 61 | 163 |
| Table A1 (c) Jamshoro @ 50 m Height | |||||||||||||
| Wind Speed (m/s) | 5 | 5.6 | 6.3 | 8.3 | 10.1 | 12.1 | 13.9 | 12.5 | 9.8 | 5.9 | 5.8 | 6.5 | 8.5 |
| Standard Deviation | 3.4 | 3.5 | 3.9 | 4.2 | 4.4 | 4.8 | 3.5 | 4 | 3.8 | 3.5 | 3.5 | 3.3 | 4.7 |
| Wind Power Density | 277 | 261 | 373 | 644 | 1008 | 1619 | 2102 | 1607 | 859 | 280 | 275 | 315 | 771 |
| Jamshoro @ 30 m Height | |||||||||||||
| Wind Speed (m/s) | 3.7 | 4.4 | 5 | 6.7 | 8.4 | 10.2 | 11.6 | 10.3 | 8.2 | 4.5 | 4.3 | 4.9 | 6.9 |
| Standard Deviation | 2.6 | 2.7 | 3 | 3.4 | 3.6 | 4.1 | 2.9 | 3.2 | 3.1 | 2.6 | 2.4 | 2.4 | 3.9 |
| Wind Power Density | 128 | 125 | 180 | 341 | 578 | 985 | 1246 | 908 | 499 | 125 | 106 | 136 | 423 |
| Jamshoro @ 10 m Height | |||||||||||||
| Wind Speed (m/s) | 2.4 | 2.5 | 2.7 | 4 | 5.4 | 6.7 | 7.7 | 6.7 | 5.4 | 2.3 | 1.9 | 2.4 | 4.2 |
| Standard Deviation | 1.7 | 1.8 | 1.9 | 2.2 | 2.6 | 2.8 | 2 | 2.1 | 2.3 | 1.7 | 1.3 | 1.6 | 3.1 |
| Wind Power Density | 27 | 29 | 39 | 81 | 162 | 284 | 353 | 243 | 144 | 26 | 14 | 24 | 160 |
| Table A1 (d) Hyderabad @ 50 m Height | |||||||||||||
| Wind Speed (m/s) | 4.4 | 4.4 | 4.3 | 6.5 | 8.9 | 10 | 9.9 | 8.5 | 7.8 | 3.9 | 3.9 | 4.8 | 6.4 |
| Standard Deviation | 2.6 | 2.6 | 2.9 | 3 | 3.9 | 4 | 4 | 3 | 2.9 | 2.5 | 2.4 | 2.8 | 3.9 |
| Wind Power Density | 121 | 114 | 137 | 283 | 687 | 908 | 887 | 532 | 427 | 96 | 88 | 150 | 372 |
| Hyderabad @ 30 m Height | |||||||||||||
| Wind Speed (m/s) | 3.6 | 3.6 | 3.6 | 5.6 | 7.8 | 8.8 | 8.8 | 7.5 | 6.9 | 3.2 | 3.2 | 3.8 | 5.5 |
| Standard Deviation | 2.2 | 2.2 | 2.4 | 2.7 | 3.6 | 3.6 | 3.7 | 2.8 | 2.6 | 2.1 | 2 | 2.2 | 3.5 |
| Wind Power Density | 69 | 68 | 82 | 184 | 474 | 644 | 635 | 373 | 290 | 55 | 48 | 75 | 264 |
| Hyderabad @ 10 m Height | |||||||||||||
| Wind Speed | 2.2 | 2.3 | 2.1 | 4 | 5.7 | 6.7 | 6.5 | 5.8 | 5.2 | 1.9 | 1.8 | 1.9 | 3.8 |
| Standard Deviation | 1.9 | 1.9 | 2.1 | 2.3 | 2.8 | 2.8 | 2.7 | 2.3 | 2.2 | 1.9 | 1.7 | 1.9 | 2.9 |
| Wind Power Density | 35 | 34 | 46 | 84 | 202 | 277 | 265 | 175 | 134 | 32 | 25 | 35 | 123 |
| Table A1 (e) Chuhar Jamali @ 50 m Height | |||||||||||||
| Wind Speed (m/s) | 4.4 | 4.9 | 4.3 | 5.9 | 7.6 | 8 | 7.9 | 7.5 | 6.5 | 3.9 | 4.1 | 4.7 | 5.8 |
| Standard Deviation | 2.9 | 2.8 | 3.3 | 3.5 | 3.3 | 3.4 | 3.5 | 3.1 | 3.3 | 2.8 | 2.8 | 2.7 | 3.5 |
| Wind Power Density | 144 | 158 | 176 | 285 | 432 | 504 | 450 | 404 | 310 | 113 | 118 | 139 | 276 |
| Chuhar Jamali @ 30 m Height | |||||||||||||
| Wind Speed (m/s) | 3.9 | 4 | 3.6 | 5.1 | 6.6 | 7.1 | 6.9 | 6.4 | 5.3 | 3.1 | 3.3 | 3.9 | 5 |
| Standard Deviation | 2.4 | 2.4 | 2.8 | 3 | 2.9 | 3.2 | 3.1 | 2.9 | 2.6 | 2.3 | 2.3 | 2.3 | 3 |
| Wind Power Density | 88 | 92 | 116 | 185 | 290 | 353 | 329 | 266 | 160 | 65 | 67 | 85 | 177 |
| Chuhar Jamali @ 10 m Height | |||||||||||||
| Wind Speed (m/s) | 2.8 | 2.6 | 2.6 | 3.9 | 5.1 | 5.5 | 5.3 | 4.5 | 3 | 1.6 | 1.7 | 2.4 | 3.4 |
| Standard Deviation | 3 | 2.8 | 2.8 | 3.2 | 3.1 | 3.4 | 3.2 | 3.7 | 3.1 | 2.4 | 2.3 | 2.7 | 3.2 |
| Wind Power Density | 153 | 114 | 115 | 160 | 186 | 240 | 211 | 266 | 156 | 103 | 84 | 100 | 168 |
| Table A1 (f) TB-Khan @ 50 m Height | |||||||||||||
| Wind Speed (m/s) | 3.3 | 3.6 | 2.6 | 5.3 | 6.8 | 8.6 | 8.5 | 7.6 | 6.8 | 2.3 | 2.4 | 3.3 | 5.1 |
| Standard Deviation | 2.8 | 3 | 3.3 | 4 | 4.7 | 4.3 | 4.4 | 3.8 | 3.6 | 2.7 | 2.5 | 3 | 4.2 |
| Wind Power Density | 118 | 134 | 233 | 323 | 571 | 683 | 705 | 502 | 376 | 118 | 87 | 127 | 374 |
| TB-Khan @ 30 m Height | |||||||||||||
| Wind Speed (m/s) | 2.6 | 3 | 2.1 | 4.4 | 5.8 | 7.4 | 7.4 | 6.5 | 5.7 | 1.8 | 1.8 | 2.7 | 4.3 |
| Standard Deviation | 2.4 | 2.6 | 2.7 | 3.4 | 4.1 | 3.8 | 4 | 3.4 | 3.1 | 2.2 | 2.1 | 2.5 | 3.7 |
| Wind Power Density | 65 | 82 | 125 | 196 | 375 | 460 | 486 | 319 | 227 | 62 | 47 | 75 | 243 |
| TB-Khan @ 10 m Height | |||||||||||||
| Wind Speed | 1.6 | 1.9 | 1.4 | 2.8 | 4.4 | 5.4 | 5.7 | 4.9 | 3.8 | 1 | 1.1 | 1.6 | 3 |
| Standard Deviation | 1.9 | 2 | 2 | 2.6 | 3.1 | 2.9 | 3.1 | 2.6 | 2.5 | 1.6 | 1.6 | 2 | 2.9 |
| Wind Power Density | 39 | 40 | 55 | 85 | 162 | 189 | 231 | 138 | 95 | 32 | 30 | 49 | 117 |
| Study Zones | January | February | March | April | May | June | July | August | September | October | November | December | Annual Avg |
|---|---|---|---|---|---|---|---|---|---|---|---|---|---|
| Table A2 (a) Gadani @ 50 m Height | |||||||||||||
| Wind Speed (m/s) | 4.5 | 4.7 | 4.9 | 6.3 | 8.2 | 8.5 | 8.6 | 7.7 | 6.6 | 3.9 | 3.8 | 4.7 | 6.0 |
| Standard Deviation | 2.9 | 2.9 | 2.6 | 2.9 | 3.1 | 3.7 | 3.7 | 2.9 | 2.7 | 2.8 | 2.7 | 2.8 | 3.5 |
| Wind Power Density | 144.9 | 148.1 | 138.3 | 249.9 | 498.6 | 593.8 | 612.1 | 417.7 | 269.6 | 118.1 | 103.7 | 146.6 | 287.8 |
| Gadani @ 30 m Height | |||||||||||||
| Wind Speed (m/s) | 3.3 | 3.5 | 3.8 | 5.2 | 7.0 | 7.2 | 7.2 | 6.6 | 5.6 | 2.9 | 2.7 | 3.4 | 4.9 |
| Standard Deviation | 2.1 | 2.2 | 2.1 | 2.5 | 2.9 | 3.3 | 3.3 | 2.7 | 2.4 | 2.1 | 1.9 | 2.1 | 3.0 |
| Wind Power Density | 58.6 | 68.5 | 69.7 | 148.7 | 320.2 | 380.1 | 380.9 | 267.3 | 169.8 | 51.6 | 39.1 | 59.5 | 170.5 |
| Gadani @ 10 m Height | |||||||||||||
| Wind Speed (m/s) | 0.9 | 1.1 | 1.5 | 1.3 | 4.9 | 5.0 | 4.8 | 4.6 | 3.7 | 0.8 | 0.5 | 0.9 | 2.7 |
| Standard Deviation | 1.4 | 1.7 | 1.9 | 2.5 | 2.5 | 2.6 | 2.5 | 2.3 | 2.3 | 1.4 | 1 | 1.4 | 2.6 |
| Wind Power Density | 17.2 | 29.7 | 39.6 | 75.8 | 132.1 | 139.7 | 131.3 | 106.7 | 76.6 | 18.8 | 6.6 | 19.0 | 86.2 |
| Table A2 (b) Jiwani @ 50 m Height | |||||||||||||
| Wind Speed (m/s) | 3.8 | 4 | 4.4 | 5.5 | 5.3 | 4.8 | 4.6 | 4.3 | 3.9 | 3.7 | 4.2 | 4.4 | 4.4 |
| Standard Deviation | 2.4 | 2.5 | 2.5 | 2.9 | 2.7 | 2.7 | 2.6 | 2.5 | 2.6 | 2.3 | 2.3 | 2.9 | 2.6 |
| Wind Power Density | 82.1 | 93.7 | 114.6 | 194.6 | 163.5 | 140.6 | 125.7 | 106.7 | 110.4 | 81.4 | 78.2 | 136.1 | 119 |
| Jiwani @ 30 m Height | |||||||||||||
| Wind Speed (m/s) | 3 | 3.3 | 3.7 | 4.6 | 4.5 | 4.3 | 4 | 3.8 | 3.7 | 3.2 | 3 | 3.4 | 3.7 |
| Standard Deviation | 2 | 2.1 | 2.2 | 2.6 | 2.5 | 2.5 | 2.4 | 2.3 | 2.4 | 2 | 1.9 | 2.5 | 2.4 |
| Wind Power Density | 45 | 56.3 | 70.3 | 126.4 | 115.9 | 104.2 | 92.9 | 78.5 | 78.4 | 47.1 | 42 | 79.5 | 78.4 |
| Jiwani @ 10 m Height | |||||||||||||
| Wind Speed (m/s) | 1.7 | 2 | 2.3 | 3.1 | 3.3 | 3.3 | 3.1 | 2.9 | 2.7 | 2 | 1.6 | 1.9 | 2.5 |
| Standard Deviation | 1.5 | 1.8 | 1.9 | 2.3 | 2.3 | 2.2 | 2.1 | 2 | 2.1 | 1.7 | 1.5 | 1.9 | 2 |
| Wind Power Density | 15.8 | 26.6 | 33.2 | 63.2 | 65.3 | 61.3 | 54.5 | 45.5 | 45.8 | 24.6 | 16.3 | 31.1 | 41.9 |
| Table A2 (c) Hubchoki @ 50 m Height | |||||||||||||
| Wind Speed (m/s) | 4.0 | 4.6 | 5.3 | 6.5 | 7.4 | 7.7 | 9.0 | 8.1 | 6.6 | 4.2 | 3.6 | 3.8 | 5.9 |
| Standard Deviation | 2.4 | 2.4 | 2.4 | 2.5 | 2.4 | 2.8 | 3.0 | 2.7 | 2.5 | 2.5 | 2.1 | 2.4 | 3.1 |
| Wind Power Density | 89.7 | 114.0 | 151.9 | 251.0 | 346.4 | 404.5 | 620.3 | 447.6 | 8257.8 | 103.9 | 65.2 | 83.6 | 240.5 |
| Hubchoki @ 30 m Height | |||||||||||||
| Wind Speed (m/s) | 3.3 | 3.9 | 4.5 | 5.6 | 6.5 | 6.8 | 7.4 | 6.6 | 5.5 | 3.5 | 2.9 | 3.1 | 5.0 |
| Standard Deviation | 2.0 | 2.1 | 2.1 | 2.3 | 2.2 | 2.5 | 1.7 | 2.0 | 1.9 | 2.2 | 1.7 | 2.0 | 2.6 |
| Wind Power Density | 53.3 | 68.3 | 91.8 | 159.2 | 229.5 | 276.9 | 312.9 | 229.1 | 141.1 | 63.1 | 33.7 | 45.0 | 139.1 |
| Hubchoki @ 10 m Height | |||||||||||||
| Wind Speed (m/s) | 2.2 | 2.5 | 2.9 | 3.9 | 4.8 | 5.2 | 5.0 | 3.7 | 3.6 | 2.3 | 1.7 | 1.7 | 3.3 |
| Standard Deviation | 1.7 | 1.8 | 1.9 | 2.1 | 2.0 | 2.1 | 3.4 | 2.5 | 2.2 | 1.8 | 1.6 | 1.5 | 2.4 |
| Wind Power Density | 25.6 | 31.3 | 40.8 | 70.5 | 105.1 | 128.0 | 215.8 | 87.3 | 70.5 | 29.7 | 20.1 | 15.6 | 72.6 |
| Table A2 (d) Aghore @ 50 m Height | |||||||||||||
| Wind Speed (m/s) | 5.1 | 5.1 | 5.2 | 6.4 | 7.9 | 8.3 | 8.2 | 7.9 | 6.2 | 4.6 | 4.7 | 5.3 | 6.2 |
| Standard Deviation | 1.6 | 1.8 | 1.9 | 2.1 | 2.5 | 2.5 | 2.4 | 2.1 | 2.1 | 1.7 | 1.3 | 1.6 | 2.6 |
| Wind Power Density | 128.2 | 127.7 | 134.5 | 231.2 | 432.5 | 509.3 | 479.4 | 420.4 | 221.1 | 112.5 | 106.3 | 140.2 | 247.3 |
| Aghore @ 30 m Height | |||||||||||||
| Wind Speed (m/s) | 4.1 | 4.2 | 4.5 | 5.8 | 7.2 | 7.6 | 7.4 | 7.2 | 5.7 | 3.8 | 3.7 | 4.2 | 5.5 |
| Standard Deviation | 1.8 | 1.9 | 1.9 | 2.2 | 2.7 | 2.9 | 2.8 | 2.4 | 2.2 | 2.0 | 1.6 | 1.7 | 2.7 |
| Wind Power Density | 66.4 | 73.7 | 87.1 | 168.8 | 334.5 | 388.5 | 364.8 | 315.7 | 165.0 | 64.3 | 50.0 | 69.4 | 173.5 |
| Aghore @ 10 m Height | |||||||||||||
| Wind Speed | 2.6 | 2.9 | 3.3 | 4.8 | 6.3 | 6.5 | 6.3 | 6.1 | 4.8 | 2.6 | 2.2 | 2.6 | 4.2 |
| Standard Deviation | 2.4 | 2.5 | 2.6 | 2.9 | 2.7 | 2.4 | 2.3 | 2.1 | 2.2 | 2.4 | 2.2 | 2.4 | 2.7 |
| Wind Power Density | 24.3 | 35.2 | 48.0 | 106.6 | 228.8 | 247.6 | 220.9 | 194.0 | 106.2 | 27.6 | 14.9 | 24.3 | 108.2 |
| Table A2 (e) Winder @ 50 m Height | |||||||||||||
| Wind Speed (m/s) | 4.0 | 4.4 | 5.4 | 6.4 | 7.1 | 6.9 | 7.1 | 6.2 | 5.6 | 3.7 | 3.2 | 4.0 | 5.3 |
| Standard Deviation | 2.9 | 2.9 | 3.2 | 3.2 | 3.0 | 2.7 | 2.7 | 2.3 | 2.4 | 3.0 | 2.7 | 3.0 | 3.2 |
| Wind Power Density | 132.4 | 142.3 | 213.1 | 297.6 | 346.4 | 304.7 | 331.8 | 218.6 | 167.4 | 130.4 | 100.2 | 137.4 | 208.6 |
| Winder @ 30 m Height | |||||||||||||
| Wind Speed (m/s) | 3.6 | 4.0 | 4.9 | 6.0 | 6.5 | 6.4 | 6.5 | 5.8 | 5.1 | 3.3 | 2.8 | 3.5 | 4.9 |
| Standard Deviation | 2.6 | 2.7 | 3.0 | 3.0 | 2.8 | 2.6 | 2.6 | 2.1 | 2.2 | 2.7 | 2.4 | 2.7 | 9 |
| Wind Power Density | 95.7 | 107.7 | 161.1 | 237.3 | 269.2 | 246.1 | 258.3 | 172.1 | 127.4 | 93.6 | 66.2 | 98.8 | 160.7 |
| Winder @ 10 m Height | |||||||||||||
| Wind Speed (m/s) | 2.9 | 3.3 | 4.1 | 5.3 | 5.7 | 5.7 | 5.7 | 5.1 | 4.3 | 2.6 | 2.1 | 2.7 | 4.1 |
| Standard Deviation | 2.4 | 2.5 | 2.6 | 2.9 | 2.7 | 2.4 | 2.3 | 2.1 | 2.2 | 2.4 | 2.2 | 2.4 | 2.7 |
| Wind Power Density | 68.7 | 77.3 | 105.1 | 179.1 | 194.6 | 180.5 | 172.7 | 126.9 | 91.8 | 64.1 | 55.8 | 68.3 | 116.6 |
| Table A2 (f) Gwadar @ 50 m Height | |||||||||||||
| Wind Speed (m/s) | 3.7 | 4.2 | 4.4 | 5.1 | 4.4 | 4.6 | 4.5 | 4 | 3.9 | 3.7 | 3.4 | 4 | 4.2 |
| Standard Deviation | 2.5 | 2.9 | 3.1 | 3.3 | 2.8 | 2.7 | 2.5 | 2.2 | 2.3 | 2.5 | 2.5 | 3.2 | 2.8 |
| Wind Power Density | 87.7 | 135.9 | 157.9 | 218.1 | 132.1 | 132 | 116.1 | 83.2 | 83.2 | 87.6 | 81.8 | 162.1 | 121.4 |
| Gwadar @ 30 m Height | |||||||||||||
| Wind Speed (m/s) | 3 | 3.4 | 3.6 | 4.4 | 3.8 | 4.1 | 4.1 | 3.6 | 3.4 | 3.1 | 2.8 | 3.3 | 3.6 |
| Standard Deviation | 1.9 | 2.4 | 2.6 | 3 | 2.6 | 2.5 | 2.4 | 2.1 | 2.2 | 2.3 | 2.1 | 2.7 | 2.5 |
| Wind Power Density | 40.6 | 75.2 | 91.6 | 146.3 | 97.5 | 101.8 | 90 | 63.2 | 61.7 | 59.3 | 49.3 | 91.9 | 80.4 |
| Gwadar @ 10 m Height | |||||||||||||
| Wind Speed | 2 | 2.4 | 2.5 | 3.2 | 2.9 | 3.3 | 3.4 | 2.9 | 2.6 | 2.1 | 1.9 | 2.2 | 2.6 |
| Standard Deviation | 1.5 | 2 | 2.2 | 2.6 | 2.3 | 2.3 | 2.1 | 1.9 | 2 | 2 | 1.7 | 1.9 | 2.1 |
| Wind Power Density | 18.4 | 41.7 | 51.7 | 84.8 | 58.6 | 64.3 | 56 | 39.5 | 38.8 | 39.9 | 25.4 | 35.4 | 46.5 |
| Project City/Province | Name of Company | Installation Capacity [MW] | Project Status |
|---|---|---|---|
| Jhimpir/Sindh | Zephyr Power Ltd. | 50 | Under construction, to be completed by December 2016 |
| Yunus Energy Limited | 50 | 6 MW Operational since 2009; 50.4 MW added in March 2013 | |
| Wind Eagle (Pvt) Limited | 50 | Operational since December2012 | |
| UEPL Wind Power Pakistan (Pvt) Ltd. | 100 | Under construction | |
| Trident Energy (Pvt) Ltd. | 50 | Under construction | |
| Tricon Boston Corporation | 50 | Under construction | |
| Titan Energy Pakistan (Pvt) Ltd. | 50 | Under construction, to be completed by December 2016 | |
| Three Gorges First Wind Farm Pakistan Ltd. | 49.5 | Under construction | |
| Sachal Engineering Works (Pvt) Limited | 50 | Under construction | |
| Metro Wind Power Co., Limited | 50 | Under construction | |
| Master Wind Energy Limited | 49.5 | Under construction, to be completed by December 2016 | |
| Jhimpir Wind Power Plant | 56.4 | 6 MW Operational since 2009; 50.4 MW added in March 2013 | |
| Jhimpir Wind Energy Project (FFCEL) | 49.6 | Operational since December 2012 | |
| Hawa Energy Ltd. | 50 | Under construction | |
| Hartford Alternate Energy | 50 | Under construction | |
| Gul Ahmed Wind Power Limited | 50 | Under construction, to be completed by December 2016 | |
| Finerji (Pvt) Ltd. | 50 | Under construction | |
| Dewan Energy (Pvt) Ltd. | 50 | Under construction | |
| China Sunec Energy Pvt Ltd. | 50 | Under construction | |
| Bhambore/Sindh | Zephyr Power Ltd. | 50 | Under construction, to be completed by December 2016 |
| Hydro China Dawood Power Ltd. | 50 | Under construction | |
| Bhambore/Gharo Sindh | Dawood Power (Pvt) Limited | 50 | |
| Thatta/Sindh | Thatta Power Plant | 150 | Operational since January 2015 |
| Khutti Kun, Mirpur Sakro/ Sindh | TenagaGenerai Limited | 49.5 | Under construction |
| Khutti Kun, Gharo | Foundation Wind Energy–I & II Pvt. Ltd. | 100 | Operational since January 2015 |
| Gharo/Sindh | Bhambore Wind Project | 50 | Under construction |
| Thatta/Sindh | Sapphire Wind Power (Pvt) Limited | 49.5 | Under construction wind energy project |
| Karachi/Sindh | Mbm Engineering Company | 1 | Letter of intent |
| Gharo/Sindh | Gharo Wind Power Plant | 50 | Under construction |
| Punjab | AM Pak Energy | 50 | Letter of intent |
| Baluchistan | No any | 0 | No any |
References
- Harijan, K.; Uqaili, M.A.; Memon, M.; Mirza, U.K. Assessment of centralised grid connected wind power cost in the coastal area of Pakistan. Renew. Energy 2009, 34, 369–373. [Google Scholar] [CrossRef]
- Makkawi, A.; Tham, Y.; Asif, M.; Muneer, T. Analysis and inter-comparison of energy yield of wind turbines in Pakistan using detailed hourly and per minute recorded data sets. Energy Convers. Manag. 2009, 50, 2340–2350. [Google Scholar] [CrossRef]
- Asif, M. Sustainable energy options for Pakistan. Renew. Sustain. Energy Rev. 2009, 13, 903–909. [Google Scholar] [CrossRef]
- Mirza, U.K.; Maroto-Valer, M.M.; Ahmad, N. Status and outlook of solar energy use in Pakistan. Renew. Sustain. Energy Rev. 2003, 7, 501–514. [Google Scholar] [CrossRef]
- Renewables 2013 Global Status Report REN21. Available online: www.ren21.net (accessed on 2 September 2017).
- Stritih, U.; Zupan, G.; Butala, V. Review of green electricity production in Slovenia. Renew. Sustain. Energy Rev. 2007, 11, 2201–2208. [Google Scholar] [CrossRef]
- Gyamfi, S.; Modjinou, M.; Djordjevic, S. Mawufemo Modjinou, and Sinisa Djordjevic. Improving electricity supply security in Ghana—The potential of renewable energy. Renew. Sustain. Energy Rev. 2015, 43, 1035–1045. [Google Scholar] [CrossRef]
- Khare, V.; Nema, S.; Baredar, P. Status of solar wind renewable energy in India. Renew. Sustain. Energy Rev. 2013, 27, 1–10. [Google Scholar] [CrossRef]
- Ahmed, S.; Islam, M.T.; Karim, M.A.; Karim, N.M. Exploitation of renewable energy for sustainable development and overcoming power crisis in Bangladesh. Renew. Energy 2014, 72, 223–235. [Google Scholar] [CrossRef]
- Aliyu, A.S.; Dada, J.O.; Adam, I.K. Current status and prospects of renewable energy in Nigeria. Renew. Sustain. Energy Rev. 2015, 48, 336–346. [Google Scholar] [CrossRef]
- Gurung, A.; Karki, R.; Cho, J.S.; Park, K.W.; Oh, S.E. Roles of renewable energy technologies in improving the rural energy situation in Nepal: Gaps and opportunities. Energy Policy 2013, 62, 1104–1109. [Google Scholar] [CrossRef]
- Ahmad, S.; Ab Kadir, M.Z.A.; Shafie, S. Current perspective of the renewable energy development in Malaysia. Renew. Sustain. Energy Rev. 2011, 15, 897–904. [Google Scholar] [CrossRef]
- Proietti, S.; Sdringola, P.; Castellani, F.; Astolfi, D.; Vuillermoz, E. On the contribution of renewable energies for feeding a high altitude Smart Mini Grid. Appl. Energy 2017, 185, 1694–1701. [Google Scholar] [CrossRef]
- Clarke, A.; Trinnaman, J. World Energy Council Survey of Energy Resources; Elsevier Science & Technology Book: London, UK, 2004. [Google Scholar]
- Khan, M.A.; Qayyum, A. The demand for electricity in Pakistan. OPEC Energy Rev. 2009, 33, 70–96. [Google Scholar] [CrossRef] [Green Version]
- Mirza, S.A. Privatisation in Pakistan; Ferozsons: Islamabad, Pakistan, 1995. [Google Scholar]
- Yearbook, P.E. Hydrocarbon Development Institute of Pakistan; Ministry of Petroleum and Natural Resources, Government of Pakistan: Islamabad, Pakistan, 2003.
- Baloch, M.H.; Kaloi, G.S.; Wang, J. Feasible Wind Power Potential from Coastal Line of Sindh Pakistan. Res. J. Appl. Sci. Eng. Technol. 2015, 10, 393–400. [Google Scholar]
- Baloch, M.H.; Wang, J.; Kaloi, G.S. A Point of View: Analysis and Investigation of Wind Power from Southern Region of Pakistan. Int. J. Energy Convers. 2015, 3, 103–110. [Google Scholar]
- Water and Power Development Authority. Available online: www.wapda.gov.pk (accessed on 2 January 2017).
- Reports: Chamber of Commerce Pakistan. An Overview of Electricity Sector in Pakistan. Available online: www.icci.com.pk (accessed on 2 September 2017).
- NREL. Pakistan 50 m Wind Power. NREL-USAID. Available online: http://www.nrel.gov/wind/pdfs/final1-1-1pwr50pk.pdfS (accessed on 2 September 2016).
- Muneer, T.; Asif, M. Prospects for secure and sustainable electricity supply for Pakistan. Renew. Sustain. Energy Rev. 2007, 11, 654–671. [Google Scholar] [CrossRef]
- State of Industry Report. Available online: http://www.nepra.org.pk/ (accessed on 9 May 2015).
- Alternative Energy Sector in Pakistan. Available online: http://www.aedb.org/currstatus.htm (accessed on 3 October 2016).
- Quaid-E-Azam Solar Park Company (QASPC). Available online: http://www.qasolar.com/ (accessed on 12 May 2015).
- Rehman, S. Wind energy resources assessment for Yanbo, Saudi Arabia. Energy Convers. Manag. 2004, 45, 2019–2032. [Google Scholar] [CrossRef]
- Saidur, R.; Islam, M.R.; Rahim, N.A.; Solangi, K.H. A review of global wind energy policy. Renew. Sustain. Energy Rev. 2010, 14, 1744–1762. [Google Scholar] [CrossRef]
- Worldwide Wind Energy. Available online: http://www.wwindea.org (accessed on 28 December 2015).
- Khahro, S.F.; Tabbassum, K.; Soomro, A.M.; Liao, X.; Alvi, M.B.; Dong, L.; Manzoor, M.F. Techno-economical evaluation of wind energy potential and analysis of power generation from the wind at Gharo, Sindh Pakistan. Renew. Sustain. Energy Rev. 2014, 35, 460–474. [Google Scholar] [CrossRef]
- Lau, K.Y.; Yousof, M.F.M.; Arshad, S.N.M.; Anwari, M.; Yatim, A.H.M. Performance analysis of hybrid photovoltaic/diesel energy system under Malaysian conditions. Energy 2010, 35, 3245–3255. [Google Scholar] [CrossRef]
- Ngan, M.S.; Tan, C.W. Assessment of economic viability for PV/wind/diesel hybrid energy system in southern Peninsular Malaysia. Renew. Sustain. Energy Rev. 2012, 16, 634–647. [Google Scholar] [CrossRef]
- Global Wind Energy. Available online: http://www.gwec.net (accessed on 6 December 2015).
- Pakistan Metrological Department, Reports. Available online: www.pakmet.com.pk (accessed on 4 October 2016).
- Akpinar, E.K.; Akpinar, S. An assessment of seasonal analysis of wind energy characteristics and wind turbine characteristics. Energy Convers. Manag. 2005, 46, 1848–1867. [Google Scholar] [CrossRef]
- Bagiorgas, H.S.; Assimakopoulos, M.N.; Theoharopoulos, D.; Matthopoulos, D.; Mihalakakou, G.K. Electricity generation using wind energy conversion systems in the area of Western Greece. Energy Convers. Manag. 2007, 48, 1640–1655. [Google Scholar] [CrossRef]
- Baloch, M.H.; Kaloi, G.S.; Memon, Z.A. Current scenario of the wind energy in Pakistan challenges and future perspectives: A case study. Energy Rep. 2016, 2, 201–210. [Google Scholar] [CrossRef]
- Chang, T.J.; Wu, Y.T.; Hsu, H.Y.; Chu, C.R.; Liao, C.M. Assessment of wind characteristics and wind turbine characteristics in Taiwan. Renew. Energy 2003, 28, 851–871. [Google Scholar] [CrossRef]
- Öztopal, A.; Şahin, A.D.; Akgün, N.; Şen, Z. On the regional wind energy potential of Turkey. Energy 2000, 25, 189–200. [Google Scholar] [CrossRef]
- Manwell, J.F.; McGowan, J.G.; Rogers, A.L. Wind Energy Explained: Theory, Design and Application; John Wiley & Sons: Washington, DC, USA, 2010. [Google Scholar]
- Baloch, M.H.; Wang, J.; Kaloi, G.S. Stability and nonlinear controller analysis of wind energy conversion system with random wind speed. Int. J. Electr. Power Energy Syst. 2016, 79, 75–83. [Google Scholar] [CrossRef]
- Celik, A.N. A statistical analysis of wind power density based on the Weibull and Rayleigh models at the southern region of Turkey. Renew. Energy 2004, 29, 593–604. [Google Scholar] [CrossRef]
- Borowy, B.S.; Salameh, Z.M. Methodology for optimally sizing the combination of a battery bank and PV array in a wind/PV hybrid system. IEEE Trans. Energy Convers. 1996, 11, 367–375. [Google Scholar] [CrossRef]
- Garcia, A.; Torres, J.L.; Prieto, E.; De Francisco, A. Fitting wind speed distributions: A case study. Sol. Energy 1998, 62, 139–144. [Google Scholar] [CrossRef]
- Lu, L.; Yang, H.; Burnett, J. Investigation on wind power potential on Hong Kong islands-an analysis of wind power and wind turbine characteristics. Renew. Energy 2002, 27, 1–12. [Google Scholar] [CrossRef]
- Torres, J.L.; Prieto, E.; Garcia, A.; De Blas, M.; Ramirez, F.; De Francisco, A. Effects of the model selected for the power curve on the site effectiveness and the capacity factor of a pitch regulated wind turbine. Sol. Energy 2003, 74, 93–102. [Google Scholar] [CrossRef]
- Rehman, S.; Halawani, T.O.; Mohandes, M. Wind power cost assessment at twenty locations in the Kingdom of Saudi Arabia. Renew. Energy 2003, 28, 573–583. [Google Scholar] [CrossRef]
- Akpinar, E.K.; Akpinar, S. Determination of the wind energy potential for Maden-Elazig, Turkey. Energy Convers. Manag. 2004, 45, 2901–2914. [Google Scholar] [CrossRef]
- Balouktsis, A.; Chassapis, D.; Karapantsios, T.D. A nomogram method for estimating the energy produced by wind turbine generators. Sol. Energy 2002, 72, 251–259. [Google Scholar] [CrossRef]
- Ulgen, K.; Hepbasli, A. Determination of Weibull parameters for wind energy analysis of Izmir, Turkey. Int. J. Energy Res. 2002, 26, 495–506. [Google Scholar] [CrossRef]
- Celik, A.N. On the distributional parameters used in the assessment of the suitability of wind speed probability density functions. Energy Convers. Manag. 2004, 45, 1735–1747. [Google Scholar] [CrossRef]
- Köse, R. An evaluation of wind energy potential as a power generation source in Kütahya, Turkey. Energy Convers. Manag. 2004, 45, 1631–1641. [Google Scholar] [CrossRef]
- Celik, A.N. Weibull representative compressed wind speed data for energy and performance calculations of wind energy systems. Energy Convers. Manag. 2003, 44, 3057–3072. [Google Scholar] [CrossRef]
- Deaves, D.M.; Lines, I.G. On the fitting of low mean wind speed data to the Weibull distribution. J. Wind Eng. Ind. Aerodyn. 1997, 66, 169–178. [Google Scholar] [CrossRef]
- Persaud, S.; Flynn, D.; Fox, B. Potential for wind generation on the Guyana coastlands. Renew. Energy 1999, 18, 175–189. [Google Scholar] [CrossRef]
- Seguro, J.V.; Lambert, T.W. Modern estimation of the parameters of the Weibull wind speed distribution for wind energy analysis. J. Wind Eng. Ind. Aerodyn. 2000, 85, 75–84. [Google Scholar] [CrossRef]
- Lun, I.Y.; Lam, J.C. A study of Weibull parameters using long-term wind observations. Renew. Energy 2000, 20, 145–153. [Google Scholar] [CrossRef]
- Bianchi, F.D.; Mantz, R.J.; De Battista, H. Wind Turbine Control Systems: Principles, Modelling and Gain Scheduling Design; Springer Science & Business Media: London, UK, 2006. [Google Scholar]
- European Wind Energy Association. The Economics of Wind Energy. Available online: http://www.ewea.org (accessed on 2 September 2016).
- Scappatici, L.; Bartolini, N.; Castellani, F.; Astolfi, D.; Garinei, A.; Pennicchi, M. Optimizing the design of horizontal-axis small wind turbines: From the laboratory to market. J. Wind Eng. Ind. Aerodyn. 2016, 154, 58–68. [Google Scholar] [CrossRef]
- Bresesti, P.; Kling, W.L.; Hendriks, R.L.; Vailati, R. HVDC connection of offshore wind farms to the transmission system. IEEE Trans. Energy Convers. 2007, 22, 37–43. [Google Scholar] [CrossRef]
- Irfan, M.; Iqbal, J.; Iqbal, A.; Iqbal, Z.; Riaz, R.A.; Mehmood, A. Opportunities and challenges in control of smart grids—Pakistani perspective. Renew. Sustain. Energy Rev. 2017, 71, 652–674. [Google Scholar] [CrossRef]
- Mirjat, N.H.; Uqaili, M.A.; Harijan, K.; Valasai, G.D.; Shaikh, F.; Waris, M. A review of energy and power planning and policies of Pakistan. Renew. Sustain. Energy Rev. 2017, 79, 110–127. [Google Scholar] [CrossRef]
- Valasai, G.D.; Uqaili, M.A.; Memon, H.R.; Samoo, S.R.; Mirjat, N.H.; Harijan, K. Overcoming electricity crisis in Pakistan: A review of sustainable electricity options. Renew. Sustain. Energy Rev. 2017, 72, 734–745. [Google Scholar] [CrossRef]
- Kennedy-Darling, J.; Hoyt, N.; Murao, K.; Ross, A. The Energy Crisis of Nigeria: An Overview and Implications for the Future; The University of Chicago: Chicago, IL, USA, 2008. [Google Scholar]
- Reports: The Express New York Time. Available online: http://tribune.com.pk/story/889024/per-capita-income-a-pakistani-now-makes-1513-a-year (accessed on 2 September 2017).
- Short, L. Wind Power and English Landscape Identity. In Wind Power in View: Energy Landscapes in a Crowded World; Academic Press: London, UK, 2002; p. 43. [Google Scholar]
- Volut, S.; Schonek, J. Electrical Installation Guide According to IEC International Standards; Schneider Electric: Valence, France, 2007. [Google Scholar]
- Pierpont, N. Wind Turbine Syndrome: A Report on a Natural Experiment; K-Selected Books: Santa Fe, NM, USA, 2009. [Google Scholar]
- Punch, J.; James, R.; Pabst, D. Wind turbine noise: what audiologists should know. Audiol. Today 2010, 22, 20–31. [Google Scholar]
- Midilli, A.; Dincer, I.; Rosen, M.A. The role and future benefits of green energy. Int. J. Green Energy 2007, 4, 65–87. [Google Scholar] [CrossRef]
- Saidur, R.; Rahim, N.A.; Islam, M.R.; Solangi, K.H. Environmental impact of wind energy. Renew. Sustain. Energy Rev. 2011, 15, 2423–2430. [Google Scholar] [CrossRef]
- Wang, P.; Huang, J.Y.; Ding, Y.; Loh, P.; Goel, L. Demand side load management of smart grids using intelligent trading/metering/billing system. In Proceedings of the 2010 IEEE Power and Energy Society General Meeting, Providence, RI, USA, 25–29 July 2010. [Google Scholar]
- Depuru, S.S.S.R.; Wang, L.; Devabhaktuni, V. Smart meters for power grid: Challenges, issues, advantages and status. Renew. Sustain. Energy Rev. 2011, 15, 2736–2742. [Google Scholar] [CrossRef]
- Bachram, H. Climate fraud and carbon colonialism: The new trade in greenhouse gases. Capital. Nat. Social. 2004, 15, 5–20. [Google Scholar] [CrossRef]
- Sindh Board of Investment Pakistan. Available online: http://www.sbi.gos.pk/wind_energy.php (accessed on 2 September 2016).
- Wind Power Projects. Available online: https://www.dawn.com/news/1227553 (accessed on 5 October 2014).
- UPM’s Pakistani Metro Power and Gul Ahmed Wind Energy Projects Registered with the CDM. Available online: http://www.upm-cdm.eu/upms-pakistani-metro-power-and-gul-ahmed-wind-energy-projects-registered-with-the-cdm-2/ (accessed on 2 September 2017).
- Renewable Enrgy World Wide Projects. Available online: http://www.renewableenergyworld.com/rea/news/article/2015/01/pakistans-winds-blow-slow (accessed on 5 February 2016).
- Renewable Energy World. Available online: http://www.renewableenergyworld.com/rea/news/article/2015/01/pakistans-winds-blow-slow (accessed on 2 September 2016).
- FFC Energy Ties to Grid 50-MW Wind Farm in Pakistan. Available online: https://en.wikipedia.org/wiki/Jhimpir_Wind_Energy_Project_(FFCEL) (accessed on 2 September 2016).
- NISACO Group of Companies Karach. Available online: http://www.MBM-ENGG.COM (accessed on 2 August 2016).
- Renewable Energy in China. Available online: https://en.wikipedia.org/wiki/Renewable_energy_in_China (accessed on 5 October 2014).


| Proposed Sindh Province Wind Zones | ||||||
| Name of Zone | Hyderabad | Jamshoro | Kati-Bandr | Noori Abad | Chuhar Jamali | Thano Bola Khan |
| Longitude | 68.367 E | 68.263 E | 67.276 E | 68.525 E | 68.112 E | 67.462 N |
| Latitude | 25.367 N | 25.433 N | 24.941 N | 25.894 N | 24.349 N | 25.243 E |
| Proposed Balochistan Province Wind Zones | ||||||
| Name of Zone | Gwadar | Hubchoki | Aghore | Jiwani | Gadani | Winder |
| Longitude | 62.322498 E | 66.9129 E | 62.355876 E | 61.745876 E | 66.727802 E | 66.668256 E |
| Latitude | 25.126389 N | 25.0529 N | 25.137273 N | 25.047273 N | 25.116345 N | 25.385636 N |
| Various HEIGHTS | At 10 m Heights | At 30 m Heights | At 50 m Heights | ||||
|---|---|---|---|---|---|---|---|
| # | Resource Class | m/s | W/m2 | m/s | W/m2 | m/s | W/m2 |
| 1 | Poor | 0–4.4 | 0–100 | 0–5.1 | 0–160 | 0–5.4 | 0–200 |
| 2 | Marginal | 4.4–5.1 | 100–150 | 5.1–5.9 | 160–240 | 5.4–6.2 | 200–300 |
| 3 | Moderate | 5.1–5.6 | 150–200 | 5.9–6.5 | 240–320 | 6.2–6.9 | 300–400 |
| 4 | Good | 5.6–6.0 | 200–250 | 6.5–7 | 320–400 | 6.9–7.4 | 400–500 |
| 5 | Excellent | 6.0–6.4 | 250–300 | 7–7.4 | 400–480 | 7.4–7.8 | 500–600 |
| 6 | Excellent | 6.4–7.0 | 300–400 | 7.4–8.2 | 480–640 | 7.8–8.6 | 600–800 |
| 7 | Excellent | >7.0 | >400 | 8.2–11 | 640–1600 | >8.6 | >800 |
| Name of Wind Zones | Sindh Province Resource Zones | Baluchistan Province Resource Zones | |||||
|---|---|---|---|---|---|---|---|
| # | Class | Total Windy Zones (%) | Land (km2) | Potential Capacity (GW) | Total Windy Zones (%) | Land (km2) | Potential Capacity (GW) |
| 3 | Moderate | 8.76 | 12,349 | 61.745 | 4.75 | 16,487 | 82.435 |
| 4 | Good | 3.29 | 4640 | 23.2 | 2.22 | 7709 | 38.535 |
| 5 | Excellent | 0.50 | 703 | 3.515 | 0.78 | 2722 | 13.610 |
| 6 | Excellent | 0 | 0 | 0 | 0.54 | 1891 | 9.455 |
| 7 | Excellent | 0 | 0 | 0 | 0.12 | 420 | 2.1 |
| Total | 12.55 | 17,692 | 88.460 | 8.41 | 29,229 | 146.145 | |
© 2017 by the authors. Licensee MDPI, Basel, Switzerland. This article is an open access article distributed under the terms and conditions of the Creative Commons Attribution (CC BY) license (http://creativecommons.org/licenses/by/4.0/).
Share and Cite
Baloch, M.H.; Abro, S.A.; Sarwar Kaloi, G.; Mirjat, N.H.; Tahir, S.; Nadeem, M.H.; Gul, M.; Memon, Z.A.; Kumar, M. A Research on Electricity Generation from Wind Corridors of Pakistan (Two Provinces): A Technical Proposal for Remote Zones. Sustainability 2017, 9, 1611. https://doi.org/10.3390/su9091611
Baloch MH, Abro SA, Sarwar Kaloi G, Mirjat NH, Tahir S, Nadeem MH, Gul M, Memon ZA, Kumar M. A Research on Electricity Generation from Wind Corridors of Pakistan (Two Provinces): A Technical Proposal for Remote Zones. Sustainability. 2017; 9(9):1611. https://doi.org/10.3390/su9091611
Chicago/Turabian StyleBaloch, Mazhar H., Safdar A. Abro, Ghulam Sarwar Kaloi, Nayyar H. Mirjat, Sohaib Tahir, M. Haroon Nadeem, Mehr Gul, Zubair A. Memon, and Mahendar Kumar. 2017. "A Research on Electricity Generation from Wind Corridors of Pakistan (Two Provinces): A Technical Proposal for Remote Zones" Sustainability 9, no. 9: 1611. https://doi.org/10.3390/su9091611