Credit Optimization Algorithm for Calculating LEED Costs


1
Graduate School of Civil, Environment and Architectural Engineering, Korea University, 145 Anam-ro, Seongbuk-gu, Seoul 02841, Korea
2
Department of Architecture, Korea University, 145 Anam-ro, Seongbuk-gu, Seoul 02841, Korea
3
Ecolead Corporation, 329 Hangang-daero, Yongsan-gu, Seoul, 04320, Korea
4
Global Loss Control Center, Ph.D., 11th Fl., Samsung Fire & Marine Insurance Co., Ltd., 29 Eulji-ro, Jung-gu, Seoul 04523, Korea
5
Faculty of Civil, Environment and Architectural Engineering, Korea University, 145 Anam-ro, Seongbuk-gu 02841, Korea
*
Author to whom correspondence should be addressed.
Sustainability 2017, 9(9), 1607; https://doi.org/10.3390/su9091607
Submission received: 1 August 2017
/
Revised: 5 September 2017
/
Accepted: 5 September 2017
/
Published: 9 September 2017
Abstract
:As environmental and energy issues continue to emerge as global concerns, Leadership in Energy and Environmental Design (LEED) certification is becoming highly valued. However, since additional costs for LEED certification cannot be estimated before proceeding with certification projects, financial losses are often incurred. Additional construction costs are the most significant issue faced by enterprises aiming for LEED certification. Rough estimates of the range of additional construction costs are available, but it is difficult to identify factors that increase or decrease the price of a building. Thus, there is a need for a program that provides average data for LEED certification costs and suggests the easiest way to attain credits for a building. Considering that LEED certification is a rating system, this study develops an optimization algorithm that aims to derive the minimum score for a desired LEED level at minimal cost. Credits are studied and classified by their difficulty and the required cost, allowing for an algorithm that can suggest a customized approach to acquire the minimal required score. The practical, data-driven program developed herein helps shorten the consulting process and increases the accessibility of LEED certification.
1. Introduction
As environmentally friendly and energy-saving construction becomes progressively more important, the number of projects aiming for Leadership in Energy and Environmental Design (LEED) certification worldwide is also increasing. In most countries, owing to the demand from standards organizations and facility characteristics, LEED certification from the U.S. Green Building Council is becoming an important addition to domestic certifications [1]. The greatest obstacles a constructor faces in attaining a certain LEED credit level are documentation, lack of experience, education regarding LEED certification, and—most importantly—cost [2]. Construction costs for “green buildings” are higher than those of existing non-green buildings [3]. Construction procedures and schedule management—which are necessary in the construction of green buildings owing to their differences from existing buildings—are a concrete representation of many of the obstacles faced. Because the longer the construction cost period, the higher the construction cost, mostly. Hwang stated that the ratio of delayed green building construction projects is double that of traditional building construction projects, based on a survey of 220 traditional and 96 green buildings in Singapore [4]. However, databases with which to predict additional costs are insufficient, causing constructors to incur major economic losses during current construction projects, as they lack the means to make the estimations required to commence LEED certification.
Trials have been conducted to estimate the costs involved in LEED certification. Tatari and Kucukvar studied the relationship between LEED categories and cost premiums, and developed an analysis model of the construction costs of green buildings using an artificial neural network; this method was used previously for analyzing existing construction costs [5]. Son et al. analyzed the influence of preproject planning on cost performance [6]. Arun et al. analyzed factors that cause delays and cost increases required for green building certification through a questionnaire survey and suggested a simulation [7]. Finally, the integrated project delivery process (IPD) was introduced in IPD Planner, which suggests discussing environmentally friendly factors from the very beginning of the construction process. Per this suggestion, although initial investment should also be increased, a plan can provide guidance for a stable construction process [8].
However, the above research (except for IPD Planner) did not consider regional features or pricing, and the presented methods are difficult for common users to apply. Additionally, although IPD Planner provides a construction schedule, it contains no content regarding relevant costs or certification levels. Therefore, a program suitable for use in LEED projects that can organically estimate all credit levels and construction costs is required. Furthermore, it is necessary to identify the composition of construction costs and their influencing factors at the design phase.
Moreover, if a client can easily employ a program by utilizing only the limited information available during initial construction planning, accessibility can also be improved for users aiming to achieve LEED certification.
Therefore, this paper presents an estimation program based on the target certification level and basic building specifications. The overall algorithm is divided into primary and secondary calculation processes. In the primary calculation, basic building information is used to calculate relevant credits and scores. In the secondary calculation, if the scores calculated in the primary calculation do not satisfy the desired credit level, priority credits that can compensate for deficiencies are recommended.
The information required for calculation concerns the architectural scheme, including gross area, building area, roof area, mandatory energy reduction rate, and the number of floors. The calculation process can be applied to both ongoing and planned LEED projects. The program is designed based on LEED V3 and will be applicable to LEED V4 with minor modifications.
2. Materials and Methods
2.1. Analysis of LEED Certification
2.1.1. Analysis of LEED Checklists
The scoring criteria for LEED are divided into six categories: sustainable sites (SS), water efficiency (WE), energy and atmosphere (EA), material and resources (MR), indoor environmental quality (IEQ), and innovation. Each category is divided into detailed credits, and each credit is scored and summed to grant credit levels—from lowest to highest—of Certified, Silver, Gold, and Premium [9]. An example of each category and credit analysis is presented in Table 1.
2.1.2. Cost Analysis for Each Credit
Calculating the cost for each credit point enables users to define how the costs necessary for achieving each credit interact with the building project and to derive the minimum required cost when provided with building data as input. Studies of additional construction costs have included data for variations in additional construction costs, shown as percentage values, which indicate the additional cost required to achieve LEED certification in comparison to the construction cost of an existing building [11,12,13,14,15]. In this study, data appropriate for conditions in Korea were referred to and substituted into actual construction projects to conduct a comparative analysis of the additional construction costs calculated for these projects.
Three projects with specific data on the cost of credit were studied: a business type with large gross area, a business type with small gross area, and a factory. The first project, which achieved the silver level, had a total construction cost increase of 0.81%, and the other two projects, which achieved gold level, increased by 2.03% and 2.47%.
In the results, components with small errors were maintained, whereas components with relatively large errors were modified by referencing the average unit price list. Hereafter, the average price refers to the average price derived from the unit prices as listed to set the unit price in estimates of completed projects [16,17,18]. Unit prices include labor cost.
2.2. Algorithm Development
LEED certification is ultimately divided into four levels: Certified, Silver, Gold, and Platinum. The same treatment is given to all buildings within the same level. Therefore, this program aims to satisfy the minimum conditions of each objective level. It is natural that different LEED credits are achieved by each project. However, there is a universal standard for classifying credits regardless of a project’s characteristics. This program is established with the basic goal of proposing credits given the most basic building conditions. In this paper, a credit that is commonly easy to achieve—regardless of a building’s basic information—is defined as a “basic credit”. A credit determined by the basic conditions of a building, such as its gross area, number of floors, plottage, and building use, is defined as a “conditional credit”. A credit weighted by granting priority based on its difficulty of fulfillment, is called a “priority credit” when the desired score has not been achieved after the primary calculation.
The estimation program is designed based on optimization theory, which aims to minimize the additional costs of obtaining LEED certification. The optimization process comprises an objective function, constraints, and various influential factors regarding LEED score points—namely, the variables [19,20]. The optimization model in this study seeks the values of various influential factors that minimize the objective functions numerically arranged as the costs for LEED certification under constraints that satisfy LEED certification prerequisites and LEED points for each level. In other words, the model aims to derive the items required to obtain LEED points with the goal of attaining LEED certification at minimal cost.
All credits in the checklist are classified based on their costs to minimize the cost for a building’s LEED certification [21], and the fundamental frame of the algorithm is structured based on the classified credit groups. From classification results, credits are sorted into a group with low difficulty with no cost (Costless-Easy), a group with high difficulty with no cost (Costless-Hard), a group with low difficulty and a cost (Cost-Easy), and a group with high difficulty and costs (Cost-Hard) [21]. The difficulty of achieving a credit even depends on building characteristics and location. In general, practical procedures such as paperwork, proportion of time consuming work, and confirmation also greatly affect the difficulty. Therefore, the difficulty was determined based on these factors. The overall algorithm can be represented with the four groups in Table 2, except for fluctuations triggered by unique characteristics. The supporting data for Table 2 are presented in the Supplementary Materials.
The four groups in Table 2 serve as a basis for classification in the overall algorithm—namely, the credit scores of the primary and secondary calculations. Examples of credits for each group are presented in Section 2.2.2 and Section 2.2.3.
2.2.1. Information for Project Registration
The information required to register a project is its gross area, gross area excluding the basement, building area, land area, number of floors, landscaping area, open space area, roof area, parking area, building type (building design and construction (BD + C)/core and shell), building use (accommodation/business/factory/commercial facility), renewable energy portfolio standard (RPS), bicycle rack presence, and desired LEED level.
2.2.2. Primary Calculation
Base LEED points are given to any construction project upon registering. These points are the scores from basic credits, which require almost no cost and are exempt from being applied with conditional expressions because they are relatively independent of a building’s basic specifications. Therefore, the basic credits provide fixed values. Of the credit groups in Table 2, credits that are relatively easy to achieve with no cost belong to this group. The scores range from 0 points to the full category score depending on the characteristics of the credit, and are given with universal values regardless of building specifications.
For instance, SSc4.3 (alternative transportation, low-emitting and fuel-efficient vehicles) can be scored with credit points alone by designating parking lots for low-emission and fuel-efficient vehicles; thus, 3 points—the full item score—can be acquired. SSc7.1 (heat island effect, non-roof) is more challenging to achieve than SSc4.3. However, since no cost is required, the financial feasibility of its achievement is easy. Therefore, it is scored at 1 point. Similar considerations apply for Items MRc2 (construction waste management) and MRc4 (recycled content). In the IEQ category, IEQc7.1 (thermal comfort: design) and IEQ7.2 (thermal comfort: ventilation) are scored similarly. In contrast, some basic credits cannot be given scores, regardless of conditions. These credits are difficult to achieve and incur high costs. In the case of EAc5 (measurement and verification)—since the additional construction costs for installing and maintaining a device are high—most constructors have difficulty obtaining this score, and this item is often scored at 0 points. Items EAc6 (green power) and MRc6 (rapidly renewable materials) are typical cases representing conditions not suitable for the Korean context; without fostering the same conditions, points for these items are fixed at 0. There are six other items for which credits are scored at 0 points.
Conditional credits are scored by inputting information to the respective conditional expressions. These credits are directly related to or influenced by building specifications. Therefore, they involve their own calculation algorithms. Herein, the calculated scores are summed with the basic credit scores to determine the total primary calculation score. Among the credit groups, there are those that are difficult to achieve but incur no additional costs, and those that are easy to achieve with additional costs, which belong to the category of conditional credits. For instance, since Item WEc3 is scored based on the percentage of water saved by purchasing and using water-saving equipment, the costs involved matter, whereas the achievement of this aim is easy. In the cases of MR1.1, and MR1.2, which are scored based on the ratio of the area applied within the remodeling work, no cost is required, but achievement of the aim is difficult.
After calculating the basic and conditional credits in the primary calculation, the score is compared with the minimum score of the desired level. If the sum exceeds this threshold, the calculation ends and it is determined that the registered construction project will achieve the desired level; otherwise, the algorithm enters the secondary calculation to supplement deficiencies and thereby achieve the minimum score for the desired LEED level.
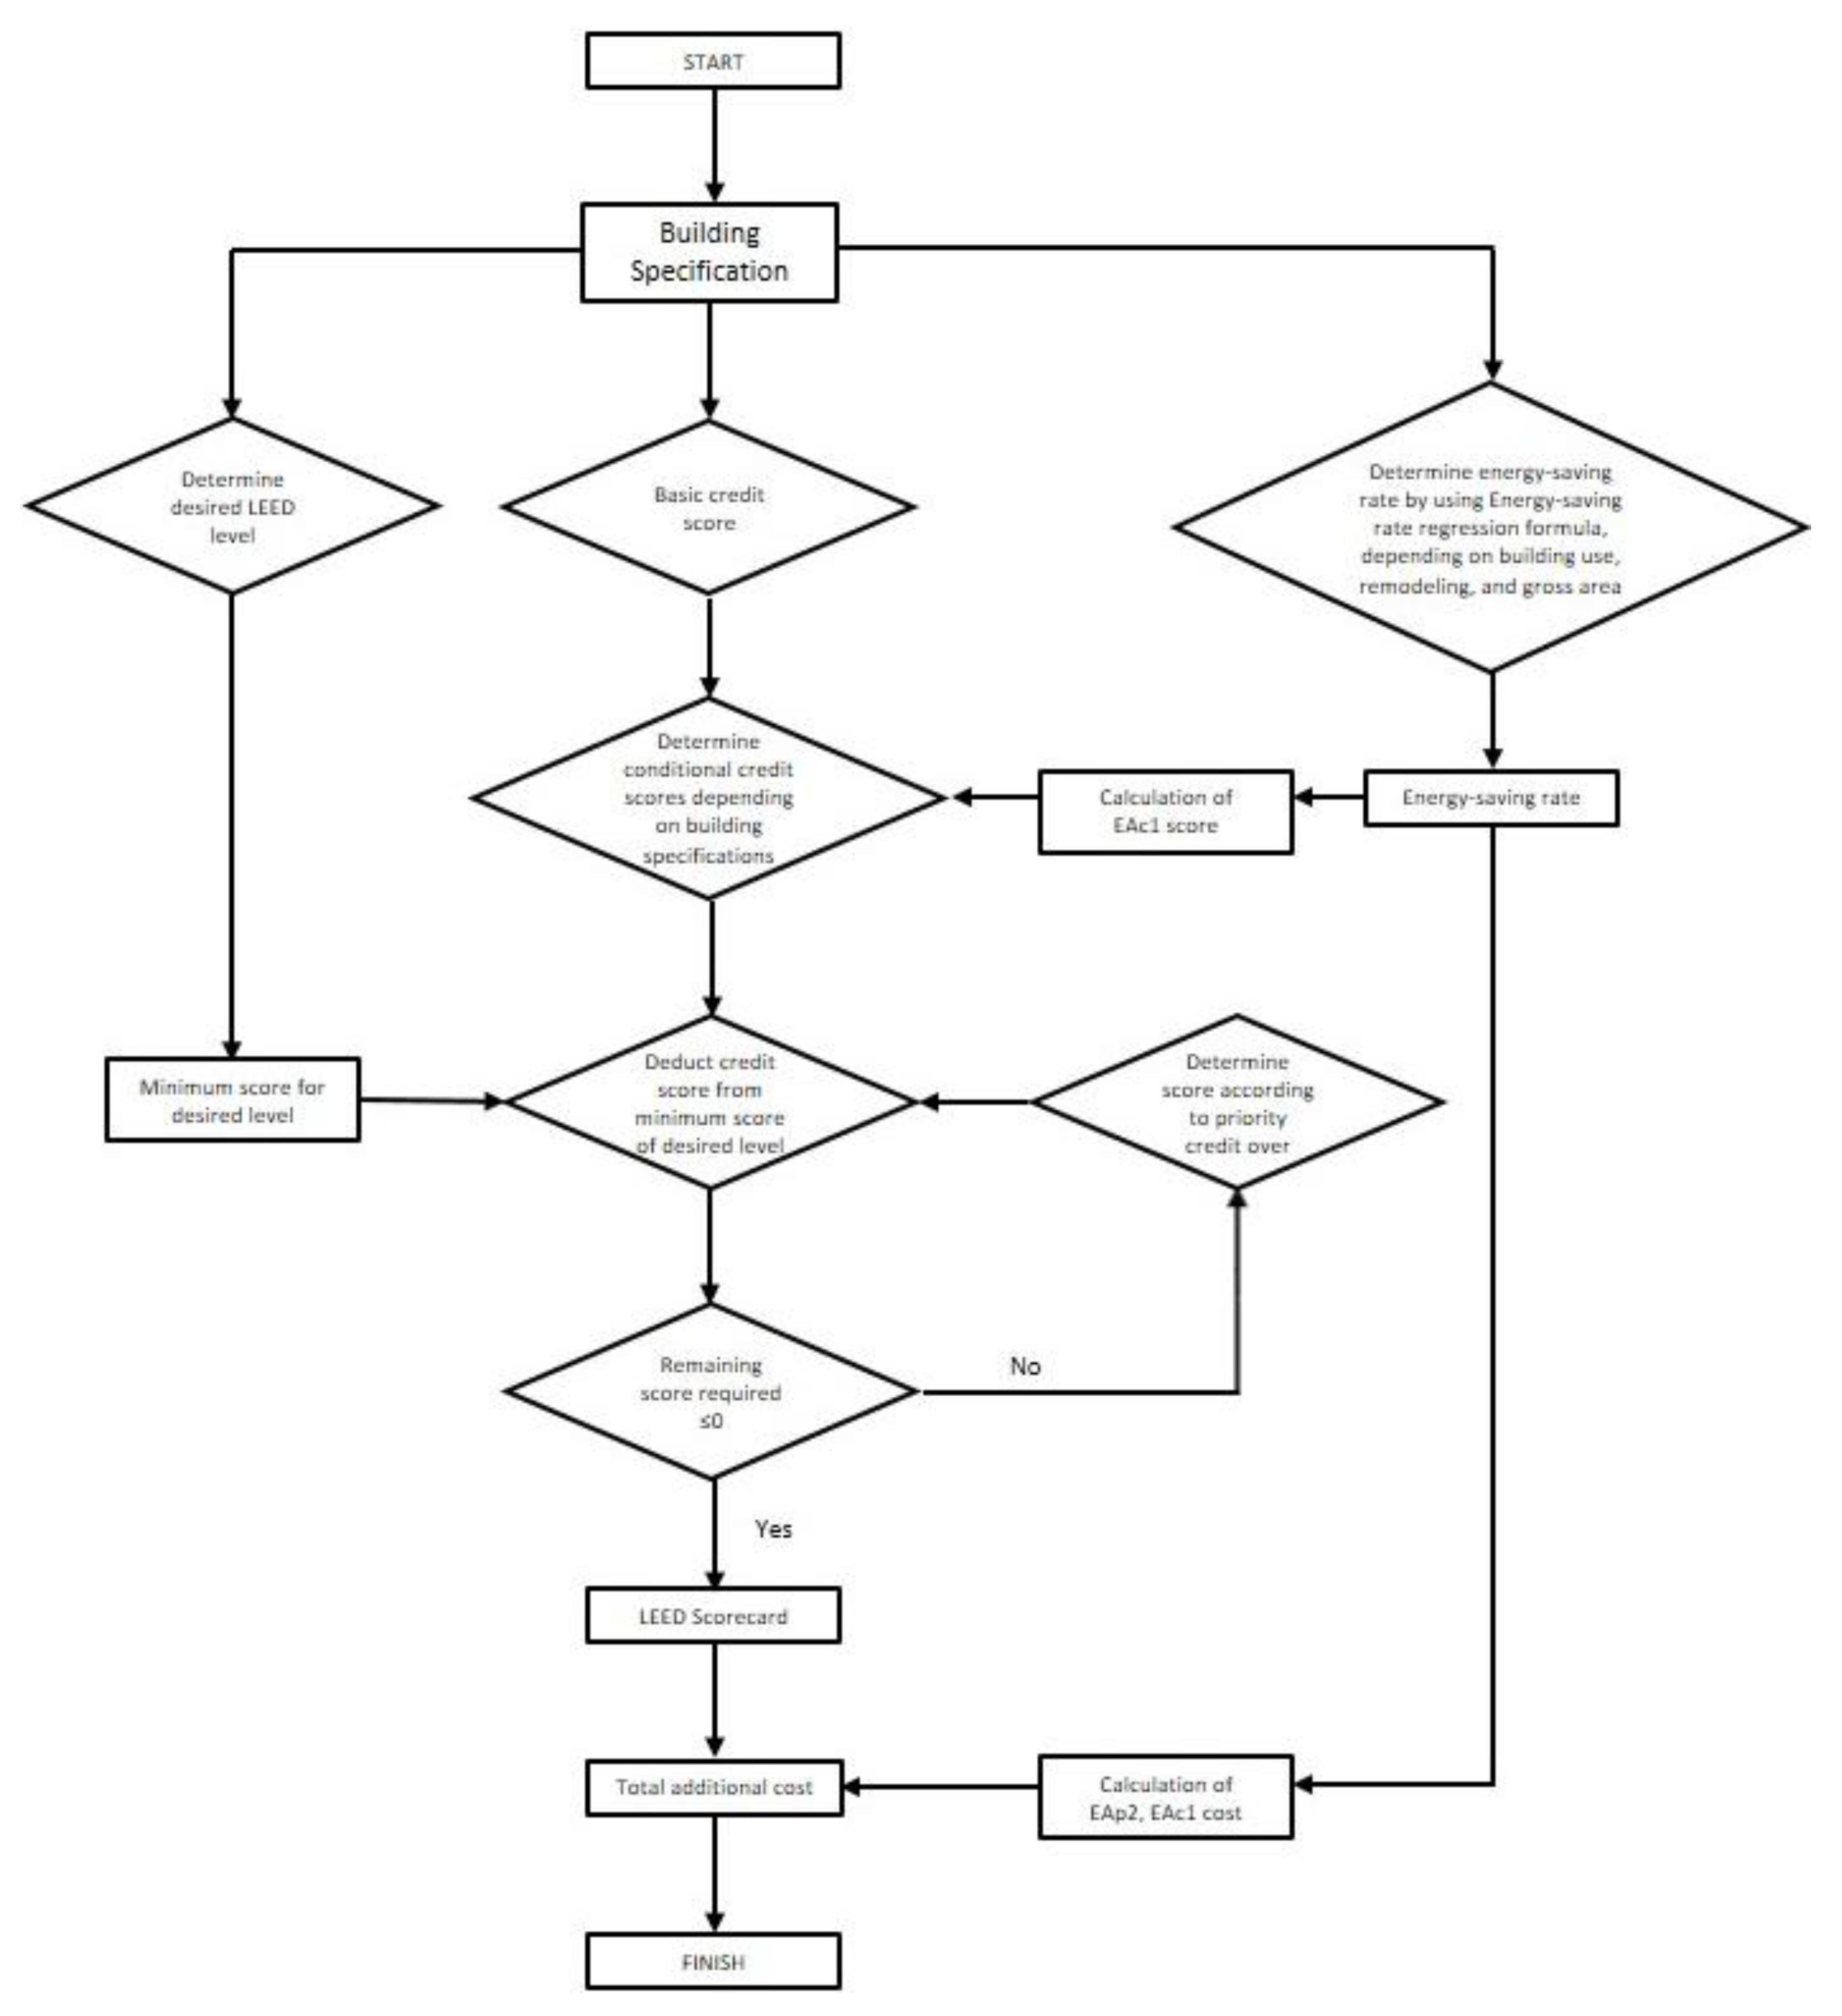
Figure 1 shows a graphical representation of the above algorithm, including the sequence and process by which additional construction costs are derived from building specifications. The energy saving costs of EA in the primary calculation are mentioned in Section 2.2.6.
2.2.3. Secondary Calculation
Priority credits refer to all credits other than the basic and conditional credits. Priority credits are calculated when the total score resulting from the primary calculation does not reach the minimum score of the user’s desired LEED level. The process for ordering and summing deficient scores for priority credits—the difference between the primary calculation score and the minimum score of the desired LEED level—is defined as the secondary calculation. Priority credits mostly incur costs and are difficult to achieve. The priority of these credits is decided not only by expansion towards the minimum cost but also by calculating the percentage average score (PAS) of the credits and costs, to ensure user convenience.
where Ai is the average score of credit i among the collected cases and Ti is the full score of credit i.
PAS = Ai ÷ Ti × 100%
PAS is an equation for numerically expressing the difficulty of achieving each LEED credit, as suggested by Ma and Cheng [22]. Because PAS is a simple numeric evaluation using scored values alone, it is difficult to apply it to the achievement of priorities in actual construction projects—since aspects such as the costs required to achieve certain credits cannot be considered. Therefore, based on 38 construction projects in Korea, including 19 Silver- and 19 Gold-credited projects, PAS values are calculated while also calculating priorities—along with costs—by comparing them with the actual costs spent to achieve LEED credits. The priority credits were arranged in ascending order of achievement cost. Table 3 gives an example of the PAS for credits at the Silver and Gold levels.
Higher priority was given to credits with lower PAS values by deferring to PASs if the costs were similar. If costs and PAS values were similar, the standard deviations of credits were calculated by analyzing specimens. These standard deviations were considered for credits for which the score distribution was relatively even and for credits for which high scores were attained in specific projects rather than in common projects. Since credits that have uniform score distributions (lower standard deviations) have less error in the algorithm, these credits were given higher priority. The order of the priority credits thus determined is shown in Table 4.
For instance, IEQc4.1 (low-emitting materials: adhesives and sealants) and IEQc4.4 (low-emitting materials: composite wood and agrifiber products) are correlated, and the costs required for their achievement are insignificant. However, the PAS value of IEQc4.1 at the Silver level is 78.9%, whereas that of IEQc4.4 at the Silver level is 26.3%, which makes the PAS of IEQc4.1 about 3 times that of IEQc4.4. At the Gold level, the PAS value of IEQc4.1 is 78.9% and that of IEQc4.4 is 52.6%, which makes the PAS of IEQc4.1 about 1.5 times the PAS of IEQc4.4. Therefore, the Item IEQc4.1 places first among the priority credits, whereas Item IEQc4.4 is placed eleventh.
Credits with similar costs and PAS values were ordered by their standard deviations, following the score distribution for each credit. For example, both IEQc3.1 (construction IAQ management plan) and IEQc6.1, IEQc6.2 (controllability of system: lighting and thermal comfort) require similar costs for achievement, and the full score for each of these items is 2 points. Additionally, their PAS values at the Silver level are similar: 60.5%, and 57.8%, respectively. However, since the standard deviations of IEQc3.1 and IEQc6 are, respectively, 0.5 and 0.7, at both the Silver and Gold levels, IEQc3.1 becomes higher-priority than IEQc6.1, IEQc6.2.
2.2.4. Partial Algorithm
The basic credit system of the primary calculation grants scores to each item of the construction project regardless of building data. The conditional credits of the primary calculation and the priority credits of the secondary calculation have their own scoring algorithms, called conditional algorithms. When a user extracts information that is used as a variable for a credit from the basic information input by the user, scores are derived depending on predetermined algorithms.
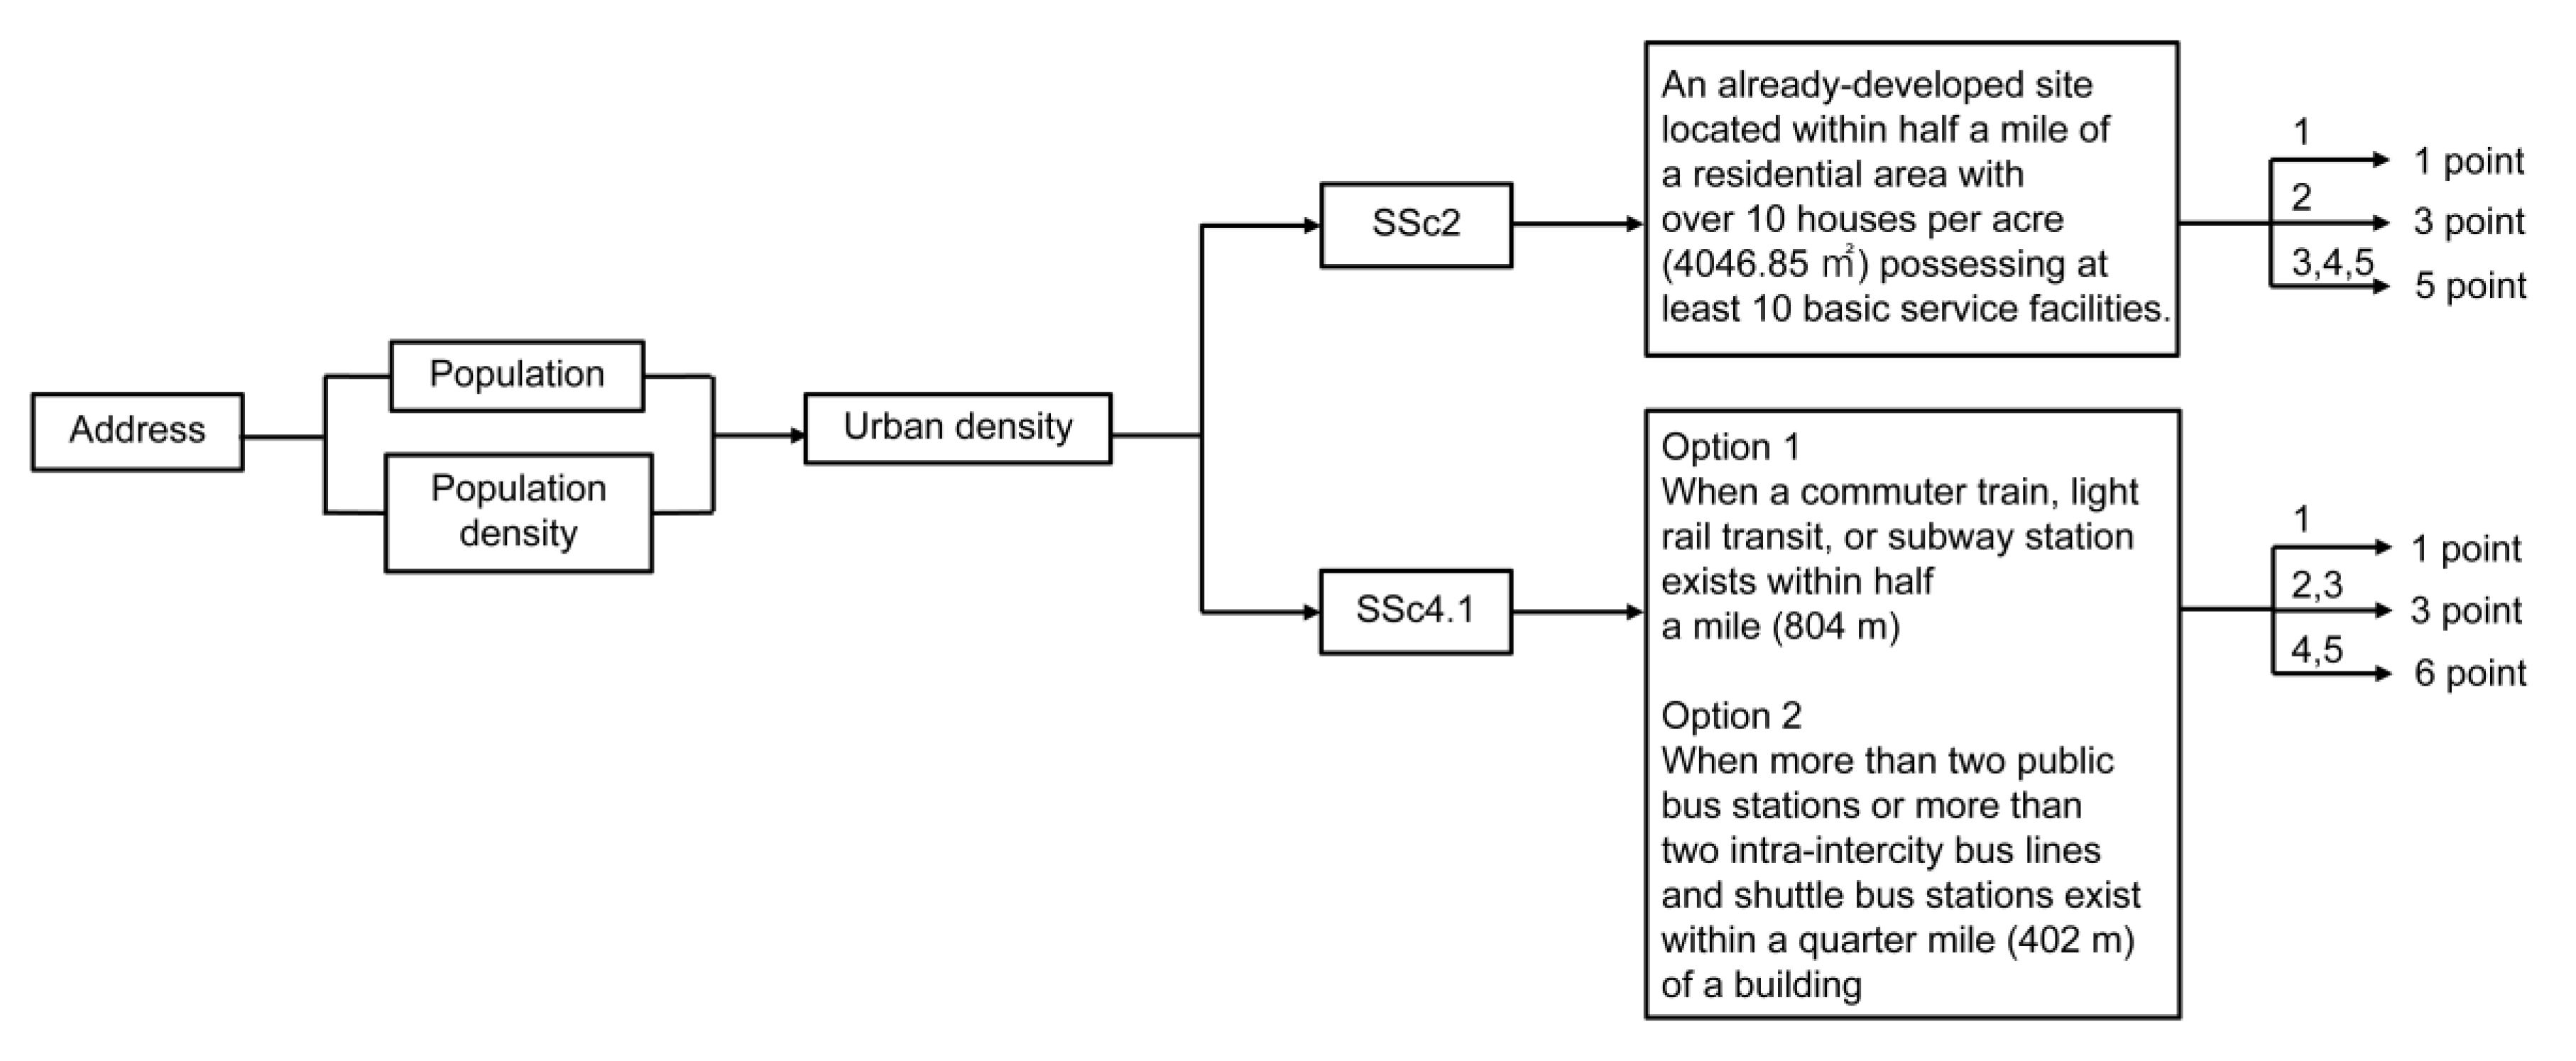
For example, to obtain the scores for Item SSc5.2 (site development: maximize open space), the open space ratio is needed (Figure 2). This ratio can be obtained from the open space and landscaping areas. Therefore, the algorithm extracts these areas from the registered construction project to calculate appropriate scores. Both SSc2 (development density and connectivity) and SSc4.1 (alternative transportation, public transportation connectivity) require information about urban concentration (or density) (Figure 3). Registered addresses are then used to calculate the population and population density. The urban density is calculated from the population and population density and is transmitted to the credit algorithm for further calculation. The algorithm concerning the priority of calculation is presented in the Supplementary Materials.
2.2.5. Cost Algorithm
In this program, the additional costs required for LEED certification are calculated based on optimization theory using an objective function for minimum costs, as described above. The process for calculating the cost of achieving each credit can be defined as follows: except for seven cases, LEED cost calculation is based on the product of unit price and gross area. Item SSc6 concerns the water retaining tank, and is calculated by summing the costs for the tank and for using the facility. WEp1 and WEc3 are basically the same, but with different conditions regarding water-saving rates. Therefore, their costs are included in the costs of WEc3 when Item WEc3 is scored. If not, Item WEp1 is calculated as the product of unit price and gross area. The costs of EAp1 and EAc3 are included in consulting costs. When EAc1 and EAc2 are scored, they are calculated as the unit price for the respective energy saving rates. If not, both are regarded as 0 USD. WEc1 is calculated as the product of unit price and landscaping area.
Assuming that the additional construction cost required for LEED certification is the total cost required to achieve the respective credits, the minimum cost is given by the optimum objective function value. The objective function variables are displayed in Table 5.
The constraints of variables are as shown in Table 6, including all conditions required for LEED certification.
The objective function derives the minimum costs using relevant variables. The calculation methods defined above can be used to assemble the objective function by dividing it into credit categories. The minimum-cost objective functions for each category are shown below.
Total SS costs:
Total WE costs when WEc3 = 0:
Total WE costs when WEc3 > 0:
Total EA costs when EAc1 = 0:
Total EA costs when EAc1 > 0:
Total MR costs:
Total IEQ costs:
Total innovation costs:
Total RP costs:
When the score of credit n in is 0, multiply by 0 in the cost function.
where Cadd is the total additional construction cost.
Cadd = SSsum + WEsum + EAsum + MRsum + IEQsum + INsum + RPsum
The sum of x3, x4, and x5 is the total cost of SSc6.1 (storm water design: quantity control)—i.e., the cost of a water retaining tank, and its operation and treatment. x3, x4, and x5 have nine groups, as shown in Table 7, which are classified according to the capacity of their water retaining tanks.
As shown in Table 7, various expensive items in the installation of a water retaining management system can be classified into three groups: the storage tank, utilization facility, and processing device. Costly items related to utilization and processing facilities are pipes, pavement demolition and restoration, buoyancy gate devices, tunnel screens, etc., whose costs do not change with tank capacity. Therefore, the cost of items classified under the utilization and processing categories are fixed, and the costs of items that change with the storage tank area are grouped [23].
If the score of SSc6.1 is not 0, the required capacity of the water retaining tank for the project is calculated by Equation (12) and the expected cost is computed according to the closest capacity in Table 7. When the capacity of the water retaining tank calculated in Equation (12) is applied to Table 7, it is rounded up to the nearest capacity for the most adverse cost.
Water retaining tank = ((Roof area × 0.95 + Packing area × 0.85 + Landscaping area × 0.1) − Land area × 0.35) × 0.038
Equation (12) for the capacity of the water retaining tank is based on Table 8, which shows the standard outflow coefficient for storm water. It was applied as either a large or an average number corresponding to the roof, parking, landscaping, and land areas. A coefficient of 0.038 is consistently computed as the ratio when comparing actual and calculated water-retaining capacities before multiplying by the coefficient of actual projects.
2.2.6. Application of Energy Simulation
Until now, the cost of attaining energy savings has usually represented a large portion of the total additional construction costs for LEED certification [25], but has been difficult to calculate with a consistent formula because of varying building characteristics and configurations. Further, the additional construction cost of EA credits is calculated as conditional in the primary calculation and has considerable influence on the secondary calculation because of the wide spectrum of scores and costs in the program. Therefore, to calculate the cost of EA credits in the program, it was necessary to develop a consistent function that connects the energy saving rate and cost.
In the above objective function for cost calculation, the additional cost function of EAp1 was derived using an energy simulation tool called Trace 700. To calculate the additional cost using the energy saving rate, building models with different gross areas and building uses were made and applied in a simulation. Based on the estimation models, additional cost functions for different gross areas and scales were produced. First, based on the American Society of Heating, Refrigerating and Air-Conditioning Engineers (ASHRAE) standard building model, 14 specimen types with different gross areas and building uses (e.g., business, residential, and industrial) were distinguished. Then, building models for various conditions for each type were applied in Trace 700.
Businesses make up nine of the 14 building types. Based on three ASHRAE standard building models (small, medium, and large offices), these nine types are expanded into versions obtained by changing the size of the three existing ASHRAE types. Table 9 shows one such case. After arranging the same standard models for each type, the variables in Table 10 were altered to fabricate building models with various energy systems based on each type. The variables comprise the number of cases in a building’s energy system, and are largely related to the building, electricity, and machines. Detailed factors include thermal transmittance, lighting, and cooling and heating equipment. To create the function, 12 specimens of each type were applied to obtain a sufficient energy saving rate and cost spectra.
Table 11 and Table 12 refer to the building models altered from Table 9. The types have the same gross area and building use, but different energy systems. These models can be used to calculate energy saving rates, energy reduction, and necessary additional costs using the energy simulation tool. The calculated energy saving rates and additional costs of business A1 are shown in Table 13.
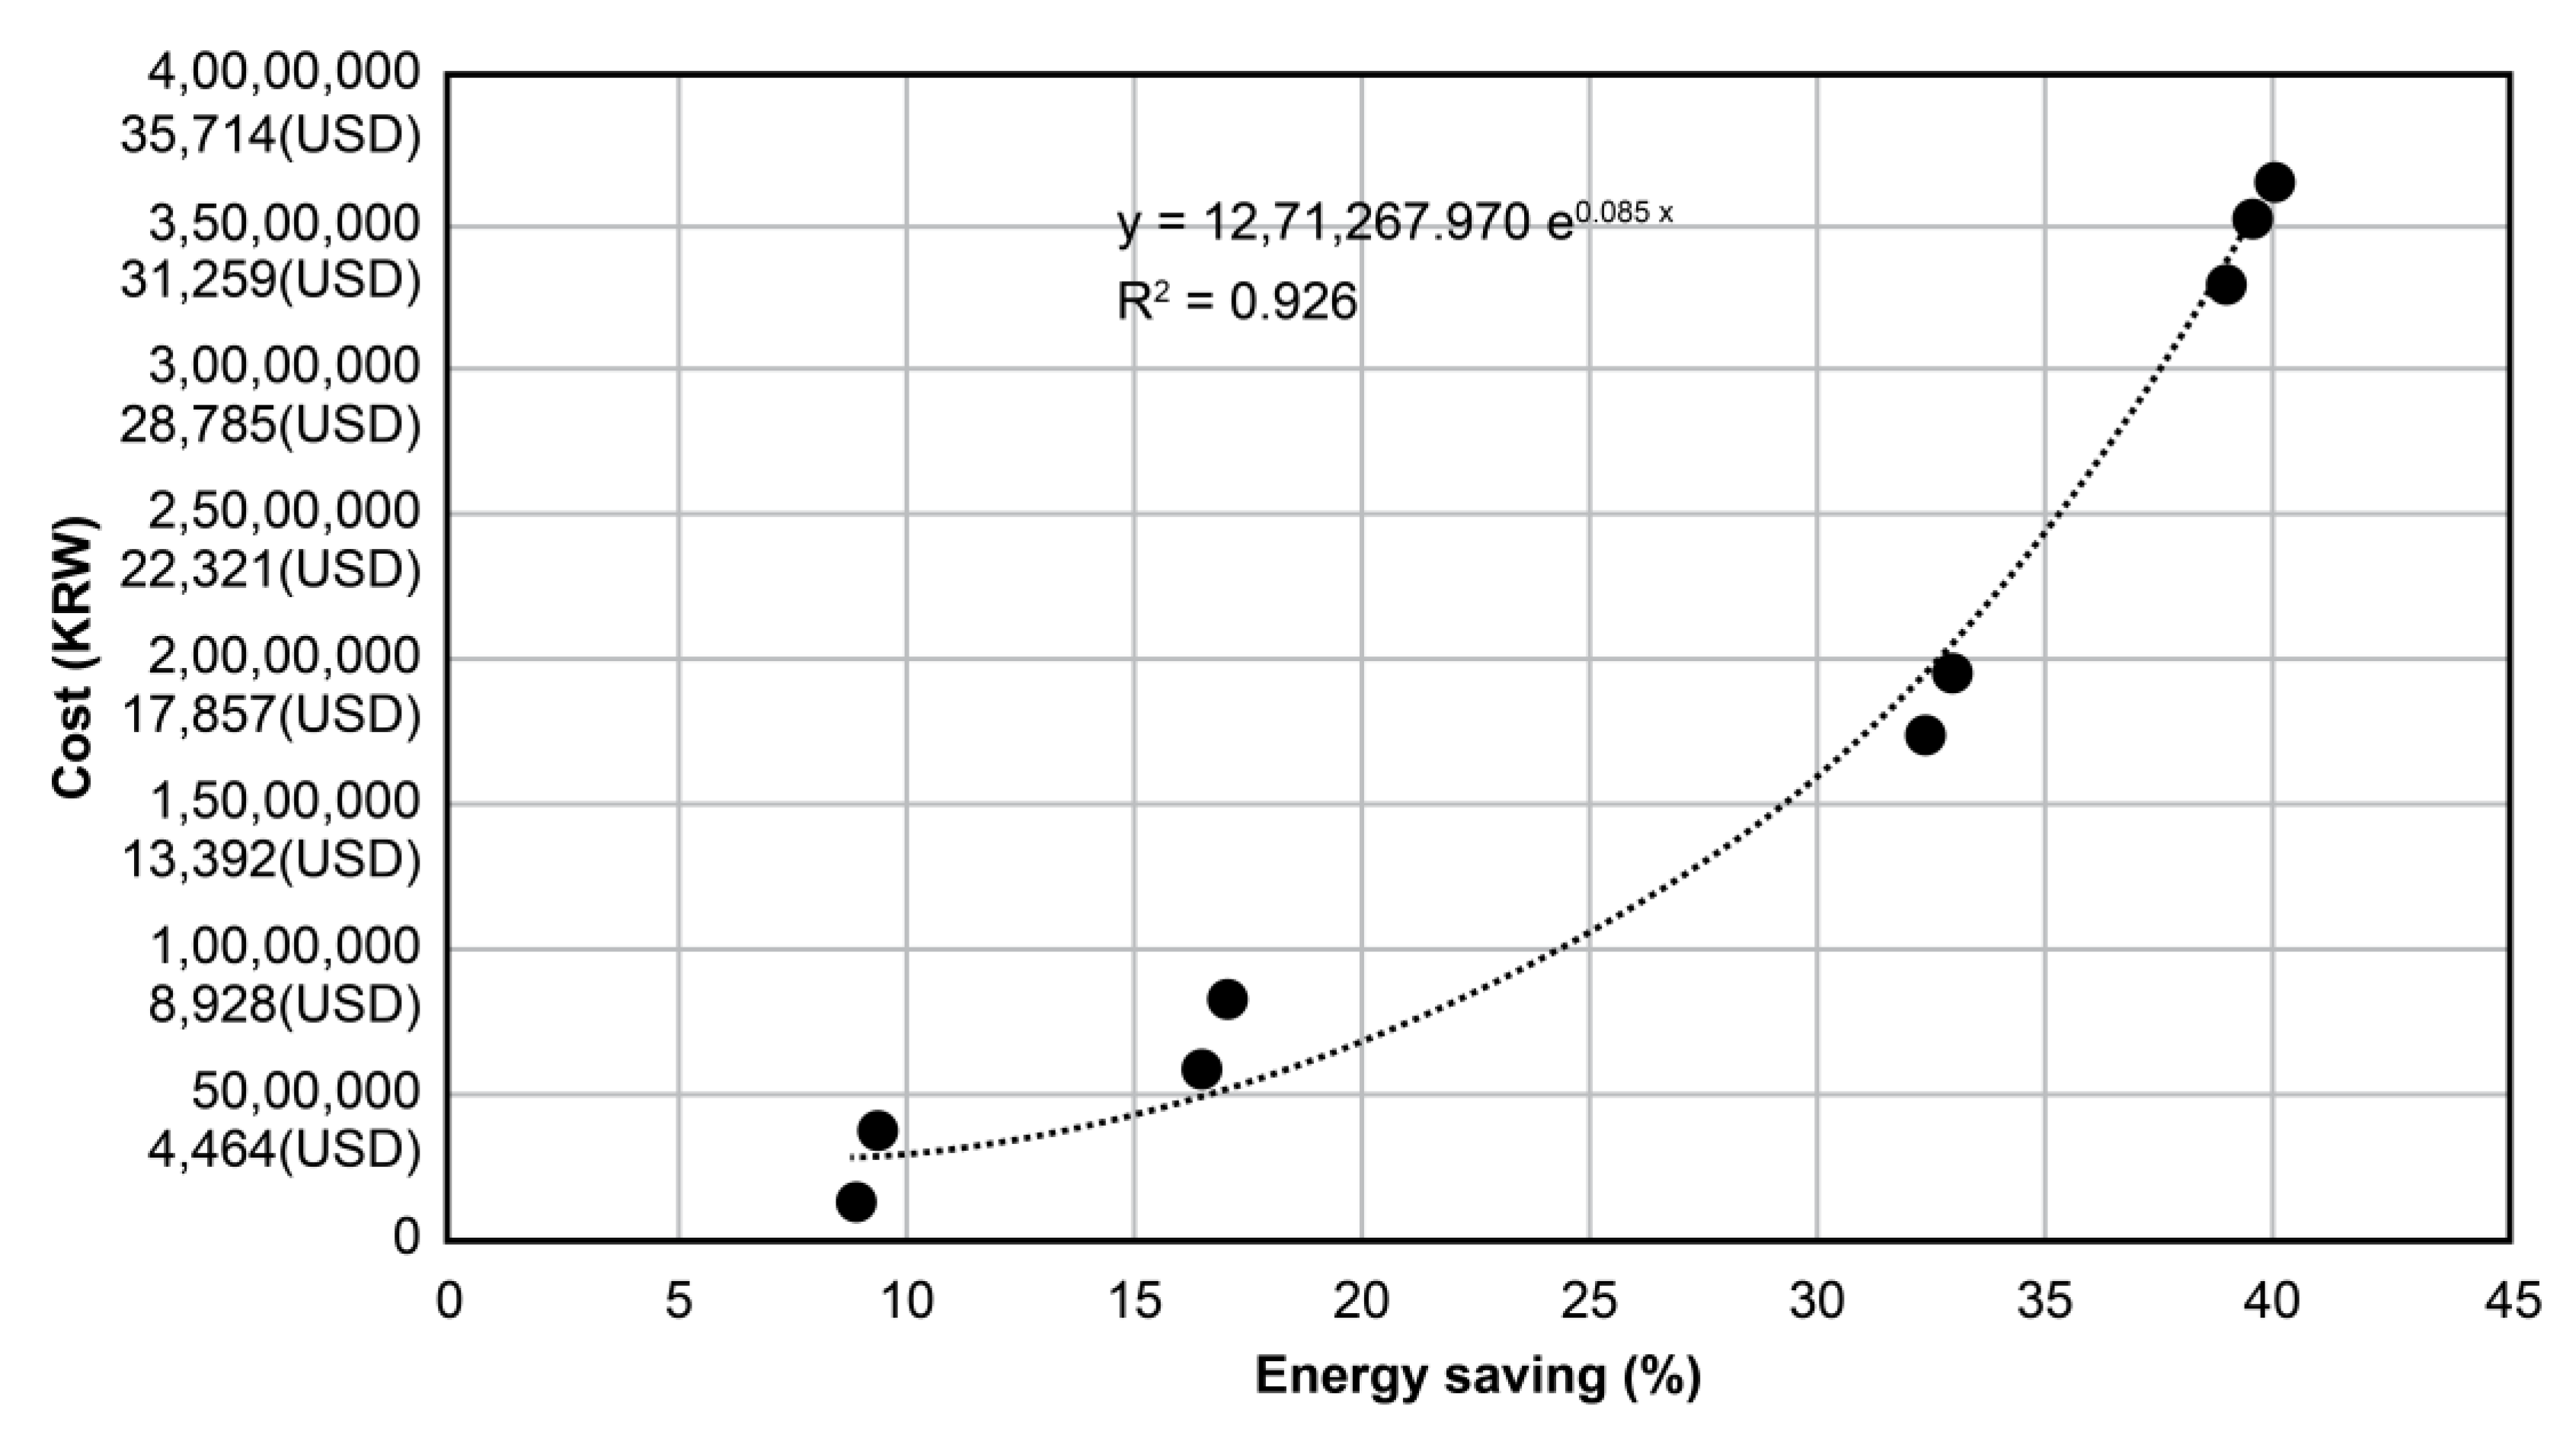
The functions for other building types showed quadric curves similar to the one in Figure 4. Hence, 14 results for each of the 12 specimens (for a total of 168 building model specimens) were applied to the energy simulation tool to derive Equation (13) and Equation (14) for the additional cost per energy saving rate.
Ces is the additional construction cost per energy saving rate, where a and b are 14 sets of coefficients corresponding to each building type and E is defined as the percentage energy reduction. is the error rate of the least-squares method. The 14 sets of coefficients a and b are shown in Table 14. The optimized regression models were established to minimize for each of the 14 sets. The models of the Business and Factory types are exponential functions as shown in Equation (13) and the models of the Accommodation type are linear functions as shown in Equation (14).
3. Results and Discussion
The accuracy of the estimated scores and costs produced by the proposed program was verified using three completed construction projects that earned LEED scores. The project building specifications were given as inputs to the program and the estimated scores and costs thus derived were compared with the actual scores and costs.
The minimum additional construction cost for the minimum score proposed by the program should be within the range of typical construction cost increases in Table 15—or lower. It was confirmed that the estimated additional construction cost within the range of typical construction increased or decreased accordingly. The relevant verification equation is as follows:
where Cadd is the estimated additional construction cost, Ctotal is the total actual construction cost, and Cmax is the maximum variation of construction costs for the affected level.
Cadd ÷ Ctotal × 100% ≤ Cmax
3.1. Specimen
3.1.1. Project A (Gold Level): Second HQ, Daegu Bank
Table 16 refers to the specifications of a completed building that achieved the Gold LEED level. The cost estimated by the program using its specifications was 1,049,153.93 USD. The total construction costs registered on the GBCI were 69,967,856.3 USD. The percentage of additional construction costs expected in comparison with the actual total construction costs is 1.5%—the value was within the various ranges of construction cost increase for Gold level listed in Table 15.
3.1.2. Project B (Silver Level): KARI Daycare Center
Table 17 refers to the specifications of a building that was finished and achieved the Silver LEED level. The cost estimated by the program using its specifications was 17,884.36 USD. The total construction costs registered on the GBCI were 3,798,428.57 USD. The percentage of additional construction costs expected in comparison with the actual total construction costs is 0.47%—the value was within the various ranges of construction cost increase for Silver level listed in Table 15.
In both projects, the estimated additional construction cost per actual construction cost was in range of the typical additional construction cost increase; therefore, Equation (15) was satisfied and the program’s cost estimation system was verified.
3.1.3. Project C (Gold Level): SK Chemicals Vaccine Production Factory
Project C was actually applied to the algorithm and certified, with the specification listed in Table 18. The cost estimated by the program was 1,314,116.21 USD, whereas the total construction costs were 53,050,397.88 USD. The percentage of additional construction costs expected in comparison with the actual total construction costs is 2.48%, which was within the various ranges of construction cost increase for Gold level listed in Table 15. Project C has a small deviation between the estimated additional construction cost data and the actual measured additional construction cost because the suggested algorithm has been applied in its procedure.
Tables for comparing LEED items suggested by the algorithm and the actual selected LEED credit items of the three buildings are presented as Supplementary Materials.
4. Conclusions
This study provided background for and described the process of designing a program to estimate additional costs using basic building specifications such as gross area, number of floors, and roof area. An expected LEED level can be set in advance, and the feasibility and costs necessary to obtain the desired level are provided to the user as results. By applying the proposed program to existing completed construction projects, all formulae regarding construction costs were verified. Users can thus mitigate economic losses by reducing the gap between initial investment costs and actual costs required to begin a project. Furthermore, since the program requires no other operation constraints outside of the basic building specifications, it eases considerations regarding LEED certification.
As the proposed program organically connects factors including building specifications with figures such as credit scores, changing the preset values can create diverse variations to suit different purposes as needed. For instance, in LEED V4, credit and achievement conditions are similar to those in V3; therefore, it is not difficult to modify the V3-based algorithm and expand its scope for V4. However, some parts of the program—such as the material cost per credit—are constituted from empirical studies; hence, it may be necessary to obtain data from projects that have achieved LEED V4 certification as the basis of the new version. In another development direction, applied unit prices can also be modified by the administrator, so that a unit price for each country can be applied to a project as needed.
Moreover, since the program can estimate the costs and levels of green building certification, it provides a domestic green building authentication system with potential for expansion to the newly introduced LEED V4 standards. The proposed program has high potential as a fundamental integrated estimation system for green-building certification.
After applying the program to actual completed projects, it was clear that it is an effective tool for finding the most suitable way to support the objectives of LEED certification and additional cost reduction. Users can directly operate the program and receive LEED certification help in the design phase.
In this article, only V3 credits and the corresponding algorithm were explained, although V4 was already applied in the program. However, projects that have been certified with LEED V4 are needed because it is advantageous to build a more accurate system for the price of materials needed. Few buildings are certified with V4; thus, the program will be updated in detail in the future. At present, the program is limited regionally, in that it was only applied for regional characteristics and unit prices; hence, it will be expanded in scope to include various countries. It is being developed to be applied to US regional characteristics and unit prices as the next goal. If these developments are completed, and data are accumulated and updated continuously, the program will be a high-potential candidate as a future LEED certification estimation system.
Supplementary Materials
The following are available online at www.mdpi.com/2071-1050/9/9/1607/s1., Project A, B and C.
Acknowledgments
This research did not receive any specific grants from funding agencies in the public, commercial, or not-for-profit sectors.
Author Contributions
This study was designed by Jae-Yong Park, Sul-Geon Choi, Da-Kyung Kim, and Min-Chul Jeong, who developed the algorithm for optimization. Jae-Yong Park and Sul-Geon Choi developed the optimization program. Program design and English corrections were undertaken by Da-Kyung Kim, Jae-Yong Park, and Jung-Sik Kong. Jae-Yong Park, Da-Kyung Kim, and Jung-Sik Kong led the preparation of the paper.
Conflicts of Interest
The authors declare no conflicts of interest.
References
- USGBC. Number of LEED Certified Projects. 2016. Available online: http://www.usgbc.org (accessed on 8 July 2016).
- Johnson, B.T. Barriers to Certification for LEED Registered Projects. Master’s Thesis, Colorado State University, Fort Collins, CO, USA, 2005. [Google Scholar]
- Dwaikat, L.N.; Ali, K.N. Green buildings cost premium: A review of empirical evidence. Energy Build. 2016, 110, 396–403. [Google Scholar] [CrossRef]
- Hwang, B.-G. Comparison of schedule delay and causal factors between traditional and green construction projects. Technol. Econ. Dev. Econ. 2013, 19, 310–330. [Google Scholar] [CrossRef]
- Tatari, O.; Kucukvar, M. Cost premium prediction of certified green buildings: A neural network approach. Build. Environ. 2011, 46, 1081–1086. [Google Scholar] [CrossRef]
- Son, H.; Lee, S.; Kim, C. An empirical investigation of key pre-project planning practices affecting the cost performance of green building projects. Procedia Eng. 2015, 118, 37–41. [Google Scholar] [CrossRef]
- Arun, C.S.; Narayanan, L.; Gaurav, A.; Krishna, N. Cost overrun assessment for green construction project. In Proceedings of the World Construction Conference 2012—Global Challenges in Construction Industry, Colombo, Sri Lanka, 28–30 June 2012; pp. 28–30. [Google Scholar]
- IPD Planner Process. 2016. Available online: http://www.aired.kr/Default.aspx (accessed on 8 July 2016).
- LEED Reference Guide for Building Design and Construction V3, USGBC. 2009. Available online: http://www.usgbc.org/resources/leed-reference-guide-green-building-design-and-construction-global-acps (accessed on 8 July 2016).
- Choi, D.-H.; Kim, G.-H. A study on the comparative analysis of score in each assessment items for LEED certified buildings. J. Korean Inst. Archit. Sustain. Environ. Build. Syst. 2013, 7, 295–304. [Google Scholar]
- Kim, J.-M.; Yang, W.-Y.; Kang, H.-S.; Min, J.-K.; Lee, K.-H. A study on variation of additional construction cost as certifying graded LEED of public office building acquired the pre-certification in KGBC. Archit. Inst. Korea Struct. Constr. Spring Conf. 2013, 13, 24–25. [Google Scholar]
- Kim, J.-M.; Yang, W.-Y.; Kim, H.-S.; Min, J.-K. A study on estimate of additional construction cost as certifying LEED of office building in Korea. J. Archit. Inst. Korea Struct. Constr. 2012, 28, 161–168. [Google Scholar]
- Kim, S.-E.; Lee, D.-H.; Kim, S.-K. Comparative analysis of evaluation items in green building certification case of apartment housing. Korea Inst. Ecol. Archit. Environ. J. 2010, 10, 31–38. [Google Scholar]
- Lee, W.-K. A Study on Additional Construction Cost for LEED Certification of New Construction: Focused on LEED Certificated Projects in Korea. Master’s Thesis, Seoul National University of Science and Technology, Seoul, Korea, 2013. [Google Scholar]
- Northbridge Environmental Management Consultants. Analyzing the Cost of Obtaining LEED Certification; The American Chemistry Council: Washington, DC, USA, 2013; pp. 8–10. [Google Scholar]
- Public Procurement Service. Analysis of Construction Expenses Classified by Public Facilities. 2014. Available online: http://www.pps.go.kr/kor/ (accessed on 30 July 2016).
- Public Procurement Service. Analysis of Construction Expenses Classified by Public Facilities. 2015. Available online: http://www.pps.go.kr/kor/ (accessed on 30 July 2016).
- Public Procurement Service. Analysis of Construction Expenses Classified by Public Facilities. 2016. Available online: http://www.pps.go.kr/kor/ (accessed on 30 July 2016).
- Venkayya, V.B. Structural optimization: A review and some recommendations. Int. J. Numer. Methods Eng. 1978, 13, 203–228. [Google Scholar] [CrossRef]
- Fleury, C. Structural optimization: A new dual method using mixed variables. Int. J. Numer. Methods Eng. 1986, 23, 409–428. [Google Scholar] [CrossRef]
- Steven Winter Associates, Inc. LEED Cost Study Final Report; Steven Winter Associates: New York, NY, USA, 2004. [Google Scholar]
- Ma, J.; Cheng, J.C.P. Data-driven study on the achievement of LEED credits using percentage of average score and association rule analysis. Build. Environ. 2016, 98, 121–242. [Google Scholar] [CrossRef]
- Korea Water and Wastewater Works Association. Sewerage Facility Standard; Korea Water and Wastewater Works Association: 244 Daerim-ro, Yeongdeungpo-gu, Seoul, 07379, Korea, 1998. [Google Scholar]
- Korea Water and Wastewater Works Association. Sewerage Facilities Criteria; Korea Water and Wastewater Works Association: 244 Daerim-ro, Yeongdeungpo-gu, Seoul, 07379, Korea, 2011; p. 35. [Google Scholar]
- Dwaikat, L.N.; Ali, K.N. Measuring the actual energy cost performance of green buildings: A test of the earned value management approach. Energies 2016, 9, 188. [Google Scholar] [CrossRef]
Figure 1.
Overall algorithm.

Figure 2.
Example of the algorithm for each credit: SSc5.2.
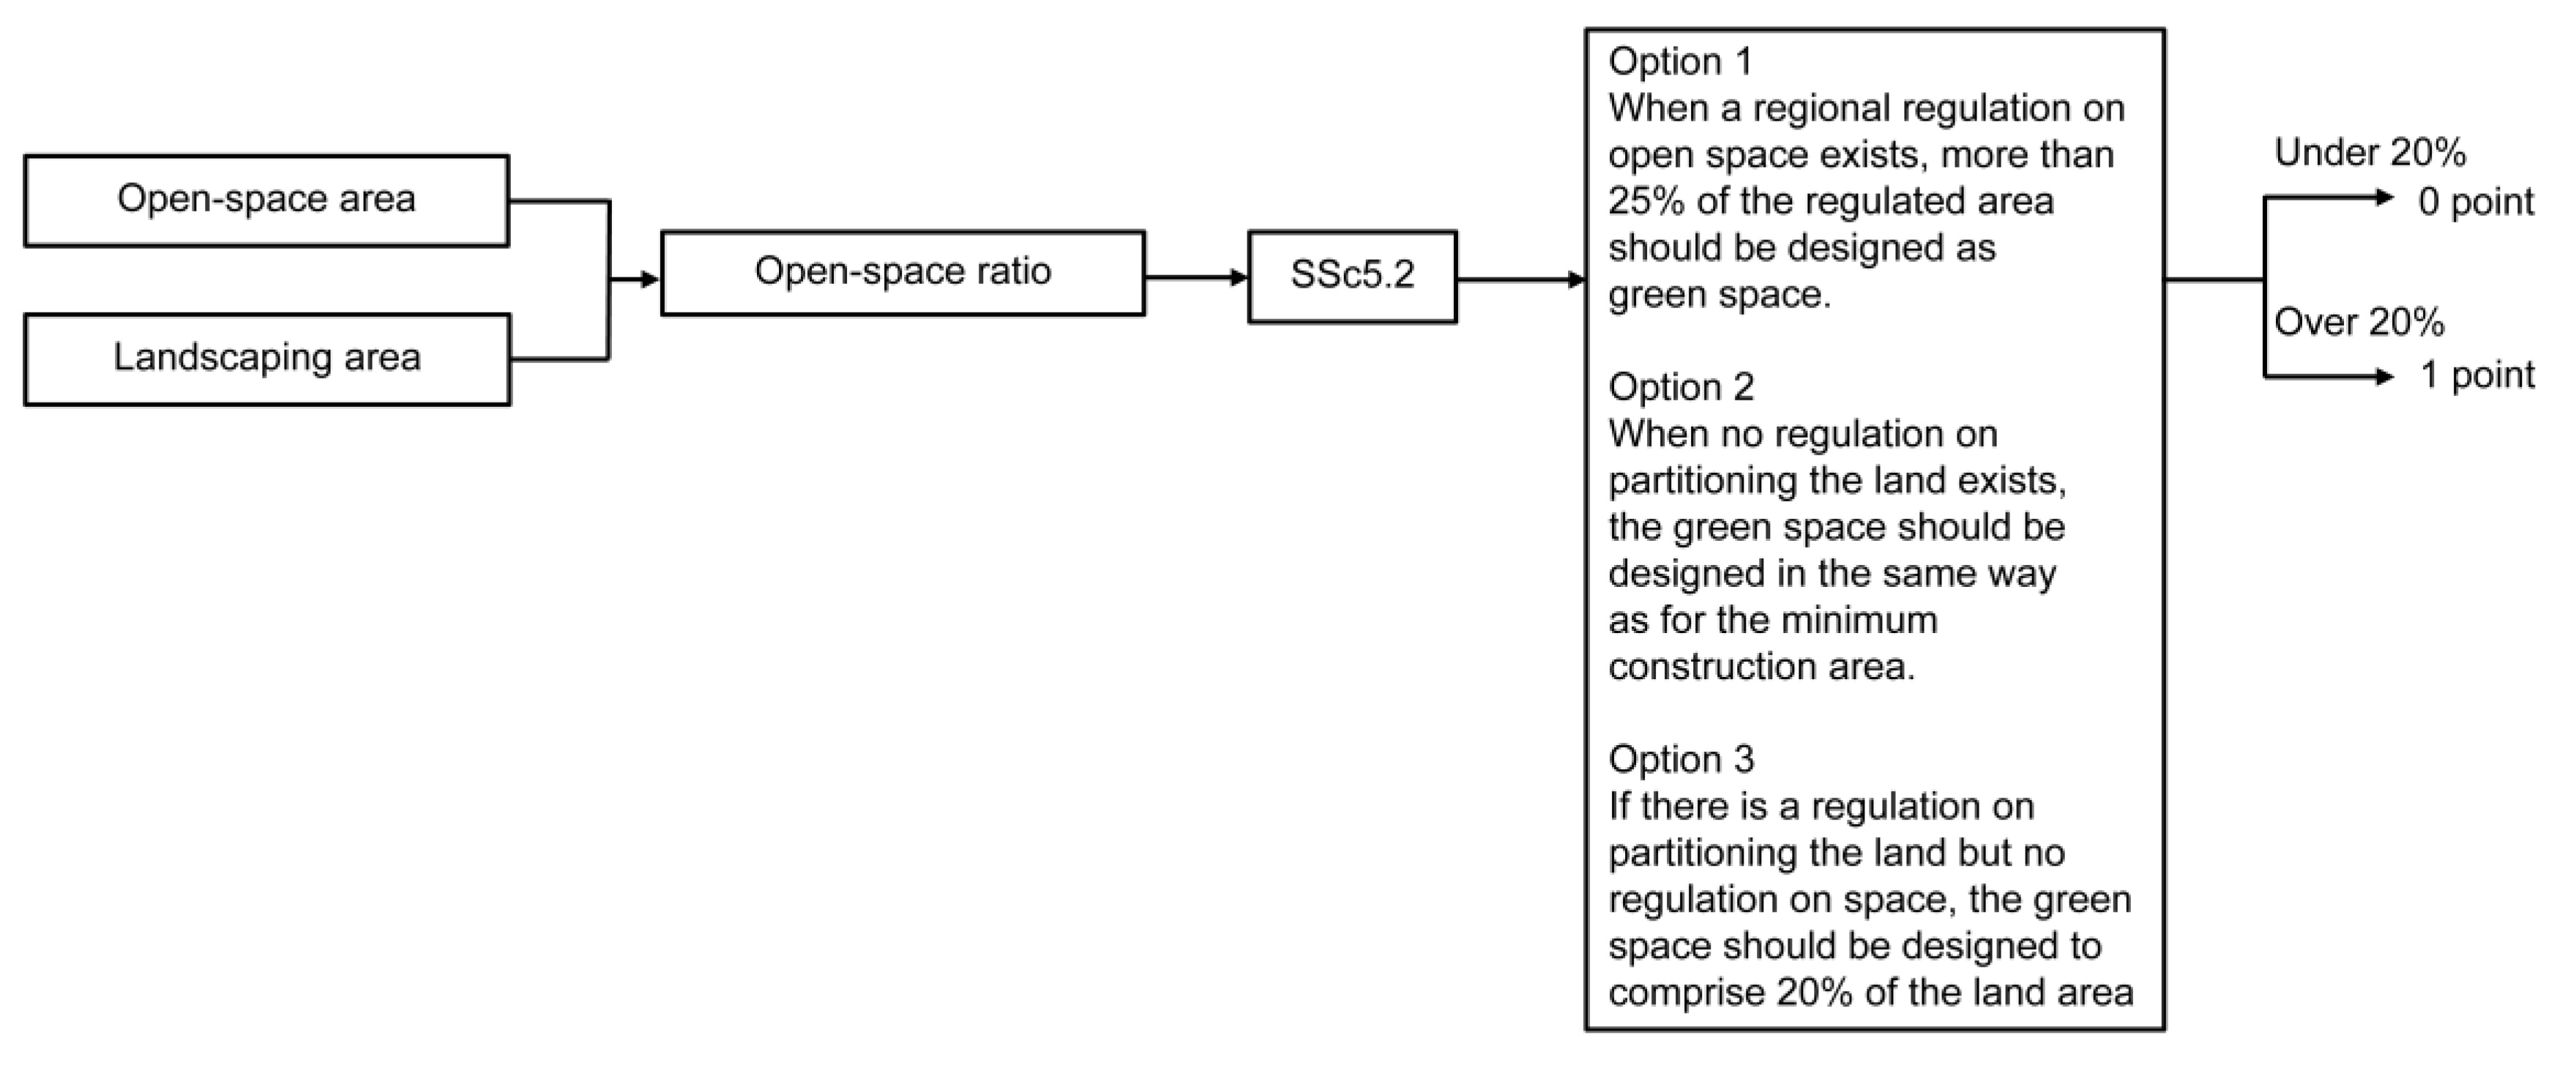
Figure 3.
Example of the algorithm for two credits: SSc2 and SSc4.1.

Figure 4.
Business A1: Additional cost per energy saving rate.

Table 1.
Analysis of LEED(Leadership in Energy and Environmental Design) checklists [10].
Table 1.
Analysis of LEED(Leadership in Energy and Environmental Design) checklists [10].
| Category | Total Points | Example | ||
|---|---|---|---|---|
| Credit | ||||
| Sustainable Sites | Primarily focuses on minimizing environmental breaches and providing conveniences for traffic surrounding a building
Site selection affects the scoring of all credit | 26 | SSc2: Development and community connectivity | Scored when more than 10 service facilities exist within a half-mile diameter of the site. |
| SSc4.2: Alternative transportation, bicycle storage, and changing rooms | Scored by installing a bicycle rack within a certain distance from the building.
In the case of residential buildings, a bicycle rack and a showering/changing room that can support more than 15% of the occupants are required. | |||
| SSc5: Site development protect or restore habitat | Demands that green field sites be protected or that existing developed sites be restored. | |||
| Water Efficiency | Focuses on minimizing wastewater including rainwater harvesting and water recycling.
Distribution and less difference between each score—because the detailed items are evaluated by applications that are relatively easy to manage. | 10 | WEc1: Water efficient landscaping | Scored depending on the reduction in irrigated water used for landscaping. |
| WEc3 : Water use reduction | Scored according to the reduction rate in relation to the building’s total water use. | |||
| Energy and Atmosphere | The largest portion of the total score.
However, the overall rate of its application ranks among the lowest, and the difference between its score levels is very large. | 35 | EAp3: Fundamental refrigerant management | To reduce the destruction of the ozone layer—chlorofluorocarbon (CFC) refrigerants should not be used. |
| EAc2: Onsite renewable energy | Scored based on the percentage of new and renewable energy systems adopted to reduce a building’s energy consumption. | |||
| Material Resources | Refers to the minimization of environmental damage triggered during the production and processing of raw materials, and to reusing construction materials and resources.
Both the differences between score levels and the overall application ratio in this category are low. | 14 | MRc1.1: Building reuse: maintain existing walls, floors and roofs | Scored by reusing the structure of an existing building or partially reusing the exterior materials or cladding of an existing building to extend its lifetime, maintain resource levels, and reduce waste. |
| MRc4: Recycled content | Scored when a certain percentage of a project’s material costs are for recycled materials. | |||
| MRc6: Rapidly renewable materials | Extension of MRc4.
Scored when the costs of fast-growing renewable building materials and products exceed a predetermined portion of the material costs of the entire building. | |||
| Indoor Environmental Quality | Focuses on the improvement of indoor air quality for the convenience and health of building users, and on securing pleasant acoustics, lighting, views, temperature, and humidity in the indoor environment. | 15 | EQc3.2: Construction IAQ management plan, before occupancy | Scored when a predetermined minimum temperature and relative humidity are maintained prior to users moving into a building, and when the entire indoor space of a building can be ventilated by providing a certain amount of outdoor air on a per-cubic-foot basis |
| EQc6.1: Controllability of systems: lighting | Scored when at least 90% of building occupants can adjust their desired lighting level. | |||
Table 2.
Classification of each credit by cost and difficulty.
| Costless-Easy | Costless-Hard | Cost-Easy | Cost-Hard |
|---|---|---|---|
| SSc1 | SSc3 | SSp1 | SSc6.1 |
| SSc2 | SSc7.1 | SSc4.2 | SSc6.2 |
| SSc4.1 | SSc8 | SSc5.1 | WEc2 |
| SSc4.3 | EAc4 | SSc5.2 | EAp1 |
| SSc4.4 | MRc1.1 | SSc7.2 | EAp2 |
| EAp3 | MRc1.2 | WEp1 | EAc1 |
| MRp1 | MRc3 | WEc1 | EAc2 |
| MRc2 | IEQc2 | WEc3 | EAc3 |
| MRc4 | IEQc3.1 | EAc6 | EAc5 |
| MRc5 | IEQc8.1 | MRc7 | MRc6 |
| IEQp1 | IEQc8.2 | IEQc3.2 | IEQc1 |
| IEQp2 | IEQc4.1 | IEQc4.3 | |
| IEQc7.1 | IEQc4.2 | IEQc4.4 | |
| IEQc7.2 | IEQc6.1 | IEQc5 | |
| IEQc6.2 |
Table 3.
Priority credit PASs(Percentage Average Score).
| Credit Number | Silver (%) | Credit Number | Gold (%) |
|---|---|---|---|
| IEQc4.2 | 89.4 | SSc7.2 | 78.9 |
| IEQc4.1 | 78.9 | IEQc4.2 | 78.9 |
| SSc7.2 | 68.4 | IEQc4.1 | 78.9 |
| IEQc3.1 | 60.5 | IEQc3.1 | 73.7 |
| IEQc6.1 | 57.8 | IEQc3.2 | 73.7 |
| IEQc6.2 | 57.8 | IEQc5 | 68.4 |
| SSc6.1 | 26.3 | SSc6.1 | 63.1 |
| SSc6.2 | 26.3 | IEQc6 | 57.8 |
| WEc2 | 26.3 | WEc2 | 52.6 |
| IEQc4.4 | 26.3 | IEQc4.4 | 52.6 |
| IEQc5 | 21.1 | SSc6.2 | 26.3 |
| MRc7 | 21 | MRc7 | 15.7 |
Table 4.
Order of priority credits.
| Priority | Credit Number |
|---|---|
| 1 | IEQc4.1 |
| 2 | IEQc4.2 |
| 3 | IEQc3.1 |
| 4 | IEQc3.2 |
| 5 | SSc7.2 |
| 6 | IEQc6.1 |
| 7 | SSc6.1 |
| 8 | WEc2 |
| 9 | IEQc6.2 |
| 10 | IEQc5 |
| 11 | IEQc4.4 |
| 12 | SSc6.2 |
| 13 | MRc7 |
Table 5.
Optimization variables.
| Variables |
|---|
| = Gross area |
| = Landscaping area |
| = Costs for water retaining tank |
| = Costs for water retaining tank operation |
| = Costs for treatment of water retaining tank |
| = Energy saving rate coefficient (price) |
| = Energy saving rate coefficient (%) |
| = Energy saving rate |
| = Unit price of material for each SS credit |
| = Unit price of material for each WE credit |
| = Unit price of material for each EA credit |
| = Unit price of material for each MR credit |
| = Unit price of material for each IEQ credit |
| = Unit price of material for each Innovation credit |
| = Unit price of material for each RP credit |
Table 6.
Constraints in optimization.
| Constraints |
|---|
| Prerequisite satisfied: ≥ Costs for adopting water-saving instruments ≥ Costs necessary for reducing energy by more than 10% Conditions for achieving respective credit scores |
Table 7.
Cost of a water retaining tank by capacity.
| Capacity (Tons) | Storage Tank (USD) | Utilization Facility (USD) | Processing Device (USD) | SUM (USD) |
|---|---|---|---|---|
| 50 | 34,406.70 | 16,762.24 | 8645.79 | 59,814.73 |
| 100 | 56,462.28 | 16,762.24 | 8645.79 | 81,870.31 |
| 150 | 78,517.87 | 16,762.24 | 8645.79 | 103,925.90 |
| 200 | 101,455.67 | 16,762.24 | 8645.79 | 126,863.70 |
| 300 | 138,509.04 | 16,762.24 | 8645.79 | 163,917.07 |
| 500 | 173,797.97 | 16,762.24 | 8645.79 | 199,206.00 |
| 700 | 186,149.10 | 16,762.24 | 8645.79 | 211,557.13 |
| 1000 | 217,909.13 | 16,762.24 | 8645.79 | 243,317.16 |
| 1500 | 326,863.70 | 16,762.24 | 8645.79 | 352,271.73 |
Table 8.
Standard value of the run-off coefficient per surface type [24].
Table 8.
Standard value of the run-off coefficient per surface type [24].
| Surface Type | Run-off Coefficient | Surface Type | Run-off Coefficient |
|---|---|---|---|
| Roof | 0.85–0.95 | Open area | 0.10–0.30 |
| Pavement | 0.80–0.90 | Turf area | 0.05–0.25 |
| Impervious surface | 0.75–0.85 | Gently sloped open area | 0.20–0.40 |
| Water Surface | 1.00 | Steeply sloped open area | 0.40–0.60 |
Note: 0.95: Storm water run-off coefficient (Concrete pavement); 0.85: Storm water run-off coefficient (General pavement); 0.1: Storm water run-off coefficient (Flat vegetation); 0.35: Storm water run-off coefficient (Ground level); and 0.038: Design storm water intensity (once-in-two-years 24-h storm in /m2).
Table 9.
Model outline based on type: Business A1.
| Division | Business A1 | |
|---|---|---|
| Gross area (m2) | 1000 (25 × 20 × 2) | |
| Floors | 2 | |
| Thermal Transmittance (U-Value) | Wall | U-0.365 |
| Roof | U-0.273 | |
| Windows | U-2.27 | |
| Lighting | Office (W/m2) | 10.5 |
| System | Type | Sys3 (PRTU(Packaged Rooftop Unit)) |
| Fan | Forward Curved Centrifugal Fan | |
| Cooling | Type | Dx Cooling |
| Air-cooled Unitary | COP 3.22 | |
| Air-cooled Condenser | ||
| Turbo Chiller | ||
| Heating | Type | Furnace |
| Efficiency | 80% | |
Table 10.
Variables.
| Division | ||
|---|---|---|
| Building | Thermal Transmittance | Standard (roof/wall/fenestration) |
| Energy saving plan >> U-0.102/0.26/1.705 | ||
| 30% reduction from baseline ASHRAE >> U-0.191/0.256/1.59 | ||
| Electricity | Lighting | Standard (office/lab/stairs/classroom) W/m2 |
| 30% reduction from baseline | ||
| Machine | System | Standard (COP) |
| EHP_VRF ASHRAE-based VRF heat recover 135–240 (cooling EER: 10.4/heating cop: 3.2) + DOAS | ||
| EHP_VRF eff 10% up (cooling EER: 11.44/heating cop: 3.52) + DOAS | ||
| CAV/Turbo Chiller cop 6.1 | ||
| VAV/Turbo Chiller cop 6.1 | ||
| VAV + FCU | ||
| FCU cooling + radiant floor heating + DOAS/Turbo freezer (COP 6.1) | ||
| FCU + DOAS/Turbo Freezer (COP 6.1) | ||
| Cooling Equipment | Turbo freezer (efficiency) 800USRT-based | |
| COP 6.1 | ||
| VAV/COP 6.6 (baseline) | ||
| Absorbing-type freezer (efficiency) 800USRT-based | ||
| COP 0.7/boiler eff 80% | ||
| COP 0.7/boiler eff 85% | ||
| Heating Equipment | Standard (boiler 80%) | |
| Boiler 85% | ||
| Boiler 90% | ||
| Miscellaneous Equipment | ERV 50% (FCU + DOAS-based) | |
| ERV 65% (FCU + DOAS-based) | ||
| ERV 50% (Baseline) | ||
| ERV 65% (Baseline) | ||
| Air conditioner fan type (constant volume to variable volume) | ||
| Fan efficiency 10% up | ||
| Pump efficiency 10% up | ||
Table 11.
Altered building model 1.
| % | Saving (USD) | Cost (USD) | ||||
|---|---|---|---|---|---|---|
| Building | Thermal Transmittance | |||||
| Electricity | Lighting | 30% reduction from baseline | 7.60 | 1830 | 4018 | |
| Machine | System | |||||
| Cooling | ||||||
| Heating | Boiler 85% | 0.51 | 123 | 2095 | ||
| Miscellaneous | Air conditioner fan type (constant volume to variable volume) | 8.82 | 2124 | 1202 | ||
| 16.93 | 4077 | 7315 | ||||
Table 12.
Altered building model 2.
| % | Saving (USD) | Cost (USD) | ||||
|---|---|---|---|---|---|---|
| Building | Thermal Transmittance | Energy saving plan | 6.60 | 1590 | 13,805 | |
| Electricity | Lighting | 30% reduction from baseline | 7.60 | 1830 | 4018 | |
| Machine | System | FCU cooling + radiant floor heating + DOAS/Turbo Freezer (COP 6.1) | 15.84 | 3815 | 10,084 | |
| Cooling | ||||||
| Heating | Boiler 90% | 0.96 | 232 | 3315 | ||
| Miscellaneous | Air conditioner fan type (constant volume to variable volume) | 8.82 | 2124 | 1202 | ||
| 39.82 | 9591 | 32,424 | ||||
Table 13.
Additional costs per energy saving rate: Business A1.
| % | Cost (USD) |
|---|---|
| 8.82 | 1201 |
| 9.33 | 3296 |
| 16.42 | 5219 |
| 16.93 | 7315 |
| 32.25 | 15,303 |
| 32.76 | 17,398 |
| 38.85 | 29,109 |
| 39.37 | 31,204 |
| 39.82 | 32,424 |
Table 14.
Coefficients a and b.
| Type | Regression Model | a | b | |
|---|---|---|---|---|
| Business A1 (0 ≤ Gross area < 1250) | Exponential | 1,271,267.97 | 0.085 | 0.926 |
| Business A2 (1250 ≤ Gross area < 1750) | Exponential | 5,263,602.32 | 0.053 | 0.797 |
| Business A3 (1750 ≤ Gross area < 2300) | Exponential | 1,964,456.21 | 0.099 | 0.815 |
| Business B1 (2350 ≤ Gross area < 7200) | Exponential | 16,674,142.09 | 0.079 | 0.907 |
| Business B2 (7200 ≤ Gross area < 9000) | Exponential | 10,070,453.37 | 0.123 | 0.908 |
| Business B3 (9000 ≤ Gross area < 14,000) | Exponential | 22,491,658.93 | 0.108 | 0.825 |
| Business C1 (14,000 ≤ Gross area < 25,000) | Exponential | 23,378,699.14 | 0.144 | 0.935 |
| Business C2 (25,000 ≤ Gross area < 35,000) | Exponential | 34,490,364.86 | 0.143 | 0.769 |
| Business C3 (35,000 ≤ Gross area) | Exponential | 46,669,919.40 | 143 | 0.811 |
| Accommodation 1 (0 ≤ Gross area < 5000) | Linear | 2,302,001.28 | 0 | 0.947 |
| Accommodation 2 (5000 ≤ Gross area < 9500) | Linear | 4,174,216.47 | 0 | 0.879 |
| Accommodation 3 (9500 ≤ Gross area) | Linear | 7,276,140.83 | 0 | 0.862 |
| Factory 1 (0 ≤ Gross area < 16,400) | Exponential | 1,293,578.90 | 0.37 | 0.78 |
| Factory 2 (16,400 ≤ Gross area) | Exponential | 6,214,259.16 | 0.519 | 0.906 |
| Level | Variation of Construction Costs (%) |
|---|---|
| Certified | 0.08–1.75 |
| Silver | 0.4–2.04 |
| Gold | 1.18–3.24 |
| Platinum | 2.44–5.75 |
Table 16.
Outline for the second HQ of Daegu Bank.
| Input List | Input Data |
|---|---|
| Gross area | 37,332.05 m2 |
| Gross area except basement | 16,332.11 m2 |
| Building area | 3634.34 m2 |
| Land area | 9638.90 m2 |
| Number of floors | 10 |
| Landscaping area | 1732.21 m2 |
| Open space area | 1010.04 m2 |
| Roof area | 1944 m2 |
| Parking area | 2000 m2 |
| LEED type | V3 BD + C |
| Use | Business |
| RPS | 0 |
| Bicycle rack present | Y |
| Desired LEED level | Gold |
Table 17.
Outline for KARI Daycare Center.
| Input List | Input Data |
|---|---|
| Gross area | 998 m2 |
| Gross area except basement | 778 m2 |
| Building area | 531.73 m2 |
| Land area | 3294 m2 |
| Number of floors | 2 |
| Landscaping area | 200 m2 |
| Open space area | 224 m2 |
| Roof area | 324 m2 |
| Parking area | 196 m2 |
| LEED type | V3 BD + C |
| Use | Business |
| RPS | 0 |
| Bicycle rack present | Y |
| Desired LEED level | Silver |
Table 18.
Outline of SK Chemicals Vaccine Production Factory.
| Input List | Input Data |
|---|---|
| Gross area | 19,257 m2 |
| Gross area except basement | 15,490 m2 |
| Building area | 9290 m2 |
| Land area | 31,584 m2 |
| Number of floors | 2 |
| Landscaping area | 11,693 m2 |
| Open space area | 4000 m2 |
| Roof area | 8000 m2 |
| Parking area | 4560 m2 |
| LEED type | V3 BD + C |
| Use | Factory |
| RPS | 0 |
| Bicycle rack present | Y |
| Desired LEED level | Gold |
© 2017 by the authors. Licensee MDPI, Basel, Switzerland. This article is an open access article distributed under the terms and conditions of the Creative Commons Attribution (CC BY) license (http://creativecommons.org/licenses/by/4.0/).
Share and Cite
MDPI and ACS Style
Park, J.-Y.; Choi, S.-G.; Kim, D.-K.; Jeong, M.-C.; Kong, J.-S. Credit Optimization Algorithm for Calculating LEED Costs. Sustainability 2017, 9, 1607. https://doi.org/10.3390/su9091607
AMA Style
Park J-Y, Choi S-G, Kim D-K, Jeong M-C, Kong J-S. Credit Optimization Algorithm for Calculating LEED Costs. Sustainability. 2017; 9(9):1607. https://doi.org/10.3390/su9091607
Chicago/Turabian StylePark, Jae-Yong, Sul-Geon Choi, Da-Kyung Kim, Min-Chul Jeong, and Jung-Sik Kong. 2017. "Credit Optimization Algorithm for Calculating LEED Costs" Sustainability 9, no. 9: 1607. https://doi.org/10.3390/su9091607
Note that from the first issue of 2016, this journal uses article numbers instead of page numbers. See further details here.