Yields of the Major Food Crops: Implications to Food Security and Policy in Tanzania’s Semi-Arid Agro-Ecological Zone


1
Centre of Excellence for Soil Biology, College of Resources and Environment, Southwest University, Chongqing 400715, China
2
Department of Geography and Environmental Studies, Solomon Mahlangu College of Science and Education, Sokoine University of Agriculture, Morogoro 3038, Tanzania
3
School of Biological Sciences, University of Western Australia, Crawley 6009, Australia
*
Authors to whom correspondence should be addressed.
Sustainability 2017, 9(8), 1490; https://doi.org/10.3390/su9081490
Submission received: 7 July 2017
/
Revised: 17 August 2017
/
Accepted: 17 August 2017
/
Published: 22 August 2017
(This article belongs to the Section Sustainable Agriculture)
Abstract
:While Tanzania has been facing food shortage for some decades, little efforts have been made to elicit optimal crop yields. To limit this problem, there is a need for a robust agricultural policy that aims at stabilizing agricultural production and socio-economic entitlement among the farmers. The present study analyses the production trend of maize, sorghum and millet (i.e., staple food crops) under rain fed agriculture in Kongwa District, the semi-arid agro-ecological zone of Central Tanzania, and envisage their implications to food security and policy. We collected a set of crop data (1980–2015) from the Ministry of Agriculture, Livestock and Fisheries. In addition, 400 respondents were sampled randomly in the study area during household survey while a series of interviews and discussions were conducted mostly basing on the expertise. The Mann-Kendall Test and Microsoft excel (window 13) and theme content methods were employed for data analyses. The results showed that the production trends for maize, sorghum and millet yields have been decreasing at R2 = 0.40, 0.35 and 0.11 respectively and this trend was supported by 80% of the respondents. This decrease was greatly influenced by the temporal decrease in the mean annual rainfall (R2 = 0.21). The diminishing production trend has already decreased food security for 30% in the area. Since agricultural policy can be among the main sources of this poor yields, an explicit and sound agricultural policy should be the central aspect in planning and implementing agricultural activities.
1. Introduction
Insufficient food production has become a major problem in most developing countries. This is a central reason for food shortage in Sub-Sahara region [1]. According to UNDP [2] the region has nearly 218 million people who are food insecure and undernourished. The report further clarifies that food security is a core component of the human development and capability paradigm. Thus, enhancing food availability and entitlements is a robust way to sustainable human development [3,4]. Countries like Burkina Faso, Mali, Niger, Malawi, Kenya and Tanzania have already been adversely affected by climate change [5,6]. While climate is increasingly impacting the production, the population growth has been increasing rapidly, and thus, food production has not been kept up with population growth [2]. Since 2000s the population projection shows that about 70% of African rural population who depend on locally produced food will be significantly affected by environmental stress [7,8]. It was further indicated that the growth rate of cereal grains (food crops) was 1% while that of population was 3%. Correspondingly, as from 1980s to 2010s the per capita cereals production has decreased for about 15% (150–130) kg/person compared to Asia and South America whose figures progressed from 200 to 250 kg/person [1,9].
To raise the per capita cereal production, we need a sound agricultural/food policy that would be a central focus in relieving food shortage [10,11]. It is evident that most agricultural policies in the region are obscured by other sectoral policies such as environment, tourism, water and population which sometimes have contrasting procedures and regulations. Thus, a robust food policy that harmonizes other allied policies is very important in closing the yield gap (see Figure 1). Further, advanced technology should be well explicated in this policy to allow rational implementations of various agricultural plans and programs [12].
The robust implementation of a well-articulated food policy can address the key issues that have been causing poor yields in the region [13]. The impacts of climate change, weak labor, weak technology and inadequate agricultural systems are among the key challenges that should be well addressed in the policy. Despite of having low agricultural productivity, the Sub-Sahara Africa has not taken satisfactory efforts to elevate food security [9]. Instead, food requirement has increased for about 100 million tons of cereal food crops (maize, millet, sorghum etc.). For the past two decades, the food requirement gap has widened in the region despite the increase in food imports and aids to 180% and 290% respectively (from 16 to about 36 million tons) [14]. Theoretically, low production has been happening because of ineffective utilization of the endowed environmental resources i.e., especially land [15]. For instance, there has been increased soil degradation and deforestation by 16% and 70% respectively despite of being prohibited in most policies [7,9]. Therefore, there should be mechanisms to synthesize the policy formulation and implementations.
The present study locates in Tanzania where agriculture industry is a main source of food, energy, fiber, feed and other industrial raw materials [9]. It accounts for over 70% of the total economic activities and employs about 90% of the Tanzanians especially those in rural areas [16,17]. In addition, it provides up to 50% of the Gross National Product and 80% of the exports [18,19]. Maize accounts for over 70% of the national starch requirements and is a staple food for over 80% of the people in the country [18]. However, the country experiences frequent food shortage which is more pronounced in semi-arid agro-ecological zones. In due fact, the National Agriculture Policy [18], National Water Policy [20], National Population Policy [21] and National Environmental Policy [22] are alleged for not addressing this situation adequately. It is widely understandable that there is a need to ensure effective utilization of available resources to raise food security and socio-economic welfares; however, the two targets have been out of reach. For example, in 2013/2014 the food requirement was 7,656,673 tons but only 5,613,221 tons were produced and thus, making a food deficit of 2,043,452 tons (27%), leading to serious implications to food security and poverty [16]. This shortage was more pronounced in semi-arid zones.
Furthermore, the food survey report of 2014 showed that semi-arid regions had more than 50% food deficit. In the midst of this vain, Kimaro et al. [23], Mtengeti et al. [24], Mongi et al. [25], Yanda et al. [26] and Paavola [27] reported that climate change impacts and poor management of environmental resources were the major cause of that food shortage and therefore, all necessary and sustainable measures should be taken into serious consideration to curb them. During food shortage, there has been a tendency of the farmers blaming the government for not giving them subsides and aids while the government reverse the blames to them for not copping with the drought. In the midst of this, policy issues need to be carefully looked at. Besides, the socio-economic role of NGOs or/and international development banks is not much reflected at local level as they are mainly operating at ministerial level.
Although the science of assessing the changes in the crop yields in various agro-ecological zones is progressing rapidly, a variety of knowledge gaps still exist. This research was geared towards filling this gap of investigating the seasonal variability of food crop yields in semi-arid agro-ecological zone and their implications to food security and policy. This will enable policy makers to pay special attention to the most vulnerable and already affected areas when planning to optimize food security. Moreover, a robust food policy that explicitly touches the interest of the farmers can enable them to significantly cope with environmental stresses despite the limited resources.
Therefore, this study assesses the temporal production trends of maize, sorghum and millet (major food crops) in Kongwa District, the semi-arid area of central Tanzania to determine their contributions to food security and how food policy addresses this issue to make the country more food secure. We selected maize, sorghum and millet because they are staple food crops and determine food security for more than 90% in the country [26,27,28,29]. The findings of this study are expected to be useful to policy makers and implementers in agricultural sector at different level.
2. Materials and Methods
2.1. Conceptual Framework
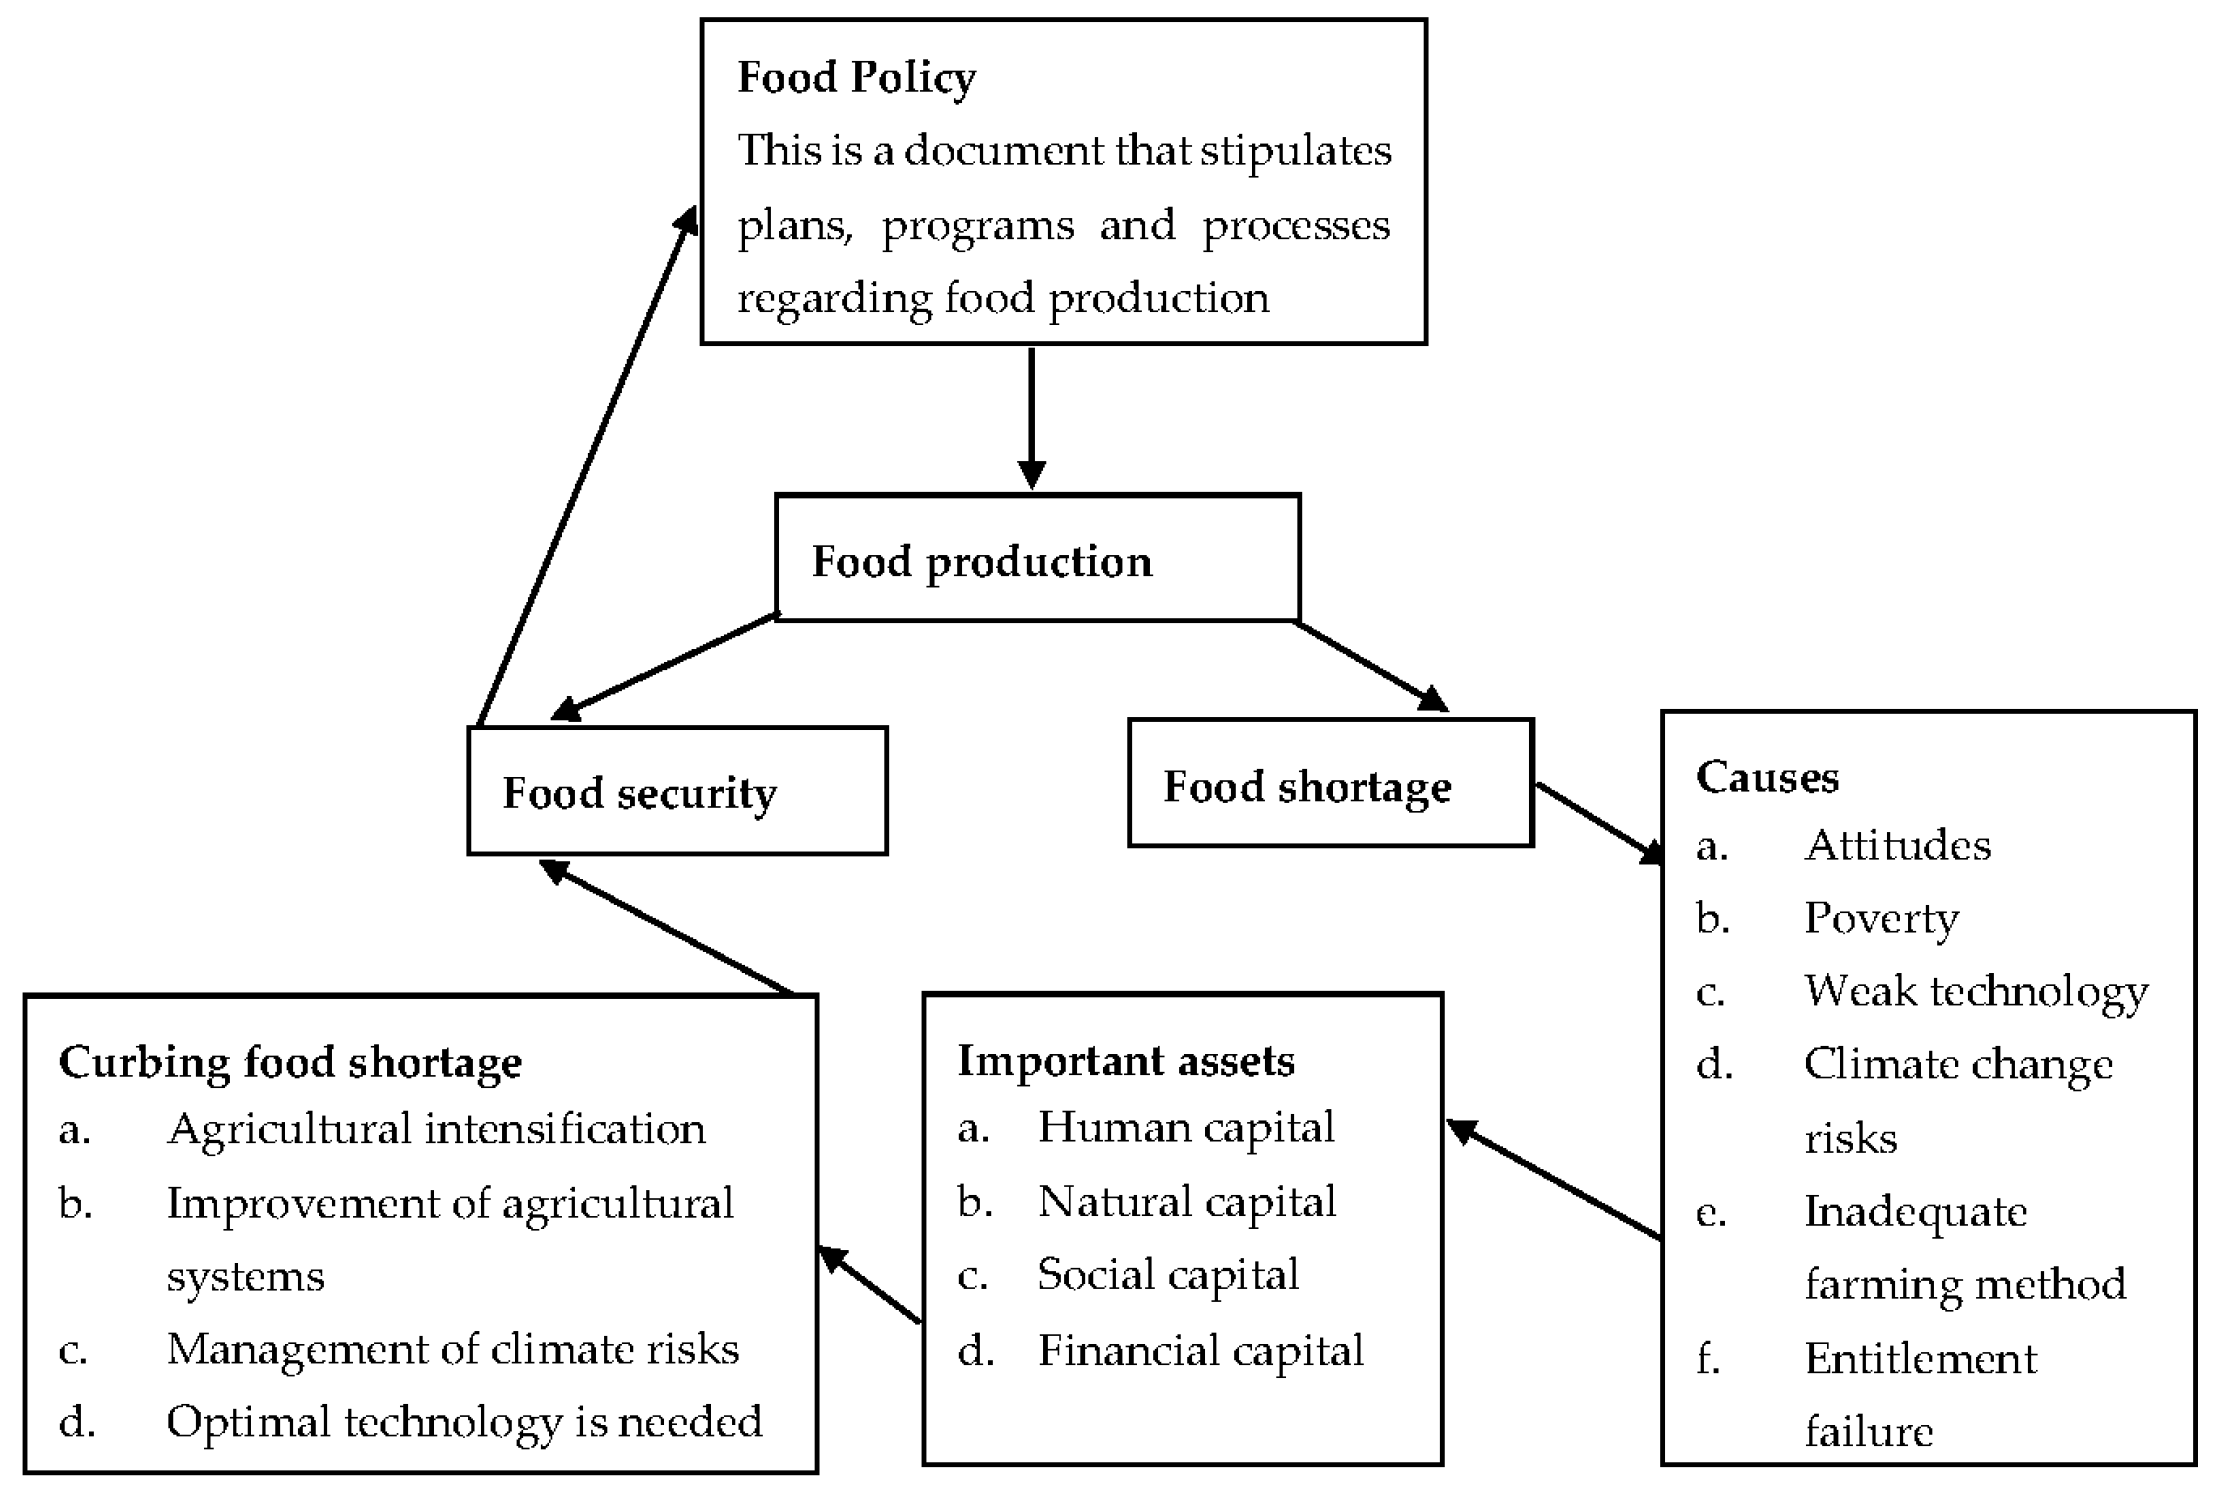
This study uses a conceptual framework to capture and elicit salient aspects of the study (Figure 1). This was purposively adopted to elicit the general and specific thoughts adopted in the study.
This conceptual framework (CF) indicates how a robust food policy can significantly contribute to yields optimization. The CF further clarifies that the major causes of poor yields can be poverty, weak technology, climate change risk and entitlement failure just to mention a few. These challenges need to be well addressed into the relevant policy to optimize the production. Best use of available assets such as human capital, natural capital, social capital and financial capital can facilitate the achievement of the goal (yield optimization). These can help to improve agricultural systems, management of climate risk and agricultural intensification. Therefore, the CF above carries the salient aspects to be dealt in the discussion of this paper, and eventually insinuates the best ways of advancing agricultural sector in Tanzania.
2.2. Profile of the Study Area
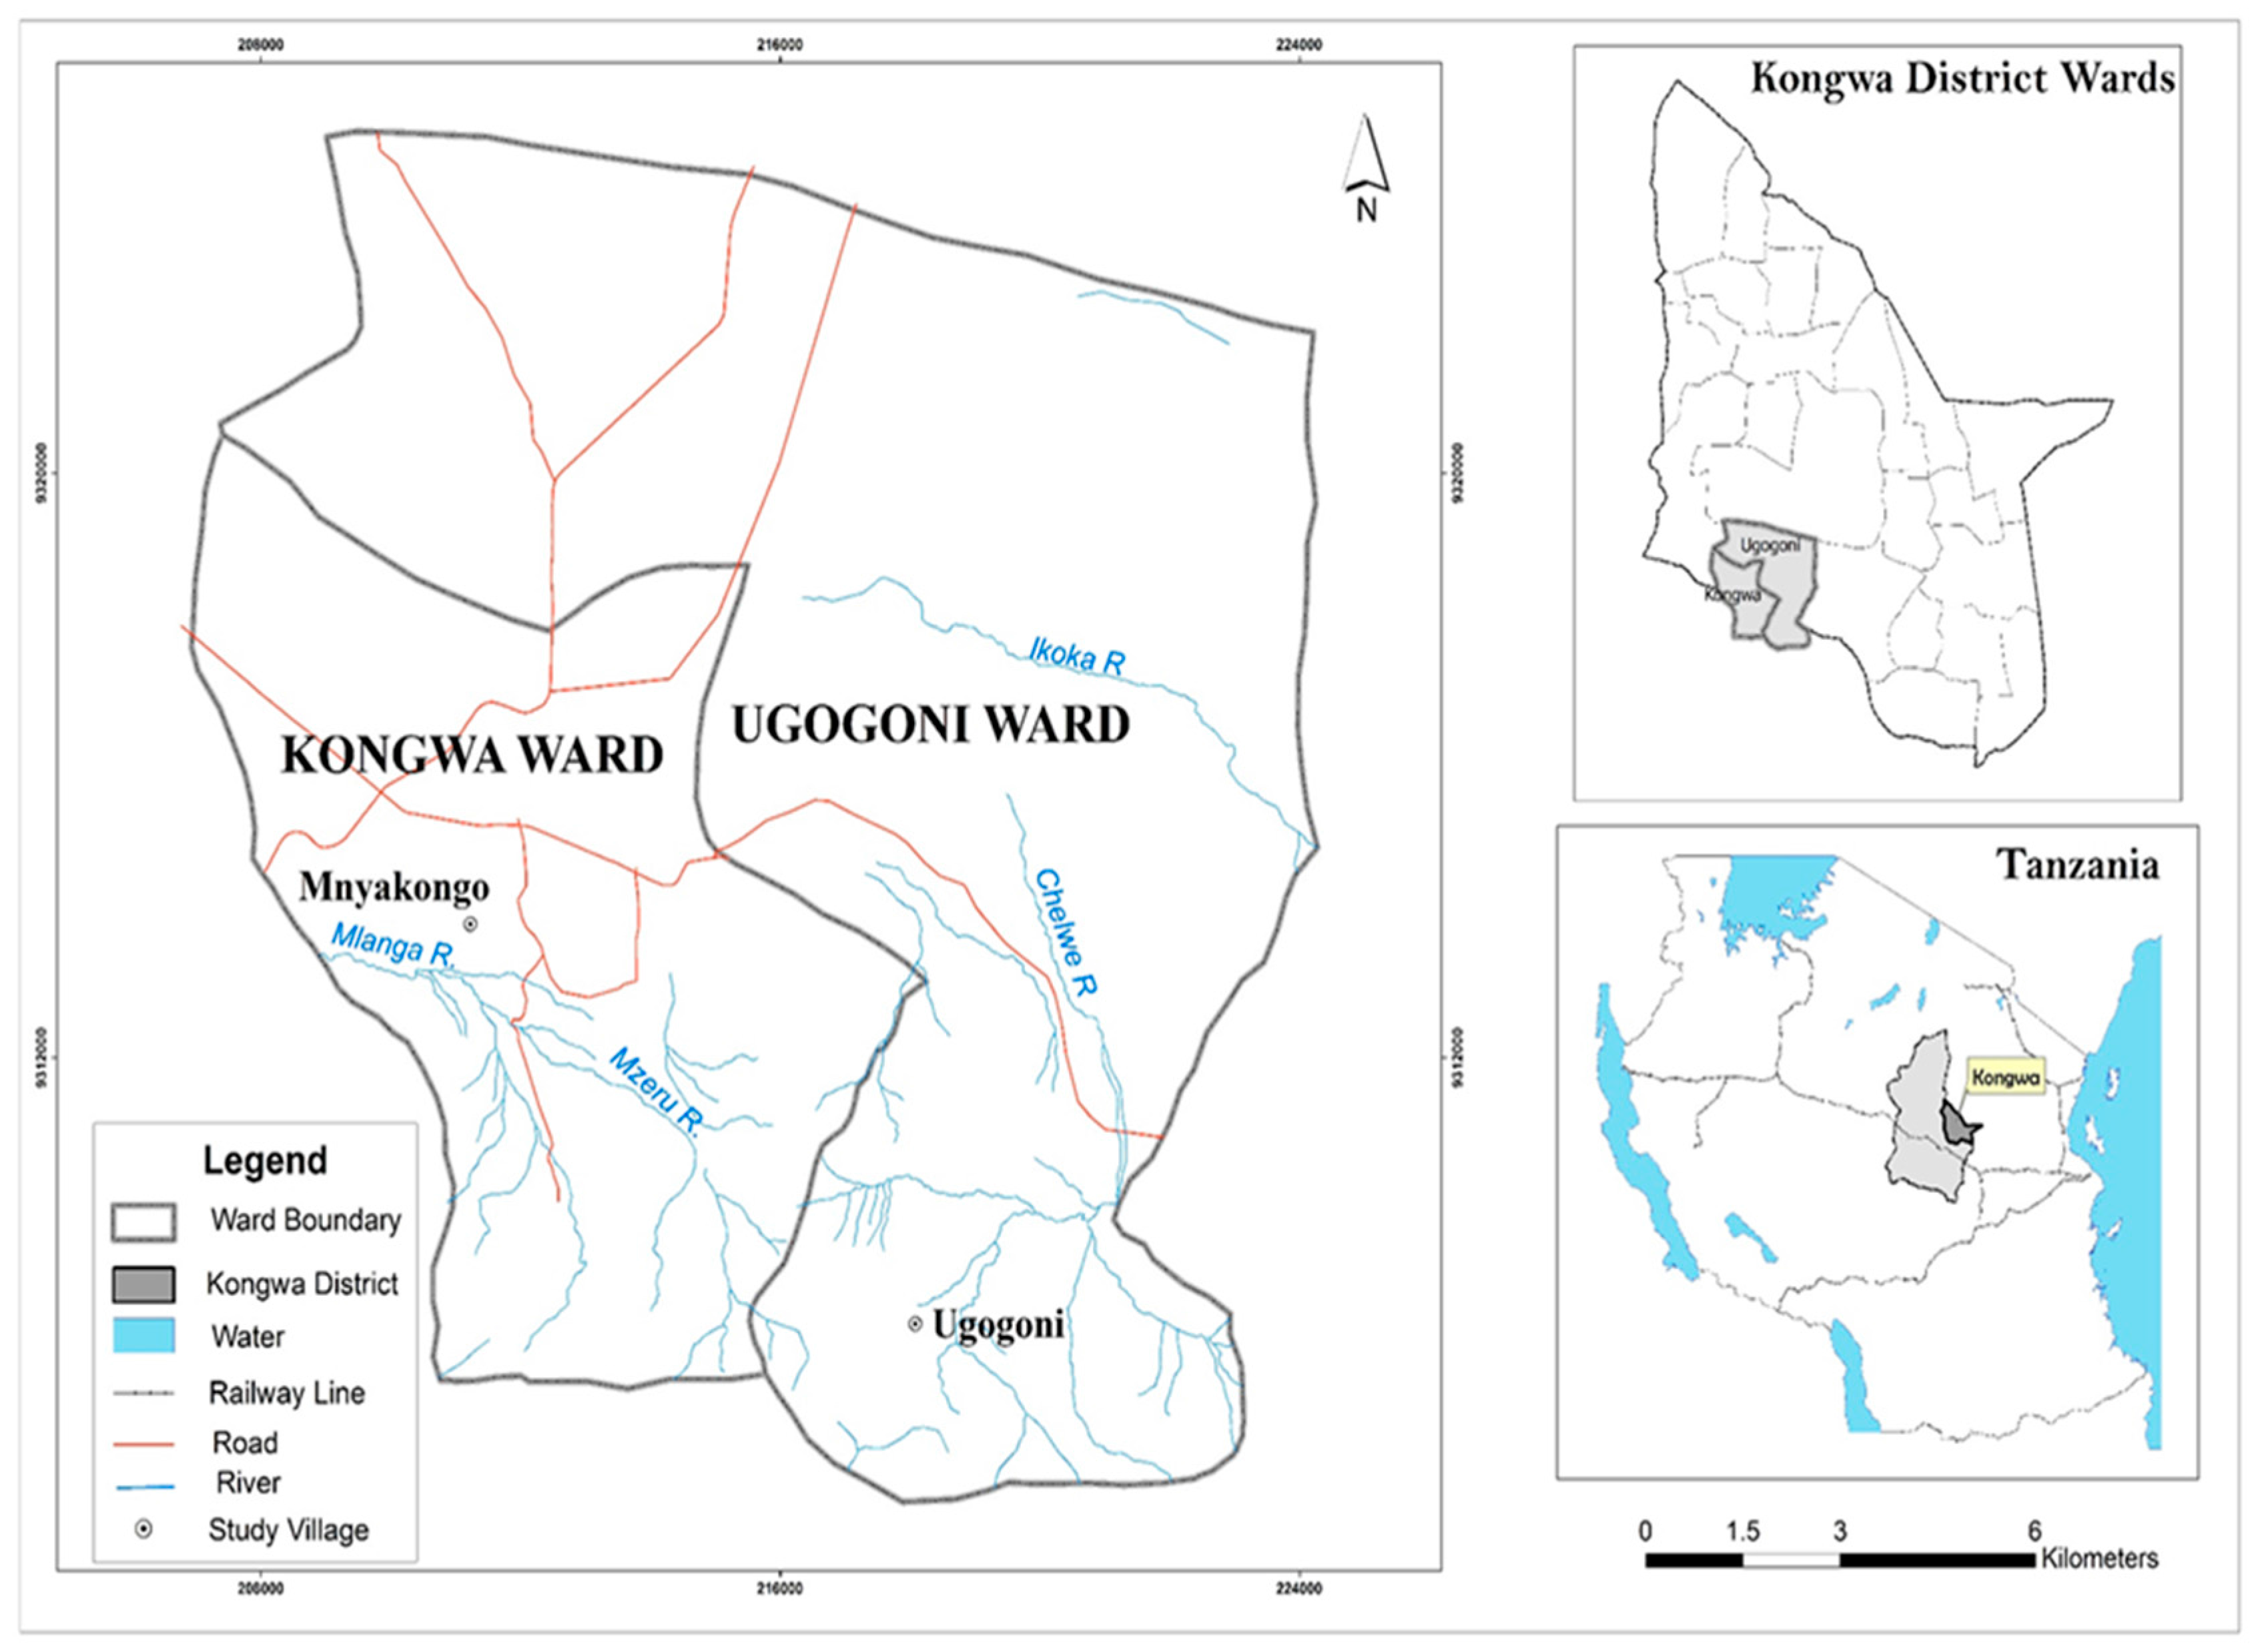
This study was carried out in the Kongwa District, the semiarid zone of Central Tanzania between June and September 2016. The elevation of the District ranges 900–1000 m a.s.l. and located on the leeward side of Ukaguru Mountains. It is located between latitude 5°30′ to 6°0′ S and longitude 36°15′ to 36° E, with an area of about 4041 km2. The vegetation type of the Central Tanzania is of bush or thicket. Mean annual precipitation in the area is 400–600 mm with a maximum of rain between December and April and a mean annual temperature is 26 °C. The soils are classified as Chromic Luvisols [30] with a sandy loam texture. The silt contents of the soils at the different farms were not significantly different (p > 0.05) and ranged between 170 and 255 g kg−1 soil with a bulk density between 1.25 and 1.65 Mg m−3. The soils are neutral to alkaline pH values, medium levels of organic C, N, P, K and trace soil elements. It has moderately high cation exchange capacity and high base saturation.
The current population of Kongwa District is estimated to be 318,995. Out of these, 156,982 are males and 162,013 are females. This population grows at a growth rate of 2.4% per annum. There is moderate population growth due to sustained rural—urban migration, which is prompted by a search for better employment prospects. The number of households is 60,301 with an average size of 4.9 persons. The number of farming households is 45,271 which are almost equal to 90% of the total households.
Labor force engaged in agricultural farming is 90 percent (of which farmers are 85 percent and livestock keepers are 5 percent). The dominant farming systems are cropping, livestock keeping and agro-pastoralism. The area has 117,598 cattle, 73,196 goats, 33,896 sheep, 32,592 pigs and 2656 donkeys [29]. These animals are potential as they can provide manure to farmers. Chemical fertilization is insignificantly applied in the area because it only focuses in irrigation schemes especially along Ikoka, Mzeru, Chelwe and Mlanga rivers (Figure 2).
2.3. Data Collection and Sampling Design
Household surveys, informative interviews, physical observations, group discussions and literature reviews were the main approach of data collection in the study area where 400 respondents were randomly sampled (Table 1).
Purposive sampling was employed to sample Kongwa among the semi-arid districts of Tanzania mainly based on the frequency of food shortage and other physical aspects [30]. The same approach was used to select the two village and informative interviewers. Further, simple random sampling was used to select the 400 households during survey [31]. Data related to crop yields of the major food crops (maize, sorghum and millet) were mainly collected from the Ministry of Agriculture, Livestock and Fishery (MALF) and Kongwa District Agricultural and Livestock Development Officer (DALDO) while climate data were gathered form the Kinyasungwe meteorological station located in the study area.
Moreover, the National Agricultural, Environmental, Water and Population Policies were consulted to gasp their implications toward food security. Here we conducted interviews with policy experts and agricultural officers at both ministerial and district levels respectively. In addition, publication materials such as books, journal papers, original scientific work, government reports and academic dissertation just to mention a few were adequately consulted during review to identify and bridge up the gap basing on the study’s objective.
The household questionnaires for this survey were constructed and designed purposely to grasp important information that answer the research questions. The main questions include: socio-economic characteristics of the household/respondents; household major economic activities; main types of crops produced; and farmers’ perceptions on food security and agricultural policy.
Therefore, the questionnaire encompassed the following sections: (i) The appraisal scenario where researchers introduced to respondents the rationale of the survey; (ii) The status of agricultural production and its influence to food security; (iii) Key agricultural aspects that are addressed in Agricultural Policy; (iv) If they are aware of policy issues or not and why? (v) Influence of global environmental change to agriculture; (vi) The role of the household head in ensuring food security. In between the reconnaissance survey and actual survey data collection, we trained research assistants on the appropriate way to administer questions. We introduced them the important aspects of the questionnaire.
Quantitative data were gathered using structured questionnaires as the main tool. The structured questionnaire covered questions on main agricultural practices, crops produced, amount of crop yields, implication of the obtained yields to food security, what is the major cause for crop yields, what are the existing strategies to curb food shortage, what are the way forward to solving the problem. Besides, climate data were collected in the meteorological station in the study area.
2.4. Data Analyses
We analyzed crops data from MALF and the study area basing on tons per hectare to obtain the actual production trends. If we could use the total yields, we could not get the actual results, because the total yields might increase due to expansion of farms or other factors. And this could show increased total yields while the actual production (tn ha−1) has decreased. The Mann-Kendall Test and Microsoft excel (window 13) were used for analyzing crop yields data. These analyses established the productions trend of each crop i.e., maize, sorghum and millet from 1980 to 2015. The Mann-Kendall Test was also employed to analyze the mean annual rainfall of the study area. The data from questionnaire survey were also independently analyzed. Quantitative data from the 400 questionnaires were coded and cleaned for final analyses. We employed Statistical Package for Social Sciences (SPSS) version 20 to analyze quantitative data. We carried out analysis to acquire frequency responses from farmers who expressed their understanding on various research aspects. From this, we also established some tables to present the results. In addition, we employed theme content methods to analyze qualitative data that were mainly collected through interview and group discussion.
3. Results
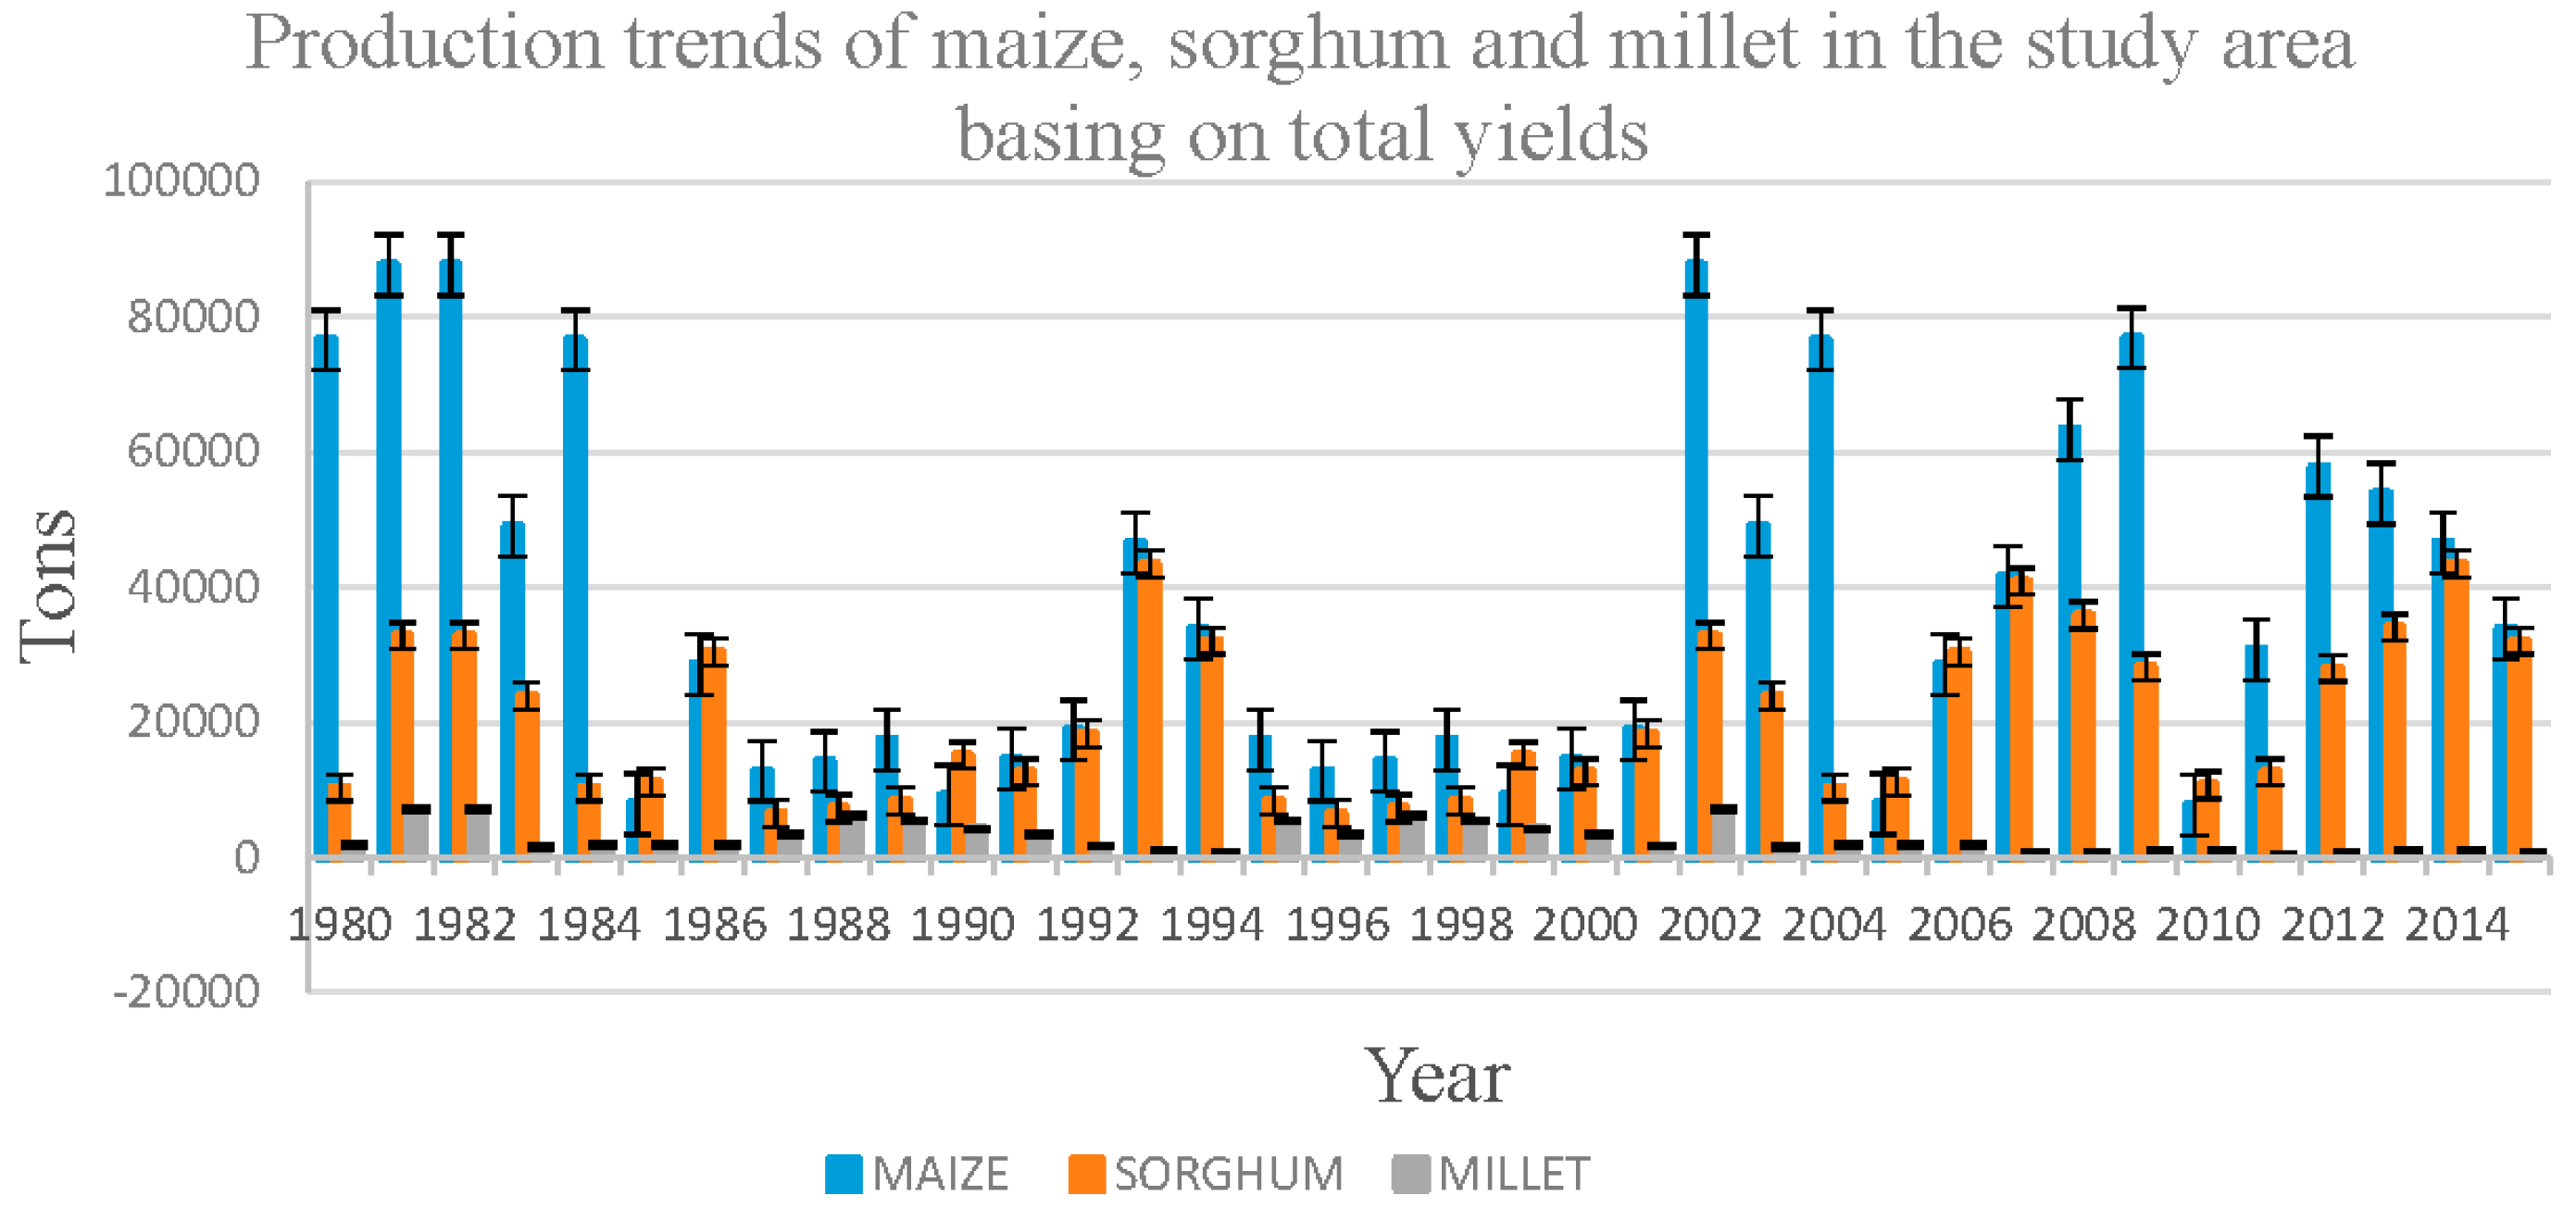
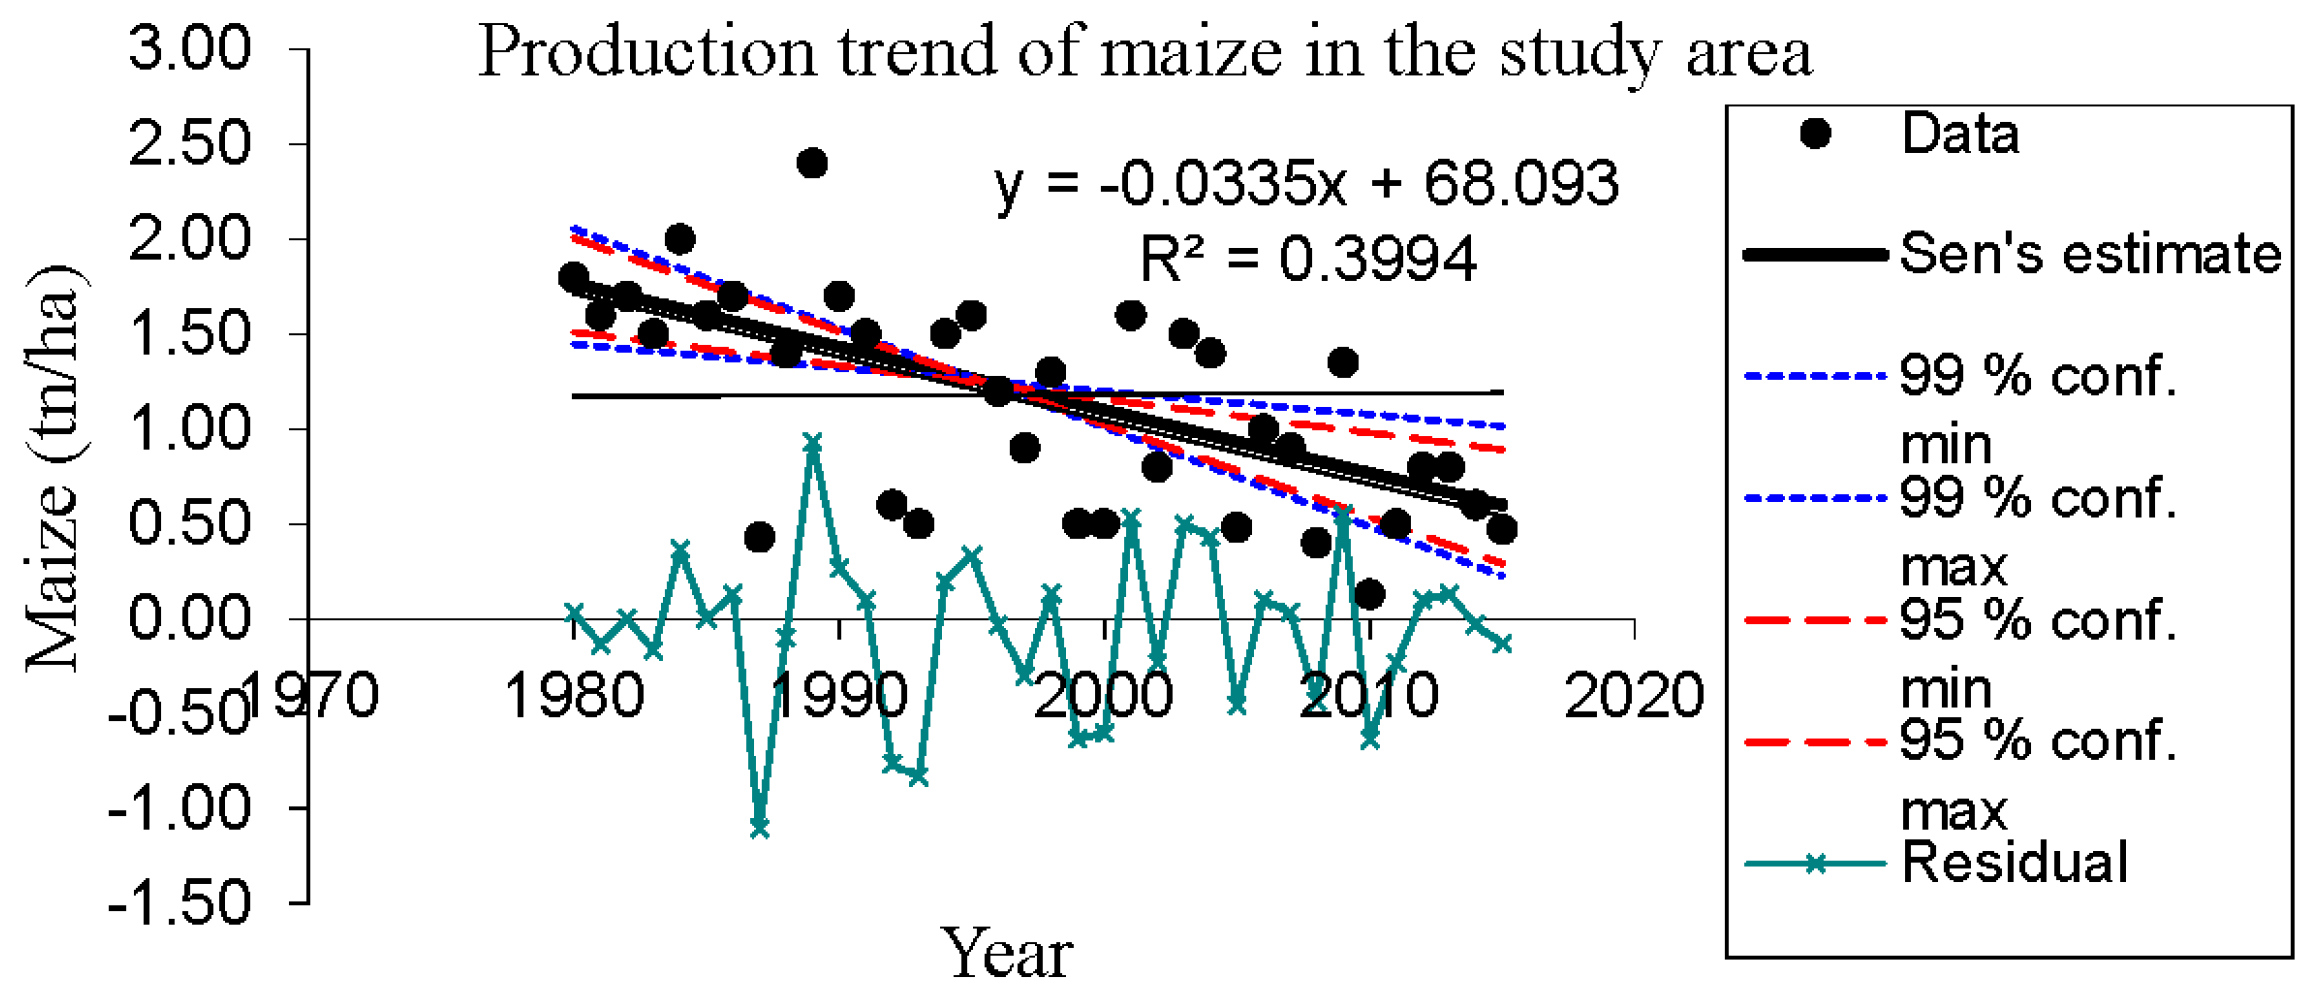
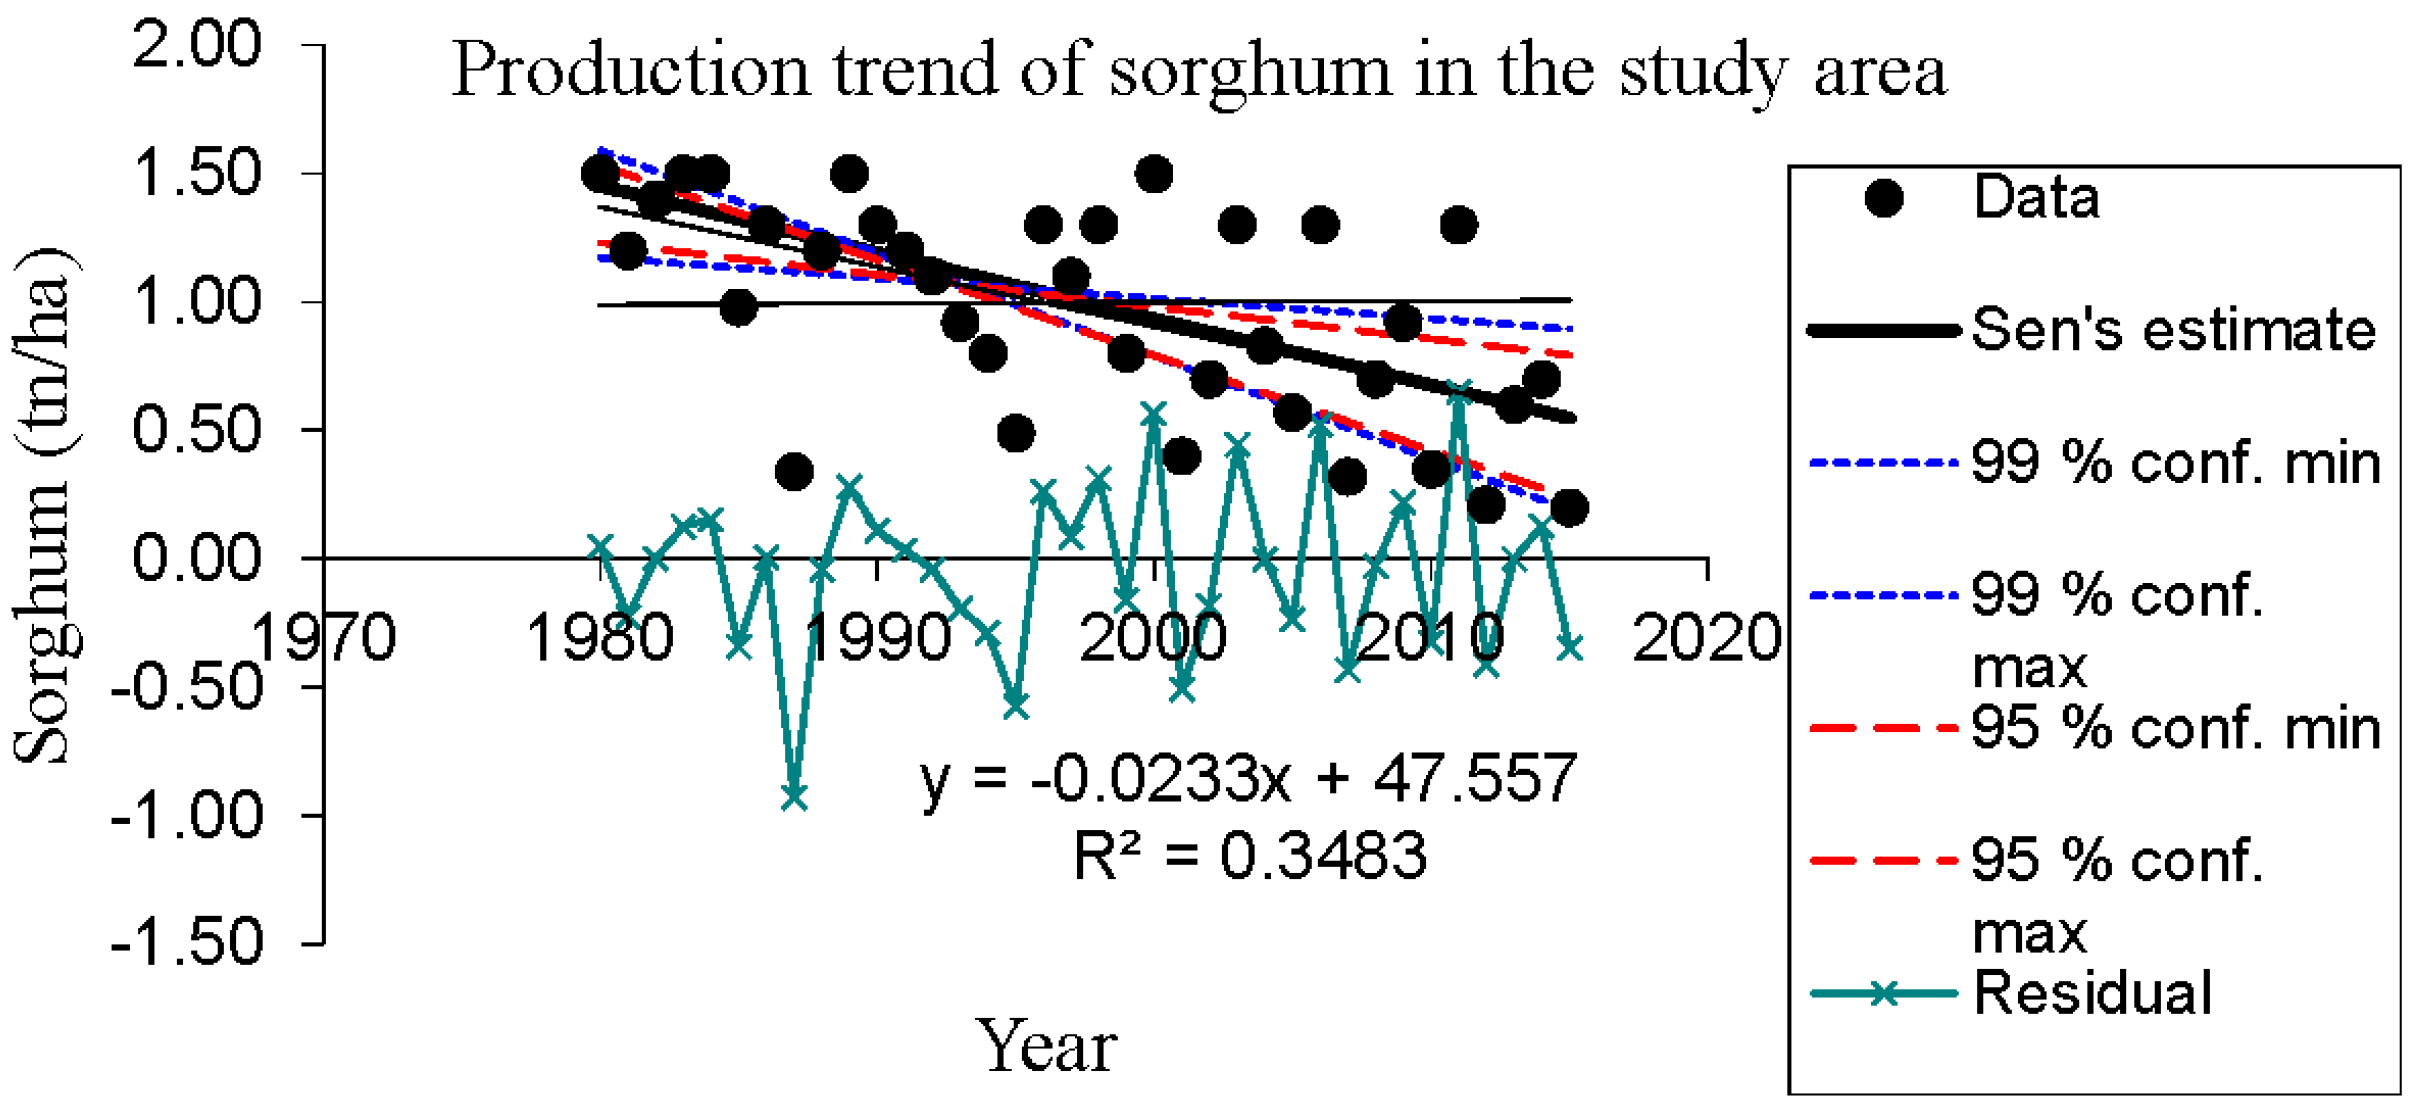
The overall results indicated that maize yields had high total quantity compared to sorghum and millet (Figure 3). In good years it accounted to 90,000 tn while sorghum and millet trailed to 4000 tn and 1000 tn respectively (Figure 3). We analyzed the yields per hectare to determine the actual seasonal variability (Figure 4, Figure 5 and Figure 6). The results from such analysis showed that maize, sorghum and millet yields significantly decreased (p < 0.05) at R2 = 0.40, 0.35 and 0.11 respectively (Figure 4, Figure 5 and Figure 6). In additional, 80% of the interviewed farmers were in agreement with the results (see Table 2). They further mentioned extreme drought as the significant cause of the vain. Moreover, a number of government reports such as the National Adaptation Program of Action (NAPA) and the review of food and agricultural policies of 2014 had similar observation on the same [16,29]. The prolific elucidation of each crop is done in Section 3.1, Section 3.2 and Section 3.3 below.
3.1. Maize Production
The production trend of maize has been decreasing from 1980 to 2015 at R2 = 0.40 (see Figure 4). The overall quantitative decrease ranged from 2.2 to 1.5 ton per hectare (3% per year). In addition, over 80% of the respondents had similar observation (see Table 2). They further vetted extreme climate variability as a major cause of the crisis. The studies by Paavola [27] and Msongaleli et al. [32] pointed out in favor of the farmers’ observation. In addition, the results from interviews cemented on the same. It is discernible that maize (Zea mays L.) is the main food crop throughout levels from the local to the national as account for over 70% of the cereal food requirement in the country [18]. The crop is also a staple food in most African communities in Kenya, South Sudan, Burundi, Mali, Ghana, Ivory Coast, Nigeria, Malawi and Democratic Republic of Congo [3,5,10]. Therefore, its production has a strong determination to food security.
3.2. Sorghum Production
Sorghum is among the dominant crops in the study area (semi-arid) produced under smallholder farming. It is among the most drought resistant crops and therefore its resilience to climate change impacts is a bit high. Despite this resilience, its production has been decreasing at R2 = 0.35 (Figure 5). The overall quantitative decrease ranged from 1.4 to 0.5 ton per hectare (2.5% per annum). In addition, more than 80% of respondents had agreement with these results (see Table 2). They mostly pointed at excessive droughts and soils infertility as the major causes of yield decline in their areas. On such premises, they asserted that, the former is due to climate change impacts while the latter is amplified by continuous cultivation without soil fertilizations. The studies by Lobell and Field [33] also had similar observation with the results of the present study.
3.3. Millet Production
Millet has been trivially produced in the area compared to maize and sorghum respectively. Even its production was potentially low compared to maize and sorghum. Its production trend has been decreasing at a non-significant rate (p > 0.05) at R2 = 0.11 as seen in Figure 6. Meanwhile, the rate of yields decline was less compared to maize and sorghum respectively. This is because most millet cultivars are resistant to droughts and other environmental stresses. Further, the results from informative interviews, discussion and physical observation confirmed on the same (see Table 2).
3.4. Mean Annual Rainfall
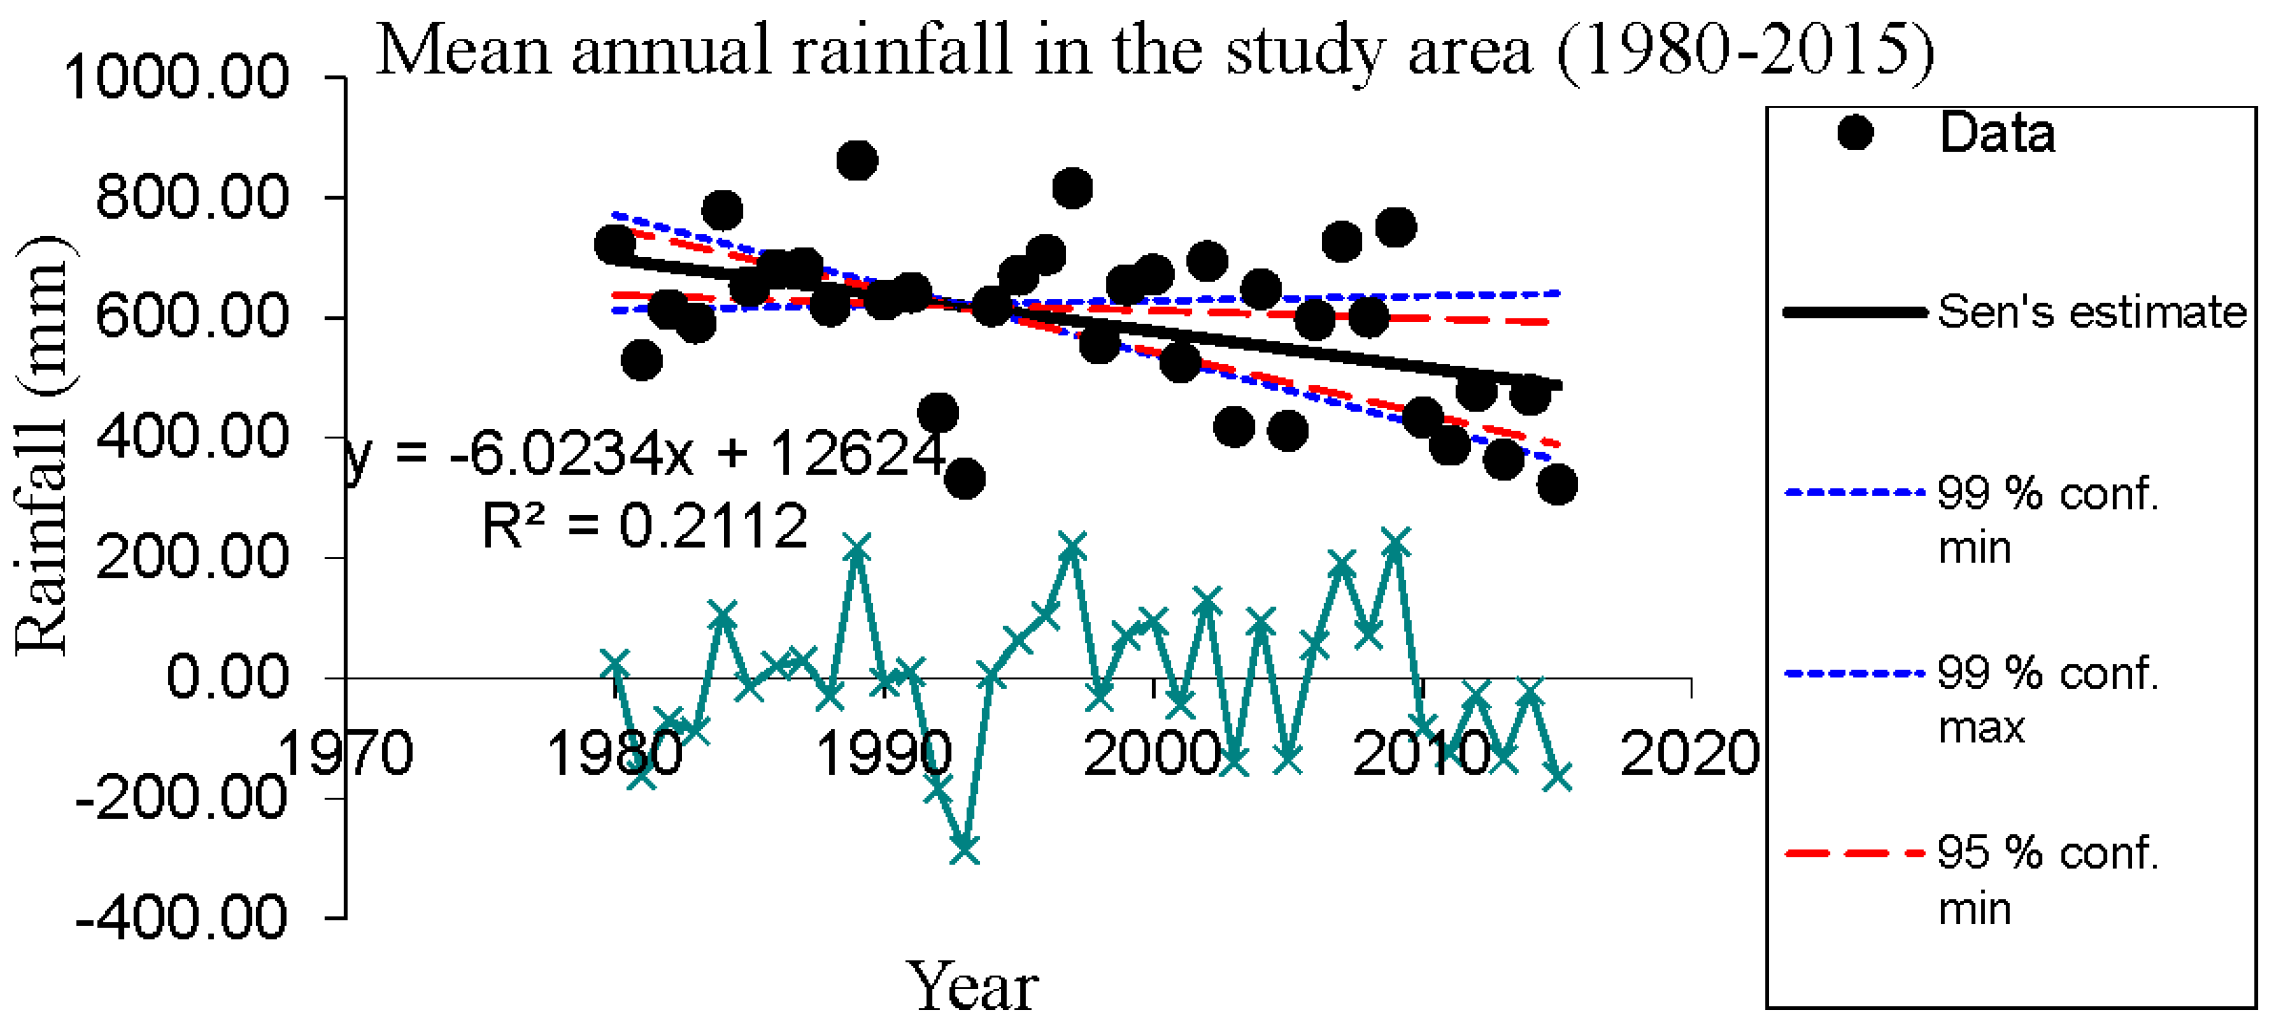
Given the level of vulnerability, it was wealthier to assess the trend of rainfall variability in the area as a cofactors of yields data analyses. The results in Figure 7 below shows that rainfall has been decreasing at the rate of R2 = 0.21. This mean annual rainfall depict the general trend of rainfall availability and intensity in the area. Statistically, this trend has adverse impacts on crop production and the agro-ecosystems at large.
3.5. Response from Farmers
The results from data analyses from the Ministry of Agriculture, Livestock and Fisheries (MALF) had association with those from the respondents (Table 2). Overall, most farmers perceived that the production trend of the major food crop has been unsatisfactory and thus, has posed frequent food shortage (insecurity) and exacerbated poverty.
The results in Table 2 above explore the actual situation of the farmers in the study areas and other related regions with similar biophysical characteristics. Although the majority respondents had basic education, they had a wide understanding on their locality more especially on the socio-economic and biophysical change of their local condition.
3.6. Food Security
According to FAO [34,35,36] food security has got three major pillars namely (i) Food availability; this refer to sufficient quantities of food available on a consistent basis; (ii) Food access; this refer to having sufficient resources to obtain appropriate foods for a nutritious diet; (iii) Food use which refer to appropriate use based on knowledge of basic nutrition and care, as well as adequate water and sanitation. Moreover, food insecure households refers to unable, at some time during the year, to provide adequate food for one or more household members due to lack of resources whilst a very low food secure households refers disruption of normal eating patterns of some household members and their food intake reduced below levels they considered appropriate.
Self Sufficient Ratio (SSR) refers to the situation where food availability is compared to food requirement to determine the food deficit [16,17]. It is expressed as SSR of the area = Production/Requirement × 100%. Basing on these concepts, we calculated the SSR to determine the food security in the area. We used the crops yield data from the Ministry of Agriculture and Kongwa District (District Agricultural and Livestock Development) to calculate it. Consideration was on the availability, accessibility and use of food.
In the study area, the SSR varied depending on the production levels of food crops. The calculation hereunder has given mathematical explanation of this concept. The results from group discussion, informative interviews and physical observation gave additional information on the same that was useful to make inference of the study. Table 3 below gives evidence that the yields from food production have not been enough for a couple of years.
Calculation
Basing on the information from the District Agricultural and Livestock Development Officer (DALDO),
- (i)
- The total production of staple food crops (maize, sorghum and millet (2015) = 55,649,500 kg.
- (ii)
- The annual food requirement was 75,681,563.75 kg. This figure was obtained through the following procedure;
- -
- The number of people (especially adults) in the study area is 318,995.
- -
- According to FAO [36], the daily requirement of food (particularly starch) per person is 0.65 kg.
Therefore, the daily starch requirement of the people in the study area: =Total Population × 0.65 kg
Hence, 318,995 × 0.65 = 207,346.75 kg (per day)
Since, 207,346.75 kg is the daily food (starch) requirement, then the annual food (starch) requirement for the total population in the study area.
Therefore, 207,346.75 kg × 365.25 (days) = 75,733,400.4375 kg (yearly food requirement)
Since SSR = Production/Requirement × 100%
Thus,
SSR = (55,649,500 kg/75,733,400.4375 kg) × 100% = 73.4%
Therefore, 73.4%% as the SSR means, there was a food shortage of 26.52% in the study area.
These findings were then supported by household heads where over 70% of the respondents informed that they have reduced the number of meals from three to two or one as a coping mechanism. Some adjusted to the situation by eating wild food (fruits, roots etc.). For any reasons, this problem is significant and is more pronounced to the poorest households. The researchers of this study also confirmed on the severity of the problem and it was clear that the majority were living under severe starvation. In general, we can conclude that the production of the three crops has not been enough to suffice food security in the area.
Results from analyses showed that there is strong correlation between the prevalence of food insecurity, and the impacts of climate change and variability (p < 0.05) in the study. Despite the existence of some adaptation and coping strategies, yet food insecurity has remained an acute challenge in the area. Thus, good strategies are needed to increase yields otherwise we cannot further progress in terms of economic development and other community welfare.
3.7. Policy Framework
National Agriculture Policy (NAP) [18] is a leading instrument to spearhead agricultural industry in the country. Besides, other relevant sectoral policy that works closer to NAP includes but not limited to: National Water Policy [20], National Population Policy [21] and National Environmental Policy [22]. These government instruments collectively aim to elevate the living standard of the people through sustainable utilization of environmental resources [18,20,21,22]. This is stipulated in Agricultural Policy (in Sections 3.1.1, 3.4.1, 3.5.1 and 3.12.1), Water Policy (in Section 2.3), Population Policy (in Section 4.9), and Environmental Policy (in Section 4.6).
NAP indicates that, the country has an arable land around 44 million hectares with diverse water resources ranging from big lakes to numerous rivers, and wetland ecosystems [18]. However, only 10.8 million hectares (24%) of this arable land has been under agriculture. Further, this percent is greatly dominated by small scale farming who always yield less harvest around 3 tn/ha, this is contrary to the productivity potential of 6–7.5 tn/ha [18]. Besides, the irrigation potential is also poorly harnessed as less than 4% of the irrigable land has been exploited. Thus, compelling efforts are needed to expand the production systems of agriculture in the country.
4. Discussion
4.1. Crops Yield
The results from analyses indicated that the yields from both small and medium scale farming had temporal fluctuation (Figure 3, Figure 4, Figure 5 and Figure 6). For a duration of about 35 years; the production trends for maize, sorghum and millet have been declining significantly at R2 = 0.40, 0.35 and 0.11 respectively. This is in agreement with Lobell et al. [15], and Lobell and Field [33]. This trend has also been observed in other African countries such as Malawi, Kenya, South Africa, Mali and Niger [3,10].
In the context of sub-Sahara Africa, the region has diverse climate, politics and historical background that significantly contribute to low yields and environmental unsustainability [36,37,38,39,40]. The countries located in arid and semi-arid agro-ecological zone are more vulnerable than those with moderate climate. Besides, the intra-climate variations within each country pose diverse magnitude of the impacts [40,41,42,43,44,45].
Among the major aspects that hinder crop production in the study area is climate change impacts. This is evidenced by the decreasing trend of the mean annual rainfall (Figure 7). Besides, there has been a positive correlation between the production trend of crops and rainfall variability (Figure 4, Figure 5, Figure 6 and Figure 7). Despite of adopting some drought resistant crops cultivars, the yields remained insignificant (Figure 3, Figure 4, Figure 5 and Figure 6). Maize appeared to be more vulnerable to environmental stress than sorghum and millet as it significantly declined than others (Figure 4). In addition, millet was resistant to drought as it insignificantly declined than maize and sorghum (Figure 6). This resistance was attributed by the bulrush and finger millet varieties which are predominantly produced in the area.
The production trend from 1980 to 2015 was fairly inconsistence and thus, it brought about socio-economic turbulence to the farmers. Further, the results revealed that there were significance difference (p < 0.05) between the low and medium class and/or above on the capacity to produce or/and recover from environmental stress. This was evidenced by the crop failure and increased vulnerability and as stipulated in Table 2 and Table 5 respectively. In this case, the poor farmers were more vulnerable than the wealthy class. Previously, Tanzanian agriculture was meant to provide food for survival and other socio-economic welfare to farmers. However, the current situation is quite different because the obtained yields is no longer helpful to the majority farmers (i.e., smallholder farmers) even for a quarter of a year i.e., especially during bad years.
In geomorphological aspect, highland areas had fewer yields than the lowland. Quantitatively, the low land farms produced about two times than the counterpart side. This appeared to be attributed by high soil moisture content in the lowland than in the highland). Similarly, the lowland appeared to receive organic materials through run-off which eventually decomposed into organic matter (useful for crops production) than the highlands did. The results were in agreement with Kimaro et al. [23]. These could be among the reasons for the yields differences between the two lands.
Another novel aspect in our analyses indicated that, among other things, excessive drought and poor soil management were the major reasons for crop failure in the area. In this aspect, climate change impacts, poor soil and inappropriate agronomic practices were significantly implicated on the same [29]. In addition, Rowhani et al. [28], informed that 20% increase in intra-seasonal precipitation variability reduces agricultural yields by 4.2%, 7.2%, and 7.6% respectively for maize, sorghum, and rice which are the major food crops in Tanzania.
Likewise, Neufeldt et al. [37] and Harvey et al. [38] supported that soil organic management practices such as application of animal manure, little tillage and soil cover increase have significant contribution to increased crops yield and thus, they need to be adopted in agricultural production. These practices eventually optimize food security, the resilience/adaptive capacity of farmers and mitigation of climate change by sequestering carbon in biomass and soils and/or reducing greenhouse gases emissions.
Poor yields of the major food crops brought socio-economic repercussion to the community. It was revealed that, despite the major aim of crop production being for food, farmers also aimed to sell (cash) the excess yields (Table 4), the target was not met due to low and seasonal variability of yields.
In this regards, seasonal variability of crop yields (i.e., decrease) caused frequent food shortage, hunger and economic turbulence especially in most vulnerable areas. The prevalence of frequent hunger and undernourishment further brought about malnutrition and other allied diseases especially to children under five years. On top of that, the academic progress among the primary and secondary school learners also deteriorates due to starvation. In all, shortage had multiple negative impacts to social, economic, academic and political aspects. Physical observation and discussions indicated that most farmers were weak to cope or recover from the posed environmental stress. Therefore, the government and other development partners should take proactive measures to build socio-economic capacity of these smallholder farmers.
4.2. Rainfall
The global impacts of climate change are observed to have adverse impacts to crop production and agro-ecosystems at local level. The results in Figure 7 indicates that the mean annual rainfall has been decreasing at the rate of R2 = 0.21. This decrease has adversely affected crops production as seen in Figure 3, Figure 4, Figure 5 and Figure 6 above. This is also evident from most local areas of Tanzania where climate change is greatly interpreted as the variability of rainfall. This is because the farmers can easily identify the impacts at field level. However, despite of this understanding there has been no permanent solution to limit the problem.
Since the rains are projected to decrease and temperature increase in the study area, early maturing and high yielding maize cultivars such as open pollinated varieties of Staha, TMV-1, STUKA M1 and Kilima-ST are recommended. Similarly, water use efficient and drought tolerant varieties such as hybrid varieties like TAN 250 are equally considered to be effective in the face of climate change. In addition, the drought resistant millet varieties such as finger and bulrush need to the strengthened to optimize the yields in the face of climate change. This should be done to other crops such as sorghum, beans, sunflower and ground nuts which are predominantly produced in the area.
4.3. Status of Food Security
The calculation in Section 3.6 above reveals that, out of 365 days, SSR of food was about 70% thus making 30% food insecure. This means, overall out of 365 days, there were about 85 days (roughly 3 months) a year in which people had no food access, hence, they were food insecure. However, this quantitative food shortage is not necessarily be in the continuum days and months, but it reflects the general magnitude of food shortage in the area. By all means, this situation leads to abject malnutrition and death to people especially to children under 5 years. Despite of having no in-depth statistics, the Ministry of Heath approximates to about 5% of the children have been dying of that. Further, abject poverty limited some farmers to access food from other areas (i.e., districts). The destitute mostly relied on remittances, government aids, religious institutions and other development partners. Unfortunately, it appears that always the destitute are many than the available capacity to feed.
These results were also observed by UN agencies like FAO, WHO and UNDP who categorize Sub-Sahara Africa as the most affected and vulnerable region to global environmental change while IPCC [6] grouped Tanzania among the 13 most affected and vulnerable countries by climate change in the world. Thus, the present study and the findings from other studies herewith, justify what is exactly happening on the ground.
Besides, it appeared that old people were more vulnerable to the stressed environment and food shortage than the working class (15–64 years) because they were socio-economically weak to adjust or cope with the incumbent dreadful conditions. During hunger they could not migrate to turban areas to seek employment as young people always do. We further noticed that, despite of being vulnerable, some of these elders had responsibility of taking care of their grandchildren whose biological parents either died or divorce. For example, the 80 years old man, expressed his deep feeling to the researcher that he has been living alone after the death of his wife and children for a couple of years ago. Despite of that situation, he was obliged to engage in crop production using hand hoe to earn his daily bread from the farm. He gave long-life experience in agriculture and declared that, the production of the major food crop had has a tremendous downfall. Finally, he concluded that, compelling efforts from the government and development partners are cordially needed to curb the situation.
This kind of vulnerability was also observed in Malawi and Niger by Ricker-Gilbert and Jones [12] and in most sub-Sahara Africa by UNDP [2] and Conceição et al. [3]. The semi-arid arid and other vulnerable ecosystems appeared to be mostly impacted. The western African countries like Mali, Niger and Ivory Coast were good example in this vain [11].
A study by Rowhani et al. [25] and Msongaleli et al. [32] on the impacts of climate change on cereal crops observed that crop failure is mostly caused by climate variability. They also indicated that, poor people are adversely impacted than the wealthy who are resilient to the dreadful condition. Hence, wherever impact happens in the community, it is the weak people who mostly suffer the consequences and thus, policy makers and planners have to have a third eye on these destitute and think big on the same.
Therefore, it should be understandable that, to improve food security, social welfare and economic development we need to be more innovative in the production systems and more preferably the dissemination of research finding on crops, fertilizations and possible irrigation. Otherwise, to achieve economic development while struggling for food security will not be fruitful.
4.4. Policy Implications
Agricultural policy of 2013 which responsible for food production has stipulated various aspects that meant to improve crop production. This stipulation has also been done by other related policies such as Environmental Policy 1997, Water Policy and Land Policy. For example, Section 1.3 of the Agricultural Policy outlines challenges that are mostly directed to last users. To accord such a problem, the establishment of strong institutions is inevitable. This also include legal organs with well stipulated laws, Acts, regulations and procedures. However, the interpretations of these laws, regulation and Acts should be clear. Despite of these stipulations, farmers are still facing frequent food shortages. This is attributed by the increased factors that influence the vulnerability of the farmers (Table 5).
In general most rural areas of Sub-Saharan Africa have poor institutions that could reduce the level of vulnerability [41,42,43,44]. Economic factors such as lack of assets and entitlement failure limit the capacity to adapt to dreadful conditions [6]. Entitlement failure of natural resources leads to degradation of common resources with little economic return [4,42,45]. Semi-arid areas of Tanzania and other vulnerable ecosystems in Africa experiences frequent food shortages due to the fore mentioned reasons. Again, the optimal policy that harmonizes the situation in a more holistic way is pleasantly indorsed to curb the situation.
The policy implementation was another novel aspect observed in the field. Food availability, accessibility and use have been increasingly affected by weak implementation of policies. This emanates from inadequate needs assessment through insufficient quantification of the required sustenance in the destitute community. In most cases, the assessment bases on simple approximation instead of detail evaluation. By doing so, even when the required food is brought by whichever organ, it could not suffice the destitute. Therefore, all important socio-economic welfares of the farmers should be well embedded in the framed policy and ensure definite implementation of the same.
Food pricing has also been a serious problems to food accessibility. The policy states that, food availability and accessibility will be positive accorded. However, during shortage, the pricing is commonly controlled by the business group and thus, making food accessibility almost impossible to the starving and destitute class. Ultimately, this bring about serious suffering to these people.
Therefore, despite of having explicit policy, there is a need to amend them so that they can fit into the changing environmental parameters. Again, the regulations should not conflict each other, instead, they altogether resolve the upsetting challenges. Lastly, in the situation where new challenges arise, new policy should be established to address the same [42,45].
5. Conclusions
It is evident that the production trend of maize, sorghum and millet have been declining significantly and thus, causing food shortage and insecurity in the area. Since 1980–2015 there has been a decline in yields for maize, sorghum and millet. This situation have had caused frequent food shortages and famine. In other words, famine has not yet been curbed because the production is still not promising. Among other things, agricultural policy has not well addressed the problems especially those emanating from global environmental change. Under such a condition, the farmers, especially old people (the dependence class) have been more vulnerable to famine than the rich class as they have limited adaptation options and weak recovery from the impacts. The results from the calculations in Section 3.6 above, has provided empirical results and interpretation that the area is food insecure and thus, this ultimately imply that the poor suffer the consequences.
Despite the NAP 2013 and its allied policies aiming to ensure food security in the country, the crisis still persist and thus, most farmers who constitute agricultural industry in the country are in mess. Their vulnerability arises mostly from their poor endowments (less than 2 ha under cultivation) and entitlement failure (famine and hunger). Therefore, there is a need to revise agricultural policy by accommodating new needs of farmers to build socio-economic capacity, optimize production and upsurge their livelihoods.
Hereunder, are some potential aspects that can be accommodated in the policy to build capacity of the farmers in both semi-arid agro-ecological zones and the whole country.
- Thorough assessment should be done countrywide to assess the differential requirements of the people. This should mainly focuses the smallholders located in the marginalized areas.
- Quantification of needs assessment across different agro-ecological zones, i.e., inputs.
- Timely supply of the agricultural inputs i.e., fertilizers, seeds etc.
- Proper budgeting and timely provision of help especially during food shortage instead of making long logistics until some of the victims die.
- Substantial guidance on the proper adaptations to climate change impacts as they vary over agro-ecological zones.
- Government should put her hand in agriculture by not only providing subsidies but also having some farms as demonstration. This will oust the dominant dogma in the country that agriculture is for the people with no livelihood options. As well, this will help to increase food reserves through surplus production.
- Therefore, there is a need to make compelling efforts to ensure surplus food production and sustainable food security is in the country. After that, the country would plan for serious industrialization to make an economically stable country.
Acknowledgments
We are indebted to the Chinese Government Scholarship (CSC) for providing the scholarship for Msafiri Y. Mkonda. We also wish to thank research assistants who were involved in data collection. This study is supported by a China Scholar Council International PhD Program to Msafiri Mkonda and the 2015 Chongqing 100 Talents Program to Xinhua He at the Southwest University in Beibei, Chongqing, China. Further, we convey our gratitude thanks to the two anonymous reviewers for their comments and insights on our paper. Their constructive suggestions and inputs remains a permanent assert for reporting similar scientific works in future.
Author Contributions
Both authors designed the study. M.Y.M. collected the data in the study area, analyzed and wrote a first draft. Author X.H. revised the manuscript to get a final draft for submission. Both authors read and approved the final version for submission.
Conflicts of Interest
The authors declare no conflict of interest.
References
- Food and Agriculture Organization. FAOSTAT Agriculture Data; FAO: Rome, Italy, 2003; Available online: http://apps.fao/cgi-binnph-db.pl?suset=agriculture (accessed on 25 July 2016).
- United Nations Development Programme (UNDP). Africa Human Development Report 2012: Towards a Food Secure Future; United Nations Development Programme (UNDP): New York, NY, USA, 2012. [Google Scholar]
- Conceição, P.; Levine, S.; Lipton, M.; Warren-Rodríguez, A. Toward a food secure future: Ensuring food security for sustainable human development in Sub-Saharan Africa. Food Policy 2016, 60, 1–9. [Google Scholar] [CrossRef]
- Sen, A. Capability and well-being. In The Quality of Life; Nussbaum, M., Sen, A., Eds.; Clarendon Press: Oxford, UK, 1993. [Google Scholar]
- Mmbando, F.; Wale, E.; Baiyegunhi, L. Welfare impacts of smallholder farmers’ participation in maize and pigeon pea markets in Tanzania. Food Secur. 2015, 7, 1211–1224. [Google Scholar] [CrossRef]
- Intergovernmental Panel on Climate Change. Climate Change Impacts. In Adaptation, and Vulnerability. Part A: Global and Sectoral Aspects; Contribution of Working Group II to the Fifth Assessment Report of the Intergovernmental Panel on Climate Change; Field, C.B., Barros, V.R., Estrada, Y.O., Genova, R.C., Girma, B., Kissel, E.S., Levy, A.N., MacCracken, S., Mastrandrea, P.R., White, L.L., et al., Eds.; Cambridge University Press: Cambridge, UK; New York, NY, USA, 2014. [Google Scholar]
- ECA (Economic Commission for Africa). Harnessing Technologies for Sustainable Development; ECA: Addis Ababa, Ethiopia, 2002. [Google Scholar]
- Department of Economic and Social Affairs. United Nations World Population Prospects: The 2000 Revision; Department of Economic and Social Affairs: New York, NY, USA, 2001.
- Food and Agriculture Organization of the United Nations. Soil Fertility Management in Support of Food Security in Sub-Saharan Africa; FAO: Rome, Italy, 2001. [Google Scholar]
- Cornia, G.; Deotti, L.; Sassi, M. Sources of food price volatility and child malnutrition in Niger and Malawi. Food Policy 2016, 60, 20–30. [Google Scholar] [CrossRef]
- Higgins, N.; Hintermann, B.; Brown, M. A model of West African millet prices in rural markets. Food Policy 2015, 52, 33–43. [Google Scholar] [CrossRef]
- Ricker-Gilbert, J.; Jones, M. Does storage technology affect adoption of improved maize varieties in Africa? Insights from Malawi’s input subsidy program. Food Policy 2015, 50, 92–105. [Google Scholar] [CrossRef]
- Seufert, V.; Ramankutty, N.; Mayerhofer, T. What is this thing called organic?—How organic farming is codified in Regulations. Food Policy 2017, 68, 10–20. [Google Scholar] [CrossRef]
- Wart, J.; Kersebaum, K.; Peng, S.; Milner, M.; Cassman, K. Estimating crop yield potential at regional to national scales. Field Crops Res. 2012, 143, 34–43. [Google Scholar] [CrossRef]
- Lobell, D.B.; Cassman, K.G.; Field, C.B. Crop yield gaps: Their importance, magnitudes and causes. Annu. Rev. Environ. Resour. 2009, 34, 4. [Google Scholar] [CrossRef]
- United Republic of Tanzania (URT). Review of Food and Agricultural Policies in the United Republic of Tanzania; MAFAP Country Report Series; FAO: Rome, Italy, 2014.
- United Republic of Tanzania (URT). Poverty and Human Development Report; Government Publishing Press: Dar es Salaam, Tanzania, 2009.
- United Republic of Tanzania (URT). National Agriculture Policy; Government Publishing Press: Dar es Salaam, Tanzania, 2013.
- Bagachwa, M. Poverty Alleviation in Tanzania: Recent Research Issues; Dar-es-Salaam University Press: Dar es Salaam, Tanzania, 1994. [Google Scholar]
- United Republic of Tanzania (URT). National Water Policy; Government Publishing Press: Dar es Salaam, Tanzania, 2002.
- United Republic of Tanzania (URT). National Population Policy; Government Publishing Press: Dar es Salaam, Tanzania, 2006.
- United Republic of Tanzania (URT). National Environmental Policy; Government Publishing Press: Dar es Salaam, Tanzania, 1997.
- Kimaro, A.; Mpanda, M.; Rioux, J.; Aynekulu, E.; Shaba, S.; Thiong’o, M.; Mutuo, P.; Abwanda, S.; Shepherd, K.; Neufeldt, H.; et al. Is conservation agriculture ‘climate-smart’ for maize farmers in the highlands of Tanzania? Nutr. Cycl. Agroecosyst. 2015. [Google Scholar] [CrossRef]
- Mtengeti, E.J.; Brentrup, F.; Mtengeti, E.; Eik, L.O.; Chambuya, R. Sustainable intensification of maize and rice in smallholder farming systems under climate change in Tanzania. In Sustainable Intensification to Advance Food Security and Enhance Climate Resilience in Africa; Springer: Berlin, Germany, 2015; pp. 441–465. [Google Scholar]
- Mongi, H.; Majule, A.E.; Lyimo, J.G. Vulnerability Assessment of Rain-fed Agriculture to Climate Change and Variability in Semi-arid areas of Tanzania. Afr. J. Environ. Sci. Technol. 2010, 4, 370–383. [Google Scholar]
- Yanda, P.; Kalumanga, E.; Mubaya, P. Post Dialogue Report. In Proceedings of the Integrating Climate Change Adaptation and Mitigation in Development Planning: National Science-Policy Dialogue in Tanzania, Dar es Salaam, Tanzania, 20–22 January 2010. [Google Scholar]
- Paavola, J. Livelihoods, vulnerability and adaptation to climate change in Morogoro, Tanzania. Environ. Sci. Policy 2008, 11, 642–654. [Google Scholar] [CrossRef]
- Rowhani, P.; Lobell, D.B.; Linderman, M.; Ramankutty, N. Climate variability and crop production in Tanzania. Agric. For. Meteorol. 2011, 151, 449–460. [Google Scholar] [CrossRef]
- United Republic of Tanzania (URT). National Adaptation Programme of Action (NAPA); Division of Environment, Vice President’s Office: Dar es Salaam, Tanzania, 2007.
- Food and Agriculture Organization. FAO—Unesco Soil Map of the World, Revised Legend, with Corrections and Updates; World Soil Resources Report 60; Reprinted with Updates as Technical Paper 20; ISRIC: Wageningen, The Netherlands, 1988. [Google Scholar]
- Kothari, C. Methods and Technique. In Research Methodology, 2nd ed.; New Age International Publisher: New Delhi, India, 2004; p. 31. [Google Scholar]
- Msongaleli, B.; Rwehumbiza, F.; Tumbo, S.; Kihupi, N. Impacts of Climate Variability and Change on Rainfed Sorghum and Maize: Implications for Food Security Policy in Tanzania. J. Agric. Sci. 2015, 7, 124. [Google Scholar] [CrossRef]
- Lobell, D.B.; Field, C.B. Global scale climate-crop yield relationships and the impacts of recent warming. Environ. Res. Lett. 2007, 2, 1–7. [Google Scholar] [CrossRef]
- Food and Agriculture Organization. Declaration of the World Summit on Food Security; World Summit on Food Security 16–18 November 2009; FAO: Rome, Italy, 2009. [Google Scholar]
- Food and Agriculture Organization. State of Food Insecurity 2010-11: Women in Agriculture—Closing the Gender Gap for Development; FAO: Rome, Italy, 2011. [Google Scholar]
- Food and Agriculture Organization. FAOSTAT. 2012. Available online: http://faostat.fao.org/ (accessed on 10 January 2017).
- Neufeldt, H.; Jahn, M.; Campbell, B.M.; Beddington, J.R.; De Clerk, F.; De Pinto, A.; Gulledge, J.; Hellin, J.; Herrero, M.; Jarvis, A.; et al. Beyond climate smart agriculture: Toward safe operating spaces for global food systems. Agric. Food Secur. 2013, 2, 12. [Google Scholar] [CrossRef] [Green Version]
- Harvey, C.A.; Chaco’, M.; Donatti, C.I. Climate-smart landscapes: Opportunities and challenges for integrating adaptation and mitigation in tropical agriculture. Conserv. Lett. 2014, 7, 77–90. [Google Scholar] [CrossRef]
- Lipton, M. Africa’s national-accounts mess. J. Dev. Stud. 2013, 49, 12. [Google Scholar] [CrossRef]
- Lipton, M. Learning from Others: Increasing Agricultural Productivity for Human Development in Sub-Saharan Africa; Working Paper 2012-007; United Nations Development Programme, Regional Bureau for Africa: New York, NY, USA, 2012. [Google Scholar]
- Lobell, D.; Bänziger, M.; Magorokosho, C.; Bindiganavile Vivek, B. Nonlinear heat effects on African maize as evidenced by historical yield trials. Nat. Clim. Chang. 2010. [Google Scholar] [CrossRef]
- Sen, A.K. Development as Freedom; Knopf, A., Ed.; Oxford University Press: New York, NY, USA, 1999. [Google Scholar]
- Adger, N. Vulnerability. Glob. Environ. Chang. 2006, 16, 268–281. [Google Scholar] [CrossRef]
- Eriksen, S.; Noess, L.O. Pro-Poor Climate Adaptation: Norwegian Development Cooperation and Climate Change Adaptation; Norwegian Agency for Development Cooperation: Oslo, Norwegian, 2003. [Google Scholar]
- Mkonda, M.Y.; He, X.H. Are Rainfall and Temperature Really Changing? Farmer’s Perceptions, Meteorological Data, and Policy Implications in the Tanzanian Semi-Arid Zone. Sustain. J. 2017, 9, 1412. [Google Scholar] [CrossRef]
Figure 1.
The Conceptual Framework of Food Policy Source: Created by the Authors, 2017.

Figure 2.
The Study Area. Source: Created by the GIS unit of IRA, University of Dar es Salaam, 2016.
Figure 2.
The Study Area. Source: Created by the GIS unit of IRA, University of Dar es Salaam, 2016.

Figure 3.
Production trends of maize, sorghum and millet in the study area. Source: Field Survey Data, 2016.
Figure 3.
Production trends of maize, sorghum and millet in the study area. Source: Field Survey Data, 2016.

Figure 4.
Production trend of maize (tn/ha) in the study area. Source: Field Survey Data, 2016.

Figure 5.
Production trend of sorghum (tn/ha) in the study area. Source: Field Survey Data, 2016.

Figure 6.
Production trend of millet (tn/ha) in the study area. Source: Field Survey Data, 2016.

Figure 7.
Mean annual rainfall in the study area. Source: Field Survey Data, 2016.


Table 1.
Respondents profile.
| Region | District | Village | Total Households | Respondents |
|---|---|---|---|---|
| Dodoma | Kongwa | Mnyakongo | 2050 | 200 |
| Ugogoni | 2080 | 200 |
Field Survey Data, 2016.
Table 2.
Responses (Yes) on important aspects of agriculture and policy.
| Adaptation Activities | Mnyakongo (N = 200) | Ugogoni (N = 200) | Total (N = 400) |
|---|---|---|---|
| Average maize yields per HH (<500 kg) | 160 | 151 | 155.5 |
| Average sorghum yields per HH (<500 kg) | 172 | 177 | 174.5 |
| Average millet yields per HH (<500 kg) | 172 | 165 | 168.5 |
| Maize yields not sufficient for food | 185 | 188 | 16.5 |
| Sorghum yields not sufficient for food | 175 | 176 | 175.5 |
| Millet yields not sufficient for food | 180 | 191 | 185.5 |
| Awareness on Food Policy | 20 | 16 | 18 |
| Unfair distribution of agricultural inputs | 160 | 155 | 157.5 |
| Willingness to address climate impacts | 170 | 165 | 167.5 |
Source: Field Data Survey, 2016.
Table 3.
Production trend (in tons) of maize, sorghum and millet in the study area (1996–2015).
| Year | Maize | Sorghum | Millet | Total | ||||
|---|---|---|---|---|---|---|---|---|
| Produced | Required | Produced | Required | Produced | Required | Produced | Required | |
| 1996 | 12,800 | 17,500 | 6500 | 9700 | 3460 | 4500 | 22,760 | 31,700 |
| 1997 | 14,200 | 18,400 | 7300 | 12,000 | 6300 | 9300 | 27,800 | 39,700 |
| 1998 | 17,400 | 23,900 | 8400 | 13,000 | 5400 | 8500 | 31,200 | 45,400 |
| 1999 | 9200 | 23,500 | 15,100 | 17,000 | 4200 | 6800 | 28,500 | 47,300 |
| 2000 | 14,600 | 17,900 | 12,600 | 18,000 | 3400 | 4390 | 30,600 | 40,290 |
| 2001 | 18,800 | 25,900 | 18,300 | 23,900 | 1670 | 2300 | 38,770 | 52,100 |
| 2002 | 95,600 | 138,000 | 32,800 | 52,000 | 7200 | 9800 | 135,600 | 199,800 |
| 2003 | 48,990 | 68,800 | 23,900 | 34,000 | 1600 | 2000 | 74,490 | 104,800 |
| 2004 | 119,300 | 136,000 | 10,320 | 13,500 | 1820 | 2300 | 131,440 | 151,800 |
| 2005 | 79,300 | 99,600 | 11,200 | 14,900 | 1850 | 2500 | 20,980 | 117,000 |
| 2006 | 28,600 | 35,000 | 30,400 | 42,900 | 1830 | 2400 | 60,830 | 80,300 |
| 2007 | 41,500 | 68,000 | 40,820 | 65,000 | 710 | 1100 | 83,030 | 134,100 |
| 2008 | 63,313 | 89,000 | 35,818 | 45,800 | 768 | 1080 | 99,899 | 135,880 |
| 2009 | 76,867 | 94,000 | 28,179 | 34,590 | 826 | 1300 | 105,872 | 129,890 |
| 2010 | 77,560 | 89,000 | 10,706 | 13,500 | 974 | 1400 | 19,436 | 103,900 |
| 2011 | 30,741 | 58,000 | 12,617 | 15,609 | 212 | 390 | 43,570 | 73,999 |
| 2012 | 57,834 | 89,000 | 28,018 | 32,000 | 643 | 890 | 86,495 | 121,643 |
| 2013 | 53,831 | 85,000 | 34,019 | 40,000 | 1017 | 1350 | 88,868 | 126,350 |
| 2014 | 46,582 | 65,900 | 43,375 | 54,000 | 994 | 1300 | 90,952.25 | 121,200 |
| 2015 | 33,848 | 40,000 | 21,067 | 34,000 | 734.5 | 1681.563 | 55,649.5 | 75,681.5 |
Source: Ministry of Agriculture, Livestock and Fisheries [18].
Table 4.
Percentage of utility among the key crops in the study area.
| Crop | Food | Cash | Food & Cash | Total (%) |
|---|---|---|---|---|
| Millet | 60 | 1.3 | 38.7 | 100 |
| Maize | 80 | 0 | 20 | 100 |
| Sorghum | 65 | 5 | 30 | 100 |
| Average (N = 400) | 68.3 | 2.1 | 29.5 | 100 |
Source: Field Survey Data, 2016.
Table 5.
Examples of factors that influence vulnerability.
| Institutional Factors | Economic Factors | Environmental Factors |
|---|---|---|
|
|
|
Source: Modified from Eriksen and Noes [44].
© 2017 by the authors. Licensee MDPI, Basel, Switzerland. This article is an open access article distributed under the terms and conditions of the Creative Commons Attribution (CC BY) license (http://creativecommons.org/licenses/by/4.0/).
Share and Cite
MDPI and ACS Style
Mkonda, M.Y.; He, X. Yields of the Major Food Crops: Implications to Food Security and Policy in Tanzania’s Semi-Arid Agro-Ecological Zone. Sustainability 2017, 9, 1490. https://doi.org/10.3390/su9081490
AMA Style
Mkonda MY, He X. Yields of the Major Food Crops: Implications to Food Security and Policy in Tanzania’s Semi-Arid Agro-Ecological Zone. Sustainability. 2017; 9(8):1490. https://doi.org/10.3390/su9081490
Chicago/Turabian StyleMkonda, Msafiri Y., and Xinhua He. 2017. "Yields of the Major Food Crops: Implications to Food Security and Policy in Tanzania’s Semi-Arid Agro-Ecological Zone" Sustainability 9, no. 8: 1490. https://doi.org/10.3390/su9081490
Note that from the first issue of 2016, this journal uses article numbers instead of page numbers. See further details here.