Effect of Distance on Open Innovation: Differences among Institutions According to Patent Citation and Reference


1
Tenured Principal Researcher, Daegu Gyeongbuk Institute of Science and Technology (DGIST), 50-1 Sang-ri, Hyeonpung-Myeon, Dalseong-Gun, Daegu 711-873, Korea
2
Principal Researcher, Korea Institute of Science and Technology Information (KISTI), Hoegi-Ro, 66 Dongdaemun-Gu, Seoul 130-741, Korea
*
Authors to whom correspondence should be addressed.
Sustainability 2017, 9(8), 1478; https://doi.org/10.3390/su9081478
Submission received: 3 July 2017
/
Revised: 7 August 2017
/
Accepted: 18 August 2017
/
Published: 21 August 2017
(This article belongs to the Special Issue Sustainability of Economic Growth: Combining Technology, Market and Society)
Abstract
:The main topic of this paper is the effects of distance between technology and the market, on open innovation. For this, we set up two research questions, as follows: Is there any relation between the distance between technology and the market, and open innovation? If there is, what differences are there in the relation among Fortune 500 companies, non-Fortune 500 companies, laboratories, universities, and start-ups? First, this study measured the distance between technology and the market of a patent by the size of its list of references and citations. Second, the OI network among patent application subjects was described based on patent similarity. Third and most importantly, regression analyses were used to answer the research questions. The first result was that there were differences in the distance and OI among Fortune 500 firms, Fortune non-500 firms, laboratories, universities, and start-ups. Thus, there are relations between the distance between technology and the market, and open innovation. The second result was that the distance between technology and the market was found to moderate the open innovation effect in Fortune 500 companies and laboratories.
1. Introduction
The “information age” and the “knowledge economy” have brought with them a shift in key economic assets, from resources to labor and technology, and from the natural environment to knowledge [1]. With this, capitalism is now being redefined as a complex and evolving system [2]. As the knowledge-based society accelerates, more and more aspects of knowledge and technology are being applied to patents. However, the ratio or possibility of realizing patents into successfully commercialized products significantly varies among subjects of patent application. In other words, there are different sorts of gap between technologies and markets of patents applied for by organizations such as Fortune 500 and non-Fortune 500 companies, universities, laboratories, and start-ups. In addition, gaps for diverse subjects differently affect open innovation (OI) performance. Facebook, which was a small start-up at a university and also a non-Fortune 500 company, became a Fortune 500 company within 10 years of its foundation. In most instances, students and researchers create their companies right after they finish university, with some succeeding in the long run [3].
Maybe the distance between technology and the market will be different among five agents. In addition, open innovation will have a relationship with the distance between technology and the market. However, until now, the relation between open innovation and the distance between technology and the market was not sufficiently developed because, most of all, the way to measure the distance between technology and the market was not yet elucidated.
Based on these situations, we set two research questions as follows.
- (1)
- Is there any relation between the distance between technology and the market, and open innovation?
- (2)
- If there is, what differences are there in this relation among Fortune 500 firms, non-Fortune 500 companies, laboratories, universities, and start-ups?
This research was conducted to answer the above two questions. The first question was designed to determine the relation between OI and the distance between technology and the market, which was measured by a patent of a specific subject. Here, we wanted to measure the level of OI, in addition to the distance between technology and the market, using patents.
On the other hand, the second question sought to identify differences between the OI and the distance between technology and the market depending on the subject, such as Fortune 500 companies, non-Fortune 500 companies, laboratories, universities, and start-ups. For this, we divided major subjects of applied patents into five groups and attempted to clarify the differences among the groups.
All patents that were applied for at the United States Patent and Trademark Office (USTPO) in the computer, information, and communication sectors in 2007 will be analyzed in this study. The targets of this study were 47,409 patents from G04 to G08 in the computer sector, 13,544 patents from G09 to G12 in the information sector, and 34,993 patents from H03 to H04 in the communication sector.
The median of the references and citations of the patents applied for in the five subjects was analyzed by the number of the patents applied for in 2007. However, to block the impact of patent size on organization performance, the analysis of the relation difference between the OI and the distance between technologies and markets of each of the five subjects was made by targeting the top 100 subjects of patent application of each of the five subjects.
2. Literature Review and Research Framework
2.1. Literature Review
Rimmer and McLennan [4] (p. 14) analyzed the challenges in intellectual property by exploring the legal aspects of the following emerging technologies:
- (1)
- Medicine, biotechnology, and genomics;
- (2)
- Biobanks, bioinformatics, and biobricks;
- (3)
- Genetics, stem cells, and nanotechnology;
- (4)
- Biodiversity, food security, and climate change.
Similarly, one study by Ejermo [5] uses patent counts to examine the effects of environmental policies on technological innovation in renewable energy.
Aside from being used as an indicator of technological importance, patent citations can serve as a measure of the value of innovations. With this, following an empirical analysis of a particular innovation, patent citations can be significant indicators of the value of innovations such as computed tomography scanners [6]. Trajtenberg, Henerson, and Jaffe [7] stated that “importance” and “generality” are measures for the basicness of an innovation, while the degree of technological self-reliance and faithfulness to the innovational paths comprise the basicness of research [7]. It is also through the analysis of patent citations that people can measure spillover, knowledge diffusion, and knowledge obsolescence [8]. In addition, patent citations can serve as evidence of the level of the geographic localization of knowledge spillovers [9].
In addition, it was discovered that modeling of the flow of patent citations could serve as a reflection of knowledge diffusion across institutional and geographic boundaries, such as that from universities and federal laboratories; moreover, patent citations also prove patterns of how knowledge flows from one country to another [10,11]. Through patent citation analysis, the effects of universities and federal laboratories on commercial innovation can be measured [12,13].
To analyze the technological closeness given the closeness of two IPC classes, both the main and supplementary classifications of patents have to be examined [5]. From the main classification of a patent, “spillovers” can be inferred to the patent’s supplementary class [14]. In addition, patent diversity, which is measured by classes or subclasses, can also be used as a predictor of regional innovation [5]. Technological diversity, measured by patent data, such as “IPC co-occurrence” in class or subclass, was identified as a persistent innovator because of its contributions to product diversification and sales growth [15]. With this, an “IPC co-occurrence” is when multiple IPC codes belonging to different technology fields exist in a single patent. Through patents, we can measure corporate market value; in fact, Chen and Chang [16] identified that patent citations and relative patent position (RPP) were positively associated with corporate market value; however, the Herfindahl–Hirschman index of patents (HHI) was negatively associated with this value.
A company has a significantly higher intention to pursue among R & D collaborators, with smaller companies having higher numbers of patent applications than larger ones [17]. Technical collaboration in invention activities by co-inventors and co-assignees can be measured through the co-invention index , and the co-assignee index [18]. The HHI of patents can be used to evaluate the concentration of patents among patent classes as well as the concentration level of companies’ technological capability [19]. According to the US pharmaceutical industry, the HHI values of patents and RPP in a relevant technological field have positive influences both nonlinearly and monotonically upon corporate performance, while the influence of patent citations is nonlinearly U-shaped [20]. By analyzing citation networks and visualizing patent statistics, the position of applicants within citation networks can help explain applicant behavior in the marketplace, such as people’s cooperation or patent infringement trials [21].
In a study in which the ratio of joint patent application cases among all patents of companies is defined as the breadth of OI, and in which the average of the patent applicants of each patent of a company is the depth of OI, the concept of collaboration of joint patent application is materialized as OI [22]. Yun et al. [22] use two concepts, the breadth of OI, which means the ratio of all people who gave positive answers to the survey of OI, and the depth of OI, which means the percentage of all people who gave positive answers about OI with high intensity, to develop the width and depth of OI and to connect this concept with joint patent application [23]. To measure the synergy in an innovative system, such as OI and triple helix, it is necessary to consider diverse aspects of patents, such as citations, joint patent applications, etc. [24]. To identify the kind of innovations necessary to secure our future, the proper patent characteristics, such as citation, applicant, and patent network, that are to be connected with which technology patent or business model patent must be identified [25]. In addition, the process in which OI circulates through the complex adaptive system, and the evolutionary change dynamics, can be concretely analyzed through the time series change of a company, that is, the change of citations or of the patent network [26]. Most of all, patent forward citations have become an established measure for the technological and economic value of patents in the empirical innovation literature [27].
Next, we review only the key papers and books on open innovation which are required to develop the research questions of this paper because there is currently a broad awareness of open innovation and its relevance to corporate R & D [28]. Open innovation is the use of purposive inflows and outflows of knowledge to accelerate internal innovation, and expand the markets for external use of innovation, respectively [29]. So, Open innovation does not deter but motivates the active production and use of intellectual property [30]. Open innovation indicates two inbound processes: sourcing and acquiring, and two outbound processes, revealing and selling [31]. So, open innovation requires a creative interpretation and adaptation of the value propositions or business models in each situation, as open innovation coincides with the new business model in the third or fourth industrial revolution [28,32]. Regarding the open innovation paradigm, the necessity of allowing ideas to both flow out of the corporation in order to find better sites for their monetization, and flow into the corporation as new offerings and new business models, requires different ways of managing the open innovation processes, based on teamwork or task forces, and the different roles, which are more or less proactive in special industries such as telecommunication [32,33]. According to recent research, constraints on the application of firm resources decrease innovative performance of open innovation, but external knowledge increases the innovative performance of open innovation [34].
2.2. Research Method
This study measured the distance between technology and the market of a patent for a subject using the size of its list of references and citations [21,23,27]. As can be seen in Figure 1, the A type, with many citations and references, was defined as the group with the shortest distance between technology and the market; the B type, with many citations and a small number of references, was the group with a slightly short distance between those two areas; the C type, with a small number of citations and many references, was the group with a slightly far distance between the two areas; and the D type, with small numbers of citations and references, was the group with the farthest distance.
The distance between technology, and the market was used in this study was summarized for each patent application subject and divided into four types, as shown in Figure 1. The division criterion was the median value. Patents to analyze were classified into those of Fortune 500 companies, non-Fortune 500 companies, universities, laboratories, and start-ups (individual patent applicants), and the median of their citations and references for each of the top five subjects was calculated. In this study, it was defined that the A type had values the same as or higher than the median of the citations and references (the distance between technology and the market for these was closer than it was for the others). The B type had values the same or higher than the median of the citations and less than the median of the references (the distance was slightly closer than it was for the others, except for the A type). The C type had values less than the median of the citations and the same as or higher than the median of the references (the distance was slightly farther than it was for the others, except for the D type). The D type had values less than the median of the citations and the references (the distance was farther than it was for the others). Because, according to previous studies, market performance is determined depending on the references and citations, we can estimate the distance between technology and the market according to the structure of the references and citations [18,20]. While we can presume that many references mean a patent that was closer to markets and based on diverse technologies, it could be thought that many citations indicated the frequent use of the patent in a certain market. Thus, the B type is closer to the market than is the C type.
Second, for the level of OI, in the case of the A type, of patents with many references and citations, the number of patents of A type was set as the depth of OI, and the ratio of the patents to total patents including A type, B type, C type, and D type was set as the breadth of OI, considering that the patents were externally and frequently used. Second, in this study, the breadth of OI was measured according to the ratio of the A type of each subject, that is, how large a percentage of the patents of the A type was found among the patents applied for by the target organizations (e.g., universities, laboratories, etc.). In addition, the depth of OI was measured according to the number of the patents of the A type of the organization. The ratio of the A type, with many references and citations, of an organization was used to measure the width of OI, which meant how diverse the technical activities of the organization were that were connected to the outside. In addition, the number of A type patentscould be estimated and used to determine the strength of OI activities.
Third, based on previous studies, the performance of an organization was measured according to the number of sub-IPCs. In many previous studies, the ways in which technically creative and diverse patents were applied was used in various ways as a measurement index of the performance of an organization [5,14].
Fourth, based on the above three methods, the impact of OI on the company performance, and the moderating effect of the distance between technology and the market on the OI, were determined through statistical analysis [28,29,30].
In addition, to display the OI network in the stage before statistical analysis, the OI network of patent application subjects was described based on the patent similarity, with a cosine value of 0.8 or higher and sub-IPC 7 digits. This study briefly estimated the visual characteristics of an OI network through the similarity network of sub-IPC, a dependent variable. By matching the locations of the five subjects in the OI network according to the similarity, the locations of statistically similar subjects in the network were analyzed through visual network analysis results. Furthermore, we analyzed the locations and characteristics of the five subjects, in particular looking at statistically similar subjects in modules and components in the network.
2.3. Research Framework
Through regression analysis, this study used the five groups to draw a group with similarity by setting a university as a basic variable and a dummy variable, and analyzing the difference between the analysis models of similar groups as shown Figure 2.
With this, we formulated the following hypotheses:
Hypothesis 1.
Hypothesis 2.
Hypothesis 3.
3. In Advance Analysis
3.1. Analysis of Descriptive Statistics
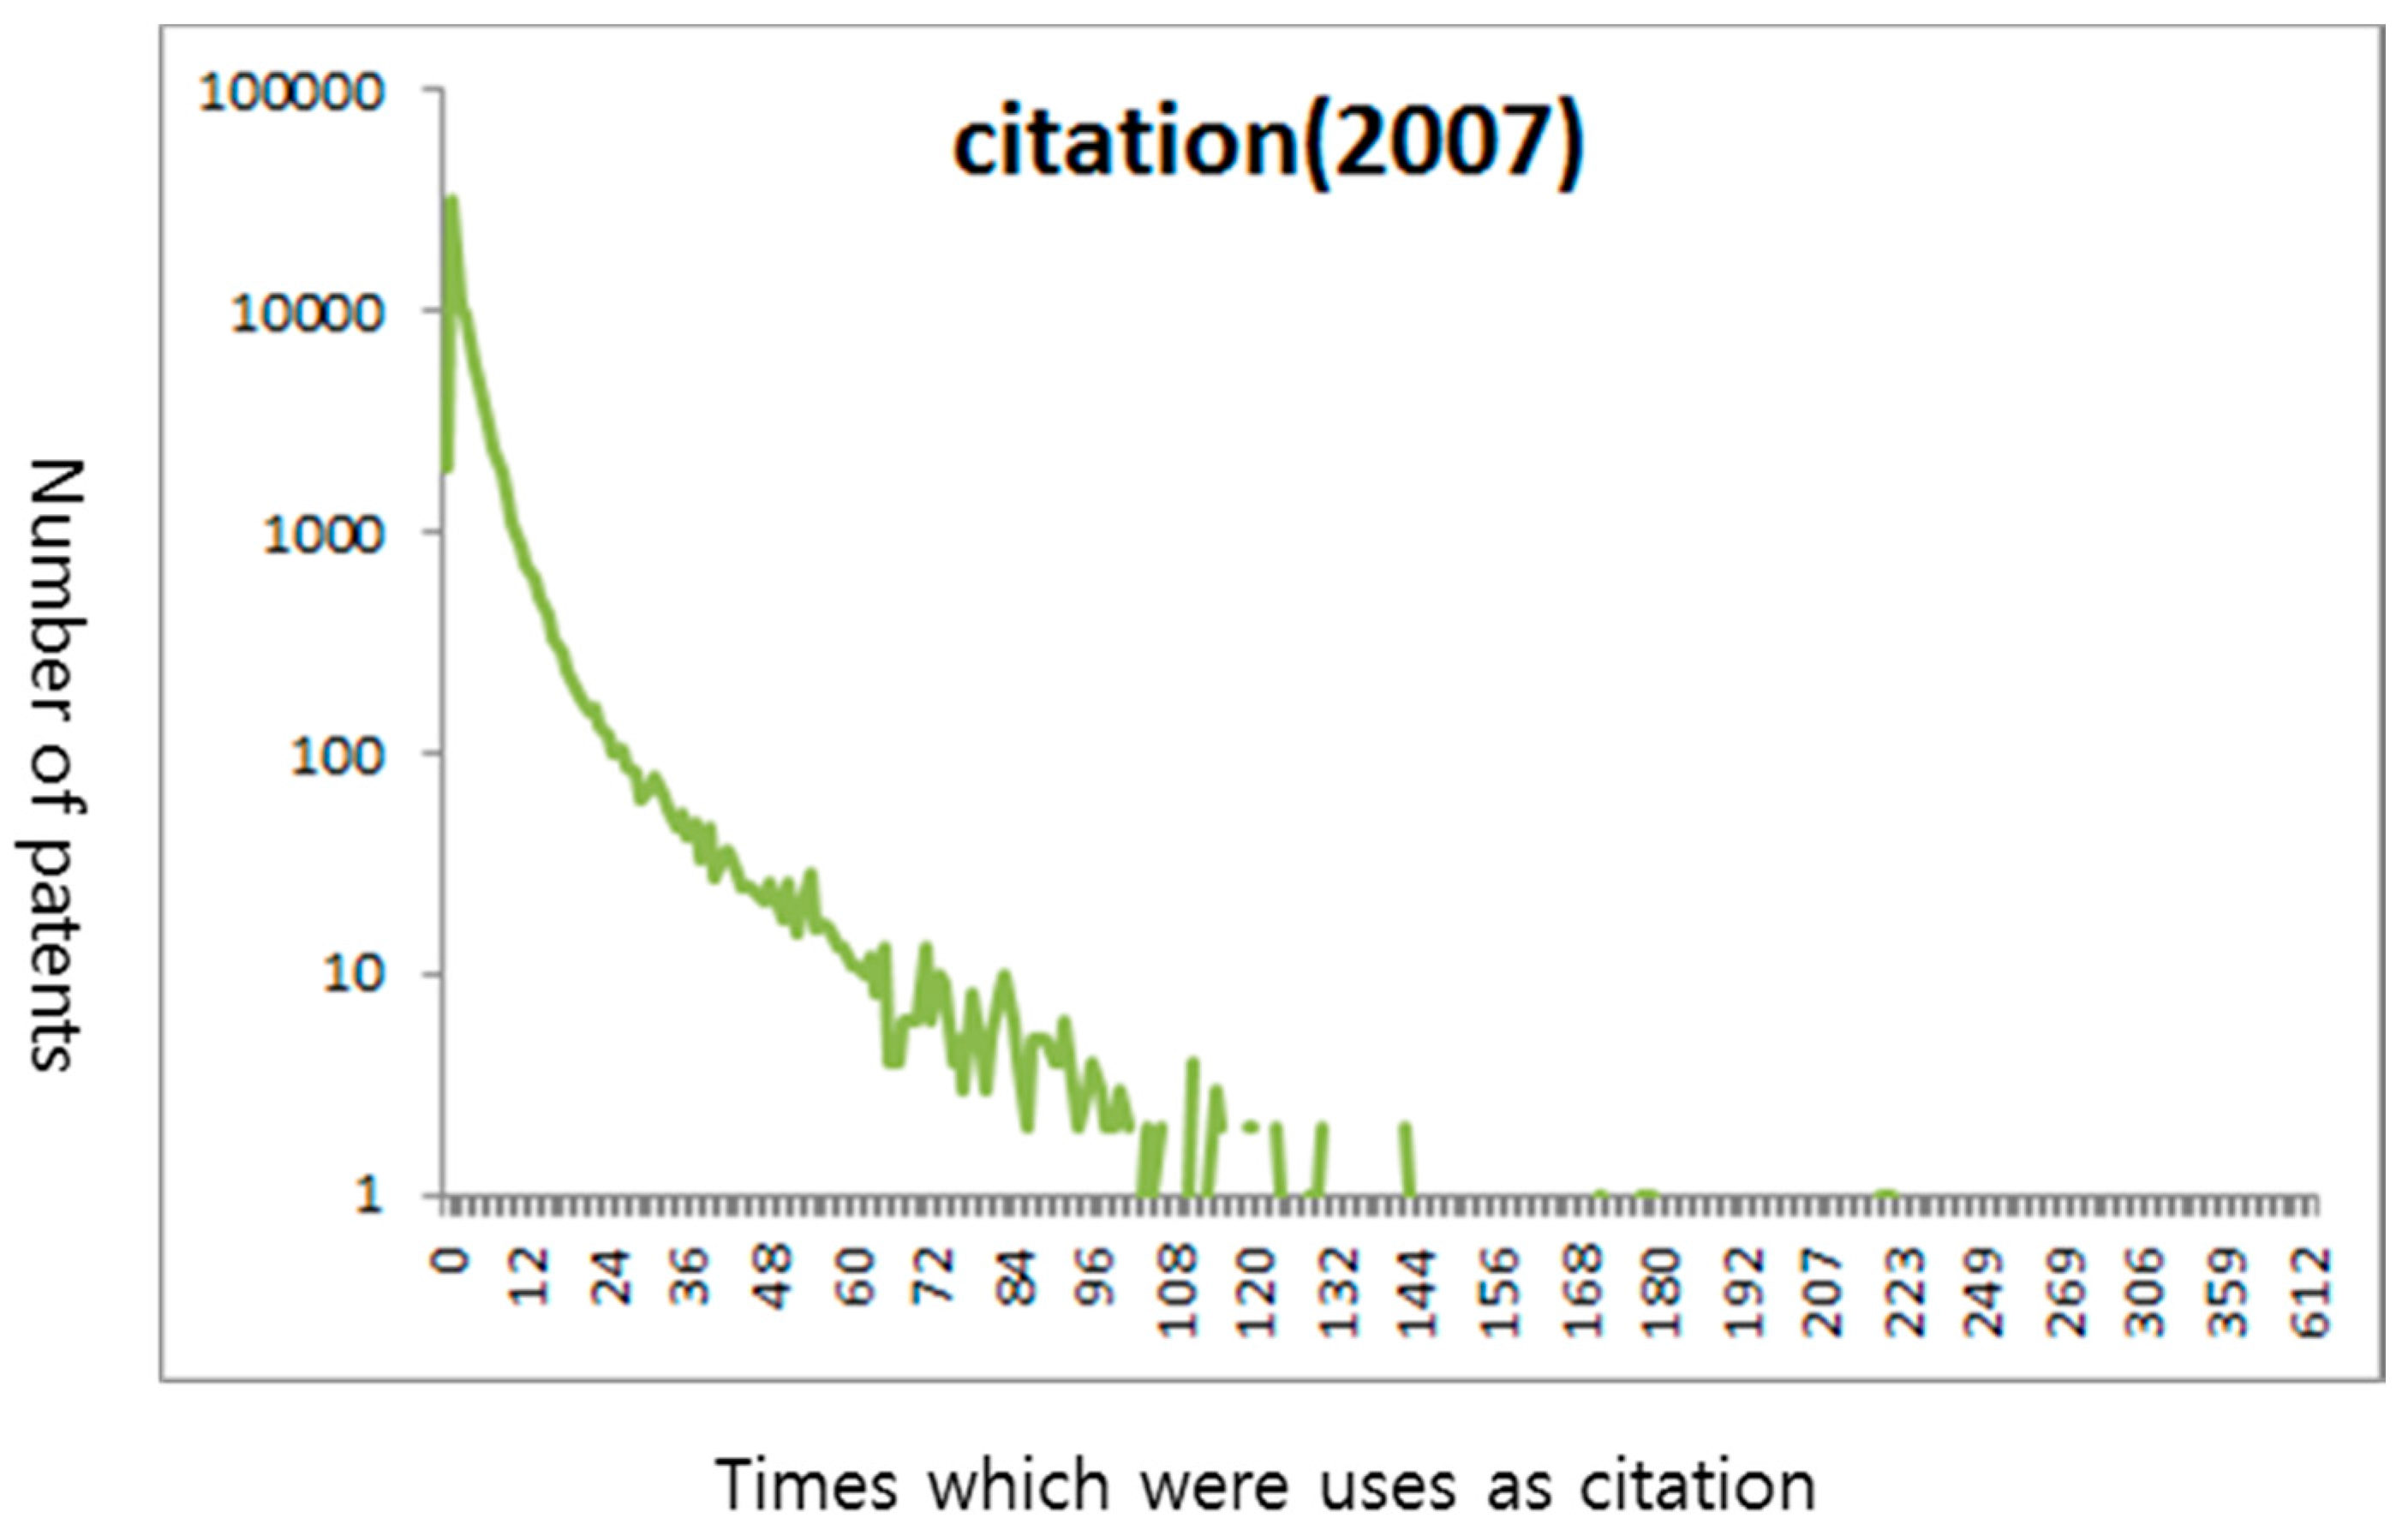
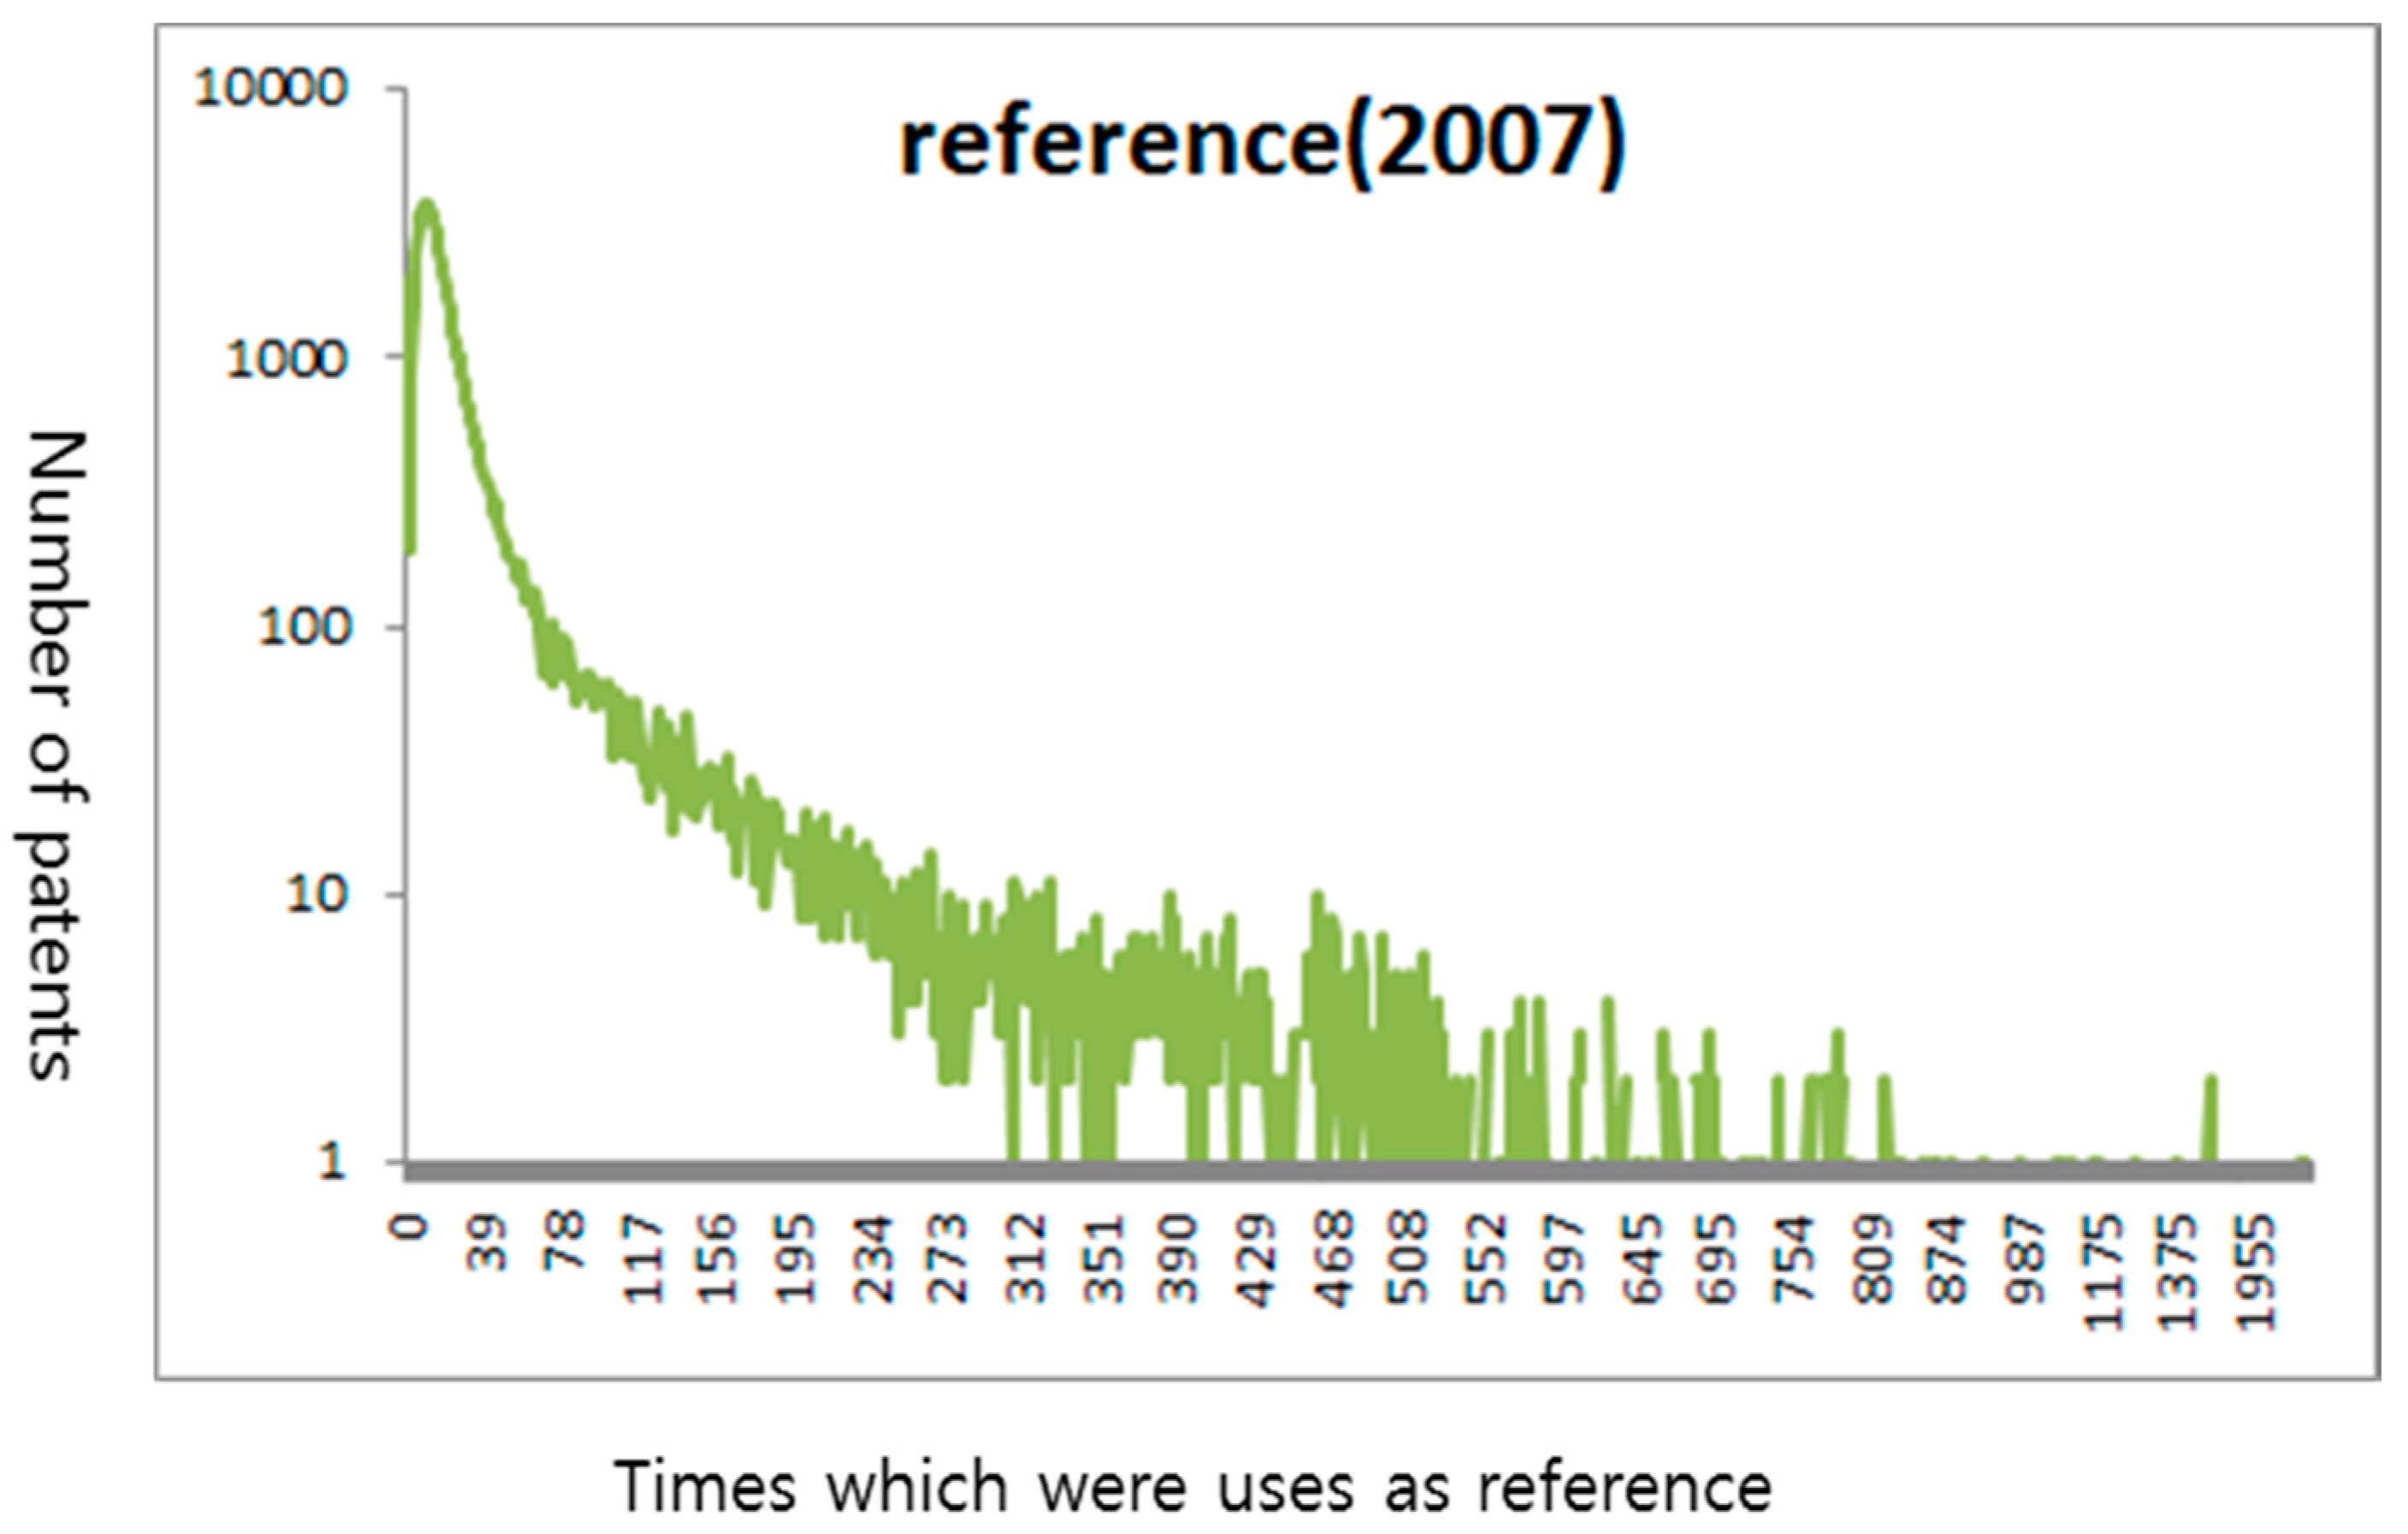
This study was conducted targeting 79,685 patents applied for in 2007 like Table 1. The number excluded the data reviewed in duplicate among 95,546 patents applied for in 2007. The number of patent application cases was the number of target patents in the database on 6 November 2016. In addition, the distribution of references and citations was not a normal distribution like that in Appendix A. Instead of an average, median values, that is, 14 for references and 1 for citations, were used.
For the D type, the percentages of universities and laboratories were the highest, but that of start-ups was the lowest. Type D proved the technically statistical value of the type. In the A type, the percentages of universities and laboratories were low, but that of start-ups was the highest. Type A also proved the technically statistical value of the type. In addition, in the B and C types, the five subjects all showed a significant difference in terms of technology statistics.
In terms of technical statistics, the number of patents for each subject differed. For example, the number of patents applied for by non-Fortune 500 companies was 51,789, and that by start-ups was 3317. In addition, that by universities was 997. Thus, to analyze the difference between the OI and the distance of technology and the market among the five subjects, we selected the top 100 patents applied for for each subject and conducted a precise statistical analysis including an additional regression analysis.
When looking at the cases of the four types in Table 2, there is a big difference among the top 500 companies between Apple and Google, and among IBM, Samsung, and Nokia. Apple and Google, which promote OI-based corporate strategies, have a relatively high ratio of the A type. It is easy to think that each subject has a certain trend, but laboratories and universities have a relatively high ratio of C and D types.
This study selected 100 organizations for each subject, as shown in Appendix B, to clarify, through regression analysis, the relation among OI, the distance between technology and the market, and the company performance. Through the correlation analysis, with details shown in Table 3, OI, the distance between technology and the market, and the moderating variables that were to be clarified through regression analysis, can be seen to have a significant relation with diverse aspects beyond company innovation performance.
3.2. Preliminary Network Analysis of the OI Network and Distance between Technology and the Market
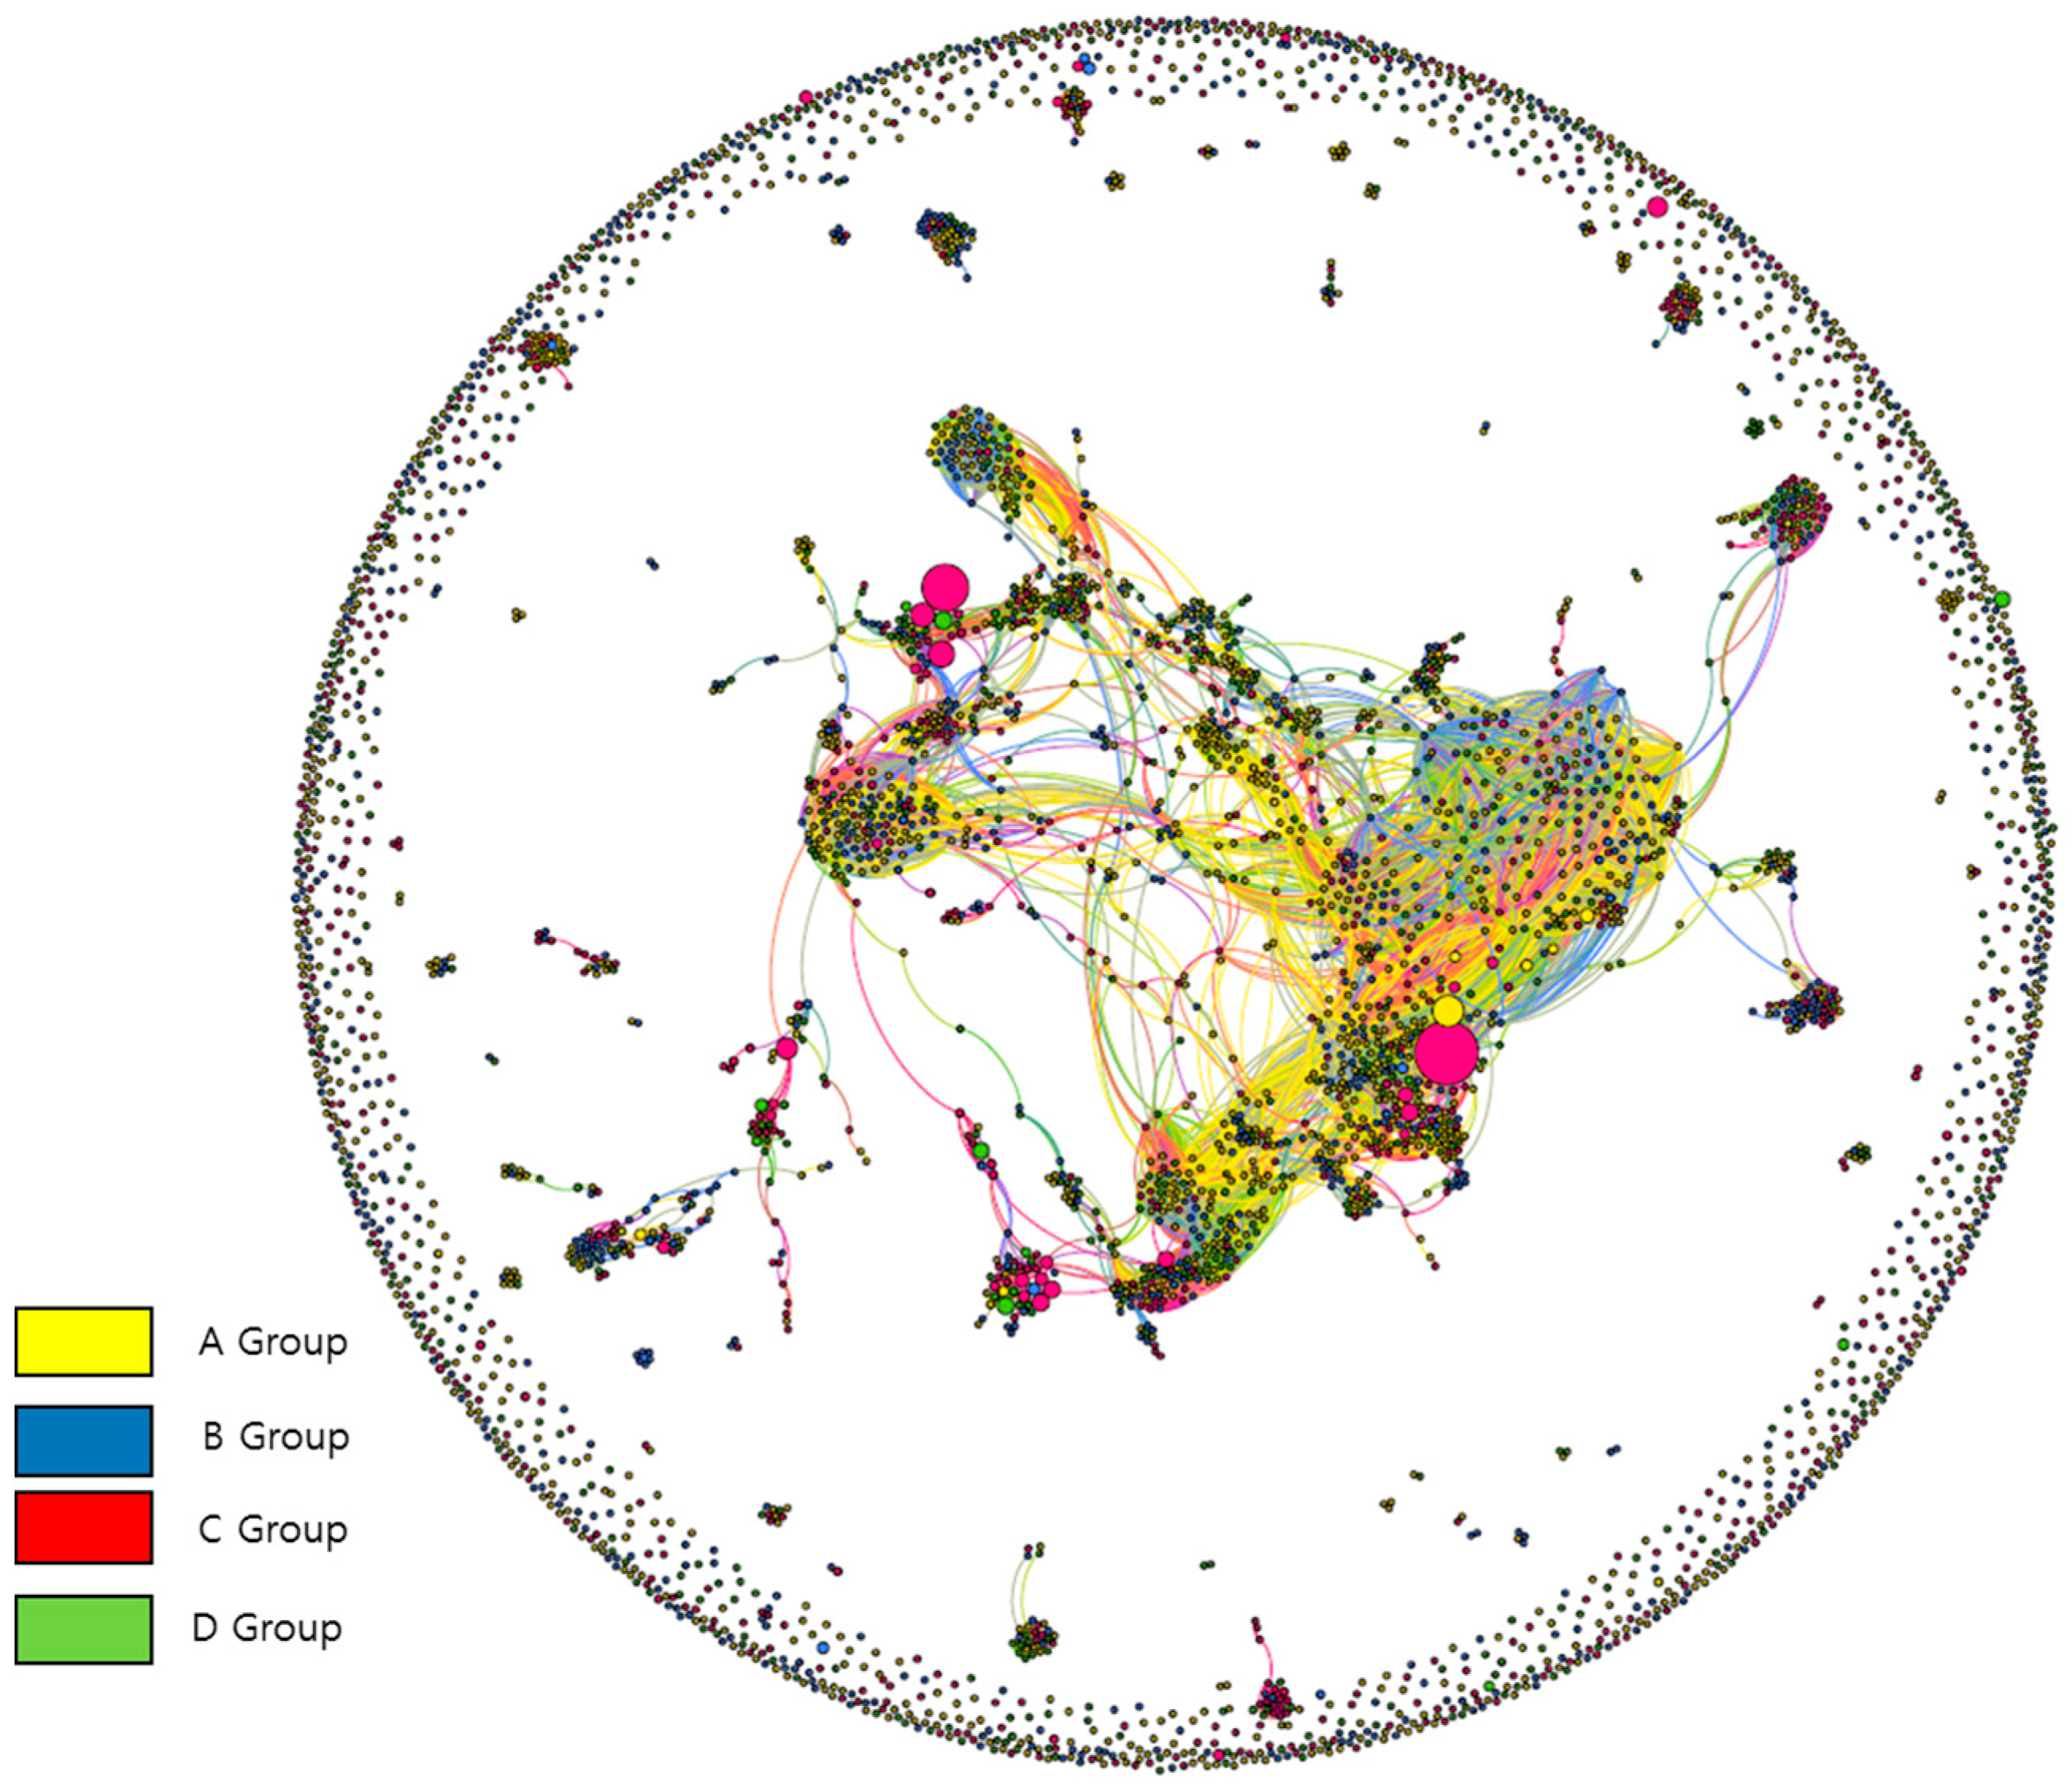
First, the four groups in the sub-IPC similarity network are described as shown in Figure 3. A group which has high reference and high citation is displayed relatively at the center of the sub-IPC similarity network. Thus, it is reasonable to set the A group as the measurement index for the width and depth of OI. This means a strong relation between the distance between technology and the market, and open innovation which was shown in the similarity network.
Second, the distribution of Fortune 500 and non-Fortune 500 companies in the sub-IPC network is displayed in Figure 4. It can be seen that the location structure of the two organization groups is highly different. We can presume that this difference leads to a different impact on OI performance. This means that Fortune 500 firms and Fortune non-500 firms will be different in open innovation effects and distance.
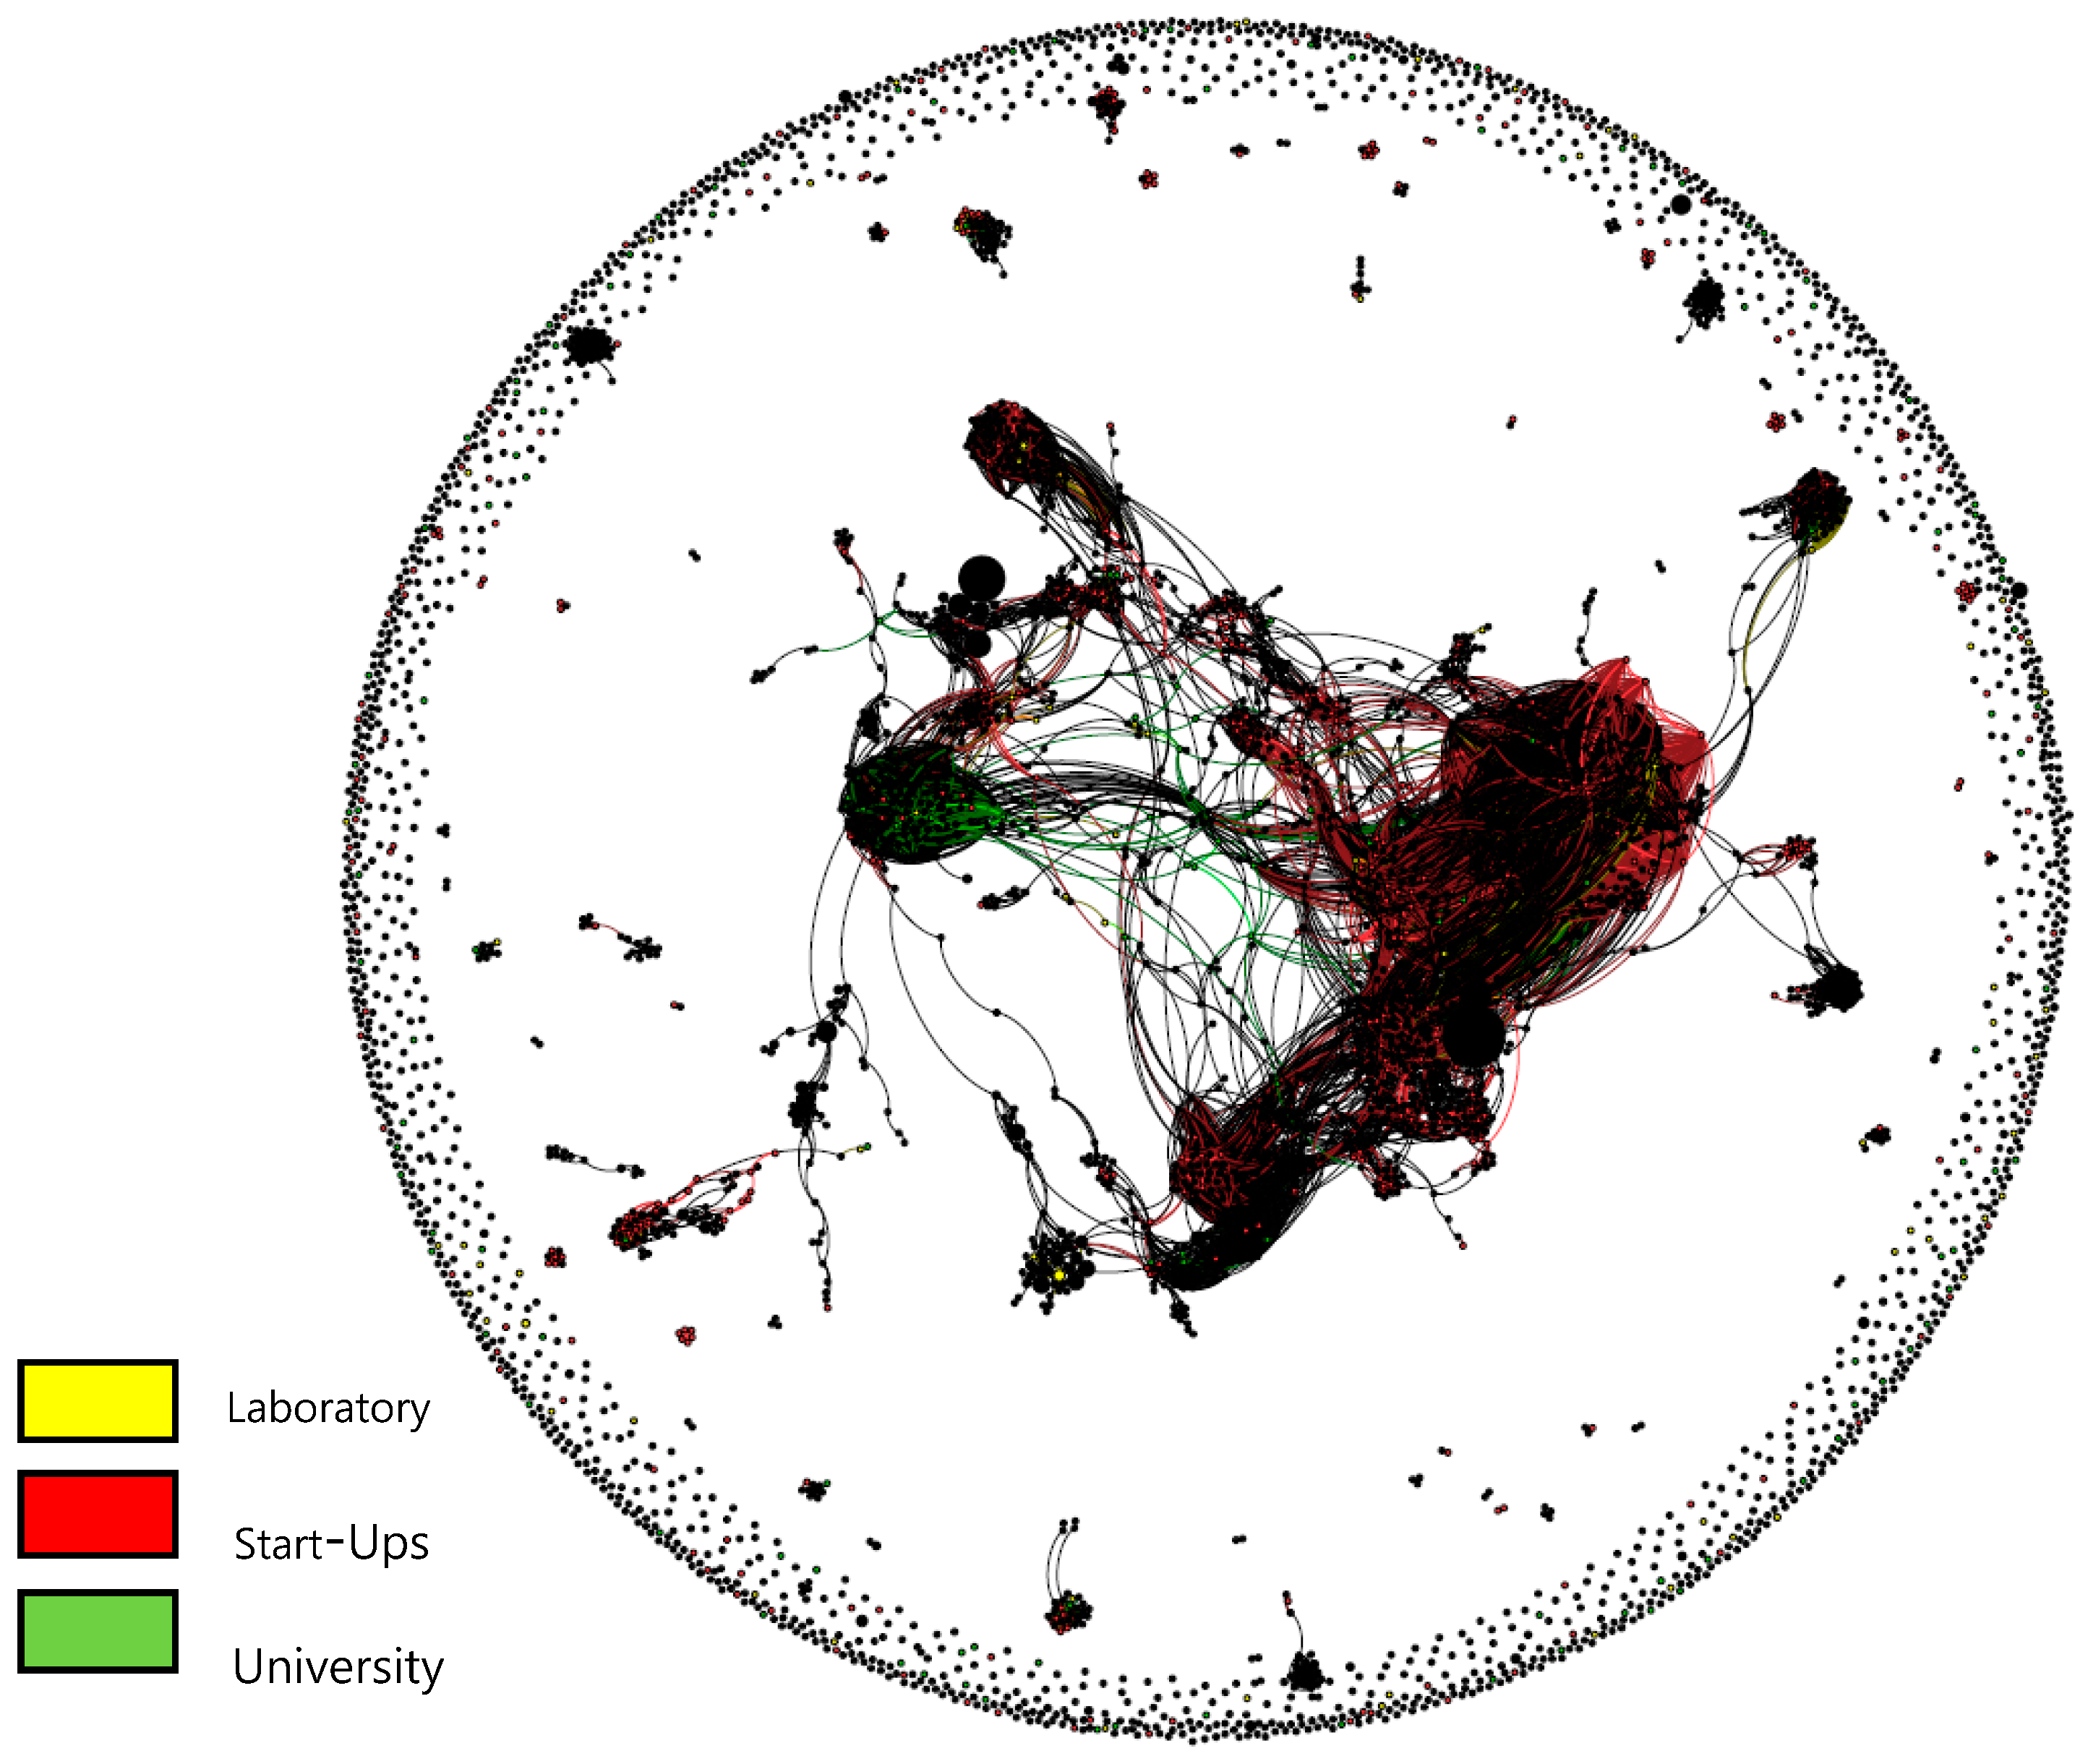
Third, when describing universities, start-ups, and laboratories in the sub-IPC network, the start-ups and universities are weakly connected with each other in location structure, and form an independent network, as shown in Figure 5. In addition, laboratories do not have a clear network. Thus, it can be estimated that the relation of OI, the distance between technology and the market, and the company performance are significantly different among universities, start-ups, and laboratories. As the network structure of open innovation among laboratories, universities, and starts-up, is totally different in appearance, we can evaluate that these show the difference of performance according to the situations of open innovation and distance.
4. Statistical Analysis and Hypothesis Test
According to the entire moderating effect regression analysis, shown in Table 4, this analysis model is statistically significant. That is, the analysis model shown in Figure 2 is statistically significant according to the analysis of the 500 institutions (i.e., 100 for each group).
In addition, OI has a statistically significant impact on company performance, as shown in Model 1. It can be presumed that the values of “OD*OB” and “(OD*OB)” are statistically significant, and that OI affects company performance in the shape of a U-curve, as the former is positive and the latter is negative. In other words, Hypothesis 1 is accepted.
In Model 2, the distance between technology and the market has a positive impact on company performance. That is, the closer the distance is, the higher the company performance is. Thus, Hypothesis 2 is accepted.
In Model 3, the moderating effect is statistically significant. That is, the closer the distance is, the higher the impact of OI is on company performance. Therefore, Hypothesis 3 is accepted.
Finally, according to the analysis of Fortune 500 and non-Fortune 500 companies, laboratories, and start-ups as dummies, and based on the analysis of universities in Models 1, 2, and 3, the results of universities and Fortune 500 and non-Fortune 500 companies are found to be different. Thus, we can presume that, for each subject, the impact of OI and distance between technology and the market on company performance is different. In other words, Hypothesis 4 is accepted. Meanwhile, the differences that exist among the five subjects need to be additionally analyzed. According to Appendix C, in the case of Fortune 500 companies and laboratories, each of the organizations in the top 100 shows a statistically significant impact of OI on performance and the OI moderating effect of the distance between technology and the market. However, these aspects are not statistically significant in the case of non-Fortune 500 companies, universities, and start-ups. In other words, the OI and the distance between technology and the market, which were measured using references and citations for the five subjects, have different impacts on company performance. In addition, the distance had a different moderating effect on the OI performance of companies.
5. Discussion and Conclusions
5.1. Discussion
First, if we answer the first research question “Is there any relation between the distance between technology and the market, and open innovation?”, the answer is Yes because Hypothesis 2, and 3 were accepted in addition to Hypothesis 1. Thus, the closer the distance between technology and the market, the higher open innovation, and firm performance. The core research result of this study is to identify that the closer the distance between technology and the market is, the higher the company performance is. In addition, the distance has a positive moderating effect on the open innovation (OI) effect on company performance. In the case of patents with a small number of references and citations, that is, when there is a long distance between technology and the market, or when the distance is long even though the technological novelty or scientific value is high, it cannot be confirmed that company performance increases. A patent with a close distance between technology and the market has many references and citations. To improve company performance, a patent with many references and citations needs to be applied for. That is, the development of a patent with many references and citations implies a short distance between technology and the market.
The answer to the second research question “If there is, what differences are there in this relation among Fortune 500 firms, non-Fortune 500 companies, laboratories, universities, and start-ups?” is Yes. However, the detail difference among five agents requires additional research.
The second core result of this study is that the possibility of objectively measuring the distance between technology and the market using patents can be checked. The difference among individual companies is shown in the structure and percentages of references and citations of their patents. Thus, it is confirmed that the ratio of technology to market of the four types depending on references and citations and the total number of patents can be a significant parameter to measure the distance. In addition, this study shows that it is possible to compare and analyze the distances between technology and the market by converting the distance types of technology and the market into measuring values by giving weights; these weights are then applied using statistical analysis. As the knowledge-based economy accelerates and the OI paradigm continues to extend, the number of patents is increasing in all industries and nations. Under these conditions, it is valuable in theory and reality that patents are used to measure and analyze the distance between technology and the market for companies, universities, and national research institutes and to formulate strategies.
5.2. Limits and Additional Research Goals
First, to use patent references and citations to measure and analyze the distance between technology and the market, concrete research is required targeting companies in the same industry or cluster with time series data or at a specific time [36]. Through a further study that uses patents to measure the distance between technology and the market, and that compares and analyzes the relations of market sales of companies, additional research to determine a method of analyzing the distance mentioned in this study is needed.
Second, additional research to precisely measure the OI of companies using the number of patents with many references and citations, and their ratios in groups, is needed [37]. By analyzing the reference and citation network of a specific business model patent, which is the basis of a corporate business model, or a technical patent variously used or licensed, which is the basis of a corporate business, in depth, an additional in-depth analysis of the real OI value of a patent with many references and citations can be obtained.
Third, the concrete differences among five agents in the distance, open innovation, and firm performance require additional research.
Acknowledgments
This work was supported by the DGIST 2017 R & D Program of the Ministry of Science, ICT and Future Planning. This paper has been presented at SOItmC 2016, and 2017. And we have fully developed this study, based on great comments from these conference.
Author Contributions
JinHyo Joseph Yun wrote all of this paper, from the building of the research framework to the analysis. So he is the first and corresponding author. EuiSeob Jeong prepared all patent data and performed data mining for this research. So he is the co-corresponding author. ChangHwan Lee and JinSeu joined in the patent data mining, and patent data network analysis. Ziaofei Zhao joined in the statistical analysis of the patent data.
Conflicts of Interest
The authors declared no potential conflicts of interest with respect to the research, authorship, and/or publication of this article.
Appendix A
Figure A1.
Distribution of Citations and References of Patents to Analyze in 2007.

Appendix B
Figure A2.
Technology Statistics to Analyze.
Appendix C. Analysis of Open Innovation, Distance between Technology and Market, and Company Performance of Five Agents

Table A1.
Descriptive statistics of 5 agents.
| Agent | No. of Samples | % | ||
|---|---|---|---|---|
| All | 500 | 100% | ||
| Total | Type of agency | Fortune 100 companies | 100 | 20.0% |
| Non-Fortune 100 companies | 100 | 20.0% | ||
| Laboratories | 100 | 20.0% | ||
| Universities | 100 | 20.0% | ||
| Start-ups | 100 | 20.0% | ||
| No. of joint patents | Yes | 241 | 48.2% | |
| No | 259 | 51.8% | ||
| Distance type | A type | 180 | 36.0% | |
| B type | 79 | 15.8% | ||
| C type | 114 | 22.8% | ||
| D type | 127 | 25.4% | ||
| Fortune 500 companies | No. of joint patents | Yes | 50 | 50.0% |
| No | 50 | 50.0% | ||
| Distance type | A type | 45 | 45.0% | |
| B type | 21 | 21.0% | ||
| C type | 13 | 13.0% | ||
| D type | 21 | 21.0% | ||
| Non-Fortune 500 companies | No. of joint patents | Yes | 53 | 53.0% |
| No | 47 | 47.0% | ||
| Distance type | A type | 49 | 49.0% | |
| B type | 14 | 14.0% | ||
| C type | 20 | 20.0% | ||
| D type | 17 | 17.0% | ||
| Laboratory | No. of joint patents | Yes | 32 | 32.0% |
| No | 68 | 68.0% | ||
| Distance type | A type | 39 | 39.0% | |
| B type | 12 | 12.0% | ||
| C type | 27 | 27.0% | ||
| D type | 22 | 22.0% | ||
| University | No. of joint patents | Yes | 60 | 60.0% |
| No | 40 | 40.0% | ||
| Distance type | A type | 31 | 31.0% | |
| B type | 11 | 11.0% | ||
| C type | 31 | 31.0% | ||
| D type | 27 | 27.0% | ||
| Start-up | No. of joint patents | Yes | 46 | 46.0% |
| No | 54 | 54.0% | ||
| Distance type | A type | 16 | 16.0% | |
| B type | 21 | 21.0% | ||
| C type | 23 | 23.0% | ||
| D type | 40 | 40.0% | ||
Table A2.
Analysis result of 100 Fortune 500 companies.
| Dependent Variables (Row) Independent Variables (Column) | Regression 1 | Regression 2 | Regression 3 | |||
|---|---|---|---|---|---|---|
| Std. Beta | t | Std. Beta | t | Std. Beta | t | |
| OD*OB | −0.820 ** | −5.374 | −1.281 ** | −7.955 | −1.650 ** | −12.055 |
| (OD*OB)2 | 0.975 ** | 6.390 | 1.429 ** | 8.913 | 1.068 ** | 7.856 |
| Distance | 0.478 ** | 5.262 | 0.360 ** | 4.881 | ||
| Z OD*OB × Z Distance | −0.842 ** | −7.566 | ||||
| R2 | 0.296 ** | 0.454 ** | 0.659 ** | |||
| F | 20.424 ** | 26.590 ** | 45.939 ** | |||
** p < 0.01.
Table A3.
Analysis result of 100 non-Fortune 500 companies.
| Dependent Variables (Row) Independent Variables (Column) | Regression 1 | Regression 2 | Regression 3 | |||
|---|---|---|---|---|---|---|
| Std. Beta | t | Std. Beta | t | Std. Beta | t | |
| OD*OB | −0.363 * | −2.160 | −0.363 * | −2.127 | −0.358 * | −12.055 |
| (OD*OB)2 | 0.300 | 1.785 | 0.302 | 1.666 | 0.031 | 7.856 |
| Distance | 0.003 | 0.029 | 0.085 | 4.881 | ||
| Z OD*OB × Z Distance | −0.325 | −7.566 | ||||
| R2 | 0.046 | 0.046 | 0.057 | |||
| F | 2.335 | 1.541 | 1.431 | |||
* p < 0.05.
Table A4.
Analysis result of 100 organizations from among laboratories.
| Dependent Variables (Row) Independent Variables (Column) | Regression 1 | Regression 2 | Regression 3 | |||
|---|---|---|---|---|---|---|
| Std. Beta | t | Std. Beta | t | Std. Beta | t | |
| OD*OB | −0.524 ** | −11.653 | −0.622 ** | −16.095 | −0.690 ** | −28.592 |
| (OD*OB)2 | 0.785 ** | 17.461 | 0.805 ** | 22.151 | 0.753 ** | 33.455 |
| Distance | 0.281 ** | 7.300 | 0.191 ** | 7.814 | ||
| Z OD*OB × Z Distance | −0.315 ** | −12.796 | ||||
| R2 | 0.806 ** | 0.875 ** | 0.954 ** | |||
| F | 201.514 ** | 224.522 ** | 494.790 ** | |||
** p < 0.01.
Table A5.
Analysis result of 100 organizations from among universities.
| Dependent Variables (Row) Independent Variables (Column) | Regression 1 | Regression 2 | Regression 3 | |||
|---|---|---|---|---|---|---|
| Std. Beta | t | Std. Beta | t | Std. Beta | t | |
| OD*OB | −0.425 | −1.847 | −0.445 | −1.922 | −0.546 * | −2.074 |
| (OD*OB)2 | 0.383 | 1.665 | 0.367 | 1.589 | 0.203 | 0.659 |
| Distance | −0.094 | −0.873 | −0.079 | −0.718 | ||
| Z OD*OB × Z Distance | −0.278 | −0.812 | ||||
| R2 | 0.034 | 0.042 | 0.048 | |||
| F | 1.706 | 1.389 | 1.203 | |||
* p < 0.05.
Table A6.
Analysis result of 100 companies from among start-ups.
| Dependent Variables (Row) Independent Variables (Column) | Regression 1 | Regression 2 | Regression 3 | |||
|---|---|---|---|---|---|---|
| Std. Beta | t | Std. Beta | t | Std. Beta | t | |
| OD*OB | −0.130 | −0.499 | −0.095 | −0.361 | −0.033 | −0.098 |
| (OD*OB)2 | 0.352 | 1.350 | 0.344 | 1.315 | 0.414 | 1.156 |
| Distance | −0.084 | 0.804 | 0.090 | 0.839 | ||
| Z OD*OB × Z Distance | 0.132 | 0.289 | ||||
| R2 | 0.056 | 0.062 | 0.063 | |||
| F | 2.877 | 2.126 | 1.600 | |||
References
- Jaffe, A.B.; Trajtenberg, M. Patents, Citations, and Innovations: A Window on the Knowledge Economy; MIT Press: Cambridge, MA, USA, 2002. [Google Scholar]
- Dosi, G. Innovation, evolution, and economics: Where we are and where we should go. In Innovation Studies: Evolution and Future Challenges; Fagerberg, J., Martin, B.R., Andersen, E.S., Eds.; Oxford University Press: Oxford, UK, 2013; pp. 111–133. [Google Scholar]
- Stagars, M. University Startups and Spin-Offs: Guide for Entrepreneurs in Academia; Apress: New York, NY, USA, 2014. [Google Scholar]
- Rimmer, M.; McLennan, A. Intellectual Property and Emerging Technologies: The New Biology; Rimmer, M., McLennan, A., Eds.; Edward Elgar Publishing: Cheltenham, UK, 2012. [Google Scholar]
- Ejermo, O. Patent Diversity as a Predictor of Regional Innovativeness in Sweden. Università Commerciale Luigi Bocconi, 2003. Available online: ftp://ftp.repec.org/opt/ReDIF/RePEc/cri/papers/CESPRI_wp1401.pdf (accessed on 8 May 2017).
- Trajtenberg, M. A penny for your quotes: Patent citations and the value of innovations. RAND J. Econ. 1990, 21, 172–187. [Google Scholar] [CrossRef]
- Trajtenberg, M.; Henderson, R.; Jaffe, A. University versus corporate patents: A window on the basicness of invention. Econ. Innov. New Technol. 1997, 5, 19–50. [Google Scholar] [CrossRef]
- Caballero, R.J.; Jaffe, A.B. How high are the giants’ shoulders: An empirical assessment of knowledge spillovers and creative destruction in a model of economic growth. NBER Macroecon. Annu. 1993, 8, 15–74. [Google Scholar] [CrossRef]
- Jaffe, A.B.; Trajtenberg, M.; Henderson, R. Geographic localization of knowledge spillovers as evidenced by patent citations. Q. J. Econ. 1993, 108, 577–598. [Google Scholar] [CrossRef]
- Jaffe, A.B.; Trajtenberg, M. Flows of knowledge from universities and federal laboratories: Modeling the flow of patent citations over time and across institutional and geographic boundaries. Proc. Natl. Acad. Sci. USA 1996, 93, 12671–12677. [Google Scholar] [CrossRef] [PubMed]
- Jaffe, A.B.; Trajtenberg, M. International knowledge flows: Evidence from patent citations. Econ. Innov. New Technol. 1999, 8, 105–136. [Google Scholar] [CrossRef]
- Henderson, R.; Jaffe, A.B.; Trajtenberg, M. Universities as a source of commercial technology: A detailed analysis of university patenting 1965–1988. Rev. Econ. Stat. 1998, 80, 119–127. [Google Scholar] [CrossRef]
- Jaffe, A.B.; Fogarty, M.S.; Banks, B.A. Evidence from patents and patent citations on the impact of NASA and other federal labs on commercial innovation. J. Ind. Econ. 1998, 46, 183–205. [Google Scholar] [CrossRef]
- Verspagen, B. Measuring intersectoral technology spillovers: Estimates from the European and US patent office databases. Econ. Syst. Res. 1997, 9, 47–65. [Google Scholar] [CrossRef]
- Suzuki, J.; Kodama, F. Technological diversity of persistent innovators in Japan: Two case studies of large Japanese firms. Res. Pol. 2004, 33, 531–549. [Google Scholar] [CrossRef]
- Chen, Y.-S.; Chang, K.-C. The relationship between a firm’s patent quality and its market value—The case of US pharmaceutical industry. Technol. Forecast. Soc. Chang. 2010, 77, 20–33. [Google Scholar] [CrossRef]
- Brouwer, E.; Kleinknecht, A. Innovative output, and a firm’s propensity to patent: An exploration of CIS micro data. Res. Pol. 1999, 28, 615–624. [Google Scholar] [CrossRef]
- Ma, Z.; Lee, Y. Patent application and technological collaboration in inventive activities: 1980–2005. Technovation 2008, 28, 379–390. [Google Scholar] [CrossRef]
- Hall, B.H. A Note on the Bias in the Herfindahl Based on Count Data. Unpublished Note. 2000. Available online: https://eml.berkeley.edu/~bhhall/papers/BHH05_hhibias.pdf (accessed on 27 February 2017).
- Chen, Y.-S.; Chang, K.-C. The nonlinear nature of the relationships between the patent traits and corporate performance. Scientometrics 2010, 82, 201–210. [Google Scholar] [CrossRef]
- Sternitzke, C.; Bartkowski, A.; Schramm, R. Visualizing patent statistics by means of social network analysis tools. World Pat. Inf. 2008, 30, 115–131. [Google Scholar] [CrossRef]
- Yun, J.J.; Avvari, M.V.; Jeong, E.-S.; Lim, D.-W. Introduction of an objective model to measure open innovation and its application to the information technology convergence sector. Int. J. Tech. Pol. Manag. 2014, 14, 383–400. [Google Scholar] [CrossRef]
- Laursen, K.; Salter, A. Open for innovation: The role of openness in explaining innovation performance among UK manufacturing firms. Strat. Manag. J. 2006, 27, 131–150. [Google Scholar] [CrossRef]
- Leydesdorff, L.; Ivanova, I. “Open innovation” and “triple helix” models of innovation: Can synergy in innovation systems be measured? J. Open Innov. 2016, 2, 11. [Google Scholar] [CrossRef]
- Witt, U. What kind of innovations do we need to secure our future? J. Open Innov. 2016, 2, 17. [Google Scholar] [CrossRef]
- Yun, J.J.; Won, D.; Park, K. Dynamics from open innovation to evolutionary change. J. Open Innov. 2016, 2, 7. [Google Scholar] [CrossRef]
- Jeong, H.J.; Ko, Y. Configuring an alliance portfolio for eco-friendly innovation in the car industry: Hyundai and Toyota. J. Open Innov. 2016, 2, 24. [Google Scholar] [CrossRef]
- Lee, J.H.; Khee-Su, B.; Lee, J.W.; In, Y.; Kwon, T.; Lee, W. Valuation method by regression analysis on real royalty-related data by using multiple input descriptors in royalty negotiations in Life Science area-focused on anticancer therapies. J. Open Innov. 2016, 2, 21. [Google Scholar] [CrossRef]
- Czarnitzki, D.; Hussinger, K.; Leten, B. The market value of blocking patent citations. 2011. (No. 11-021). Available online: ftp://ftp.zew.de/pub/zew-docs/dp/dp11021.pdf (accessed on 7 August 2017).
- Chesbrough, H. The logic of open innovation: Managing intellectual property. Calif. Manag. Rev. 2003, 45, 33–58. [Google Scholar] [CrossRef]
- Dahlander, L.; Gann, D.M. How open is innovation? Res. Policy 2010, 39, 699–709. [Google Scholar] [CrossRef]
- Bigliardi, B.; Ivo Dormio, A.; Galati, F. The adoption of open innovation within the telecommunication industry. Eur. J. Innov. Manag. 2012, 15, 27–54. [Google Scholar] [CrossRef]
- Enkel, E.; Gassmann, O.; Chesbrough, H. Open R & D and open innovation: Exploring the phenomenon. R&D Manag. 2009, 39, 311–316. [Google Scholar]
- Garriga, H.; Von Krogh, G.; Spaeth, S. How constraints and knowledge impact open innovation. Strat. Manag. J. 2013, 34, 1134–1144. [Google Scholar] [CrossRef]
- Chesbrough, H.; Vanhaverbeke, W.; West, J. (Eds.) Open Innovation: Researching a New Paradigm; Oxford University Press: Boston, MA, USA, 2006; p. 51. [Google Scholar]
- Yun, J.H.J. Business Model Design Compass: Open Innovation Funnel to Schumpeterian New Combination Business Model Developing Circle; Springer: London, UK, 2017; p. 153. [Google Scholar]
- Chesbrough, H. Open Innovation: The New Imperative for Creating and Profiting from Technology; Harvard Business School Press: Boston, MA, USA, 2003; p. 11. [Google Scholar]
Figure 1.
Four types of relation between technology and the market for patents, considering references and citations.
Figure 1.
Four types of relation between technology and the market for patents, considering references and citations.
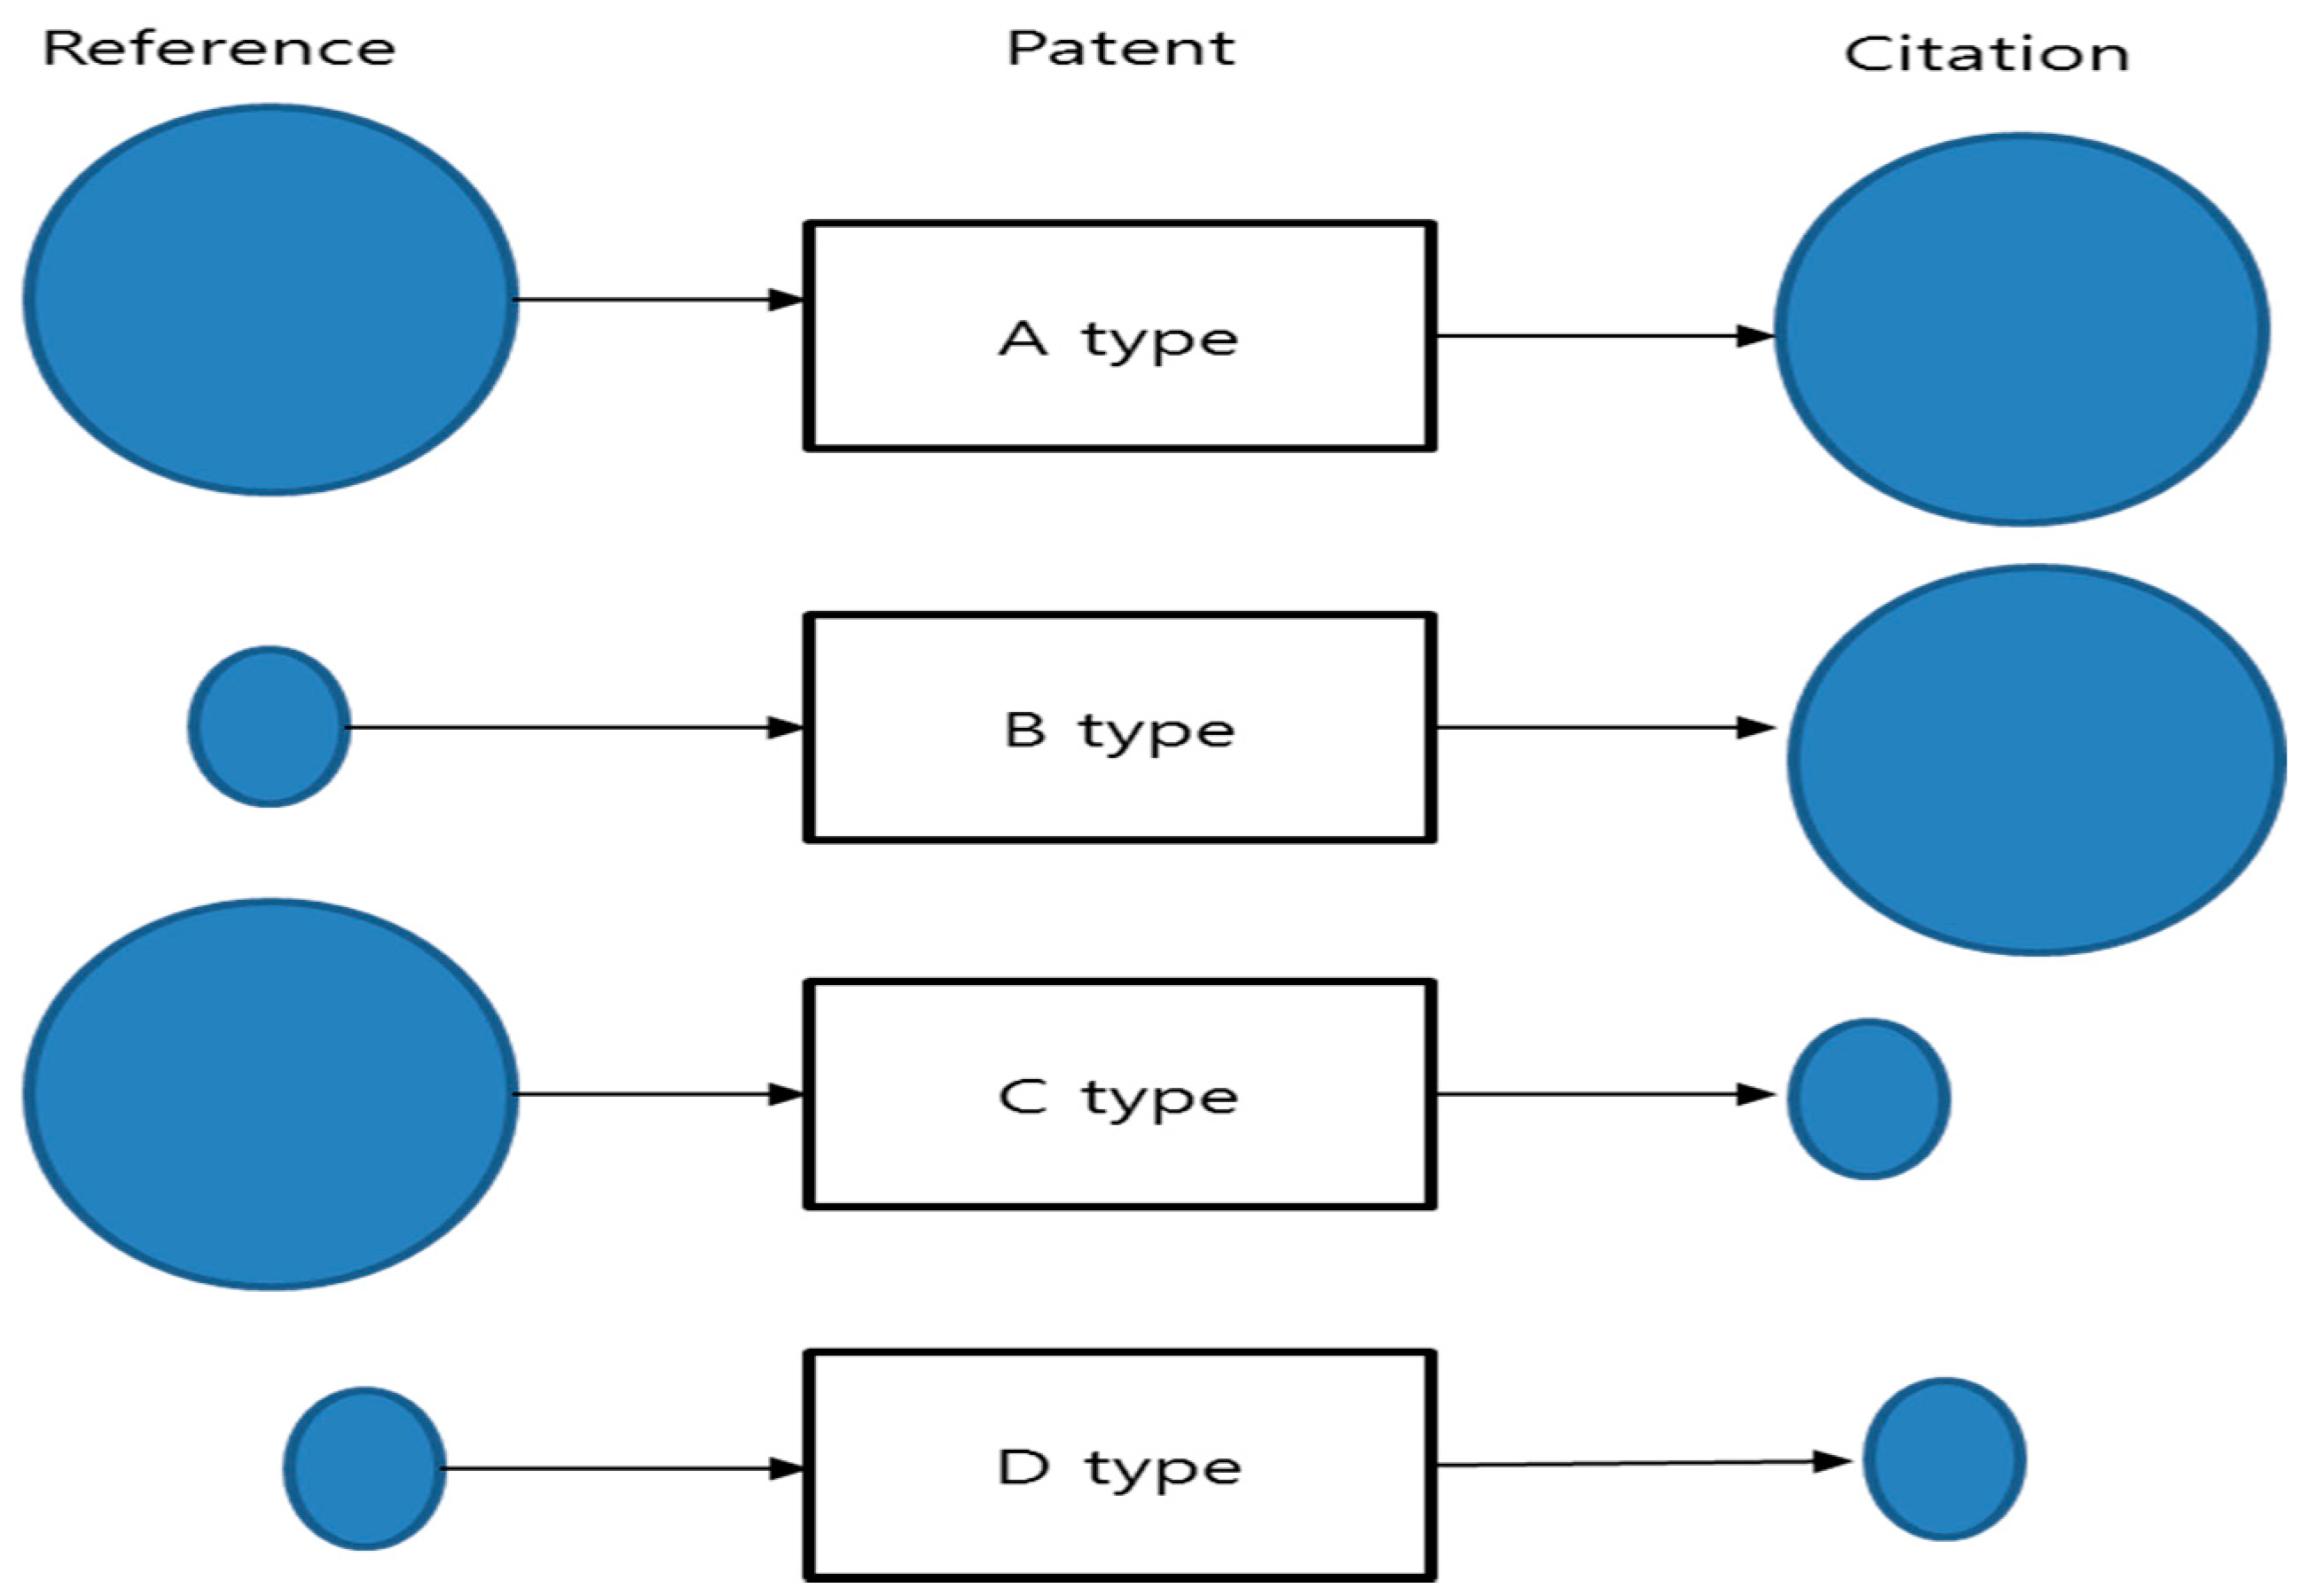
Figure 2.
Research framework.
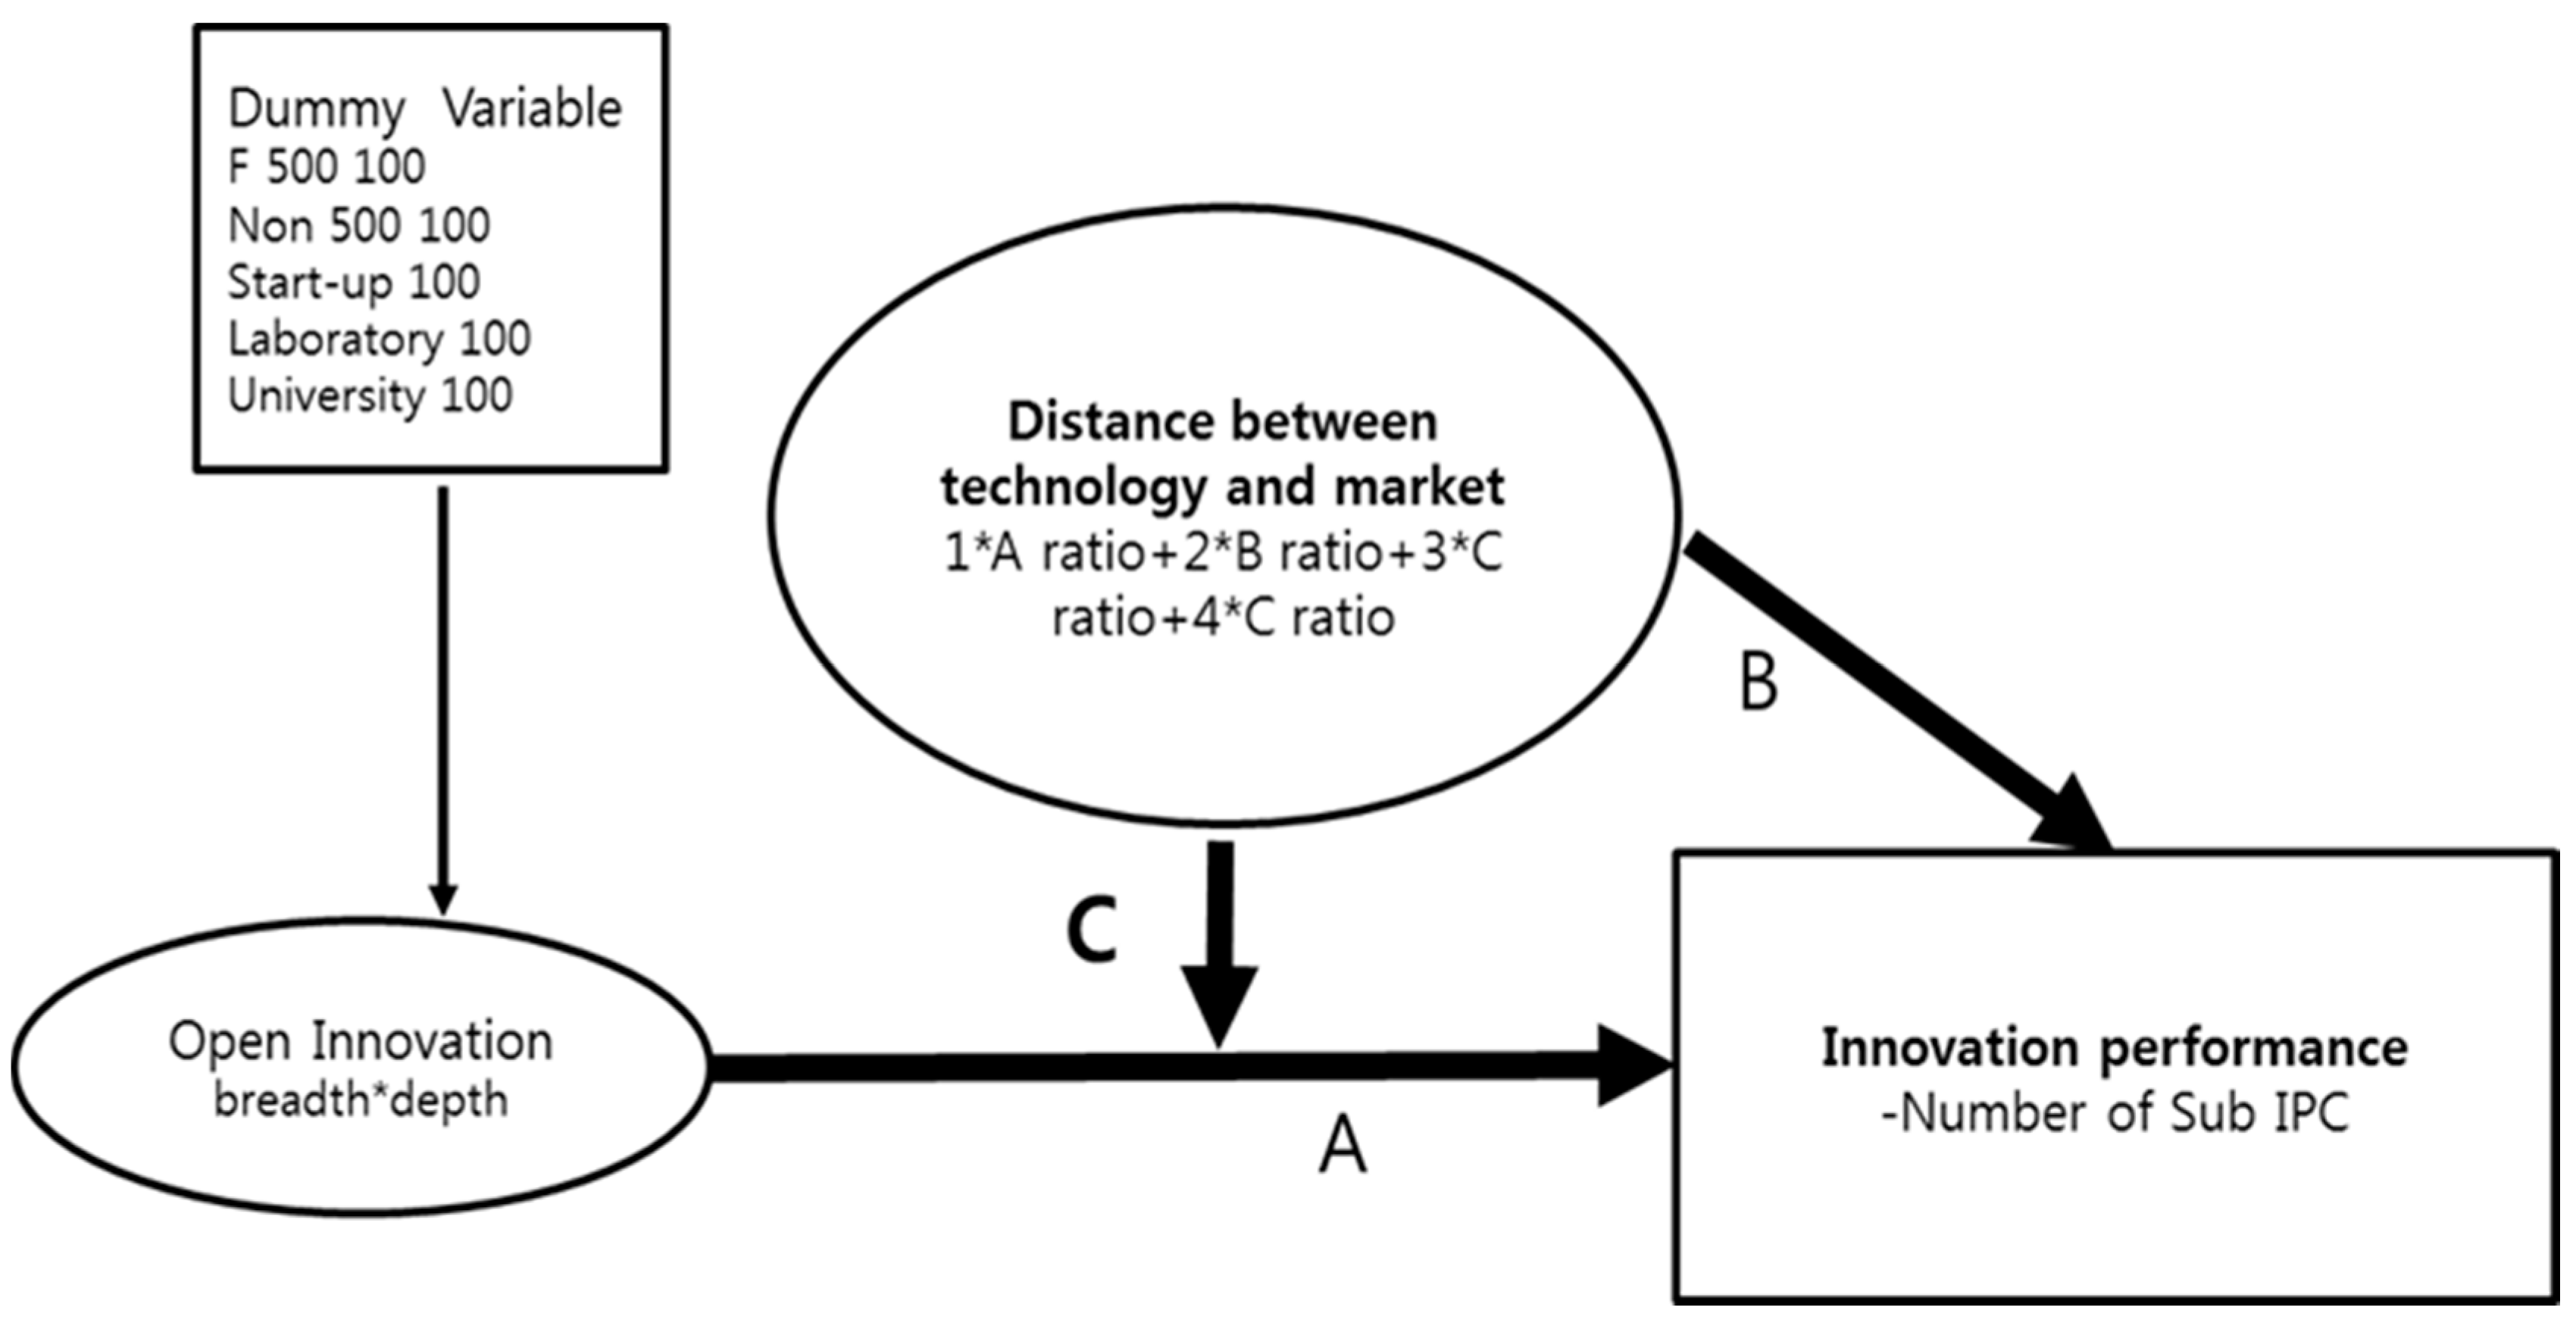
Figure 3.
Distribution of four groups in the sub-IPC network.

Figure 4.
Fortune 500 and non-Fortune 500 companies in the sub-IPC network.

Figure 5.
Laboratories, start-ups, and universities in the sub-IPC network.

Table 1.
Overview of all patents to analyze in 2007.
| Item | 2007 | Fortune 500 | Non-Fortune 500 | Lab | Univ. | Start-Up |
|---|---|---|---|---|---|---|
| Patents (records) (A) | 79,685 | 23,502 | 51,798 | 1352 | 993 | 3317 |
| Total no. of assignees (C) | 83,444 | 24,603 | 53,647 | 1695 | 1297 | 5096 |
| No. of references (Ref.) (C) | 2,411,070 | 520,583 | 1,745,187 | 26,261 | 18,745 | 100,294 |
| No. of citations (Cit.) (D) | 267,656 | 60,687 | 186,872 | 3028 | 3269 | 13,800 |
| A type (ratio) | 22.8 | 20.0 | 24.2 | 14.6 | 17.0 | 25.7 |
| B type (ratio) | 23.0 | 22.1 | 23.2 | 26.0 | 30.5 | 23.5 |
| C type (ratio) | 24.0 | 26.0 | 23.5 | 19.0 | 16.6 | 20.9 |
| D type (ratio) | 30.2 | 31.9 | 29.2 | 40.4 | 35.9 | 29.9 |
| Sub-IPC (no.) | 125,935 | 35,830 | 77,926 | 2026 | 1558 | 5346 |
| Sub-IPC (ave.) | 1.58 | 1.52 | 1.50 | 1.50 | 1.57 | 1.61 |
Source: USTPM.
Table 2.
Examples per type.
| Category | Institutions | A | B | C | D |
|---|---|---|---|---|---|
| Fortune 500 companies | IBM | 18.2 | 22.1 | 24.8 | 35.0 |
| Samsung | 13.1 | 25.7 | 22.5 | 38.6 | |
| Apple | 43.1 | 12.7 | 29.6 | 14.6 | |
| Nokia | 17.1 | 33.6 | 19.1 | 30.2 | |
| 40.6 | 19.6 | 29.7 | 10.1 | ||
| Non-Fortune 500 companies | Toshiba | 15.5 | 32.2 | 19.5 | 32.7 |
| Qualcomm | 23.1 | 13.5 | 47.4 | 16.1 | |
| AT&T | 22.7 | 17.9 | 30.6 | 28.8 | |
| Hewlett-Packard | 16.9 | 22.1 | 21.7 | 39.3 | |
| Seiko Epson Corp. | 20.8 | 22.0 | 25.3 | 31.8 | |
| Laboratories | Electronics and Telecommunication Research Institute | 13.5 | 20.8 | 22.3 | 43.4 |
| US ARMY | 11.1 | 31.9 | 13.9 | 43.1 | |
| Institute for Information Industry | 5.9 | 32.4 | 11.8 | 50.0 | |
| National Institute of Advanced Industrial Science and Technology | 23.8 | 14.3 | 14.3 | 47.6 | |
| Agency for Science, Technology and Research | 0 | 0 | 6.7 | 93.3 | |
| Universities | University of California | 11.8 | 39.2 | 19.6 | 29.4 |
| Columbia University | 25.6 | 25.6 | 20.5 | 28.2 | |
| Seoul National University | 9.4 | 31.3 | 21.9 | 37.5 | |
| Stanford University | 23.8 | 42.9 | 9.5 | 23.8 | |
| National Taiwan University | 5.9 | 52.9 | 5.9 | 35.3 |
Table 3.
Analysis of correlation.
| Category | Mean | SD | 1 | 2 | 3 | 4 | 5 | 6 | 7 | 8 |
|---|---|---|---|---|---|---|---|---|---|---|
| Innovation effect | 157.322 | 472.183 | - | |||||||
| D1 (Fortune 500 companies) | 0.200 | 0.400 | 0.267 ** | |||||||
| D2 (non-Fortune 500 companies) | 0.200 | 0.400 | 0.188 ** | −0.250 ** | ||||||
| D3 (laboratories) | 0.200 | 0.400 | −0.146 ** | −0.250 ** | −0.250 ** | |||||
| D4 (start-ups) | 0.200 | 0.400 | −0.155 ** | −0.250 ** | −0.250 ** | −0.250 ** | ||||
| OD*OB | 0.037 | 0.548 | −0.065 | 0.025 | 0.048 | 0.012 | −0.109 * | |||
| (OD*OB)2 | 0.301 | 30.752 | 0.319 ** | 0.106 * | 0.025 | −0.25 | −0.023 | 0.734 ** | ||
| Distance | 259.308 | 67.352 | 0.038 | 0.044 | 0.048 | 0.106 * | −0.254 ** | 0.280 ** | −0.056 | |
| Z OD*OB × Z Distance | 0.279 | 10.030 | −0.336 ** | 0.182 ** | −0.219 ** | 0.145 ** | 0.240 ** | −0.719 ** | −0.530 ** | −0.291 ** |
D1 to D4 are control (dummy) variables. “University” is a criterion variable and, thus, is not included in the above analysis. ** p < 0.01, * p < 0.05.
Table 4.
Entire moderating effect regression analysis.
| Dependent Variables (Row) Independent Variables (Column) | Model 1 | Model 2 | Model 3 | |||
|---|---|---|---|---|---|---|
| Std. Beta | t | Std. Beta | t | Std. Beta | t | |
| D1 (Fortune 500 companies) | 0.251 ** | 5.779 | 0.235 ** | 5.773 | 0.135 ** | 3.987 |
| D2 (non-Fortune 500 companies) | 0.283 ** | 6.572 | 0.288 ** | 7.135 | 0.172 ** | 5.111 |
| D3 (laboratory) | −0.005 | −0.105 | −0.020 | −0.497 | 0.046 | 1.392 |
| D4 (Start-up) | −0.078 | −1.803 | −0.025 | −0.596 | 0.035 | 1.025 |
| OD*OB | −0.677 ** | −13.292 | −0.884 ** | −16.445 | −1.300 ** | −25.373 |
| (OD*OB)2 | 0.794 ** | 15.603 | 0.966 ** | 18.605 | 0.931 ** | 21.944 |
| Distance | 0.311 ** | 8.357 | 0.253 ** | 8.259 | ||
| Z OD*OB × Z Distance | −0.656 ** | −15.727 | ||||
| R2 | 0.430 ** | 0.501 ** | 0.668 ** | |||
| F | 62.005 ** | 70.545 ** | 123.546 ** | |||
** p < 0.01.
© 2017 by the authors. Licensee MDPI, Basel, Switzerland. This article is an open access article distributed under the terms and conditions of the Creative Commons Attribution (CC BY) license (http://creativecommons.org/licenses/by/4.0/).
Share and Cite
MDPI and ACS Style
Yun, J.J.; Jeong, E.; Lee, C.; Park, J.; Zhao, X. Effect of Distance on Open Innovation: Differences among Institutions According to Patent Citation and Reference. Sustainability 2017, 9, 1478. https://doi.org/10.3390/su9081478
AMA Style
Yun JJ, Jeong E, Lee C, Park J, Zhao X. Effect of Distance on Open Innovation: Differences among Institutions According to Patent Citation and Reference. Sustainability. 2017; 9(8):1478. https://doi.org/10.3390/su9081478
Chicago/Turabian StyleYun, JinHyo Joseph, EuiSeob Jeong, ChangHwan Lee, JinSeu Park, and Xiaofei Zhao. 2017. "Effect of Distance on Open Innovation: Differences among Institutions According to Patent Citation and Reference" Sustainability 9, no. 8: 1478. https://doi.org/10.3390/su9081478
Note that from the first issue of 2016, this journal uses article numbers instead of page numbers. See further details here.