Article

Analyzing Farmers’ Perceptions of Ecosystem Services and PES Schemes within Agricultural Landscapes in Mengyin County, China: Transforming Trade-Offs into Synergies

1
College of Resources and Environmental Sciences, China Agricultural University, Beijing 100193, China
2
College of Horticulture and Forestry Sciences, Huazhong Agricultural University, Wuhan 430070, China
3
Beijing Laboratory of Biodiversity and Organic Farming, China Agricultural University, Beijing 100193, China
*
Author to whom correspondence should be addressed.
Sustainability 2017, 9(8), 1459; https://doi.org/10.3390/su9081459
Submission received: 26 July 2017 / Revised: 7 August 2017 / Accepted: 15 August 2017 / Published: 21 August 2017

Abstract

:
Researchers aspire to strike a balance between the production and consumption of ecosystem services (ES) in agriculture for long-term farm sustainability. One approach is to provide payments for ecosystem services (PES) through government programs. Therefore, it is necessary to evaluate ecosystem services and use the evaluated information to determine what policy designs could effectively induce more services in agricultural landscapes. This research uses a theoretical and analytical framework. In this framework, farmers’ perceptions of the obtained ES, importance of ES, design rules of PES programs and management practices of PES programs are identified in Mengyin County by using surveys. The results show: (1) farmers could possibly recognize the limitations of the obtained ES and reduce their demand appropriately; (2) regulating services (e.g., pollination and biological pest control) provision is central to transforming trade-offs into synergies among ecosystem services; (3) farmers should not only attach great importance to the maintenance of soil fertility and health but also to the maintenance of semi-natural habitat, and the adoption of such an attitude could positively affect their behavior to maximize synergies among ES; and (4) farmers are program implementers; if they have a better understanding of the perceptions of ES and PES programs, the theoretical and analytical framework could help farmers, policy-makers and relevant institutions design effective schemes.

1. Introduction

The agricultural landscape plays unique roles in both the supply and the demand of ecosystem services (ES) [1]. Meeting the dramatic growth in the demand for the provision of food, timber, fiber and fuel often leads to a diminution or loss of the supply of other ecosystem services, such as the maintenance of soil fertility, water quality, pest control, and pollination [2,3]. In turn, there are ‘burdens’ upon intensive agroecosystem that has harmful effects, leading to a decline in biodiversity and threatening the environment [4,5]. In general, through estimating the provision of agricultural landscape ES one can view the trade-offs among various services [6]. Ecosystem services encompass the many ways in which society both directly and indirectly benefits from nature (ES are the contribution of natural ecosystems to human well-being and provide a useful way to raise awareness of health dependencies between nature and human wellbeing), so there are many reasons for which ES may be valued by people [7,8,9,10,11]. There is a growing demand for incorporating social preferences in ecosystem service assessments [12]. Additionally, econometric tools and non-market valuation techniques cannot capture the full suite of ecosystem services (e.g., aesthetic and spiritual values, the maintenance of rural lifestyles, assessments such cultural services are rather difficult and subjective) to assess the value [6,9,13,14]. Investigating local people’s perception of ecosystem services can more easily differentiate single provisioning, regulating, cultural and supporting services, which are often supplied in multiple-service bundles, and this can be a useful tool for prioritizing ecosystem services [2,8,15,16]. Local farmers’ perceptions of ecosystem services differ among different regions that appear to reflect differences in local knowledge and background (generated by practice and observations) [12,17]. In order to harmonize the interrelation between humans and nature and to establish sustainable agricultural landscape management, it is important to understand the local people’s perceptions of various ES in different regions [11,12,16,18]. However, only a few studies have addressed local people’s identification or perception of ecosystem services [16,19], and most studies center on a single or a few ecosystem services [20,21].
The overarching goal of measuring and valuing ecosystem services is to use the information to shape policies and incentives for the better management of ecosystem services. Many countries have established payments for ecosystem services (PES) programs and have provided governmental support for environmentally sound farming practices that support ecosystem services, e.g., the US Conservation Security Program (CSP) of the 2002 farm bill [22] and the European agri-environment schemes (AES) [23,24,25] to mitigate the negative and increase the positive externalities of agricultural ecosystems [26]. China’s central government has implemented two major PES programs, the Natural Forest Conservation Program (NFCP) and the Sloping Land Conversion Program (SLCP), which have been described in many studies [27,28]. One major similarity of these programs (NFCP, SLCP, CSP, AES) between China and US or EU is that they are government-financed programs and most commonly pay with cash. One major difference of these programs is the targeted ecosystem [23,29,30]. PES programs (NFCP, SLCP) in China mainly relate to reforestation and sustainable forest management practices to halt deforestation, whereas PES programs (CSP, AES) in the US or European countries mostly target agricultural and working landscapes [3,30,31].
At present, China’s agricultural PES programs are still in the initial stages (Table S1 summarizes the characteristics of the agricultural PES cases in China). There are differences between agricultural PES programs in US, EU and China. In general, agricultural PES programs in the US and EU are aiming to promote the production of ecosystem services and provide farmers with subsidization (incentives) for production practices [29,32]. The practices are assumed to enhance ecosystem service flows from agriculture. China’s agricultural PES programs (Table S1) which are associated with policy options for increasing food security, farmers’ household income and on-farm carbon stocks, and have purpose as a means to promote rural development. It may well be that policymakers in China wrestle with the dual objectives of agricultural PES programs to achieve conservation goals while also promoting rural development. Agricultural PES programs’ incentives could be described as a “reward” for conserving, as a means to strengthen existing conservation efforts or land security, or as a means to compensate for biophysical land use restrictions [30,33]. In fact, agricultural PES programs could be seen as “incentives for collective action”. In general, farmers are motivated to join the scheme by a combination of extrinsic motivations (i.e., the monetary incentive) and intrinsic motivations (i.e., ethical reasons) [34,35,36]. The relationship between monetary transfers targeting the users of the resource base and the level of commoditization is positive [35]. In other words, payment may be too low to motivate the farmers to change their intensive land management practices or to implement the practices (e.g., for rural biogas development, its restricted conditionality is overburdened local farmers and high administration costs, Table S1). However, if intrinsic motivations (e.g., personal convictions and environmental awareness) are not lacking and monetary incentives (e.g., compensation methods) are appropriate, payment may ensure the economic sustainability of farming practices [35,36]. Furthermore, the effects of monetary incentives are determined by farmers’ “social meanings”, which are context- and culture-dependent, and intrinsic motivations in collective action situations [37]. Therefore, it is necessary to explore what policy designs or design rules (e.g., the compensation methods: cash or in-kind as monetary incentives) could effectively encourage (intrinsically motivate) farmers to choose the land to enroll in agricultural PES programs in order to maximize the environmental benefits.
Top-down approaches have often been proven to be inefficient for environmental protection, and the farmers were not satisfied with the current top-down implementation of agri-environmental measures in agricultural infrastructure projects [38,39]. Farmers who participate in management agricultural landscape can have a feedback-like influence on the efficiency of the ES supply [22,40]. Therefore, agricultural ES evaluation and PES programs need to be targeted to farmers who can deliver the public desired services [8,30]. Their perceptions will be more closely tailored to local conditions and needs, and a greater willingness to enforce PES program [41,42,43]. The aims of this study were to estimate how farmers can produce a wider range of ecosystem services, what the services are worth, and what agricultural PES program designs could effectively manage ES. The aim is achieved by addressing the following three objectives: (1) to calculate the relative value of obtained ES to analyze the trade-offs among various ES and to map the relationships between the obtained and demanded services; (2) to identify the most important ES for farmers; and (3) to provide useful insights for the necessary and sufficient conditions to design PES programs and decide what types of management practices should be contained.

2. Methods

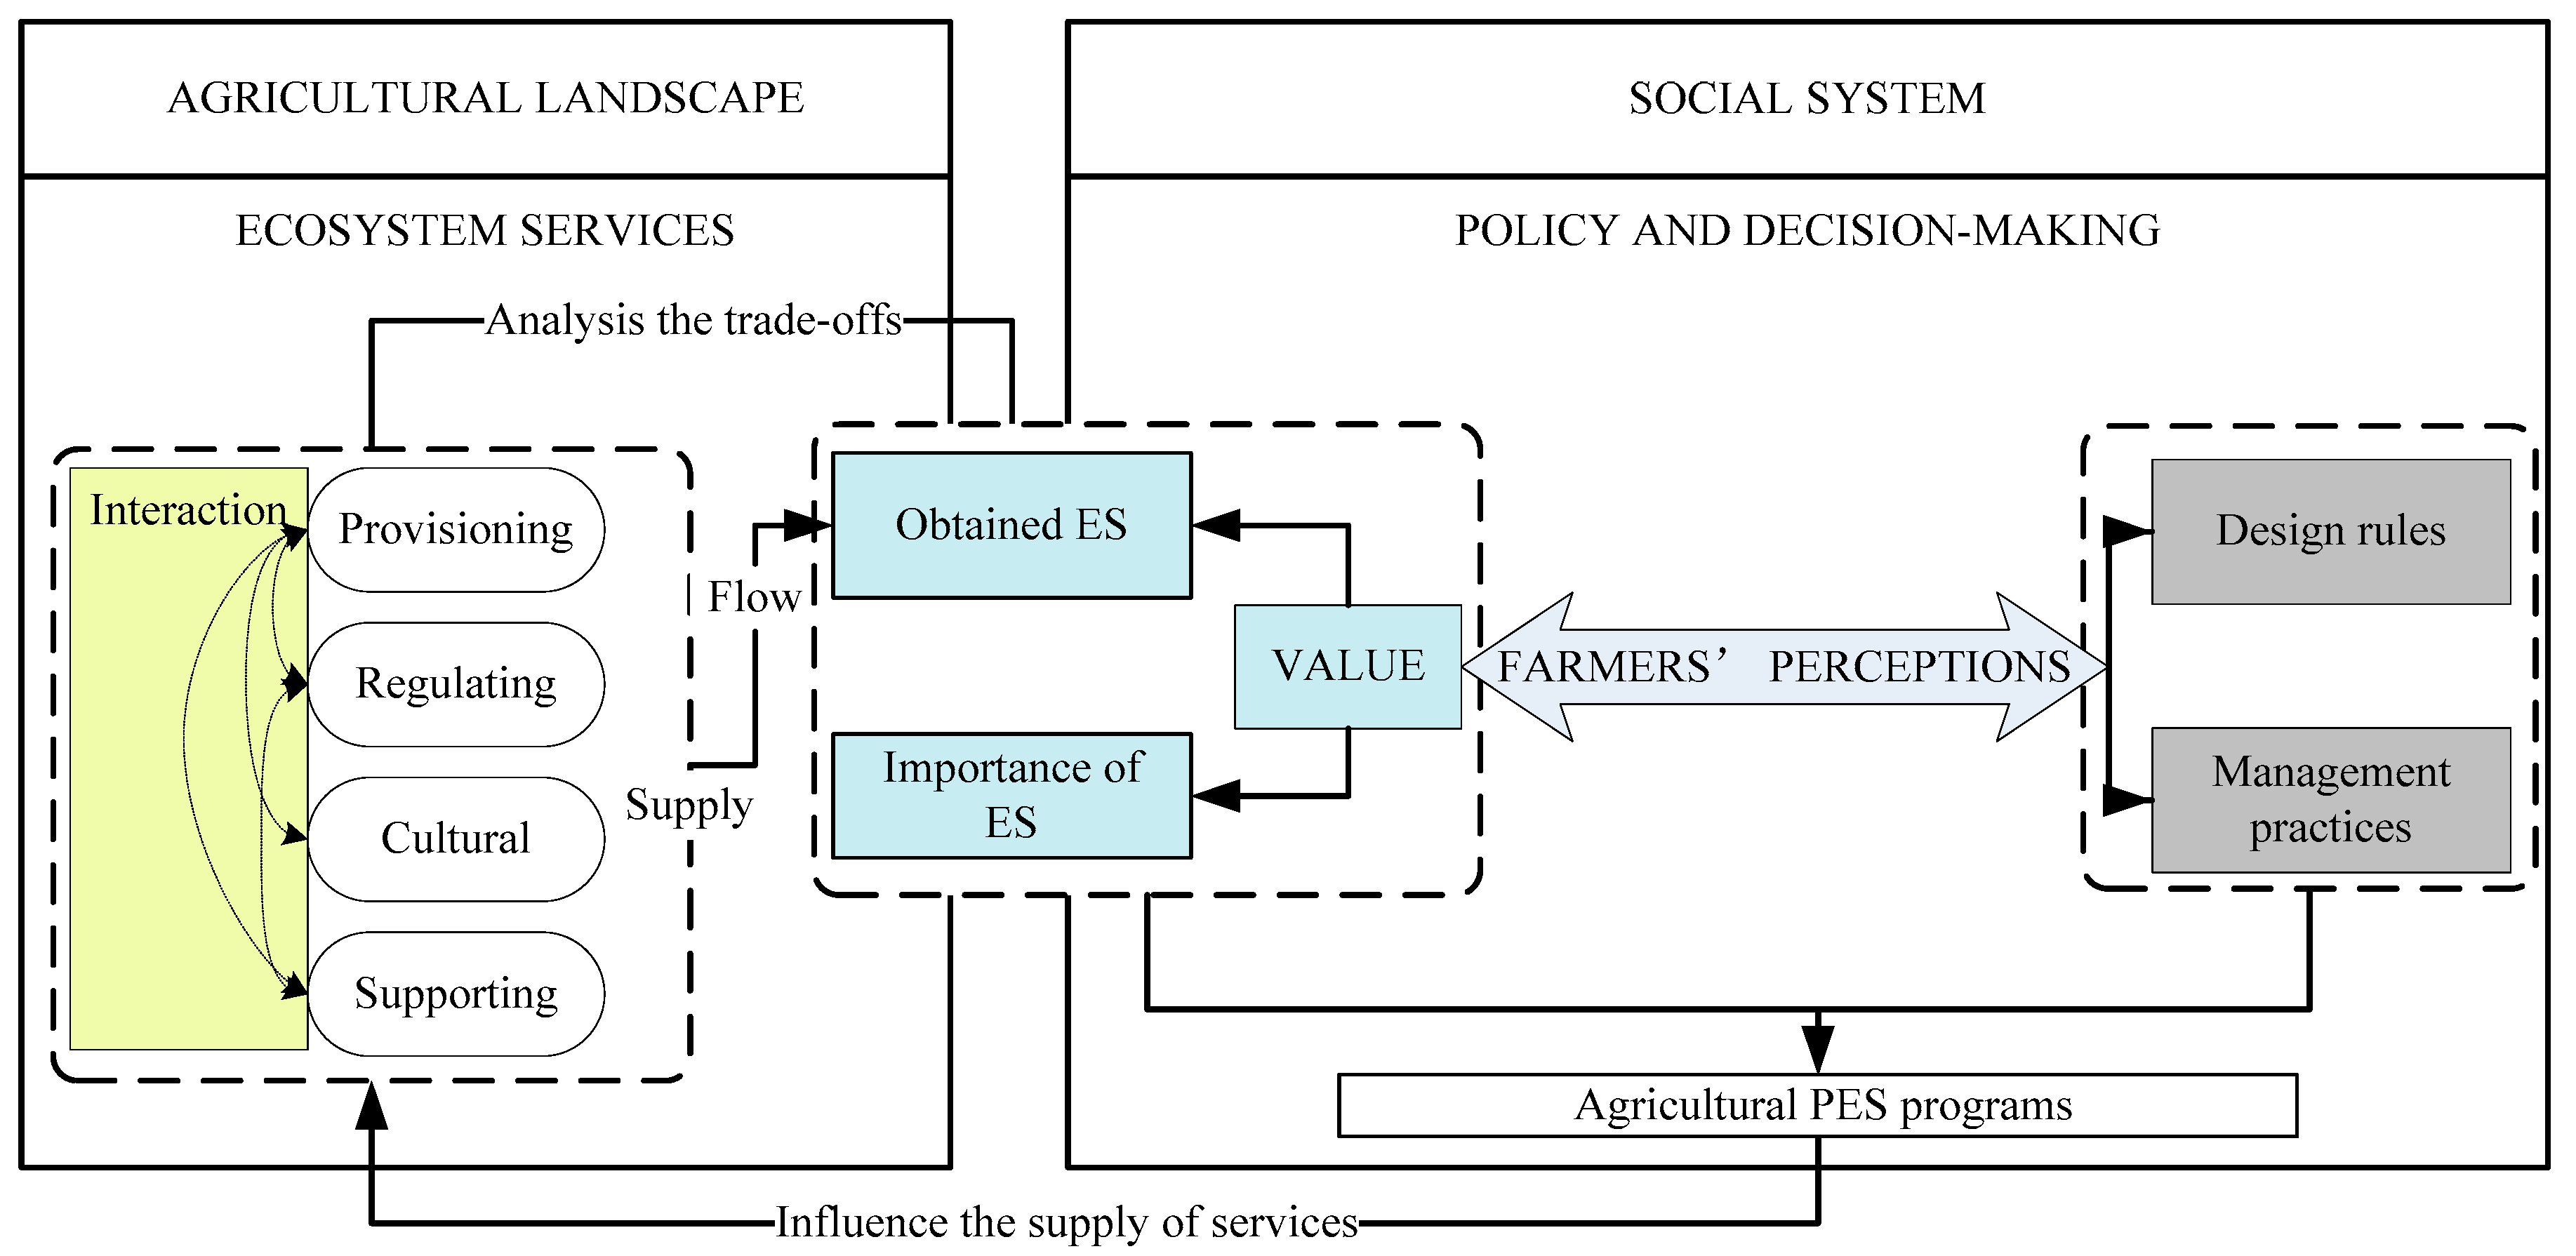
2.1. The Theoretical and Analytical Framework
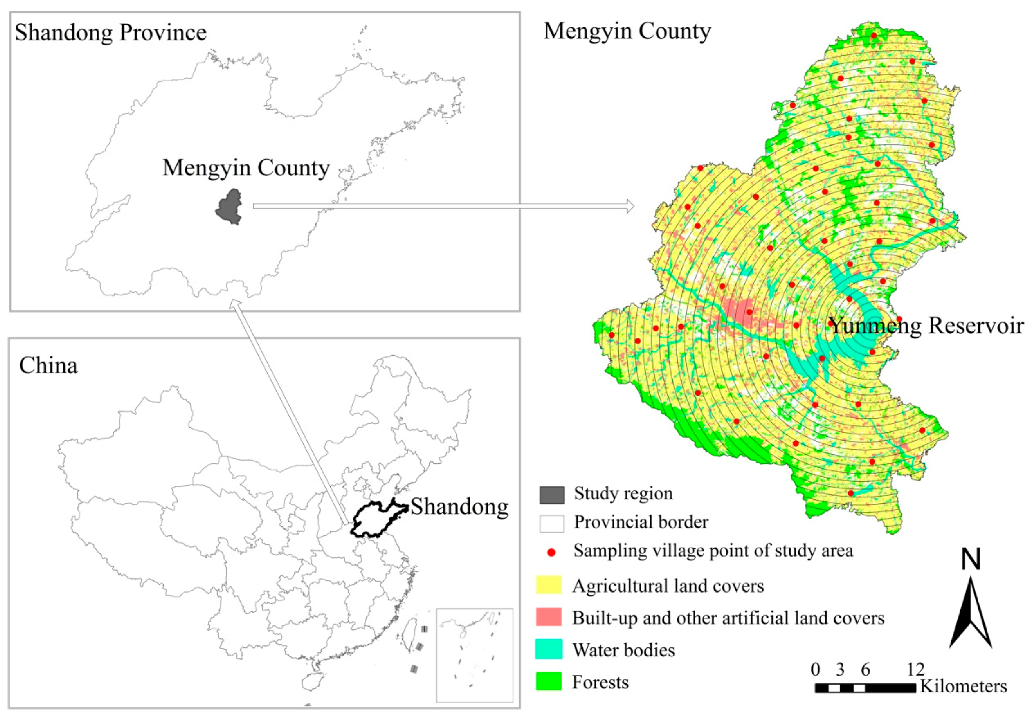
This paper use a theoretical and analytical framework that focuses on farmers’ perceptions to analyze the trade-offs among various services and to design PES programs for managing ecosystem services (Figure 1). The framework considers four elements, including the obtained ES (the service actually received by the farmers at their managed farmland and village scale agricultural landscape), the importance of ES (the farmers’ perceptions of the importance of ES at their managed farmland and village scale agricultural landscape), design rules (design rules refer to the multiple challenges to be considered when designing PES schemes within an agricultural landscape) and management practices. The framework takes into account information on evaluated the ES (i.e., the obtained ES and importance of ES for assessing ecosystem services), design rules, and management practices to carefully design agricultural PES programs.

2.2. Study Area

This study was conducted in Mengyin County, which is located in the hinterland of the Yimeng mountain area in south-central Shangdong province, China (Figure 2). The study area covers 160,188 ha and incorporates the Dongwen, Zi, and Meng Rivers. The Dongwen and Zi Rivers feed the Yunmeng Reservoir, which was designated as a Linyi unban drinking water source in 1996. The area has a warm temperate monsoon continental climate, with an average annual rainfall of 842.07 mm. Soils developed from limestone and shale, and the dominant soil types are brown soil, cinnamon soil and fluvo-aquic soil. Agricultural land uses cover 93,680 ha, approximately 60% of the area, and the large agricultural land comprises 46% peach trees, 14% corn, 13% wheat, 12% peanut and 2% flue-cured tobacco (data sources: Mengyin Statistical Yearbook, 2013). Forests cover almost 15% of total Mengyin County’s area, water bodies about 5%, and built-up and other artificial land about 8% (Figure 2). With the rapid development of peach orchard expansion, the risk of soil pollution is becoming greater. The reason is that the use of pesticides, fertilizers, and other inorganic and organic matter in agriculture has become increasingly concentrated, which is an important factor that affects non-point source pollution in Mengyin County and is highly related to water quality. Therefore, it is necessary to improve farmers’ understanding of the array of positive ecosystem services (e.g., soil conservation, pest control, pollination, water filtration) that may flow from the conservation measures. In addition, this region has a number of resource assets such as national parks (e.g., Mengshan country forest park), and culturally significant areas (e.g., the Memorial for the Battle in Menglianggu) that makes it an interesting case for the study of farmers’ perceptions in relation to ecosystem services.

2.3. Data Collection

The villages in the study area were randomly selected based on a stratified sample: the first step was based on adopting the Yunmeng Reservoir as the center, constructing buffer zones at 1-km intervals; in the second step for each buffer zone there were one or two villages randomly selected as sampling points; and in the third step a total of 44 villages were selected (Figure 2). In every village, we conducted face-to-face interviews with randomly chosen farmers, with a total of 232 farmers being interviewed. The face-to-face interviews contained three sections (Figure S1): (1) information on the characteristics of the farmland and the farmer; (2) the farmers’ perceptions of and attitudes towards ecosystem services, including the relative value of the obtained ES, the relationship between the obtained and demanded ecosystem services, and the importance of each individual service; and (3) farmers’ perceptions of how to design PES programs and what types of management practices should be contained.
In Section 1, the interview focused on the general characteristics of the farmers (age, gender, education), their farmland (size, crop type), and whether they had previously heard of the term “ecosystem services”. In Section 2, we used a list of 17 ecosystem services (Figure S1) that were identified from the literature [2,16,44,45,46]. The relative value of the obtained ES and the importance of the ES were assessed on a Likert scale ranging from 1 to 10 (low to high). The responses from the farmers on the relative value of the obtained ES were ranked as low (1–3), medium (4–6) and high (7–10), and the relationship between the obtained and the demanded ecosystem services were ranked as obtained is greater than demanded, obtained is equal to demanded or obtained is less than demanded. In Section 3, the respondents were required to select from the given options of single rules of PES schemes to express their acceptance/disagreement. Single rules refer to the multiple challenges to be considered when designing PES schemes within an agricultural landscape: (1) what the payment criterion is (standard); (2) whether to concentrate on single or bundled ES (targets); (3) how long the schemes should last (contract duration); (4) who pays (subject); and (5) the compensation methods (approach). In combination with the specific situation of the study area, we made a list of 14 management measures (Figure S1) which were identified from the literature for farmers to express their acceptance/disagreement [29,38].
A pre-survey was conducted in June 2015, and the final survey was conducted in August 2015 in Mengyin County.

2.4. Statistical Analysis

The survey data were analyzed by using the IBM® SPSS 20 software. The statistical methods adopted to interpret the data, including the independent-samples t-test, the Pearson Chi-Square, and a one-way analysis of variance (Figure S1). According to different observations of the survey data, the independent-sample t-test and one-way analysis of variance were used with the measurement data, such as age or the area managed, to compare the differences between two groups and among groups. A comparison of the count and Likert scale data used the Pearson Chi-Square, which was the main analytical method used in this study because it is best suited to Likert scale social data. First, average scores and frequency distributions were calculated for Section 1 data. Second, average scores and frequency distributions were calculated for the obtained ES under different obtained ES levels, and the Pearson Chi-Square was performed to test the difference of relationships between the obtained and the demanded services under different obtained ES levels. To graphically display the uncertainty and variability within the results on the importance of the ES, box-and-whisker plots were used to display the lowest value, second quartile, the median, the third quartile, the highest value and the mean value. The Pearson Chi-Square was used to compare the relative importance under different obtained ES levels. Third, an independent-sample t-test, the Pearson Chi-Square, and a one-way analysis of variance were performed to test the differences among farmers’ characteristics under farmers’ different choices for various single rules of PES schemes. The Pearson Chi-Square was used to compare the different distributions of the farmers’ acceptance of the provided management practices of PES schemes with respect to farmers’ characteristics.

3. Results

3.1. Profile of the Respondents

The basic characteristics of the respondents are summarized in Table 1. The average age of the respondents was 49.63. There are 48.28% of the respondents who had received a six-year compulsory education or less, 45.26% had received a nine-year compulsory education or high school, and 6.47% had reached an educational level higher than high school. According to the respondents, their managed area (farmland area) ranged from 6.67 to 0.03 ha, with an average of 0.35 ha. There were 45.25% of the respondents who engaged in planting fruit and nuts, 27.15% engaged in planting food and cash crops, and 27.60% engaged in planting a mixture of food, cash, and fruit and nut crops. Some respondents (14.66%) had heard of the term “ecosystem services”. All of the respondents understood what each individual service meant and the implications that their previous experiences in natural resource management had on the farm.

3.2. Perceptions of Ecosystem Services

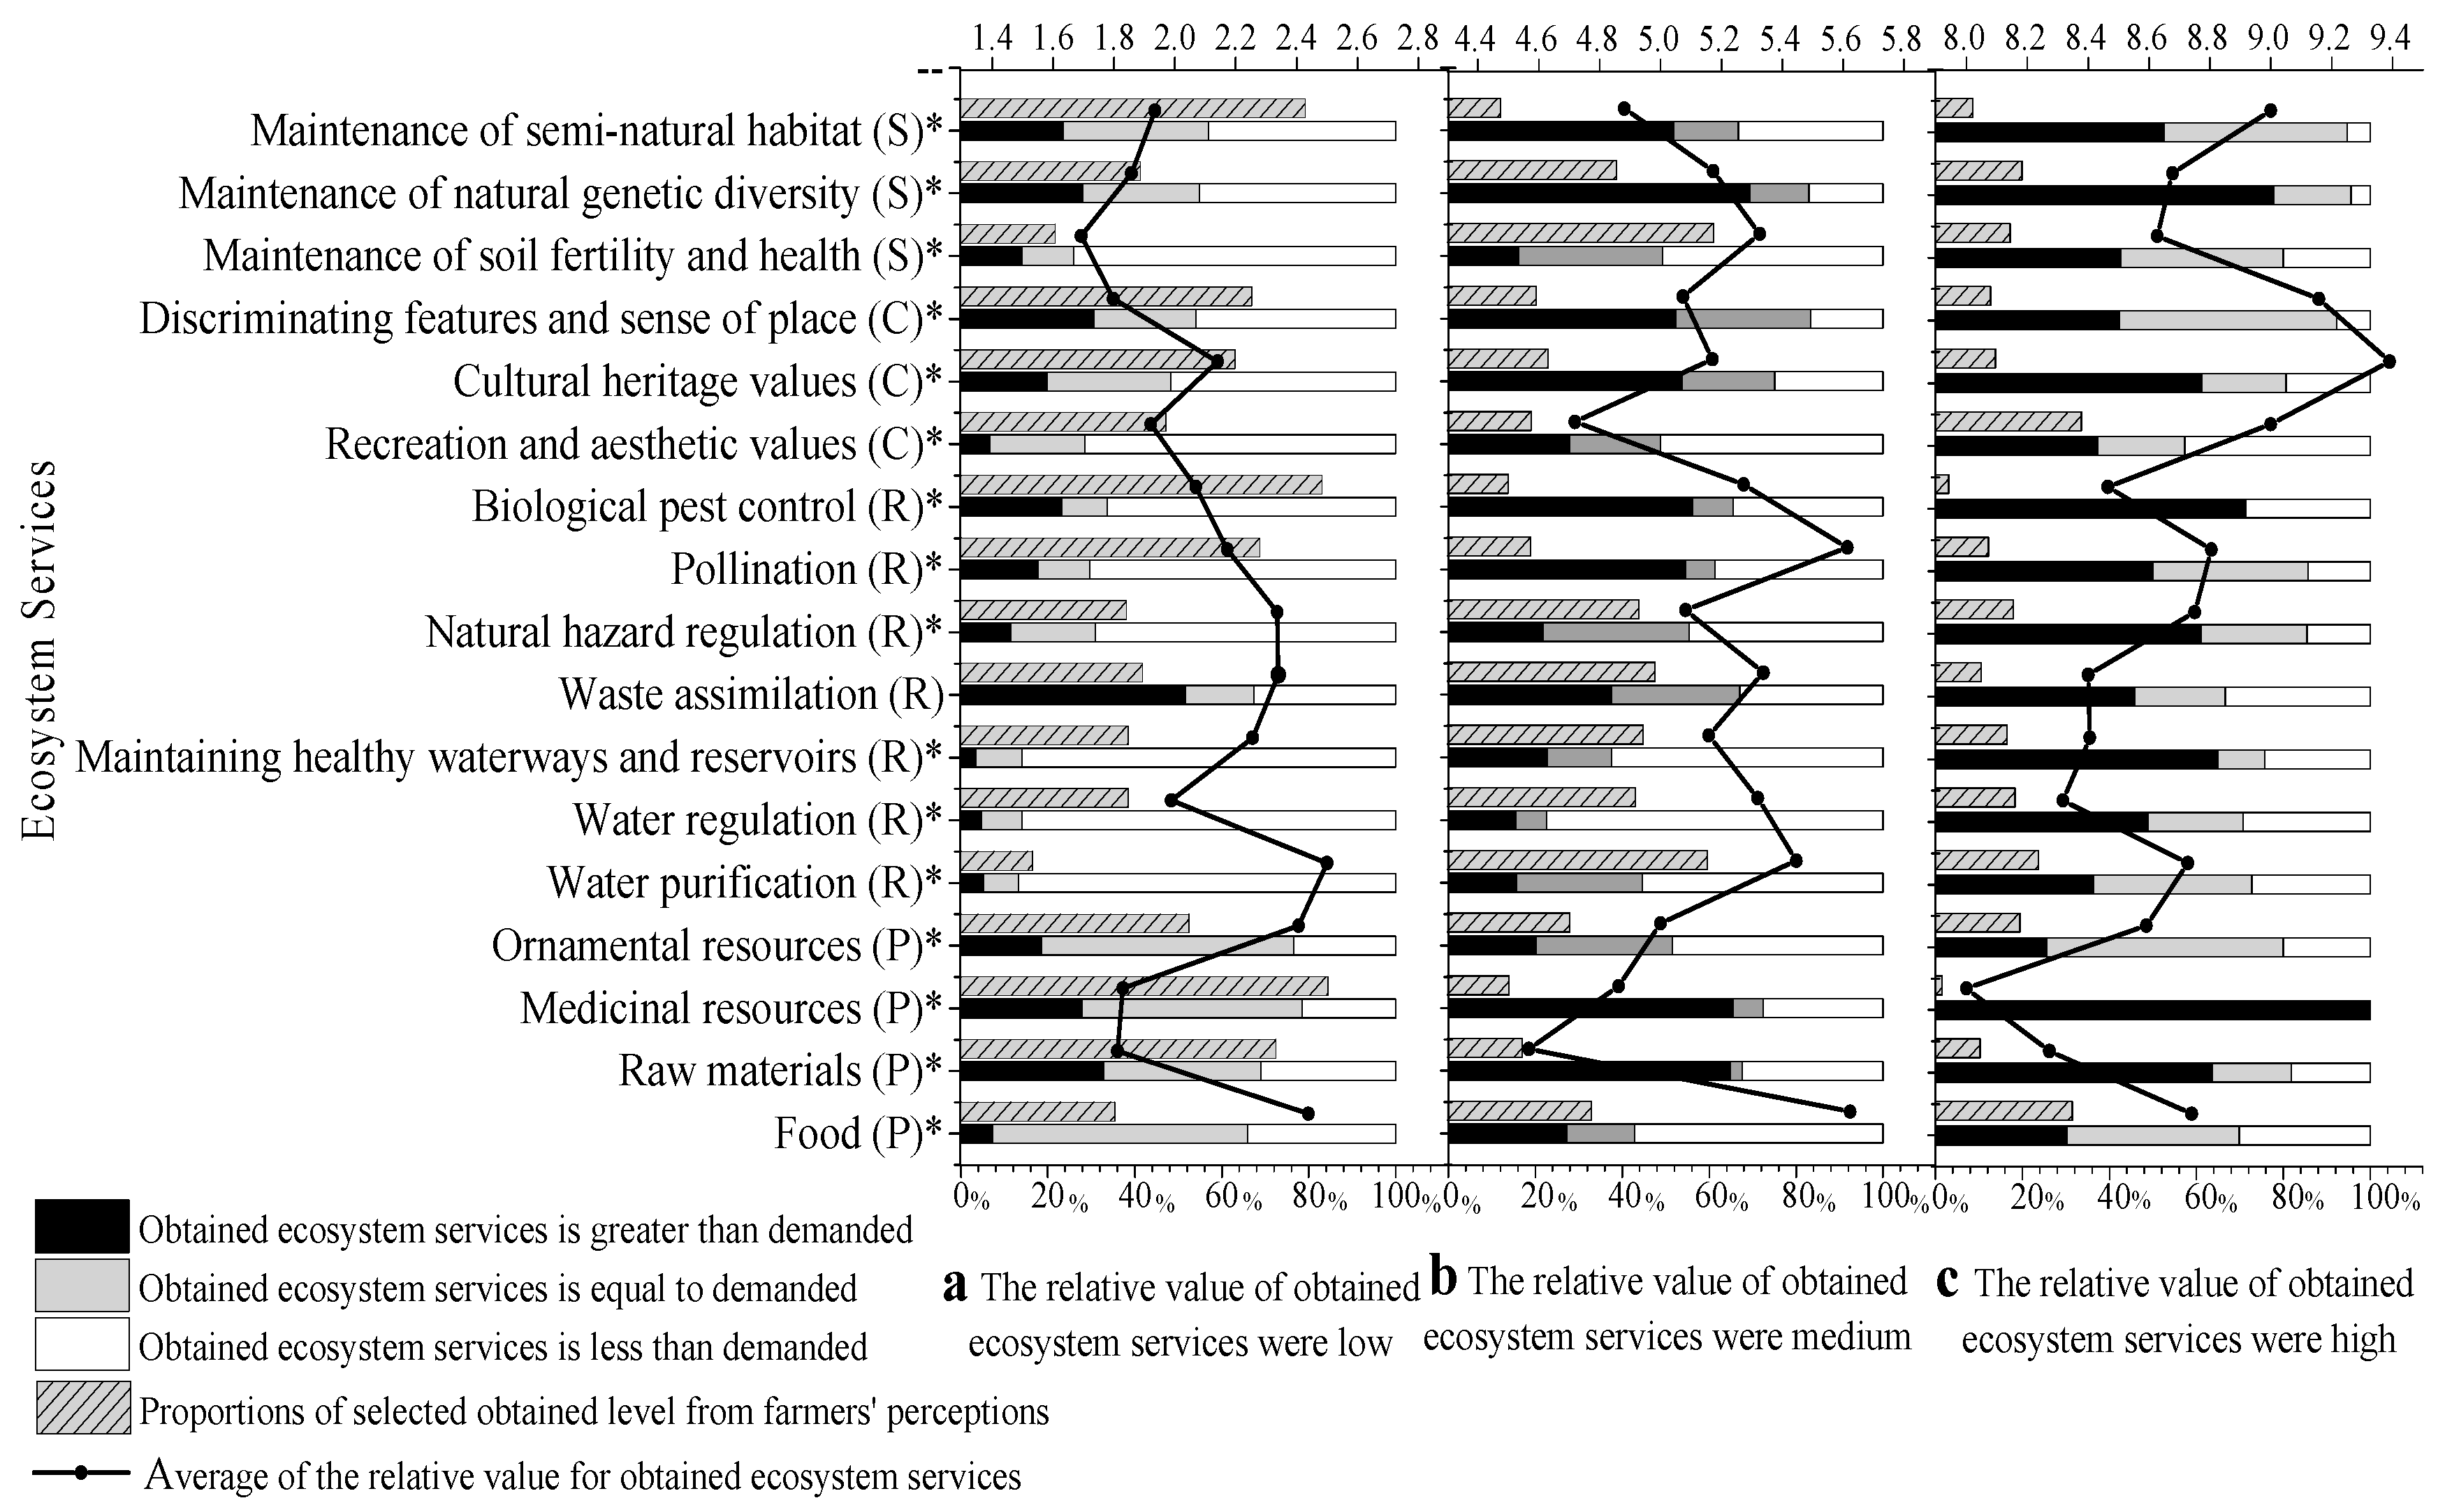
3.2.1. The Relative Value of the Obtained ES

The relative value of the obtained ES and the relationship between the obtained and the demanded services are presented in Figure 3. The results suggested that most of the respondents perceived a relatively low (ranging from 84.30 to 16.40% for different services) or medium (ranging from 61.20 to 12.30% for different services) level of the obtained ES, with only a few respondents perceiving a relatively high level (ranging from 33.60 to 1.50% for different services). When the respondents perceived a low level of the obtained ES, the three most frequently cited individual services were medicinal resources (84.30%), biological pest control (82.97%) and the maintenance of semi-natural habitat (79.10%) (Figure 3a). In this case, the mean relative value of the obtained ES showed that the respondents scored high on food (2.44) but low on other services (e.g., water regulation1.98, the maintenance of soil fertility and health 1.69). When the respondents perceived a medium level of the obtained ES, the three most frequently cited individual services were the maintenance of soil fertility and health (61.20%), water purification (59.90%) and waste assimilation (47.60%) (Figure 3b). In this case, the mean relative value of the obtained ES showed that respondents scored high on food (5.62) and on other services (e.g., pollination 5.61, biological pest control 5.27). When the respondents perceived a high level of the obtained ES, the three most frequently cited individual services were recreation and aesthetic values (33.60%), food (31.47%) and water purification (23.70%) (Figure 3c). In this case, the mean relative value of the obtained ES showed that the respondents scored high on most services (e.g., food 8.74, pollination 8.80, biological pest control 8.46, cultural heritage values 9.39 and the maintenance of semi-natural habitat 9.00). Furthermore, most of the ecosystem services (16 individual services) which have been considered in this study had significantly different distributions of different relationships between the obtained and the demanded services under different obtained levels.

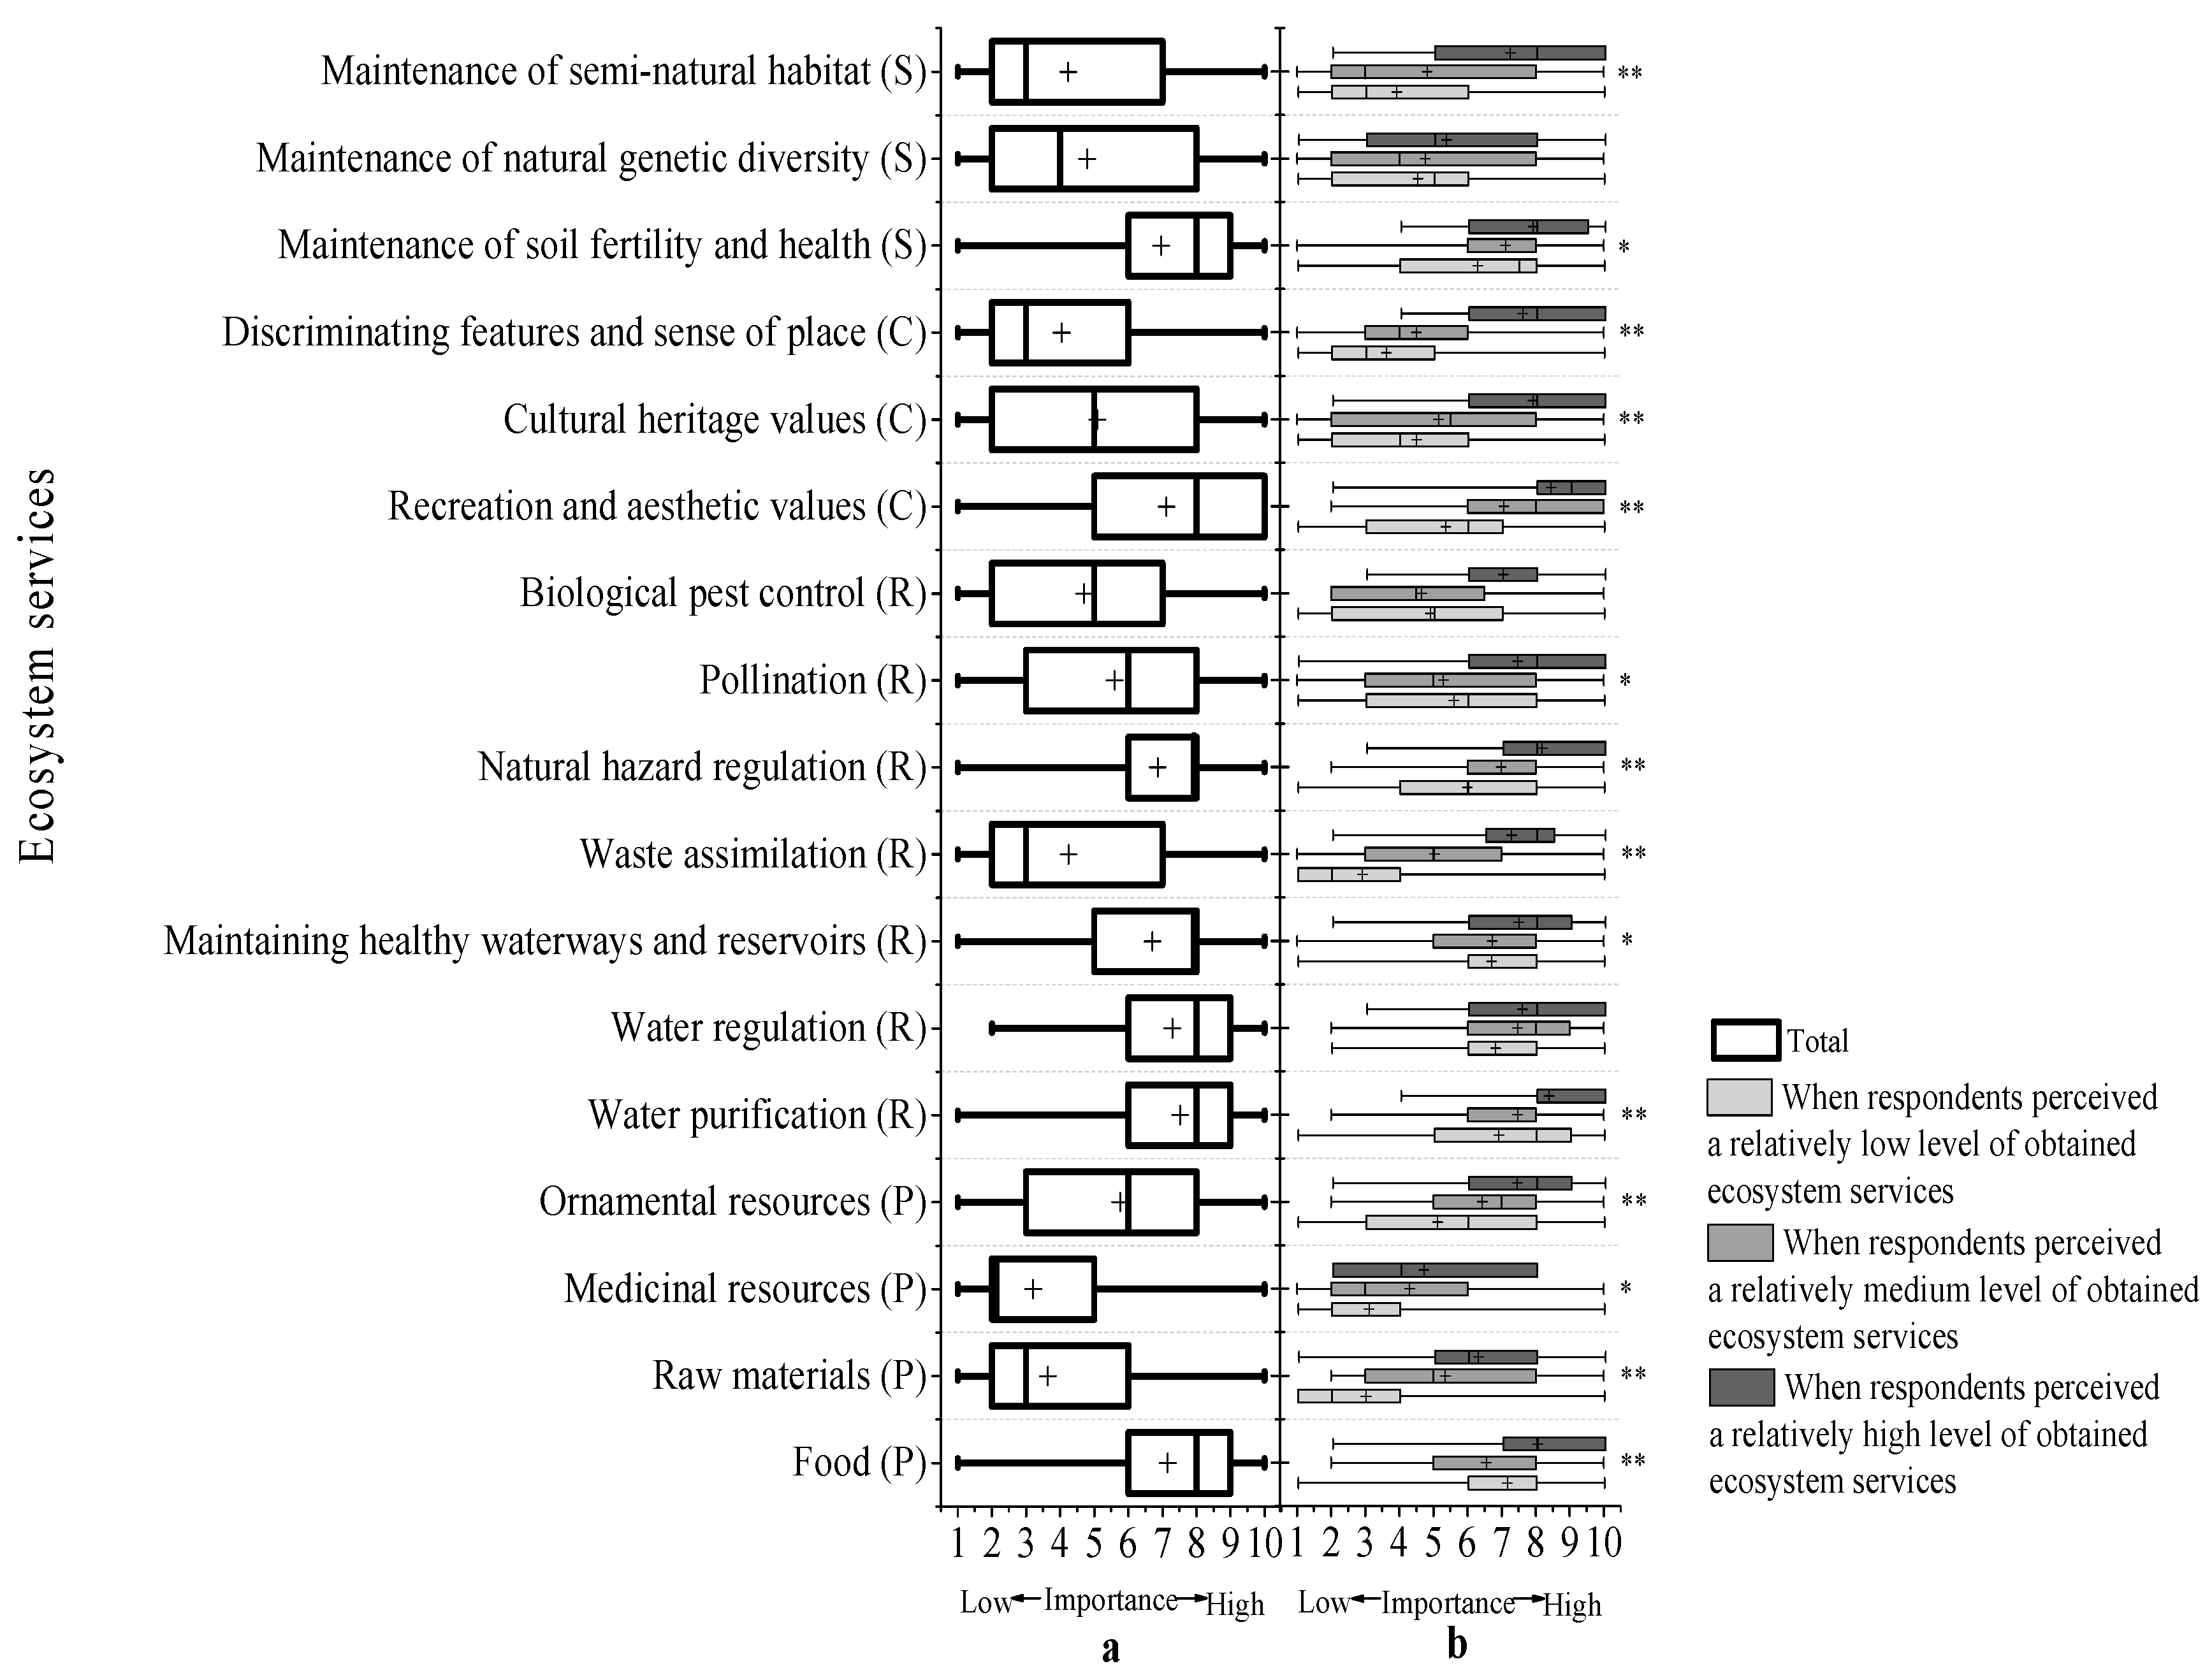
3.2.2. The Importance of Ecosystem Services

To the farmers, the importance of the ES is presented in Figure 4. The 17 ecosystem services which were considered in this study were perceived by this sample of farmers as being low to highly important (median = 2–8, mean = 3.28–7.58) with a relatively large variation (Standard Deviation = 1.97–2.93), as shown in Figure 4a. In these responses, these distributions were highly skewed (Figure 4a), because seven of the ecosystem services under consideration were assigned a value of 8, with 50% of the farmers indicating a value greater than ten for all 17 ecosystem services. The seven ecosystem services belonged to provisioning services (food), regulating services (water purification, water regulation, maintaining healthy waterways and reservoirs, natural hazard regulation), cultural services (recreation and aesthetic values) and supporting services (the maintenance of soil fertility and health). There were five ecosystem services which were rated as being of low importance by the farmers (median = 2 or 3) and belonged to provisioning (raw material, medicinal resources), regulating (waste assimilation), cultural (discriminating features and sense of place) and supporting (the maintenance of semi-natural habitat) services.
The results showed that, for the most ES (14 individual services), the importance of the ES had a significantly different distribution at each obtained ES level (Figure 4b). The respondents considered that most regulating, cultural and supporting services were significantly more important (median = 7 or 8) when they perceived a high obtained ES level. Overall, waste assimilation (total: median = 3, mean = 4.37), pollination (total: median = 6, mean = 5.75), cultural heritage values (total: median = 5, mean = 5.10) and the maintenance of semi-natural habitat (total: median = 3, mean = 4.30) were rated as being of low importance in total situation (Figure 4a). However, these ecosystem services (waste assimilation, a high obtained ES level: median = 8, mean = 7.25; pollination, a high obtained ES level: median = 8, mean = 7.43; cultural heritage values, a high obtained ES level: median = 8, mean = 7.87; the maintenance of semi-natural habitat, a high obtained ES level: median = 8, mean = 7.21) were rated as being significantly more important when the respondents perceived a high obtained ES level (Figure 4b).

3.3. Perceptions of PES Schemes within Agricultural Landscapes

3.3.1. Farmers’ Perceptions of How to Design PES Programs

The respondents were asked to select from the given options of the single rules of PES schemes, including willingness to participate, the standard, targets, the contract duration, the subject, and the approach (Table 2). Most of the respondents (81.47%) wanted to participate in PES schemes (Table 2.1). Half (57.52%) of the respondents chose output-based (result-oriented) payment schemes (Table 2.1). Most of the respondents (64.16%) wanted to focus on bundled service schemes rather than on single service schemes (Table 2.2). Most of the respondents (73.68%) assumed that longer contracts (long-term schemes) secured more environmental benefits (Table 2.2). Most of the respondents chose the provincial/municipal government and the county/town government as the payment subject, with percentages of 46.29% and 40.61%, respectively, whereas the rest (13.10%) chose public/beneficiaries (Table 2.3). Of the four approaches to payment listed in this study, nearly half (46.93%) of the respondents chose in cash, 21.60% chose in kind, 12.68% chose via appropriate policies, and 18.78% chose via appropriate technologies and knowledge (Table 2.4).
Gender and educational level are important factors for the respondents in selecting the given options of the single rules of PES schemes. The number of male respondents who chose longer contracts was significantly higher than for the number of female respondents (χ2 = 4.602, p = 0.032, Table 2.2). It infers that the gender division of labor may exist in PES programs. The male respondents (52.83%) significantly preferred the provincial/municipal government as the subject, whereas the female respondents (50.00%) significantly preferred the county/town government as the subject (χ2 = 9.301, p =0.010, Table 2.3). This infers that farmers’ perceptions of the roles of the various levels of government to implement PES programs vary across different genders. The respondents who received a higher education than the high school level wanted to participate in PES schemes significantly more (χ2 = 6.472, p = 0.039, Table 2.1), focused on bundled services (χ2 = 7.966, p = 0.019, Table 2.2), chose longer contracts (χ2 = 6.787, p = 0.034, Table 2.2), chose the provincial/municipal government (χ2 = 8.483, p = 0.042, Table 2.3) as the subject, and chose via appropriate policies (χ2 = 10.808, p = 0.049, Table 2.4) as the compensation method. The managed area (farmland area) of the farmers who focused on a single service was significantly larger than those who focused on bundled services (t = 2.481, p = 0.014, Table 2.2).

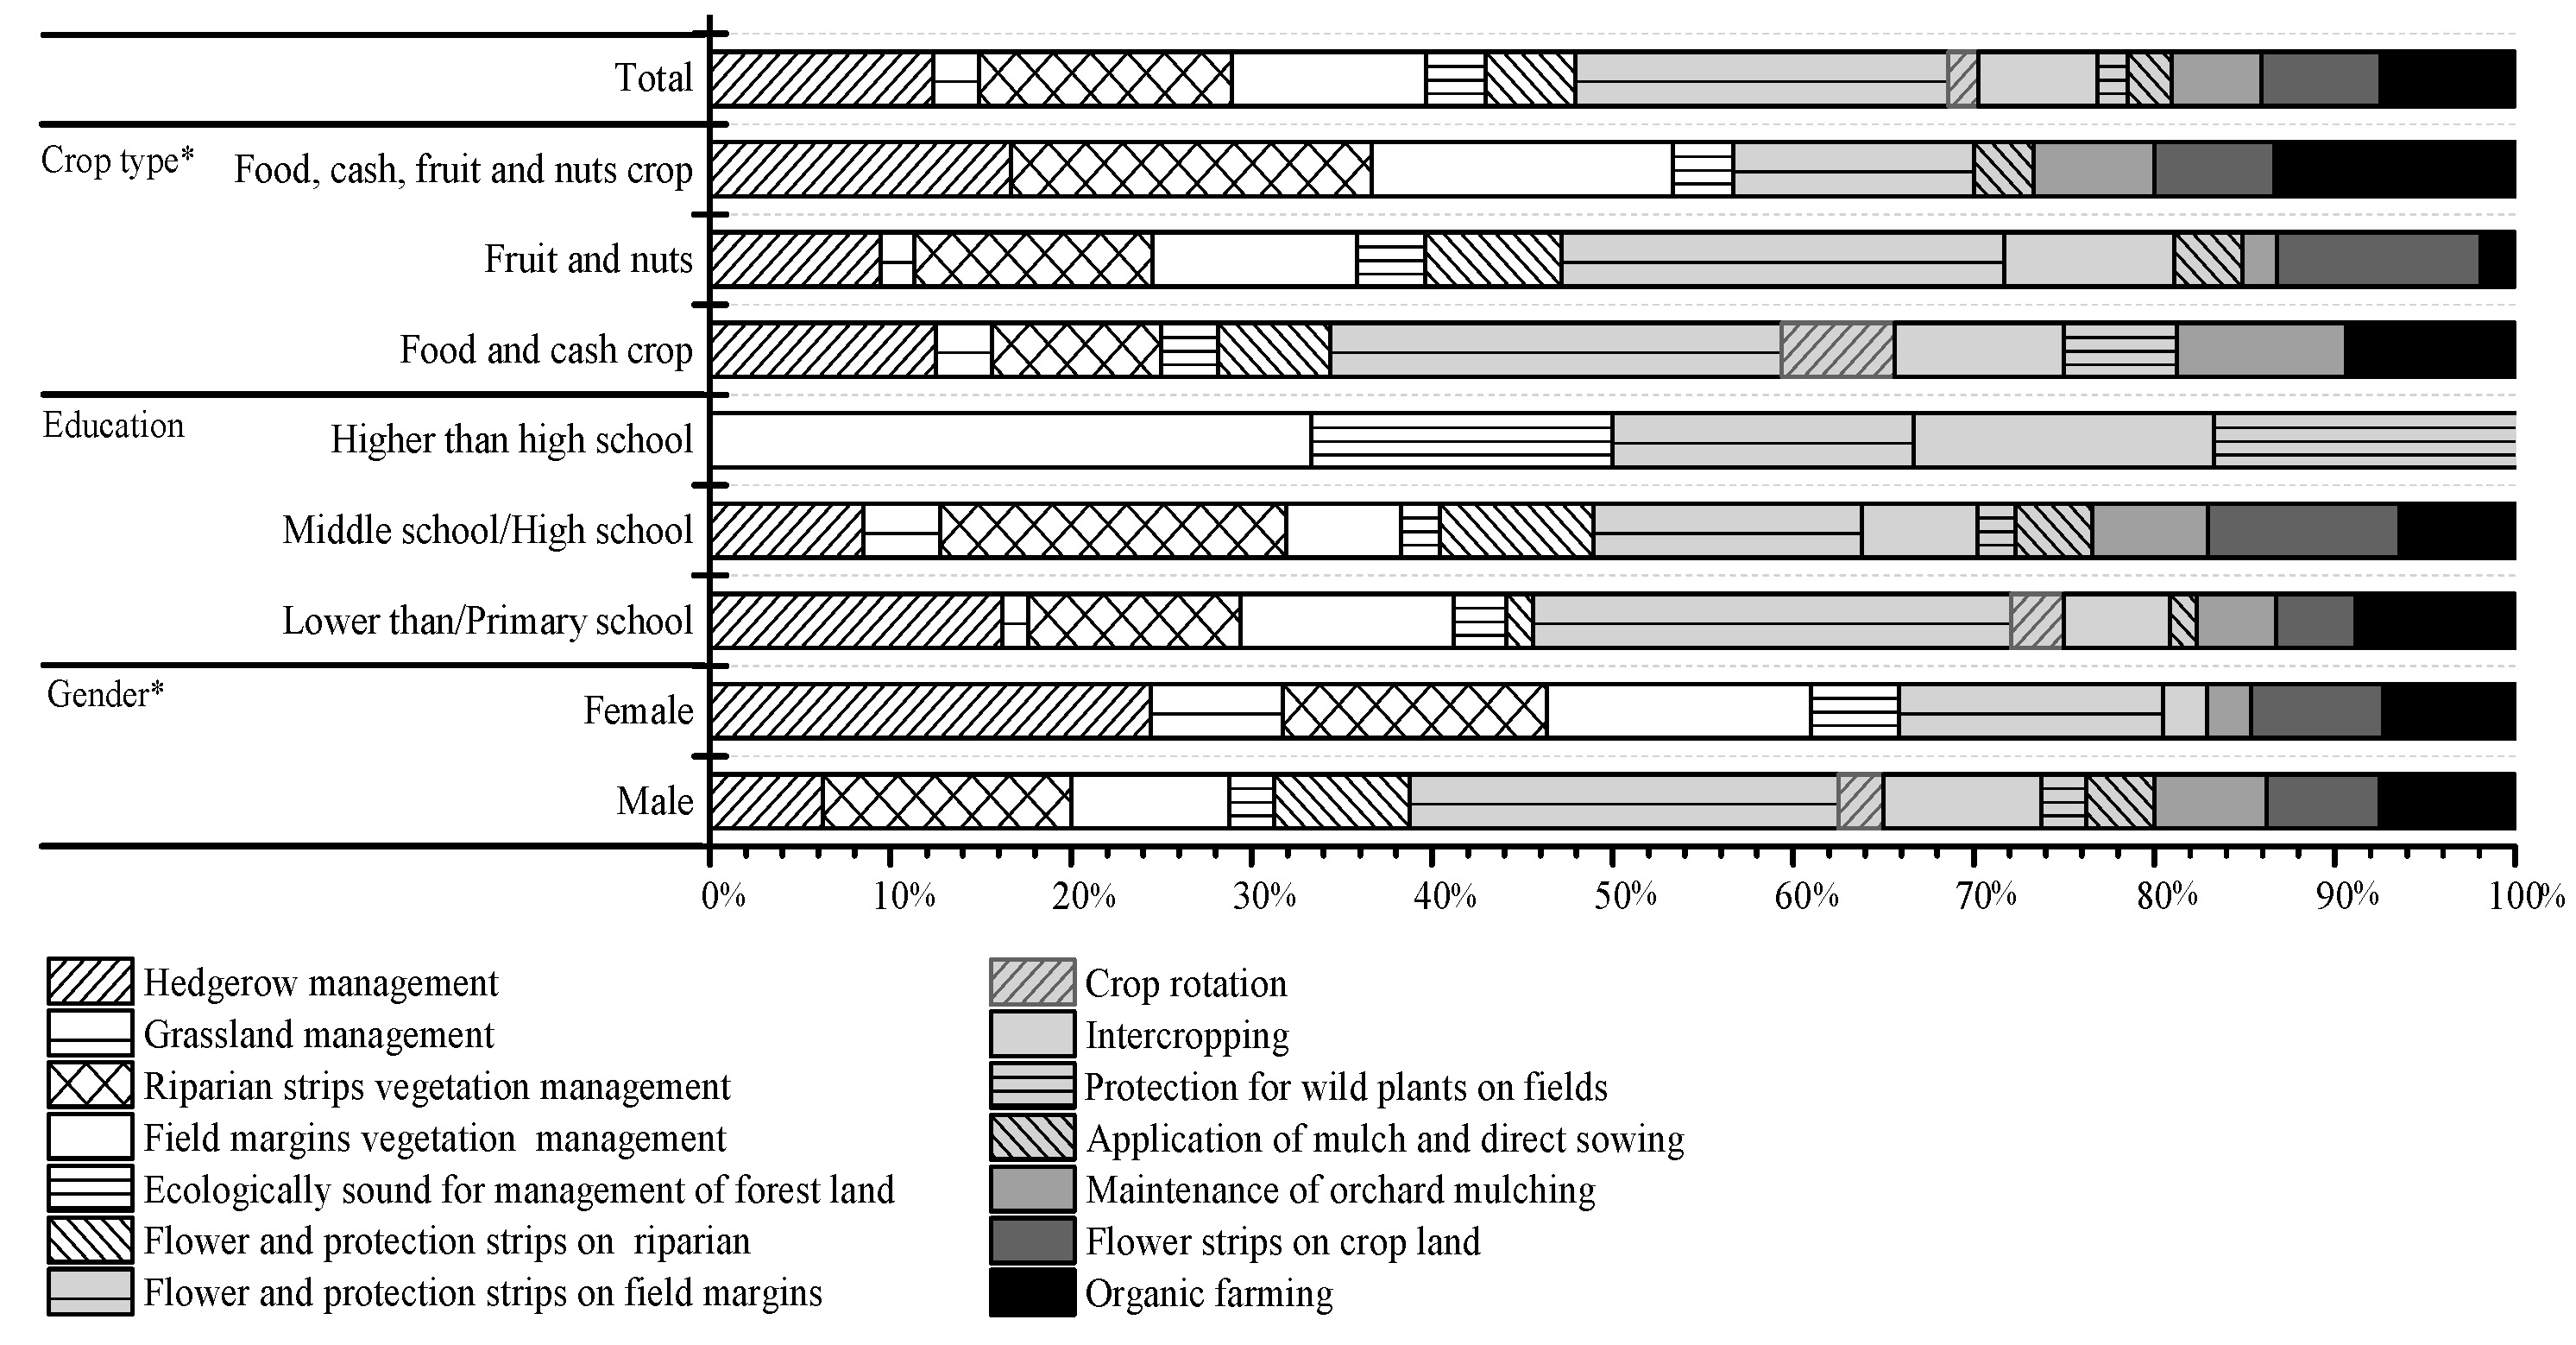
3.3.2. Farmers’ Perceptions of What Management Practices Should Be Contained in PES programs

The farmers’ acceptance of the provided management practices for PES schemes is presented in Figure 5. The respondents who willing to participate in PES schemes were required to select from the given options of management practices (n = 189). The three most frequently cited practices as identified by the respondents were flower and protection strips on field margins (20.66%), riparian strips vegetation management (14.05%), and hedgerow management measures (12.40%). The three least frequently cited practices as identified by the respondents were crop rotation (1.65%), protection for wild plants on fields (1.65%), and application of mulch and direct sowing (2.48%). Considering the different situations of the respondents’ crop type, crop rotation and protection for wild plants on fields, measures were significantly more acceptable for the respondents whose crop types were food and cash crops; the flower strips on crop land measure was significantly more acceptable for the respondents whose crop type was fruit and nuts; and organic farming and maintenance of orchard mulching measures were significantly more acceptable for the respondents whose crop types were a mixture of food, cash, and fruit and nut crops (χ2 = 33.689, p = 0.048). Considering the different situations of the respondents’ gender, males accepted the flower and protection strips on field margins measures significantly more, and females accepted the hedgerow management measure and grassland management measure significantly more (χ2 = 21.754, p = 0.030) . Considering the different situations of the respondents’ educational level, the respondents who had reached an education level higher than high school had a greater acceptation of the field margins vegetation management measure (χ2 = 28.615, p = 0.194).

4. Discussion

4.1. The Perceived Ecosystem Services Trade-Offs and Synergies in Agriculture

This study revealed that farmers could possibly be seeking the trade-offs, balances and synergies among different ES, though they may not know or realize that they are doing so. The evidence is that, when farmers scored low on the obtained ES (trade-offs situation), they scored high on food but low in other services (especially supporting services, e.g., the maintenance of soil fertility and health); however, when they scored medium on the obtained ES (balances situation), they scored high on food and other services (especially regulating services, e.g., pollination and biological pest control); and when they scored high on the obtained ES (synergies situation), they scored high on most services (especially supporting services, e.g., the maintenance of semi-natural habitat). This therefore infers that regulating services (e.g., pollination and biological pest control) provision is central to transforming trade-offs into synergies among ecosystem services and that supporting services (e.g., the maintenance of semi-natural habitat) can enhance the provision of multiple services to maximize synergies among ecosystem services. A possible explanation may be that regulating services tend to change slowly and that the strength of regulating services can attenuate the impact of shocks on ecosystems [47,48]. Moreover, declines in regulating services can result in declines in ecosystem resilience, even when they do not substantially reduce the levels of other ecosystem services [47]. The semi-natural habitats between areas of the agricultural matrix are used by many species such as small mammals, invertebrate fauna, and plants that undertake many of the crucial processes and services [49,50]. It is understandable that services which directly benefit people (e.g., the food supply) are considered to be final or end services, whereas many regulating and supporting services contribute to the provision of final services [48,51,52]. Although the demand for provisioning and cultural services can be met by moving resources or people, the demand for regulating and supporting services must often be met locally [48,53,54]. Most of the ecosystem services (16 individual services) considered in this study showed that the respondents significantly reduced their demand under a high level of the obtained ES. This infers that farmers could possibly recognize the limitation of the obtained ES and reduce their demand appropriately. When the demand for one service is met without decreasing the capacity for the future provision of the service or causing undesirable declines in other services, this situation can be considered to be sustainable [48,55,56].

4.2. Ecosystem Services Perception: Importance

The results (Figure 4) from the survey indicated that the farmers particularly value the importance of water purification, water regulation, maintaining healthy waterways, and the maintenance of soil fertility and health for maintaining productivity and the sustainability of farming enterprises. These results are similar to those of other studies that show farmers generally perceive several ecosystem services as being important for productivity and sustainability [15,16,19]. Although the farmers acknowledged the main important services, the degree to which they obtained the services and perceived the importance of the services differed. For instance, when the respondents perceived a high level of the obtained ES, the mean relative value of the obtained ES showed higher on the maintenance of semi-natural habitat than the other two supporting services did. When the respondents perceived a high level of the obtained ES, the maintenance of soil fertility and health was perceived more important than the other two supporting services. This finding highlights the difference between the farmers’ direct interest in managing a service and the actual production of a service obtained by the farmers [22,57]. Simultaneously, the mean relative value of the obtained waste assimilation, pollination, and cultural heritage values scored high under a high obtained ES level, and these services were rated as significantly more important when the respondents perceived a high obtained ES level. A possible explanation may be that the farmers’ behavior was significantly and positively affected by their intention to conserve ecological achievements and their intention was significantly influenced by their attitude [43]. Therefore, farmers should attach great importance to regulating (e.g., pollination and biological pest control) and supporting (e.g., maintenance of semi-natural habitat and the maintenance of soil fertility and health) services. The adoption of such an attitude could positively affect their behavior to maximize synergies among ES.

4.3. Sufficient Conditions for the Design of PES Programs

At present, China’s agricultural PES schemes remain at the initial stage. There are multiple challenges to consider when designing and implementing a PES scheme in agricultural landscapes. This study (Table 2) showed that the combination of certain design rules is crucial to PES programs. In this research, half (57.52%) of the respondents chose output-based (result-oriented) payment schemes. The farmers in Mengyin County revealed that the development indicator and premium calculation for input-based payments are difficult and that output-based payments are generally understood to increase the effectiveness of PES schemes. If more PES programs were designed at the outset with the intention of evaluating their effectiveness (output-based), it would make a vital contribution toward filling the large gap in our knowledge about effective conservation investments and extrinsic motivations for contributing farmers’ intrinsic motivations [17,36]. Although PES programs typically target a single service [28,58], the respondents in this study who had reached an educational level higher than high school would prefer to focus on bundled services. Unlike the outright purchase of land or permanent easements, many PES programs are short-term [16,33]. Most farmers in Mengyin County were willing to be committed for a period of more than 5 years. The success of schemes depends to a large extent on the continued motivation of farmers to participate [28,33]. In user-financed programs (13.10% of the respondents chose public/beneficiaries), the buyers often created their own intermediaries. Government-financed programs (86.90% of respondents chose government) are managed by national agencies either created for the purpose or already working in the sector. Compared to user-financed programs, government-financed programs tend to have significant economies of scale. The institutional framework conditions for government-financed PES programs remain somewhat stable over time [30]. Although cash is the most common form of payment, it is often supplemented by technical assistance and in kind [30]. This extrinsic motivations (payments with cash supplemented by technical assistance and in kind) could effectively encourage (intrinsically motivate) farmers to participate in agricultural PES programs [30,37,59]. This study revealed that the education, gender, and crop land area of the respondents significant influences their willingness of choose certain PES program design rules. Therefore, the preconditions for a PES scheme to become a feasible and cost-effective conservation mechanism are to understand different practitioners’ concerns [41].

4.4. What Management Practices Should Be Contained in PES Programs

The European Commission has launched direct payments to farmers based on conditional compliance measures: establishing Ecological Focus Areas on the farmed area and maintaining the existing permanent grassland [57,60]. The management practices in agricultural landscapes can be classified according to whether they are applied to non-productive areas, such as field boundaries and riparian strips (sometimes called off-field practices), or productive areas, such as arable crops or orchard (sometimes called on-field practices) [61]. This study (Figure 5) showed that the farmers were more willing to implement off-field practices than on-field practices. Previous studies have shown that schemes aimed at areas out of production (out-of-production schemes) were more effective at enhancing species richness than those aimed at productive areas (in-production schemes) [25,61]. This may be because off-field practices can provide more the maintenance of semi-natural habitat than on-field practices (refer to Table S2). There is a strong evidence that the semi-natural matrix between the areas of the agriculture is used by many wild species and holds more ecosystem services [24,62]. However, on-field practices aim to enhance biodiversity in general as one of several targets (Table S2), in addition to improving other ecosystem services [61]. For example, previous studies have shown that organic farming with low semi-natural habitat can enhance pollination services and crop yield [63]. This can help reduce farmers’ concerns that natural patches within and surrounding cropland are often viewed negatively by producers as a source of weedy plants and other pest species. Based on the results of this study (Figure 5), farmers whose crop type was a mixture of food, cash, and fruit and nuts crops could be encouraged to implement organic farming measure along with in-field flower strips or orchard mulching measure for enhancing crop yield [24]. The flower strips on crop land measure could be more acceptable for farmers whose crop type was fruit, for enhancing the flowering plant richness within crop fields can benefit pollinator richness [64]. Farmers whose crop type was food and cash crops could be encouraged to implement crop rotation measure with positive effects on soil organic matter and soil fertility [65,66]. Considering the different situations of the farmers’ gender, male farmers could be encouraged to implement the flower and protection strips on field margins measure; female farmers could be encouraged to implement hedgerow and grassland management measures. The farmers’ characteristics typically exert a significant effect on their adoption of management measures. Therefore, according to the farmers’ different characteristics, they generally require different bespoke management measures.

5. Conclusions

Based on a theoretical and analytical framework (framework: obtained ES, importance of ES, design rules of PES programs, and management practices of PES programs), this paper focuses on farmers’ perceptions to analyze the trade-offs among various services and design PES programs for ecosystem service management. Farmers’ perceptions of the obtained and the demanded ES imply that they had complied with certain the trade-offs, balances and synergies among different ES, though they may not know or realize that they are doing so. At the same time, they could possibly recognize the limitation of the obtained ES and reduce their demands appropriately. The provision of regulating services (e.g., pollination and biological pest control) is central to transforming trade-offs into synergies among ecosystem services, and supporting services (e.g., maintenance of semi-natural habitat) can enhance the provision of multiple services to maximize synergies among ecosystem services. Therefore, regulating services (e.g., pollination and biological pest control) plays a critical role in determining the long-term persistence of ES sets. Farmers should not only attach great importance to the maintenance of soil fertility and health but also to the maintenance of semi-natural habitat. Farmers attach great importance to the maintenance of semi-natural habitat, and the adoption of such an attitude could positively affect their behavior to maximize synergies among ecosystem services. Most of the respondents (81.47%) wanted to participate in PES schemes. According to the farmers’ preferences, agricultural PES programs in China could be designed as: (1) output-based payments are generally considered as increasing the effectiveness of PES schemes by farmers; (2) there are hopes that bundled services would be gradually generated; (3) most farmers assume that long-term schemes secure more environmental benefits and they are willing to be committed for a period of more than 5 years; and (4) government-financed programs with payments in cash supplemented by technical assistance and in kind would be more appropriate. Farmers are more willing to implement off-field practices than on-field practices. Off-field practices can provide more maintenance of semi-natural habitat, which can enhance the provision of multiple services.
This paper’s approach for assessing ES should distinguish between potential service production and the actual flow of services. The approach for assessing ES could be applicable across a wide range of ecosystem services. From the findings presented in this paper it is clear that the education, gender, and crop land area of the farmers significant influences farmers’ willingness to choose certain PES program design rules and management practices. Therefore, this theoretical and analytical framework could motivate farmers, policy-makers and relevant institutions to interact in shaping a sustainability of agricultural PES program for effectively managing ES.

Supplementary Materials

The following are available online at www.mdpi.com/2071-1050/9/8/1459/s1.

Acknowledgments

This research was funded by National Natural Science Foundation of China (No. 41271198) and Ecological Environment Project of Ministry of Agriculture. We would like to thank the colleagues from China Agricultural University and Mengyin County Government for their help in the survey of farmers. We thank the farmers for their cooperation and patience in the interview. We also thank the two anonymous reviewers for their help in improving this paper.

Author Contributions

Y.C., Q.Z., W.L. and Z.Y. conceived the ideas of the article; Y.C. and Q.Z. designed the survey questionnaire; Y.C. collected the data and analyzed the data; Y.C. and Z.Y. led the writing.

Conflicts of Interest

The authors declare that they have no competing conflicts of interests.

References

  1. Swinton, S.M.; Lupi, F.; Robertson, G.P.; Hamilton, S.K. Ecosystem services and agriculture: Cultivating agricultural ecosystems for diverse benefits. Ecol. Econ. 2007, 64, 245–252. [Google Scholar] [CrossRef]
  2. Logsdon, R.A.; Kalcic, M.M.; Trybula, E.M.; Chaubey, I.; Frankenberger, J.R. Ecosystem services and indiana agriculture: Farmers’ and conservationists’ perceptions. Int. J. Biodivers. Sci. Ecosyst. Serv. Manag. 2015, 11, 264–282. [Google Scholar] [CrossRef]
  3. González-Esquivel, C.E.; Gavito, M.E.; Astier, M.; Cadena-Salgado, M.; del-Val, E.; Villamil-Echeverri, L.; Merlín-Uribe, Y.; Balvanera, P. Ecosystem service trade-offs, perceived drivers, and sustainability in contrasting agroecosystems in central mexico. Ecol. Soc. 2015, 2, 38. [Google Scholar] [CrossRef]
  4. Zhang, W.; Ricketts, T.H.; Kremen, C.; Carney, K.; Swinton, S.M. Ecosystem services and dis-services to agriculture. Ecol. Econ. 2007, 64, 253–260. [Google Scholar] [CrossRef]
  5. Sandhu, H.S.; Wratten, S.D.; Cullen, R. Organic agriculture and ecosystem services. Environ. Sci. Policy 2010, 13, 1–7. [Google Scholar] [CrossRef]
  6. Polasky, S. What’s nature done for you lately: Measuring the value of ecosystem services. Choices 2008, 23, 42–46. [Google Scholar]
  7. Potter, C.; Gasson, R. Farmer participation in voluntary land diversion schemes: Some predictions from a survey. J. Rural Stud. 1988, 4, 365–375. [Google Scholar] [CrossRef]
  8. Bryan, B.A.; Raymond, C.M.; Crossman, N.D.; Macdonald, D.H. Targeting the management of ecosystem services based on social values: Where, what, and how? Landsc. Urban Plan. 2010, 97, 111–122. [Google Scholar] [CrossRef]
  9. Costanza, R.; d’Arge, R.; De Groot, R.; Farber, S.; Grasso, M.; Hannon, B.; Limburg, K.; Naeem, S.; O’neill, R.V.; Paruelo, J. The value of the world’s ecosystem services and natural capital. Ecol. Econ. 1998, 25, 3–16. [Google Scholar] [CrossRef]
  10. Ouyang, Z.; Zheng, H.; Xiao, Y.; Polasky, S.; Liu, J.; Xu, W.; Wang, Q.; Zhang, L.; Xiao, Y.; Rao, E. Improvements in ecosystem services from investments in natural capital. Science 2016, 352, 1455–1459. [Google Scholar] [CrossRef] [PubMed]
  11. Schleyer, C.; Lux, A.; Mehring, M.; Görg, C. Ecosystem services as a boundary concept: Arguments from social ecology. Sustainability 2017, 9, 1107. [Google Scholar] [CrossRef]
  12. Muhamad, D.; Okubo, S.; Harashina, K.; Gunawan, B.; Takeuchi, K. Living close to forests enhances people’s perception of ecosystem services in a forest–agricultural landscape of west java, indonesia. Ecosyst. Serv. 2014, 8, 197–206. [Google Scholar] [CrossRef]
  13. Qin, K.; Li, J.; Yang, X. Trade-off and synergy among ecosystem services in the guanzhong-tianshui economic region of china. Int. J. Environ. Res. Public Health 2015, 12, 14094–14113. [Google Scholar] [CrossRef] [PubMed]
  14. Ghermandi, A.; Fichtman, E. Cultural ecosystem services of multifunctional constructed treatment wetlands and waste stabilization ponds: Time to enter the mainstream? Ecol. Eng. 2015, 84, 615–623. [Google Scholar] [CrossRef]
  15. Iniesta-Arandia, I.; García-Llorente, M.; Aguilera, P.A.; Montes, C.; Martín-López, B. Socio-cultural valuation of ecosystem services: Uncovering the links between values, drivers of change, and human well-being. Ecol. Econ. 2014, 108, 36–48. [Google Scholar] [CrossRef]
  16. Page, G.; Bellotti, B. Farmers value on-farm ecosystem services as important, but what are the impediments to participation in pes schemes? Sci. Total Environ. 2015, 515, 12–19. [Google Scholar] [CrossRef] [PubMed]
  17. Pattanayak, S.K.; Wunder, S.; Ferraro, P.J. Show me the money: Do payments supply environmental services in developing countries? Rev. Environ. Econ. Policy 2010, 4, 254–274. [Google Scholar] [CrossRef]
  18. Dawoe, E.; Quashie-Sam, J.; Isaac, M.; Oppong, S. Exploring farmers’ local knowledge and perceptions of soil fertility and management in the ashanti region of ghana. Geoderma 2012, 179, 96–103. [Google Scholar] [CrossRef]
  19. Smith, H.F.; Sullivan, C.A. Ecosystem services within agricultural landscapes—Farmers’ perceptions. Ecol. Econ. 2014, 98, 72–80. [Google Scholar] [CrossRef]
  20. Buijs, A.E.; Fischer, A.; Rink, D.; Young, J.C. Looking beyond superficial knowledge gaps: Understanding public representations of biodiversity. Int. J. Biodivers. Sci. Manag. 2008, 4, 65–80. [Google Scholar] [CrossRef]
  21. Lindemann-Matthies, P.; Junge, X.; Matthies, D. The influence of plant diversity on people’s perception and aesthetic appreciation of grassland vegetation. Biol. Conserv. 2010, 143, 195–202. [Google Scholar] [CrossRef] [Green Version]
  22. Power, A.G. Ecosystem services and agriculture: Tradeoffs and synergies. Philos. Trans. R. Soc. Lond. B Biol. Sci. 2010, 365, 2959–2971. [Google Scholar] [CrossRef] [PubMed]
  23. Ekroos, J.; Olsson, O.; Rundlöf, M.; Wätzold, F.; Smith, H.G. Optimizing agri-environment schemes for biodiversity, ecosystem services or both? Biol. Conserv. 2014, 172, 65–71. [Google Scholar] [CrossRef]
  24. Garibaldi, L.A.; Carvalheiro, L.G.; Leonhardt, S.D.; Aizen, M.A.; Blaauw, B.R.; Isaacs, R.; Kuhlmann, M.; Kleijn, D.; Klein, A.M.; Kremen, C. From research to action: Enhancing crop yield through wild pollinators. Front. Ecol. Environ. 2014, 12, 439–447. [Google Scholar] [CrossRef]
  25. Andersson, E.; Nykvist, B.; Malinga, R.; Jaramillo, F.; Lindborg, R. A social–ecological analysis of ecosystem services in two different farming systems. Ambio 2015, 44, 102–112. [Google Scholar] [CrossRef] [PubMed]
  26. Baylis, K.; Peplow, S.; Rausser, G.; Simon, L. Agri-environmental policies in the eu and united states: A comparison. Ecol. Econ. 2008, 65, 753–764. [Google Scholar] [CrossRef]
  27. Liu, J.; Li, S.; Ouyang, Z.; Tam, C.; Chen, X. Ecological and socioeconomic effects of china’s policies for ecosystem services. Proc. Natl. Acad. Sci. USA 2008, 105, 9477–9482. [Google Scholar] [CrossRef] [PubMed]
  28. Démurger, S.; Pelletier, A. Volunteer and satisfied? Rural households’ participation in a payments for environmental services programme in inner mongolia. Ecol. Econ. 2015, 116, 25–33. [Google Scholar] [CrossRef]
  29. Meyer, C.; Reutter, M.; Matzdorf, B.; Sattler, C.; Schomers, S. Design rules for successful governmental payments for ecosystem services: Taking agri-environmental measures in germany as an example. J. Environ. Manag. 2015, 157, 146–159. [Google Scholar] [CrossRef] [PubMed]
  30. Wunder, S.; Engel, S.; Pagiola, S. Taking stock: A comparative analysis of payments for environmental services programs in developed and developing countries. Ecol. Econ. 2008, 65, 834–852. [Google Scholar] [CrossRef]
  31. Schomers, S.; Matzdorf, B. Payments for ecosystem services: A review and comparison of developing and industrialized countries. Ecosyst. Serv. 2013, 6, 16–30. [Google Scholar] [CrossRef]
  32. Engel, S.; Pagiola, S.; Wunder, S. Designing payments for environmental services in theory and practice: An overview of the issues. Ecol. Econ. 2008, 65, 663–674. [Google Scholar] [CrossRef]
  33. Kleijn, D.; Baquero, R.; Clough, Y.; Diaz, M.; Esteban, J.D.; Fernández, F.; Gabriel, D.; Herzog, F.; Holzschuh, A.; Jöhl, R. Mixed biodiversity benefits of agri-environment schemes in five european countries. Ecol. Lett. 2006, 9, 243–254. [Google Scholar] [CrossRef] [PubMed]
  34. Ryan, R.M.; Deci, E.L. Intrinsic and extrinsic motivations: Classic definitions and new directions. Contemp. Educ. Psychol. 2000, 25, 54–67. [Google Scholar] [CrossRef] [PubMed]
  35. Muradian, R.; Rival, L. Between markets and hierarchies: The challenge of governing ecosystem services. Ecosyst. Serv. 2012, 1, 93–100. [Google Scholar] [CrossRef]
  36. Russi, D.; Margue, H.; Oppermann, R.; Keenleyside, C. Result-based agri-environment measures: Market-based instruments, incentives or rewards? The case of baden-württemberg. Land Use Policy 2016, 54, 69–77. [Google Scholar] [CrossRef]
  37. Muradian, R. Payments for ecosystem services as incentives for collective action. Soc. Natur. Resour. 2013, 26, 1155–1169. [Google Scholar] [CrossRef]
  38. Zhang, Q.; Xiao, H.; Duan, M.; Zhang, X.; Yu, Z. Farmers’ attitudes towards the introduction of agri-environmental measures in agricultural infrastructure projects in China: Evidence from Beijing and Changsha. Land Use Policy 2015, 49, 92–103. [Google Scholar] [CrossRef]
  39. Jim, C.; Xu, S.S. Stifled stakeholders and subdued participation: Interpreting local responses toward shimentai nature reserve in south china. Environ. Manag. 2002, 30, 327–341. [Google Scholar] [CrossRef] [PubMed]
  40. Sandhu, H.S.; Wratten, S.D.; Cullen, R. From poachers to gamekeepers: Perceptions of farmers towards ecosystem services on arable farmland. Int. J. Agric. Sustain. 2007, 5, 39–50. [Google Scholar]
  41. Muradian, R.; Corbera, E.; Pascual, U.; Kosoy, N.; May, P.H. Reconciling theory and practice: An alternative conceptual framework for understanding payments for environmental services. Ecol. Econ. 2010, 69, 1202–1208. [Google Scholar] [CrossRef]
  42. Yin, R.; Zhao, M.; Yao, S. Designing and implementing payments for ecosystem services programs: What lessons can be learned from china’s experience of restoring degraded cropland. Environ. Sci. Technol. 2014, 48, 19–20. [Google Scholar] [CrossRef] [PubMed]
  43. Deng, J.; Sun, P.; Zhao, F.; Han, X.; Yang, G.; Feng, Y. Analysis of the ecological conservation behavior of farmers in payment for ecosystem service programs in eco-environmentally fragile areas using social psychology models. Sci. Total Environ. 2016, 550, 382–390. [Google Scholar] [CrossRef] [PubMed]
  44. Alcamo, J.; Van Vuuren, D.; Cramer, W.; Alder, J.; Bennett, E.; Carpenter, S.; Christensen, V.; Foley, J.; Maerker, M.; Masui, T. Changes in ecosystem services and their drivers across the scenarios. Ecosyst. Hum. Well Being 2005, 2, 297–373. [Google Scholar]
  45. Carpenter, S.R. Ecosystems and Human Well-Being: Scenarios: Findings of the Scenarios Working Group; Island Press: Washington, DC, USA, 2005; Volume 2. [Google Scholar]
  46. Rounsevell, M.; Dawson, T.; Harrison, P. A conceptual framework to assess the effects of environmental change on ecosystem services. Biodivers. Conserv. 2010, 19, 2823–2842. [Google Scholar] [CrossRef]
  47. Bennett, E.M.; Peterson, G.D.; Gordon, L.J. Understanding relationships among multiple ecosystem services. Ecol. Lett. 2009, 12, 1394–1404. [Google Scholar] [CrossRef] [PubMed]
  48. Villamagna, A.M.; Angermeier, P.L.; Bennett, E.M. Capacity, pressure, demand, and flow: A conceptual framework for analyzing ecosystem service provision and delivery. Ecol. Complex. 2013, 15, 114–121. [Google Scholar] [CrossRef]
  49. Nadrowski, K.; Wirth, C.; Scherer-Lorenzen, M. Is forest diversity driving ecosystem function and service? Curr. Opin. Environ. Sustain. 2010, 2, 75–79. [Google Scholar] [CrossRef]
  50. Bischoff, A.; Pollier, A.; Lamarre, E.; Salvadori, O.; Cortesero, A.-M.; Le Ralec, A.; Tricault, Y.; Jaloux, B. Effects of spontaneous field margin vegetation and surrounding landscape on brassica oleracea crop herbivory. Agric. Ecosyst. Environ. 2016, 223, 135–143. [Google Scholar] [CrossRef]
  51. Martín-López, B.; Gómez-Baggethun, E.; García-Llorente, M.; Montes, C. Trade-offs across value-domains in ecosystem services assessment. Ecol. Indic. 2014, 37, 220–228. [Google Scholar] [CrossRef]
  52. Guillem, E.; Murray-Rust, D.; Robinson, D.; Barnes, A.; Rounsevell, M. Modelling farmer decision-making to anticipate tradeoffs between provisioning ecosystem services and biodiversity. Agric. Syst. 2015, 137, 12–23. [Google Scholar] [CrossRef]
  53. Hauck, J.; Görg, C.; Varjopuro, R.; Ratamäki, O.; Jax, K. Benefits and limitations of the ecosystem services concept in environmental policy and decision making: Some stakeholder perspectives. Environ. Sci. Policy 2013, 25, 13–21. [Google Scholar] [CrossRef]
  54. Giannini, T.C.; Tambosi, L.R.; Acosta, A.L.; Jaffé, R.; Saraiva, A.M.; Imperatriz-Fonseca, V.L.; Metzger, J.P. Safeguarding ecosystem services: A methodological framework to buffer the joint effect of habitat configuration and climate change. PLoS ONE 2015, 10, e0129225. [Google Scholar] [CrossRef] [PubMed]
  55. Boussemart, J.-P.; Leleu, H.; Ojo, O. Exploring cost dominance in crop farming systems between high and low pesticide use. J. Prod. Anal. 2016, 45, 197–214. [Google Scholar] [CrossRef]
  56. Gils, S.; Putten, W.H.; Kleijn, D. Can above-ground ecosystem services compensate for reduced fertilizer input and soil organic matter in annual crops? J. Appl. Ecol. 2016, 53, 1186–1194. [Google Scholar] [CrossRef]
  57. Lamarque, P.; Tappeiner, U.; Turner, C.; Steinbacher, M.; Bardgett, R.D.; Szukics, U.; Schermer, M.; Lavorel, S. Stakeholder perceptions of grassland ecosystem services in relation to knowledge on soil fertility and biodiversity. Reg. Environ. Chang. 2011, 11, 791–804. [Google Scholar] [CrossRef]
  58. Long, K.; Wang, Y.; Zhao, Y.; Chen, L. Who are the stakeholders and how do they respond to a local government payments for ecosystem services program in a developed area: A case study from suzhou, china. Habitat Int. 2015, 49, 1–9. [Google Scholar] [CrossRef]
  59. Tian, Q.; Holland, J.H.; Brown, D.G. Social and economic impacts of subsidy policies on rural development in the poyang lake region, china: Insights from an agent-based model. Agric. Syst. 2016, 148, 12–27. [Google Scholar] [CrossRef]
  60. Dunford, R.W.; Smith, A.C.; Harrison, P.A.; Hanganu, D. Ecosystem service provision in a changing europe: Adapting to the impacts of combined climate and socio-economic change. Landsc. Ecol. 2015, 30, 443–461. [Google Scholar] [CrossRef] [PubMed]
  61. Batáry, P.; Dicks, L.V.; Kleijn, D.; Sutherland, W.J. The role of agri-environment schemes in conservation and environmental management. Conserv. Biol. 2015, 29, 1006–1016. [Google Scholar] [CrossRef] [PubMed]
  62. Mendenhall, C.D.; Karp, D.S.; Meyer, C.F.; Hadly, E.A.; Daily, G.C. Predicting biodiversity change and averting collapse in agricultural landscapes. Nature 2014, 509, 213–217. [Google Scholar] [CrossRef] [PubMed]
  63. Kennedy, C.M.; Lonsdorf, E.; Neel, M.C.; Williams, N.M.; Ricketts, T.H.; Winfree, R.; Bommarco, R.; Brittain, C.; Burley, A.L.; Cariveau, D. A global quantitative synthesis of local and landscape effects on wild bee pollinators in agroecosystems. Ecol. Lett. 2013, 16, 584–599. [Google Scholar] [CrossRef] [PubMed]
  64. Nicholls, C.I.; Altieri, M.A. Plant biodiversity enhances bees and other insect pollinators in agroecosystems. A review. Agric. Sustain. Dev. 2013, 33, 257–274. [Google Scholar] [CrossRef]
  65. Tiemann, L.; Grandy, A.; Atkinson, E.; Marin-Spiotta, E.; McDaniel, M. Crop rotational diversity enhances belowground communities and functions in an agroecosystem. Ecol. Lett. 2015, 18, 761–771. [Google Scholar] [CrossRef] [PubMed]
  66. Gaba, S.; Lescourret, F.; Boudsocq, S.; Enjalbert, J.; Hinsinger, P.; Journet, E.-P.; Navas, M.-L.; Wery, J.; Louarn, G.; Malézieux, E. Multiple cropping systems as drivers for providing multiple ecosystem services: From concepts to design. Agron. Sustain. Dev. 2015, 35, 607–623. [Google Scholar] [CrossRef] [Green Version]
Figure 1. Presents the theoretical and analytical framework that was used in this study. ES: ecosystem services; PES: payments for ecosystem services.
Sustainability 09 01459 g001
Figure 2. The location of the study regions (shaded dark) and sampling point of the study area.
Sustainability 09 01459 g002
Figure 3. The relative value of the obtained ES and the relationship between the obtained and the demanded services from the farmers’ perceptions. P stands for provisioning services; R stands for regulating services; C stands for cultural services; and S stands for supporting services. The same below. The Pearson Chi-Square was used to compare the distributions of the different relationships between the obtained and the demanded services under different obtained ES levels. * p < 0.05.
Sustainability 09 01459 g003
Figure 4. The importance of the ES to farmers. The Pearson Chi-Square was used to compare the relative importance under different obtained ES levels. + is the mean value, * p < 0.05, ** p < 0.01.
Sustainability 09 01459 g004
Figure 5. The farmers’ acceptance of the provided management practices for PES schemes. The Pearson Chi-Square was used to compare the distributions of gender, education, or crop type. * p < 0.05.
Sustainability 09 01459 g005
Table 1. Basic characteristics of the respondents.
Profile Information of RespondentsTotal (n = 232)
Age (mean)49.63
Gender (%)Male68.53
Female31.47
Education (%)Primary school or lower48.28
Middle/high school45.26
Higher than high school6.47
Area managed (ha)0.35
Crop type (%)Food and cash crops27.15
Fruit and nuts45.25
Food, cash, and fruit and nut crops27.60
Whether they had previously heard of the term “ecosystem services” (%)Yes14.66
No85.34
Table 2. Farmers’ perceptions in selected single rules for PES schemes—willingness to participate, standard, targets, contract duration, subject, and approach.
Table 2.1Willingness to Participate in PES Schemes p-ValueWhat Is the Criterion for Payment? (Standard)p-ValueTest Statistic
UnwillingWillingInputsOutputs
Age (mean)49.8748.530.51949.8149.420.812Independent-sample t-test a
Gender (%)Male16.3583.650.20744.5255.480.360Pearson Chi-Square b
Female23.2976.7138.0361.97
Education (%)Primary school or lower24.1175.890.039 *35.4564.550.093Pearson Chi-Square b
Middle/high school15.2484.7648.0451.96
Higher than high school0.00100.0057.1442.86
Area managed (ha)0.270.370.2490.340.360.813Independent-sample t-test a
Crop type (%)Food and cash crops15.2584.750.69140.6859.320.954Pearson Chi-Square b
Fruit and nuts18.1881.8243.1656.84
Food, cash, fruit and nuts crops21.3178.6942.6257.38
Proportions in farmers’ perceptions (%)18.5381.47 42.4857.52
Table 2.2Focus on Single or Bundled ES (Targets)p-ValueHow Long Should Schemes Last? (Contract Duration)p-ValueTest Statistic
Single BundledShorter (<5 yr) Longer (>5 yr)
Age (mean)50.7249.120.35349.7049.670.987Independent-samples t-test a
Gender (%)Male38.4661.540.22022.1577.850.032 *Pearson Chi-Square b
Female30.0070.0035.7164.29
Education (%)Primary school or lower33.3366.670.019 *31.1968.810.034 *Pearson Chi-Square b
Middle/high school42.7257.2825.0075.00
Higher than high school6.6793.330.00100.00
Area managed (ha)0.460.290.014 *0.300.370.322Independent-samples t-test a
Crop type (%)Food and cash crops37.2962.710.20020.3479.660.293Pearson Chi-Square b
Fruit and nuts40.0060.0028.8771.13
Food, cash, fruit and nuts crops26.2373.7732.7967.21
Proportions in farmers’ perceptions (%)35.8464.16 26.3273.68
Table 2.3Who Pays? (Subject)p-ValueTest Statistic
Provincial/Municipal GovernmentCounty/Town GovernmentsThe Public/Beneficiaries
Age (mean)50.1049.6648.470.813One-way analysis of variance c
Gender (%)Male52.8336.4810.690.010 *Pearson Chi-Square b
Female31.4350.0018.57
Education (%)Primary school or lower40.0048.1811.820.042 *Pearson Chi-Square b
Middle/high school49.0436.5414.42
Higher than high school73.3413.3313.33
Area managed (ha)0.380.270.490.098One-way analysis of variance c
Crop type (%)Food and cash crops40.6844.0715.250.338Pearson Chi-Square b
Fruit and nuts54.5535.3510.10
Food, cash, fruit and nuts crops40.0045.0015.00
Proportions in farmers’ perceptions (%)46.2940.6113.10
Table 2.4Compensation Methods (Approach)p-ValueTest Statistic
In CashIn KindVia Appropriate PoliciesVia Appropriate Technologies and Knowledge
Age (mean)49.8752.4347.9648.800.415One-way analysis of variance c
Gender (%)Male46.5821.2313.7018.490.931Pearson Chi-Square b
Female47.7622.3910.4519.40
Education (%)Primary school or lower48.1124.5310.3816.980.049 *Pearson Chi-Square b
Middle/high school50.0017.7112.5019.79
Higher than high school9.1027.2736.3627.27
Area managed (ha)0.350.350.330.360.995One-way analysis of variance c
Crop type (%)Food and cash crops43.1421.5717.6417.650.762Pearson Chi-Square b
Fruit and nuts51.6219.359.6819.35
Food, cash, fruit and nuts crops44.0725.4210.1720.34
Proportions in farmers’ perceptions (%)46.9421.6012.6818.78
The respondents who willing to participate in PES schemes were required to select from the given options of single rules (n = 189), * p < 0.05. a An independent-sample t-test was used to compare two groups of mean age or area managed. b The Pearson Chi-Square was used to compare the distributions of gender, education, or crop type. c A one-way analysis of variance was used to test multiple comparisons among a set of mean age or area managed.

