Cutting GHG Emissions at Student Housing in Central Mexico through Solid Waste Management
by
 , ,
, ,
Quetzalli Aguilar-Virgen
1,2 ,
,
Paul Taboada-González
1,2 ,
,
Eduardo Baltierra-Trejo
3 and 
Liliana Marquez-Benavides
2,4,* 1
Facultad de Ciencias Químicas e Ingeniería, Universidad Autónoma de Baja California, Calzada Universidad No. 14418, Mesa de Otay, Tijuana 22390, Mexico
2
Sociedad Mexicana de Ciencia y Tecnologia Aplicada a Residuos Sólidos, Calimaya 52227, Mexico
3
Centro de Investigación en Sustentabilidad Energética y Ambiental del Noreste, Universidad Autónoma del Noreste, Av. Constituyentes 1002, Las Rusias, Matamoros 87560, Mexico
4
Instituto de Investigaciones Agropecuarias y Forestales, Universidad Michoacana de San Nicolás de Hidalgo, Av. San Juanito Itzícuaro S/N, Colonia San Juanito Itzícuaro, Morelia 58240, Mexico
*
Author to whom correspondence should be addressed.
Sustainability 2017, 9(8), 1415; https://doi.org/10.3390/su9081415
Submission received: 13 July 2017
/
Revised: 3 August 2017
/
Accepted: 8 August 2017
/
Published: 11 August 2017
(This article belongs to the Section Sustainable Engineering and Science)
Abstract
:Solid waste characterisation studies have been conducted at the household or municipal level, but fewer studies have assessed the composition of solid waste within institutions of higher education or university student residences. Studies carried out in universities usually refer to the academic buildings, yet, reports of waste characterisation from student housing and the associated greenhouse gas emissions are scarce. The goal of this work was to present a study case where both equivalent carbon dioxide (CO2eq) emissions and waste reductions were successfully attained in student housing after implementation of a solid waste management strategy. Two waste characterisation studies were carried out, before and after a waste management program was implemented to reduce waste generation. The waste generation per capita (GPC) per day was estimated at 1.5 kg for the first study (2014) and 1.1 kg for the second (2015); in addition, 87% of the waste stream was diverted from the landfill through vermicomposting and recycling. The percentage of food waste used for vermicomposting was 2.83%. The CO2eq emissions in 2014 were estimated at 12,624 kg CO2eq (0.43 kg/capita/day) and 761 kg for 2015 (0.03 kg/capita/day). Appropriate solid waste management was revealed to have a fundamental role in cutting indirect CO2eq emissions.
1. Introduction
Municipal solid waste management (MSWM) is one of the major environmental challenges in most of the cities of developing countries [1,2]. People are discarding growing quantities of household solid waste (HSW), and its compositions are becoming more complex as consumer products made of plastic and diversified hazardous materials are widely used [3]. Increases in urbanisation have provoked a notable increase in both the generation and waste composition [4]. The large amount of produced waste and, consequently, the difficulty involved in eliminating it is still a problem in developed societies [5]. This situation has led to serious consequences for the environment in terms of river and groundwater contamination by landfill leachates, including soil pollution; greenhouse gas emissions; and fauna mortality [2,6]. For this reason, solid waste (SW) generation and its management has been gaining attention across the world.
In the regulation of some countries, solid waste management is the responsibility of local authorities [7]. However, this activity should not only involve public administration, but also waste generators. In Mexico, it is common to hear in the news that people complain about the authorities regarding the effects of solid waste, but these people are not willing to reduce their waste, participate in recycling programs, dispose of their waste properly, or pay for private waste collection. In cities such as Tijuana or Mexico City, rainwater systems have collapsed and cause flooding due to excessive waste on the streets or to the inadequate disposal of bulky waste, such as armchairs, refrigerators, and tyres.
The productive sector has developed and applied strategies to reduce environmental impacts that are due to human activities, including the three Rs (reuse, reduce, recycle), recovery of the energy from waste, waste valorisation, and sustainable industrial design, among others. In Europe, one of the key issues of the landfill directive was to substantially reduce the biodegradable municipal waste going to landfill and, thus, reduce uncontrolled emissions of methane, a primary greenhouse gas [8]. The government of the Japanese city of Nagoya launched the “3 Don’ts” campaign: do not buy too much food, do not cook too much food, and do not throw away too much food. Through this action, they are looking to reduce the generation of household waste [9].
Education institutions of the world accept the responsibility for adequate waste management (WM). In Mexico, researchers have reported their results about WM in universities. Ruiz [10] carried out a study on waste quantification and characterization in 2008 and 2009 at Universidad Iberoamericana, Mexico City. He found a daily waste generation of around 0.33 kg/per person and he found that 52% of the university’s solid waste could be processed through composting; 27% could be recycled, and only 21% should go to a landfill. Armijo-de-Vega [11] in 2008 analysed the waste in the Campus Mexicali I of the Autonomous University of Baja California and found that more than 65% of waste is recyclable, or potentially recyclable. In other countries, such as Italy [12], the awareness of the children/young people of differing ages were assessed regarding waste management because they consider that instilling the right behaviour in school children is also beneficial to the behaviour of their families. In Brazil [13] the principles of eco-efficiency to measure and evaluate environmental performance, such as energy supply, financial values, and the environmental impact of the water footprint, among others, were used to study five university restaurants.
With this precedent, in 2014, a strategy for the management of solid waste was implemented in a student residence belonging to the Universidad Michoacana de San Nicolas Hidalgo (UMSNH). The strategy contributes to decreasing the GHG emissions as part of the University Environmental Plan created in 2007. The importance of this action is due to the UMSNH being the main public state university in Michoacán, Mexico, which provides free food and accommodation to more than 5500 students in 35 buildings named “students’ housing”. These sites exist due to a presidential initiative passed in 1940, as a means to mitigate poverty and provide higher education for the underprivileged in the area. In 2016, the UMSNH assigned MXP $120 million (USD $6.9 million, exchange rate on 4 July 2017) to sustain the students’ homes, a figure that represents almost half of the institution’s collection resources, which is around MXP $258 million (USD $14.8 million) [14].
Assessing the environmental impacts of universities is not a trivial task due to the complexity and diversity of their operations. Nevertheless, it is deemed important to estimate them in order to identify more sustainable options for reducing their environmental footprints [15]. While numerous waste characterisation studies have been conducted at a household or municipal level, fewer studies have assessed the composition of solid waste within higher education institutions [11,12,16]. Most of them report waste characterisations or waste management, and a few determine the GHG emissions avoided through waste management. Moreover, there are few studies where the characterisation of solid waste has been related to the emission of greenhouse gases. These reports have mainly been on agricultural activities, such as CH4’s contribution to the degradation of livestock excreta [17] or the provision of municipal solid waste in landfills [18], while little attention has been paid to the contribution of specific sectors as education. However, emission sources in specific sectors and activities should be characterised as part of greenhouse gas mitigation strategies [19]. Therefore, the goal of this work is to present both equivalent carbon dioxide (CO2eq) emissions and waste reductions in one of the student housings after implementation of a solid waste management strategy.
2. Materials and Methods
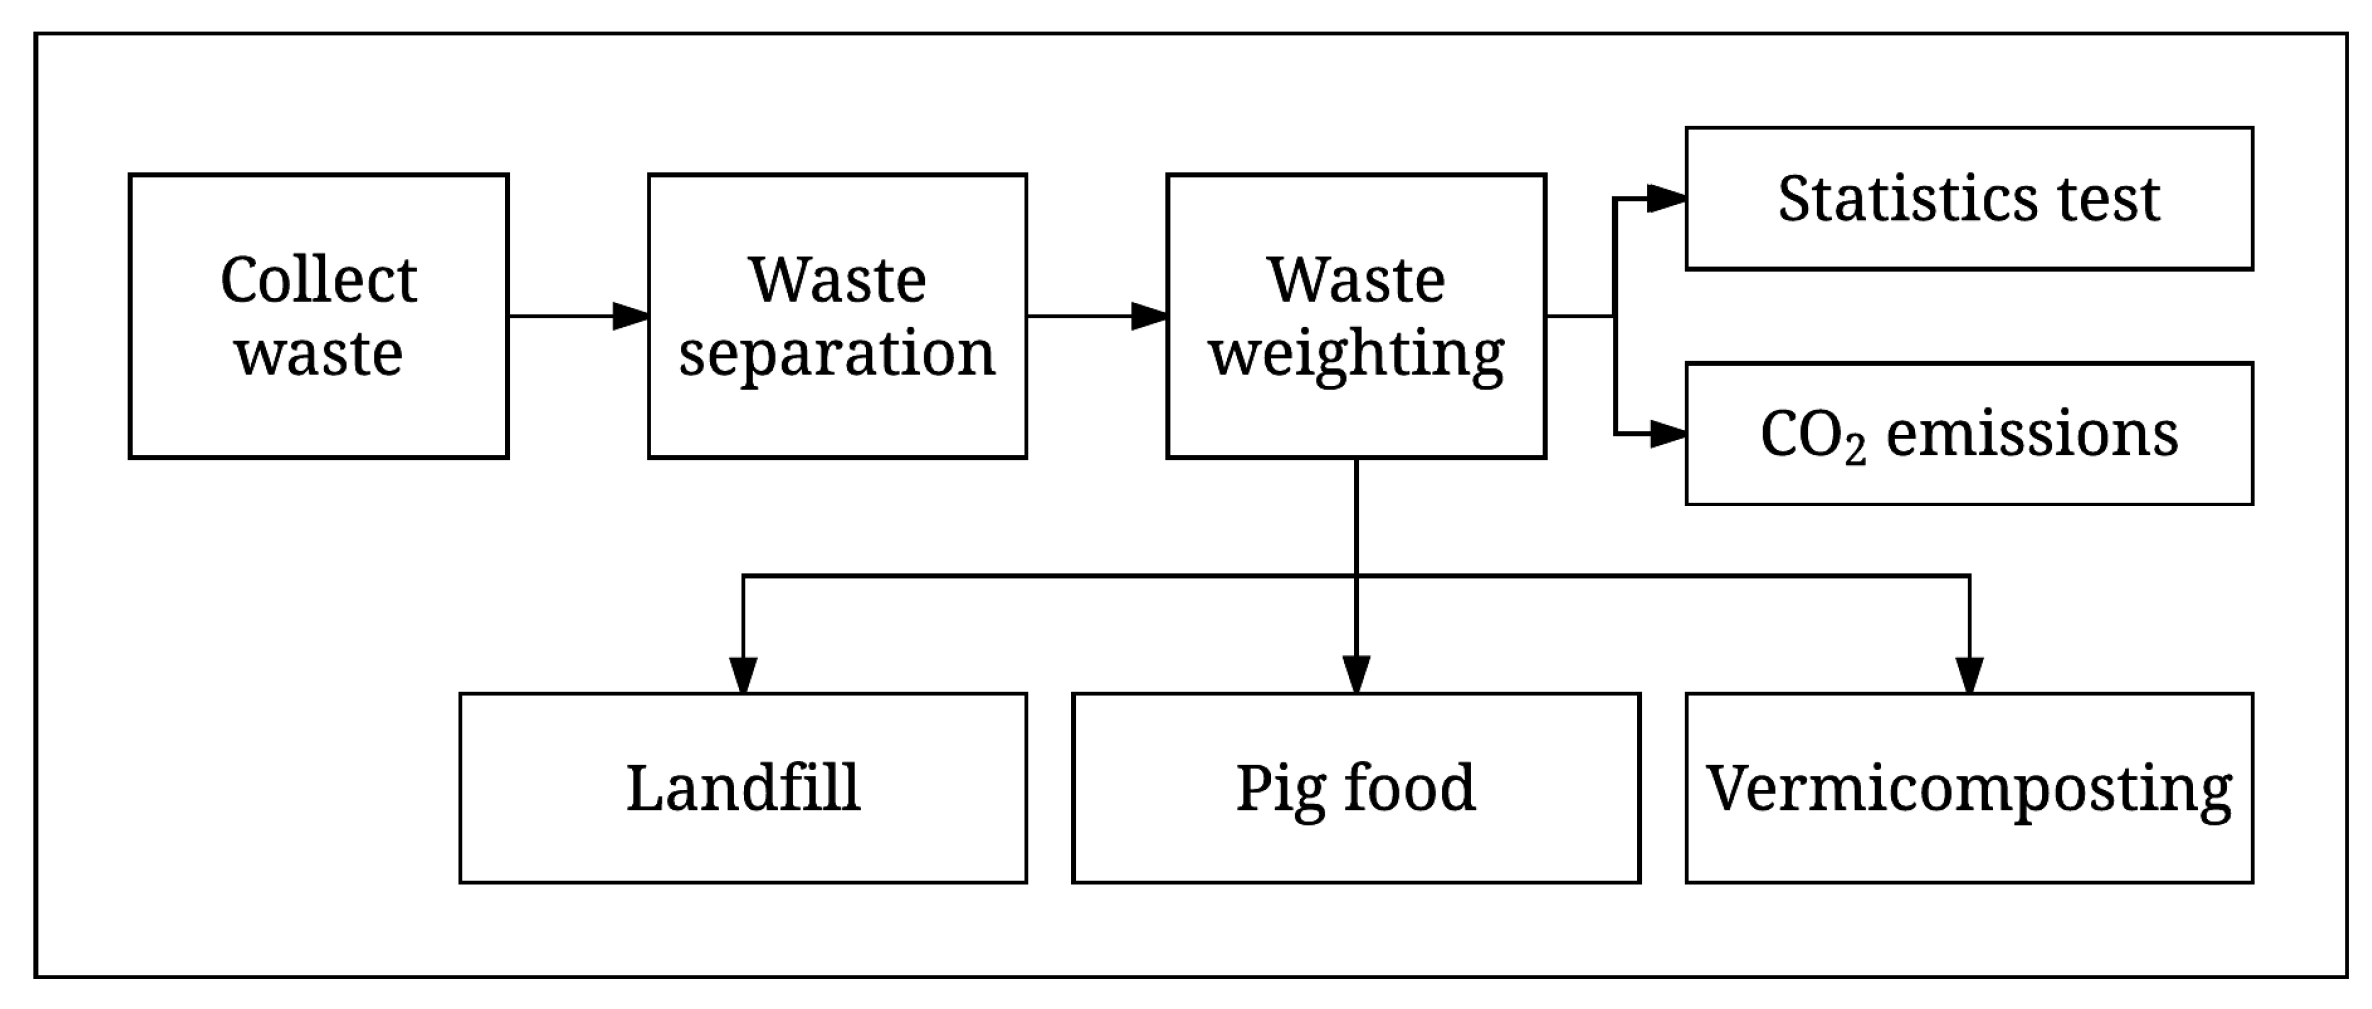
The waste characterisation studies were carried out in two stages, each one lasting seven consecutive days. The first was in June 2014 and the second in April 2015. Waste management strategies were applied after the first study. The methodology employed in the study is outlined in Figure 1.
2.1. Area of Study
The UMSNH is in Morelia, México. Morelia is in the north-central part of the state of Michoacán in Central Mexico. This city is located at 19°46′06″ N 101°11′22″ W. The city has an elevation above sea level of 1920 m (6300 ft) and a subtropical highland climate with a precipitation of 773.5 mm annually. The average annual temperature is 20 °C, the lowest temperatures occur in the month of January at around 8 °C. The average maximum temperature is 31 °C and occurs in the months of April and May.
The UMSNH has 35 student housing buildings, but in this study, only one was analysed due to: (a) economic and time constraints on realising this study; and (b) all student’ housing depends on the same university central administration, and the budget allocated for services is calculated on a per capita basis.
The building selected is named “Wenceslao Victoria Soto”, and it has a maximum annual capacity of 80 residents distributed in 15 rooms. The services to students include a basketball court, central kitchen, dining area, audio-visual room, computer room, and a library.
2.2. Solid Waste Generation and Characterisation Study
Usually, the waste analysed in the waste studies is obtained from a truck collection or directly from houses under study. In this study, waste was taken from the waste room (WR) located in the building. The student residents collect the produced solid waste and use the WR for temporary storage until the municipal services collect it later. Stored waste was solely from the Wenceslao Victoria Soto building.
At the beginning of the study, it was observed that a significant part of waste was not in plastic bags or other containers. The students only emptied the trash can on the floor without further action. The waste on the floor caused leachates and garbage to disperse through the building through the feet, due to the footsteps on the waste pile. For this reason, previous to the characterisation study, all waste in the WR was sent to the landfill, and the room was cleaned. In this way, it was possible to have control over the waste generated daily and to realise the waste characterisation in this site.
Each day, all material disposed of in the WR was hand-sorted according to the Mexican Standard NMX-AA-022-1985 [20]. The sorted-out waste component was placed into individual plastic containers, and at the ending of sorting it was weighed. The measurements were performed in situ with a Uline H-670 (Uline Company, Pleasant Prairie, WI, USA) portable electronic scale with a 150-kg capacity and 10-g readability. This procedure was performed for seven consecutive days.
2.3. Waste Statistical Analysis
A hypothesis test of the two proportions was conducted to identify any differences in HSW generation between the first study in 2014 (p1) and the second in 2015 (p2). Where components showed differences, a new hypothesis test was conducted to identify the year in which more waste was generated, considering the following as an alternative hypothesis: “More waste was generated in 2014 than in 2015 (Ha: p1 > p2).” Only components larger than 1% were included in the ratio test. MINITAB™ 16 statistical software with a 95% confidence interval was used for comparisons. The p-values used for the hypothesis test were obtained using the Exact Fisher test.
The p-value, confidence intervals (CIs), and Z0-value from the hypothesis test of the difference between two proportions were calculated. With the p-value, the value of the test should be inferior to the significance level selected (α = 0.05) in order to indicate a significant difference. With the CI, the authors [21,22] pointed out that: (a) if the interval intersects zero, it is possible to conclude that the data is consistent with the null hypothesis, H0: p1 = p2; (b) if both of the CIs are positive, this indicates that the first ratio is greater than the second ratio; and (c) if both of the CIs are negative, then the second ratio is greater than first one. For the Z-values, when the alternative hypothesis is p1 > p2, the critical region is z > 1.645.
2.4. Strategies for Waste Management
This part of the study involved implementing various methods of waste management in an attempt to reduce waste generation and environmental impacts. Authors [23] have highlighted that the waste stream from households should be minimised by encouraging waste sorting, recycling, and reducing waste production at the source. In this study, the waste management selection process began as soon as the waste characterisation process was completed. Among the options, recycling, vermicomposting, and landfill disposal strategies were selected. In this study, incineration was not considered as a possibility as this waste treatment is forbidden in Mexico.
Once the management strategies were defined, the feasibility of the implementation was verified. The first step was to talk to the leader of the student housing to ask for their support and to define the importance of their participation in the process. Subsequently, it was necessary to have conversations with recycling companies and pig producers in order to establish the days and conditions under which the material recovery process would be carried out.
Housing residents may be unable to discriminate between wastes that are and are not suitable for composting [23]. Therefore, a university researcher with experience in vermicomposting was contacted. He provided training and donated 1 kg of red worms (Eisenia foetida) to start the process in the courtyard of the student house. This worm is most commonly used in vermicomposting because both earthworms are peregrine and ubiquitous with a worldwide distribution, resilient, and have wide temperature tolerance [24].
Before the start of the separation activities, weekly talks were scheduled with all residents in order to heighten their awareness of the issue of solid waste management. In these meetings, they were asked to separate waste to avoid contaminating any components with a potential for use. For example, they avoided mixing meat, fish, oily foods, and bones in the organic material intended for vermicomposting. Rousta [25] found that a lack of information and knowledge may hinder the correct sorting of waste. Plastic containers with a capacity of 100 L were purchased to facilitate proper separation and to prevent people from depositing garbage on the floor for lack of them.
Parallel to the talks with students, work teams of five persons were set up for supervisory activities. These teams were trained on the characteristics of the materials for their proper separation and were informed about the requirements of recycling companies. The training and supervision process was repeated for six months because team members had to rotate to other activities within the housing. After this time, strict control was not necessary because the students were committed to the program and had knowledge of the processes.
2.5. Vermicomposting Process
The procedure for vermicomposting was as follows: Plastic containers of 18.11 × 45.08 × 62.23 cm (height/width/depth), with a 33 L storage capacity, were obtained. This size was selected due to the ease of moving them and their depth. A hole was drilled in the right corner to drain excess water. The containers were placed on wooden bases with heights of 10 and 15 cm to give them inclination and height to place a container for the leachate collection.
The bin was filled to start the process, as follows: First, a layer of garden soil was added to the bin. After, a mixture of fruit and vegetable scraps and wood chips cover the soil. A new layer of sawdust was added, and finally, the worms were added. Once the worms were buried, a water dew with a spray bottle was added to the mixture to increase the humidity.
The feeding process was next. The container was review to notice if there was a significant amount of food residuals. When this happened, the worms were not fed and the container was left for a few days and checked again. If the level was low, an estimated amount of food residual was added, attempting to avoid overfeeding. The waste mixture was prepared with a 70:30 ratio of brown matter (chip wood, sawdust) to green matter (food scraps and yard trimmings). The size reduction can increase the surface area for aeration and microbial action and, thus, the decomposition is easier for harder materials like fruit peels or wood [26]. This principle also applies to vermicomposting, for worms to eat faster. In this study, food waste was reduced into pieces 2 to 5 cm in size.
The container was divided into quadrants, and plastic laundry pins were used to mark where the last food was placed. The feeding was done clockwise, checking that all food added was buried. This procedure was used to avoid the mixture of decomposed materials and food residuals.
The containers were placed in the shadow to avoid overheating. About once a week, the content was moved to help with aeration. After the last feeding, the compost was available to harvest one month later.
2.6. Emission Factors
For the emission estimation, a term of one year and two scenarios were considered. The first scenario was all waste being sent to landfill. The second included a recycling closed loop [27] and landfill.
The CO2eq was calculated using the emission factors from DEFRA 2016 [28] for waste treatment processes. Each component is multiplied by the emission factor that corresponds to a particular waste management scenario (closed loop or landfill). The emission factors used in each component are listed in Table 5.
The CO2eq emission factors for a vermicomposting process using household wastes are not available. DEFRA Factors 2016 [28] and IPCC Factors 2016 [29] do not include a vermicomposting scenario and the studies reporting CO2eq emissions for vermicomposting are scarce. Possible explanations could lie in the way that the CO2 emissions from biomass are considered. Chan et al. [30] indicate that CO2eq is biogenic in origin and is usually not counted in the GHG emission budget, although in the process of aerobic composting the gas emitted mainly is CO2 rather than CH4. Kang et al. [31] explain that according to the Intergovernmental Panel on Climate Change Guidelines, CO2 emissions from biomass fractions should be excluded from the total of CO2 emissions when calculating CO2 emissions and should be separately reported due to their “carbon neutrality”. In this study, a value of 4.3 g CO2-eq/kg waste was used to estimate the waste vermicomposting emissions. This data was taken from Lim et al. [24] and is the sum of N2O and CH4 emissions from household waste treated with vermicomposting.
3. Results and Discussion
3.1. Limitations of the Study
Readers should be aware that there are limitations in the strict sense when comparing this study with others because of the characteristics that each presents. Comparison with home characterisation studies may be limited. This student housing is inhabited only by men, which explains why particular type of residues associated with children, teens, and women are not present. Regarding university studies, there are differences, such as the number of hours that each person stays and the activities performed at each site, the amounts and types of food consumed, and holidays, among others. Waste generation studies in universities usually do not report the waste in student housing. For example, a study in the USA reported [32] that the university does not track total amounts of waste produced from each building on campus. Thus, it was not possible to determine the proportion of solid waste that comes from student housing relative to the other campus buildings. In another study in Canada [16] due to time and financial resources, those authors excluded two student residence buildings, which, combined, represent a significant and distinct portion of the university’s waste.
3.2. Solid Waste Generation and Characterisation Study
The waste generation per capita (GPC) per day was estimated at 1.446 kg for the first study (2014) and 1.135 kg for the second (2015). The weights and percentages of each waste component are summarised in Table 2.
The waste generated in 2014 accounts for 29.6% in tin cans, paper, cardboard, rigid plastics, and transparent glass materials that are all recyclable; while 52.4% of waste (food residuals, wood, and yard trimmings) have a potential for waste treatments, such as vermicomposting or composting. These considerations leave only 18% of components to send to landfill. However, in 2014, all waste generated was sent to the landfill (42.2 tonnes in the year, approximately), because a solid waste management plan had not been implemented.
The waste stream and its composition changed in 2015, after application of the waste management strategies; the GPC was 21.5% lower than the previous year. However, the difference is in the waste diverted from landfill, in 2015 only 12.2% of waste generated was disposed (4.06 tonnes/year versus 42.1 tonnes/year the previous year (2014)). This value is similar to a GPC of 0.139 kg/day and a waste disposal reduction in the landfill of 92.2%.
3.3. Waste Statistical Analysis
No crockery component was found in the waste stream in 2015, therefore, it was not possible to make a comparison. The proportion test for transparent glass was conducted, however, due to sample sizes this could be inexact, because when p is small, the normal approximation to the distribution p’ will often not be very accurate in the extreme tails [22].
Five components: toilet paper, rigid plastics, construction material, film plastic, and transparent glass, did not show differences in generation for both years. The generation of wood, tin can, paper, cardboard, and cloth rags decreased in 2015, while food residuals increased (see Table 3).
The increase in the food waste proportion may be a consequence of the inhabitants thinking that they are benefitting from the waste through vermicomposting, and as food for pigs, it is not necessary to make an effort to try to reduce them. Therefore, the next strategy for decreasing waste would study the patterns of consumption. This objective is an important aspect, considering that reducing food losses and food waste is attracting public attention at the international, regional, and national levels, and a number collaborative initiatives are working to tackle the challenge [33].
3.4. Strategies for Waste Management
In total, 87% of the waste stream was diverted from landfill through vermicomposting and recycling. This value is slightly higher than the 70% reported by Smyth et al. [16]. Differences could be due to the food residuals proportion in this study, which is higher, was sorted adequately and can be recovered to be used as pig food. In a New Zealand university, Mason et al. [34] found that as staff became aware of, and familiar with, the source separation system, the level of food separation improved. In Sweden [25] it was found that an efficient source separation scheme could increase both the rate of recycling of recyclable materials and biological treatment of food waste.
For 2015, all food waste was diverted from the landfill stream (see Table 4). The percentage used for vermicomposting was 2.83%, a value lower than the 6% that is diverted for recycling in Japan [35]. In this study, the size of the infrastructure for vermicomposting limited the quantity that could be diverted. Available space for the containers, economic constraints, the number of persons available, and their work rotation restricted the facility´s growth. Despite the fact that work rotation was a problem for waste treatment in this study, authors [36] consider it as a positive aspect because the person´s rotation creates knowledge multipliers, specifically, who will act to promote environmental awareness.
In Mexico, the materials recovered to be commercialised afterwards represent 8–12% out of the total generated [37]. In India 6–10% of MSW are recyclables [7], in a Canadian university this value reached 49.3% [16], and in Taiwan, 44.92% [26]. In this study, the value was 16%. The difference could be explained by the components included in the recyclable´s classification.
The container installation changed the behaviour of students in the WR. When the second study was carried out, all waste was in covered containers, not on the floor. There were no leachates on the floor, and all the solid waste was inside plastic bags. Due to time restrictions, it was not possible carry out a study to learn the impact on the students and the reasons for the change in their conduct. However, it was observed that young people who live in these university residences usually come from marginalised communities in states with significant educational inequalities, such as Chiapas, Oaxaca, Guerrero in Southern Mexico, and Michoacan. Oaxaca State, for instance, has 570 municipalities and 417 are governed by indigenous customs and usages. In these regions, the culture of recycling and proper management of solid waste is limited; Oaxaca implemented the first landfill sites in 2012 [38]. It is not uncommon for these students to struggle with the Spanish language proficiency required for higher education. Moreover, at the university they do not receive environmental education, except in some courses; thus, the implementation of a program of solid waste management, including its acceptance and continuity, involved a challenge for the researchers. The factors that favoured the students’ appropriation were the inclusion of the young students in the program, allowing them to contribute ideas and tasks; the acceptance of the leaders of the residences that they would eventually see the results of their efforts in economic savings; and those with a higher level of organization, based on a hierarchical structure.
3.5. Emission Factors
The emissions in 2014 were estimated at 12,624 kg CO2eq (0.43 kg/capita/day) and 761 kg CO2eq for 2015 (0.03 kg/capita/day). In one year, after the waste management implementation, CO2eq emission was reduced by 93.94% (see Table 5). This reduction does not include the CO2 emission of food waste diverted for pig food and its transport to the farm.
The food residuals proportion was greater in 2015 that 2014. However, the CO2eq emissions in 2015 were 99.93% less than 2014 because 95.92% (22.1 tonnes) was diverted as pig food and was not included in the estimation. The percentage of the waste diverted is high compared to 71.46% in Taiwan [26], due to the vermicomposting infrastructure in the student housing and the pig farms near to the student residence.
The potential reduction in CO2e emissions that would no longer be released into the atmosphere is approximately 11.86 ton CO2e during the 2015. This volume has a total value of USD $130 year−1 in the carbon market, considering an average cost of USD $11.00 CO2e ton−1 [39].
4. Conclusions
Appropriate solid waste management was revealed to have a fundamental role in cutting indirect CO2eq emissions. The recovery of waste reduced the amount of waste sent to landfill. Implementing a waste recovery strategy as a business plan can give an extra boost. However, it is important to recognise that the secondary materials market has variations and that the gains may vary over time.
The process to construct a tailor-made plan is complicated as several variables should be taken into consideration, such as the will to participate, the enforcement of the waste management plans from the residence board, solid waste generation, and processes to recover waste components, among others. This process requires leadership and perseverance to prevent the plan from failing once the maturation phase begins. The site authority’s support is indispensable.
This study demonstrates that there is a possibility of improving environmental performance in student housing. The effects will be bigger if these practices are applied to the others 34 residences and the rest of the university. Recommendations for decision makers at the university include:
- The implementation of annual solid waste characterisation at student residences.
- The inclusion of waste programs in the operating rules of student residences.
- To encourage the association between solid waste research academics and the student leadership operating at these residences.
- To promote seminars at student residences to promote the waste management program, as student enrolment will naturally end with student graduation periods.
Acknowledgments
The funds for covering the publishing in open access of this publication was given by the Facultad de Ciencias Químicas e Ingeniería, UABC. The technical assistance of Bulmaro Arriaga Gutierrez for data collection is fully appreciated. Additionally, all comments during the peer review process revision are deeply appreciated.
Author Contributions
Eduardo Baltierra-Trejo and Liliana Marquez-Benavides conceived, designed, and conducted the household solid waste studies; Liliana Marquez-Benavides applied the waste management; Liliana Marquez-Benavides, Paul Taboada-González, and Quetzalli Aguilar-Virgen analysed the data; and Quetzalli Aguilar-Virgen and Paul Taboada- González wrote the paper.
Conflicts of Interest
The authors declare no conflict of interest.
References
- Khan, D.; Kumar, A.; Samadder, S.R. Impact of socioeconomic status on municipal solid waste generation rate. Waste Manag. 2016, 49, 15–25. [Google Scholar] [CrossRef] [PubMed]
- Chen, X.; Pang, J.; Zhang, Z.; Li, H. Sustainability Assessment of Solid Waste Management in China: A Decoupling and Decomposition Analysis. Sustainability 2014, 6, 9268–9281. [Google Scholar] [CrossRef]
- Gu, B.; Wang, H.; Chen, Z.; Jiang, S.; Zhu, W.; Liu, M.; Chen, Y.; Wu, Y.; He, S.; Cheng, R.; et al. Characterization, quantification and management of household solid waste: A case study in China. Resour. Conserv. Recycl. 2015, 98, 67–75. [Google Scholar] [CrossRef]
- Suthar, S.; Singh, P. Household solid waste generation and composition in different family size and socio-economic groups: A case study. Sustain. Cities Soc. 2015, 14, 56–63. [Google Scholar] [CrossRef]
- Gallardo, A.; Edo-Alcón, N.; Carlos, M.; Renau, M. The determination of waste generation and composition as an essential tool to improve the waste management plan of a university. Waste Manag. 2016, 53, 3–11. [Google Scholar] [CrossRef] [PubMed]
- Aguilar-Virgen, Q.; Taboada-González, P.; Ojeda-Benítez, S. Seasonal analysis of the generation and composition of solid waste: Potential use—A case study. Environ. Monit. Assess. 2013, 185, 4633–4645. [Google Scholar] [CrossRef] [PubMed]
- Bhawal Mukherji, S.; Sekiyama, M.; Mino, T.; Chaturvedi, B. Resident Knowledge and Willingness to Engage in Waste Management in Delhi, India. Sustainability 2016, 8, 1065. [Google Scholar] [CrossRef]
- Barton, J.R.; Issaias, I.; Stentiford, E.I. Carbon—Making the right choice for waste management in developing countries. Waste Manag. 2008, 28, 690–698. [Google Scholar] [CrossRef] [PubMed]
- Zheng, P.; Zhang, K.; Zhang, S.; Wang, R.; Wang, H. The door-to-door recycling scheme of household solid wastes in urban areas: A case study from Nagoya, Japan. J. Clean. Prod. 2016. [Google Scholar] [CrossRef]
- Ruiz Morales, M. Caracterización de residuos sólidos en la Universidad Iberoamericana, Ciudad de México. Rev. Int. Contam. Ambient. 2012, 28, 93–97. [Google Scholar]
- Armijo de Vega, C.; Ojeda Benítez, S.; Ramírez Barreto, M.E. Solid waste characterization and recycling potential for a university campus. Waste Manag. 2008, 28, S21–S26. [Google Scholar] [CrossRef] [PubMed]
- Rada, E.C.; Bresciani, C.; Girelli, E.; Ragazzi, M.; Schiavon, M.; Torretta, V. Analysis and Measures to Improve Waste Management in Schools. Sustainability 2016, 8, 840. [Google Scholar] [CrossRef]
- Strasburg, V.J.; Jahno, V.D. Application of eco-efficiency in the assessment of raw materials consumed by university restaurants in Brazil: A case study. J. Clean. Prod. 2017, 161, 178–187. [Google Scholar] [CrossRef]
- Hernández, A. Mantener las casas del estudiante le cuesta 120 mdp a la UMSNH. MiMorelia, 2017. Available online: http://www.mimorelia.com/mantener-las-casas-del-estudiante-le-cuesta-120-mdp-a-la-umsnh/ (accessed on 12 July 2017). (In Spanish).
- Lukman, R.; Tiwary, A.; Azapagic, A. Towards greening a university campus: The case of the University of Maribor, Slovenia. Resour. Conserv. Recycl. 2009, 53, 639–644. [Google Scholar] [CrossRef]
- Smyth, D.P.; Fredeen, A.L.; Booth, A.L. Reducing solid waste in higher education: The first step towards ‘greening’ a university campus. Resour. Conserv. Recycl. 2010, 54, 1007–1016. [Google Scholar] [CrossRef]
- Chadwick, D.; Sommer, S.; Thorman, R.; Fangueiro, D.; Cardenas, L.; Amon, B.; Misselbrook, T. Manure management: Implications for greenhouse gas emissions. Anim. Feed Sci. Technol. 2011, 166, 514–531. [Google Scholar] [CrossRef]
- Mor, S.; Ravindra, K.; De Visscher, A.; Dahiya, R.P.; Chandra, A. Municipal solid waste characterization and its assessment for potential methane generation: A case study. Sci. Total Environ. 2006, 371, 1–10. [Google Scholar] [CrossRef] [PubMed]
- Bogner, J.; Pipatti, R.; Hashimoto, S.; Diaz, C.; Mareckova, K.; Diaz, L.; Kjeldsen, P.; Monni, S.; Faaij, A.; Gao, Q.; et al. Intergovernmental Panel on Climate Change (IPCC) Working Group III (Mitigation) Mitigation of global greenhouse gas emissions from waste: Conclusions and strategies from the Intergovernmental Panel on Climate Change (IPCC) Fourth Assessment Report. Working Group III (Mitigation). Waste Manag. Res. J. Int. Solid Wastes Public Clean. Assoc. ISWA 2008, 26, 11–32. [Google Scholar] [CrossRef]
- Selección y Cuantificación de Subproductos. Available online: http://biblioteca.semarnat.gob.mx/janium/Documentos/Ciga/agenda/DOFsr/NMX-AA-022-1985.pdf (accessed on 12 July 2017). (In Spanish).
- Walpole, R.E.; Myers, R.H.; Myers, S.L.; Ye, K.E. Probability and Statistics for Engineers and Scientists, 9th ed.; Pearson: Boston, MA, USA, 2012; ISBN 978-0-321-62911-1. [Google Scholar]
- Devore, J.L. Probability and Statistics for Engineering and the Sciences, 8th ed.; Cengage Learning: Boston, MA, USA, 2011; ISBN 978-0-538-73352-6. [Google Scholar]
- Neugebauer, M.; Sołowiej, P. The use of green waste to overcome the difficulty in small-scale composting of organic household waste. J. Clean. Prod. 2017, 156, 865–875. [Google Scholar] [CrossRef]
- Lim, S.L.; Lee, L.H.; Wu, T.Y. Sustainability of using composting and vermicomposting technologies for organic solid waste biotransformation: Recent overview, greenhouse gases emissions and economic analysis. J. Clean. Prod. 2016, 111, 262–278. [Google Scholar] [CrossRef]
- Rousta, K.; Bolton, K.; Dahlén, L. A Procedure to Transform Recycling Behavior for Source Separation of Household Waste. Recycling 2016, 1, 147–165. [Google Scholar] [CrossRef]
- Chen, Y.-T. A Cost Analysis of Food Waste Composting in Taiwan. Sustainability 2016, 8, 1210. [Google Scholar] [CrossRef]
- Green, J.A.S. Aluminum Recycling and Processing for Energy Conservation and Sustainability, 1st ed.; ASM International: Geauga, OH, USA, 2007; ISBN 978-1-61503-057-6. [Google Scholar]
- DEFRA (Department for Environment, Food and Rural Affairs) Greenhouse Gas Reporting—Conversion Factors 2016. Available online: https://www.gov.uk/government/publications/greenhouse-gas-reporting-conversion-factors-2016 (accessed on 29 June 2017).
- IPCC (The Intergovernmental Panel on Climate Change) EFDB—Main Page. Available online: http://www.ipcc-nggip.iges.or.jp/EFDB/main.php (accessed on 7 July 2017).
- Chan, Y.C.; Sinha, R.K.; Wang, W. Emission of greenhouse gases from home aerobic composting, anaerobic digestion and vermicomposting of household wastes in Brisbane (Australia). Waste Manag. Res. 2011, 29, 540–548. [Google Scholar] [CrossRef] [PubMed]
- Kang, S.; Kim, S.; Lee, J.; Jeon, Y.; Kim, K.-H.; Jeon, E. A Study on Applying Biomass Fraction for Greenhouse Gases Emission Estimation of a Sewage Sludge Incinerator in Korea: A Case Study. Sustainability 2017, 9, 557. [Google Scholar] [CrossRef]
- Goldberg, K.; Smith, C.; Baxter, C. Characterization of Solid Waste and the Potential to Reduce Solid Waste through Implementation of a Composting Program at the University of Wisconsin-Platteville; University of Wisconsin-Platteville: Platteville, WI, USA, 2009. [Google Scholar]
- Liu, C.; Hotta, Y.; Santo, A.; Hengesbaugh, M.; Watabe, A.; Totoki, Y.; Allen, D.; Bengtsson, M. Food waste in Japan: Trends, current practices and key challenges. J. Clean. Prod. 2016, 133, 557–564. [Google Scholar] [CrossRef]
- Mason, I.G.; Oberender, A.; Brooking, A.K. Source separation and potential re-use of resource residuals at a university campus. Resour. Conserv. Recycl. 2004, 40, 155–172. [Google Scholar] [CrossRef]
- Wei, Y.; Li, J.; Shi, D.; Liu, G.; Zhao, Y.; Shimaoka, T. Environmental challenges impeding the composting of biodegradable municipal solid waste: A critical review. Resour. Conserv. Recycl. 2017, 122, 51–65. [Google Scholar] [CrossRef]
- Fagnani, E.; Guimarães, J.R. Waste management plan for higher education institutions in developing countries: The Continuous Improvement Cycle model. J. Clean. Prod. 2017, 147, 108–118. [Google Scholar] [CrossRef]
- Taboada-González, P.; Armijo-de-Vega, C.; Aguilar-Virgen, Q.; Ojeda-Benítez, S. Household Solid Waste Characteristics and Management in Rural Communities. Open Waste Manag. J. 2010, 3, 167–173. [Google Scholar] [CrossRef]
- SENR (Secretariat of Environment and Natural Resources) Residuos Sólidos Urbanos. Available online: http://apps1.semarnat.gob.mx/dgeia/informe_resumen14/07_residuos/7_1_2.html (accessed on 3 July 2017).
- Aguilar-Virgen, Q.; Taboada-González, P.; Ojeda-Benítez, S. Analysis of the feasibility of the recovery of landfill gas: A case study of Mexico. J. Clean. Prod. 2014, 79, 53–60. [Google Scholar] [CrossRef]
Figure 1.
Methodology employed in the study.

Table 1.
Waste components considered in the study.
| Cotton | Non-Ferrous Material |
|---|---|
| Aluminium | Paper |
| Batteries | Disposable nappies |
| Cardboard | PET plastic |
| Leather | Rigid and film plastics |
| Waxed cardboard packaging | Polyurethane |
| Hard vegetable fibber (sclerenchyma) | Expanded polystyrene |
| Synthetic fibres | Food residuals |
| Bone | Yard trimmings |
| Rubber | Fine residue |
| Tin can | Toilet paper |
| Crockery and ceramics | Tetra Pak™ packaging |
| Wood | Cloth rags |
| Construction material | Coloured glass |
| Ferrous material | Transparent glass |
Source: adapted from [20].
Table 2.
Composition of analysed waste.
| Waste Components | 2014 | 2015 | ||
|---|---|---|---|---|
| kg | % | kg | % | |
| Food residuals | 312.4 | 38.6 | 443 | 69.7 |
| Wood | 111.7 | 13.8 | 10.1 | 1.6 |
| Tin can | 89.7 | 11.1 | 34.2 | 5.4 |
| Paper (notebook sheets, magazines, newspaper) | 61.6 | 7.6 | 24.6 | 3.9 |
| Cardboard | 58.0 | 7.2 | 28.6 | 4.5 |
| Cloth rags | 38.6 | 4.8 | 6.6 | 1.0 |
| Toilet paper | 25.7 | 3.2 | 18.2 | 2.9 |
| Rigid plastics | 20.4 | 2.5 | 12.8 | 2.0 |
| Crockery and ceramics | 14.1 | 1.7 | 0.0 | 0.0 |
| Construction material | 11.5 | 1.4 | 7.7 | 1.2 |
| Film plastics | 10.3 | 1.3 | 7.0 | 1.1 |
| Transparent glass | 9.8 | 1.2 | 4.3 | 0.7 |
| Others * | 45.8 | 5.7 | 38.4 | 6.0 |
| Total-week | 809.6 | 100 | 635.5 | 100 |
| Generation rate (kg/person-day) | 1.4 | 1.1 ** | ||
* Categories with less than 1% include: electronic waste, leather, hard plastics, synthetic fibres, Styrofoam, waxed cardboard containers, stained glass, metalized plastic bags, polyurethane, rubber, non-ferrous materials, hazardous waste, hard vegetable fibre, infectious biological waste, cotton and fine residue, bones, ferrous materials, disposable nappies, yard trimmings and latex; ** The value after the implementation of management system.
Table 3.
p-Values and CIs of the waste components.
| Waste Components | Ha: p1 ≠ p2 | Ha: p1 > p2 | ||
|---|---|---|---|---|
| p-Value | CI | p-Value | Z0 | |
| Food residuals | 0.000 | (−0.360, −0.262) | 1.000 | −12.46 |
| Wood | 0.000 | (0.096, 0.148) | 0.000 | 9.36 |
| Tin can | 0.000 | (0.029, 0.085) | 0.000 | 4.06 |
| Paper (notebook sheets, magazines, newspaper) | 0.002 | (0.013, 0.060) | 0.001 | 3.07 |
| Cardboard | 0.034 | (0.001, 0.050) | 0.017 | 2.12 |
| Cloth rags | 0.000 | (0.020, 0.053) | 0.000 | 4.33 |
| Toilet paper | 0.674 | (−0.013, 0.021) | ----- | ----- |
| Rigid plastics | 0.587 | (−0.011, 0.019) | ----- | ----- |
| Construction material | 0.715 | (−0.009, 0.014) | ----- | ----- |
| Film plastics | 0.813 | (−0.009, 0.012) | ----- | ----- |
| Transparent glass | 0.225 | (−0.003, 0.015) | ----- | ----- |
Table 4.
Destination of waste components in 2015.
| Waste Component | Destination | kg/Week | % |
|---|---|---|---|
| Tin cans, cardboard, ferrous material, glass, no ferrous material (cooper, aluminium), rigid plastics, PET, paper (notebook sheets, magazines, newspaper). | Recycling centre | 104.5 | 16.4 |
| Food residuals, wood, yard trimming | Vermicomposting | 18.0 | 2.83 |
| Food residuals | Pig food | 435.1 | 68.5 |
| Toilet paper, crockery and ceramics, construction material, film plastic and others | Landfill | 77.9 | 12.3 |
| Total | 635.5 | 100 | |
Table 5.
Annual CO2eq emissions before/after implementation of different waste management strategies.
Table 5.
Annual CO2eq emissions before/after implementation of different waste management strategies.
| Component | Generation Rate ton year−1 | * Emission Factor kg CO2eq ton−1 | Contribution kg CO2eq year−1 | |||
|---|---|---|---|---|---|---|
| 2014 | 2015 | 2014 | 2015 | 2014 | 2015 | |
| Food residuals | 16.24 | 0.94 | c 332.00 | b 4.30 | 5393.27 | 4.04 |
| Wood | 5.81 | 0.53 | c 627.00 | b 21.00 | 3641.87 | 11.03 |
| Tin can | 4.66 | 1.78 | c 21.31 | a 21.00 | 99.38 | 37.35 |
| Paper and Cardboard | 6.22 | 2.77 | c 314.00 | a 21.00 | 1952.83 | 58.09 |
| Cloth rags | 2.01 | 0.34 | c 373.00 | c 373.00 | 748.69 | 128.01 |
| Toilet paper | 1.34 | 0.95 | c 314.00 | c 314.00 | 419.63 | 297.17 |
| Rigid plastics | 1.06 | 0.67 | c 34.08 | b 21.00 | 36.15 | 13.98 |
| Film plastics | 0.54 | 0.36 | c 34.08 | c 34.08 | 18.25 | 12.41 |
| Transparent glass | 0.51 | 0.22 | c 25.78 | a 21.00 | 13.14 | 4.70 |
| Others | 3.71 | 2.40 | c 81.00 | c 81.00 | 300.74 | 194.40 |
| Total kg CO2eq | 12,623.9 | 761.2 | ||||
Waste treatment option: a recycling closed loop; b vermicomposting; c landfilling. * DEFRA [28].
© 2017 by the authors. Licensee MDPI, Basel, Switzerland. This article is an open access article distributed under the terms and conditions of the Creative Commons Attribution (CC BY) license (http://creativecommons.org/licenses/by/4.0/).
Share and Cite
MDPI and ACS Style
Aguilar-Virgen, Q.; Taboada-González, P.; Baltierra-Trejo, E.; Marquez-Benavides, L. Cutting GHG Emissions at Student Housing in Central Mexico through Solid Waste Management. Sustainability 2017, 9, 1415. https://doi.org/10.3390/su9081415
AMA Style
Aguilar-Virgen Q, Taboada-González P, Baltierra-Trejo E, Marquez-Benavides L. Cutting GHG Emissions at Student Housing in Central Mexico through Solid Waste Management. Sustainability. 2017; 9(8):1415. https://doi.org/10.3390/su9081415
Chicago/Turabian StyleAguilar-Virgen, Quetzalli, Paul Taboada-González, Eduardo Baltierra-Trejo, and Liliana Marquez-Benavides. 2017. "Cutting GHG Emissions at Student Housing in Central Mexico through Solid Waste Management" Sustainability 9, no. 8: 1415. https://doi.org/10.3390/su9081415
Note that from the first issue of 2016, this journal uses article numbers instead of page numbers. See further details here.