Benchmarking the Performance of Solar Installers and Rooftop Photovoltaic Installations in California

1
Business School, China University of Political Science and Law, Beijing 100088, China
2
Desautels Faculty of Management, McGill University, Montreal, QC H3A 1G5, Canada
Sustainability 2017, 9(8), 1403; https://doi.org/10.3390/su9081403
Submission received: 20 June 2017
/
Revised: 1 August 2017
/
Accepted: 5 August 2017
/
Published: 9 August 2017
(This article belongs to the Section Energy Sustainability)
Abstract
:Rooftop photovoltaic (PV) systems are rapidly proliferating around the world. Whether the PV systems have been efficiently installed is an issue of utmost importance for both solar installers and policymakers. However, the impact of solar installers on PV performance is not well understood. In this paper, we investigate the performance of rooftop PV installations and the solar installers using a dataset of 1035 projects developed by 213 installers in California. Based on data envelopment analysis (DEA), our study takes the PV system capacity, electricity generation, cost, modules, solar irradiance, and ambient temperature into account simultaneously to construct a unified measure for the efficiency of PV installations. We analyze the relationship between installer characteristics and PV system performance. We find PV installations with the installer also being the module manufacturer, exhibit significantly better performance than other installations. PV installations by subsidiaries of oil firms have inferior performance. PV installations by large installers on average do not perform better than the installations by small installers. Geographic diversification of an installer’s operations is significantly and inversely related to the performance of installations. We demonstrate the aforementioned findings have significant implications for policymakers and the solar installation industry.
1. Introduction
In recent years, solar energy from rooftop photovoltaic (PV) systems has seen a rapid growth in United States (US), thanks to decreasing installation costs, improved module efficiencies, innovative business models, and favorable policy support [1,2,3]. A great amount of research has studied various aspects of rooftop solar PV installations, including but not limited to their design, siting, potential, environmental benefit, and performance [4,5,6]. However, the solar installers, a pivotal driving force behind the proliferation of rooftop PV systems [7], have received relatively little attention. Have they done a proper job in installing the rooftop systems? Which installers have the best practice in installation? What are the opportunities to improve the performance of PV installers? These issues are of particular importance for the solar installation industry and policymakers to better pave the road ahead for solar energy [4]. In this paper, we aim to shed some light on these issues. Specifically, we benchmark the performance of PV installations and analyze the link between installation performance and installer characteristics.
Solar capacity build-up and electricity generation are the two immediate outcomes of PV installation. Both are widely-used measures to assess PV system performance by solar installers and policymakers. For a solar installer, its installed capacity is an important indicator of its customer base and competitiveness in the market. For policymakers, capacity is used to design renewable energy quota policies and solar incentive policies in many regions such as mainland China, Hong Kong, and California [8,9,10]. The electricity generation is the total amount of electricity generated by the system in reality. Real-time electricity generation is a complex physical process and hinges on a number of factors. Some are environmental factors exogenous to the installers [11], including but not limited to the solar irradiance, the ambient temperature, the humidity, and the wind speed [12,13,14]. The other factors pertain to the installation process, such as choice of module technology, mounting rack, and orientation of the system [15,16,17]. In this paper, we would like to employ an approach to assess the PV installation performance based on environmental factors, capacity, and electricity generation simultaneously. To this end, our empirical strategy draws on data envelopment analysis (DEA). DEA is a non-parametric mathematical programming approach that is particularly tailored for the evaluation of multi-input multi-output processes. In recent years, DEA has been demonstrated as a powerful tool to evaluate the performance of electricity generation facilities, such as hydro power plants, thermal power plants, and wind farms [18,19,20,21]. However, its application to solar PV systems is still a nascent research topic [22,23,24]. In this study, we incorporate the major determinants of PV installation into consideration and map the PV installation as a multi-input multi-output process as in literature [23]. The model allows us to go beyond the conventional output-to-input ratio analysis which typically employs a single output such as capacity and a single input such as cost. Existing DEA study has examined the performance of solar installations and found diverse efficiencies among the systems [23]. However, it is unclear what causes the divergence in performance. This paper analyzes the determinant factors of PV system performance through the installer perspective. Specifically, this paper focuses on analyzing the relationship between installer characteristics and PV system performance.
Among all the states in US, California leads in both installed solar capacity and solar generation. At the end of November 2015, the state had a total solar electricity generating capacity of 9976 MW, of which 87% was from solar PV and the remaining 13% was from solar thermal [25]. In 2014, California also became the first state that generated more than 5% of annual utility-scale electricity from utility-scale solar power [26]. The rapid development of solar energy in California has been supported by various policy instruments [27]. The most important policies include renewable portfolio standards [28], tax credits [29], cash incentives [30], and net energy metering [31]. These policies target at various entities in the solar value chain. At the same time, the development of solar PV energy has fostered a blooming solar installation industry in California [7].
In this study, we apply the DEA method to evaluate a dataset of 1035 rooftop PV systems mounted by 213 installers in California. The data is obtained from the California Solar Initiative (CSI), the most prominent solar incentive program in the state [32]. We find very diverse performance of the PV systems installed by different installers. Throughout the paper, we refer to systems installed in the vertically integrated manner (e.g., installer is also the manufacturer of the modules) as vertically integrated systems. We refer to all other systems as independent systems. Please note independent systems include systems mounted by vertically integrated installers with modules from a separate manufacturer. We find that vertically integrated PV systems on average are significantly more efficient than independent systems. This finding provides supportive arguments for vertical integration of the solar installation industry. We find that the size of a PV installer, defined as the number of installations accomplished, does not necessarily translate into better performance of PV installations. Instead, some of the largest installers in the market have a performance level far below the industry average. Furthermore, the geographic diversification of a PV installer’s operations is significantly and negatively associated with the installer’s installation performance. Also, PV systems installed by subsidiaries of oil companies such as BP and Chevron are very inefficient, which might relate to their withdrawal from the solar business. We discuss the reasons behind our empirical findings in detail and elaborate on the implications for policymakers.
The remainder of the paper is structured as follows. Section 2 describes the solar installation industry in California. Section 3 illustrates the empirical methods. Section 4 describes the data sample. Section 5 summarizes the results. Section 6 concludes with further discussions and policy implications.
2. Solar Installation Industry in California
The solar installation industry is at the downstream of the solar energy value chain, and bridges the module manufacturers and the end customers. A typical installer’s service includes the following components: system design, site condition, system installation, interconnection to the power grid, system activation and test, and finally, routine maintenance. Other than these basic functions, installers may also integrate other functions such as financing as part of the service [7].
To obtain a better look into the installation industry, we extract and compile data from the CSI working dataset [33]. The CSI is the most salient solar incentive program in the state and is administered by the California Public Utilities Commission (CPUC). The CSI collects and maintains the most comprehensive and detailed database on solar energy deployment in the state. As of January 2016, the database reports data on 173,690 systems with a total capacity of 2600 MW. Table 1 documents preliminary analysis of the installers. We can identify 2965 installers from the database. For the ease of presentation, we classify installers into five bins, from small installers with no more than 5 systems to giant installers with more than 5000 systems. The results indicate that most of the installers are small, private companies or organizations serving the local area. In the dataset, 1849 installers, representing 62.36% of the installers in the whole industry, have mounted no more than 5 systems. Collectively, these 1849 installers have developed a total of 3568 systems, which account for only 2.05% of all the installations and 4.29% of total capacity in the dataset. In contrast, the five biggest installers in terms of number of systems developed have done 56,730 installations, accounting for almost one third of total installations and 17.98% of the total capacity. The ratio between percentage of capacity and percentage of installations is less than one for the largest installers, meaning that the capacity per installation by the largest installers is below the industry average. Therefore, if the largest installers have better performance than smaller installers, their outperformance is not likely to be caused by the economy of scale in developing a single PV project. We also observe sharp contrast in geographical distribution of operations. The smallest installers on average have business in 1.25 counties and 1.64 ZIP code areas, while the biggest installers on average have business spread over 39.60 counties and 712.80 ZIP code areas. In sum, Table 1 indicates that the installers are very diverse in terms of business scale and geographical outreach of operations.
3. Methods
3.1. Model Formulation
As pointed out in Section 1, from the installers’ and policymakers’ perspective, capacity and electricity generation are the two most prominent outcomes of PV installation, which depend on system cost and environmental conditions. Therefore, a desirable performance assessment method should be able to integrate relevant factors such as capacity, electricity generation, cost, and environmental conditions under a unified framework. DEA offers an adequate approach for this purpose. DEA is a non-parametric mathematical programming approach that can benchmark the performance of a group of production units or decision making units (DMUs) in transforming multiple inputs into multiple outputs [34]. Using the inputs and outputs of the units, DEA constructs an efficiency frontier by fitting piecewise linear segments to enclose all the units under consideration. For each unit, DEA computes a score to capture the unit’s efficiency relative to the frontier.
The basic principle of the DEA method is depicted in Figure 1. In the figure, the two axes correspond to the ratios between two different inputs and a single output. The points {A,B,C,D,E,F} are the DMUs under study with F being the DMU to be evaluated. The lower the input-to-output ratio, the more efficient a unit is. The efficient frontier is constructed by fitting linear segments to tightly encompass all DMUs and thus corresponds to the piecewise linear curve A-B-C-D-E. To attain the status of efficiency, the inefficient DMU {F} needs to decrease the ratios between the two inputs and the output. Specifically, DMU {F} can reduce the two input-to-output ratios proportionally along the radial direction on the line OF. We assume OF passes through the frontier at a hypothetical point {G}. The efficiency of {F} is then defined as the ratio of two distances, i.e., OG/OF. The DEA model generalizes the principle of Figure 1 to higher dimensions where a DMU operates on multiple inputs and generates multiple outputs.
To evaluate the performance of PV installations with DEA, it is important to distinguish controllable or discretionary inputs and non-controllable or non-discretionary inputs. In an input-oriented DEA model, the efficiency is improved by producing a given level of outputs using a reduced amount of inputs. In the standard DEA model, all inputs are allowed to be reduced, which is clearly not the case in PV installation. Obviously, environmental factors such as solar irradiance and ambient air temperature are exogenous to the installation process and cannot be adjusted by the installer. To incorporate the non-discretionary inputs, we use the DEA model developed in [35].
We use the following notations to represent the model. We let denote the index of the PV system for ; denotes the system under evaluation; denotes the efficiency score for system ; is the vector of weights for the units; denotes the vector of m discretionary inputs for system ; denotes the vector of non-discretionary inputs for system ; denotes the vector of outputs for system . The model is specified as follows.
The above model allows variable returns to scale (VRS) and hence is labeled as the VRS DEA model. We note that many alternative DEA models have been proposed, but model (1) is one of the most widely-used due to its straightforward conceptual interpretations [23]. For robustness check we have implemented the two other DEA models, constant returns to scale DEA and DEA with strong complementary slackness conditions. Our main results on installer performance remain unchanged under these two models. For the ease of exposition, we use the VRS model to illustrate our findings. Next, we motivate the selection of variables for model (1).
3.2. Variable Selection
The construction of output and input variables is a critical first step in DEA. The development of PV systems and electricity generation of a PV module are complex processes, the performance of which depends on many factors. An all-inclusive model would simply be impossible. In this study we introduce two non-discretionary inputs, two discretionary inputs, and two outputs to capture the most salient features of solar installation performance, as the variables in [23].
We employ the following two variables for the non-discretionary inputs in model (1):
- Solar irradiance: Solar irradiance is the most important factor in PV electricity generation. In this study, we use the global horizontal irradiance (GHI), measured in kW/m2/day. Note that GHI is different from the actual irradiance on the PV panel. This is because the actual irradiance depends on tilt and azimuth, both of which are endogenous to the installation process. To benchmark the performance of solar PV installations, we need a variable to capture the exogenous solar resource available at the installation site. The GHI serves the purpose well.
- Ambient air temperature: This is the ambient air temperature measured in °C at the site where the PV system is installed. We include temperature because the electricity generation of PV systems is related to the solar cell’s temperature, which depends on the ambient air temperature [11]. Because the PV cell energy conversion efficiency decreases in temperature [12], ambient temperature can be regarded an undesirable input and we employ the inverse of it in computing model (1). Using the inverse of an undesirable input is a common technique in DEA [36].
We construct the following two variables for discretionary inputs in model (1):
- Modules: This is the total number of PV modules used in the project. The module quantity can affect capacity, electricity generation, and the amount of labor work required for installation. Module size can be standardized. We note that number of modules is also used as input in [22].
- Total cost of the system: According to the CSI guidelines, the total cost refers to the “eligible portion of solar power project”. It is measured in thousand dollars and usually includes the module, inverter, labor, and overhead costs. Note that important features like quality and technology of the system can be regarded as embedded in cost. According to the CSI Handbook ([37], p. 49), other cost components such as warranty/maintenance/cost of capital may also be included in reported cost. We would like to point out that the variation in cost reporting methods can affect the results. However, CSI does not provide detailed cost structure for the systems, so we are unable to eliminate the potential impact of cost reporting methods on results.
We construct the following two variables for the outputs in model (1):
- Capacity: We use the CSI rating as capacity of the system, measured in kW. The CSI rating is measured upon 1000 W/m2 solar irradiance, 20 °C ambient temperature and 1 m/s wind speed. It also factors in inefficiency of inverter and design factors (e.g., shading, mounting, orientation). Compared to the nameplate capacity used by manufacturers, the CSI rating is closer to the real-world production. The CPUC, as the administrator of the CSI program, uses CSI rating to manage program goals. The CSI rating is on average 85% of the nameplate capacity for the systems in sample. To be consistent with the policymakers and better represent the real output, we use the CSI rating as capacity in this study.
- Electricity generation: This is the total electricity generated by the PV system measured in MWh for a designated time period.
In computation, we further adjust for inflation for system costs by converting the costs of installations at different times to January 2013 dollar value, using the monthly consumer price index (CPI) for all urban consumers in the West area from the US Bureau of Labor Statistics [38].
The model is based on the reasoning that under exogenous environmental conditions a best performer should be able to minimize installation cost and module use to attain specific capacity addition and electricity generation. We are fully aware that other factors, such as dust on the panel and humidity, can impact PV performance. But because data on these factors are scarce and their effects are rather secondary compared to the aforementioned key variables, we have left them out of the analysis.
4. Data
We collect data of rooftop PV systems from two CSI datasets, the CSI working dataset and the CSI measured production dataset [33]. The working dataset reports characteristics of all solar PV installations that have been approved for grid connection within the territories of the three investor-owned utilities (e.g., Pacific Gas and Electric, San Diego Gas and Electric, and Southern California Edison). For each solar installation, we can observe the location (city, county, and ZIP code), the capacity, the application date, the installer name, the model and manufacturer of the PV modules, and the quantity of the modules. For a subset of PV installations in the working dataset, CSI reports the monthly production data in the measured production dataset. Under the CSI rules, incentives for large systems are based on actual performance. Therefore, electricity generation of eligible systems is metered and reported on a monthly basis to CSI. By January 2016, a total of 157,802 system-month observations have been entered into the production dataset. For the purpose of our study, we extract the total cost and monthly production of the PV systems from the production dataset. To protect the privacy of the system owner, the name and address of the owner have been removed from the dataset by CSI. But the working data and production data can be matched through the CSI application number of the system. We have attached the matched CSI data as supplementary material.
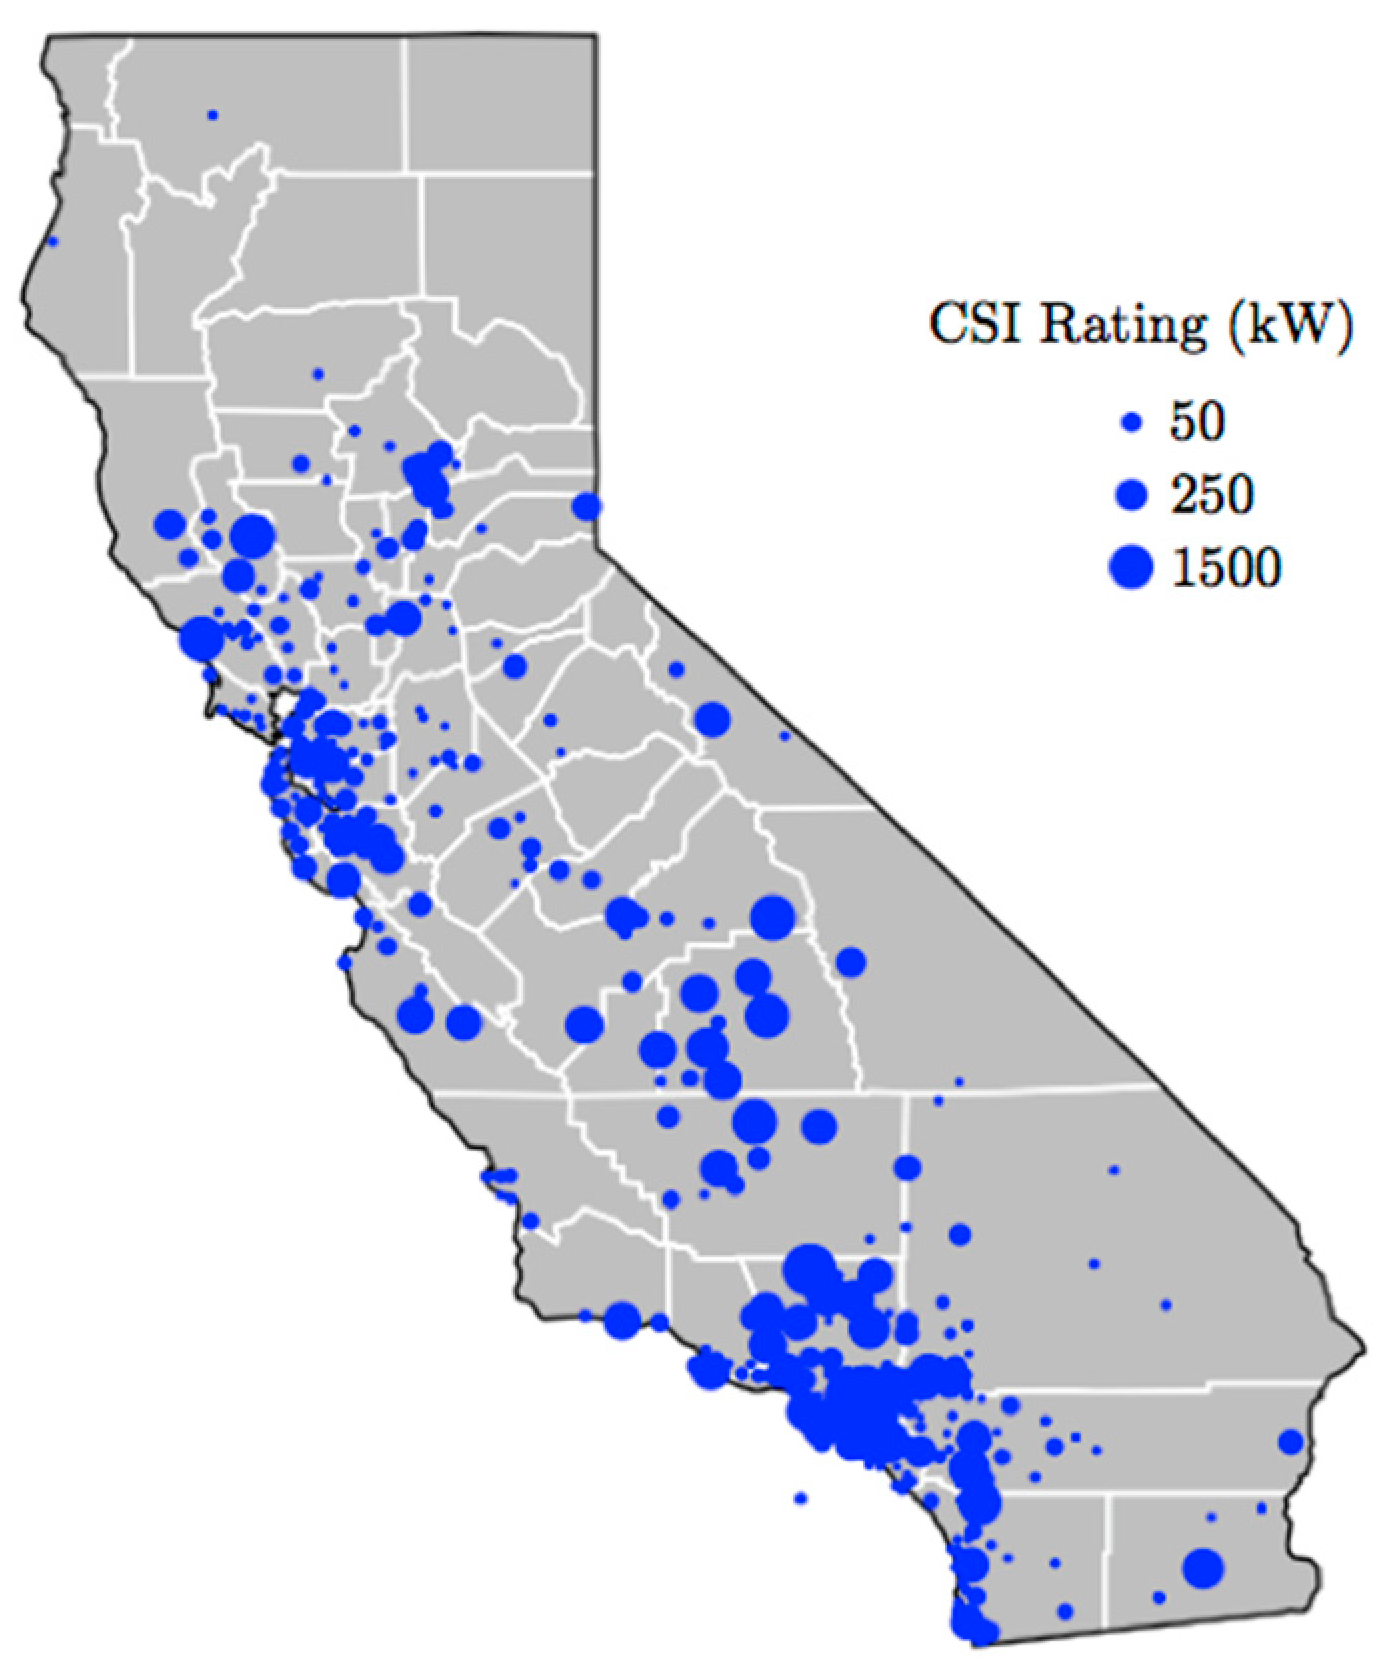
In order to assess the performance of the solar systems, we need to restrict the sample to a specific time period and measure the performance of all systems during this period. Because of seasonality of weather conditions, we should measure the PV performance over at least a one-year period. Furthermore, a careful examination of the production data shows that production of different systems may not be recorded on the same date. Some systems are measured on the first day of each month and many others are measured half way into the month. Due to the above two considerations, we restrict our production data to the period from 1 January 2013 to 31 December 2013. The time period is a plausible choice that can accommodate an adequate number of systems. Extending the time period to 2012 or 2014 would force us to significantly trim the sample. Finally, we obtain a sample of 1035 PV installations, the geographical distribution of which is plotted in Figure 2 similar to [23]. The graph shows that majority of the commercial systems locate along the coast and around densely populated areas such as the bay area, Los Angeles, and San Diego. There are few installations near the eastern and northern state borders.
Moreover, we would like to point out that a PV system’s performance depends on its technology type (e.g., monocrystalline, polycrystalline, thin-film, etc.). The conversion efficiency ranges from 13% of certain thin-film modules to more than 20% of high-performance monocrystalline modules [39]. It would be of interest to know the technology type of the systems. However, CSI does not report the technology information, so we do not know the fraction of each technology in our sample. But there is evidence that monocrystalline modules together with building-integrated PV account for over 80% of installations in California residential sector since 2010 ([39], p. 34). In addition, we would like to comment that the choice of the technology is a decision made by the system owner/installer. Therefore, technology choice can be regarded as an endogenous factor in the assessment of installer performance.
We collect the solar irradiance data compiled by NREL. Since there is no downloadable irradiance data after 2010, we use the solar irradiation data for 1998–2009 [40]. The data provides monthly average daily solar irradiation at 10-km resolution for the United States. We convert the irradiation data to irradiance as specified by the model. The ZIP code for each 10 × 10 km grid cell is also given in the data. Therefore, we assign the irradiance to a PV system by matching the ZIP code.
We obtain the monthly average temperature data from weather stations in California maintained in the National Climatic Data by the National Oceanic and Atmospheric Administration [41]. The coordinates of the weather station are included in the data. We proxy a solar installation’s coordinates based on its ZIP code. Then for each installation, we use the inverse distance weighting interpolation to derive the ambient temperature [42]. The interpolation selects the three nearest weather stations and uses the inverse quadratic distances between the installation and weather stations as the weights to calculate the weighted average temperature for the installation.
Since we assess the performance in year 2013, all monthly data are aggregated or averaged to yield the annual measure. Table 2 shows the distribution of PV systems by installers. A total of 213 installers are present in the sample. Table 3 shows the top 25 installers in the sample. Collectively, the top 25 installers build roughly 60% of all systems (655 out of 1035) in the sample. The top five installers build around one third of the systems (344 out of 1035).
Table 4 shows the descriptive statistics of the above variables in the sample. The PV installations in the sample on average have capacity of 215.15 kW, 1041.06 modules, cost of $1381.89 thousand, and electricity generation of 402.98 MWh. The biggest system in sample has a maximum capacity of 1523.26 kW whereas the smallest one is only 1.33 kW.
5. Results
We solve model (1) with the variables described in Section 4 and present the analysis in this section. Please refer to Supplementary Materials for data and sample codes.
5.1. Installer Size and Installation Performance
The DEA results for the whole sample and selected installers are summarized in Table 5. Overall, the 1035 systems attain a mean efficiency score of 0.578. Installers that have at least 10 systems have a mean efficiency of 0.578, the same as the overall mean. Installers of 2 systems have a mean efficiency of 0.569, the lowest among the installer groups. The results seem to refute the existence of positive effects of installer’s size on PV installation performance.
The DEA results do not provide statistical inference. Further, the above computation is based on the entire sample and has not controlled for the potential impact of installation date on system performance. Installation date can affect system performance due to degradation of module efficiency, technology advancement, and cost-down. To mitigate the impact of installation date on system performance, we group the PV systems by the installation year and run the DEA model for all systems installed in the same year. Grouping allows us to benchmark the systems installed in the same year against each other. Presumably, systems installed in the same year have similar degradation, technology, and cost characteristics. CSI does not provide the installation date and we approximate it using the interconnection application date reported to CSI by system owners/installers. After we obtain the results of the within-year DEA computation, we divide the 213 installers in our sample into quartiles based on each installer’s total installations and commercial installation in the entire CSI database, and compare the performance of the PV systems developed by firms in the top quartile (e.g., large installers) and bottom quartile (e.g., small installers). In addition to system level comparison, we also aggregate the performance at the installer level by taking average performance scores of all systems developed by an individual installer, e.g., each installer is assigned one efficiency score. The comparison is based on t-test for the mean and Wilcoxon rank-sum test for the median. In the case of Wilcoxon rank-sum test, all observations of efficiency scores are ranked from the greatest to the least and a test statistic is computed based on the ranks [43]. Table 6 summarizes the results. Clearly, while the large installers do have better efficiencies in all comparisons, the advantage over the small installers is very marginal with a difference ranging between 0.7% and 2%. None of the comparison is significant even at 10% significance level.
Clearly, scale of business fails to translate into better performance in the solar installation industry. We need to undertake a close examination of the big installers. Table 7 presents the efficiency scores of large installers with at least 10 installations in our sample. There are several striking observations. The biggest installer, SolarCity, displays an astonishingly low efficiency of 0.494, the worst of all installers in the table. REC Solar and Real Goods Solar, coming in the second place and third place, fail to attain the industry average performance of 0.578. Overall, six of the 14 installers in the table fail to achieve the industry average performance.
The reason of the inferior performance among these installers seems to rest at least partially on the business model they employ. The two worst installers, SolarCity and Real Goods Solar, are public companies and have been pursuing very aggressive expansion strategies. Up to now, the competitive priority of large installers has been installation growth. As admitted by SolarCity, capturing a larger share of the market as quickly as possible has been the paramount goal for big installers [44]. Consequently, cost reduction and operational efficiency were not at the uppermost mind of the management and were sacrificed, as evidenced by PV systems mounted by SolarCity and Real Goods Solar. Furthermore, solar installation is more or less a localized business. Experiences learned from other regions do not necessarily translate into advantages in local markets. To a large extent solar installation in residential and commercial sectors is a kind of engineering, procurement, and construction (EPC) business with minimal technological barrier [45]. The biggest notable advantage of larger installers is not expertise but rather their access to resources, especially financial resources. Financial advantages enable third-party ownership and thus accelerate expansion of business, but do not necessarily result in better performance of installed systems. In addition, local administration may offer additional incentive to the host if the system is installed by a local company. Therefore, with local connections and relative concentration of business, smaller installers may enjoy an edge in flexibility and nimbleness compared to larger installers that operate a statewide business.
To see whether the above interpretation is plausible, we carry out a test using the Herfindahl index, which is widely used to measure the sectoral or geographic concentration of business [46]. We cluster the 1035 system performance scores by averaging them at the installer level. For each installer, we create a measure for its geographic diversification in the manner of Herfindahl–Hirschman Index. The geographic diversification is defined as where is the proportion of an installer’s installed capacity in county j out of the installer’s total installed capacity across all counties. The Pearson correlation coefficients between geographic diversification and performance score are reported in Table 8. All three coefficients are negative with p-value below 5%. The result indicates a significant and inverse relationship between geographic diversification and PV installation performance. While still not conclusive, the correlation lends support to our interpretation of the inferior performance of large installers.
5.2. Solar Installations by Oil Companies
A very interesting finding is that installers as subsidiaries of big oil companies have had bad performance. Most notably, Chevron Energy Solutions and BP Solar have average efficiencies of 0.508 and 0.526, far below the industry average. The results resonate with the downfall of the solar business at BP and Chevron [47]. In fact, several international oil corporations are known for their venture into renewable energy. BP and Chevron are the two most notable cases and have made substantial investments in solar in the first decade of the 21st century [47]. BP first entered the solar energy industry in 1980s through acquisition of an existing solar module manufacturer. The company branched into the installation business in California in 2000s. But then BP shut down its solar business including manufacturing and installation in 2011. The CSI database indicates that BP Solar, as BP’s solar arm, has built 31 projects with a total capacity of 12.86 MW. Chevron with its solar subsidiary Chevron Energy Solutions is an even more prominent installer than BP, with 426 installations and a total capacity of 103.68 MW. However, following the footsteps of BP, Chevron closed its solar energy business in 2014. The withdrawal of big oil companies from solar business seems to validate the argument raised by existing research that oil companies are prone to regard renewable energy as a public relation vehicle rather than a sustainable core business asset [47]. We conjecture that this public relation mentality may impair the organizational support to solar business. Also, being the fringe business, solar departments at BP and Chevron may not come under as much pressure as other installers to excel in operations. Therefore, solar PV systems built by solar branches of oil companies have inferior performances compared to systems built by other installers.
5.3. Vertically Integrated Installations
Now we analyze the performance of vertically integrated systems. A close examination of our sample indicates 89 PV systems with a match between installer and module manufacturer. These systems represent vertically integrated projects done by five installers, i.e., SunPower, REC Solar, Conergy Projects, BP Solar, and Adema Technologies. We note that vertically integrated installers can also use other manufacturers’ modules. Table 9 shows the distribution of the 89 vertically integrated PV systems and compares their performance to independent systems. SunPower, BP Solar International, and Adema Technologies have developed the projects almost exclusively with the modules manufactured by themselves. The vertically integrated systems attain a mean efficiency of 0.643, far surpassing the overall mean of 0.578. Meanwhile, the average efficiency of the independent systems from these five installers is 0.562, below the vertically integrated systems. Vertically integrated systems mounted by four of the five installers have efficiency scores greater than the overall mean. The only exception is BP Solar International, which was shut down in 2011. We test the hypothesis that the vertically integrated PV systems are more efficient than independent systems using Welch’s t-test. In the test, we remove all PV systems by BP Solar International, because the company has pulled out of the solar industry in 2011 and termination of solar business can affect maintenance of the systems. We first compare vertically integrated systems and the independent systems mounted by the same group of installers (27 systems). We then compare the vertically integrated systems against all independent systems in the sample (946 systems). The results are significant (t = 2.360 and t = 5.925). These results suggest that vertical integration comes with better performance for installed PV systems.
The results in Table 9 do not take the PV module manufacturer and model into account. We complement the existing results by investigating the performance of modules supplied by the same manufacturer but installed by different companies. The analysis is presented in Table 10. There are 74 manufacturers of PV modules in the sample. SunPower, Yingli Energy, Trina Solar, Suntech Power, and Sharp are the top five manufacturers in terms of number of systems installed. They supply modules to a total of 594 projects, slightly more than half of all projects. Among them, SunPower is the only company that engages in installation business. It supplies modules to a total of 210 projects, of which 61 projects are installed by SunPower itself and 149 projects are developed by other firms. The mean efficiency of the projects using SunPower modules is 0.541, very close to the overall average efficiency. The efficiency of the systems installed by SunPower itself (0.665) clearly beats the efficiency of systems installed by others (0.491) by a significant margin (t = 7.355).
For other vertically integrated installers not covered in Table 10, we observe that REC Solar supplies modules to 16 projects and builds 8 of the projects itself. Conergy supplies modules to 9 projects and installs 8 of them itself. BP Solar International supplies modules to 35 projects and installs 11 of them itself. Adema Technologies supplies modules to build only one project by itself. For REC Solar, Conergy, and Adema Technologies, the number of PV systems they supply is too small to make a meaningful comparison. BP Solar has pulled out of installation business in 2011 so it is excluded from the analysis here. We then zoom in on the specific models of the PV modules used in the projects. The sample indicates 286 models used by the 1035 projects. However, we could not draw any conclusion from the result, because we could not find a model that is widely used by both vertically integrated installers and independent installers.
In sum, when a company installs PV systems in a vertically integrated manner by using the panels manufactured by itself, the performance of the systems on average is more efficient than PV systems manufactured by other companies. Also, PV systems installed by the module manufacturers are more efficient than those modules manufactured by the same company but installed by other companies.
The better performance of vertically integrated installations may be attributed to the advantages enjoyed by vertically integrated installers with PV module manufacturing facilities over their independent competitors. Many papers have analyzed the pros and cons of vertically integrated firms versus independent firms [48]. Most the discussions are also applicable to the solar installation industry [49]. It has been argued that vertically integrated firms enjoy competitive advantages in marketing and technological capabilities [50]. In the solar installation industry, installers with module manufacturing operations are likely to have better knowledge about the PV panels than firms with pure installation business. For instance, SunPower, a major solar company engaged in both PV cell manufacturing and rooftop installation, states that [51], “vertical integration gives SunPower the ability to drive closed-loop feedback into every step of the process. Through continuous learning and improvement, we consistently deliver high-quality energy solutions.” In addition, vertical integration may lead to better coordination along the solar supply chain to improve the logistics behind the installation business.
5.4. Evolution of Performance
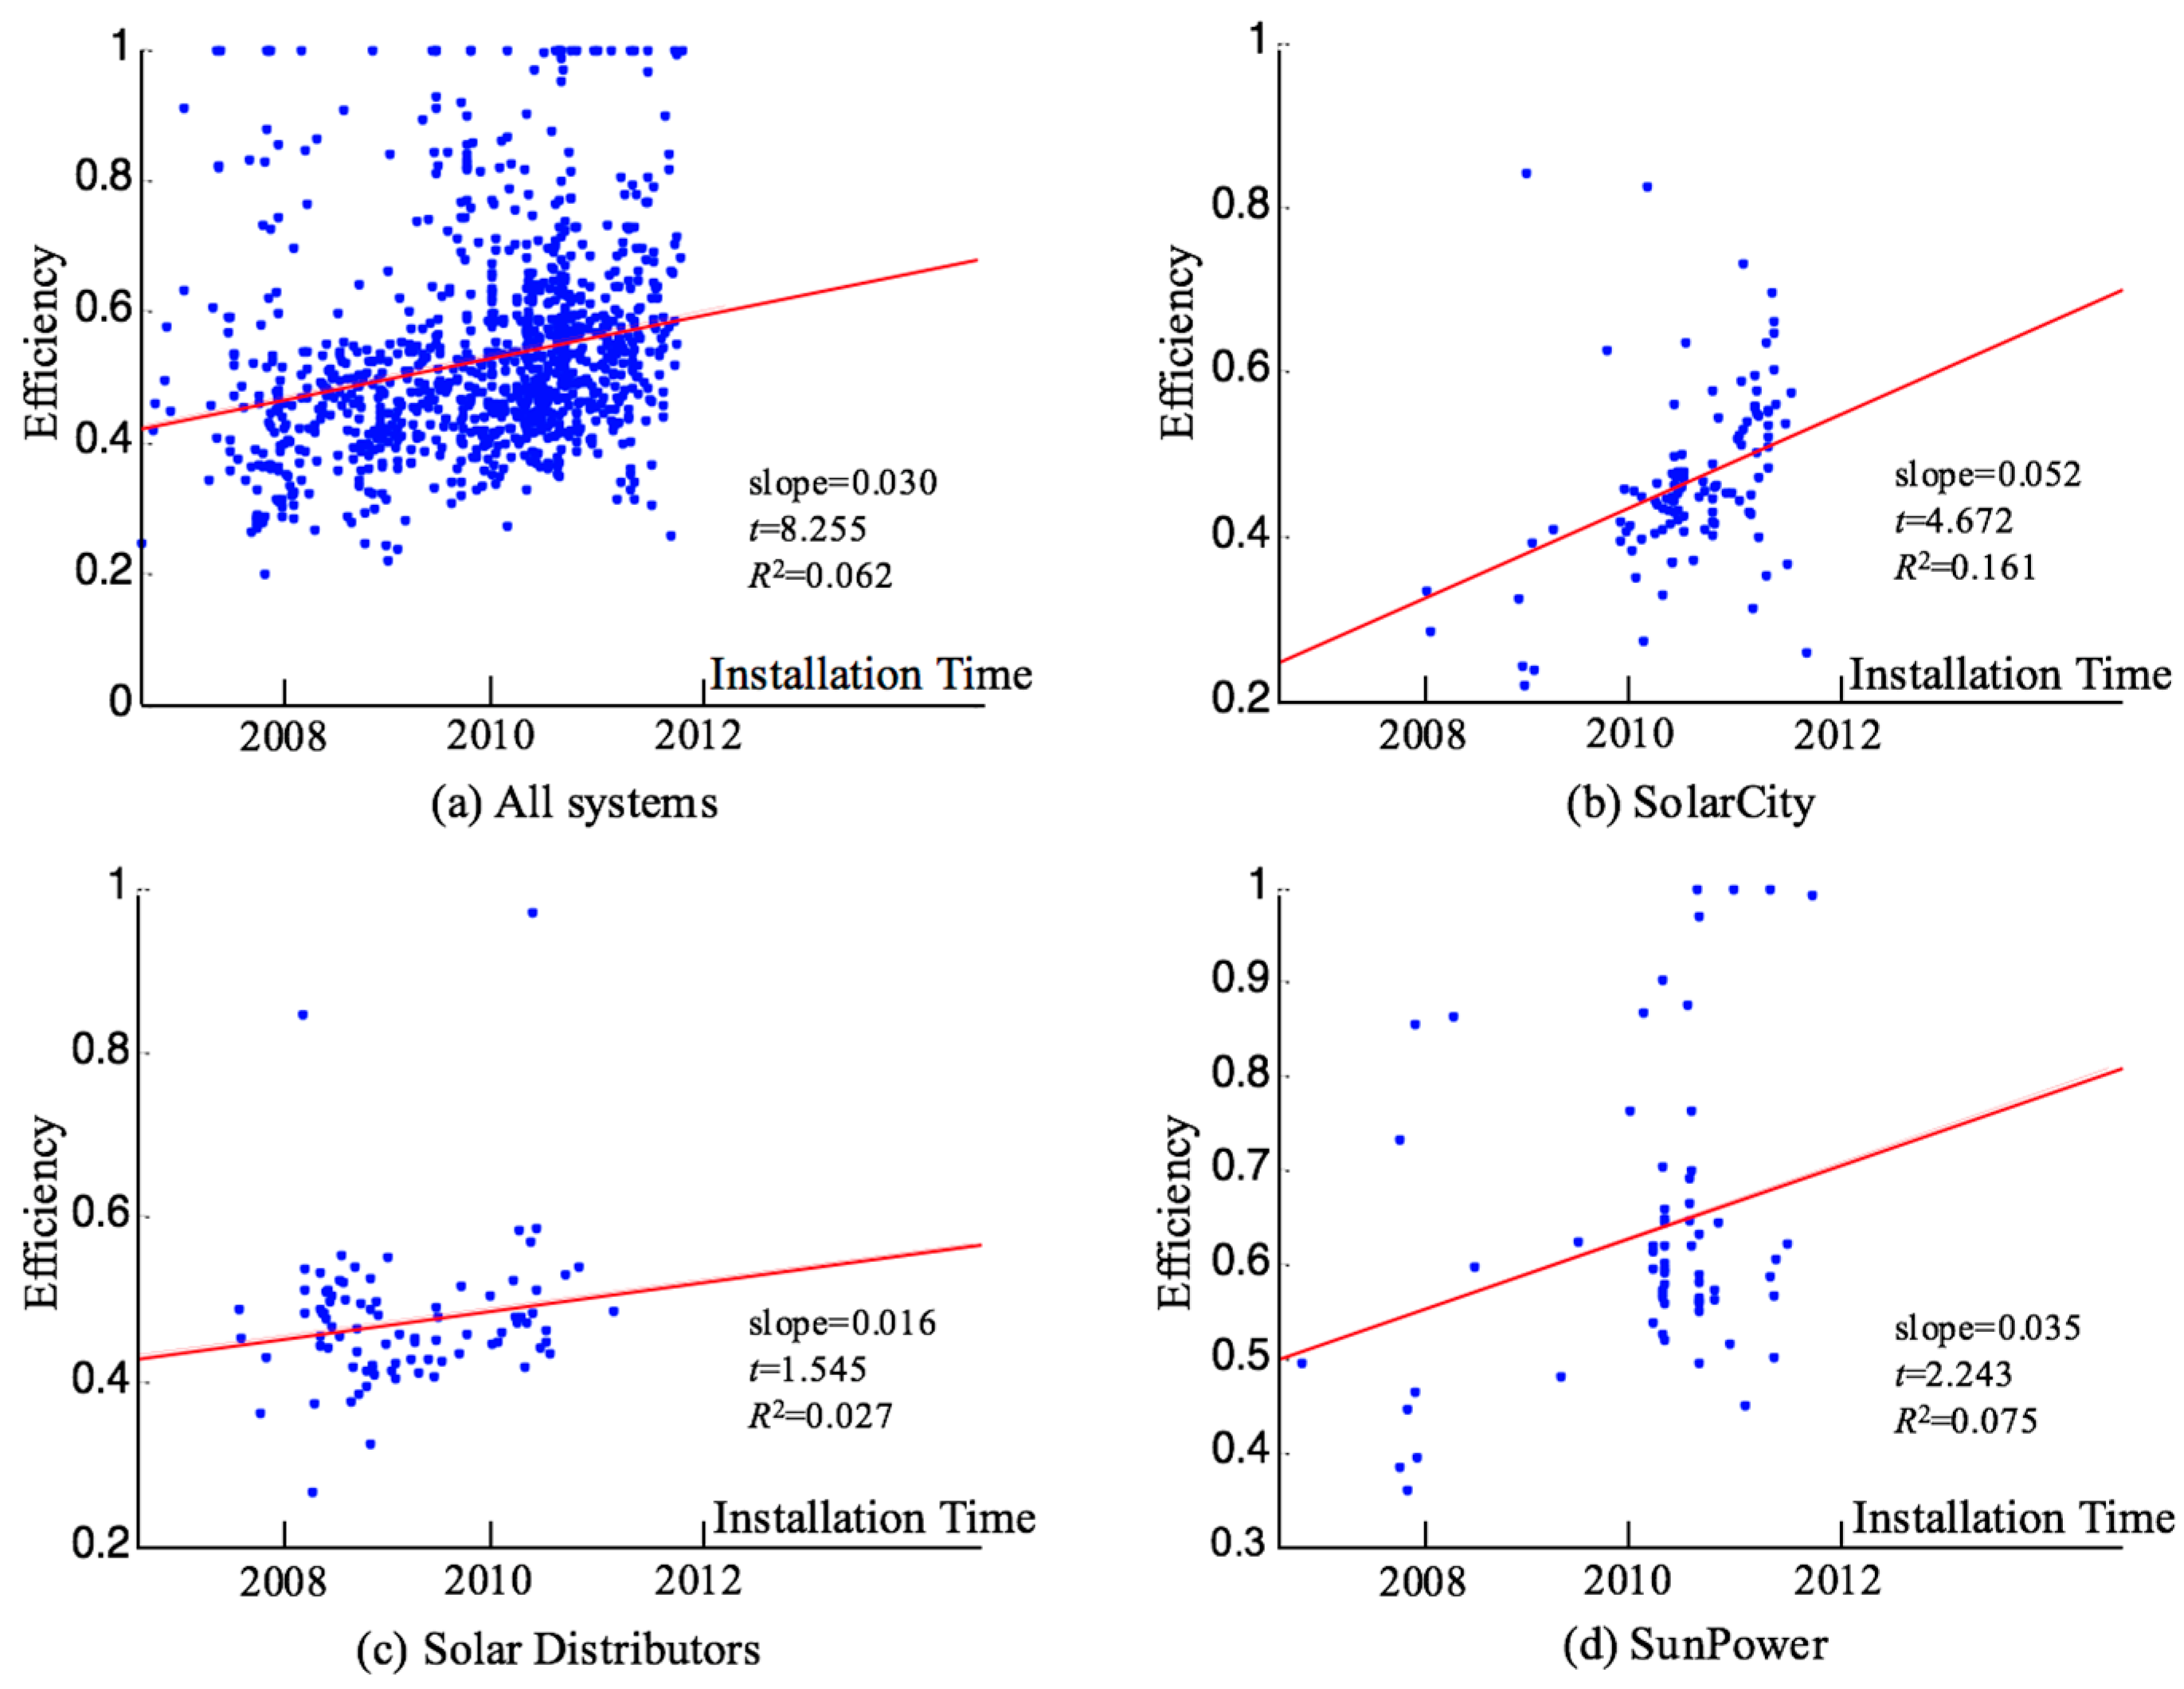
We are also interested to know how the performance evolves over time. Figure 3 presents a scatter plot with the efficiency on the y-axis and the installation date on the x-axis for all installers combined and the top three installers individually. We also plot the fitted values from a linear regression on installation date, and report the slopes, t-statistics, and R2. For all systems, the slope is 0.030 with a t-statistic of 8.255. Clearly there is a distinctively positive relation between efficiency and installation date, i.e., the efficiency grows by 3% every year. We obtain similar results for SolarCity, Solar Distributors and SunPower. The improvement of efficiency over time reflects industry-wide progress in technology and/or skills. Please note this efficiency gain over time does not conflict with our early observation that systems installed by larger and more experienced installers do not perform better than those installed by smaller and less experienced installers.
6. Discussion and Conclusions
The solar installation industry plays an important role in the rapid expansion of rooftop solar energy. Understanding how the installers perform in building up solar capacity to generate solar electricity is critical for the future development of solar energy. Through the analysis of a large sample of rooftop PV installations, we have obtained the following key findings about the solar energy in California:
- Larger installers on average do not develop rooftop PV systems in a more efficient way than smaller installers. In fact, some of the largest installers display significantly worse installation performance than the industry average.
- Geographic diversification of an installer’s operations is significantly and negatively associated with performance of the installations.
- Solar subsidiaries of oil companies like BP and Chevron have inferior installation performance.
- PV systems installed in the vertically integrated way are significantly more efficient than other systems in the sample.
The findings of this study bear significant implications for the solar installation industry and policymakers. For instance, the advantage of the vertically integrated systems highlights the benefits of vertical integration in the solar installation industry. In fact, some recent deals in the industry show that major installers have started to seek opportunities to expand their operations vertically in the supply chain. In 2014, SolarCity acquired the solar module manufacturer Silevo. The acquisition marks the transition of SolarCity from an independent installer to a vertically integrated firm with operations spanning manufacturing and installation. In the same year, Sunrun, originally a solar developer and a financer, bought the residential solar installation division of REC Solar to extend its control over the solar supply chain. NRG Home Solar, the solar subsidiary of the energy giant NRG and a major installer in US, indicated that [52], “vertical integration is the winning model.” The following reasons may motivate vertical integration. First, vertical integration provides a solar installer more market power. As our analysis of CSI data shows, the installation market is highly fragmented with many small and local installers. According to an interview with participants in the solar installation industry [45], the market of small and residential rooftop systems has no barriers to entry and even a one-man installer can handle the job. For commercial projects, the main barrier is capital rather than technology. In such a fragmented market with low barrier of entry, vertical integration can increase the installer’s market power. Second, for manufacturers deeply entrenched in the module market where cut-throat competition has driven some companies out of business, vertical integration into the installation business provides a stepping stone to tap into a rapidly growing market. Hence, expansion into the downstream installation business is a very plausible move. We expect that consolidation of the solar industry through vertical integration of manufacturing and installation will improve the industry-wide efficiency of the rooftop solar installations. The policymakers should cater to the trend of vertical integration of the installation industry and try to remove regulatory and policy barriers for the vertical consolidation of the industry.
The underperformance of some large installers and geographically diversified installers should alert the installers themselves and the policymakers. In the past, typical large and geographically diversified installers like SolarCity have prioritized market growth in their competitive strategy, and consequently, may not pay sufficient attention to installation efficiency. This growth-oriented strategy has provided them with a rapidly growing market share but has also cost them dearly, since maintaining a high growth rate requires significant investments in infrastructure, sales, and administration. The trend has started to change, as the installers are undergoing a strategic pivot from growth to cash generation. For example, in a recent shareholder letter [53], SolarCity made the following statement regarding the company’s strategy, “going forward we are focusing our strategy on cost reductions and cash flow. Though we expect our deployments to grow in 2016 we are not targeting the same growth rates that have gotten us to our current scale going forward. Specifically, it is our goal to achieve positive cash flow by 2016 year-end.” We expect that other major installers will follow suit and such a shift of focus will lead to more efforts from large and geographically diversified installers to improve installation efficiency. Policymakers may play a more proactive role to facilitate the pivot from growth to efficiency. A potential policy instrument that the policymakers can leverage is to make the installers’ historical installation performance more transparent and visible to customers. While the raw data of solar PV installations have been published through the CSI, the data in its current format is still opaque to the general public. Enhancing the visibility of installation performance data to the customers can induce more peer pressure on installers to improve installation performance. In addition, the current CSI program assigns incentive based on system size, customer class, and performance and installation factors. The policymakers may explore ways of introducing installer factors such as capacity installed and solar electricity generated relative to cost and weather conditions into incentive design.
Supplementary Materials
The following are available online at www.mdpi.com/2071-1050/9/8/1403/s1. Please refer to the attached sample data and codes for the computation of the model.
Acknowledgments
This work is supported by research program at China University of Political Science and Law.
Conflicts of Interest
The author declares no conflict of interest.
References
- Goodrich, A.; James, T.; Woodhouse, M. Residential, Commercial, and Utility-Scale Photovoltaic (PV) System Prices in the United States: Current Drivers and Cost-Reduction Opportunities; Technical Report; NREL: Golden, CO, USA, 2012.
- Drury, E.; Miller, M.; Macal, C.M.; Graziano, D.J.; Heimiller, D.; Ozik, J.; Perry IV, T.D. The transformation of southern California’s residential photovoltaics market through third-party ownership. Energy Policy 2012, 42, 681–690. [Google Scholar] [CrossRef]
- Wiser, R.; Namovicz, C.; Gielecki, M.; Smith, R. Renewables Portfolio Standards: A Factual Introduction to Experience from the United States; Lawrence Berkeley National Laboratory: Berkeley, CA, USA, 2007.
- Arnette, A.N. Integrating rooftop solar into a multi-source energy planning optimization model. Appl. Energy 2013, 111, 456–467. [Google Scholar] [CrossRef]
- Ayompe, L.M.; Duffy, A.; McCormack, S.J.; Conlon, M. Measured performance of a 1.72 kW rooftop grid connected photovoltaic system in Ireland. Energy Convers. Manag. 2011, 52, 816–825. [Google Scholar]
- Sumper, A.; Robledo-García, M.; Villafáfila-Robles, R.; Bergas-Jané, J.; Andrés-Peiró, J. Life-cycle assessment of a photovoltaic system in Catalonia (Spain). Renew. Sustain. Energy Rev. 2011, 15, 3888–3896. [Google Scholar] [CrossRef]
- Friedman, B.; Jordan, P.; Carrese, J. Solar Installation Labor Market Analysis; Contract; National Renewable Energy Laboratory: Golden, CO, USA, 2011.
- California Energy Commission California Renewable Energy Overview and Programs. Available online: http://www.energy.ca.gov/renewables/ (accessed on 7 May 2016).
- Song, A.; Lu, L.; Liu, Z.; Wong, M. A Study of Incentive Policies for Building-Integrated Photovoltaic Technology in Hong Kong. Sustainability 2016, 8, 769. [Google Scholar] [CrossRef]
- Zhang, Y.; Zhao, X.; Zuo, Y.; Ren, L.; Wang, L. The Development of the Renewable Energy Power Industry under Feed-In Tariff and Renewable Portfolio Standard: A Case Study of China’s Photovoltaic Power Industry. Sustainability 2017, 9, 532. [Google Scholar] [CrossRef]
- Markvart, T. Solar Electricity; John Wiley & Sons: Hoboken, NJ, USA, 2000. [Google Scholar]
- Tyagi, V.V.; Rahim, N.A.A.; Rahim, N.A.; Selvaraj, J.A.L. Progress in solar PV technology: Research and achievement. Renew. Sustain. Energy Rev. 2013, 20, 443–461. [Google Scholar] [CrossRef]
- Lee, A.; Kang, H.-Y.; Liou, Y.-J. A Hybrid Multiple-Criteria Decision-Making Approach for Photovoltaic Solar Plant Location Selection. Sustainability 2017, 9, 184. [Google Scholar] [CrossRef]
- Murphy, F.; McDonnell, K. A Feasibility Assessment of Photovoltaic Power Systems in Ireland; a Case Study for the Dublin Region. Sustainability 2017, 9, 302. [Google Scholar] [CrossRef]
- Chang, T.P. The gain of single-axis tracked panel according to extraterrestrial radiation. Appl. Energy 2009, 86, 1074–1079. [Google Scholar] [CrossRef]
- Huld, T.; Gottschalg, R.; Beyer, H.G.; Topič, M. Mapping the performance of PV modules, effects of module type and data averaging. Sol. Energy 2010, 84, 324–338. [Google Scholar] [CrossRef]
- Eke, R.; Senturk, A. Performance comparison of a double-axis sun tracking versus fixed PV system. Sol. Energy 2012, 86, 2665–2672. [Google Scholar] [CrossRef]
- Jha, D.K.; Shrestha, R. Measuring efficiency of hydropower plants in Nepal using data envelopment analysis. IEEE Trans. Power Syst. 2006, 21, 1502–1511. [Google Scholar] [CrossRef]
- Sarica, K.; Or, I. Efficiency assessment of Turkish power plants using data envelopment analysis. Energy 2007, 32, 1484–1499. [Google Scholar] [CrossRef]
- Sueyoshi, T.; Goto, M.; Ueno, T. Performance analysis of US coal-fired power plants by measuring three DEA efficiencies. Energy Policy 2010, 38, 1675–1688. [Google Scholar] [CrossRef]
- Iribarren, D.; Vázquez-Rowe, I.; Rugani, B.; Benetto, E. On the feasibility of using emergy analysis as a source of benchmarking criteria through data envelopment analysis: A case study for wind energy. Energy 2014, 67, 527–537. [Google Scholar] [CrossRef]
- Sueyoshi, T.; Goto, M. Photovoltaic power stations in Germany and the United States: A comparative study by data envelopment analysis. Energy Econ. 2014, 42, 271–288. [Google Scholar] [CrossRef]
- Wang, D.D.; Sueyoshi, T. Assessment of large commercial rooftop photovoltaic system installations: Evidence from California. Appl. Energy 2017, 188, 45–55. [Google Scholar] [CrossRef]
- Sueyoshi, T.; Wang, D. Measuring Scale Efficiency and Returns to Scale on Large Commercial Rooftop Photovoltaic Systems in California. Energy Econ. 2017, 65, 389–398. [Google Scholar] [CrossRef]
- EIA. California has nearly half of the nation’s solar electricity generating capacity. Available online: http://www.eia.gov/todayinenergy/detail.php?id=24852 (accessed on 8 October 2016).
- EIA. California First State to Generate More Than 5% of Electricity from Utility-Scale Solar—Today in Energy—U.S. Energy Information Administration (EIA). Available online: http://www.eia.gov/todayinenergy/detail.cfm?id=20492 (accessed on 1 August 2017).
- Timilsina, G.R.; Kurdgelashvili, L.; Narbel, P.A. Solar energy: Markets, economics and policies. Renew. Sustain. Energy Rev. 2012, 16, 449–465. [Google Scholar] [CrossRef]
- Wiser, R.; Namovicz, C.; Gielecki, M.; Smith, R. The Experience with Renewable Portfolio Standards in the United States. Electr. J. 2007, 20, 8–20. [Google Scholar] [CrossRef]
- Comello, S.; Reichelstein, S. The U.S. investment tax credit for solar energy: Alternatives to the anticipated 2017 step-down. Renew. Sustain. Energy Rev. 2016, 55, 591–602. [Google Scholar] [CrossRef]
- Hughes, J.E.; Podolefsky, M. Getting Green with Solar Subsidies: Evidence from the California Solar Initiative. J. Assoc. Environ. Resour. Econ. 2015, 2, 235–275. [Google Scholar] [CrossRef]
- Darghouth, N.R.; Barbose, G.; Wiser, R. The impact of rate design and net metering on the bill savings from distributed PV for residential customers in California. Energy Policy 2011, 39, 5243–5253. [Google Scholar] [CrossRef]
- California Energy Commission The California Solar Initiative—CSI. Available online: http://www.gosolarcalifornia.ca.gov/csi/ (accessed on 7 May 2016).
- California Solar Statistics CSI Data Sets. Available online: https://www.californiasolarstatistics.ca.gov/data_downloads/ (accessed on 20 June 2017).
- Charnes, A.; Cooper, W.W.; Rhodes, E. Measuring the efficiency of decision making units. Eur. J. Oper. Res. 1978, 2, 429–444. [Google Scholar] [CrossRef]
- Banker, R.D.; Morey, R.C. Efficiency Analysis for Exogenously Fixed Inputs and Outputs. Oper. Res. 1986, 34, 513–521. [Google Scholar] [CrossRef]
- Knox Lovell, C.A.; Pastor, J.T.; Turner, J.A. Measuring macroeconomic performance in the OECD: A comparison of European and non-European countries. Eur. J. Oper. Res. 1995, 87, 507–518. [Google Scholar] [CrossRef]
- California Public Utilities Commission. CSI Handbook; CSI: Sacramento, CA, USA, 2016.
- US Bureau of Labor Statistics CPI Databases. Available online: http://www.bls.gov/cpi/data.htm (accessed on 20 July 2017).
- Barbose, G.; Darghouth, N. Tracking the Sun VIII The Installed Price of Residential and Non-Residential Photovoltaic Systems in the United States. Available online: https://emp.lbl.gov/publications/tracking-sun-viii-installed-price (accessed on 2 August 2017).
- National Renewable Energy Laboratory Solar Resource Data. Available online: http://www.nrel.gov/rredc/solar_data.html (accessed on 20 June 2017).
- National Oceanic and Atmospheric Administration National Climatic Data. Available online: https://www.ncdc.noaa.gov/cdo-web/datasets (accessed on 20 June 2017).
- Shepard, D. A two-dimensional interpolation function for irregularly-spaced data. In Proceedings of the 1968 23rd ACM National Conference, New York, NY, USA, 27–29 August 1968; pp. 517–524. [Google Scholar]
- Hollander, M.; Wolfe, D. Nonparametric Statistical Methods; Wiley: New York, NY, USA, 1999. [Google Scholar]
- Bloomberg SolarCity Installations Decline Amid Shift away from Growth. Available online: http://www.bloomberg.com/news/articles/2016-02-09/solarcity-reports-loss-after-shifting-focus-to-cash-flow (accessed on 25 August 2016).
- Forbes Is the Solar Installation Industry Ripe for Consolidation? Available online: http://www.forbes.com/sites/tomkonrad/2011/05/31/is-the-solar-installation-industry-ripe-for-consolidation/#688007944ea8 (accessed on 25 August 2016).
- Ellison, G.; Glaeser, E.L. The Geographic Concentration of Industry: Does Natural Advantage Explain Agglomeration? Am. Econ. Rev. 1999, 89, 2. [Google Scholar] [CrossRef]
- Miller, D. Why the oil companies lost solar. Energy Policy 2013, 60, 52–60. [Google Scholar] [CrossRef]
- Williamson, O. The Vertical Integration of Production: Market Failure Considerations. Am. Econ. Rev. 1971, 61, 112–123. [Google Scholar]
- Haley, U.; Schuler, D. Government policy and firm strategy in the solar photovoltaic industry. Calif. Manag. Rev. 2011, 54, 17–38. [Google Scholar] [CrossRef]
- Harrigan, K. A framework for looking at vertical integration. J. Bus. Strategy 1983, 3, 30–37. [Google Scholar] [CrossRef]
- SunPower New Opportunities Begin with Solid Partnerships. Available online: http://us.sunpower.com/utility-scale-solar-power-plants (accessed on 25 August 2016).
- NRG Home Solar NRG Home—Solar Investor Meeting. Available online: http://phx.corporate-ir.net/External.File?item=UGFyZW50SUQ9MjY2OTM1fENoaWxkSUQ9LTF8VHlwZT0z&t=1 (accessed on 10 October 2016).
- SolarCity Q3 2015 Shareholder Letter. Available online: http://files.shareholder.com/downloads/AMDA-14LQRE/3109252180x0x857524/09011208-1501-4695-A0F6-55B83EECABC7/SCTY_3Q15_Shareholder_Letter_FINAL.pdf (accessed on 10 October 2016).
Figure 1.
Illustration of the DEA method.
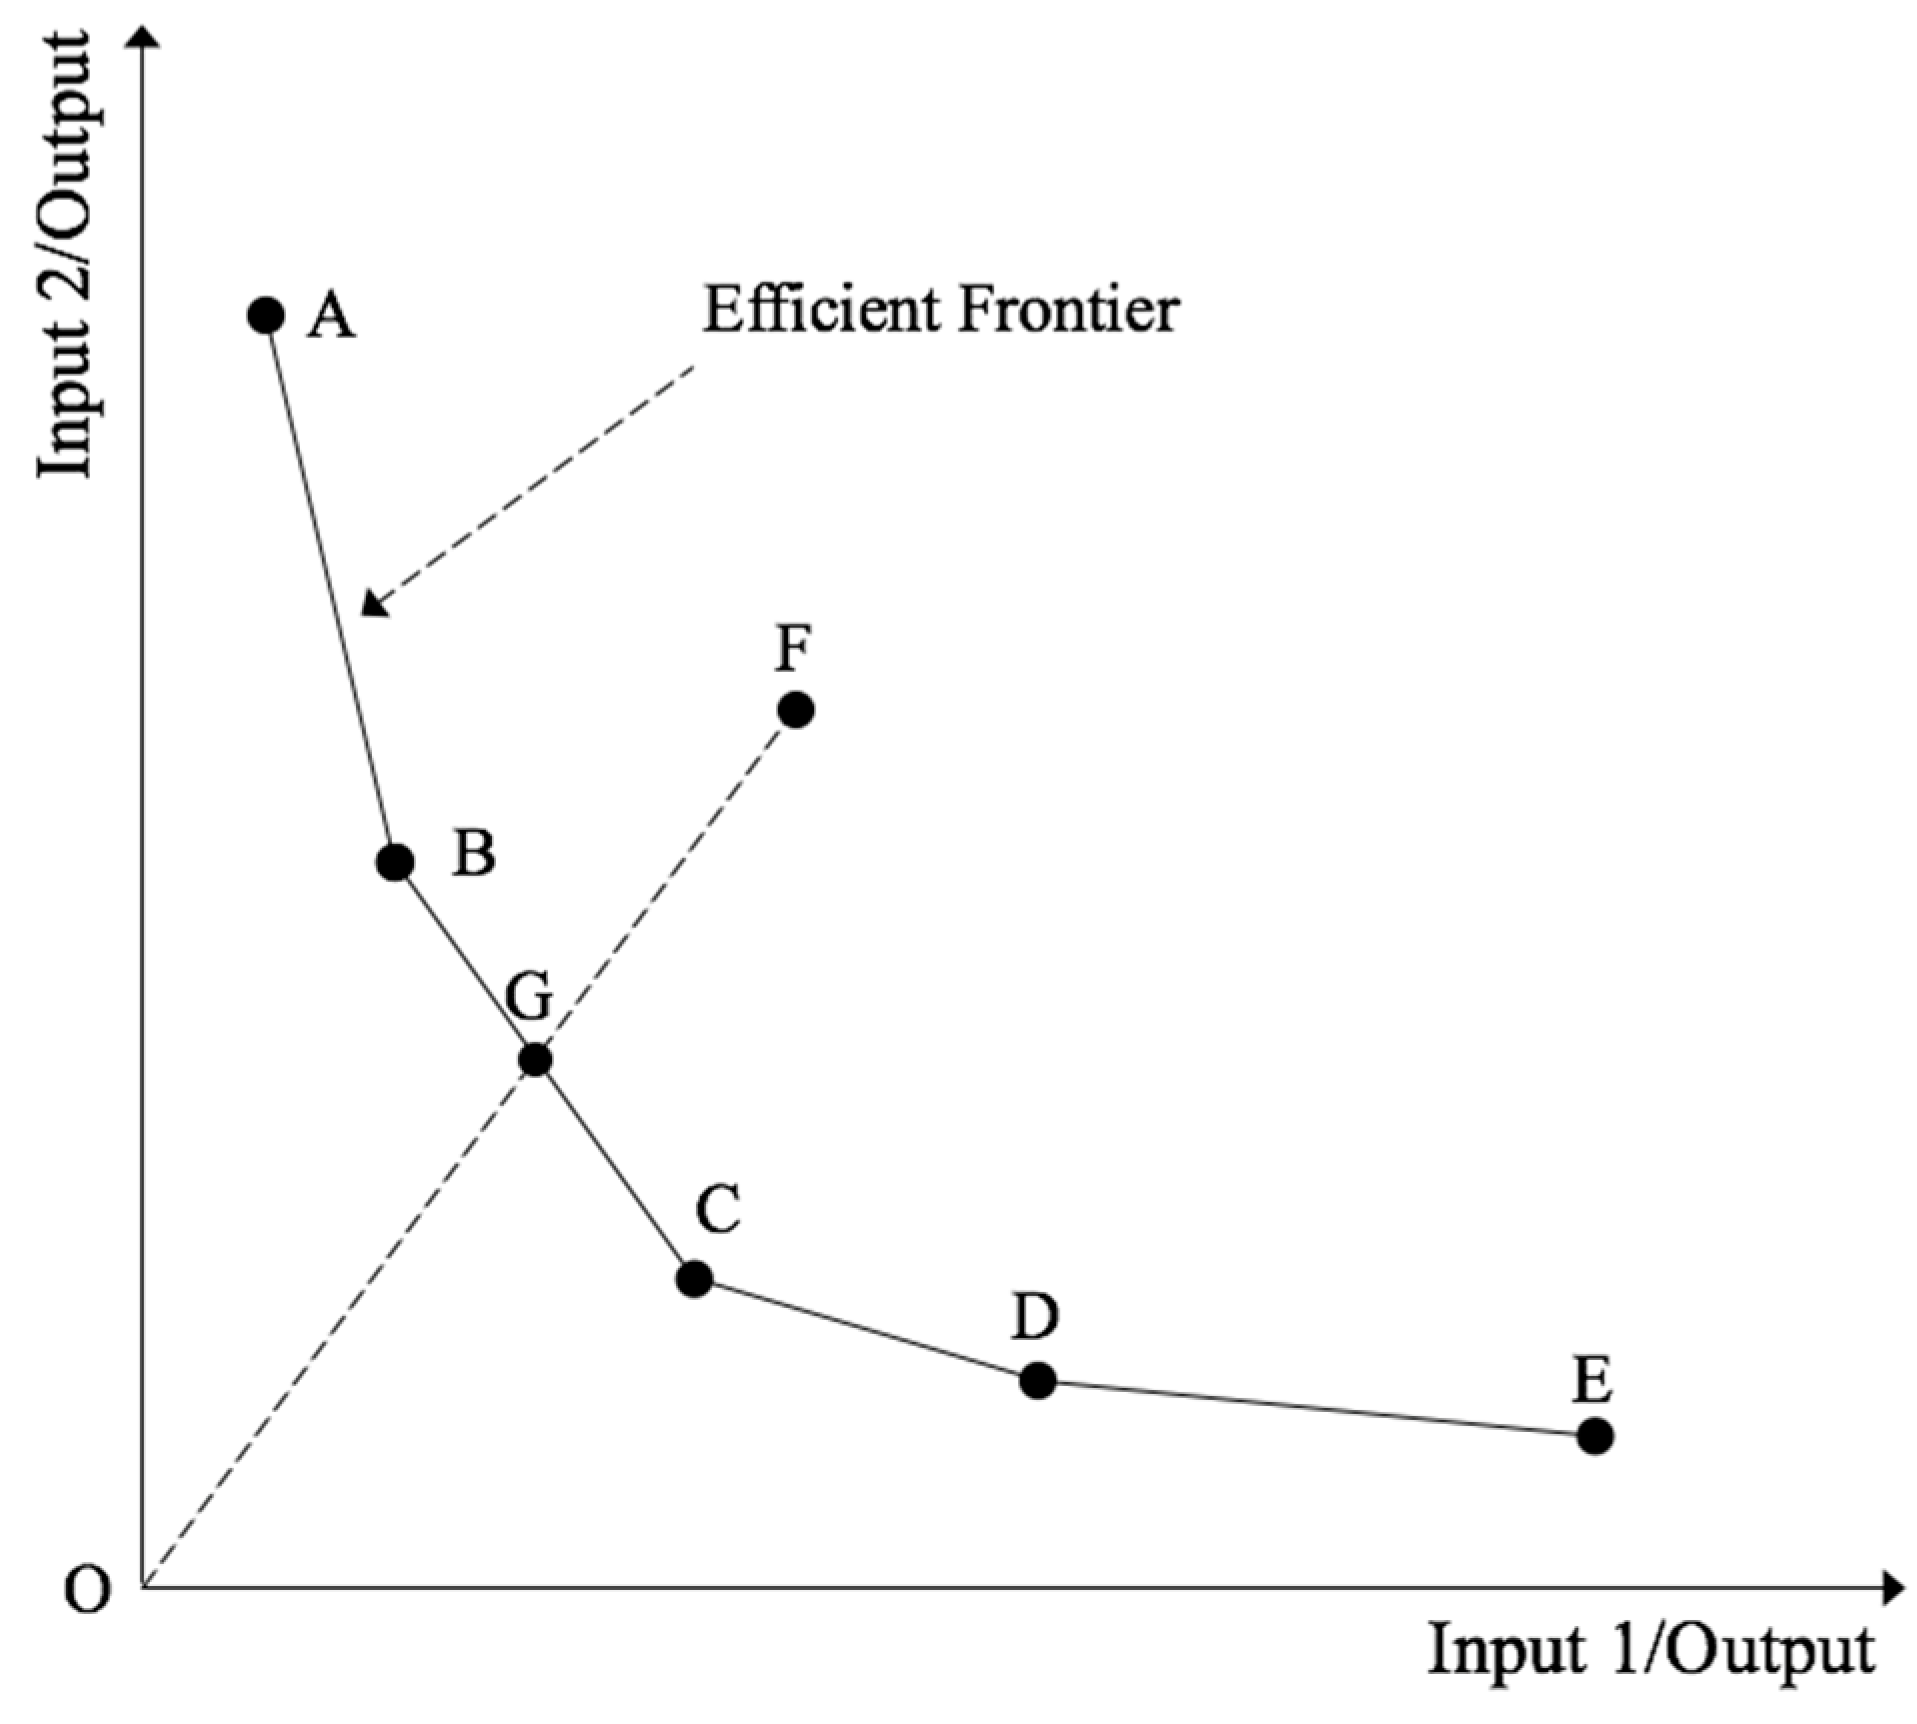
Figure 2.
Geographical distribution of the PV systems in the sample.

Figure 3.
Evolution of PV systems performance over time.


Table 1.
Summary of solar installers in California
| No. of PV Installations | ||||||
|---|---|---|---|---|---|---|
| 1−5 | 6−50 | 51−500 | 501–5000 | >5000 | Total | |
| No. of installers | 1849 | 763 | 301 | 47 | 5 | 2965 |
| Percentage of installers (%) | 62.36 | 25.73 | 10.15 | 1.59 | 0.17 | |
| Total installations | 3569 | 13,557 | 44,681 | 55,153 | 56,730 | 173,690 |
| Percentage of installations (%) | 2.05 | 7.81 | 25.72 | 31.75 | 32.66 | |
| Total capacity (MW) | 111.67 | 402.15 | 961.11 | 657.80 | 467.57 | 2600.30 |
| Percentage of capacity (%) | 4.29 | 15.47 | 36.96 | 25.30 | 17.98 | |
| Average host county reached | 1.25 | 3.38 | 7.74 | 18.49 | 39.60 | 58 |
| Percentage of county reached (%) | 2.16 | 5.83 | 13.34 | 31.88 | 68.28 | |
| Average host ZIP codes reached | 1.64 | 10.81 | 52.71 | 234.85 | 712.80 | 2591 |
| Percentage of ZIP codes reached (%) | 0.06 | 0.42 | 2.03 | 9.06 | 27.51 | |
Note: The data is extracted from CSI as of January 2016.
Table 2.
PV installations and installers in the sample.
| No. of PV Systems | |||||||
|---|---|---|---|---|---|---|---|
| 1 | 2 | 3 | 4 | 5–9 | ≥10 | Total | |
| No. of installers | 106 | 38 | 16 | 9 | 19 | 25 | 213 |
Table 3.
Installers with more than 10 installations in sample.
| Installer Name | No. of Systems in Sample |
|---|---|
| SolarCity | 116 |
| Solar Distributors, Inc. | 87 |
| SunPower Corporation | 64 |
| Chevron Energy Solutions | 47 |
| Team-Solar, Inc. | 30 |
| Rosendin Electric Inc. | 30 |
| SPG Solar, Inc. | 26 |
| Stellar Energy GP, Inc. | 22 |
| REC Solar, Inc. | 22 |
| PFMG Construction, Ltd. | 20 |
| Conergy Projects, Inc. | 18 |
| BAP Power Corporation | 17 |
| Real Goods Energy Tech, Inc. | 16 |
| Johnson Controls | 15 |
| 1st Light Energy, Inc. | 15 |
| Borrego Solar Systems, Inc. | 14 |
| JKB Energy | 12 |
| The Solar Company | 11 |
| Premier Power Renewable Energy, Inc. | 11 |
| PermaCity Construction Corp. | 11 |
| BP Solar International, Inc. | 11 |
| Sun Edison LLC | 10 |
| Sullivan Solar Power | 10 |
| Solar Monkey | 10 |
| Chico Electric | 10 |
Table 4.
Descriptive statistics for the variables.
| Annual Average Irradiation | Annual Average Temperature | Number of Modules | Total Cost | Capacity | Electricity Generation | |
|---|---|---|---|---|---|---|
| Unit: | kWh/m2/day | °C | No. | thousand$ | kW | MWh |
| Mean | 5.30 | 17.70 | 1041.06 | 1381.89 | 215.15 | 402.98 |
| S.D. | 0.32 | 3.61 | 1274.62 | 1657.84 | 266.41 | 505.75 |
| Min | 4.31 | 7.18 | 8.00 | 14.40 | 1.33 | 2.58 |
| Max | 5.93 | 24.86 | 9999.00 | 12,243.50 | 1523.26 | 2721.90 |
| 25th Quartile | 5.09 | 15.74 | 216.50 | 283.46 | 43.45 | 81.54 |
| 75th Quartile | 5.51 | 19.00 | 1392.00 | 1798.46 | 275.57 | 535.77 |
Table 5.
Efficiency scores of solar installers.
| Installer | No. of Systems | Mean | S.D. | Min | Max | 25th | Median | 75th |
|---|---|---|---|---|---|---|---|---|
| Installers of 1 system | 106 | 0.574 | 0.139 | 0.252 | 1.000 | 0.471 | 0.540 | 0.591 |
| Installers of 2 systems | 76 | 0.569 | 0.126 | 0.309 | 1.000 | 0.451 | 0.537 | 0.607 |
| Installers of 3 systems | 48 | 0.578 | 0.154 | 0.323 | 1.000 | 0.480 | 0.547 | 0.623 |
| Installers of 4 systems | 36 | 0.570 | 0.152 | 0.326 | 1.000 | 0.451 | 0.555 | 0.609 |
| Installers of 5–9 systems | 114 | 0.593 | 0.163 | 0.339 | 1.000 | 0.475 | 0.564 | 0.646 |
| Installers of ≥10 systems | 655 | 0.578 | 0.174 | 0.153 | 1.000 | 0.479 | 0.557 | 0.659 |
| All installers | 1035 | 0.578 | 0.165 | 0.153 | 1.000 | 0.474 | 0.553 | 0.646 |
Table 6.
Comparison of large installers and small installers.
| Large Installers | Small Installers | Difference (Test Statistics) | ||
|---|---|---|---|---|
| Classification based on all CSI systems | ||||
| Mean | 0.585 | 0.574 | 0.012 | (1.135) |
| Median | 0.565 | 0.557 | 0.008 | (0.917) |
| No. of observations | 561 | 80 | ||
| Classification based on all CSI systems with aggregation at installer level | ||||
| Mean | 0.567 | 0.547 | 0.020 | (0.919) |
| Median | 0.548 | 0.539 | 0.009 | (1.498) |
| No. of observations | 53 | 54 | ||
| Classification based on all CSI commercial systems | ||||
| Mean | 0.587 | 0.580 | 0.007 | (1.474) |
| Median | 0.569 | 0.551 | 0.018 | (1.222) |
| No. of observations | 665 | 89 | ||
| Classification based on all CSI commercial systems with aggregation at installer level | ||||
| Mean | 0.587 | 0.570 | 0.017 | (1.647) |
| Median | 0.576 | 0.565 | 0.011 | (0.919) |
| No. of observations | 53 | 54 | ||
The classification of large and small installers is based on either the number of all installations or the number of commercial installations. The mean comparison is based on t-test and median comparison is based on Wilcoxon rank-sum test.
Table 7.
Efficiency scores of large installers.
| Installer name | Mean | S.D. | Min | Max | 25th | Median | 75th | Installations |
|---|---|---|---|---|---|---|---|---|
| SolarCity | 0.494 | 0.117 | 0.227 | 1.000 | 0.436 | 0.470 | 0.559 | 116 |
| Solar Distributors, Inc. | 0.611 | 0.137 | 0.374 | 1.000 | 0.533 | 0.579 | 0.650 | 87 |
| SunPower Corporation | 0.663 | 0.173 | 0.278 | 1.000 | 0.577 | 0.634 | 0.702 | 64 |
| Chevron Energy Solutions | 0.508 | 0.298 | 0.153 | 1.000 | 0.287 | 0.440 | 0.947 | 47 |
| Team-Solar, Inc. | 0.597 | 0.142 | 0.263 | 1.000 | 0.555 | 0.580 | 0.646 | 30 |
| SPG Solar, Inc. | 0.723 | 0.209 | 0.403 | 1.000 | 0.553 | 0.697 | 1.000 | 26 |
| REC Solar, Inc. | 0.570 | 0.130 | 0.360 | 0.846 | 0.521 | 0.556 | 0.634 | 22 |
| Real Goods Solar | 0.506 | 0.189 | 0.305 | 1.000 | 0.354 | 0.463 | 0.608 | 16 |
| 1st Light Energy Inc | 0.668 | 0.199 | 0.328 | 1.000 | 0.555 | 0.598 | 0.776 | 15 |
| Borrego Solar Systems, Inc. | 0.575 | 0.101 | 0.475 | 0.800 | 0.518 | 0.535 | 0.647 | 14 |
| The Solar Company | 0.640 | 0.191 | 0.475 | 1.000 | 0.499 | 0.567 | 0.674 | 11 |
| Premier Power Renewable Energy | 0.557 | 0.164 | 0.325 | 0.877 | 0.448 | 0.517 | 0.653 | 11 |
| PermaCity Construction Corp. | 0.601 | 0.180 | 0.389 | 1.000 | 0.449 | 0.573 | 0.721 | 11 |
| Sullivan Solar Power | 0.673 | 0.162 | 0.496 | 1.000 | 0.543 | 0.667 | 0.760 | 10 |
Table 8.
Geographic diversification and installation performance.
| Correlation Coefficient (p-Value) | ||
|---|---|---|
| Large installers | −0.076 | (0.028) |
| Small installers | −0.143 | (0.032) |
| All installers | −0.086 | (0.021) |
Table 9.
Vertically integrated installations vs. independent installations.
| Installer Name | Vertically Integrated PV Systems | Independent PV Systems | ||
|---|---|---|---|---|
| No. | Mean Efficiency | No. | Mean Efficiency | |
| SunPower Corporation | 61 | 0.665 | 3 | 0.618 |
| REC Solar, Inc. | 8 | 0.604 | 14 | 0.550 |
| Conergy Projects, Inc. | 8 | 0.740 | 10 | 0.562 |
| BP Solar International, Inc. | 11 | 0.526 | 0 | N/A |
| Adema Technologies | 1 | 0.674 | 0 | N/A |
| Overall | 89 | 0.643 | 27 | 0.562 |
| Mean test | t-statistic (p-value) | |||
| Vertically integrated (excluding BP) vs. Independent (27) | 2.360 (0.0201) | |||
| Vertically integrated (excluding BP) vs. Independent (946) | 5.925 (0.0000) | |||
Table 10.
PV installations by module manufacturers.
| Manufacturer Name | No. of PV Systems | Mean Efficiency |
|---|---|---|
| SunPower Corporation | 210 | 0.541 |
| Installed by SunPower | 61 | 0.665 |
| Installed by other firms | 149 | 0.491 |
| Yingli Energy | 112 | 0.511 |
| Trina Solar | 103 | 0.591 |
| Suntech Power | 86 | 0.595 |
| Sharp | 83 | 0.469 |
| Overall | 594 | 0.542 |
| Mean test | t-statistic (p-value) | |
| Vertically integrated SunPower modules vs. independent SunPower modules | 7.355 (0.000) | |
© 2017 by the author. Licensee MDPI, Basel, Switzerland. This article is an open access article distributed under the terms and conditions of the Creative Commons Attribution (CC BY) license (http://creativecommons.org/licenses/by/4.0/).
Share and Cite
MDPI and ACS Style
Wang, D. Benchmarking the Performance of Solar Installers and Rooftop Photovoltaic Installations in California. Sustainability 2017, 9, 1403. https://doi.org/10.3390/su9081403
AMA Style
Wang D. Benchmarking the Performance of Solar Installers and Rooftop Photovoltaic Installations in California. Sustainability. 2017; 9(8):1403. https://doi.org/10.3390/su9081403
Chicago/Turabian StyleWang, Dadi. 2017. "Benchmarking the Performance of Solar Installers and Rooftop Photovoltaic Installations in California" Sustainability 9, no. 8: 1403. https://doi.org/10.3390/su9081403
Note that from the first issue of 2016, this journal uses article numbers instead of page numbers. See further details here.