Development of an Evaluation System for Sustaining Reservoir Functions—A Case Study of Shiwen Reservoir in Taiwan

Department of Civil Engineering, National Chung Hsing University, Taichung City 402, Taiwan
*
Author to whom correspondence should be addressed.
Sustainability 2017, 9(8), 1387; https://doi.org/10.3390/su9081387
Submission received: 5 July 2017
/
Revised: 3 August 2017
/
Accepted: 4 August 2017
/
Published: 7 August 2017
(This article belongs to the Section Sustainable Engineering and Science)
Abstract
:Reservoirs serve as important facilities, providing a stable source of public water in Taiwan. As construction of new reservoirs becomes more difficult, it is essential to ensure sustainable functionality of reservoirs in the future. To this end, this study proposes a system for reservoir sustainability evaluation. The evaluation system consists of social justice, environmental protection, and economic development containing 12 indicators which are grouped into six categories: flood control, sediment management, water resources allocation, river ecology, water quality, and benefit and fairness. Moreover, evaluation system operational procedures to supplement planning and decision-making processes are proposed, and applied in a case study of the Shiwen reservoir planning in Taiwan. The planned reservoir in this case study is rated as “Good”, nearly “Excellent”, in sustainability as evaluated with the Sustainability Confidence Index (SCI). Additionally, Analytic Network Process (ANP) results indicate that the flood control capacity and sediment management are the first and second most important indicators for the reservoir. If desilting operations had been conducted, the SCI values would have increased from 3.3 to 3.7, warranting an “Excellent” rating for the reservoir. The case study demonstrates that decision-makers can apply the proposed system when managing reservoir evaluations.
1. Introduction
In general, human activities subsequently lead to many environmental impacts on biodiversity, ecosystem functioning, and water cycle conservation efforts [1], yet reservoirs comprise an effective water infrastructure for integrated water resources development and management [2,3,4]. Changes in the natural environment are thus an inevitable consequence of reservoir construction and operation. Sustainability is one popular concept delineated in Deciding the Future of Dams and Research [5]. For a sustainable approach to reservoirs, a sediment management plan is necessary [6]. Recently, numerous studies have indicated that Integrated Water Resources Management (IWRM) should consider and seek a precautionary approach to manage aquatic habitats [1,7,8,9,10] as well as sedimentation and flood controls. Reservoir sedimentation reduces the demand of a reservoir and can be mitigated by actions such as sediment bypassing, sediment sluicing, or sediment flushing to avoid sediment accumulation [11]. Flood potential is a significant parameter when considering the tradeoff between flood control and conservation for sustaining reservoir functions in integrated water resources development [3]. Concerning water resources management, as sediment accumulation and potential flood problems not only decrease a reservoir’s demand but also influence riverine ecosystems [1,7,8,9,10,12] (e.g., fish habitats and downstream water quality), an effective evaluation system for sustaining multi-objective reservoir functions is essential to integrate water resources development and management. Accordingly, there are many factors which influence the functions of a reservoir, such as flood, sedimentation, water quality, and surrounding habitats [4,11,13,14]. Those factors with additional indices should be considered as multiple indicators for sustainable reservoir management.
1.1. Flood Control Indicator
Flood control systems include the reservoir itself and its downstream river channel, the primary purpose of which is to reduce flood flow due to considerations for the safety of both the reservoir and river channel [15]. Geng et al. [16] used flood control capability indicators to perform assessments that included a river level regulating index and flood control capability rate of change indices. Hsieh [17] integrated current flood status data with a wetness index to create a flood early warning index featuring signal lights, called the flood alert indicator (FAI). Recently, Chen [18] included minimum and maximum reservoir water levels of flood control for multiple objective operations. Some studies on flood control operations take into account inflow, non-damaging discharge, and flood peak [19,20], while other studies on flood control capability assessment mostly focus on reservoir safety and river flood flow standards. Scarrott et al. [21], Montaldo et al. [22], and Gioia [23] used reservoir routing approach in flood control.
1.2. Sediment Management Indicator
In sediment management, however, the service life of a dammed reservoir and downstream fish habitat quality is highly influenced by sedimentation [24]. Numerous indicators have been used for basin-wide sediment management—a management concept that involves reducing sediment yield in the upper catchment areas, enhancing in-stream sediment transport capacity, and desilting reservoir sediment. A drawdown ratio defined by Atkinson [25] has been used as an indicator to evaluate the elevation of river outlets or desilting outlets (including flushing, sluicing, and bypassing) in Japan. Graf et al. [26] employed a mean annual sedimentation rate as an indicator to investigate and analyze life spans of reservoirs across the United States, and then graded reservoir sedimentation states according to a five-level rating scheme based upon annual loss of reservoir capacity.
1.3. Water Resources Allocation Indicator
Water resource management concentrates on social and economic benefits and equality as well as on maintaining the ecosystem sustainability [27,28]. Water resource allocation is a key function of reservoirs. Many indicators for stress, allocation, or water resource shortage are currently used to evaluate the possibility of water shortage [2,29,30]. The shortage index (SI) is one of the established water shortage indices [2,29,30] that reflects the state of water resource allocation. Water shortage level results can then be used to revise water resource allocation strategies. In 2004, the Taiwan Water Resources Agency [31] established a three-level water supply stability indicator to evaluate water resource allocation. Huang and Chou [32] proposed regulations for adjusting water resource allocation based on Shihmen Reservoir’s operational rule curves, and further established a drought index for reservoir storage in Taiwan. Zeng et al. [2] applied SI to verify the effectiveness of the proposed water transfer triggering mechanism for multi-reservoir operation performances. Tseng et al. [29] used SI to evaluate drought events and their possible impacts to the water resources system of the Tsengwen Reservoir of Taiwan. Lian et al. [30] applied SI for optimal Danjiangkou Reservoir operations in China. For domestic water use purposes, reservoir water quality is the most important part of sustaining water supply functionality, and is the topic of many studies producing various related indicators such as the water quality index (WQI) for reservoir operations and evaluations [12,33,34]. Moreover, water quality is one popular ecological indicator in sustainable development [35].
1.4. River Ecological Indicator
For river ecology conservation, adequate reservoir flow release is necessary to mitigate adverse effects on aquatic organisms’ natural habitats caused by changes in downstream flow. Riverine ecosystem protection needs to maintain natural flow and sediment regimes downstream from dams [36]. This is needed to integrate environmental flows into multi-objective reservoir management [9]. Only recently have river ecosystems, including fish habitats and environmental flows, been considered in reservoir operations [18], though the valuable insights of stream habitat ecological modeling and assessment have been widely identified in previous studies [37,38,39]. Recently, numerous studies applying the IWRM concept have incorporated precautionary measures for aquatic habitats [1,7,8,9,10]. For such aquatic habitat studies, ecological flows can be determined using statistical methods, such as the Indicators of Hydrologic Alteration (IHA) method [9]. Xu et al. [15] used an eco-friendly reservoir operating rule for restoring a fish migration passage into their reservoir operating rules. To manage reservoir-related fish habitat issues, river habitat models can be employed to simulate changes in river flow and habitat availability under various flow scenarios. As such, weighted usable area (WUA) indices have been widely applied in habitat assessments including reservoir operations [33,38,39,40,41,42,43]. Nikghalb et al. [44] determined ecological flow using WUA, and compared these results with Q95 results. Aguilar and Polo [45] tried using various approaches to determine minimum environmental flow values including using WUA with various flows. Similar to the studies of Li et al. [40], Pasha et al. [41], Yao et al. [42], and Xu et al. [15], this study used WUA as an indicator with Q95 to represent the ecological condition of the study reservoir. However, in Taiwan, the concept of a minimum discharge required by fish has been reformulated into a relation between volume and habitat [46]. A WUA compatible with the living requirements of fish within the research area is then calculated.
1.5. Gini Coefficient
Equity, stability, and economic efficiency are key components in decision- and policymaking for sustainable development [28]. The Gini coefficient is a ratio of difference of ideal equity and real uses [47]. The coefficient can be one of the effective indices employed to explore equity in water allocation strategies [28]. The Gini coefficient here was calculated based on research on the fairness of water allocation in South Africa [48], future changes on water discharge in the coming 30 years (e.g., Masaki et al. [49]), and the inequality in water supply and demand from 1999 to 2006 in the Yellow River basin (e.g., Wang et al. [50]). Wang et al. [50] used the Gini coefficient in assessing equity in domestic water supply. Masaki et al. [49] used the Gini and Lorenz-asymmetry coefficients to evaluate the characteristics and applicability in river flow regimes under future climate change. Rajah et al. [51] applied a Gini index to evaluate the precipitation distributions for wet-day frequency and decreasing wet-day frequency. Peipoch et al. [52] applied the Gini coefficient to evaluate the effects of ecological simplification on flow variability. Hu et al. [28] used the Gini coefficient to find equity in the water allocation strategies in a river basin. Golusin and Ivanović [35] used the Gini coefficient, water quality, and water supply as indicators for Southeastern Europe countries.
1.6. Sustainable Indicators
Numerous researchers in various fields of expertise have established several indicators to determine the sustainability of a planned multipurpose reservoir. To analyze water supply, Xu et al. [53] defined a system dynamic model using a set of sustainability confidence indices (SCI) to evaluate the level of sustainability according to water supply and consumption of various water resource systems along the Yellow River in China. Huang [54] studied the application of SCI when conducting sustainability evaluations of important reservoir catchment areas in Taiwan. Chen et al. [55] also established a set of combined indicators for dam safety, reservoir management, water ecological system stability, reservoir benefits, and reservoir sustainability to assess the level of sustainable reservoir development. Petersson [56] investigated reservoir and dam sustainability issues and used changes in flow to rate reservoir and dam sustainability levels. Kumambala et al. [57] proposed the use of a hydrologic indicator, a human health indicator, and an environment indicator for water resource utilization in Malawi. Chu et al. [58] studied the impact on overall reservoir performance according to changes in the characteristics of local ecology, water quality, hydrology, and habitat environment. Recent attempts to solve the abovementioned environmental problems [12] and maintain reservoir functionality (i.e., power generation, flood control, habitat protection, water allocation, water quality, and sediment control) include using multi-objective reservoir operation modeling where water utilization and flood control targets are constrained by ecological flow or water quality.
Proposed SCI indicators in the reviewed literature have only been used for single purpose analyses such as water quality, water quantity, and flooding or sediment control. A multi-objective reservoir evaluation, however, could be used to solve environmental and ecological problems while ensuring the sustainable functions of reservoirs [11,12,18,41]. The main focus of this study is to incorporate sustainability concepts when making planning considerations and during operations of multi-purpose reservoirs with the aim of improving reservoir sustainability for reservoirs in Taiwan. Since sustainability concepts apply to the environment, economy, and society, it is therefore necessary to establish a multi-factor indicator-based evaluation system to determine reservoir sustainability levels. For Taiwan reservoir management, this study proposes an indicator system that includes calculations and standardizations employed for each indicator, weighting factors for each indicator, integrated indicator analysis, and a reservoir sustainability assessment. The proposed system was applied in a case study to demonstrate its functional application for sediment management in the reservoir planning process.
2. Materials and Methods
In order to identify indicators, 19 experts and scholars within hydraulic engineering, hydrology, and ecohydrology fields discussed 12 indicators from three different perspectives, including that of academia, non-governmental organizations, and government authorities in Taiwan (i.e., Water Resources Planning Institute, Water Resources Agency, Ministry of Economic Affairs [59]) (Table S1 in Supplementary Material), by way of research projects (i.e., Water Resources Planning Institute, Water Resources Agency, Ministry of Economic Affairs [60,61]) and a case study using a national reservoir calculus (i.e., Water Resources Planning Institute, Water Resources Agency, Ministry of Economic Affairs [62]). With the indicators and their restrictions defined, index calculations, rating schemes, and other operational procedures were integrated to formulate a reservoir SCI system. The evaluation system framework (Figure 1) incorporates “sustainable management” concepts within the planning processes so that newly constructed reservoirs can meet sustainability requirements. To evaluate the sustainability of existing reservoirs and, if necessary, to facilitate improvements so as to enhance their sustainability, the system consists of 12 indicators in six categories related to social justice, environmental protection, and economic development. The code I11 could be considered as intergenerational equity. This study considered the code by benefit sharing.
2.1. Indicators for Reservoir Function Evaluation
Indicators for assessing reservoir function were grouped into six categories. Index assessments and standards must also be considered in addition to establishing analytical tools, since each index requires extensive computational and analytical work and too many indicators increase the system complexity and user accessibility. Therefore, this study selected a total of 12 indicators from published literature, taking into consideration Taiwan’s unique hydrological and geological conditions as well as the specifications of indicator applicability. The following sections further describe the indicators listed in Table 1.
2.1.1. Flood Control Capability (Code: C1)
The flood control system includes the reservoir itself and downstream river channels, the primary purpose of which is to reduce flood flow for reservoir and river channel safety. The indicators selected for this category are a flood reduction ratio (code: I1) and a safe flood flow ratio (I2). The former is defined as the ratio of peak inflow reduction (Qpi − Qpo) to peak inflow (Qpi), while the latter is defined as the ratio of peak outflow from the reservoir (Qpo) to the designed maximum flow of the downstream river channel (Qr). The indicator I1 represents the reservoir’s flood reduction capability. The higher the I1 value, the better the flood reduction capability of the reservoir. However, since reservoir functions include water supply, I1 is subject to a number of restrictions as well. Qr indicates whether downstream river channels have the capacity needed to accommodate peak outflow from the reservoir. Hence, a smaller I2 suggests a decreased potential of disastrous downstream flooding.
2.1.2. Sediment Management (C2)
Two indicators selected for this category are the effective reservoir capacity ratio (I3) and the adequacy of sediment supply to downstream and coastal areas (I4). The indicator I3 is defined as the ratio of effective reservoir capacity at a specific point in time to the capacity at the time of its completion (or renovation). Effective reservoir capacity at a given time is equal to the initial effective reservoir capacity (V0) minus the volume of sediment (Vs) accumulated from years before. The indicator I4 is defined as the ratio of annual sediment supply to downstream areas after completion of the reservoir (Qd) to the annual sediment supply prior to completion (Qs). Qs can be acquired from historical data, while Qd can be estimated by simulation or determined as the reservoir becomes operational.
Changes in I3 reflect the effects of desilting and sedimentation, and therefore can be used as a basis to decide whether to take desilting or soil conservation measures in upper catchment areas. The indicator I4 reflects the downstream river channel and coastal area, as well as river ecology, and protection needs, and therefore can be used as a basis for adjusting reservoir desilting efforts.
2.1.3. Water Resource Allocation (C3)
The water supply ratio and the water allocation ratio which are included in water resource allocation (C3) were simulated and analyzed based on annual records of daily water supply and demand, and have been set by the reliability standard frequently adopted in Taiwan (SI = 1.0 was adopted in the cases in this research). Therefore, no further descriptions were considered or calculations were performed regarding this index. The indicators selected for this category are water supply stability (I5) and adequacy of water resource allocation (I6). The indicator I5 is defined as the ratio of the amount of water the reservoir actually supplied (SA) to the planned water supply (S), and is used to determine whether the reservoir is capable of providing the planned water supply. The indicator I6 is defined as the ratio of actual water allocated to various targets (SA) or planned water supply (S) to the corresponding demand of the targets (D). It is used to evaluate the adequacy of water allocation, and to determine if the reservoir must adjust its water supply to various targets. For reservoirs currently in planning phases, the SA value is obtained by simulating reservoir operations to obtain a planned water supply value versus the actual supply. In terms of stability or adequacy, any water resource supplied that exceeds demand is considered poor water resource allocation.
2.1.4. River Ecology (C4)
This study selected an ecological base flow ratio (I7) and a measurement of change in river habitat area (I8) as the two indicators for the conservation of river ecology. The indicator I7 is defined as the ratio of the ecological base flow released from the reservoir (Qsb) to the dry season flow with a 95% probability of exceedance (Q95). It is used to evaluate the effects of the base flow on downstream ecology and to act as a reference to determine if discharge adjustments are needed during the dry season. The indicator I8 is defined as the percentage of change in WUA before and after reservoir construction. It is used to assess whether the reservoir discharge meets ecological requirements, and as a reference when reviewing river ecology conservation plans.
The WUA represents the equivalent area suitable for the survival of indicator organisms, and can be calculated using the following equation:
in which, F[…] is the combined suitability index of habitat mesh i and is used as the weighting factor; f(Vi), f(Di), and f(di) are, respectively, the suitability indices of flow velocity Vi, water depth Di, and bed sediment particle size di of mesh i; Ai is the habitat area of mesh i; and n represents the total number of meshes in the habitat. The suitability index can be obtained from the habitat suitability curve [63].
2.1.5. Water Quality (C5)
Good water quality is a key factor for ensuring reservoir sustainability. Reservoir water quality directly affects water purification and treatment costs, drinking water quality, and public hygiene. Water quality maintenance indicators can be divided into two types. The first type, used to assess the degree of water body pollution, includes a river pollution index (RPI) and a water quality index (WQI). The second type, used to assess the degree of eutrophication in a reservoir water body, is the total phosphorus (TP) under normal conditions.
RPI is composed of the four parameters Dissolved Oxygen (DO), Biochemical Oxygen Demand (BOD), Suspended Solids (SS), and Ammoniacal Nitrogen (NH3-N), and graded according to their concentrations. WQI includes the seven parameters DO, BOD, pH, NH3-N, E. coli colonies, SS, and TP, which are collectively referred to as WQI7. WQI7 is calculated using the following equation [64]:
in which, wi is the weighting factor of each water quality parameter, based on the outcomes of expert surveys [64]; qi are the grades of each water quality parameter, and can be obtained through model simulations or on-site surveys.
In this study, WQI7 and TP are selected for a water body pollution indicator (I9) and for a eutrophication indicator (I10), respectively. I9 can be calculated upon obtaining the seven water quality parameters included in WQI7. Results are then used to categorize the water quality and as a reference for assessing water body pollution status. For the indicator I10, the TP concentration can be obtained from field survey or from a Vollenweider model [65] simulation. Parameters required of this model include the total volume of water in reservoir inflow of TP, settling rate of TP, area of inundation, and outflow velocity.
2.1.6. Benefit and Fairness (C6)
As mentioned earlier, the sustainable development concept requires satisfying the needs of the present generation without threatening the needs of future generations [66]. Considering that the main objective of this research is to understand and analyze the future economic benefit of water and the reduction of actual water supply, “benefit” and “fairness” were taken as indices to demonstrate how the indices change over time from the present to future, and to further estimate and detect variances between time periods that will affect future generations [50,66]. Hence, reservoir planning or renovation must consider the issue of water supply benefits and fairness. Indicators for benefits and fairness include cost-benefit ratios, economic benefits, benefit indices, Gini coefficients, a fairness index, and public acceptance. The Gini coefficient is the ratio of area A to the sum of area B and area A [28], and can be used for water allocation equity [28]. In this study, industrial revenue derived from water will change over time, and shortages of water supply will worsen. Since the two evaluation results (e.g., benefit and fairness) are both categorized as changes affecting generations, both are considered to be in the same category [50,66].
After considering data accessibility and indicator representativeness, this study selected the mean annual production value per unit water use (GWRi) as a benefit indicator (I11) and the Gini coefficient (Gini) as a fairness indicator (I12). In other words, I11 = while I12 = Gini. GWRi is calculated by using the following equation:
In the equation above, GWti is the production value per unit water use (NT$/m3) in the year ti; T is the time interval (five years); i is the index of year census taken; GWRi is the mean annual change of GWti within the interval of T years. Hence, ΣGWRi/n is the mean over the total number of n intervals.
The Gini coefficient is defined by the following equation [48]:
in which, Xi is the dimensionless cumulated time, Yi is the dimensionless cumulated volume of water supplied, i = 1, 2, …, n, with n as the total number of time segments. As shown in Figure 2, is equal to the increase in the dimensionless water supply volume from the time Xi−1 to Xi. Hence, the second part on the right side of Equation (4) becomes . If , then Gini = 0. Under such conditions, the Yi = f(Xi) curve shown in Figure 2 coincides with the 45°-line, and all the increments ΔYi are the same for each equal segment of ΔXi. This is why the 45°-line is referred to as the line of equality or complete fairness. The larger the deviation of the Yi = f(Xi) curve from the 45°-line, the less fairness. Hence, the area A in Figure 2 between the curve and the 45°-line represents the degree of inequality. The curve represents real water allocation [52]. Therefore, the area A (dark color) represent differences between the perfect water allocation and real water allocation during various cumulated time periods. In the worst case of extreme inequality, the Yi = f(Xi) curve goes along the horizontal axis and suddenly rises to 1 at Xi = 1.
The equity of water allocation can be calculated by the equitable sharing of the used water quantity for economic benefits [28]. Evaluation outcomes of the benefit and fairness indicators could be used to assess current and future water supply situations. When poor benefit or fairness is observed, managerial actions to improve the situation can be taken.
2.2. Planning Support and Decision-Making Analysis
2.2.1. Reservoir Sustainability Rating
Literature points to isometric rating schemes, which are used to identify the relative levels of different indicators as the most used evaluation indicators. In this study, each indicator is rated by using a four-level scheme of Excellent, Good, Fair, and Poor with index scores (Si) of 4, 3, 2, and 1, respectively. This scheme helps resolve difficulties posed by differences in index units or values when calculating overall assessment ratings. Table 2 lists the ranges of index values, corresponding levels, and scores of the indicators selected in this study. The indicator ranges in Table 2 (upper and lower limit) were taken from relevant published literature, and further revised in this study for the national reservoir planning case study (i.e., Water Resources Planning Institute, Water Resources Agency, Ministry of Economic Affairs [67]) (Table S2 in Supplementary Material).
For flood control capability, I1 represents the reservoir’s flood reduction capacity. Hence, I1 30% is regarded as Excellent, indicating that the reservoir can perform robust flood reduction functions; I1 = 21~30% is rated as Good, meaning that the reservoir is still capable of providing good flood reduction; I1 = 11~20% is rated as Fair, meaning that the reservoir may be losing its capability to provide adequate flood reduction; I1 10% is rated as Poor, indicating that the reservoir is losing its flood reduction capability. Rating schemes for the other indicators follow the same principle.
To assess the overall reservoir sustainability, each indicator weighting factor was analyzed with the analytic network process (ANP) (i.e., Water Resources Planning Institute, Water Resources Agency, Ministry of Economic Affairs [68]). ANP survey questionnaires were distributed to three groups of experts in academic institutions, non-governmental organizations (NGOs), and public agencies with hydrology, hydraulic engineering, and ecohydrology backgrounds. The weighting factor for each category of indicators was then determined by averaging the returned questionnaire responses (Section S3 in Supplementary Material). To simplify the ANP surveys, the two indicators in each category were given the same weighting. Table 3 lists the weighting factors of the 12 indicators (δi, i = 1, 2, …, 12).
The sum of the 12 weighting factors Σδi is equal to 1. For the sustainability evaluation, index scores of each indicator are multiplied by their corresponding weighting factor and then summed. Since the sums range from 1 to 4, the sustainability rating was divided into four levels with index scores as shown in Table 4. Reservoirs rated as “Excellent” are in very good condition with high sustainability, and should be monitored for any change in their sustainability; reservoirs rated as “Good” are considered sustainable with some indices degrading, and measures should be taken to upgrade them; reservoirs rated as “Average” are those with deteriorating sustainability, and in-depth investigations should be carried out to formulate improvement strategies; those rated as “Poor” should undergo drastic improvements to restore their sustainability.
2.2.2. Application of Indicators in Planning
Operational procedures for applying evaluation indicators in reservoir planning is shown in Figure 3. Required data are first collected while compatible models are established for each of the indicators. ANP is adopted as the tool for decision analysis in Figure 3. The collected data and models were then used to compute indices while index scores (Si) and weighting factors were obtained from Table 2 and Table 3 (δi), respectively. Finally, the total score of reservoir sustainability was calculated as Σ(δiSi) which is the sustainability confidence index (SCI = Σ(Si) × (δi)). To evaluate changes in reservoir sustainability due to environmental, economic, or social factors, analyses are carried out to identify key factors affecting the reservoir’s sustainability (such as flood control, desilting, or water quality). Following this, relevant indices and weighting factors are revised, and sustainability is re-evaluated accordingly.
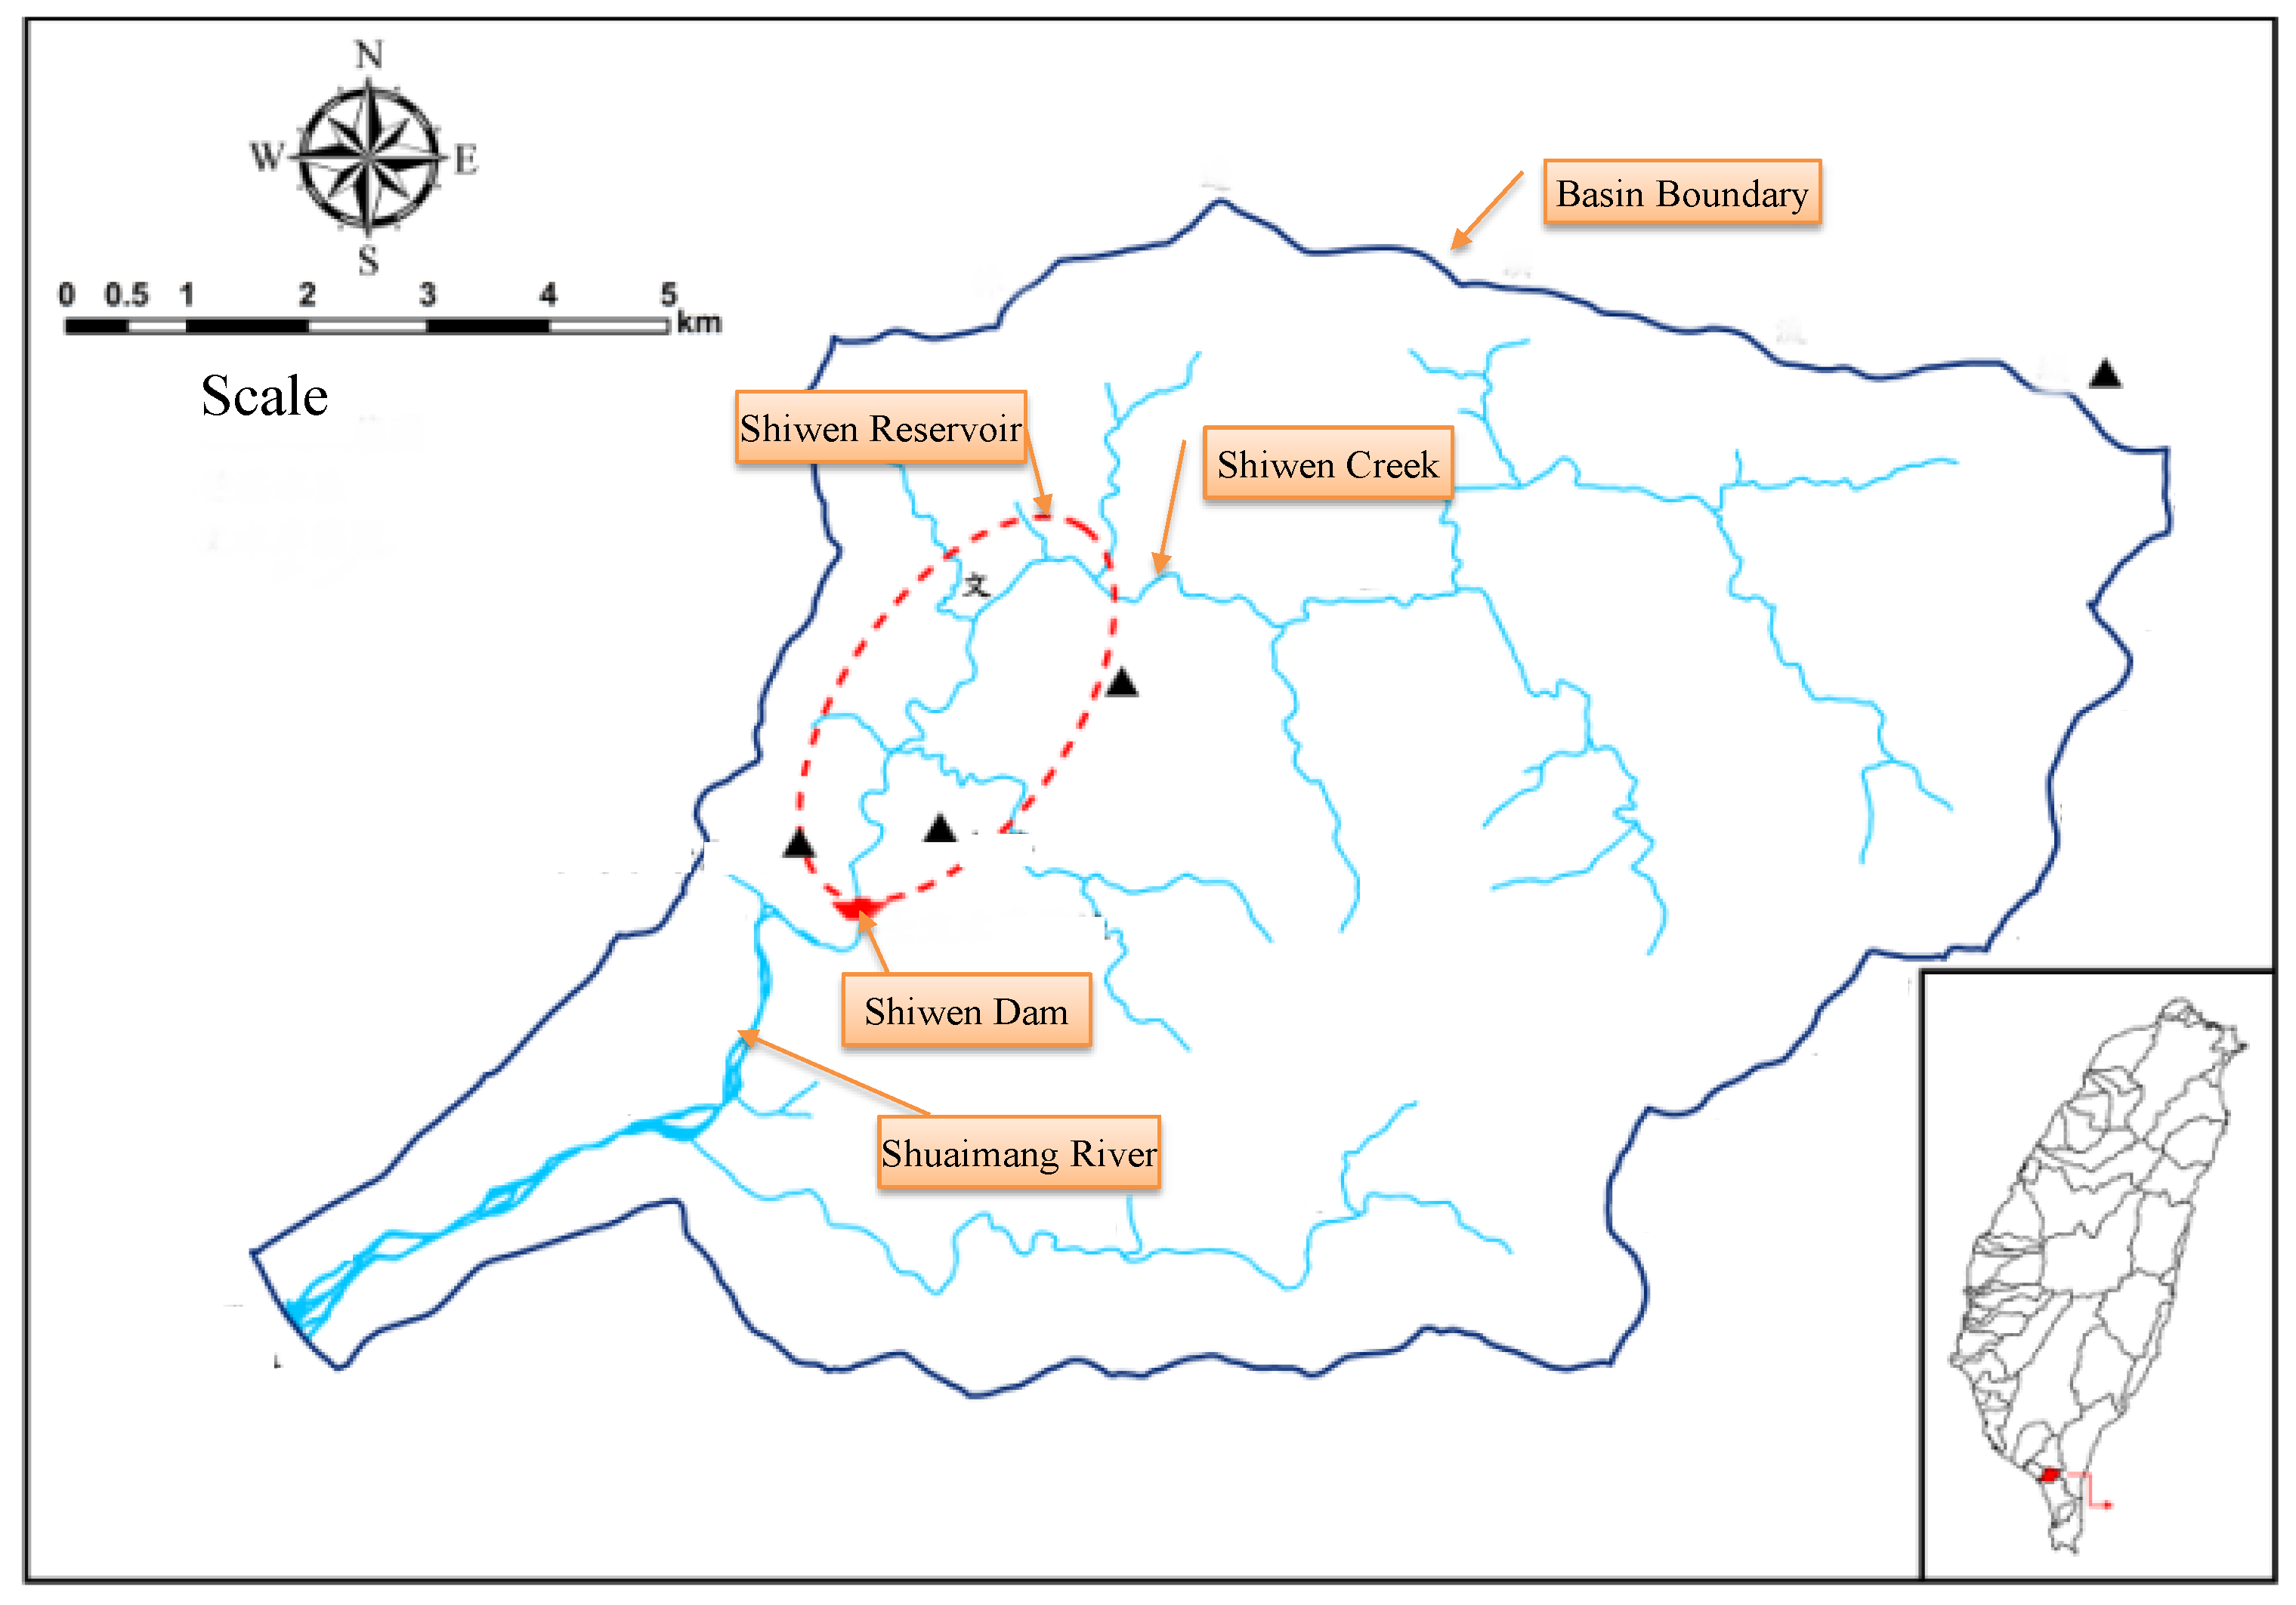
2.3. Study Area
This study selected the Shiwen Reservoir, currently in its planning phase, to demonstrate an application of the proposed evaluation system. The following section will briefly describe the background of the reservoir, calculation and analysis procedures of each index (Si & δi), and evaluation of the sustainability confidence index (SCI) where SCI = Σ(Si) × (δi). Details are available in relevant reports [67] (Tables S4–S6 in Supplementary Material). Shiwen Creek, in Taiwan’s Pingtung County, is the site of the Shiwen Reservoir, as shown in Figure 4. The reservoir has a catchment area of 65.53 km2 and an effective capacity of 65 × 106 m3 and a planned daily water supply of 2 × 10⁵ m3, which satisfies Pingtung area water requirements until the target year (2031). The Shiwen dam projected height is 103 m, with a normal full pool level at elevation (EL). 170 m, a dam crest at EL. 178 m, and a total capacity of 70.13 × 10⁶ m3. Major flood discharge facilities include a spillway and a sluiceway with designed discharges of 1439 m3/s and 947 m3/s, respectively. The spillway has two bays, 21 m wide each, and its crest is at EL. 170 m. The sluiceway has three bays, 4 m in diameter each, and its outlet is located at the bottom of the dam.
3. Results
3.1. Sustainability Analysis
Table 5 lists the calculated results of indices and SCIs. Though marginally rated as “Excellent”, the sum of sustainability confidence indices (ΣSCI) for the case excluding desilting facilities is equal to 3.3, while indices I3 and I4 are rated as “Poor” and “Fair”, respectively. The inclusion of desilting facilities raises indices I3 and I4 to the levels of “Good” and “Excellent”, respectively, and consequently, the ΣSCI increases from 3.3 points to 3.7 points, making Shiwen Reservoir even more sustainable. The index scores and SI rating ranges are converted into a radar chart, shown in Figure 5, to facilitate the planning and decision-making processes. The following describes the results of the analysis for each indicator.
3.2. Flood Control Capability
The simulated peak inflow and outflow for a 100-year return period for the Shiwen Reservoir are 1136 m3/s and 769 m3/s, respectively. Hence, the flood reduction ratio I1 = 32.3% and is rated as “Excellent”. The designed flood flows for a 100-year return period for river channels downstream are 1180 m3/s for Shiwen Creek and 1460 m3/s for Shuaimang River. Therefore, the safe flood flow ratios are 65.2% for Shiwen Creek and 52.7% (=I2) for Shuaimang River. Hence, the Shiwen Reservoir is rated as “Excellent” for its flood control functionality.
3.3. Sediment Management
The effective capacity ratio I3 for the Shiwen Reservoir excluding desilting operations is 49.61% and is rated as “Poor”. When including desilting operations, I3 becomes 80.11% and is rated as “Good”. The index I4 for adequacy of sediment supply to downstream channels and coastal areas is 13.5%, and rated as “Fair” when excluding desilting operations. With desilting operations, I4 becomes 65.25% and is rated as “Excellent”.
3.4. Water Resource Allocation
The simulated mean annual water supply value (70.2 × 10⁶ m3) results in a water supply stability index (I5) of 96.16%, which differs from the “Excellent” rating of the planned estimate value (73.0 × 10⁶ m3). Increased public water consumption in the Pingtung Area by the target year (2031) is projected to exceed the current supply by 87,000 m3/day. Since the Shiwen Reservoir is capable of supplying an additional 120,000 m3/day, the adequacy of the water allocation index is 12/8.7 × 100% = 137.93%. Water resources for agricultural purposes are the priority, and its allocation index is assumed to be 100%. Therefore, the simple mean of the two, (100 + 137.93)/2 = 118.97%, is taken as the overall allocation index (I6) and is rated as “Good”.
3.5. River Ecology
The planned ecology baseflow for Shiwen Reservoir is 0.086 m3/s, while the dry season flow with a 95% probability of exceedance is 0.0336 m3/s. Therefore, the ecological baseflow ratio (I7) is 2.56 and is rated as “Good”. The WUA of downstream river habitats before and after completion of the reservoir are calculated by using a 2D river simulation model and are reduced from 613 m2 during the wet season and 321 m2 during the dry season to 245 m2. The percentage of reduction (I8) ranges from 60% to 23%, with a simple mean of 41.5%, and is rated as “Fair”.
3.6. Water Quality
Sampling stations in the Shiwen Reservoir catchment area collected water quality data. Data analysis shows that index I9 (=WQI7) ranges from 77 to 92, with a simple mean of 87, and is rated as “Excellent”. Vollenweider Model simulation results yield a total phosphorus content (TP) of 4.35 to 15.47 g/L. Average TP of the reservoir water body is 11 g/L. Therefore, the eutrophication index I10 is rated as “Excellent”.
3.7. Benefits and Fairness
The Shiwen Reservoir is expected to be a major source of water for the Pingtung Area. The area’s total industrial and commercial production for 2006 and 2011, as well as the public water supply, provided the basis for calculating unit water use and its effect on production value for these two years. The results are 825 and 1301 $TWD/m3 for unit water use and production effect, respectively. The Directorate-General of Budget, Accounting, and Statistics of the Taiwan Executive Yuan conducts industrial, commercial, and service censuses once every five years, while the Water Resources Agency has compiled annual water use data for each administrative district since 2001. A time step that correlates with the five-year census frequency is used in the first dataset (n = 1) from 2006 with T = 5. The mean annual change in the effect of unit water use on production value is 2 × (1301 − 825)/((1301 + 825) × 5) × 100% = 9%. The benefits index I11 is thus 9.0% and is rated as “Excellent”.
Daily water supply volume estimates of reservoir operations are simulated using 46 years of historical hydrological data from 1962 to 2007 (Table S7 in Supplementary). The simulated results are then used to calculate the cumulated daily water supply ratios (simulated water supply/planned water supply). The yearly minimum water supply ratios are then ranked in ascending order. A normalized cumulative curve is then plotted and compared with the 45-degree line equality curve. The water supply inequality level, which is represented by the area between the two lines, is then calculated. The result obtained is the Gini coefficient, I12 = 0.2, and is rated as “Excellent”.
4. Discussion
In reservoir operations, there is a tendency to increase the maximum water level, and therefore capacity, to meet downstream water demands. Yet, the ability to meet downstream demands is a function of a range of factors including infrastructure, operations, and water supply volume/timing. Increasing maximum water levels does not necessarily increase capacity to meet downstream demands since, in doing so, flood storage capacity is reduced and reservoir flood control functionality is possibly affected, impacting the overall reservoir operations. Moreover, reservoir desilting can lead to excessive turbidity, and result in water supply issues and downstream ecological impacts. Accordingly, integrated reservoir management aims to maximize and maintain reservoir functions such as power generation, flood control, habitat protection, and water allocation, as well as water quality and sediment controls [11,18]. During flooding periods, however, inundation mitigation of downstream areas might counter the natural flow of supply for ecological needs, which is deprioritized to increase upstream flood control [9]. Thus, this study applied an evaluation system for sustaining reservoir functions to a case study in Taiwan by taking into account reservoir desilting and catchment area sediment yield reduction, as well as considering water quantity and quality, habitat protection, and operational benefit and fairness.
Numerous recommendations for using statistical approaches in environmental flow studies have been reported. For example, Morrison et al. [69] used IHA to assess the impacts of environmental flow on reservoir and recreational operations. Nikghalb et al. [44] as well as Alexandre et al. [70] used Q95 to evaluate impacts of flows on movement patterns and habitat. They also determined ecological flow using WUA, and compared these results with Q95 results. Aguilar and Polo [45], Li et al. [40], Pasha et al. [41], Yao et al. [42], and Xu et al. [15] used WUA as an indicator with Q95 to represent the ecological condition of their study reservoir. However, Nikghalb et al. [44] indicated that different criteria are needed to determine the environmental flow requirement from the WUA−discharge relationship. This study used WUA change ratio values to avoid the above issue, but this value should be thoroughly evaluated when used in other applications. For further tests, the IHA change ratio should be included when evaluating the results of WUA and Q95.
As recommended by recent studies in relevant fields [2,3,11,12,18,29,30,38,39,41,42,43], the proposed indicators were established to evaluate environmental, water resource-related, and ecological sustainability in Taiwan, with the exception of fairness which is represented by the benefit index and Gini Coefficient. Therefore, in contrast with recent studies that have evaluated multi-purpose reservoirs, the proposed evaluation system takes the benefit index and Gini coefficient into account to ensure future water supply and reservoir sustainability. Although the Gini coefficient has been applied in the evaluation of the characteristics and applicability in river flow regimes under future climate change, it can also be used to evaluate the distribution of precipitation of wet-day frequency and decreasing wet-day, to assess effects of ecological simplification on flow variability, as well as to find equity in the water allocation strategies in a river basin. Moreover, ANP was used to obtain weighted factors for each proposed indicator to deal with trade-offs within the six categories, namely, flood control, sediment management, water resource allocation, river ecology, water quality, and benefit and fairness. The proposed approach can be universally applied to Taiwan reservoirs if more case studies are conducted using this study’s methodology.
This study applied the proposed evaluation system to a reservoir in its planning phase to achieve the reservoir’s flood control capacity and sediment management aims. The evaluation SCI value for the reservoir in this case study is rated as “Good” and “Excellent” in sustainability. Additionally, the ANP results indicated that the flood control capacity and sediment management are the first and second most important indicators for the reservoir. If desilting operations had been conducted, the SCI values would have increased from 3.3 to 3.7, and a SCI value rated as “Excellent” achieved. However, reservoirs in Taiwan must be equipped with adequate desilting facilities due to the unique hydrological and geological conditions characterized by the rapid rise and recession of flood flow, and the potential for extremely severe landslides in the catchment area. Reservoir sustainability evaluations must consider the fact that environmental, economic, and social factors play an important role in the overall planning of sustainable water resource systems.
5. Conclusions
This study proposed a reservoir evaluation system that includes 12 indicators grouped into six categories of flood control, sediment management, water resource allocation, river ecology, water quality, as well as benefit and fairness. The system was successfully applied in a case study. In this study, a framework, concepts, processes, index calculations, and rating schemes were presented along with a proposed reservoir sustainability evaluation procedure. This procedure could supplement current reservoir planning and decision-making. A four-level scheme of Excellent, Good, Fair, and Poor with index scores of 4, 3, 2, and 1 points, respectively, was established to rate the index obtained for each indicator. This rating scheme can be used to assess reservoir sustainability and for planning revisions if needed. A weighting factor for each evaluation indicator was determined using the ANP method. Index scores of each indicator are multiplied by its weighting factor and then summed to yield the reservoir sustainability confidence index.
Since reservoir sustainability may involve historical and environmental factors, the suitability of its evaluation indicators requires thorough examination. Lack of relevant data, which is often the case, may require additional investigation and analyses. Indicator weighting factors, used for the planning of sustainable reservoirs, may be adjusted, if necessary, given that different reservoirs face varied issues. This study recommends further studies on this issue to be conducted, since the specific indicators for this study may not be generally applicable to all reservoirs in Taiwan. Indicators need to be more soundly justified and tested prior to further applications. Accordingly, feedback on the applications of the proposed system will improve its models. Future work may include an evaluation of the sustainability of all of Taiwan’s reservoirs using the proposed system, so as to a form a decision-making support platform. The proposed procedure may be integrated with a Decision Support System for sustainable reservoir management in further study. It is also suggested that the impact of climate change on reservoir sustainability is investigated to identify any required adjustment plans.
Supplementary Materials
The following are available online at www.mdpi.com/2071-1050/9/8/1387/s1.
Acknowledgments
The authors would like to thank support of Water Resources Planning Institute (WRA-MOEA) of the Republic of China.
Author Contributions
The scope of this study was developed by Chan-Ming Tsai. The first manuscript draft was written by Chan-Ming Tsai was substantially revised by Rong-Song, Chen, and Chan-Ming Tsai.
Conflicts of Interest
The authors declare no conflict of interest.
References
- Saha, A.K.; Setegn, S.G. Ecohydrology for sustainability of iwrm: A tropical/subtropical perspective. In Sustainability of Integrated Water Resources Management; Springer: Cham, Switzerland, 2015; pp. 163–178. [Google Scholar]
- Zeng, X.; Hu, T.S.; Guo, X.N.; Li, X.J. Water transfer triggering mechanism for multi-reservoir operation in inter-basin water transfer-supply project. Water Resour. Manag. 2014, 28, 1293–1308. [Google Scholar] [CrossRef]
- Loucks, D.P.; Van Beek, E. Water Resources Systems Planning and Management: An Introduction to Methods, Models and Applications; UNESCO: Paris, France, 2005. [Google Scholar]
- Liu, P.; Li, L.P.; Guo, S.L.; Xiong, L.H.; Zhang, W.; Zhang, J.W.; Xu, C.Y. Optimal design of seasonal flood limited water levels and its application for the three gorges reservoir. J. Hydrol. 2015, 527, 1045–1053. [Google Scholar] [CrossRef]
- Ho, M.; Lall, U.; Allaire, M.; Devineni, N.; Kwon, H.H.; Pal, I.; Raff, D.; Wegner, D. The future role of dams in the united states of america. Water Resour. Res. 2017, 53, 982–998. [Google Scholar] [CrossRef]
- George, M.W.; Hotchkiss, R.H.; Huffaker, R. Reservoir sustainability and sediment management. J. Water Res. Plan. Manag. 2017, 143, 04016077. [Google Scholar] [CrossRef]
- Saha, A.K.; Setegn, S.G. Ecohydrology: Understanding and maintaining ecosystem services for iwrm. In Sustainability of Integrated Water Resources Management; Springer: Cham, Switerzerland, 2015; pp. 121–145. [Google Scholar]
- Grigg, N.S. Models, data, and monitoring in iwrm. In Integrated Water Resource Management; Springer: London, UK, 2016; pp. 251–264. [Google Scholar]
- Porse, E.C.; Sandoval-Solis, S.; Lane, B.A. Integrating environmental flows into multi-objective reservoir management for a transboundary, water-scarce river basin: Rio grande/bravo. Water Resour. Manag. 2015, 29, 2471–2484. [Google Scholar] [CrossRef]
- Gorenflo, L.; Warner, D.B. Integrating biodiversity conservation and water development: In search of long-term solutions. Wiley Interdiscip. Rev. Water 2016, 3, 301–311. [Google Scholar] [CrossRef]
- Baoligao, B.; Xu, F.R.; Chen, X.R.; Wang, X.Y.; Chen, W.X. Acute impacts of reservoir sediment flushing on fishes in the yellow river. J. Hydro-Environ. Res. 2016, 13, 26–35. [Google Scholar] [CrossRef]
- Xu, X.Y.; Bin, L.L.; Pan, C.Z.; Ding, A.Z.; Chen, D.S. Optimal reoperation of multi-reservoirs for integrated watershed management with multiple benefits. Water 2014, 6, 796–812. [Google Scholar] [CrossRef]
- Munthali, K.G.; Irvine, B.J.; Murayama, Y. Reservoir sedimentation and flood control: Using a geographical information system to estimate sediment yield of the songwe river watershed in malawi. Sustainability 2011, 3, 254–269. [Google Scholar] [CrossRef]
- Gu, Q.; Zhang, Y.; Ma, L.G.; Li, J.D.; Wang, K.; Zheng, K.F.; Zhang, X.B.; Sheng, L. Assessment of reservoir water quality using multivariate statistical techniques: A case study of qiandao lake, china. Sustainability 2016, 8, 243. [Google Scholar] [CrossRef]
- Xu, Z.H.; Yin, X.A.; Sun, T.; Cai, Y.P.; Ding, Y.; Yang, W.; Yang, Z.F. Labyrinths in large reservoirs: An invisible barrier to fish migration and the solution through reservoir operation. Water Resour. Res. 2017, 53, 817–831. [Google Scholar] [CrossRef]
- Geng, L.-H.; Liu, H.; Zhong, H.-P.; Liu, C.-S. Indicators and criteria for evaluation of healthy rivers. J. Hydraul. Eng. 2006, 3, 253–258. [Google Scholar]
- Hsieh, C.L. Flood Early Warning Model in Real-Time Reservoir Operation; National Taiwan Ocean University: Keelung, Taiwan, 2010. [Google Scholar]
- Chen, D.; Chen, Q.W.; Leon, A.S.; Li, R.N. A genetic algorithm parallel strategy for optimizing the operation of reservoir with multiple eco-environmental objectives. Water Resour. Manag. 2016, 30, 2127–2142. [Google Scholar] [CrossRef]
- Connaughton, J.; King, N.; Dong, L.C.; Ji, P.; Lund, J. Comparing simple flood reservoir operation rules. Water 2014, 6, 2717–2731. [Google Scholar] [CrossRef]
- Chou, F.N.F.; Wu, C.W. Stage-wise optimizing operating rules for flood control in a multi-purpose reservoir. J. Hydrol. 2015, 521, 245–260. [Google Scholar] [CrossRef]
- Scarrott, R.M.J.; Reed, D.W.; Bayliss, A.C. Indexing the Attenuation Effect Attributable to Reservoirs and Lakes; Robson, A., Reed, D., Eds.; Centre for Ecology & Hydrology: Wallingford, UK, 1999; pp. 19–26. [Google Scholar]
- Montaldo, N.; Mancini, M.; Rosso, R. Flood hydrograph attenuation induced by a reservoir system: Analysis with a distributed rainfall-runoff model. Hydrol. Process. 2004, 18, 545–563. [Google Scholar] [CrossRef]
- Gioia, A. Reservoir routing on double-peak design flood. Water 2016, 8, 553. [Google Scholar] [CrossRef]
- Kondolf, G.M.; Gao, Y.X.; Annandale, G.W.; Morris, G.L.; Jiang, E.H.; Zhang, J.H.; Cao, Y.T.; Carling, P.; Fu, K.D.; Guo, Q.C.; et al. Sustainable sediment management in reservoirs and regulated rivers: Experiences from five continents. Earths Future 2014, 2, 256–280. [Google Scholar] [CrossRef]
- Atkinson, E. The Feasibility of Flushing Sediment from Reservoirs; HR Wallingford: Wallingford, UK, 1996. [Google Scholar]
- Graf, W.L.; Wohl, E.; Sinha, T.; Sabo, J.L. Sedimentation and sustainability of western american reservoirs. Water Resour. Res. 2010, 46, W12535. [Google Scholar] [CrossRef]
- Mitchell, B. Integrated water resource management, institutional arrangements, and land-use planning. Environ. Plan. A 2005, 37, 1335–1352. [Google Scholar] [CrossRef]
- Hu, Z.N.; Wei, C.T.; Yao, L.M.; Li, C.Z.; Zeng, Z.Q. Integrating equality and stability to resolve water allocation issues with a multiobjective bilevel programming model. J. Water Res. Plan. Manag. 2016, 142. [Google Scholar] [CrossRef]
- Tseng, H.W.; Gan, T.Y.; Yu, P.S. Composite drought indices of monotonic behaviour for assessing potential impact of climate change to a water resources system. Water Resour. Manag. 2015, 29, 2341–2359. [Google Scholar] [CrossRef]
- Lian, J.J.; Sun, X.Z.; Ma, C. Multi-year optimal operation strategy of danjiangkou reservoir after dam heightening for the middle route of the south-north water transfer project. Water Sci. Technol. Water Supply 2016, 16, 961–970. [Google Scholar] [CrossRef]
- Water Resources Agency, Ministry of Economic Affairs. The Assessment and Computation of the Indicators on Sustainable Development of Water Resources in Taiwan; Water Resources Agency at Ministry of Economic Affairs (Taiwan): Taipei, Taiwan, 2004. (In Chinese)
- Huang, W.C.; Chou, C.C. Risk-based drought early warning system in reservoir operation. Adv. Water Resour. 2008, 31, 649–660. [Google Scholar] [CrossRef]
- Benjankar, R.; Tonina, D.; McKean, J. One-dimensional and two-dimensional hydrodynamic modeling derived flow properties: Impacts on aquatic habitat quality predictions. Earth Surf. Process. Landf. 2015, 40, 340–356. [Google Scholar] [CrossRef]
- Lobato, T.C.; Hauser-Davis, R.A.; Oliveira, T.F.; Silveira, A.M.; Silva, H.A.N.; Tavares, M.R.M.; Saraiva, A.C.F. Construction of a novel water quality index and quality indicator for reservoir water quality evaluation: A case study in the amazon region. J. Hydrol. 2015, 522, 674–683. [Google Scholar] [CrossRef]
- Golusin, M.; Ivanovic, O.M. Definition, characteristics and state of the indicators of sustainable development in countries of southeastern europe. Agric. Ecosyst. Environ. 2009, 130, 67–74. [Google Scholar] [CrossRef]
- Yin, X.A.; Yang, Z.F.; Petts, G.E.; Kondolf, G.M. A reservoir operating method for riverine ecosystem protection, reservoir sedimentation control and water supply. J. Hydrol. 2014, 512, 379–387. [Google Scholar] [CrossRef]
- Schwartz, J.S.; Herricks, E.E. Fish use of ecohydraulic-based mesohabitat units in a low-gradient illinois stream: Implications for stream restoration. Aquat. Conserv. Mar. Freshw. Ecosyst. 2008, 18, 852–866. [Google Scholar] [CrossRef]
- Lin, Y.P.; Wang, C.L.; Yu, H.H.; Huang, C.W.; Wang, Y.C.; Chen, Y.W.; Wu, W.Y. Monitoring and estimating the flow conditions and fish presence probability under various flow conditions at reach scale using genetic algorithms and kriging methods. Ecol. Model. 2011, 222, 762–775. [Google Scholar] [CrossRef]
- Lin, Y.P.; Lin, W.C.; Wu, W.Y. Uncertainty in various habitat suitability models and its impact on habitat suitability estimates for fish. Water 2015, 7, 4088–4107. [Google Scholar] [CrossRef]
- Li, R.N.; Chen, Q.W.; Tonina, D.; Cai, D.S. Effects of upstream reservoir regulation on the hydrological regime and fish habitats of the lijiang river, china. Ecol. Eng. 2015, 76, 75–83. [Google Scholar] [CrossRef]
- Pasha, M.F.K.; Yeasmin, D.; Rentch, J.W. Dam-lake operation to optimize fish habitat. Environ. Process. 2015, 4, 631–645. [Google Scholar] [CrossRef]
- Yao, W.W.; Rutschmann, P.; Sudeep. Three high flow experiment releases from glen canyon dam on rainbow trout and flannelmouth sucker habitat in colorado river. Ecol. Eng. 2015, 75, 278–290. [Google Scholar] [CrossRef]
- Wen, X.; Fang, G.H.; Guo, Y.X.; Zhou, L. Adapting the operation of cascaded reservoirs on yuan river for fish habitat conservation. Ecol. Model. 2016, 337, 221–230. [Google Scholar] [CrossRef]
- Nikghalb, S.; Shokoohi, A.; Singh, V.P.; Yu, R. Ecological regime versus minimum environmental flow: Comparison of results for a river in a semi mediterranean region. Water Resour. Manag. Int. J. 2016, 30, 4969–4984. [Google Scholar] [CrossRef]
- Aguilar, C.; Polo, M.J. Assessing minimum environmental flows in nonpermanent rivers: The choice of thresholds. Environ. Model. Softw. 2016, 79, 120–134. [Google Scholar] [CrossRef]
- Water Resources Planning Institute, Water Resources Agency, Ministry of Economic Affairs. Mechanism Development and Strategies Implementation of Environmental Flows under Climate Change (1/2); Water Resources Planning Institute of Water Resources Agency (Taiwan): Taipei, Taiwan, 2010. (In Chinese)
- Gini, C. Measurement of inequality of incomes. Econ. J. 1921, 31, 124–126. [Google Scholar] [CrossRef]
- Cullis, J.; Van Koppen, B. Applying the Gini Coefficient to Measure Inequality of Water Use in the Olifants River Water Management Area, South Africa; IWMI (International Water Management): Colombo, Sri Lanka, 2007; Volume 113. [Google Scholar]
- Masaki, Y.; Hanasaki, N.; Takahashi, K.; Hijioka, Y. Global-scale analysis on future changes in flow regimes using gini and lorenz asymmetry coefficients. Water Resour. Res. 2014, 50, 4054–4078. [Google Scholar] [CrossRef]
- Wang, X.J.; Zhang, J.Y.; Shahid, S.; ElMahdi, A.; He, R.M.; Wang, X.G.; Ali, M. Gini coefficient to assess equity in domestic water supply in the yellow river. Mitig. Adapt. Strateg. Glob. Chang. 2012, 17, 65–75. [Google Scholar] [CrossRef]
- Rajah, K.; O’Leary, T.; Turner, A.; Petrakis, G.; Leonard, M.; Westra, S. Changes to the temporal distribution of daily precipitation. Geophys. Res. Lett. 2014, 41, 8887–8894. [Google Scholar] [CrossRef]
- Peipoch, M.; Brauns, M.; Hauer, F.R.; Weitere, M.; Valett, H.M. Ecological simplification: Human influences on riverscape complexity. Bioscience 2015, 65, 1057–1065. [Google Scholar] [CrossRef]
- Xu, Z.X.; Takeuchi, K.; Ishidaira, H.; Zhang, X.W. Sustainability analysis for yellow river water resources using the system dynamics approach. Water Resour. Manag. 2002, 16, 239–261. [Google Scholar] [CrossRef]
- Huang, Q.Y. On the Sustainable Indicators of Major Reservoir Watersheds in Taiwan; National Central University: Chung-Li, Taiwan, 2002. [Google Scholar]
- Chen, X.; Hu, Z.H. Study on appraisal system of sustainable development for medium and small-sized reservoirs. Dam. Saf. 2006, 6, 9. [Google Scholar]
- Petersson, E. Comparative Assessment of Large Dam Projects; Technische Universität Darmstadt: Darmstadt, Germany, 2007. [Google Scholar]
- Kumambala, P.G.; Ervine, A. Water resources sustainable decision-making for malawi based on basin hydrology, human health and environment. In U21 Postgraduate Research Conference Proceedings I; University of Birmingham: Brirmingham, UK, 2008. [Google Scholar]
- Chu, D.J.; Chen, H.C.; Kuo, Y.Y.; Cheng, A.S.; Fang, W.T.; Shih, C.H. The weight estimation approach of stream integrity assessment model in terms of eco-environmental aspects—A case study of natural tourism site at shihmen reservoir. J. Geogr. Sci. 2009, 55, 65–95. [Google Scholar]
- Water Resources Planning Institute; Water Resources Agency; Ministry of Economic Affairs. Assessment Framework for Sustainable Reservoir Planning-No.1; Water Resources Planning Institute of Water Resources Agency (Taiwan): Taipei, Taiwan, 2010. (In Chinese)
- Water Resources Planning Institute; Water Resources Agency; Ministry of Economic Affairs. Sustainable Reservoir Planning(4)-Research on River Ecological Conservation-No.2; Water Resources Planning Institute of Water Resources Agency (Taiwan): Taipei, Taiwan, 2011. (In Chinese)
- Water Resources Planning Institute; Water Resources Agency; Ministry of Economic Affairs. Study on Sustainable Reservoir Planning and Research(4)-Research of Water Quality Maintenance-No.3; Water Resources Planning Institute of Water Resources Agency (Taiwan): Taipei, Taiwan, 2011. (In Chinese)
- Water Resources Planning Institute; Water Resources Agency, Ministry of Economic Affairs. Study on Sustainable Reservoir Planning General Report-No.4; Water Resources Planning Institute of Water Resources Agency (Taiwan): Taipei, Taiwan, 2013. (In Chinese)
- Fish, U.; Service, W. Standards for the Development of Habitat Suitability Index Models: Ecological Service Manual 103; department of interior of United State of America: Washington, DC, USA, 1980. [Google Scholar]
- EPA-Taiwan. Evaluation and Modification for the Classification of River Water Bodies in River Administered by Central Government; Environmental Protection Agency of Taiwan: Taipei, Taiwan, 2007. (In Chinese)
- Vollenweider, R.A. The Scientific Basis of Lake and Stream Eutrophication with Particular Reference to Phosphorus and Nitrogen as Factors in Eutrophication; DAS/CSI/67-27; Organization for Economic Cooperation and Development: Paris, France, 1968. [Google Scholar]
- World Commission on Environment and Development. Our Common Future; Oxford University Press: New York, NY, USA, 1987. [Google Scholar]
- Water Resources Planning Institute; Water Resources Agency; Ministry of Economic Affairs. Review and Improvement of the Sustainable Reservoir Indicator System-No.5; ange (1/2); Water Resources Planning Institute of Water Resources Agency (Taiwan): Taipei, Taiwan, 2014. (In Chinese)
- Water Resources Planning Institute; Water Resources Agency; Ministry of Economic Affairs. Integrated Assessment of Supporting Decision System and Reservoir Sustainability-No.6; Resources Planning Institute of Water Resources Agency (Taiwan): Taipei, Taiwan, 2011. (In Chinese)
- Morrison, R.R.; Stone, M.C. Evaluating the impacts of environmental flow alternatives on reservoir and recreational operations using system dynamics modeling. J. Am. Water Resour. Assoc. 2015, 51, 33–46. [Google Scholar] [CrossRef]
- Alexandre, C.M.; Almeida, P.R.; Neves, T.; Mateus, C.S.; Costa, J.L.; Quintella, B.R. Effects of flow regulation on the movement patterns and habitat use of a potamodromous cyprinid species. Ecohydrology 2016, 9, 326–340. [Google Scholar] [CrossRef]
Figure 1.
Reservoir evaluation system framework.
Figure 2.
Definition of the Gini coefficient.

Figure 3.
Reservoir sustainability evaluation system flowchart for planning and decision-making support.
Figure 3.
Reservoir sustainability evaluation system flowchart for planning and decision-making support.

Figure 4.
Location of Shiwen Reservoir.

Figure 5.
Radar chart of indices (a) and bar chart of SCI (b) for the Shiwen Reservoir. I1: Flood reduction ratio; I2: Safe flooding flow ratio; I3: Effective reservoir capacity ratio; I4: Sediment supply ratio; I5: Water supply ratio; I6: Water allocation ratio; I7: Ecological baseflow ratio; I8: Change in WUA; I9: Water pollution index; I10: Eutrophication index; I11: Benefits index; I12: Fairness index.

Table 1.
A summary of various evaluation indicators for reservoir evaluation.
| Indicator Name | Code | Calculation |
|---|---|---|
| Flood reduction ratio | I1 | (Qpi − Qpo)/Qpi |
| Safe flooding flow ratio | I2 | Qpo/Qr |
| Effective reservoir capacity ratio | I3 | (Vo − Vs + Vd)/Vo |
| Sediment supply ratio | I4 | Qd/Qs |
| Water supply ratio | I5 | SA/S |
| Water allocation ratio | I6 | SA/D (during operations); S/D (during planning) |
| Ecological baseflow ratio | I7 | Qsb/Q95 |
| Change in WUA | I8 | Equation (1) |
| Water pollution index | I9 | Equation (2) |
| Eutrophication index | I10 | Model simulation |
| Benefits index | I11 | Equation (3) |
| Fairness index | I12 | Equation (4) |
Table 2.
Rating scheme for reservoir sustainability indicators.
| Category | Indicator | Rating | |||
|---|---|---|---|---|---|
| Excellent (4 pts.) | Good (3 pts.) | Fair (2 pts.) | Poor (1 pts) | ||
| C1 | I1 (%) | >30 | 21~30 | 11~20 | ≤10 |
| I2 (%) | <96 | 96~100 | 101~110 | >110 | |
| C2 | I3 (%) | 91~100 | 71~90 | 51~70 | ≤50 |
| I4 (%) | >35 | 26~35 | 13~25 | <13 | |
| C3 | I5 (%) | 91~110 | 81~90 or >110 | 71~80 | ≤70 |
| I6 (%) | 91~110 | 81~90 or >110 | 71~80 | ≤70 | |
| C4 | I7 (multiplier) | >3.0 | 2.1~3.0 | 1.1~2.0 | ≤1.0 |
| I8 (%) | >0 | 0~−33 | −33~−67 | −68~−100 | |
| C5 | I9 (WQI7) | >85 | 71~85 | 51~70 | ≤50 |
| I10 (μg/L) | <12 | 12~18 | 19~24 | >24 | |
| C6 | I11 (%) | >8.0 | 5.1~8.0 | 2.1~5.0 | ≤2.0 |
| I12 (%) | 0~0.2 | 0.3~0.4 | 0.5~0.6 | 0.7~1.0 | |
Table 3.
Weighting factors of indicators.
| δ1,δ2 | δ3,δ4 | δ5,δ6 | δ7,δ8 | δ9,δ10 | δ11,δ12 | Σδi |
|---|---|---|---|---|---|---|
| 0.145 | 0.095 | 0.094 | 0.050 | 0.079 | 0.037 | 1.00 |
Table 4.
Reservoir sustainability rating and grade.
| Sustainability Rating | Excellent | Good | Average | Poor |
|---|---|---|---|---|
| SCI interval | 3.26~4.00 | 2.51~3.25 | 1.76~2.50 | 1.00~1.75 |
Table 5.
Indicator weighting factors and Shiwen Reservoir sustainability rating during desilting operations.
Table 5.
Indicator weighting factors and Shiwen Reservoir sustainability rating during desilting operations.
| Category | Indicator | Calculated Index | Grade | Score (Si) | Weighting Factor (δi) | SCI(i) = Si * δi |
|---|---|---|---|---|---|---|
| C1 | I1 (%) | 32.3 | Excellent | 4 | 0.145 | 0.580 |
| I2 (%) | 52.7 | Excellent | 4 | 0.145 | 0.580 | |
| C2 | I3 (%) | 80.11 (49.61) * | Good (Poor) * | 3 (1) * | 0.095 | 0.285 (0.095) * |
| I4 (%) | 62.25 (13.5) * | Excellent (Fair) * | 4 (2) * | 0.095 | 0.380 (0.190) * | |
| C3 | I5 (%) | 96.16 | Excellent | 4 | 0.094 | 0.376 |
| I6 (%) | 118.97 | Good | 3 | 0.094 | 0.282 | |
| C4 | I7 (multiplier) | 2.56 | Good | 3 | 0.050 | 0.150 |
| I8 (%) | −41.5 | Fair | 2 | 0.050 | 0.100 | |
| C5 | I9 (WQI7) | 87 | Excellent | 4 | 0.079 | 0.316 |
| I10 (μg/L) | 11 | Excellent | 4 | 0.079 | 0.316 | |
| C6 | I11 (%) | 9.0 | Excellent | 4 | 0.037 | 0.148 |
| I12 (%) | 0.2 | Excellent | 4 | 0.037 | 0.148 |
* Results for the absence of desilting operations are provided in parentheses. ΣSCI = 3.7 (3.3).
© 2017 by the authors. Licensee MDPI, Basel, Switzerland. This article is an open access article distributed under the terms and conditions of the Creative Commons Attribution (CC BY) license (http://creativecommons.org/licenses/by/4.0/).
Share and Cite
MDPI and ACS Style
Chen, R.-S.; Tsai, C.-M. Development of an Evaluation System for Sustaining Reservoir Functions—A Case Study of Shiwen Reservoir in Taiwan. Sustainability 2017, 9, 1387. https://doi.org/10.3390/su9081387
AMA Style
Chen R-S, Tsai C-M. Development of an Evaluation System for Sustaining Reservoir Functions—A Case Study of Shiwen Reservoir in Taiwan. Sustainability. 2017; 9(8):1387. https://doi.org/10.3390/su9081387
Chicago/Turabian StyleChen, Rong-Song, and Chan-Ming Tsai. 2017. "Development of an Evaluation System for Sustaining Reservoir Functions—A Case Study of Shiwen Reservoir in Taiwan" Sustainability 9, no. 8: 1387. https://doi.org/10.3390/su9081387
Note that from the first issue of 2016, this journal uses article numbers instead of page numbers. See further details here.