Deduction of Optimum Surface Design Factors for Enhancement of Outdoor Thermal Environment in a Micro-Scale Unit


Department of Architecture, Pusan National University, 2, Busandaehak-ro 63beon-gil, Geumjeong-gu, Busan 609-735, Korea
*
Author to whom correspondence should be addressed.
Sustainability 2017, 9(8), 1381; https://doi.org/10.3390/su9081381
Submission received: 29 June 2017
/
Revised: 23 July 2017
/
Accepted: 2 August 2017
/
Published: 4 August 2017
(This article belongs to the Special Issue Urban Heat Island)
Abstract
:To solve some of the problems associated with changing urban climates, such as the heat island effect, the exterior building skin and ground surfaces should be analyzed because they are directly exposed to the outdoor climate and have the greatest impact on energy consumption. Research is needed to identify design factors to improve the effect of a building’s skin in the outdoor summer season’s thermal environment. In this study, the current conditions of outdoor thermal environments were identified by conducting field measurements at an apartment housing complex. A simulation analysis was conducted based on cases that included different design factors for a building’s skin and ground surfaces. When the significance probability of the design factors for the surface plans for apartment buildings and surface cover was analyzed based on the Taguchi experimental design method, the window plan and surface cover plan influenced the outdoor thermal environment. Notably, the surface cover plan had the most significant impact on the outdoor thermal environment. The result of the analysis of the correlation between the design factors for an apartment complex’s surface plans and outdoor thermal environment indices showed that the window plan correlated with the entire surface temperature of building and heat island potential (HIP).
1. Introduction
1.1. Background and Necessity of Study
Increase in population, traffic volume, and land surface pavement area due to urbanization are directly and indirectly influencing urban climates [1]. In addition to the economic, managerial, and social challenges associated with growing cities, depressed energy budgets contribute to a warmer climatic condition known as an urban heat island (UHI) [2]. In highly populated areas, the vertical and horizontal development of cities with artificial materials decrease the ventilation and increase the absorption of solar radiation, thus reducing the longwave emissions to the atmosphere [3,4]. The elevated temperature triggers heat-related diseases and contributes to premature deaths in urban areas [5,6].
Summertime UHIs significantly decrease the outdoor air quality (OAQ), along with increasing the energy demands of a city. Widespread power outages may occur as a result of the energy increase due to increased air conditioning system demand [2].
In the U.S. and Japan, existing plans and measures for reducing the heat island phenomenon focus on artificial building skin improvements. A Japanese guideline for measures against the urban heat island effect includes five control categories: shade, ground surface cover, exterior building material, and control of the arrangement of building equipment. These items are reflected in architectural design guidelines and architectural plans [7]. The U.S. Environmental Protection Agency (EPA) runs an urban heat island mitigation program, where related technologies like urban green spaces, green roofs, cool roofs, and cool pavements are applied to easily adaptable physical elements such as urban vegetation and urban material properties [8]. As is clear from these cases, intensive research needs to be performed to improve the areas most exposed to urban climates, such as the buildings and ground surfaces that directly influence people’s living environment. In addition, the development of various exterior materials, the operation of urban heat island mitigation programs, and the improvement of related systems needs to be successfully carried out. Finally, the various surface coverings of urban infrastructure, such as building and ground surfaces, should be quantitatively analyzed and their impact on the outdoor thermal environment investigated.
In this study, the current conditions of outdoor thermal environments were investigated by conducting field measurements at an apartment housing complex. This helped us to understand the outdoor thermal environment for micro-scale units, which are the small units that form a city, and to explore ways to improve this environment. This study also reviewed design factors that affect outdoor thermal environment with the goal of using these as data for urban and architectural planning.
1.2. Literature Review
Studies on urban heat islands have been conducted for regions, cities, parks, residential complexes, buildings, and streets in relation to thermal comfort, the reduction of building energy consumption, and the mitigation of the heat island phenomenon. Various improvement plans for thermal environments have been examined, taking regional characteristics into consideration. The actual conditions of the thermal environments of urban areas were researched using satellite images and geographic information system (GIS) data, and improvement plans were explored [9,10,11,12]. Research was conducted on parks and streets to identify the current problems, and improvement plans using green space planning approaches were explored. Changes in the thermal environment were examined by applying various design factors [13,14,15,16,17,18]. Field studies and experiments, surveys of pedestrians, and programs to evaluate the improvement in thermal comfort have been conducted [19,20,21,22,23]. The results were based on thermal comfort indices such as the predicted mean vote (PMV) and physiological equivalent temperature (PET), as well as the three-dimensional non-hydrostatic model ENVI-met and computational fluid dynamics (CFD) simulations. DesignBuilder (DesignBuilder Software Ltd, UK), the integrated environmental solutions virtual environment software (IES VE), Energy Plus, and the thermos-radiative model SOLENE were used to evaluate the effects of planting greenery on buildings and cool loop system planning on the urban temperature and building energy consumption [24,25,26,27,28,29,30]. Next, there were studies on the measurement method of thermal comfort [31] and others assessing the impact of streets pavement on thermal comfort [32].
With the population increase in urban areas, the supply of apartment units has also been growing. In previous studies, there has been a lack of research on the actual conditions of the thermal environment within apartment complexes. Moreover, even though apartment housing constitutes the highest ratio among the buildings in cities, there have been few studies on improvement plans. Unlike an indoor environment, the outdoor thermal environment is formed by several physical factors, including the wind speed, heat, humidity, and radiation. Therefore, using the PMV and PET evaluation indices is inadequate for evaluating the summer environment, when the radiation environment is the most acute. There are several relevant studies on the performance of heat island mitigation technologies [33]. However, if one considers how the thermal environments of outdoor spaces can be affected by the architecture’s cooling condition, insulation condition, and its window ratios, there are not enough previous studies that have engaged in the comparative analysis of the effects of surface material variables of outdoor spaces and architectural planning variables, in a comprehensive and quantitative manner.
In this study, research on the actual conditions of the thermal environment (field study and numerical simulation) was conducted on existing apartment complexes to identify problems related to the artificial covering of the building exterior and outdoor surface spaces. Numerous design factors were selected to quantitatively analyze the effects of the characteristics of the building skin and outdoor space surface on the outdoor thermal environment in an apartment complex. A numerical simulation was performed to quantify the effects on the outdoor thermal environment and thermal comfort, and to aid in the formulation of improvement plans. In addition, by examining the correlation between the heat island phenomenon and thermal comfort in the outdoor space for each design element, useful data were collected for an architectural design that considers the heat island phenomenon. The mean radiant temperature (MRT) was used to evaluate the thermal comfort and outdoor thermal environment in terms of the thermal radiation and heat island potential (HIP) evaluation index, and thus the effect on the urban heat island.
1.3. Proposed Method of Study
This study reviewed the component materials of existing buildings and outdoor spaces that constitute the surface area within a city. The goal was to analyze their impact on outdoor thermal environments. This study quantitatively analyzed the design factors used for urban and architectural planning. These design factors are applied to urban micro-scale units to improve urban microclimates. Using diverse cases, this study also examined the optimum design factors that positively affect outdoor thermal environment.
The methodology applied to this study was field measurements of the thermal environment in an existing apartment housing complex in an urban micro-scale unit. An examination of the changes in the temperatures of the skins of the buildings and ground surfaces at different times of the day was also conducted. The sensible heat flux of each type of component material of the skin was then determined.
A simulation analysis was performed using cases that included different design factors for the building skin and ground surfaces. The design factors that affect outdoor thermal environment were then determined by applying the Taguchi method (Taguchi experimental design). Finally, optimum plans for the improvement of outdoor thermal environments were formulated.
2. Methods
2.1. Measurement
2.1.1. Measurement of Outdoor Thermal Environment in Apartment Housing Complexes
Apartment complexes constitute the largest number of buildings in Korea. The utilization rate of indoor and outdoor spaces in apartment complexes is high because these spaces are densely populated. For this reason, an apartment housing complex was selected for the field measurement in this study. To provide a comprehensive review of the current conditions of the building skin and ground surfaces, an apartment housing complex that was large enough to form an urban micro-scale unit was selected. When three to four buildings are located in the same complex, they form a cluster, which is a small unit of a repeated pattern within a complex.
Apartment houses with typical layouts were chosen for the field measurements. An apartment complex in Haeundae, South Korea had an ideal living environment. It was built by the R construction firm, and was located at a latitude 35°10′33″N and longitude of 129°10′50″E. The complex consisted of eight 20–24 story residential buildings. The complex was constructed with a floor area ratio of 256.0% and building-to-land ratio of 16.0%.
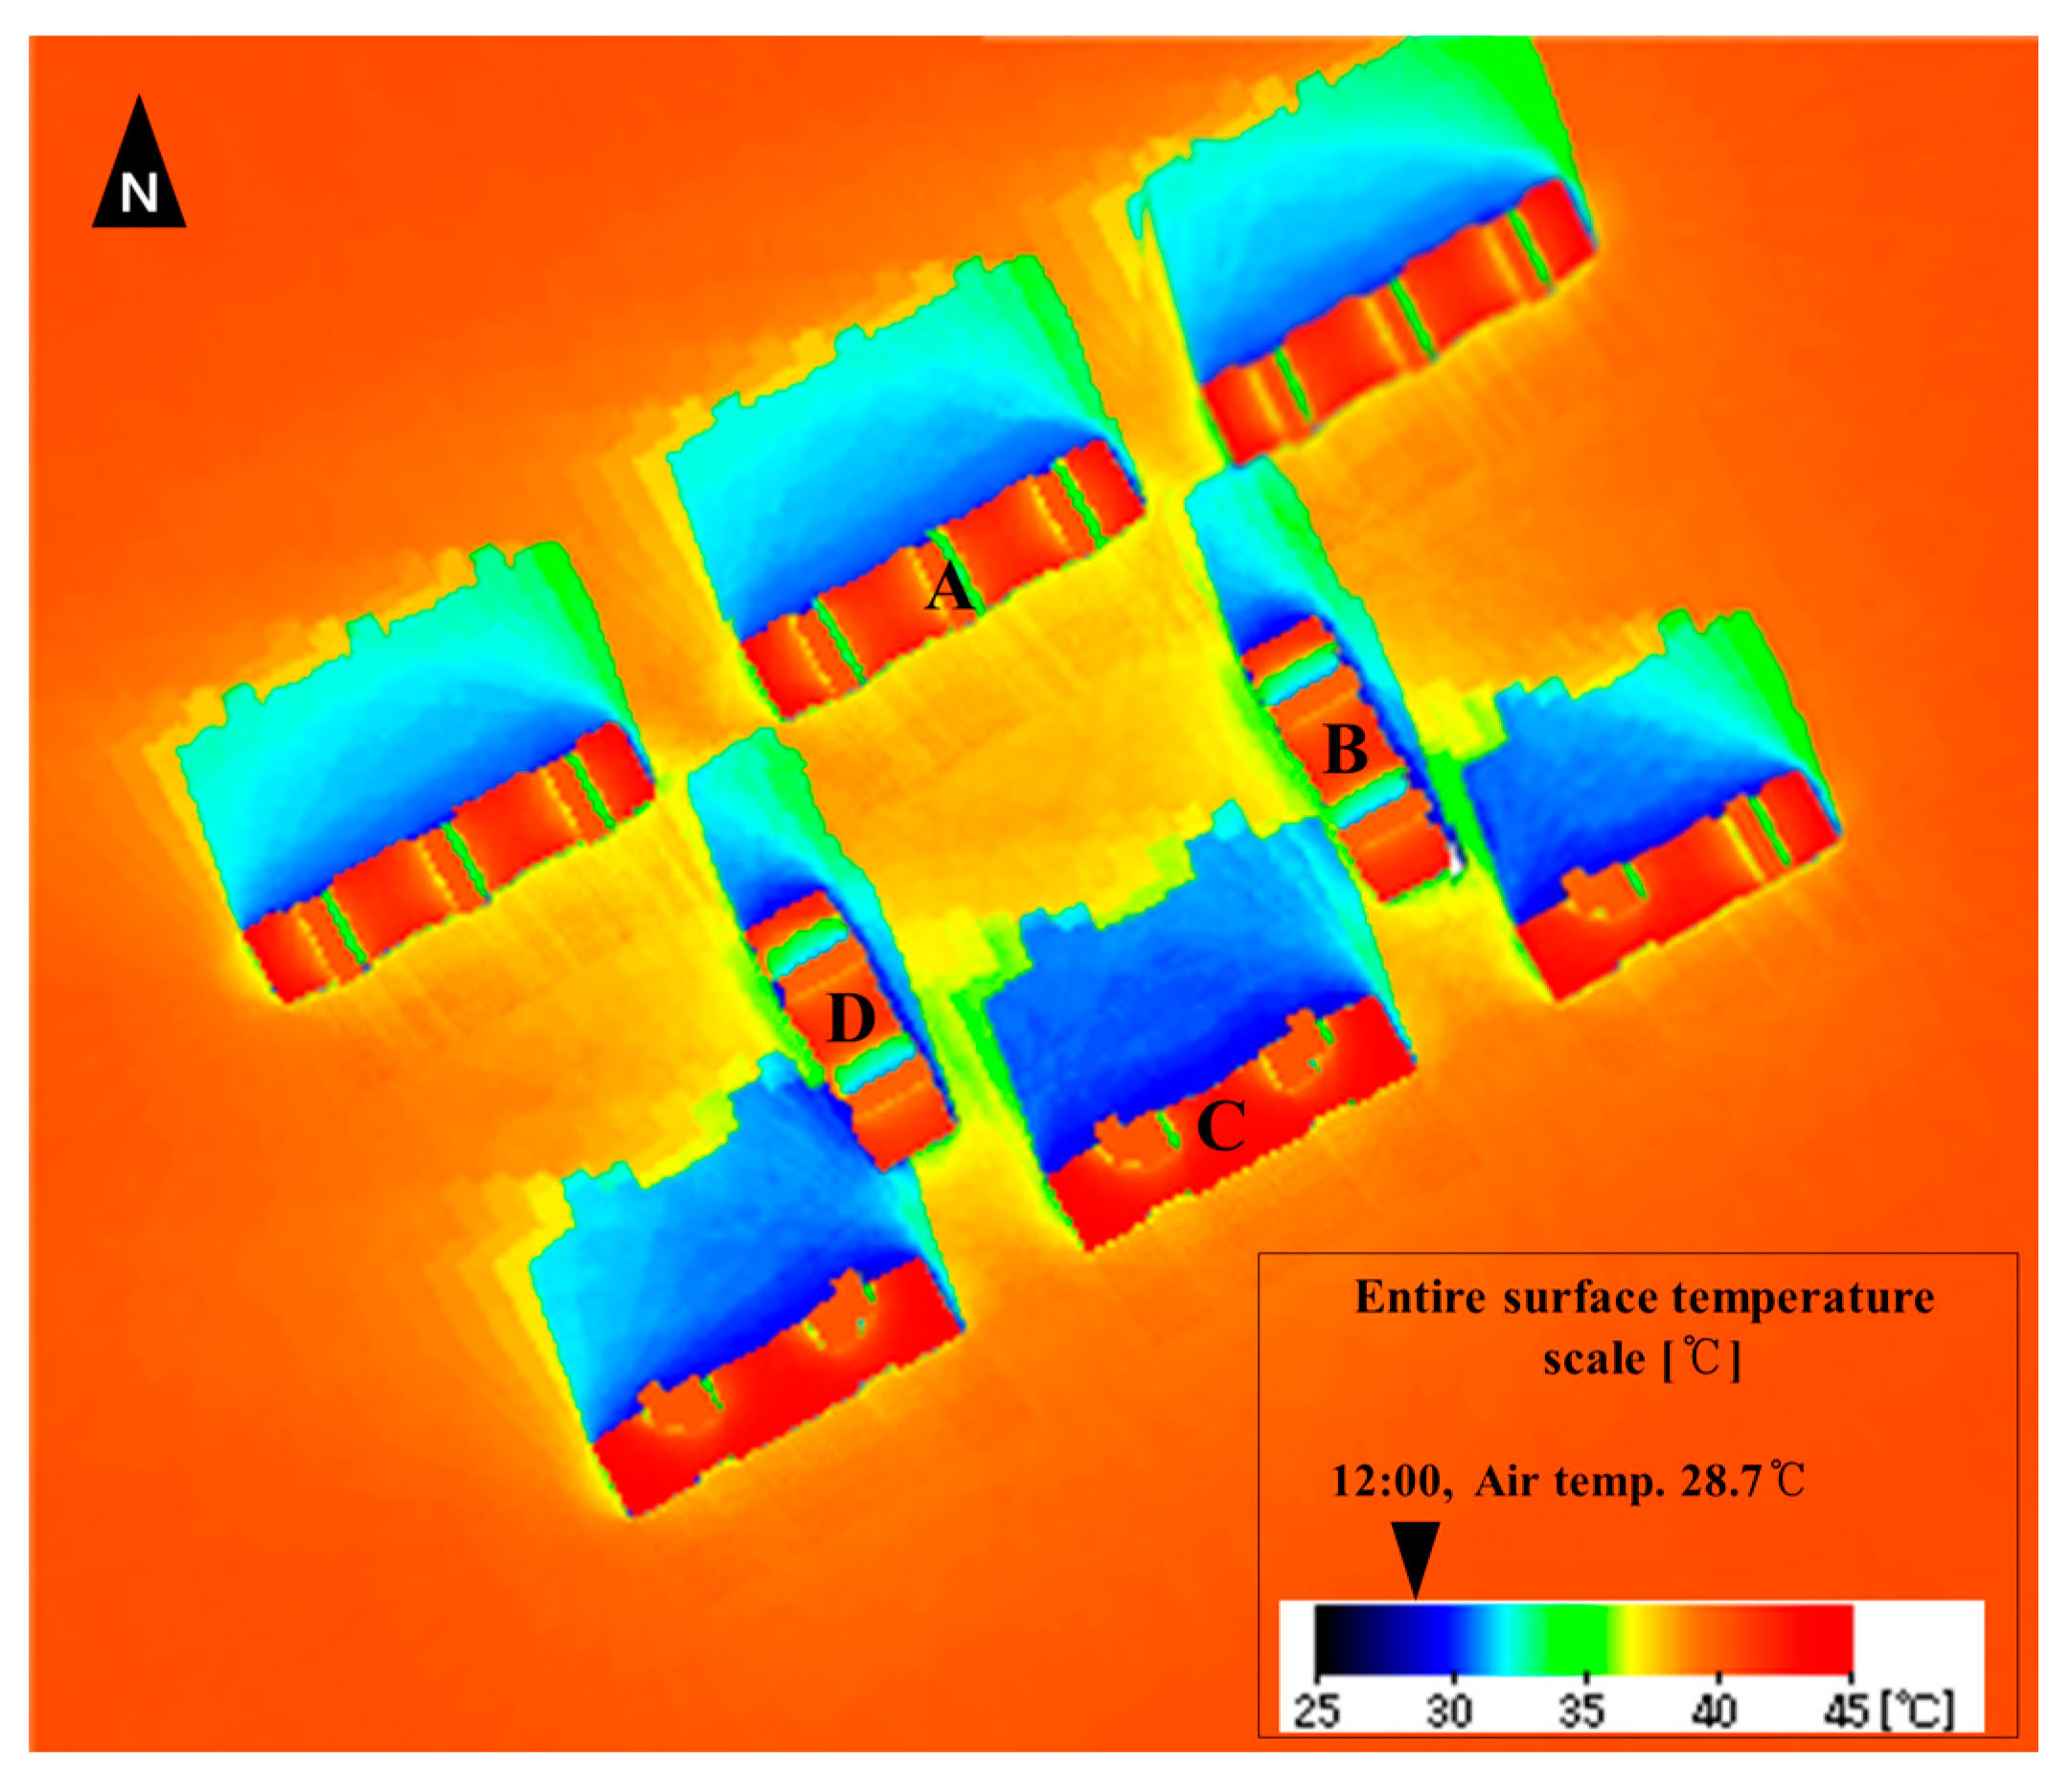
Figure 1 shows the location and scale of the apartment housing complex that was chosen for the field measurements. Figure 2 shows the thermal imaging range. Eight residential buildings were arranged in a square-shaped layout, and the residential buildings and outdoor spaces required for the field measurements were selected from four residential buildings (A to D) located at the center of the layout. The selected space had an area enclosed on four sides that was considered suitable for studying the microclimate changes within a closed space. For the field measurements, climate observations were conducted and thermographic images were taken at the center of the square-shaped outdoor space. The value measured using the infrared thermal camera is the temperature value converted from the thermal energy radiated from the surface of the subject; if the surface emissivity is 1.0, it can be considered approximately equal to the surface temperature. Many construction materials, including concrete, show a surface emissivity of 0.9 and higher; in such cases, solar reflection can be the cause of a minor range error. Considering such characteristics, this study used the measurement values obtained from the infrared thermal camera to see the relative ratio of sensible heat emissions for each azimuth orientation and for each hour.
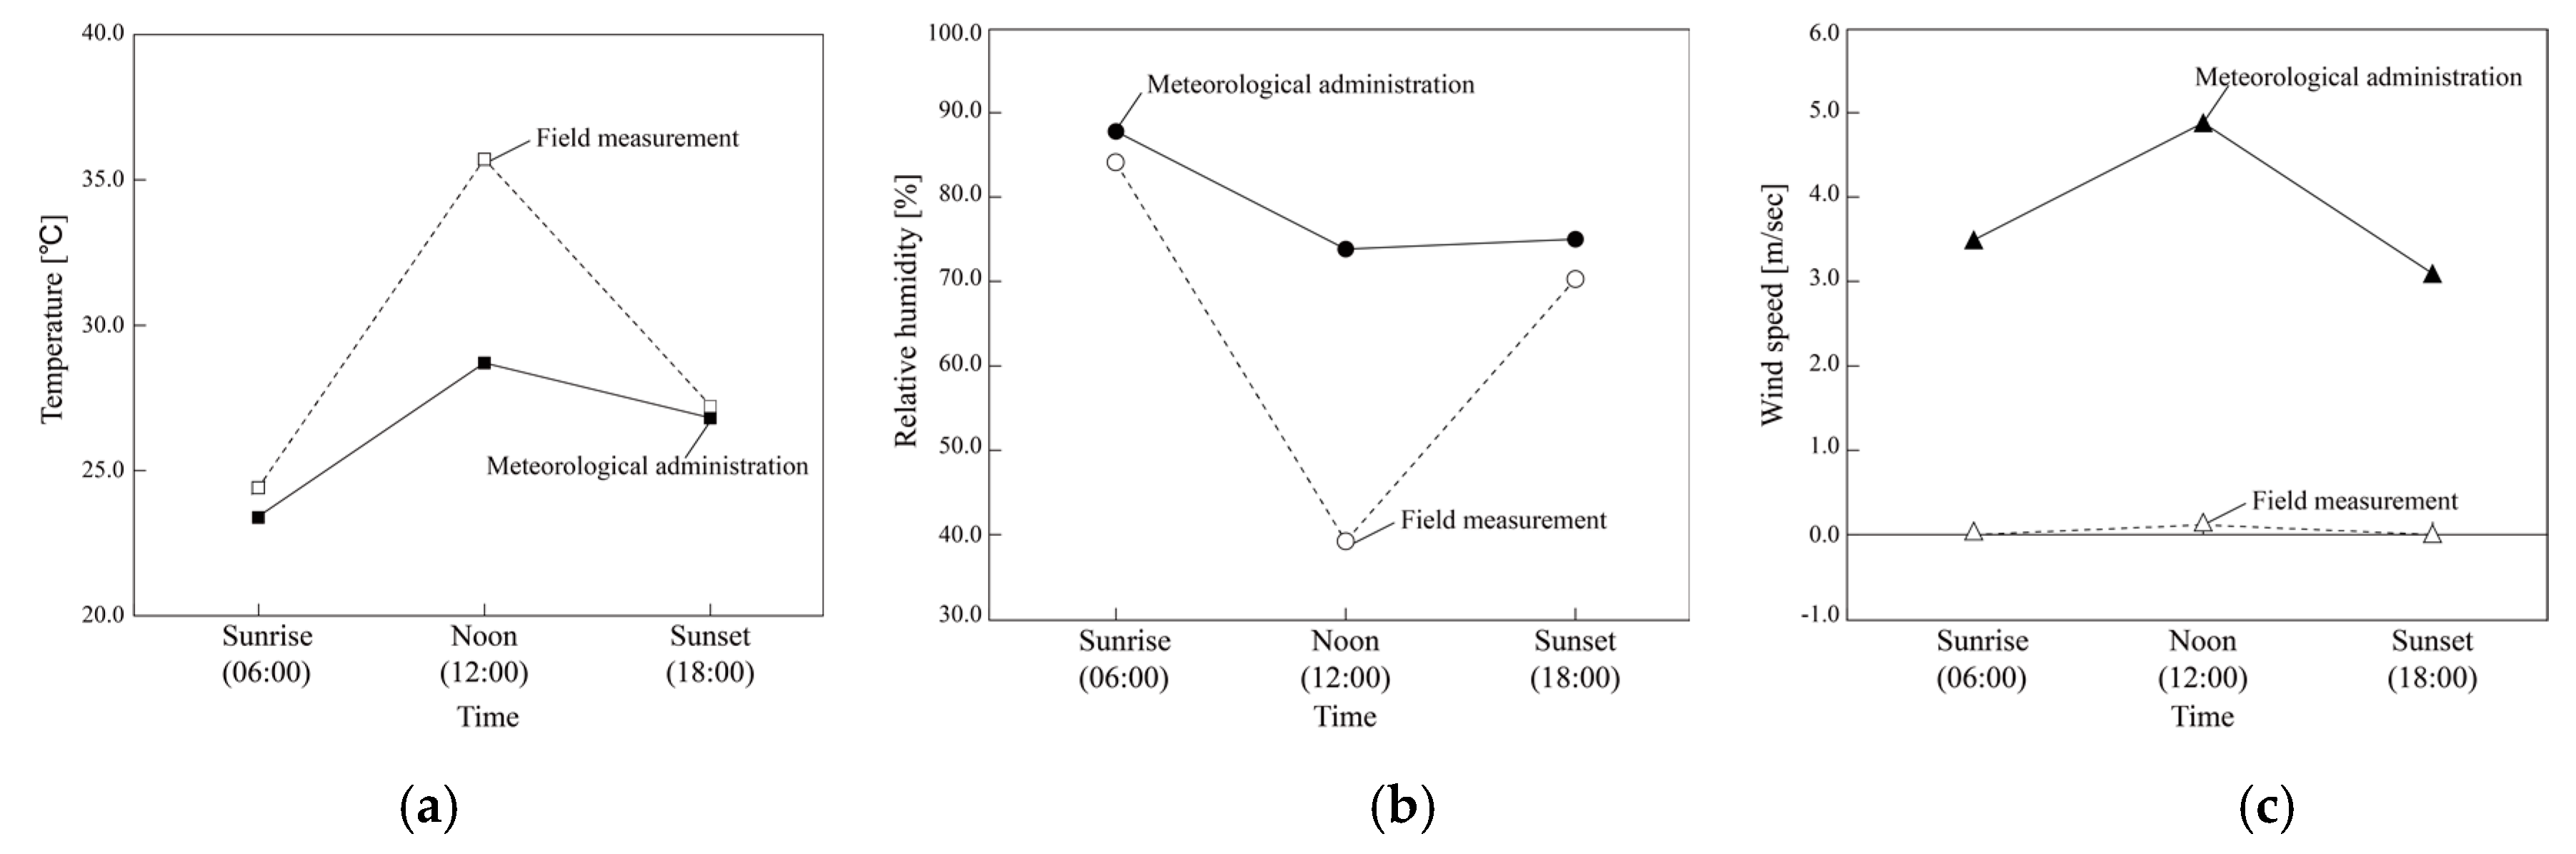
This was accomplished to test for temperature changes on the building and ground surfaces over time. The weather conditions were obtained from air velocity and temperature, global temperature, and relative humidity parameters, using sensors placed at a height of 1.5 m from the ground. The field measurements were performed on 14 August 2015, when the sky was clear and the temperature was relatively high. Measurements were taken at sunrise (6:00), noon (12:00), and sunset (18:00).
Figure 3 lists the weather observation results from the field, and the weather center data for the same date. The data from the field measurements were relatively high compared to the weather center data. This was assumed to be a result of the square-shaped, closed arrangement of the residential buildings, which decreased the air ventilation in the courtyard. This phenomenon was also clearly seen in the measured wind speeds.
2.1.2. Analysis of Sensible Heat Flux Values for Different Component Materials of Apartment Housing Complex
The sensible heat flux values for different components of the apartment complexes were analyzed using the field measurement results from a thermographic camera. The emissivity of surface materials, excluding glass and unfinished metals are more than 0.9, and it was deemed that the influence of the solar reflection is limited in terms of calculating the surface temperature with an infrared thermal camera. Furthermore, because the analysis results are subject to relative evaluation, it was thought not to have a significant effect on the validity of the analysis.
Regarding the glass surfaces at the Glass surfaces of apartment complexes subject to this study were excluded from the comparison of heat emission values because their emissivity is relatively low and more likely to be affected by solar reflections. Actual apartment complexes were studied to quantitatively analyze the effects of the components on the temperature increases.
Figure 4 shows the scope of the subjects that were analyzed for the sensible heat flux. The southeast side of residential building A (which was directly exposed to solar radiation) and the northwest side of residential building C (which was barely exposed to solar radiation) were the subjects of the analysis. To avoid shadow effects from neighboring buildings, the highest floor was chosen for the assessment. Building components were categorized according to the external walls (air-conditioned spaces and non-air-conditioned spaces (The term “air-conditioned spaces” refers to rooms in buildings where heating and cooling is available that are used for living, working, leisure, and other similar activities (known as a “living room” according to the building code). The term “non-air-conditioned spaces” refers to spaces where activities are conducted without affecting the living rooms (air-conditioned areas), including hallways and staircases.)) [34] and heated sections of a rooftop floor. In addition, to analyze the sensible heat flux values of the different component materials, measurements were implemented on the asphalt surface and green space (garden and trees) located on the ground surface on the southeast side (Out 01) and northwest side (Out 02). The times of the sensible heat flux analyses were sunrise (6:00), noon (12:00), and sunset (18:00).
The thermographic data were organized according to the emissivity coefficient of each component (The external walls of apartment houses were categorized according to paint color. The radiation factor for the color of the external wall cladding was 0.92 for the heated (living) areas on the rooftop floor (gray tone), 0.91 for non-heated areas (orange tone), 0.95 for the asphalt in outdoor spaces, and 0.94 for the soil and trees.) [35,36,37]. Equations (1) and (2) are from studies by Hoyano (1999) and Cole and Sturrock (1997), respectively [38,39]:
2.2. Simulations
2.2.1. Simulation of Outdoor Thermal Environment
Since the importance of comfortable outdoor environments began to be recognized, thermal comfort has usually been assessed by means of indices such as the new effective temperature (NET), standard new effective temperature (SET), PMV, and predicted percentage of dissatisfaction (PPD). Despite being based on indoor environments, where a steady state is maintained and the temperature changes very little, these indices are also used to indicate outdoor thermal comfort. However, because the subjective range that ordinary people feel is pleasant in an outdoor environment far exceeds the estimations produced by the indices tailored to indoor environments, a separate outdoor thermal comfort index is needed for quantitative analyses. Because the outdoor thermal environment consists of physical factors such as airflow, heat, humidity, and radiation, an evaluation index that allows the consideration of all elements is necessary. Therefore, it has been pointed out that indicators such as the PMV and PET are not sufficient to evaluate such thermal environments [40].
ENVI-met and CFD are representative simulations that are used to analyze urban thermal environments. ENVI-met is a three-dimensional micro-meteorological modeling program that simulates the interactions among ground surfaces, plants, and the atmosphere in an urban environment. This simulation program can be used for urban climate analysis, architecture, building design, and environmental planning. However, because the program does not reflect the topography, a large area impact evaluation is not possible, the daily temperature change is not considered, and when no wind flow from outside occurs, the thermal impact cannot be accurately analyzed. The CFD model represents not only the wind speed changes caused by a complex arrangement of urban buildings but also the temperature, humidity, and various routes of air pollution diffusion. Because of these advantages, a CFD simulation can be applied in urban design to reduce wind paths and the heat island effect [41]. However, the computational load of this program causes practical limitations on the calculation time for multiple cases and for obtaining design feedback [42].
In this study, we used a Thermorender (version 5.0, A&A Co., Ltd, Tokyo, Japan) simulation to evaluate thermal environments for the summer season, when the radiant environment is most acute, and for a micro-scale unit.
This simulation is an application tool based on a 3D-CAD program. Among its features, the CAD software Vectorworks (A&A Co., Ltd, Tokyo, Japan) can be used as a data input and output interface, allowing the designer to create building models while simultaneously estimating and evaluating the outdoor thermal environment. It is also useful for providing feedback on the design in the planning stages. This simulation tool evaluates the three-dimensional effects of space by considering the fact that the geometric shape, arrangement, and material selection of the building, which are important factors in architectural planning, have the greatest direct impact on the surface temperature and outdoor radiant heat environment [43]. For an urban-scale analysis of a building, with the wind speed distribution of the target analysis zone set at a constant, a numerical model for estimating the outdoor thermal radiation environment was designed to perform numerical simulations with a relatively low computational load.
Figure A1 shows the process for a numerical simulation. At the city-block-creating stage using 3D-CAD, the input process required entering conditions for a spatial-composition-elements database (DB), materials DB, and heat-transfer-calculation-model DB. Mesh data were selected, and a thermal equilibrium calculation process for each mesh was performed. In order to evaluate the thermal environment in summer, which is dominated by the radiation environment, the three-dimensional distribution of the entire surface temperature, mean radiant temperature (MRT), which is a measure of the radiant heat environment, and heat island potential (HIP) were used as evaluation indices through a three-dimensional numerical simulation of the entire surface temperature [44].
The MRT and HIP indices are derived from the three-dimensional surface temperature distributions of a space being studied. The three-dimensional surface temperature distributions and radiant thermal environment are determined by the shape, arrangement, and component materials of a building, and are the most important variables in construction planning. Hence, the MRT and HIP were used as the evaluation indices for the three-dimensional surface temperature distributions and radiant thermal environment. The MRT is the temperature obtained by averaging the effect of thermal radiation from the surroundings experienced by the human body in all directions (Equation (3)) [45]. In this study, the MRT value measured at 1.5 m above the ground at the central point of the subject was used for the evaluation:
The heat island potential (HIP) is a ratio of the area generating sensible heat to the total surface area of a building or the ground. It is a thermal index that converts the influence of an object of analysis on the heat island phenomenon to a surface temperature. For the HIP, the daily change (0–23 o’clock) is output. The HIP based on the sensible heat flux (°C) is shown in Equation (4):
This simulation can not only evaluate the outdoor thermal environment at the building-city level, but also verify the positive effects of the eco-friendly architectural plan and facility plan on the outdoor thermal environment. Several papers employing this simulation have been published in international journals [43,44,45,46,47,48].
2.2.2. Outline of Outdoor Thermal Environment Simulation of Subject of Field Measurement
To verify the validity of the results of the outdoor thermal environment simulation, a simulation test on the outdoor thermal environment of the apartment complex for which the field measurements were conducted was implemented. Eight buildings from the apartment complex that was chosen for the field measurements were remodeled. Four residential buildings (A to D) were chosen for the analysis. Standard values for the southern region, which were revised in 1987 (Enforcement Decree of the Building Act [Annex 5] Based on the southern region, the heat transmission coefficient of the external wall of the living room on the lowest floor was 0.76, with values of 0.52 for the living room ceiling on the highest floor or roof, 0.70 for the side walls of the apartment houses, and 3.60 for living room windows exposed to the outside air, based on the Enforcement Decree of the Building Act ) [49], were used for the heat transmission coefficients of the different building sections. The air conditioning temperature was set to 26.0 °C to maintain a constant indoor temperature as a boundary condition (Korean Building Energy Codes [Annex 8] standards of indoor temperature and humidity for calculating the air conditioning and heating capacity, where the range of standard dry-bulb temperatures for selecting the indoor temperature for apartment houses with air conditioning is 26–28 °C (amendment for building design standards for saving energy)). [50]. Automatic weather system (AWS) weather data from Busan for 14 August, which was the same date that the field measurements were conducted, were used as the weather conditions [51].
2.2.3. Outdoor Thermal Environment Assessment Using the Experiment Design Method
For this study, an apartment complex, which represented an urban micro-scale unit, was selected as the model. A case study was conducted by selecting the design factors for planning the building and ground surfaces to improve the outdoor thermal environment of the apartment complex, and then using the Taguchi method and simulation.
Case Study Selection Conditions
Figure 5 shows the case study selections. The land area was 265 m × 170 m, and the floor area ratio was set to a value lower than 250%, according to Type 3 of the Standards for General Residential Areas by Urban Planning Ordinance Type for Seoul. The building-to-land ratio was set to a value lower than 10% (six residential buildings), the layout was a parallel arrangement, and the distance between buildings was set to 1.0 H. The type of residential building was assumed to be flat, which is a common type in Korea. The private living area was set to the National Housing Size, which is 85 m2 or smaller. The length of a residential building was planned so no more than four units were in one row (width-to-distance ratio = 4:1), the number of floors was set to 29, and the height of each story was set to 2.9 m. Table A1 lists the material properties of the components of the residential buildings [52].
Boundary Conditions for Outdoor Thermal Environment Simulation
The location of the simulation was Seoul, at a latitude of 37°33′59″N and longitude of 126°58′40″E. The date of 5 August (the designated day for the temperature and solar radiation to be the maximum) was selected as the day of the evaluation.
The simulation was performed using standard weather data from Seoul (temperature over a period of 24 h, absolute humidity, sky solar radiation on a horizontal surface, direct normal insolation, nighttime solar radiation, wind direction, and wind speed) as shown in Figure A2 [50].
Figure A3 shows the mesh division for the analysis of the simulation. The meshes were used to estimate the radiant flux from the surroundings [53]. The mesh was divided into equal three-dimensional meshes of 0.4 m for three-dimensional total surface temperature simulations. This provided an accurate analysis of the effects of the construction materials of the ground surfaces and residential buildings on the outdoor thermal environment. The air conditioning temperature was set at 26.0 °C to maintain a constant indoor temperature [53].
Selection of Design Factors for Case Study
Figure 6 and Table 1 show the design factors that were selected for the surface plans of the apartment complexes. The design factors were selected from construction designs that greatly affected the outdoor thermal environment and were related to the building skin and ground surface. The variables were the window design, external wall insulation design, roof surface component design, and ground-surface cover design. The window design was based on changing the height of the window while the width was fixed. Four window-to-wall ratios (WWR) of 30%, 50%, 70%, and 90% were selected as design factors [54].
The skin insulation design was based on the heat transmission coefficient values of building sections in different regions (central region). The coefficients were 0.36 W/m2·K (standard for 2010), 0.27 W/m2·K (standard for 2013), 0.21 W/m2·K (standard for 2015), and 0.15 W/m2·K (German passive insulation standard). A green roof (grass and soil depth) and high reflective varnish, which are passive design factors, were implemented in the design of the roof surface components [55,56]. Furthermore, 50% of the concerned area was selected to have greenery, dry land, and porous pavement in its ground surface cover design [57].
Case Selection by Design of Taguchi Experiments
Table 2 lists 16 valid cases that were chosen using orthogonal arrays (L16). We considered four design factors for the apartment complexes, including the window design WWR (A), external wall insulation design (B), roof surface component design (C), and ground-surface cover design (D). Considering four factors for each of the design factors required a total of 256 numerical simulations. In this study, we planned to use experiments designed by the Taguchi method. Therefore, calculations from just 16 numerical simulations would provide results that approximated the results of a complete simulation. The design of Taguchi experiments is a statistical method where the experimenter uses systematic approaches to efficiently conduct experiments, and then effectively analyzes the data obtained to derive accurate results.
Taguchi experimental designs are different from existing experimental designs, in that they set criteria that determine the optimum conditions for an experiment as a distribution of the characteristics. The experimental condition with the smallest distribution of the characteristics is then selected as the optimum condition [58]. Taguchi experimental design advantages include a reduction in the development period, a reduction in the production cost, an improvement in quality, the optimization of processing conditions, the efficient synthesis of technologies, and the effective production of expensive items in large quantities [59].
3. Results
3.1. Measurement Results
Results of Outdoor Thermal Environment Measurement in Apartment Housing Complexes
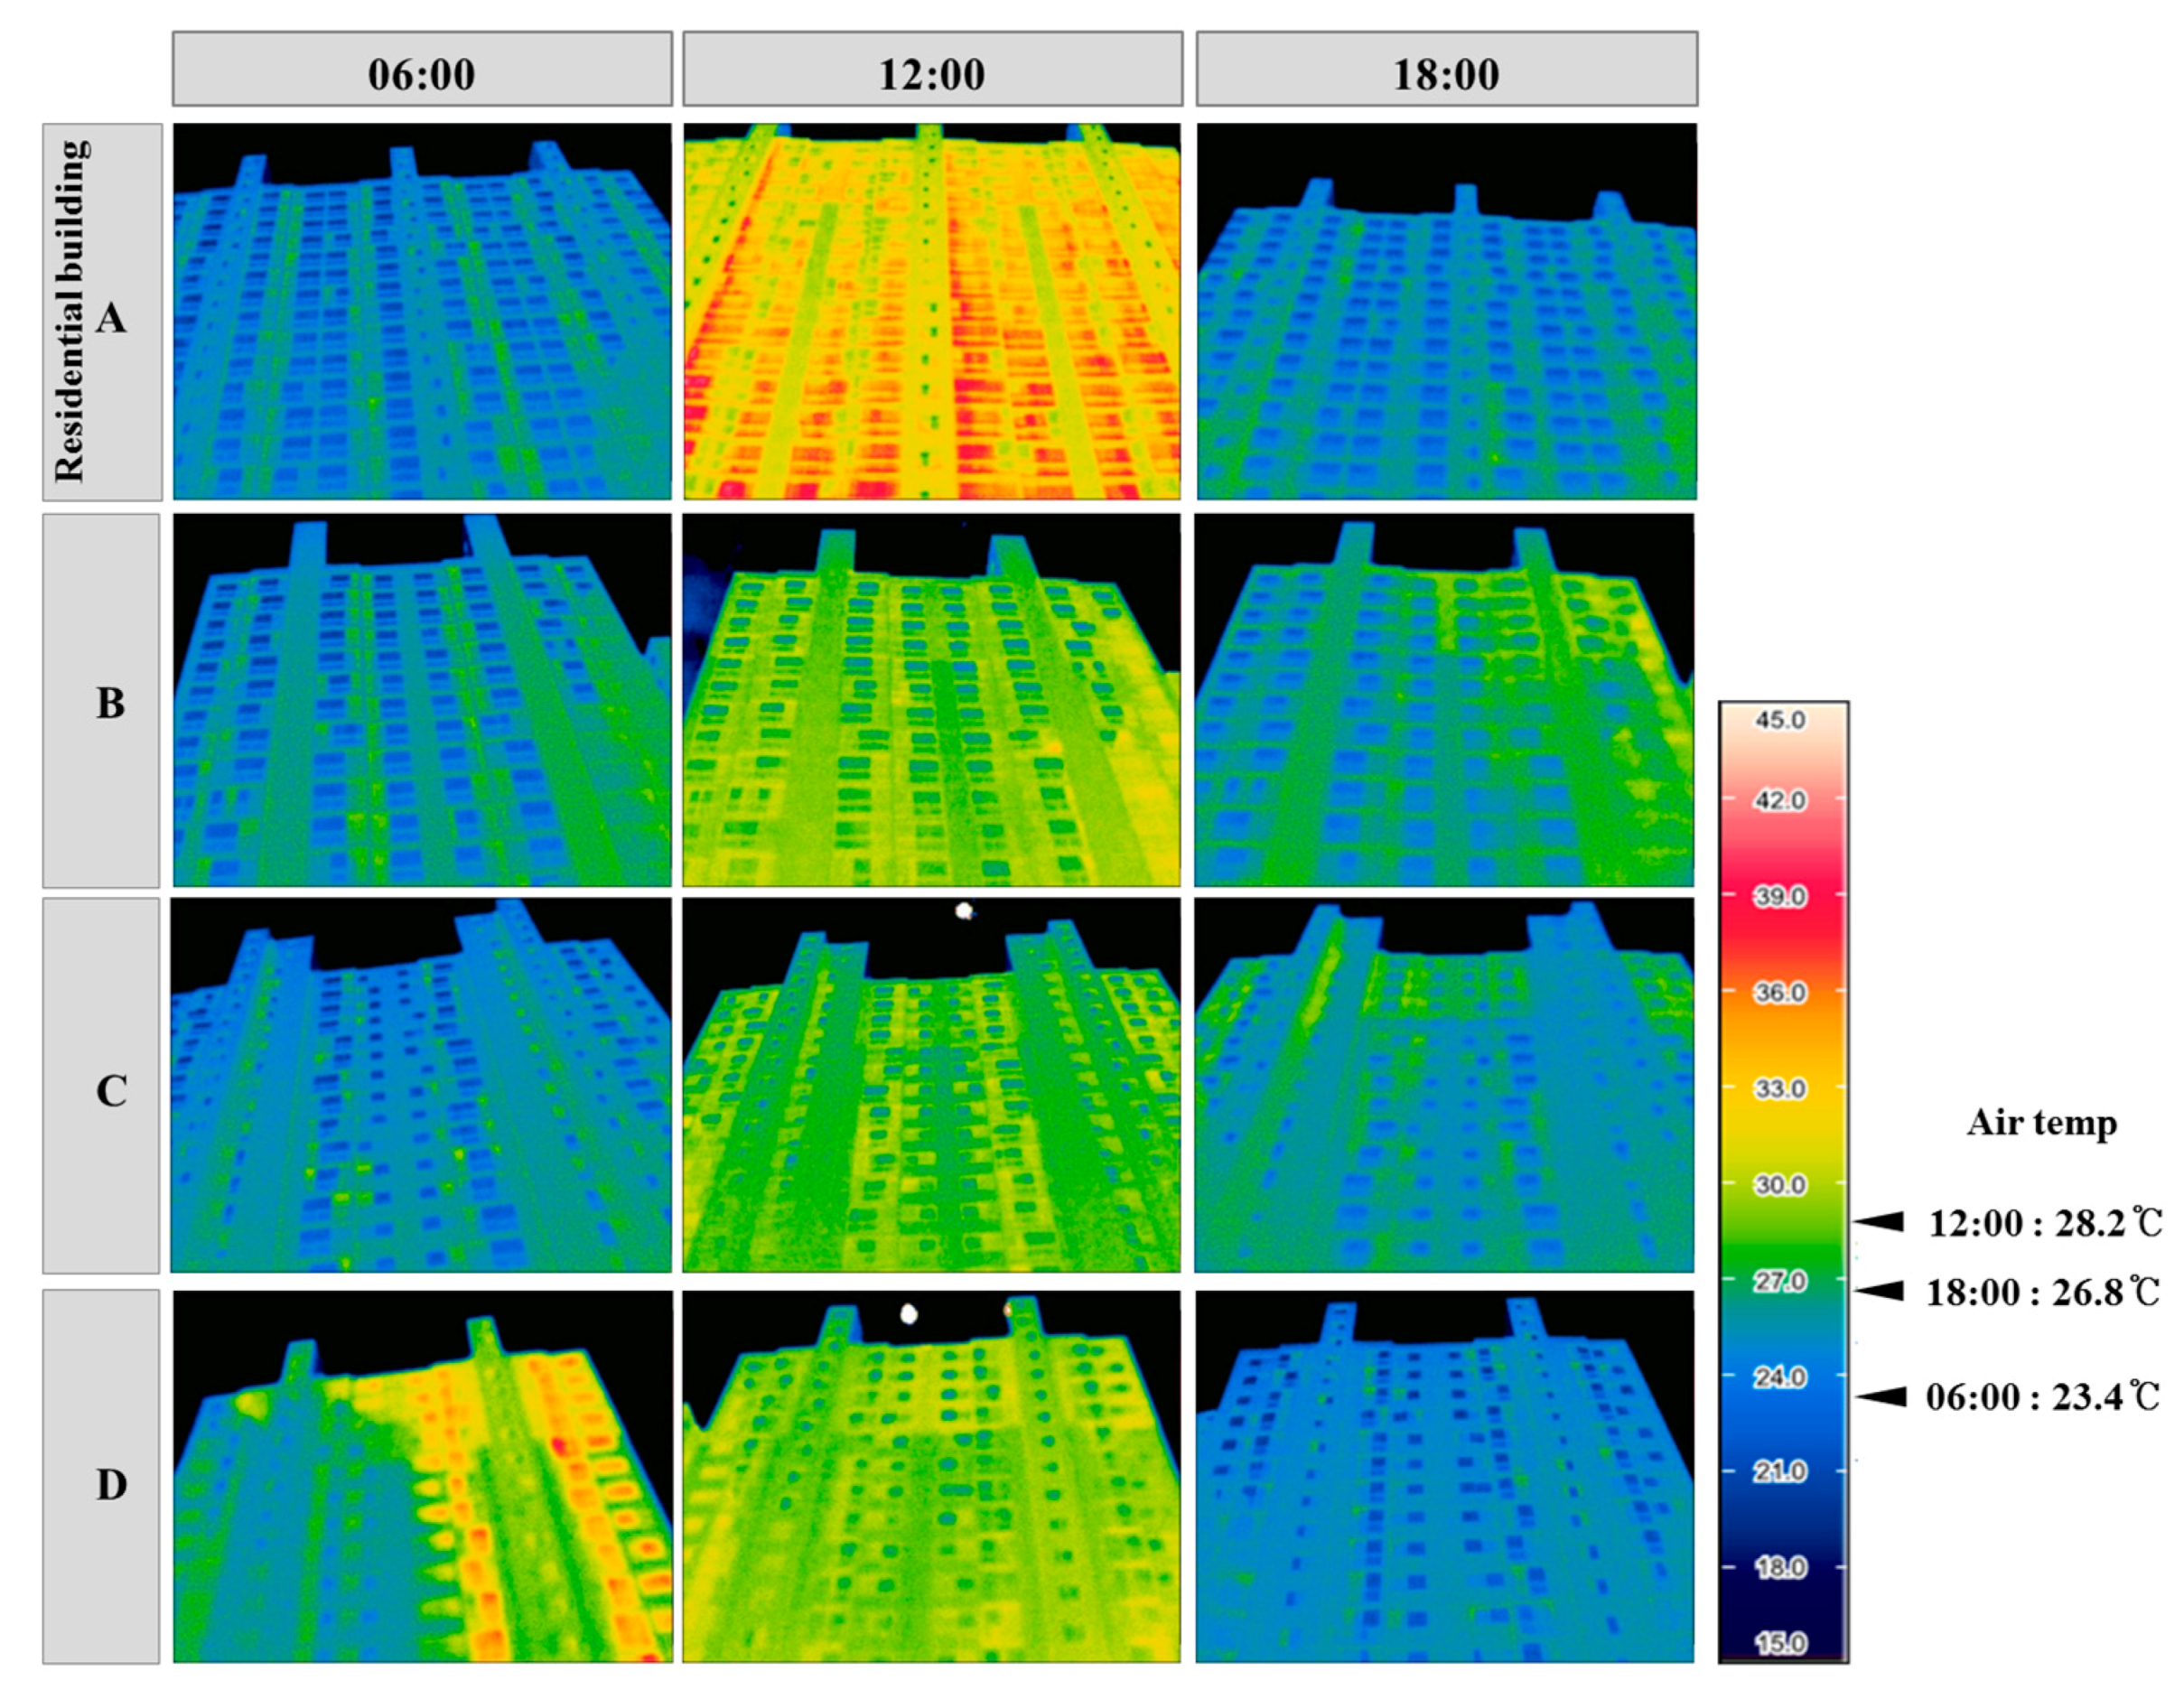
Figure A4 and Figure A5 show images of the field measurements at sunrise (6:00), noon (12:00), and sunset (18:00). These were performed to measure the temperature changes on the residential building surfaces and outdoor ground surfaces over time.
Figure A4 shows images of the field measurements of the entire façade of a building. The distribution of the radiation temperature on the entire façade of a building was obtained using the emissivity coefficient of concrete (0.95), which is the material making up most of the surface of the building. The average radiation temperature of the residential buildings was 24.7–25.5 °C at sunrise, with all of the residential buildings showing very similar surface temperature distributions. At noon, the average temperature was 29.1–33.0 °C. Residential buildings A and C had the highest and lowest radiation temperature distributions, respectively. Differences in the stored solar radiation were presumed to be due to differences in the vertical surface areas that were exposed to direct solar radiation, as a result of the different directions that the residential buildings faced. At sunrise, the average temperature distribution was 25.2–27.8 °C, which was approximately 3.6–5.2 °C lower than the values at noon.
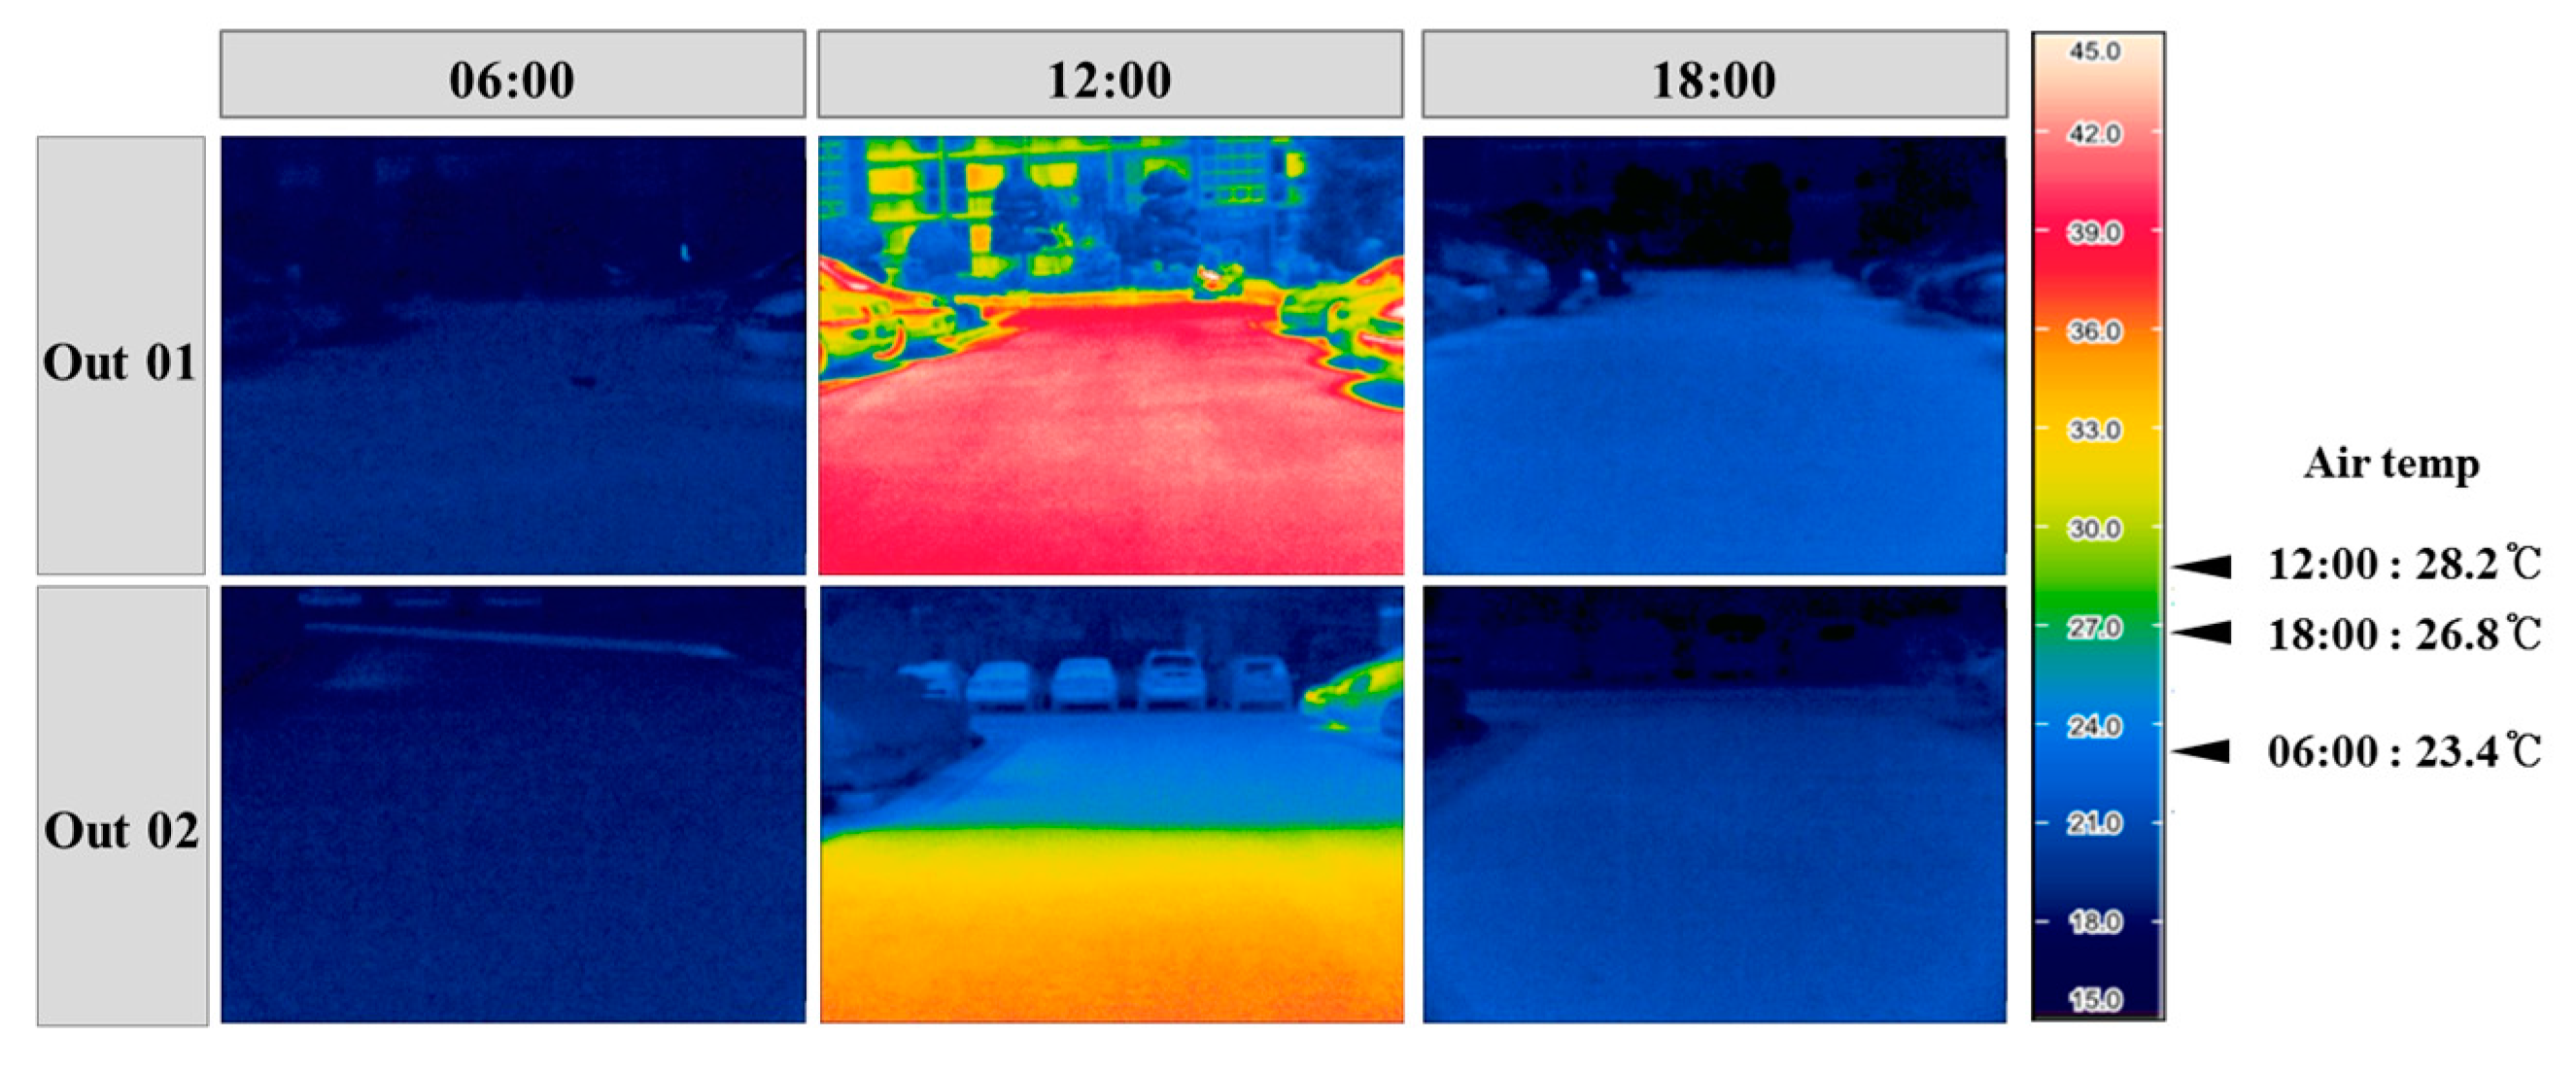
Figure A5 shows thermographic images of the radiation temperature on the ground surfaces. These images were taken at outdoor spaces on the southeast side (Outdoor space 01, Out 01) and northwest side (Outdoor space 02, Out 02). The outdoor space on the south side (Out 01) and the outdoor space on the north side (Out 02) had average temperatures of 29.9 °C and 29.4 °C, respectively, showing a difference of approximately 0.5 °C. At noon, the Out 01 location had an average temperature of 52.4 °C, and Out 02 had an average temperature of 41.9 °C, showing a difference of 10.5 °C. This indicated that the radiation temperature changed with the solar radiation area. At sunset, the Out 01 location had an average temperature of 32.2 °C, and Out 02 had an average temperature of 30.8 °C, showing a difference of approximately 1.4 °C. At sunset and sunrise, the outdoor ground surfaces, with buildings facing different directions, had negligible differences in their radiation temperatures. However, at noon, with strong solar radiation, a temperature difference of more than 10.0 °C was observed.
Figure 7, Figure 8 and Figure 9 show graphs of the sensible heat flux for different components per unit area of a residential building (A, C) or outdoor space (Out 01, Out 02).
Figure 7 shows the calculated sensible heat flux values for different components of an external wall on the southeast side of residential building A. The heat flux from the heated section of a roof was 10.6 W/m2. This increased with time and reached 17.1 W/m2 at sunset. This was assumed to be a material characteristic of the roof (the heat-storing phenomenon). Therefore, a high heat flux was observed at sunset. The external wall of a heated section had a heat flux of 10.4 W/m2 at noon, while at sunset, the heat flux was high at 11.7 W/m2. Owing to almost, the amount of thermal radiation was higher during sunset.
Figure 8 shows the sensible heat flux values of different components of an external wall on the northwest side of residential building C. The distribution of the heat absorption for each component had a range of 19.5–25.4 W/m2 at noon. At sunset, the residential section of the rooftop floor had a high heat flux of 6.1 W/m2, and the residential section of an external wall had a high heat flux of 5.3 W/m2. The sensible heat flux analysis of each component of the external wall on the northwest side showed that the heat-storing phenomenon caused a heat flux from the roof and external wall at sunset.
Figure 9 shows the sensible heat flux values of different components according to the location of the studied subject in the outdoor space. The heat flux at sunrise was 44.4 W/m2, while the heat flux and heat absorption at noon were 108.7 W/m2 and 9.6 W/m2, respectively. The heat flux and heat absorption at sunset were 31.0 W/m2 and 27.5 W/m2, respectively. The sensible heat flux values of the asphalt on the southeast and northwest sides showed similar trends at sunrise, with heat flux values of 18.4 W/m2 and 16.4 W/m2, respectively. However, a significant difference was observed at noon between the asphalt on the southeast side and the asphalt on the northwest side, with heat flux values of 101.7 W/m2 and 5.5 W/m2, respectively.
Additionally, the asphalt on the southeast side and that on the northwest side had heat flux values of 19.3 W/m2 and 11.8 W/m2, respectively, at sunset. This indicated the need to include a ground surface cover during the design of the apartment housing. The green space was in the same location as the asphalt, but the sensible heat flux value was relatively low. This was presumed to be due to evapotranspiration reducing the latent heat, and possibly the sensible heat or conductive heat.
Changes in the shadows cast by buildings according to their locations caused differences in the sensible heat flux values of different components of the ground surfaces. This was confirmed by the field measurements. In addition, even at the same location, the sensible heat flux was different for each component (green space or asphalt). Existing buildings and ground surfaces were covered mostly with artificial skin, which raised the outside air temperature. This caused the urban heat island effect and the tropical night phenomenon. The measurements confirmed that plans for building surfaces and ground surfaces that use natural skin and eco-friendly design factors should be implemented at the architectural planning stage to improve outdoor thermal environments.
3.2. Simulation Results
3.2.1. Results of Outdoor Thermal Environment Simulation for Apartment Complex Where Field Measurements Were Conducted
Table 3 lists the surface temperatures at different times for all four residential buildings (A–D) in the apartment complex where the field measurements were conducted.
The average surface temperature at sunrise was approximately 24.2 °C for all of the residential buildings, and there was no significant difference between them. At noon, the temperature was 30.4 °C on average. Building A showed the highest temperature, with an average of 30.7 °C, and buildings B and C showed the lowest temperatures, with an average of 30.2 °C.
The reason for the differences in the surface temperatures of the buildings was thought to be the heat-storing phenomenon caused by differences in their solar absorptivity values. At sunset, the temperature was 28.2 °C on average, except for building A, which had a wide area of solar absorptivity. The average surface temperatures for buildings B and C were almost the same.
Figure 10 shows the changes in the entire surface temperature for a multiple city block area during a single day. The lowest temperature was 25.5 °C at sunrise. It then rose to 40.0 °C at noon, and decreased to 32.4 °C at sunset. The temperature began to rise after sunrise and reached a peak of 41.1 °C at 14:00. After 20:00, the difference in the hourly HIP temperature was small, at 0.6 °C. Because the lowest temperature was approximately 25.0 °C, the heat island effect was expected to occur as a result of the ground surfaces maintaining a high temperature until late in the evening due to the artificial skin covering.
A time interval of 12:00 to 15:00 was selected to assess the MRT in an outdoor space during the afternoon, when the amount of solar radiation was the largest. Following an increase in the amount of solar radiation, a strong radiant heat value was caused by radiation absorption. Thus, a difference of approximately 5.7 °C occurred between the lowest temperature of 25.5 °C and the highest temperature of 31.2 °C (Table 4). Figure A6 shows an image of the entire surface temperatures at 12:00.
3.2.2. Validity Assessment of Analysis Method for Outdoor Thermal Environment Simulation
Before conducting the simulation, its validity was assessed. From the results of the field measurement discussed in Section 3.1 and Section 3.2.1, the surface temperatures of the four residential buildings (A to D) measured by thermography were used for the assessment. The temperatures on the residential building surfaces measured by thermography and the temperatures calculated in the simulation for the same surfaces (buildings A to D) were compared.
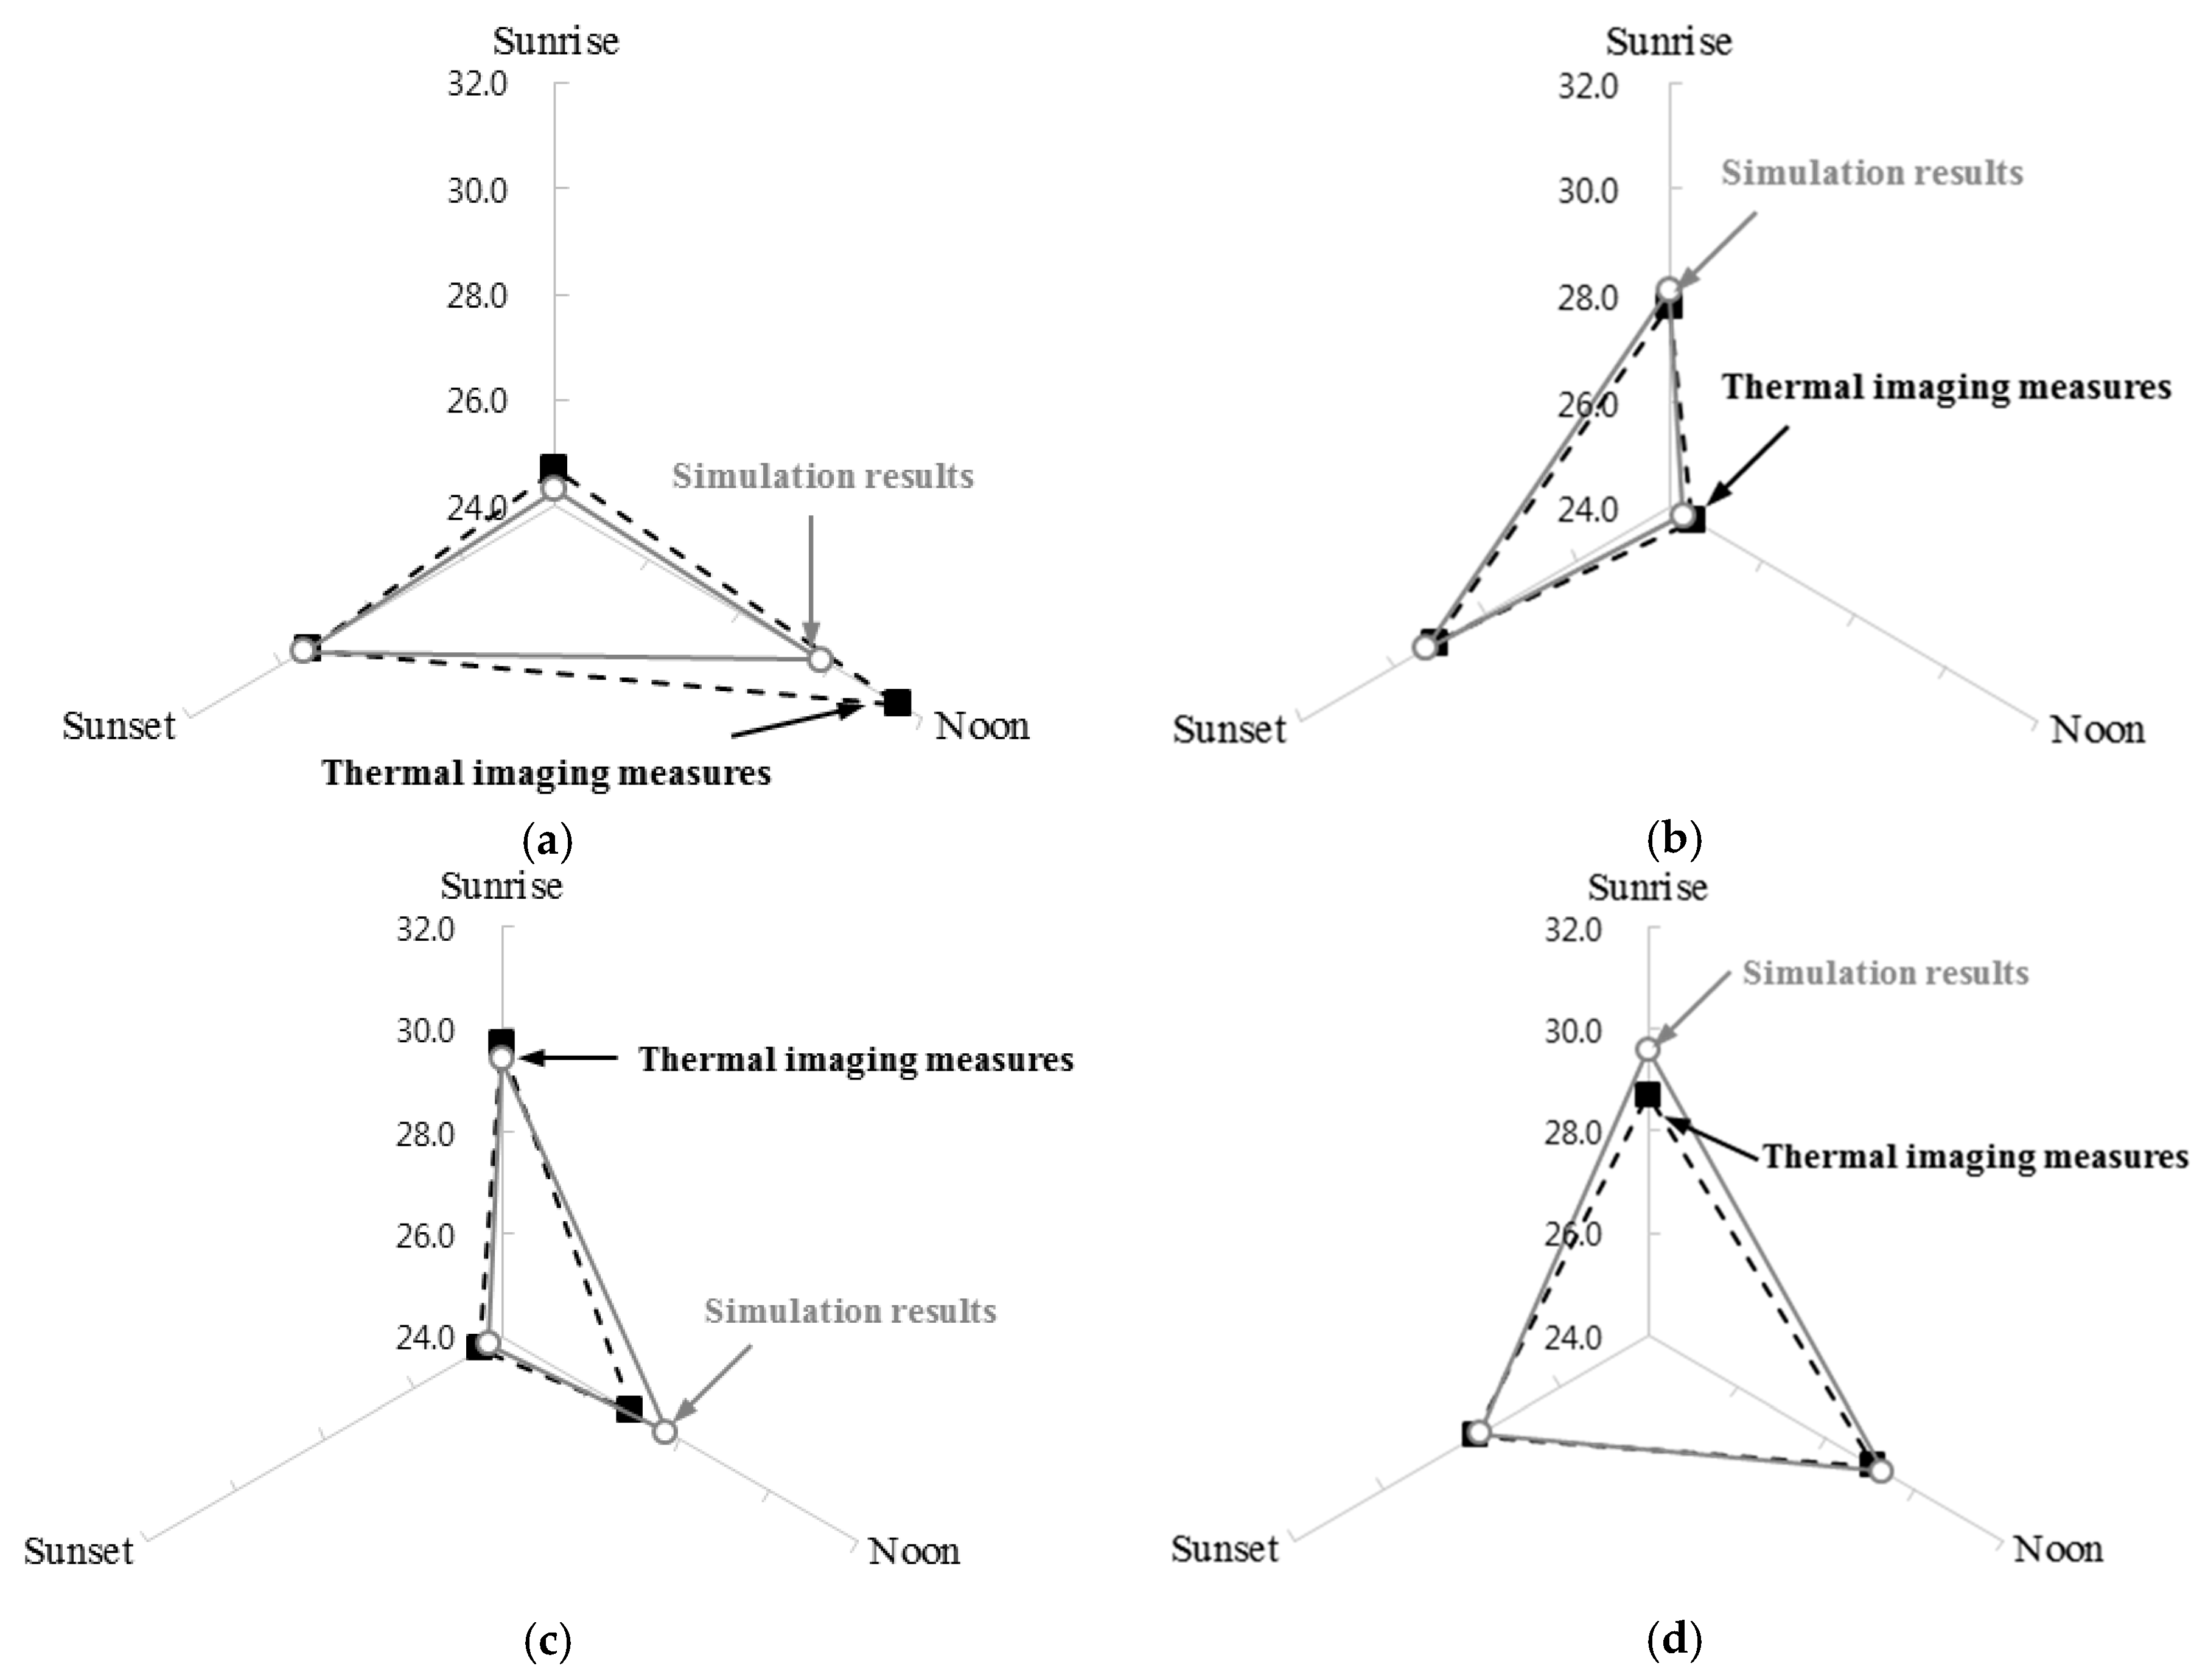
Figure 11 show the results of comparisons of the average surface temperatures measured by thermography and the average surface temperatures calculated in the simulations. The temperature distribution of each residential building had different patterns for different analysis times. The difference in the temperature distribution patterns between sunrise, noon, and sunset was presumed to result from solar radiation differences according to the location of the residential building. The measured thermography and simulated values had differences of approximately 0.1–1.7 °C, and the average error was 0.4 °C.
The largest difference between the surface temperatures occurred at the time that the amount of solar radiation increased. This difference may have been the result of the difference between the indoor temperature when the thermographic images were taken and the indoor temperatures of the simulation. In addition, radiant heat may have been emitted from the wall of a neighboring residential building, which may have affected the surface temperature. The comparison indicated that the surface temperatures measured by thermography and calculated in the simulations were similar. Thus, the simulation results were thought to be appropriate for application to the outdoor thermal environment assessment in this study.
3.2.3. Results of Outdoor Thermal Environment Simulation Performed Based on Experimental Design
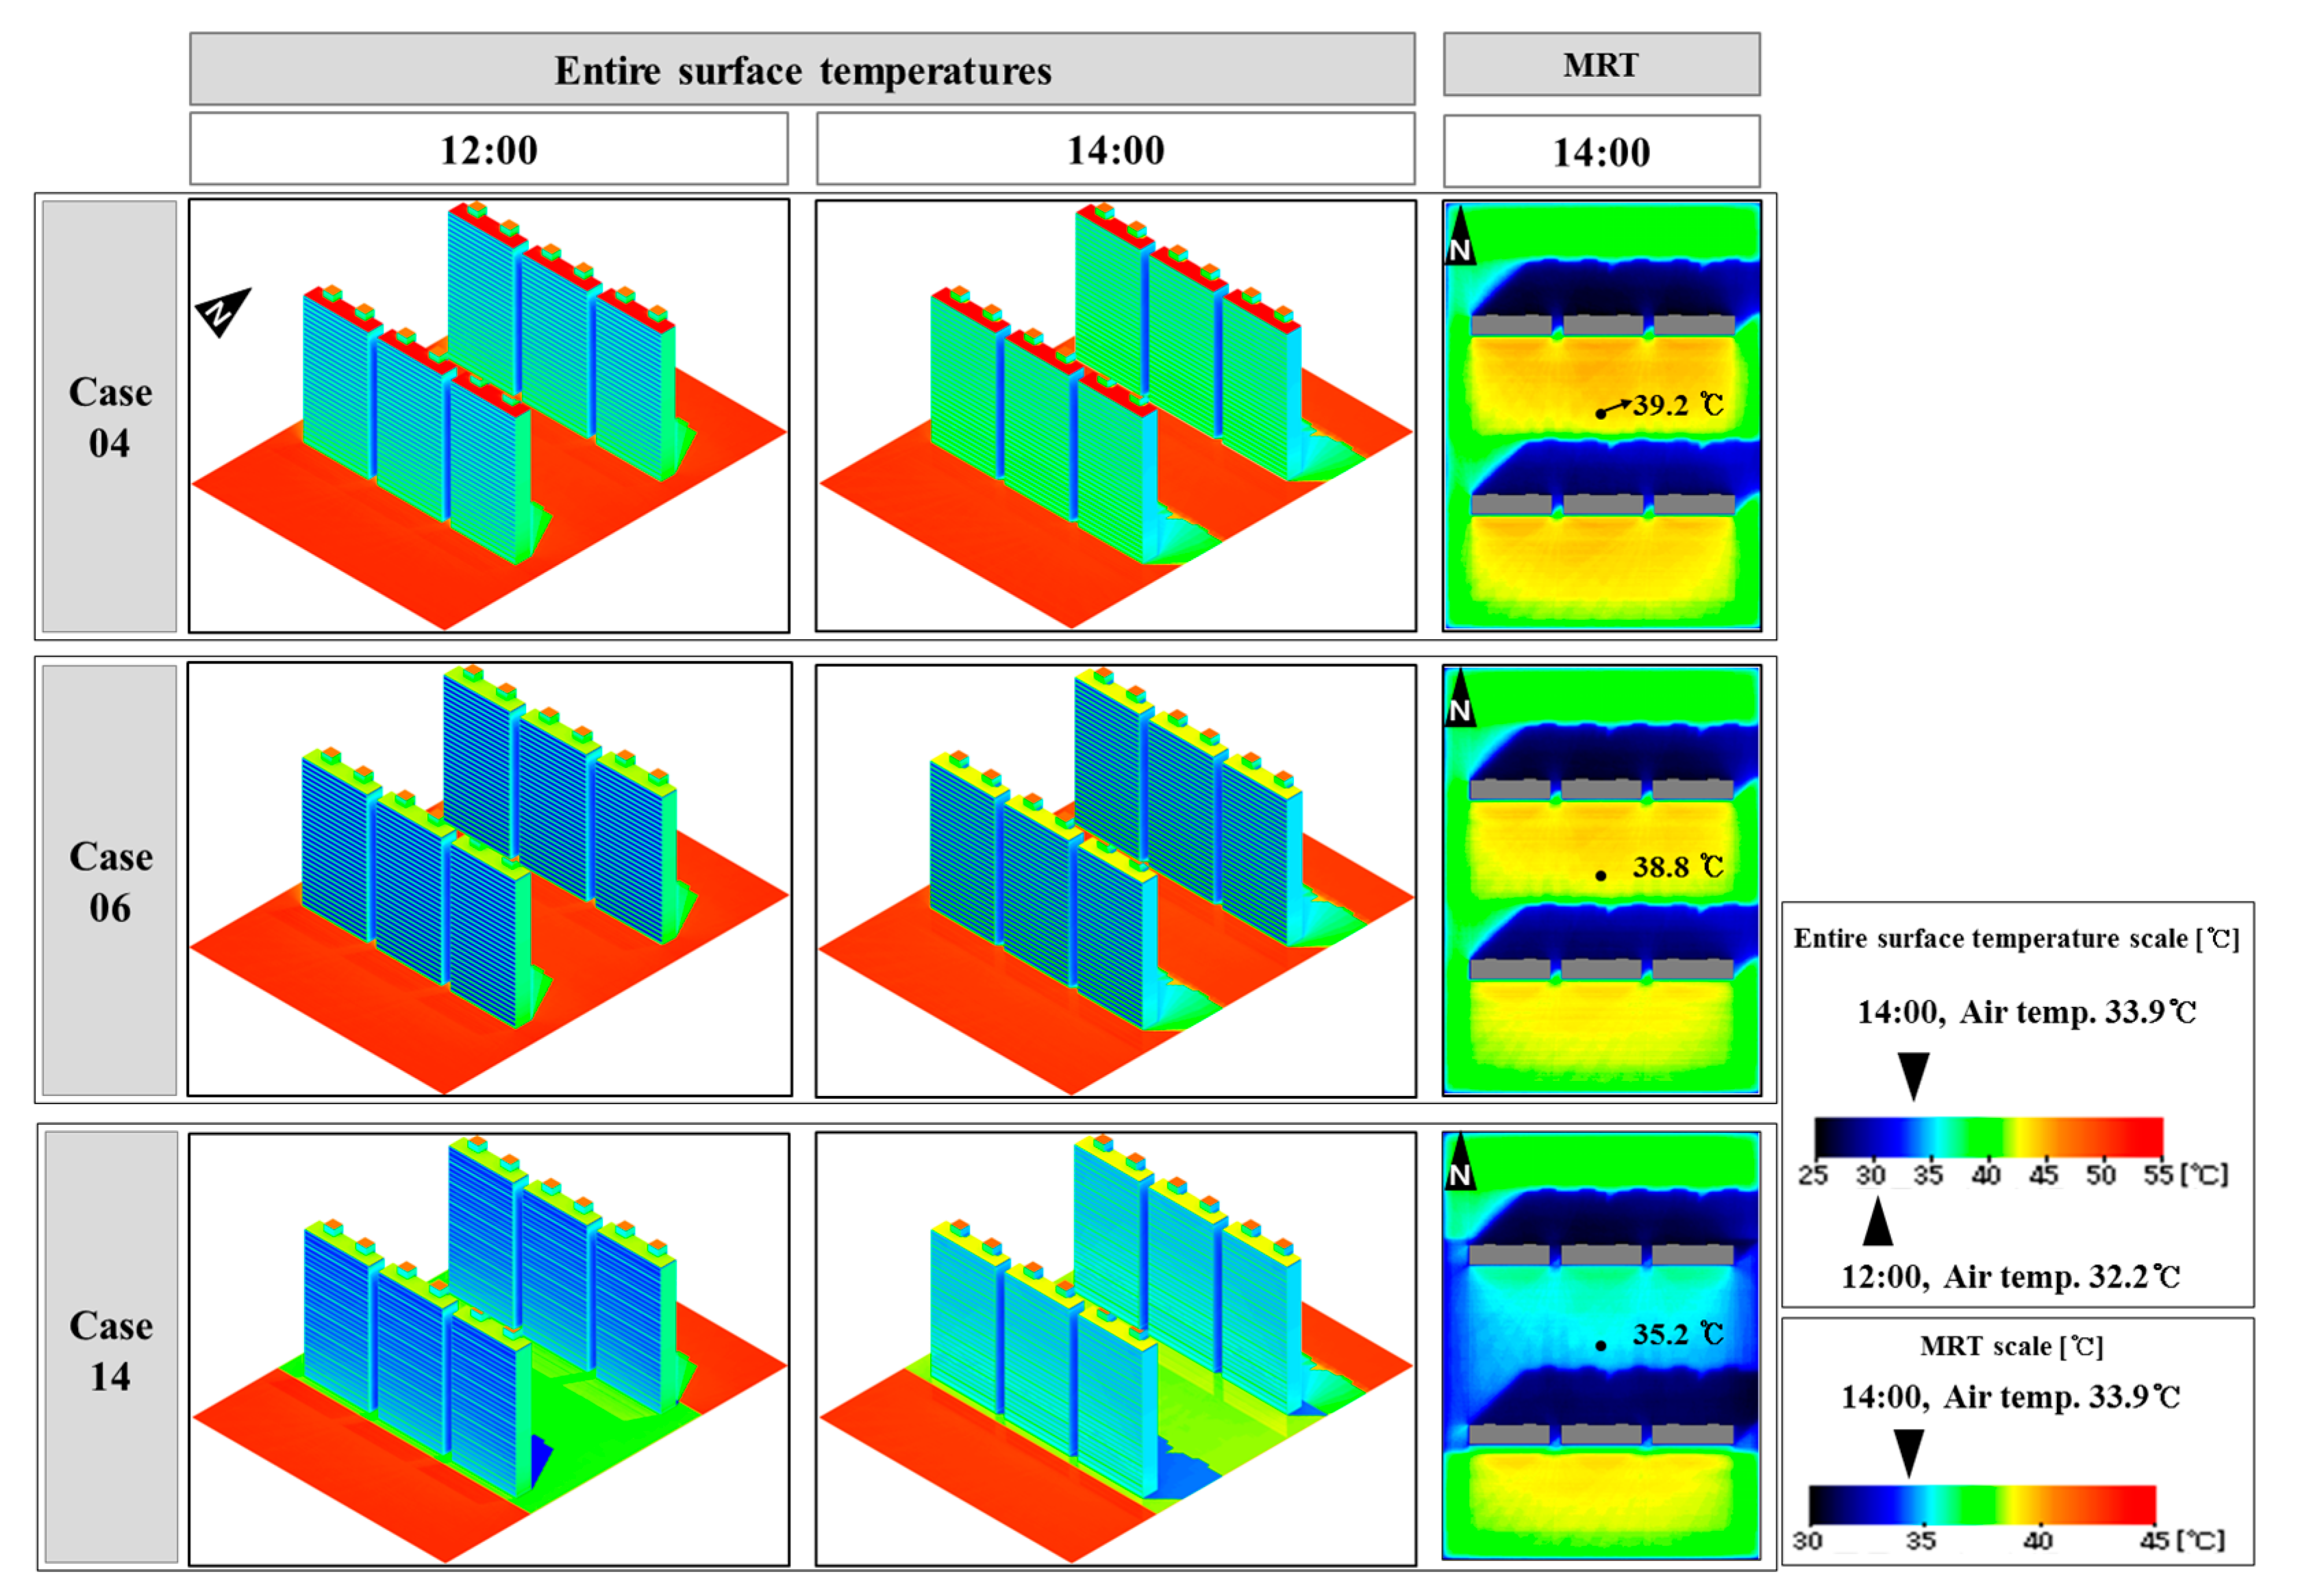
Table 5 lists the temperature changes for the 16 cases representing different design factors. The temperatures were monitored at the following times: 6:00, 12:00, 14:00, and 19:00. Case 4 shows the highest entire surface temperature distribution, which indicates that the outdoor thermal environment for this case is the poorest. The entire surface temperatures of the residential buildings were lower in case 6 and case 14. In case 6, the temperatures at 12:00 and 14:00 (when the amount of solar radiation was the greatest) were low at 33.1 °C and 34.4 °C, respectively. In case 14, the temperatures at 6:00 (sunrise) and 19:00 (after sunset) were low at 26.0 °C and 29.3 °C, respectively. The differences between the highest and lowest temperatures for each measurement time were 0.8 °C at 6:00, 1.4 °C at 12:00, 1.4 °C at 14:00, and 1.2 °C at 17:00 These temperature differences were caused by differences in the radiation factor, reflexibility, and heat transfer rate of the component materials.
The MRT was calculated at a height of 1.5 m above the ground at the center of the measurement area at 14:00 The MRT value was the highest for case 4 and the lowest for case 14. The MRT values for case 4 and case 14 were 39.2 °C and 35.2 °C, respectively. Thus, the difference was approximately 4.0 °C. This result indicates that the selection of the material for the ground surface plays a significant role in creating a comfortable outdoor thermal environment.
With respect to the measurement times, case 4 showed the highest value of HIP and case 14 showed the lowest HIP temperature distribution. The temperature differences were 2.8 °C at 6:00, 4.8 °C at 12:00, 4.4 °C at 14:00, and 3.2 °C at 19:00. These results confirmed that the application of a natural skin such as greenery on ground or building surfaces is effective in reducing the heat island phenomenon.
Figure A7 shows an image of the entire surface temperature (at 12:00 and 14:00) and MRT (14:00) for cases 4, 6 and 14.
3.2.4. Determining Design Factors for Surface Planning to Improve Outdoor Thermal Environment
The design factors that affect outdoor thermal environments were determined by applying the Taguchi experimental design method and a correlation analysis. This helped to predict design factors that are effective in reducing the heat in outdoor environments.
Table 6 lists the significance probability results from an experimental analysis using the Taguchi method. The design of experiments by the Taguchi method adopted a loss function and the signal-to-noise (SN) ratio from telecommunications engineering to expand the range of its applications. The design factors that affected the outdoor thermal environment of an apartment housing complex were the window design WWR (A) and ground surface cover design (D). The effects of the insulation design for external walls (B) and roof surface component design (C) on the outdoor thermal environment were understood to be negligible.
In addition, according to the SN delta statistics on the design factors, the delta value of the land-covering plan was 0.45, which indicated that it had the most significant influence on the outdoor thermal environment. The value for the window plan was 0.13. The values for the roof surface material and skin insulation were 0.11 and 0.08, respectively.
Table 7 lists the results of the analysis of the correlation between each of the design factors and the outdoor thermal environment. This analysis was conducted to review the influences of the design factors for apartment complex surface plans on the outdoor thermal environment. Among the design factors, the plan for windows (WWR) affected the entire surface temperature of building and HIP. The window plan showed a significant negative relationship (−0.734) with the entire surface temperature of building. This result indicates that the entire surface temperature of building decreases following an increase in the window-to-wall ratio. The level of the window plan’s correlation with HIP was −0.499, which demonstrates that an increase in the window-to-wall ratio decreases the HIP temperature distribution.
The thermal environment index that was most affected by the window plan (WWR) was the entire surface temperature of building. This result will be useful in establishing plans to reduce the entire surface temperature of building. The surface cover plan had negative correlations with MRT and HIP of −0.751 and −0.604, respectively. When a surface cover material such as greenery was applied, the MRT and HIP temperature distribution decreased. The analysis revealed that the MRT was most affected by the surface cover plan. This result will be useful in planning a comfortable outdoor environment. The correlation between the outdoor thermal environment indices and the outer-wall insulation plan, and between the indices and the roof surface material, appeared to be insignificant. Reduced glass surface temperature owing to air conditioning has cooling effects in terms of the outdoor thermal radiation; however, outdoor air emissions from air conditioning may cause sensible heat emission, increasing the possibility of a negative effect on outdoor thermal conditions. Evaluation of outdoor thermal effects, such as sensible heat dissipation from buildings, can be projects saved for the future.
4. Conclusions
This study quantitatively analyzed the design factors used for urban and architectural planning in a cluster of residential buildings (a small unit that constitutes a city) to explore ways to improve the urban microclimate. This study analyzed a variety of cases in which different design factors were combined to determine the optimum design factors for improving the outdoor thermal environment.
To measure the radiation temperature of an existing apartment complex at different times and quantitatively analyze its impact on increases in urban temperature, the sensible heat flux for each residential building and each ground surface material was identified. The radiation temperature distributions for buildings differed based on the direction that the building faced, and the radiation temperature distributions for ground surfaces varied based on the location of the ground surface area. This difference is thought to be attributable to the difference in the vertical area exposed to direct solar radiation based on the locations the buildings faced, as well as the difference in the ground surface area exposed to solar radiation (which is caused by differences in the shadows that the buildings cast over the ground).
The sensible heat flux values for different surface materials differed based on changes in the shadows cast by buildings at different locations. Windows radiated more heat than outer walls at noon because of solar radiation, and the roof radiated more heat than the outer walls at sunset because of the heat storage on the roof. This indicated that eco-friendly technologies need to be applied to the plans for windows and rooftops. In addition, the sensible heat flux values differed for the different materials used to cover the ground surfaces, such as greenery and asphalt, even at the same location. This result confirmed that the component materials used in apartment complexes cause the heat island and tropical island phenomena. It also indicated that the comfort levels of urban outdoor environments differ according to the design factors applied in urban and apartment housing complex planning.
To determine the building skin and ground surface design factors that most affect the outdoor thermal environment, a case study was conducted using a table of orthogonal arrays (L16). The results of the study indicated differences in the entire surface temperature of building, MRT, and HIP for different combinations of design factors. Notably, the cases in which natural skin was applied to residential buildings and outdoor ground surfaces showed lower temperature distributions than the other cases.
When the significance probabilities of the design factors for the surface plans for apartment buildings and land cover were analyzed based on the Taguchi experimental design method, the window plan and land cover plan were found to have the most influence on the outdoor thermal environment. Meanwhile, the correlation between the outdoor thermal environment indices and the outer-wall insulation plan, and between the indices and the roof surface material, appeared to be insignificant.
The result of the analysis of the correlations between the design factors for an apartment complex’s surface plans and outdoor thermal environment indices (entire surface temperature, MRT, and HIP) showed that the window plan correlated with the entire surface temperature and HIP (correlation coefficients of −0.734 and −0.499). When the WWR increased, the entire surface temperature decreased, and the HIP temperature distribution also decreased. This result confirmed the fact that the WWR is especially influential in reducing a building’s entire surface temperature. The land cover plan correlated with the MRT and HIP (correlation coefficients of −0.751 and −0.604, respectively). This indicated that the MRT and HIP temperature distribution decreases when the green space area increases. Thus, green spaces can enhance the level of comfort in an outdoor environment and can reduce the heat island phenomenon. Reduction in glass surface temperature has cooling effects in terms of the outdoor thermal radiation; however, outdoor air emissions owing to air conditioning may cause sensible heat emission, increasing the possibility of a negative effect on outdoor temperature (Table 8).
Nevertheless, the aim of this study was to obtain quantitative predictions and analyses on the effects of exterior materials on the outdoor thermal environment and comfort in housing complex design elements, from the perspective of a summer radiation environment; other complex effects associated with temperature increase from indoor cooling conditions and outdoor sensible heat emissions are good topics for future projects.
Acknowledgments
This research was supported by Basic Science Research Program through the National Research Foundation of Korea (NRF) funded by the Ministry of Science, ICT and Future Planning (2015R1A2A2A01007849).
Author Contributions
Sukjin Jung and Seonghwan Yoon conceived and designed the measurements; Sukjin Jung performed the measurements and simulation, and analyzed the data. Sukjin Jung visualized the results. Sukjin Jung wrote the paper with help from Seonghwan Yoon. All of the authors contributed to the final version of the manuscript by proofreading and bringing in constructive ideas.
Conflicts of Interest
The authors declare no conflict of interest.
Nomenclature
| sensible heat flux [W/m2] | ℯ | water vapor pressure near the ground [Pa] | |
| convective heat transfer coefficient [W/m2 K] | convective heat transfer coefficient [W/m2·K] | ||
| surface temperature [°C] | evaporation heat [J/kg] | ||
| air temperature [°C] | evaporation efficient [kg/m2·kg/kg´] | ||
| an area of an element [m2] | absolute humidity [ kg/kg´] | ||
| air velocity [m/s] | heat conductivity [W/m·K] | ||
| net solar radiation [W/m2] | volumetric specific heat [W/m·K] | ||
| net long wave radiation [W/m2] | cloud amount (0 ≤≤ 10) | ||
| atmospheric radiation [W/m2] | coefficient of cloud altitude | ||
| long wave radiation from surrounding buildings and ground [W/m2] | over-all heat transfer coefficient [W/m2·K] | ||
| sensible heat flux [W/m2] | surface temperature for indoor side [K] | ||
| latent heat flux [W/m2] | room air temperature [K] | ||
| conductive heat flux [W/m2] | total number of a very small surface | ||
| temperature [K] | form factor of a very small surface | ||
| solar absorptivity | surface temperature [K] | ||
| incidence angle of direct solar radiation [rad] | area of the site plan [m2] | ||
| amount of direct solar radiation [W/m2] | Subscripts | ||
| shape modulus (sky:sky factor) | s | surface | |
| amount of sky solar radiation [W/m2] | a | atmosphere | |
| amount of reflected solar radiation [W/m2] | w | surrounding building and ground | |
| long wave emittance | n | total number of objects that emit long wave radiation | |
| Stefan Boltzmann constant | |||
| constant in Brunt’s formula [W/m2K4] | |||
Appendix A

Table A1.
Properties of materials of housing block.
| Properties | Solar Reflectance | Long Wave Emissivity | Solar Transmittance | Thermal Conductivity [W/m·K] | Volumetric Specific Heat [J/m3·K] | ||
|---|---|---|---|---|---|---|---|
| Materials | Diffuse | Specular | |||||
| concrete | 0.2 | 0.0 | 0.9 | 0.0 | 1.6 | 1,896,000 | |
| pressed concrete | 0.2 | 0.0 | 0.9 | 0.0 | 1.5 | 1,896,000 | |
| mortar | 0.0 | 0.0 | 0.95 | 0.0 | 1.5 | 1,600,000 | |
| waterproof mortar | 0.0 | 0.0 | 0.95 | 0.0 | 1.5 | 1,600,000 | |
| plaster board | 0.0 | 0.0 | 0.95 | 0.0 | 0.22 | 904,000 | |
| insulation | 0.0 | 0.0 | 0.95 | 0.0 | 0.034 | 25,000 | |
| 6-mm thick glass | 0.0 | 0.072 | 0.094 | 0.802 | 1.0 | 1,913,862 | |
| air space | 0.0 | 0.0 | 0.0 | 1.0 | 0.09 | 1298 | |
| asphalt | 0.1 | 0.0 | 0.9 | 0.0 | 0.7 | 2,000,000 | |
| green space | 0.8 | 0.0 | 0.9 | 0.0 | 0.3 | 1,400,000 | |
| porous pavement | 0.2 | 0.0 | 0.9 | 0.0 | 0.7 | 2,055,000 | |
| bare soil | 0.2 | 0.0 | 0.9 | 0.0 | 0.5 | 1,600,000 | |
| soil depth | 0.0 | 0.0 | 0.94 | 0.0 | 1.5 | 3,100,000 | |
| high reflectivity | 0.7 | 0.0 | 0.75 | 0.0 | 0.0 | 0 | |
Figure A1.
Numerical simulation process and algorithm.
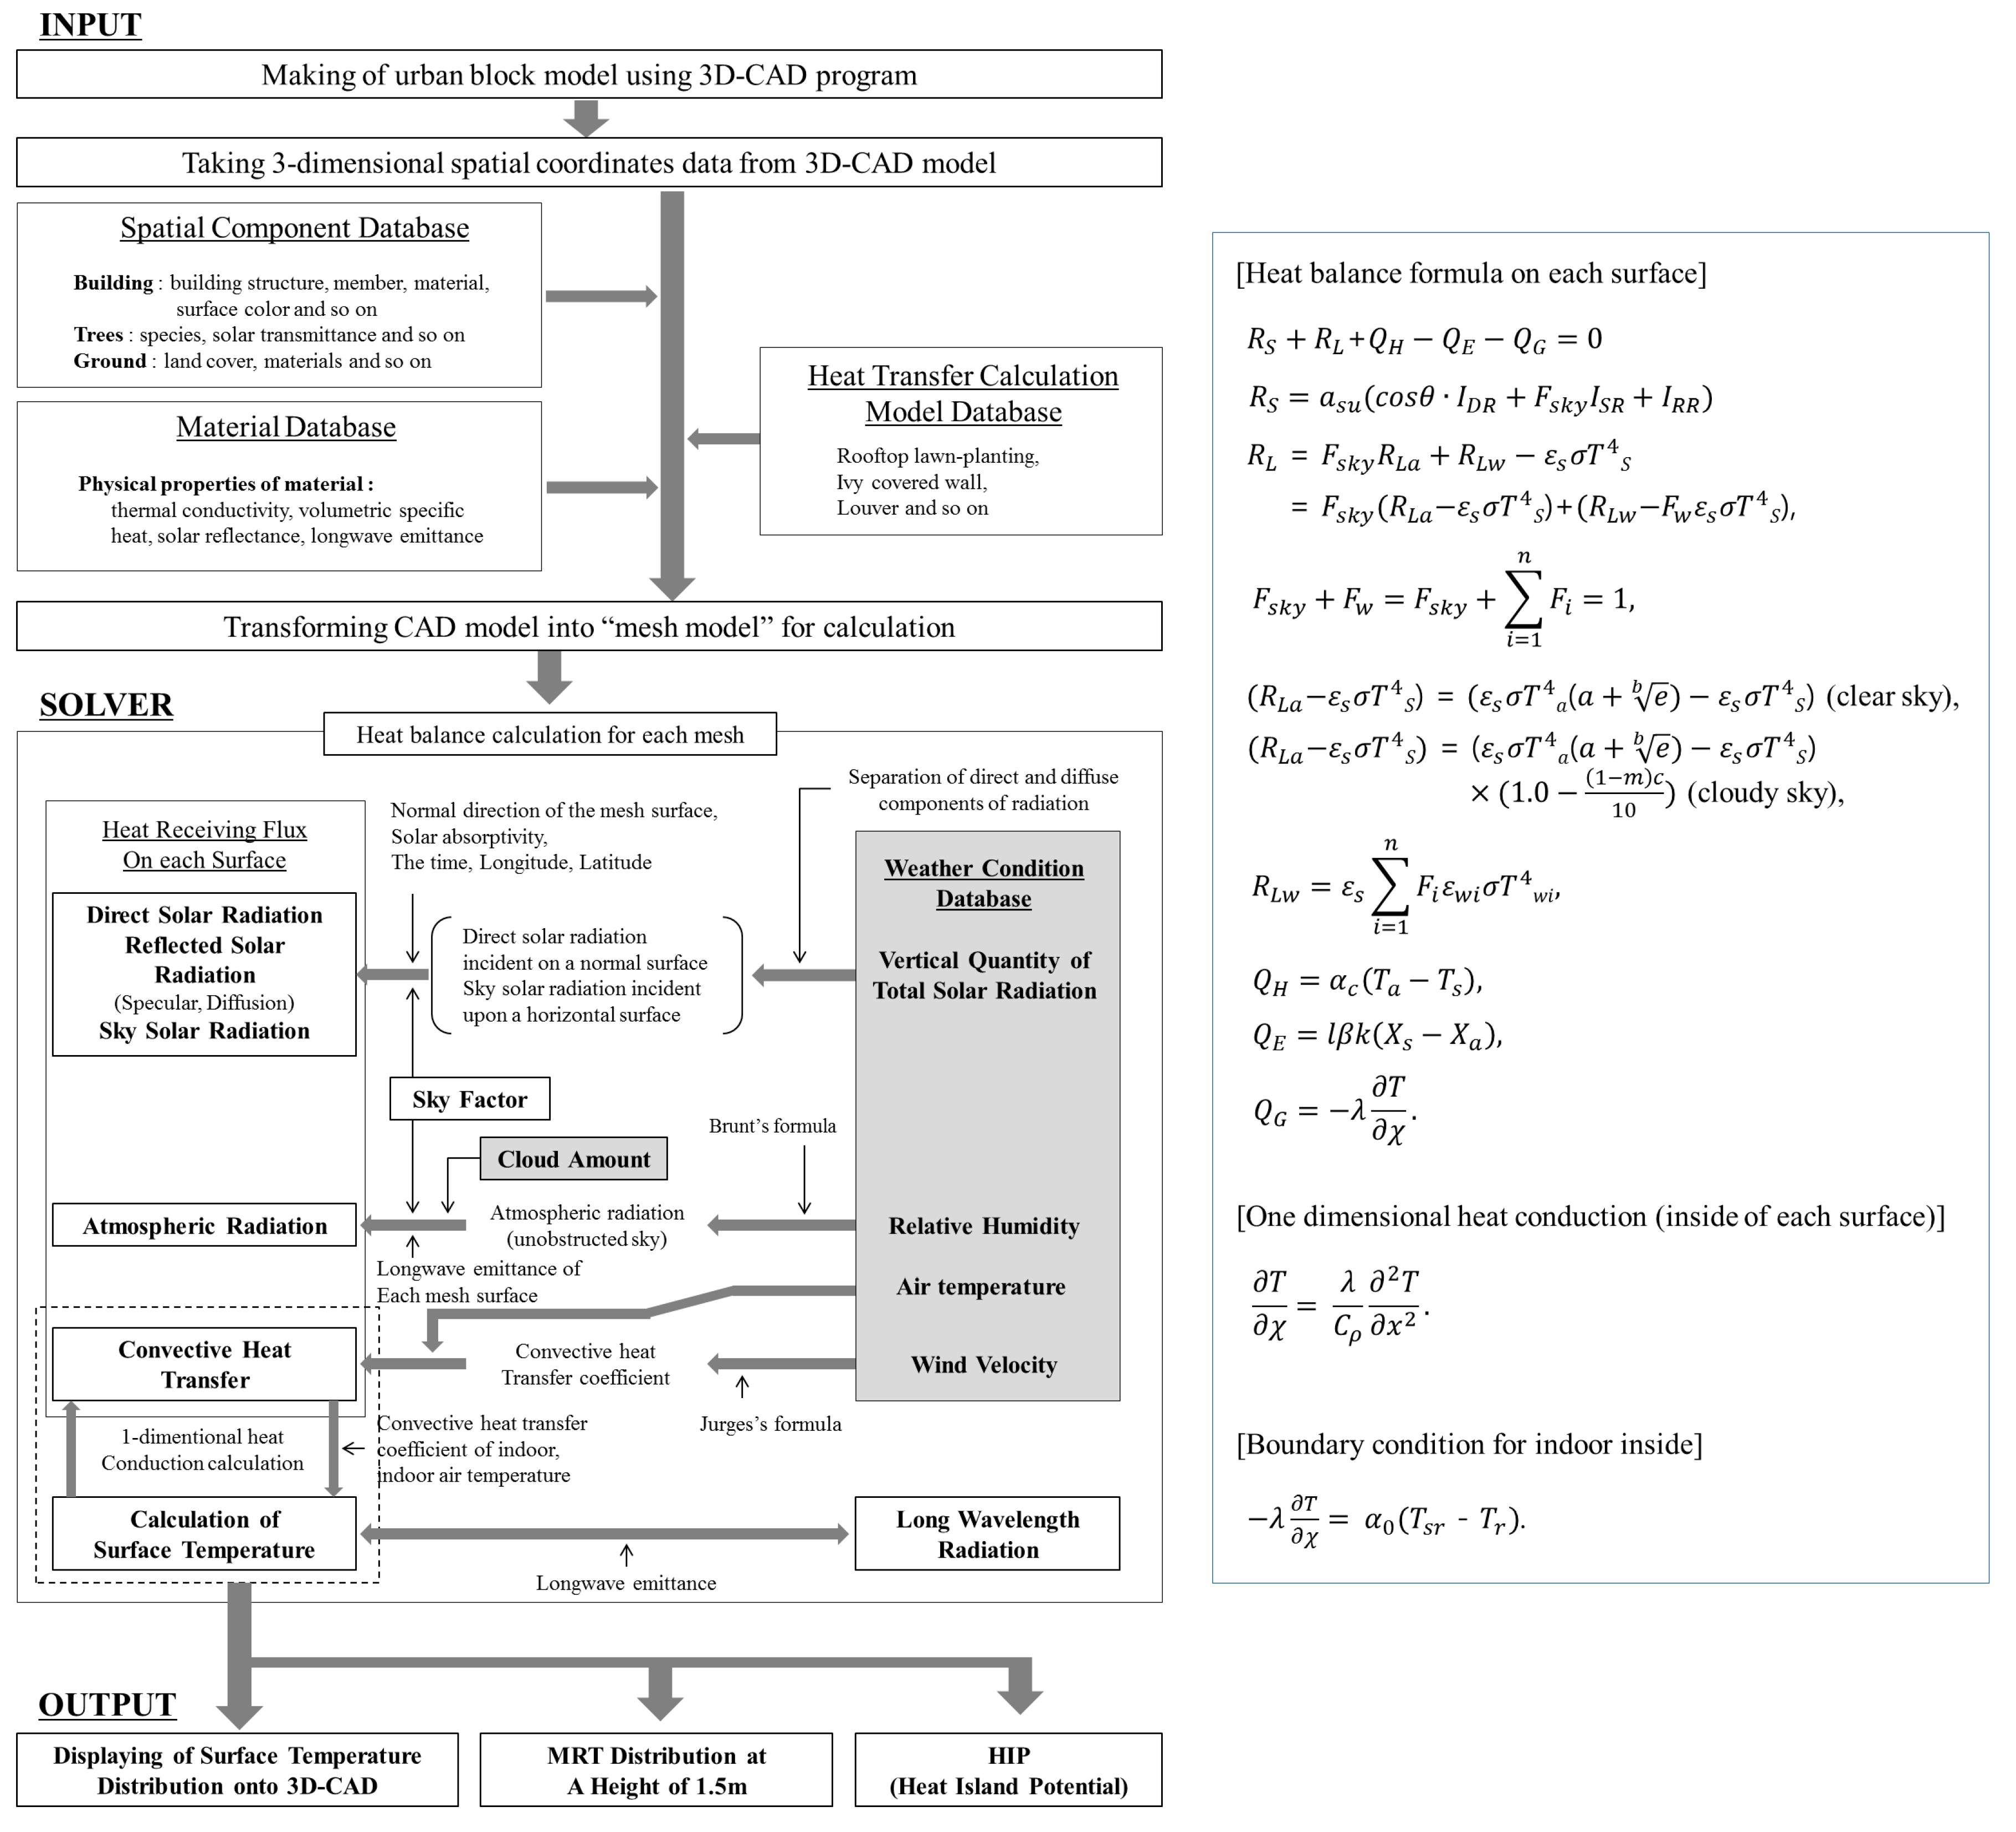
Figure A2.
Weather conditions for outdoor thermal environment simulation.
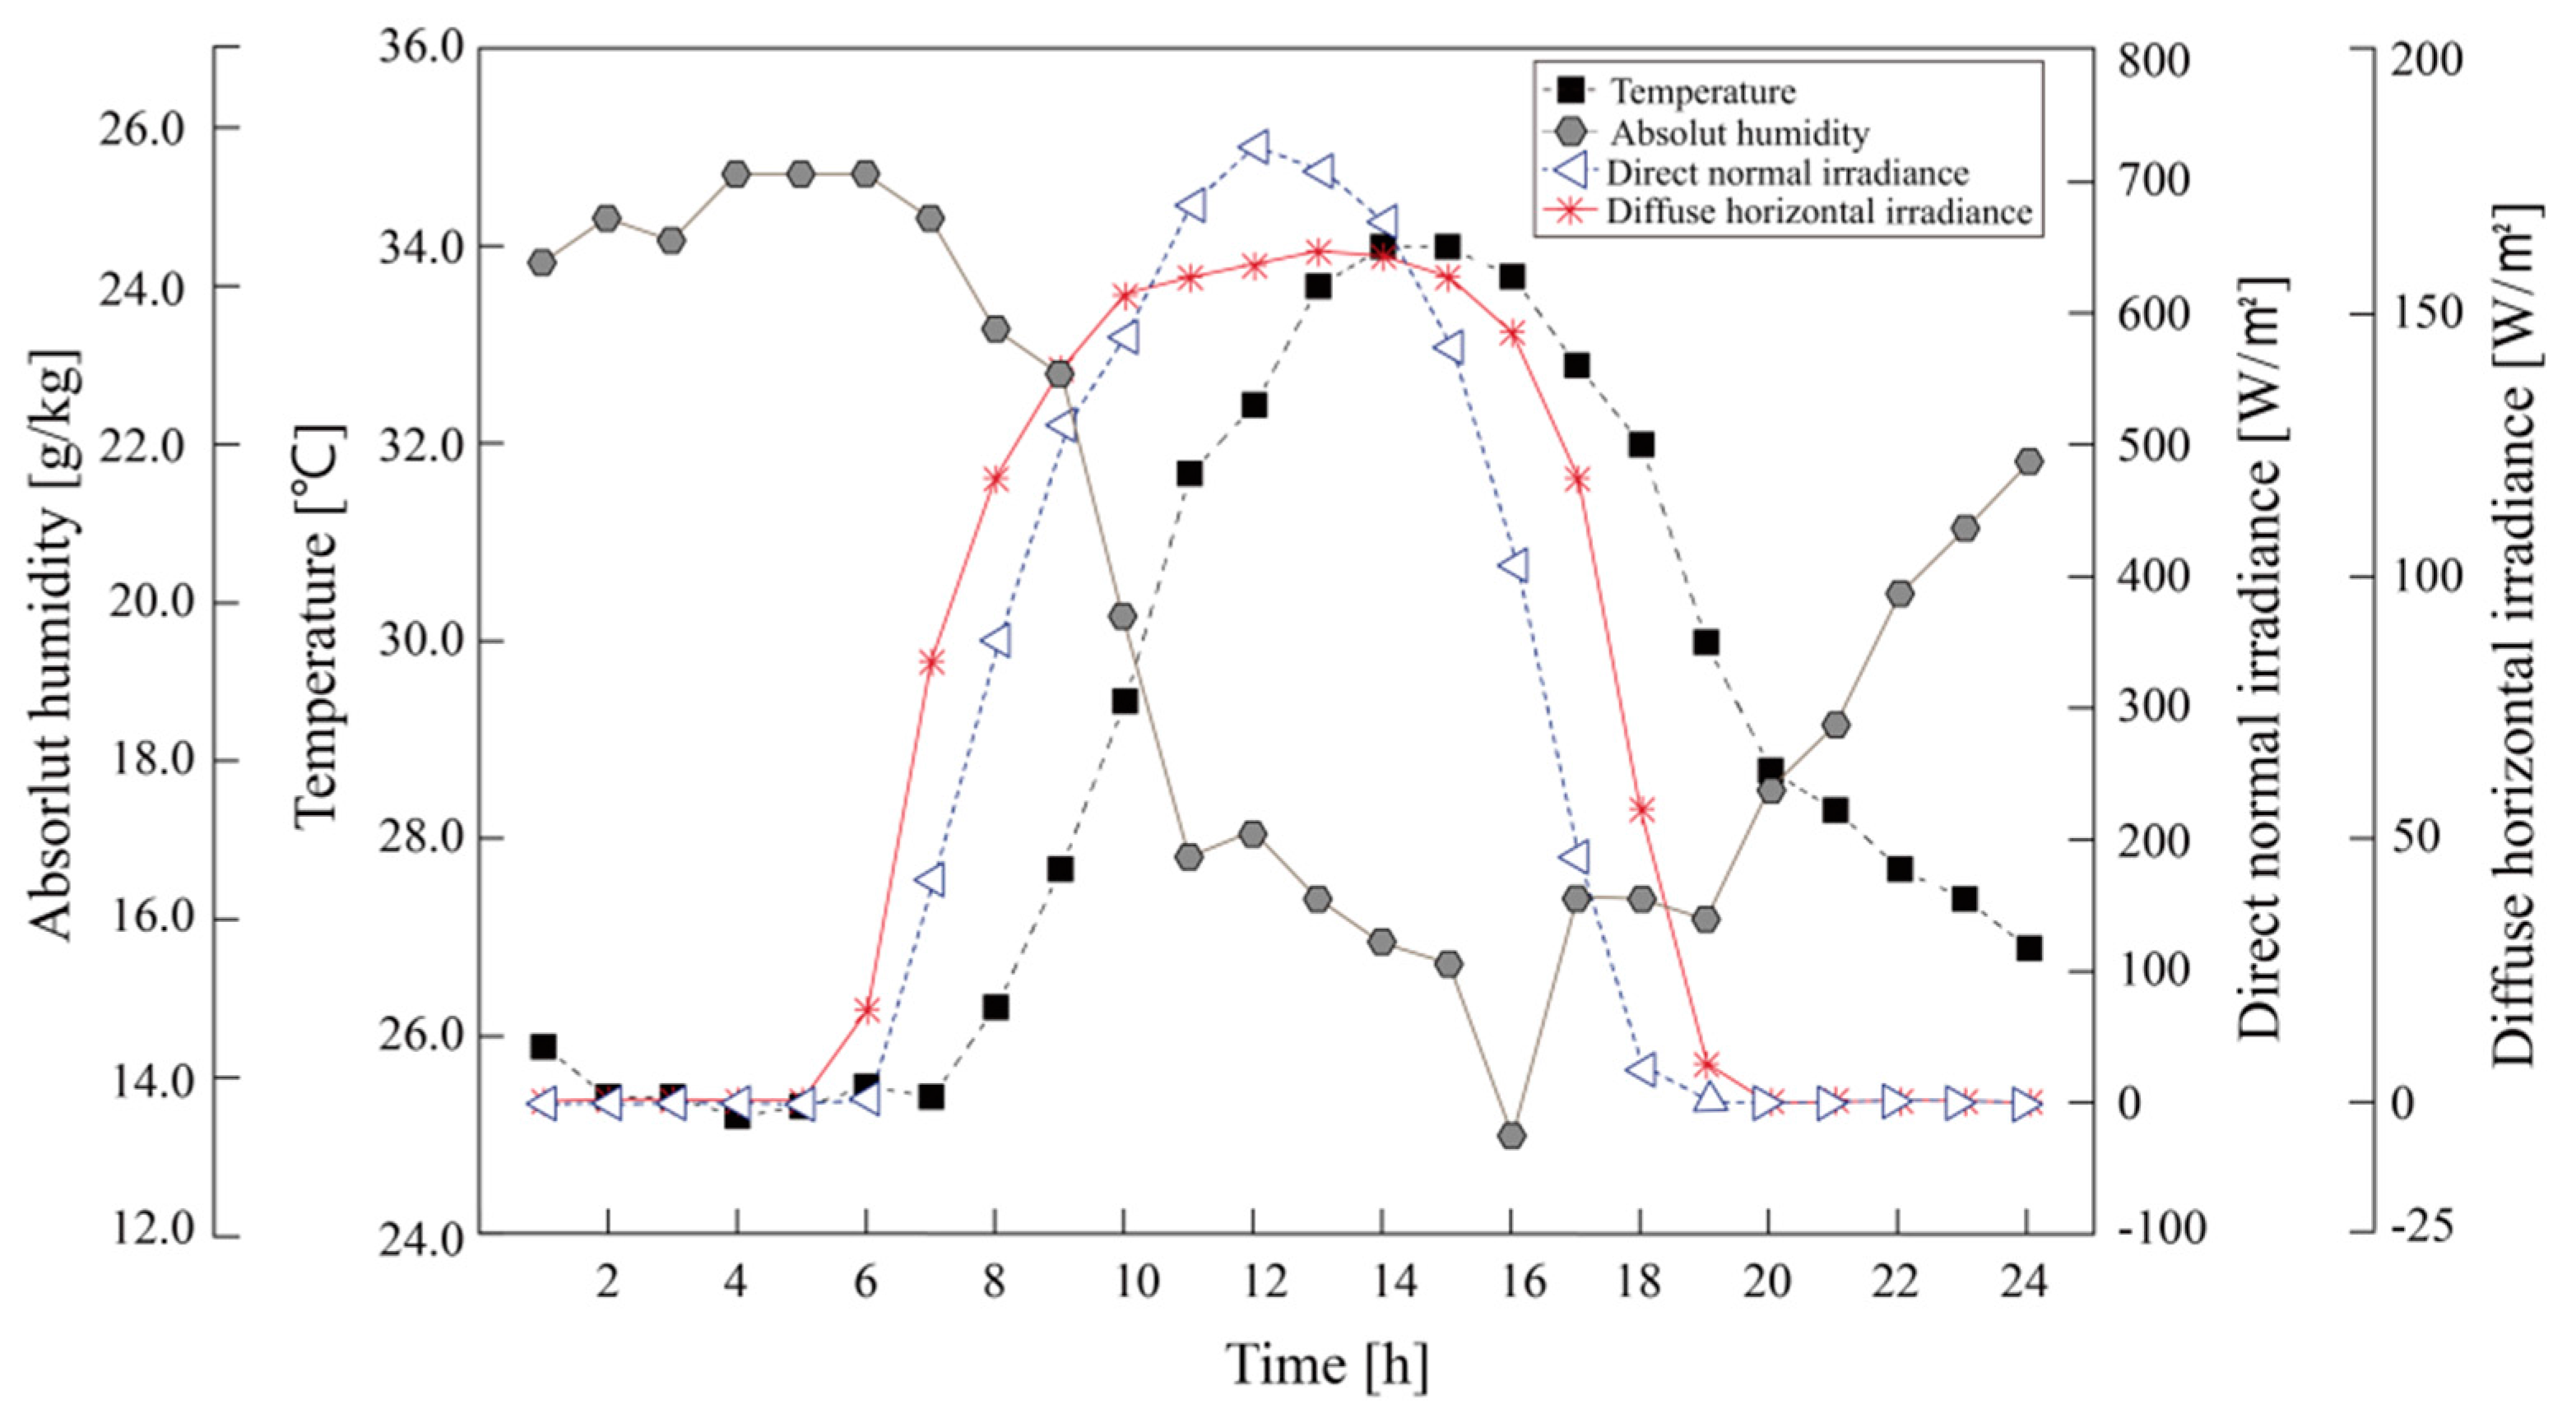
Figure A3.
Mesh division for simulation.
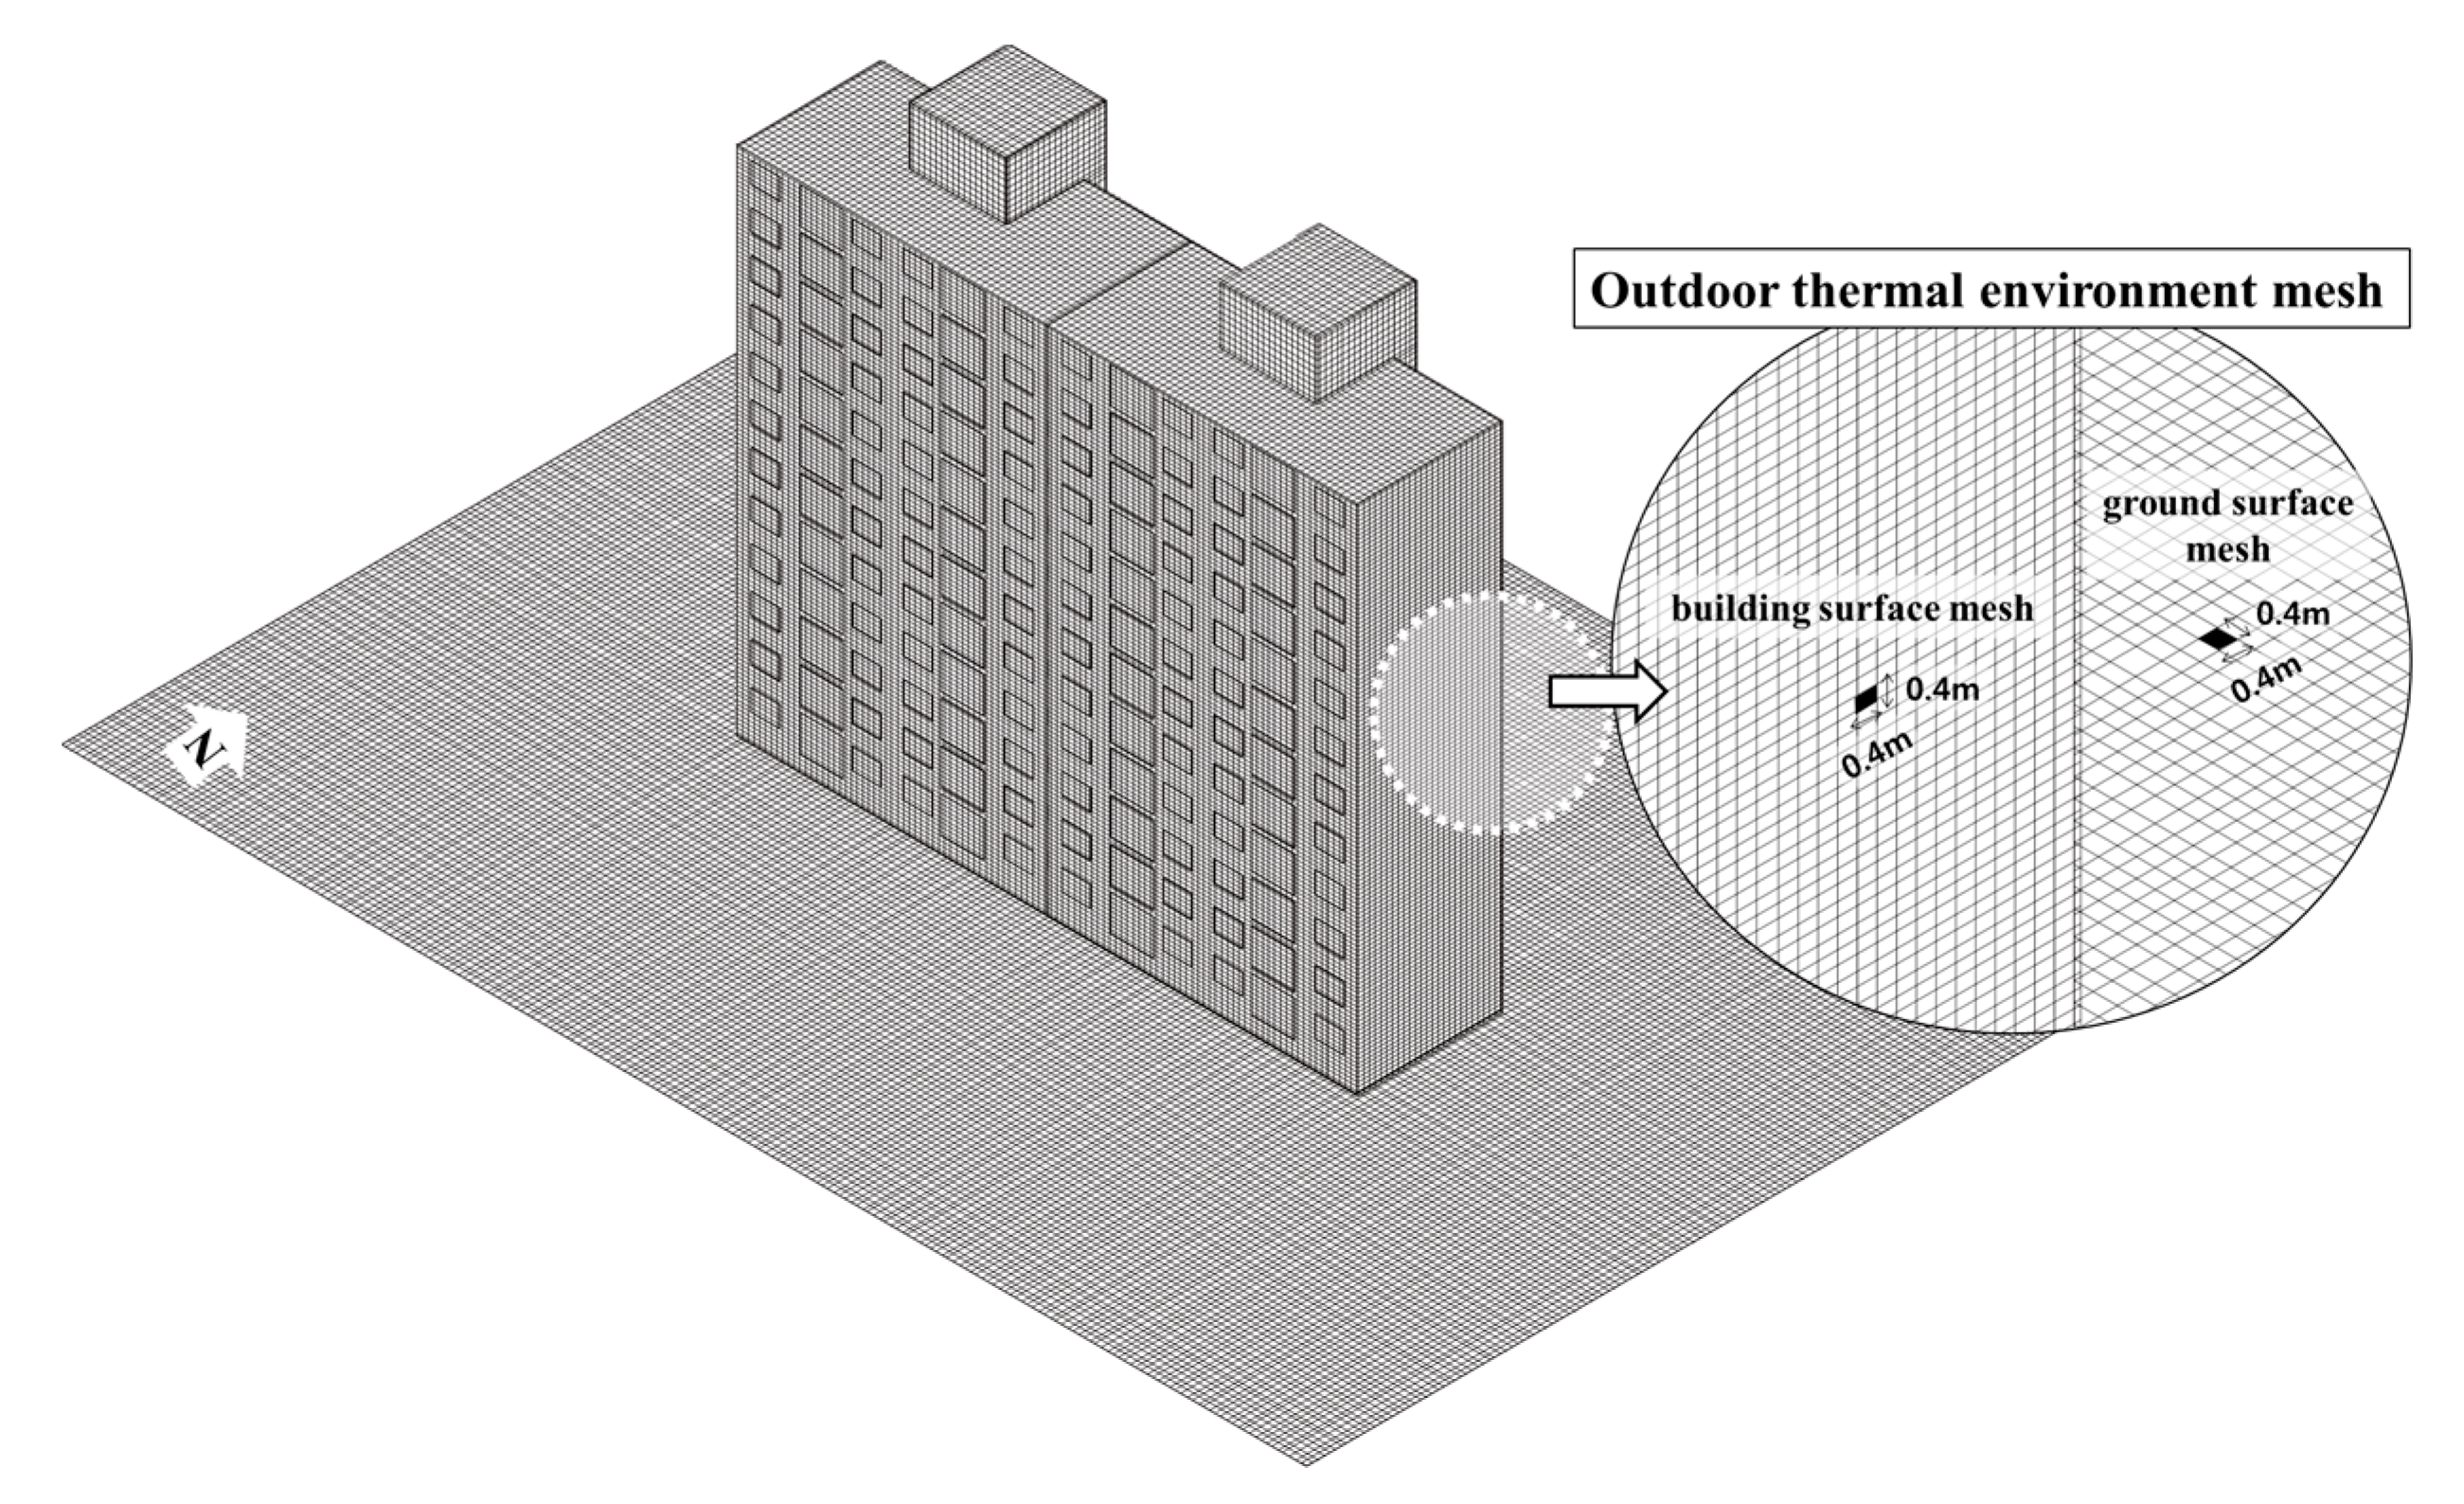
Figure A4.
Images of actual measurements of radiation temperatures in residential buildings at each measurement time.
Figure A4.
Images of actual measurements of radiation temperatures in residential buildings at each measurement time.

Figure A5.
Images of actual measurements of radiation temperatures of outdoor ground space at each measurement time.
Figure A5.
Images of actual measurements of radiation temperatures of outdoor ground space at each measurement time.

Figure A6.
Entire surface temperature (12:00).

Figure A7.
Simulation results.
References
- Lee, H.; Lee, K.; Lee, S.; Lee, H. Numerical Study on the Air Cooling Effect due to Increased Albedo in Urban Area. J. Korean Soc. Atmos. Environ. 2008, 24, 383–392. [Google Scholar] [CrossRef]
- Mirzael, P.A. Recent challenges in modeling of urban heat island, sustainable cities and society. Sustain. Cities Soc. 2015, 19, 200–206. [Google Scholar] [CrossRef]
- Ashtiani, A.; Mirzaei, P.A.; Haghighat, F. Indoor thermal condition in urban heat island: Comparison of the artificial neural network and regression methods prediction. Energy Build. 2014, 76, 597–604. [Google Scholar] [CrossRef]
- Mizaei, P.A.; Haghighat, F. Approaches to study Urban Heat Island-abilities and limitations. Energy Build. 2010, 45, 2192–2201. [Google Scholar] [CrossRef]
- Basu, R.; Samet, J.M. Relation between elevated ambient temperature and mortality: A review of the epidemiologic evidence. Epidemiol. Rev. 2002, 24, 190–202. [Google Scholar] [CrossRef] [PubMed]
- Doyon, B.; Bélanger, D.; Gosselin, P. The potential impact of climate change on annual and seasonal mortality for three cities in Quebec, Canada. Int. J. Health Geogr. 2008, 7, 23. [Google Scholar] [CrossRef] [PubMed]
- Kim, S.; Jang, D. Analysis on the Heat Island Guideline in Japan. J. Archit. Inst. Korea 2012, 32, 1–2. [Google Scholar]
- Bang, J. The characteristics of urban heat island mitigation measures in U.S municipalities. J. Archit. Inst. Korea Plan. Design 2013, 29, 79–90. [Google Scholar]
- Mackey, C.; Lee, X.; Smith, R. Remotely sensing the cooling effects of city scale efforts to reduce urban heat island. Build. Environ. 2011, 49, 348–358. [Google Scholar] [CrossRef]
- Chow, W.; Brazel, A. Assessing xeriscaping as a sustainable heat island mitigation approach for a desert city. Build. Environ. 2011, 47, 170–181. [Google Scholar] [CrossRef]
- Shashua, B.; Tsiros, L.; Hoffman, M. Passive cooling design options to ameliorate thermal comfort in urban streets of a Mediterranean climate (Athens) under hot summer conditions. Build. Environ. 2012, 57, 110–119. [Google Scholar] [CrossRef]
- Wong, N.H.; Kardinal, J.; Aung, L. Environmental study of the impact of greenery in an institutional campus in the tropics. Build. Environ. 2012, 57, 110–119. [Google Scholar] [CrossRef]
- Berry, R.; Livesley, S.; Aye, L. Tree canopy shade impacts on solar irradiance received by building walls and their surface temperature. Build. Environ. 2013, 69, 91–100. [Google Scholar] [CrossRef]
- Klemm, W.; Heusinkveld, B.G.; Lenzholzer, S.; Jacobs, M.H.; van Hove, B. Psychological and physical impact of urban green spaces on outdoor thermal comfort during summertime in The Netherlands. Build. Environ. 2014, 83, 120–128. [Google Scholar] [CrossRef]
- Cohen, P.; Potchter, O.; Matzarakis, A. Daily and seasonal climatic conditions of green urban open spaces in the Mediterranean climate and their impact on human comfort. Build. Environ. 2011, 51, 285–295. [Google Scholar] [CrossRef]
- Yang, W.; Wong, N.; Jusuf, S. Thermal comfort in outdoor urban spaces in Singapore. Build. Environ. 2012, 59, 426–435. [Google Scholar] [CrossRef]
- Salata, F.; Golasi, L.; de Lieto Vollaro, R.; de Lieto Vollaro, A. Outdoor thermal comfort in the Mediterranean area. A transversal study in Rome, Italy. Build. Environ. 2015, 96, 46–61. [Google Scholar] [CrossRef]
- Niu, J.; Liu, J.; Lee, T.; Lin, Z.; Mak, C.; Tse, K.; Tang, B.; Kwok, K. A new method to assess spatial variations of outdoor thermal comfort: Onsite monitoring results and implications for precinct planning. Build. Environ. 2015, 91, 263–270. [Google Scholar] [CrossRef] [Green Version]
- Wen, C.; Juan, Y.; Yang, A. Enhancement of city breathability with half open spaces in ideal urban street canyons. Build. Environ. 2016, 112, 322–336. [Google Scholar] [CrossRef]
- Tan, Z.; Lau Kevin, K.; Ng, E. Planning strategies for roadside tree planting and outdoor comfort enhancement in subtropical high-density urban areas. Build. Environ. 2017, 120, 93–109. [Google Scholar] [CrossRef]
- Taleghani, M.; Kleerekoper, L.; Tenpierik, M.; Dobbelsteen, A. Outdoor thermal comfort within five different urban forms in the Netherlands. Build. Environ. 2014, 83, 65–78. [Google Scholar] [CrossRef]
- Carnielo, E.; Zinzi, M. Optical and thermal characterisation of cool asphalts to mitigate urban temperatures and building cooling demand. Build. Environ. 2012, 60, 56–65. [Google Scholar] [CrossRef]
- Ng, E.; Chen, L.; Wang, Y.; Yuan, C. A study on the cooling effects of greening in a high-density city: An experience from Hong Kong. Build. Environ. 2011, 47, 256–271. [Google Scholar] [CrossRef]
- Coma, J.; Pérez, G.; Gracia, A.; Burés, S.; Urrestarazu, M.; Cabeza, L. Vertical greenery systems for energy savings in buildings: A comparative study between green walls and green facades. Build. Environ. 2016, 111, 228–237. [Google Scholar] [CrossRef]
- Squier, M.; Davidson, C. Heat flux and seasonal thermal performance of an extensive green roof. Build. Environ. 2016, 107, 235–244. [Google Scholar] [CrossRef]
- Taleghani, M.; Tenpierik, M.; Debbelsteen, A. Indoor thermal comfort in urban courtyard block dwellings in the Netherlands. Build. Environ. 2014, 82, 556–579. [Google Scholar] [CrossRef]
- Malys, L.; Musy, M.; Inard, C. A hydrothermal model to assess the impact of green walls on urban microclimate and building energy consumption. Build. Environ. 2013, 73, 187–197. [Google Scholar] [CrossRef]
- Xu, T.; Sathaye, J.; Akbari, H.; Garg, V.; Tetali, S. Quantifying the direct benefits of cool roofs in an urban setting: Reduced cooling energy use and lowered greenhouse gas emissions. Build. Environ. 2011, 48, 1–6. [Google Scholar] [CrossRef]
- Wong, N.; Kwang, T.; Chen, Y.; Sekar, K.; Tan, P.; Chan, D.; Chiang, K.; Wong, N. Thermal evaluation of vertical greenery systems for building walls. Build. Environ. 2009, 45, 663–672. [Google Scholar] [CrossRef]
- Alexandri, E.; Jones, P. Temperature decreases in an urban canyon due to green walls and green roofs in diverse climates. Build. Environ. 2006, 43, 480–493. [Google Scholar] [CrossRef]
- Thorsson, S.; Lindberg, F.; Eliasson, I.; Holmer, B. Different methods for estimating the mean radiant temperature in an outdoor urban setting. Int. J. Clim. 2007, 27, 1983–1993. [Google Scholar] [CrossRef]
- Rosso, F.; Pisello, A.L.; Cotana, F.; Ferrero, M. On the thermal and visual pedestrians’ perception about cool natural stones for urban paving: A field survey in summer conditions. Build. Environ. 2016, 107, 198–214. [Google Scholar] [CrossRef]
- Santamouris, M.; Ding, L.; Fiorito, F.; Oldfield, P.; Osmond, P.; Paolini, R.; Prasad, D.; Synnefa, A. Passive and active cooling for the outdoor built environment—Analysis and assessment of the cooling potential of mitigation technologies using performance data from 220 large scale projects. Sol. Energy 2016, 19. [Google Scholar] [CrossRef]
- Ministry of Land Infra. Available online: http://www.greentogether.go.kr/ (accessed on 3 August 2017).
- CRRC. Available online: http://coolroofs.org/ (accessed on 3 August 2017).
- Hwang, M.; Kim, K. Study on the comparison of the thermal performance by methods using infrared camera and computer simulations on the window system. J. Archit. Inst. Korea Plan. Des. 2007, 23, 261–268. [Google Scholar]
- JOOWON. Available online: http://www.visual-data.co.kr/ (accessed on 3 August 2017).
- Hoyano, A.; Asano, K.; Kanamaru, T. Analysis of the sensible heat flux from the exterior surface of buildings using time sequential thermography. Atmos. Environ. 1999, 33, 3941–3951. [Google Scholar] [CrossRef]
- Cole, R.J.; Sturrock, N.S. The convective heat exchange at the external surface of buildings. Build. Environ. 1977, 12, 207–214. [Google Scholar] [CrossRef]
- Jeon, M.; Kim, S.; Leigh, S.; Kim, T. An Analysis of Domestic and Foreign Research about Assessing Outdoor Thermal Comfort. J. Archit. Inst. Korea Plan. Des. 2009, 29, 605–608. [Google Scholar]
- Kim, S.; Suh, S. Numerical Analysis of Urban Climate Using Mellor-Yamada Model. J. Archit. Inst. Korea Plan. Des. 2002, 18, 251–258. [Google Scholar]
- Kim, T.; Kim, J.; Roh, J. Analysis of Indoor Heat Gain to Solar Radiation and Coupled Simulation of Convection Radiation and Heat Conduction within Atrium. J. Archit. Inst. Korea Plan. Des. 1998, 18, 469–474. [Google Scholar]
- He, J.; Hoyano, A.; Asawa, T. A numerical simulation tool for predicting the impact of outdoor thermal environment on building energy performance. Appl. Energy 2009, 86, 1596–1605. [Google Scholar] [CrossRef]
- Asawa, T.; Hoyano, A.; Nakaohkudo, K. Thermal design tool for outdoor spaces based on heat balance simulation using a 3D-CAD system. Build. Environ. 2007, 43, 2112–2123. [Google Scholar] [CrossRef]
- He, J. A design supporting simulation system for predicting and evaluating the cool microclimate creating effect of passive evaporative cooling walls. Build. Environ. 2011, 46, 584–596. [Google Scholar] [CrossRef]
- He, J.; Hoyano, A. A numerical simulation method for analyzing the thermal improvement effect of super-hydrophilic photocatalyst-coated building surfaces with water film on the urban/built environment. Energy Build. 2008, 40, 968–978. [Google Scholar] [CrossRef]
- He, J.; Hoyano, A. A 3D CAD-based simulation tool for prediction and evaluation of the thermal improvement effect of passive cooling walls in the developed urban locations. Sol. Energy 2009, 83, 1064–1075. [Google Scholar] [CrossRef]
- Jeong, S.; Yoon, S. Method to quantify the effect of apartment housing design parameters on outdoor thermal comfort in summer. Build. Environ. 2012, 53, 150–158. [Google Scholar] [CrossRef]
- MLIT. Enforcement Decree of the Building, Korea Building Energy Codes; Ministry of Land, Infrastructure and Transport: Sejong, Korea, 1987.
- MLIT. Amendment for Building Design Standards for Saving Energy, Korea Building Codes; Ministry of Land, Infrastructure and Transport: Sejong, Korea, 2015.
- National Climate Data Service System. Available online: http://sts.kma.go.kr/ (accessed on 3 August 2017).
- Jeong, S. Quantification of Outdoor Thermal Environmental Information in Summer for the Design of Green Apartment Housing. Master’s Thesis, Pusan National University, Busan, Korea, 2010. [Google Scholar]
- Jung, S.; Yoon, S. Changes in sunlight and outdoor thermal environment conditions based on the layout plan of flat type apartment houses. Energies 2015, 8, 9155–9172. [Google Scholar] [CrossRef]
- Lee, K.; Ryu, J.; Choo, S. A Correlation Analysis on ‘Cooling and Heating Loads’ and ‘Window to Wall Ratios’ in Accordance with the form of Simulation-Based Office Towers—Focused on BIM Model at the Early Design Stages. J. Archit. Inst. Korea Plan. Des. 2013, 29, 15–24. [Google Scholar]
- Huang, J.M.; Ooka, R.; Okada, A.; Omori, T.; Huang, H. The effects of urban heat island mitigation strategies on the outdoor thermal environment in central Tokyo. In Proceedings of the Seventh Asia-Pacific Conference on Wind Engineering, Taipei, Taiwan, 8–12 November 2009. [Google Scholar]
- Yang, J.; Wei, B.; Lee, E. A evaluation of performance criteria for cool roof material through analysis database of cool roof material. Proc. Ann. Conf. Archit. Inst. Korea 2013, 33, 417–418. [Google Scholar]
- Mok, J.; Kim, D. A simulation of biotope area factor (BAF) for application of district unit plan in Seoul. Korea Plan. Assoc. 2005, 40, 87–100. [Google Scholar]
- Ahn, J.; Kim, D.; Choi, J.; Shin, K. Friction Properties of Carbon Coated Ultra-thin Film using Taguchi Experimental Design. J. Korean Soc. Precis. Eng. 2003, 20, 143–150. [Google Scholar]
- Lee, H.; Choi, M.; Park, J.; Kim, J. Process Optimization of Coaxial Air-blown Electrospinning Process by Design of Experiment. Text. Sci. Eng. 2014, 51, 14–20. [Google Scholar] [CrossRef]
Figure 1.
Outline of measurement object.
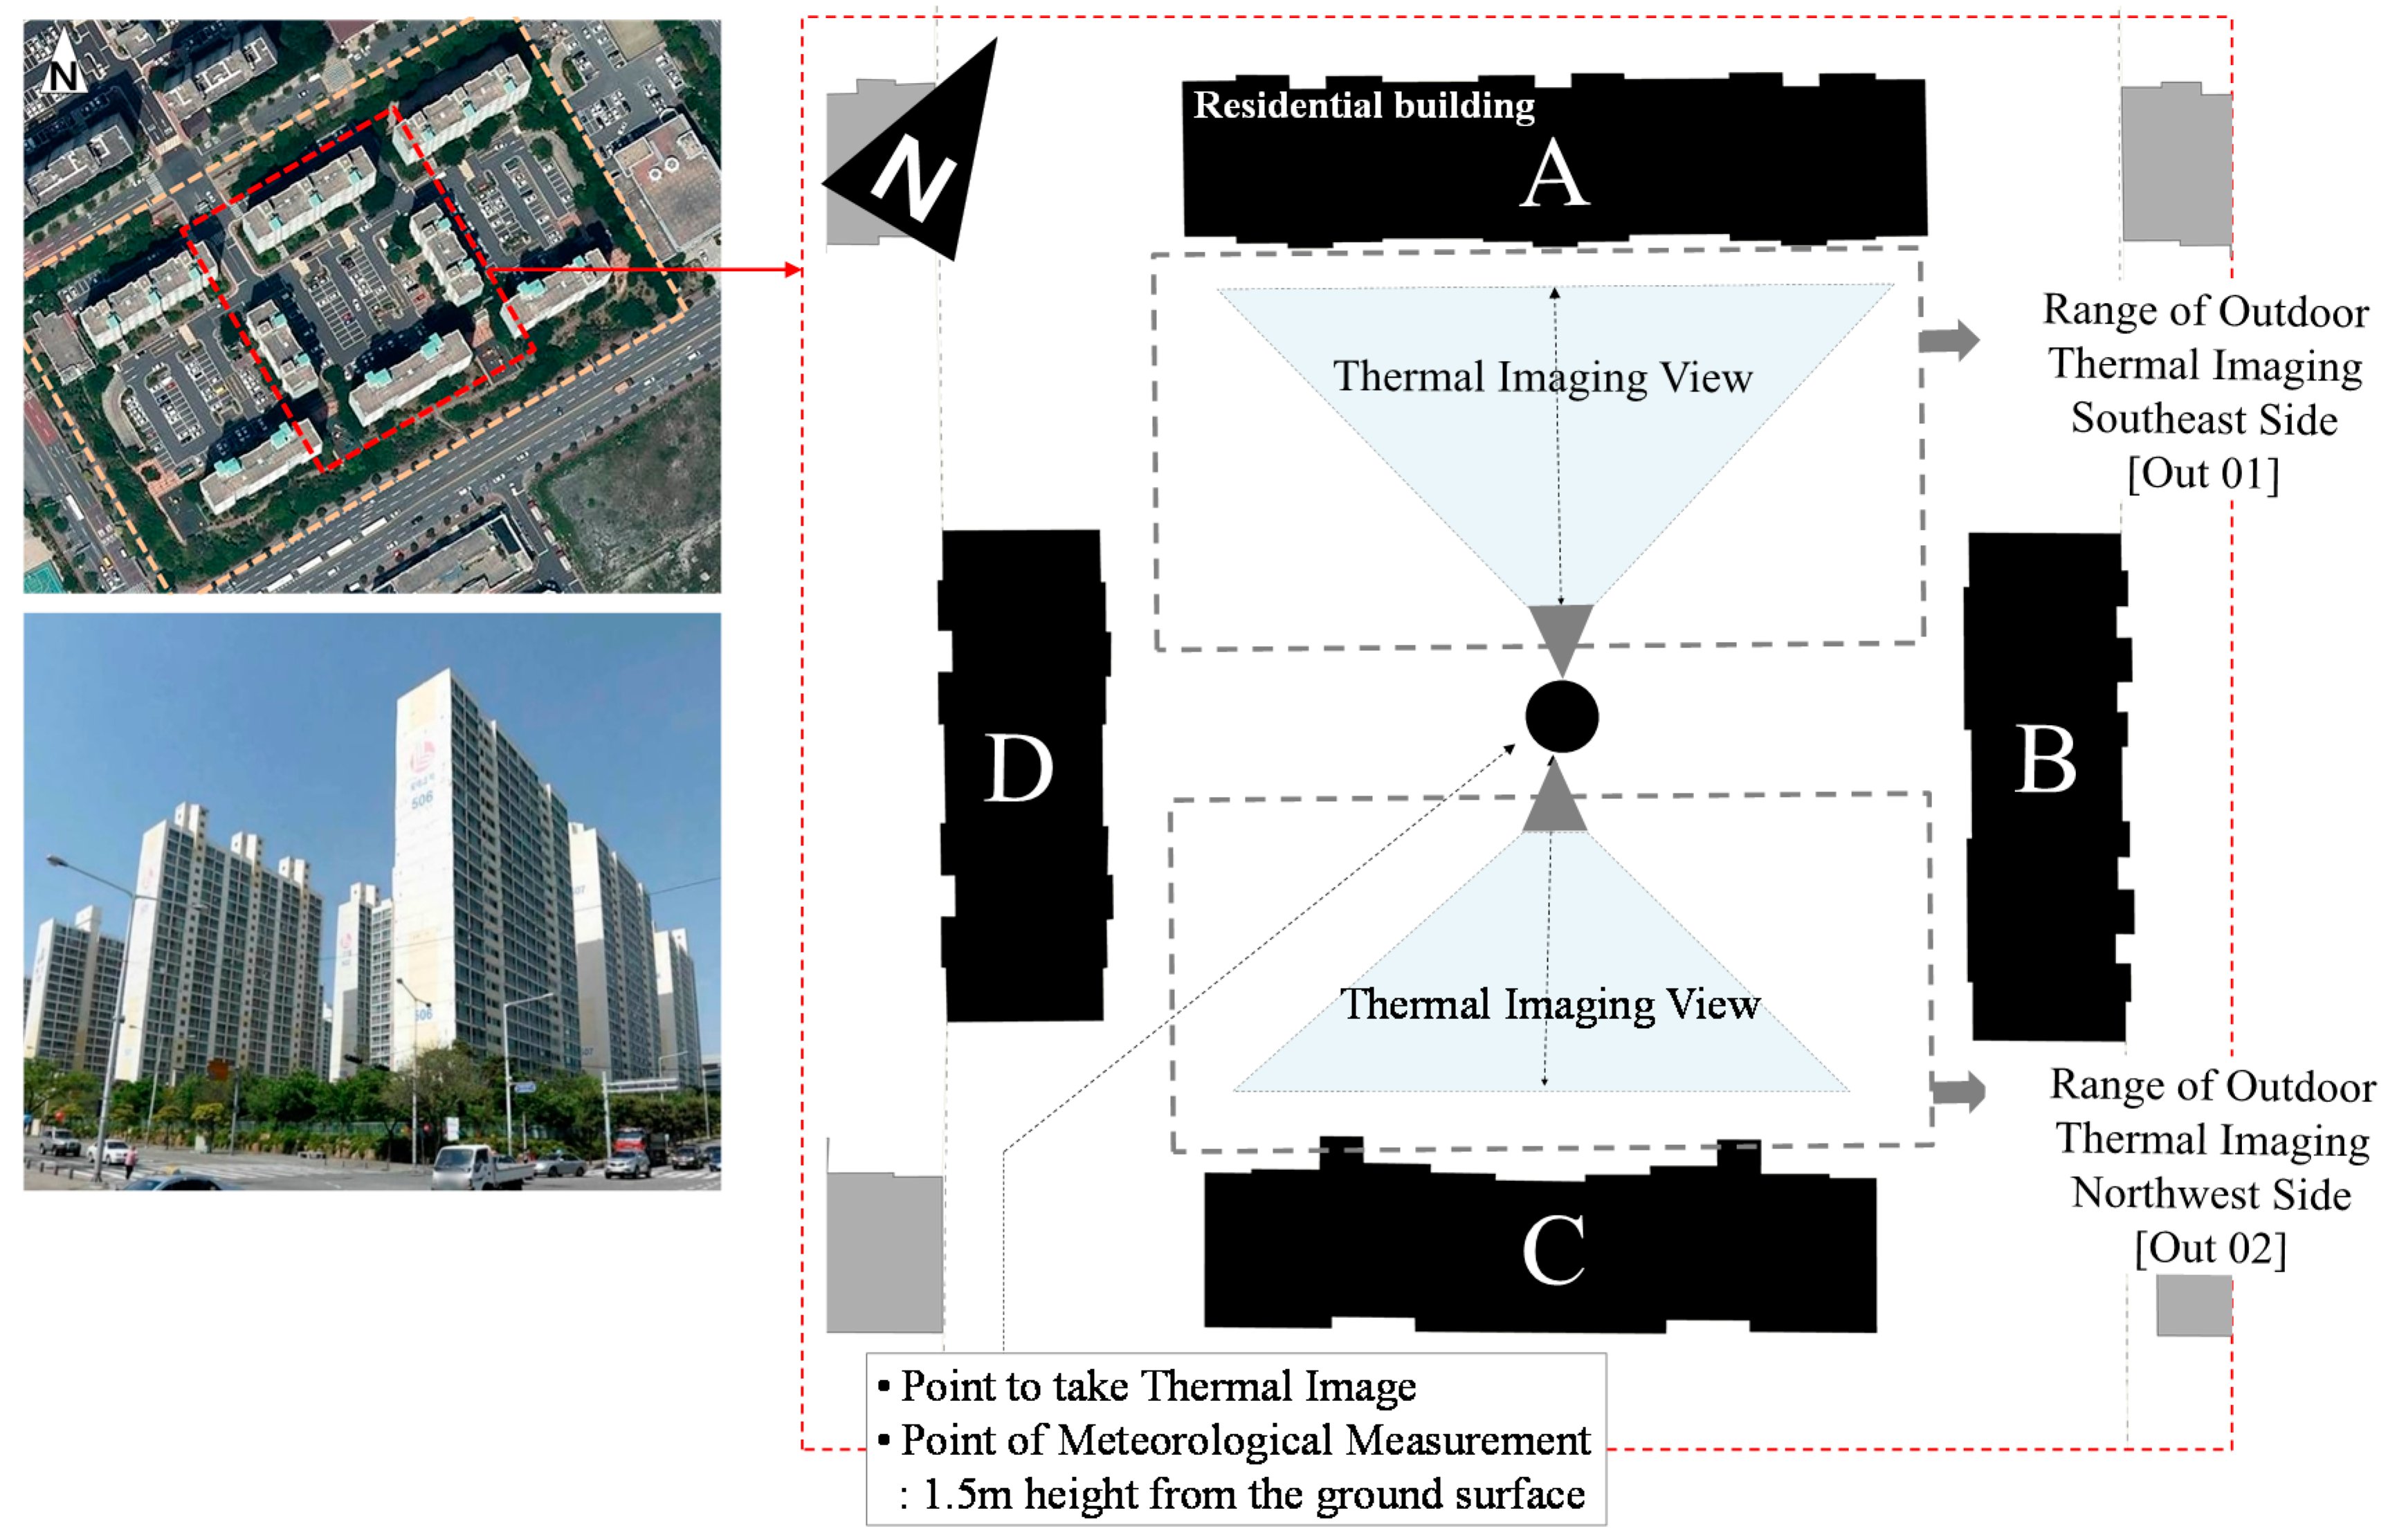
Figure 2.
Thermal imaging range.
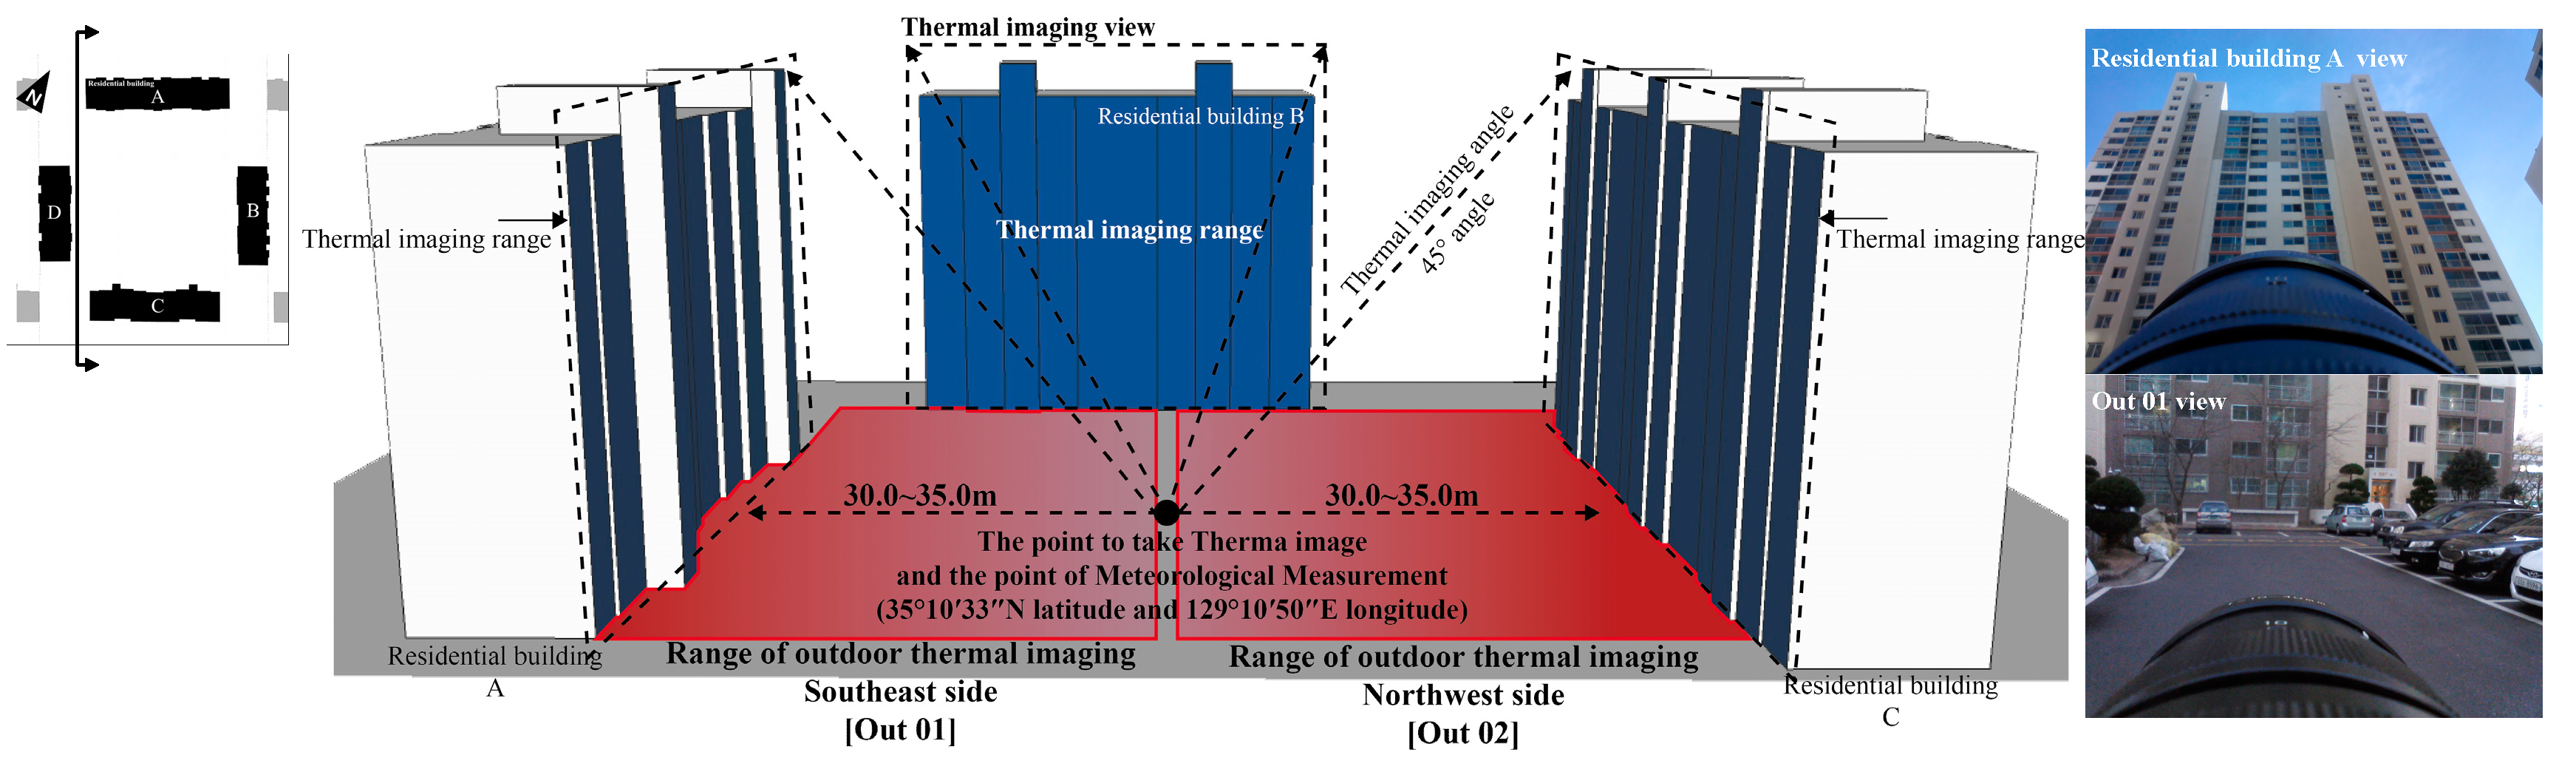
Figure 3.
Thermal imaging values: (a) temperature; (b) relative humidity; and (c) wind speed.

Figure 4.
Analysis range of sensible heat flux.
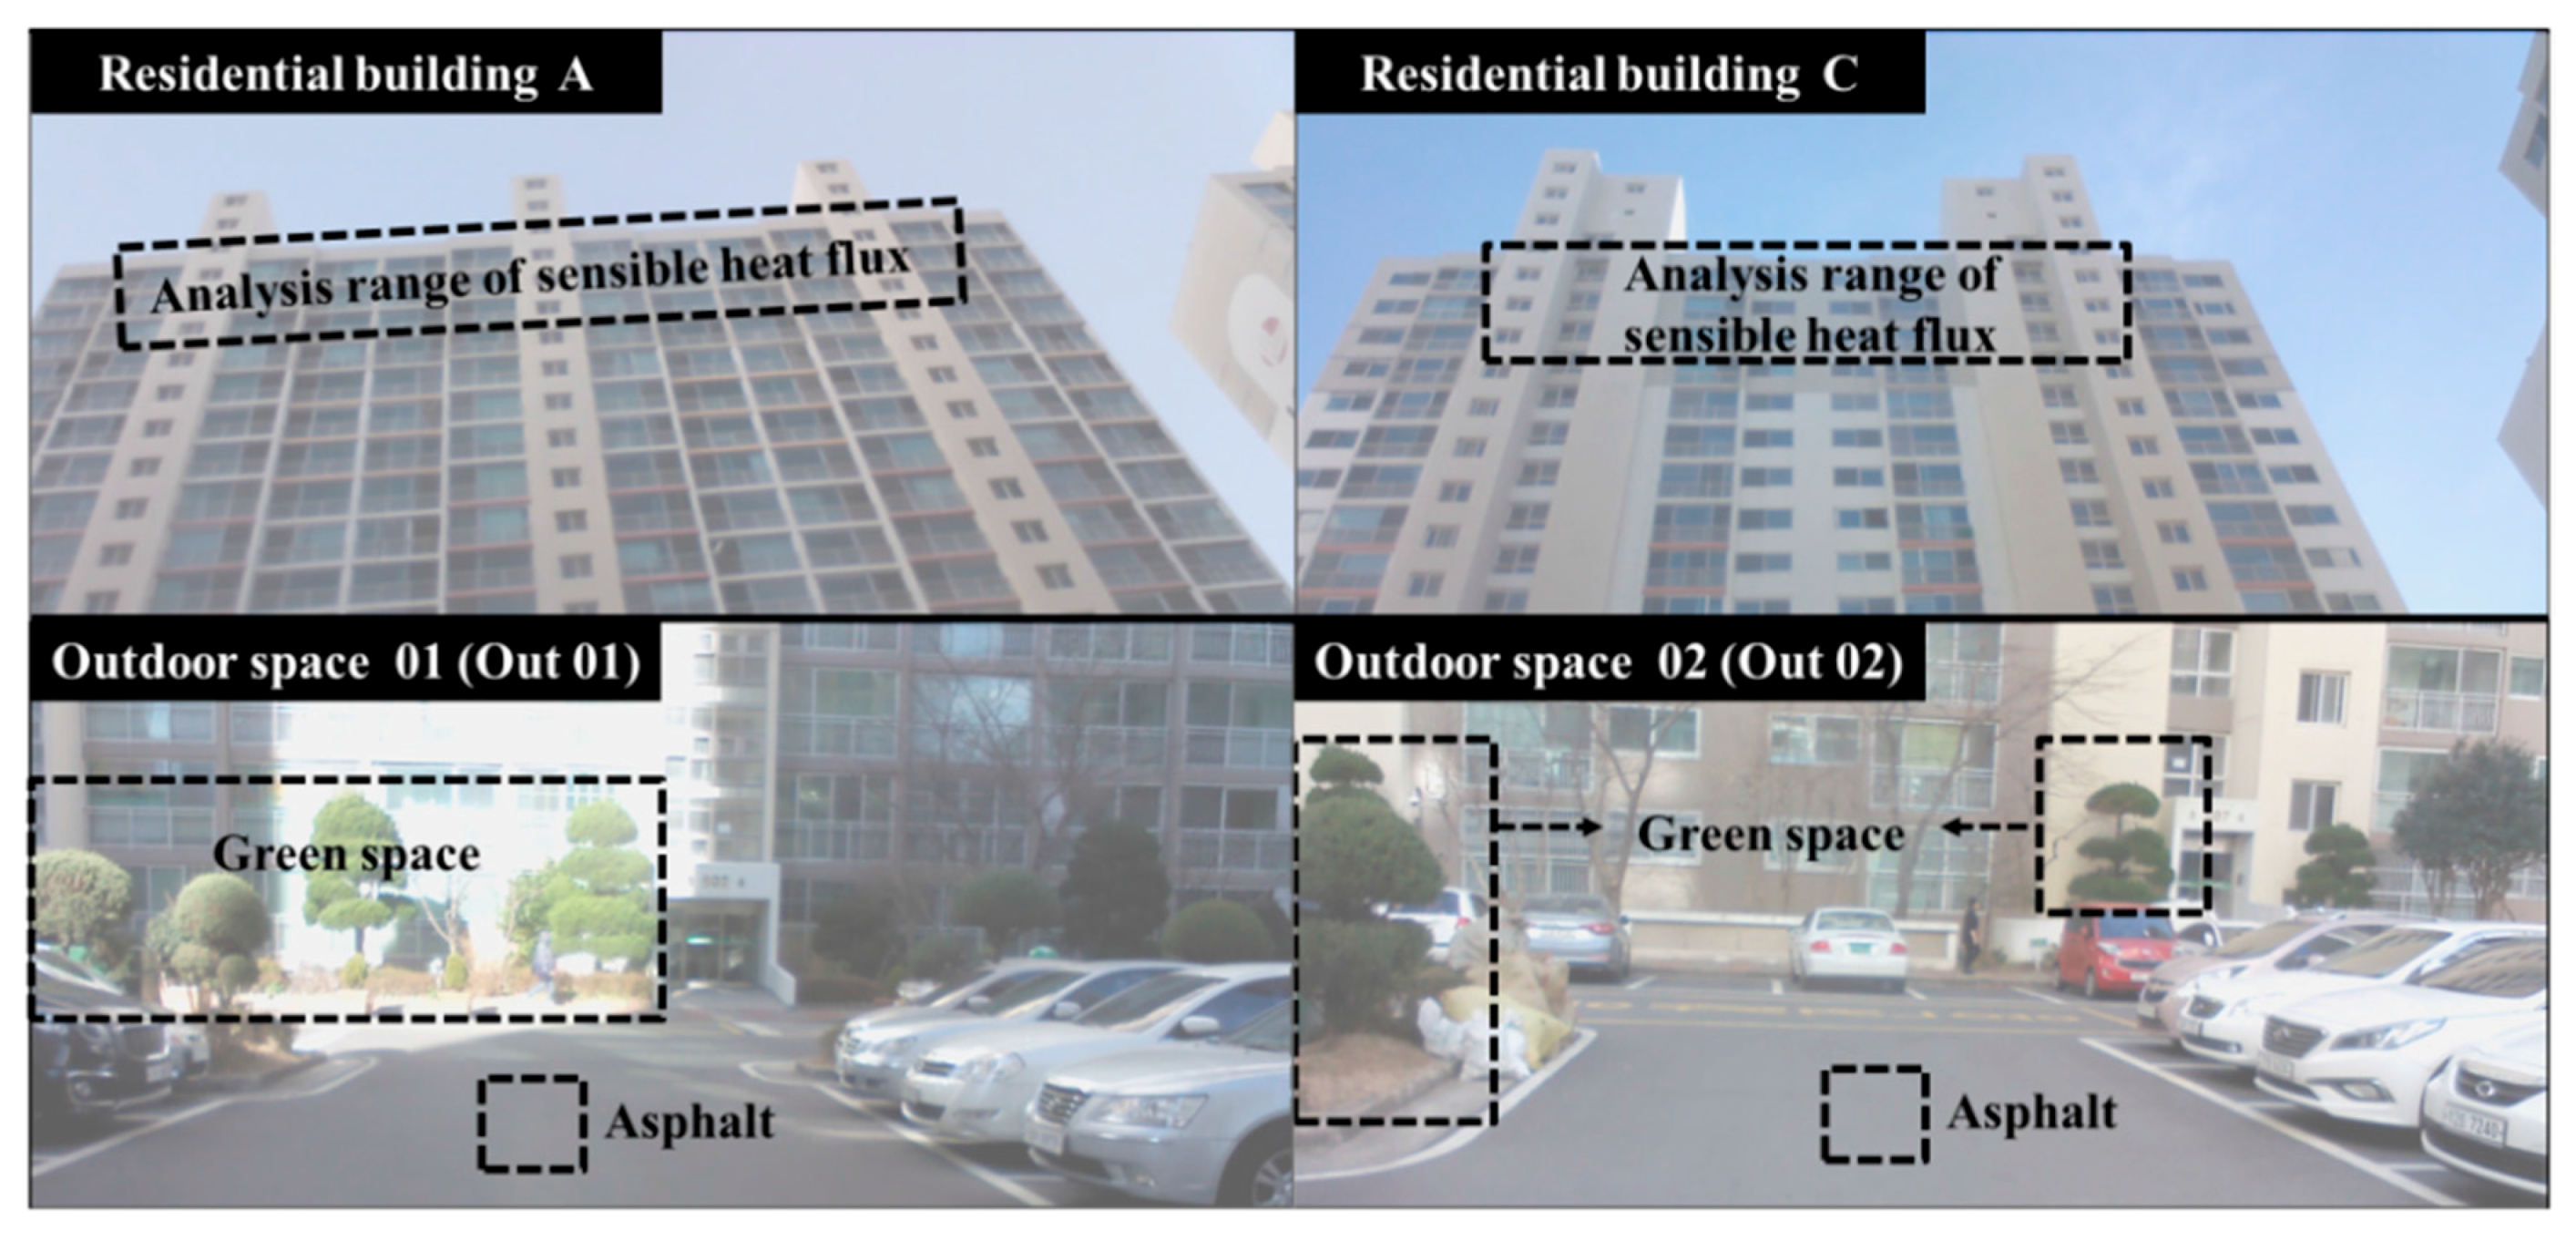
Figure 5.
Sectional description by model part.
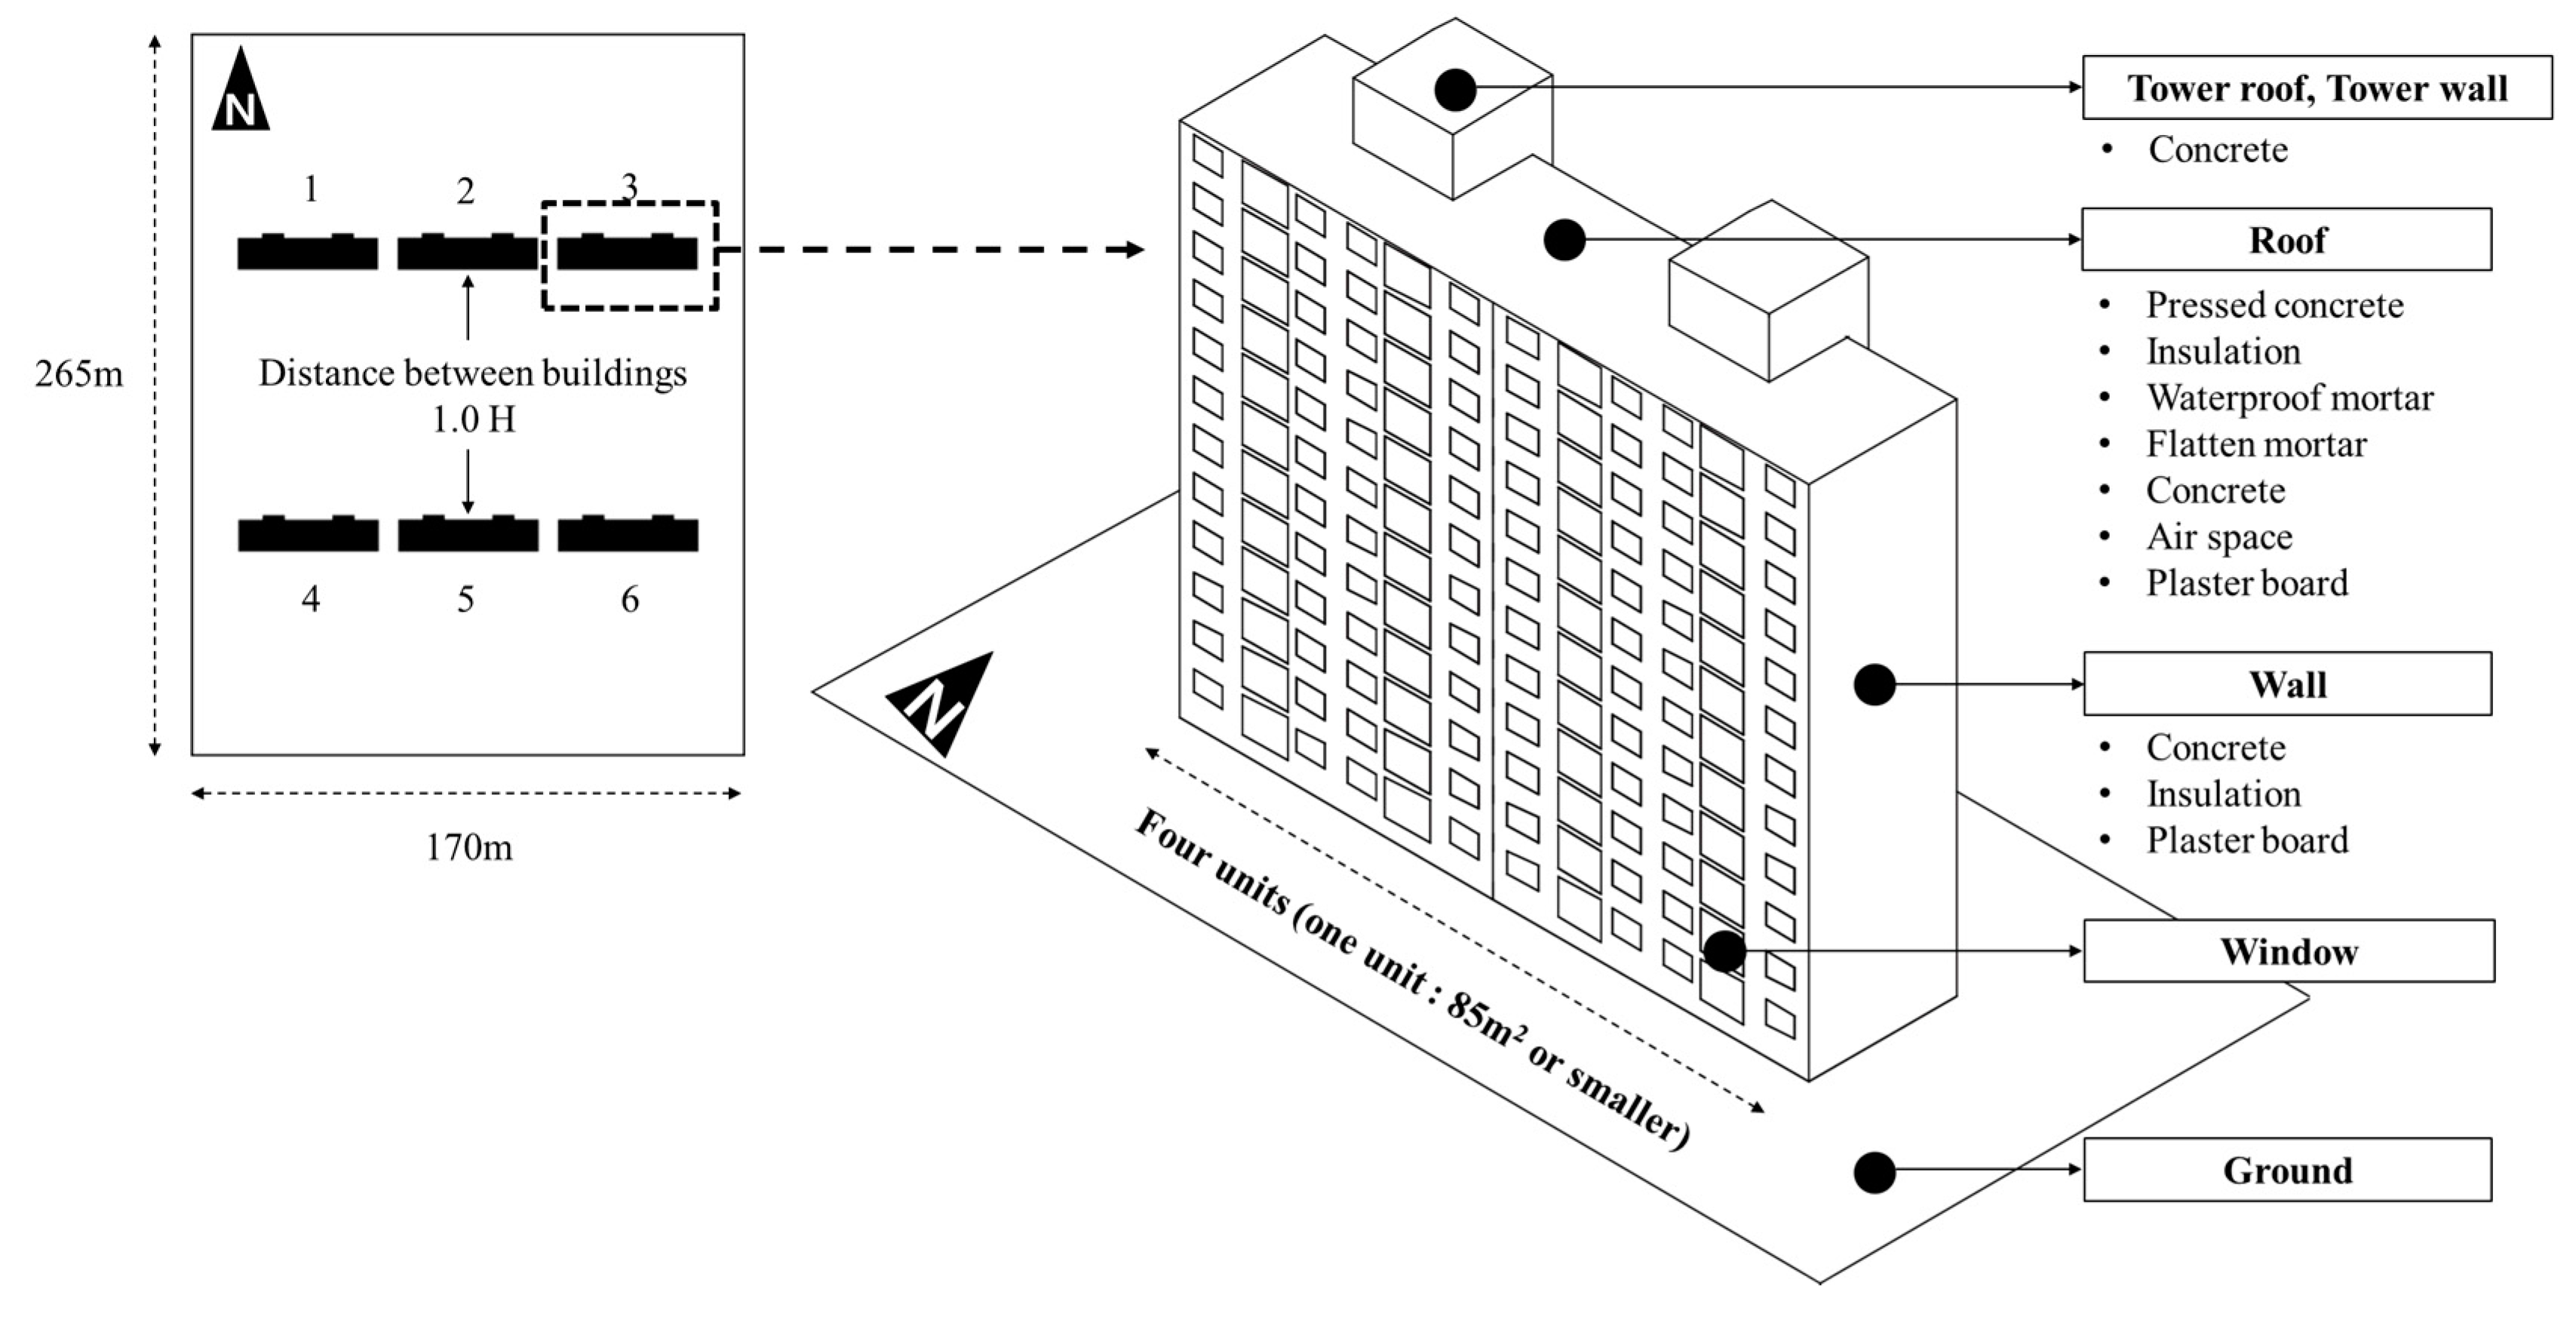
Figure 6.
Selection of design factors for surface skin plans for apartment complexes.
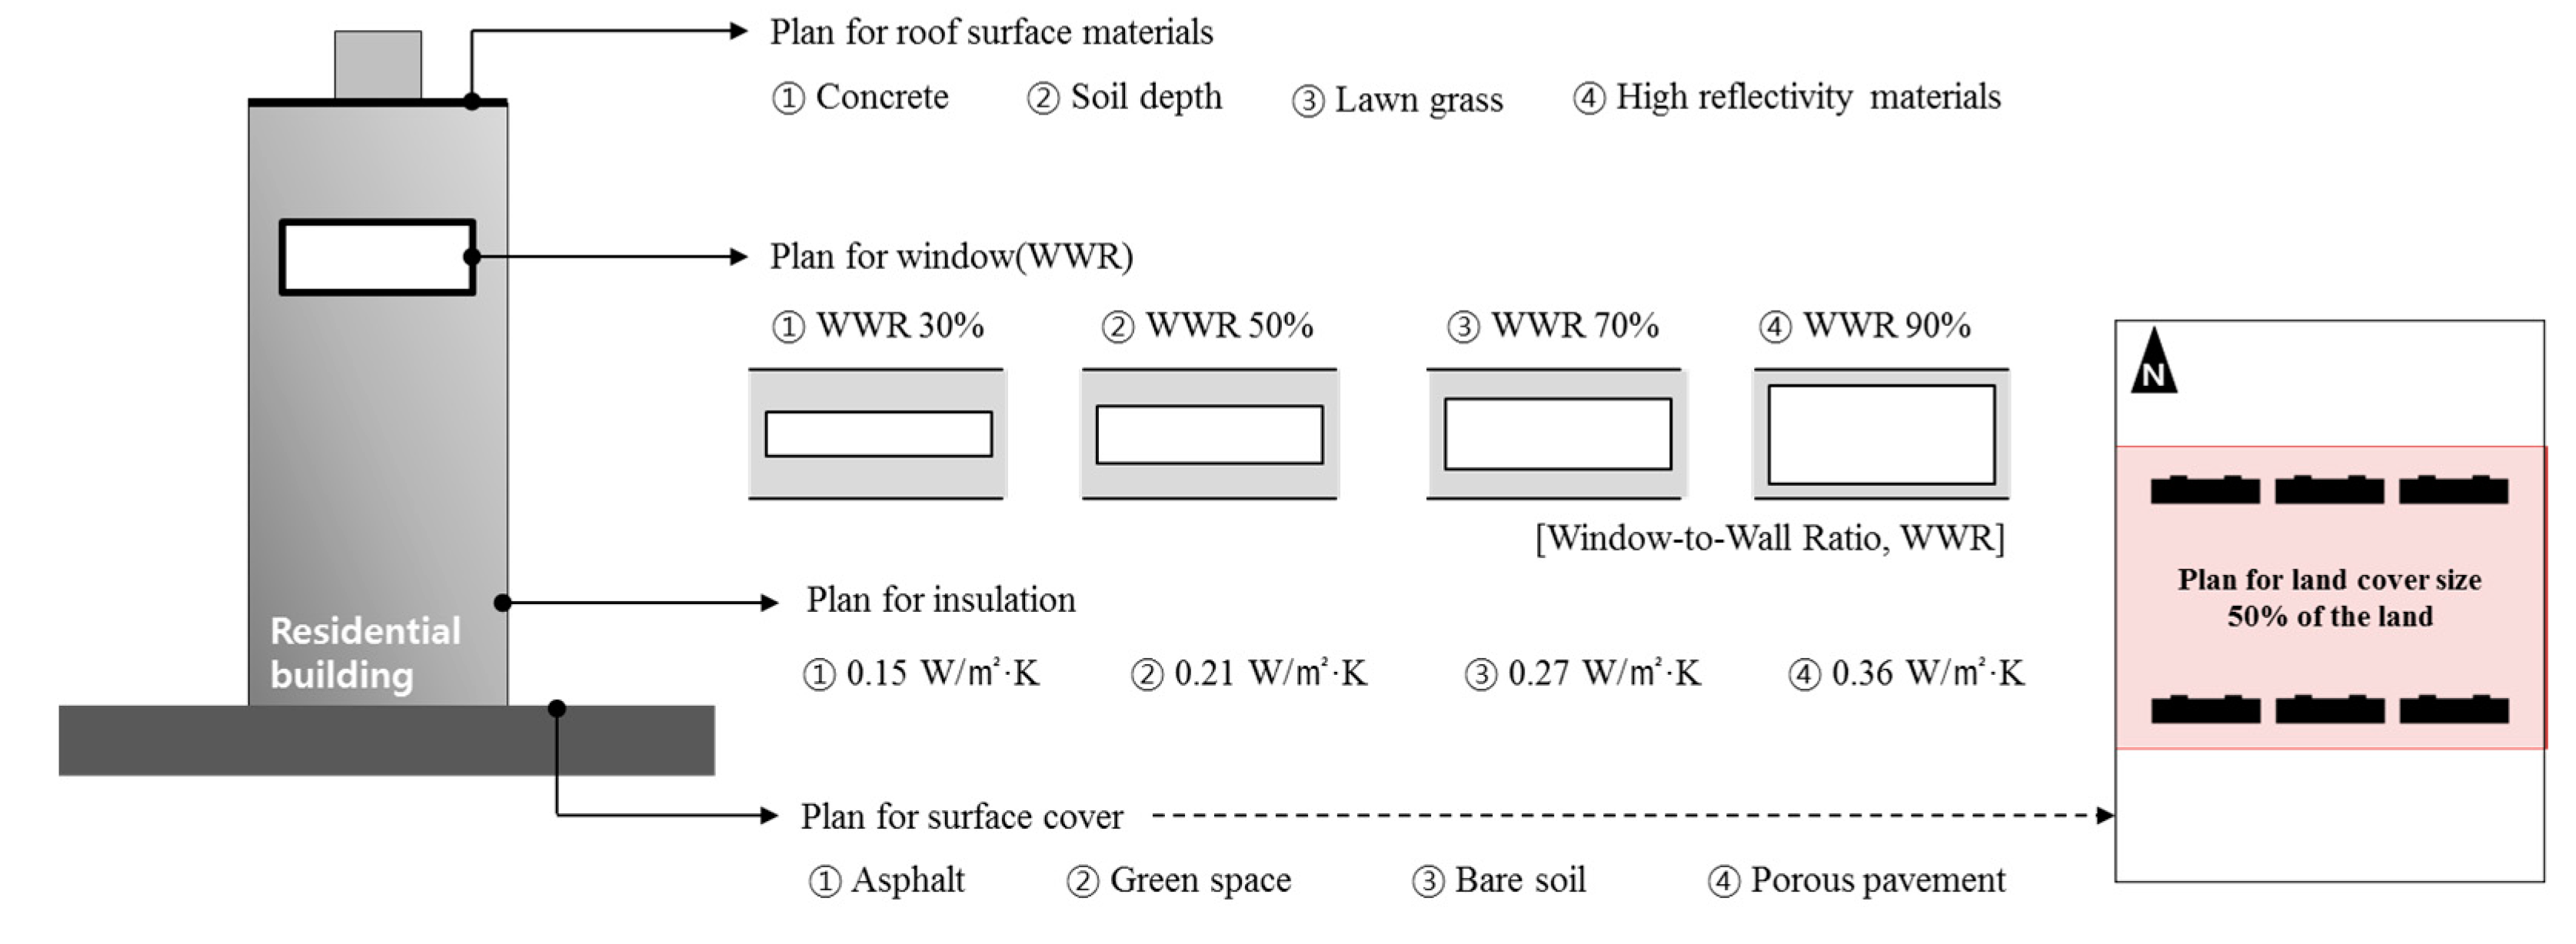
Figure 7.
Sensible heat flux values of southeast side of residential building A by material composition.
Figure 7.
Sensible heat flux values of southeast side of residential building A by material composition.
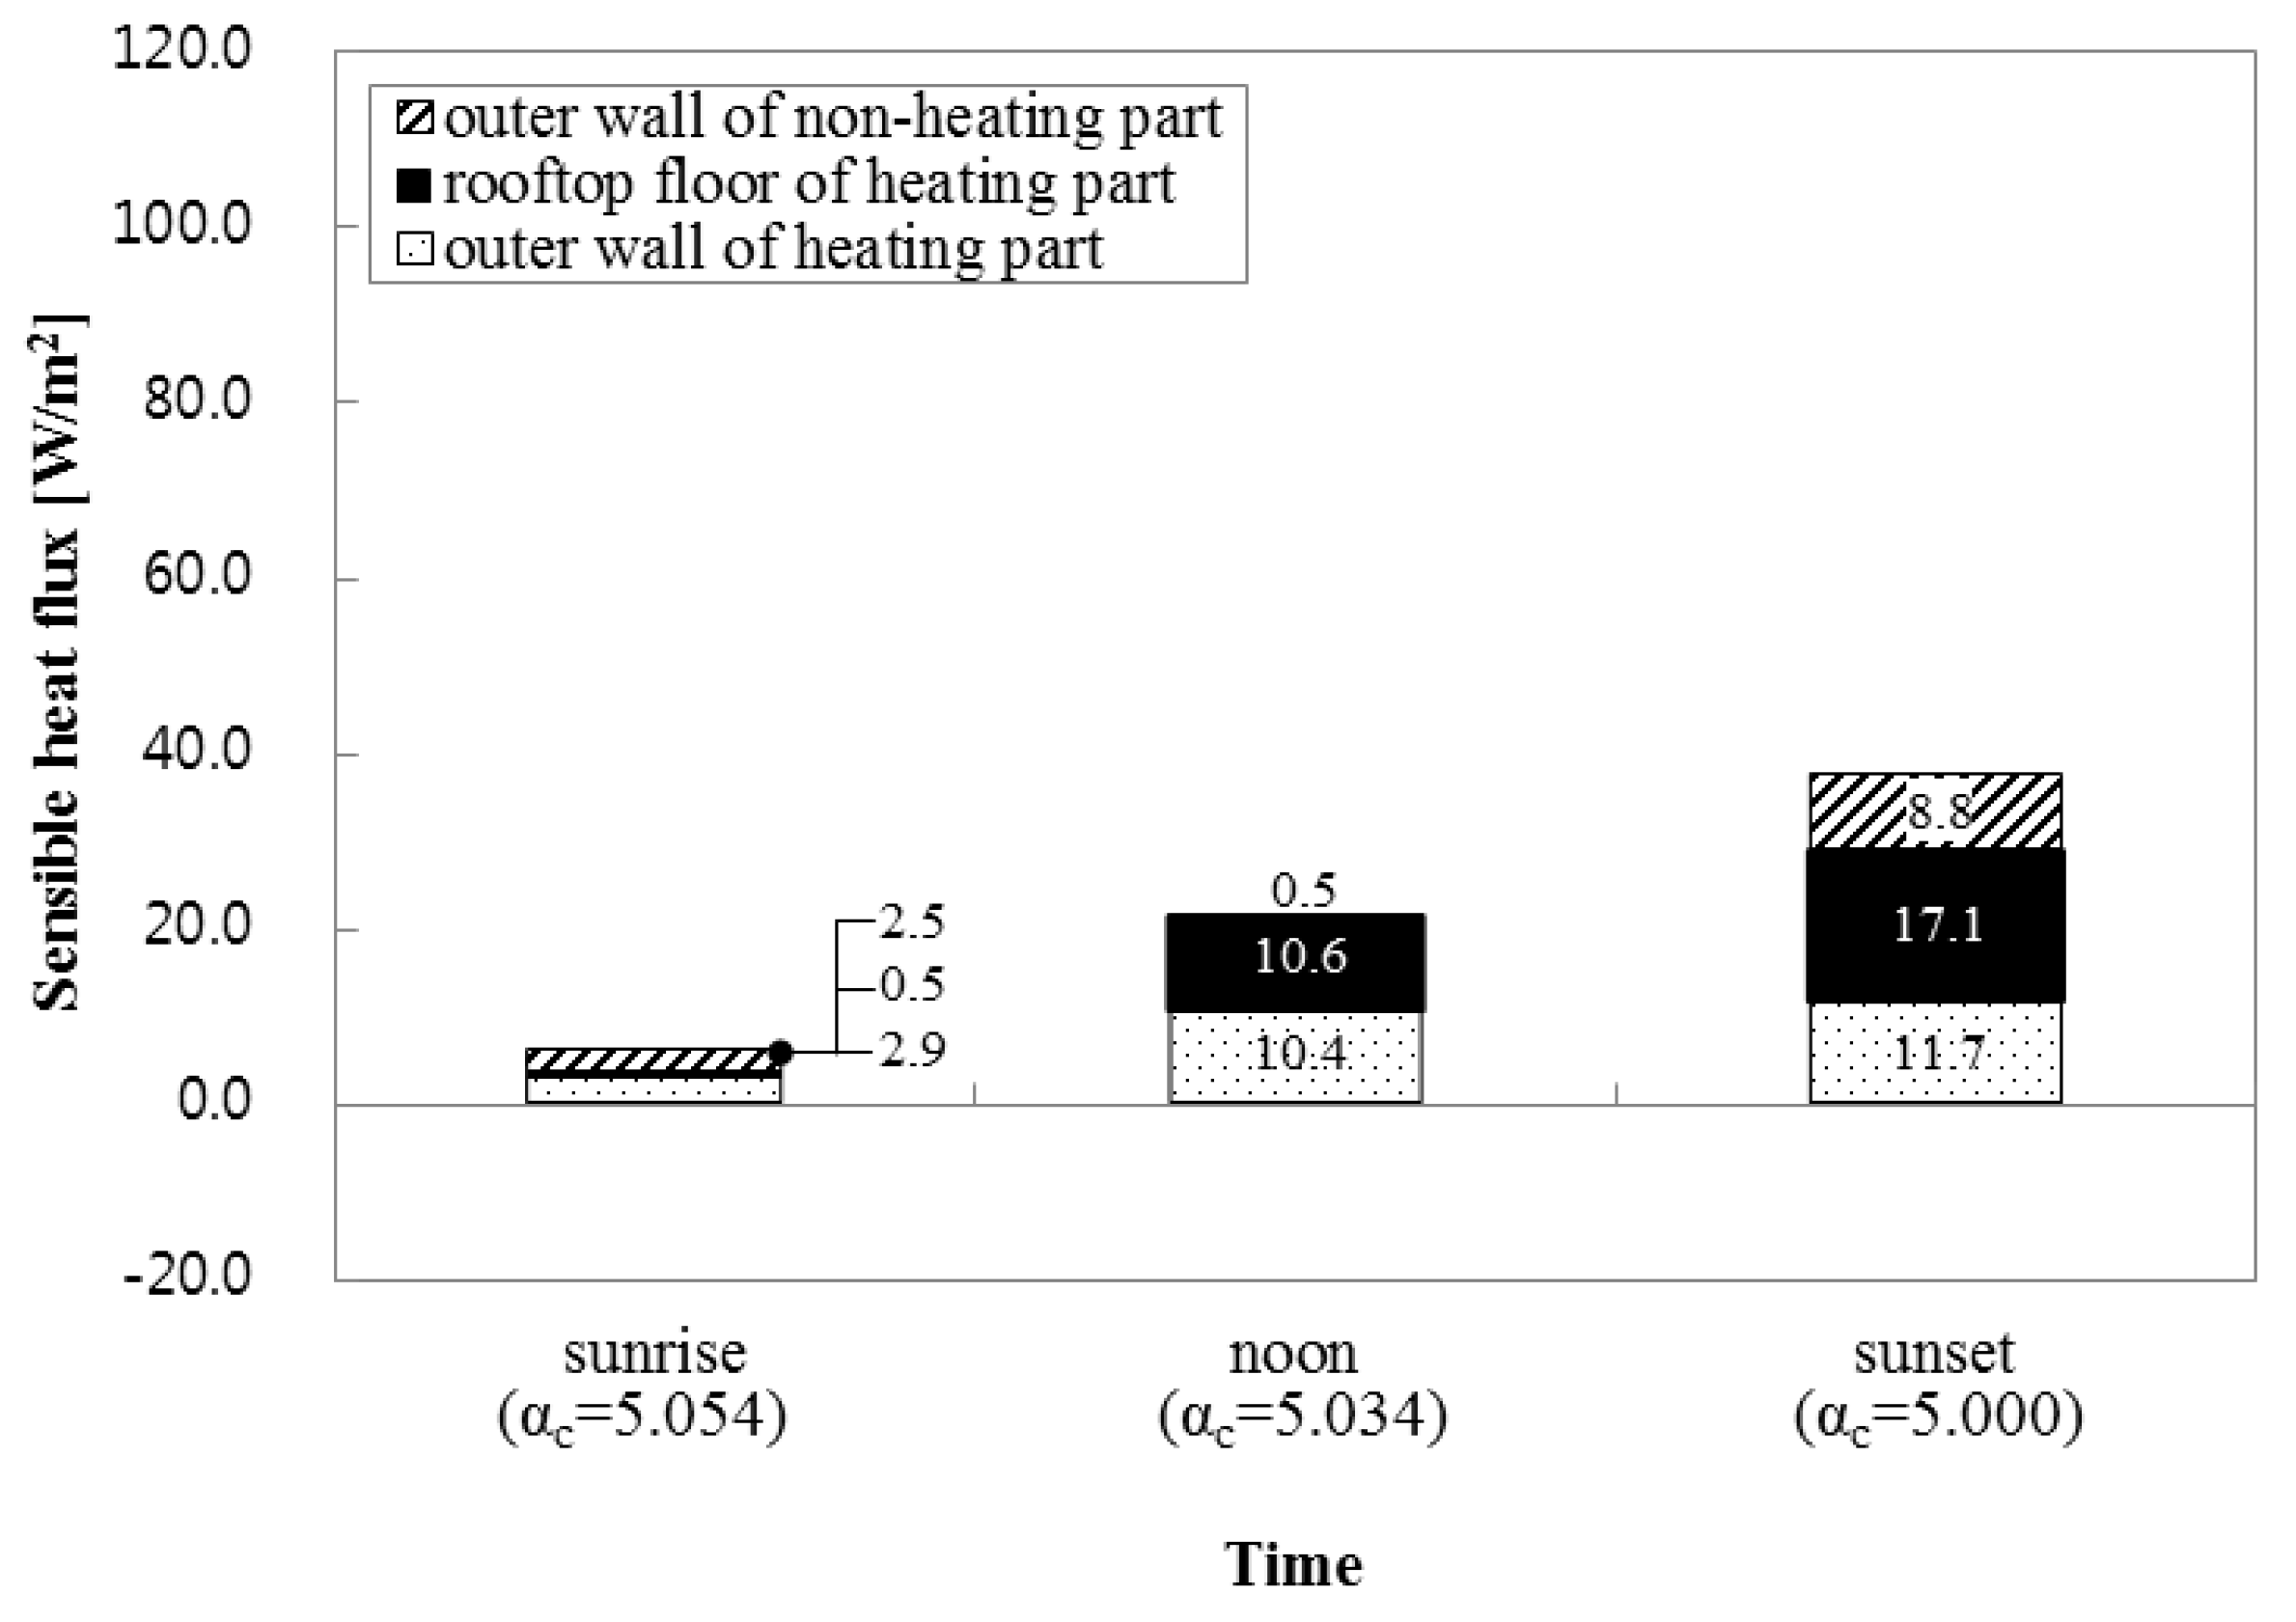
Figure 8.
Sensible heat flux values of southeast side of residential building C by material composition.
Figure 8.
Sensible heat flux values of southeast side of residential building C by material composition.
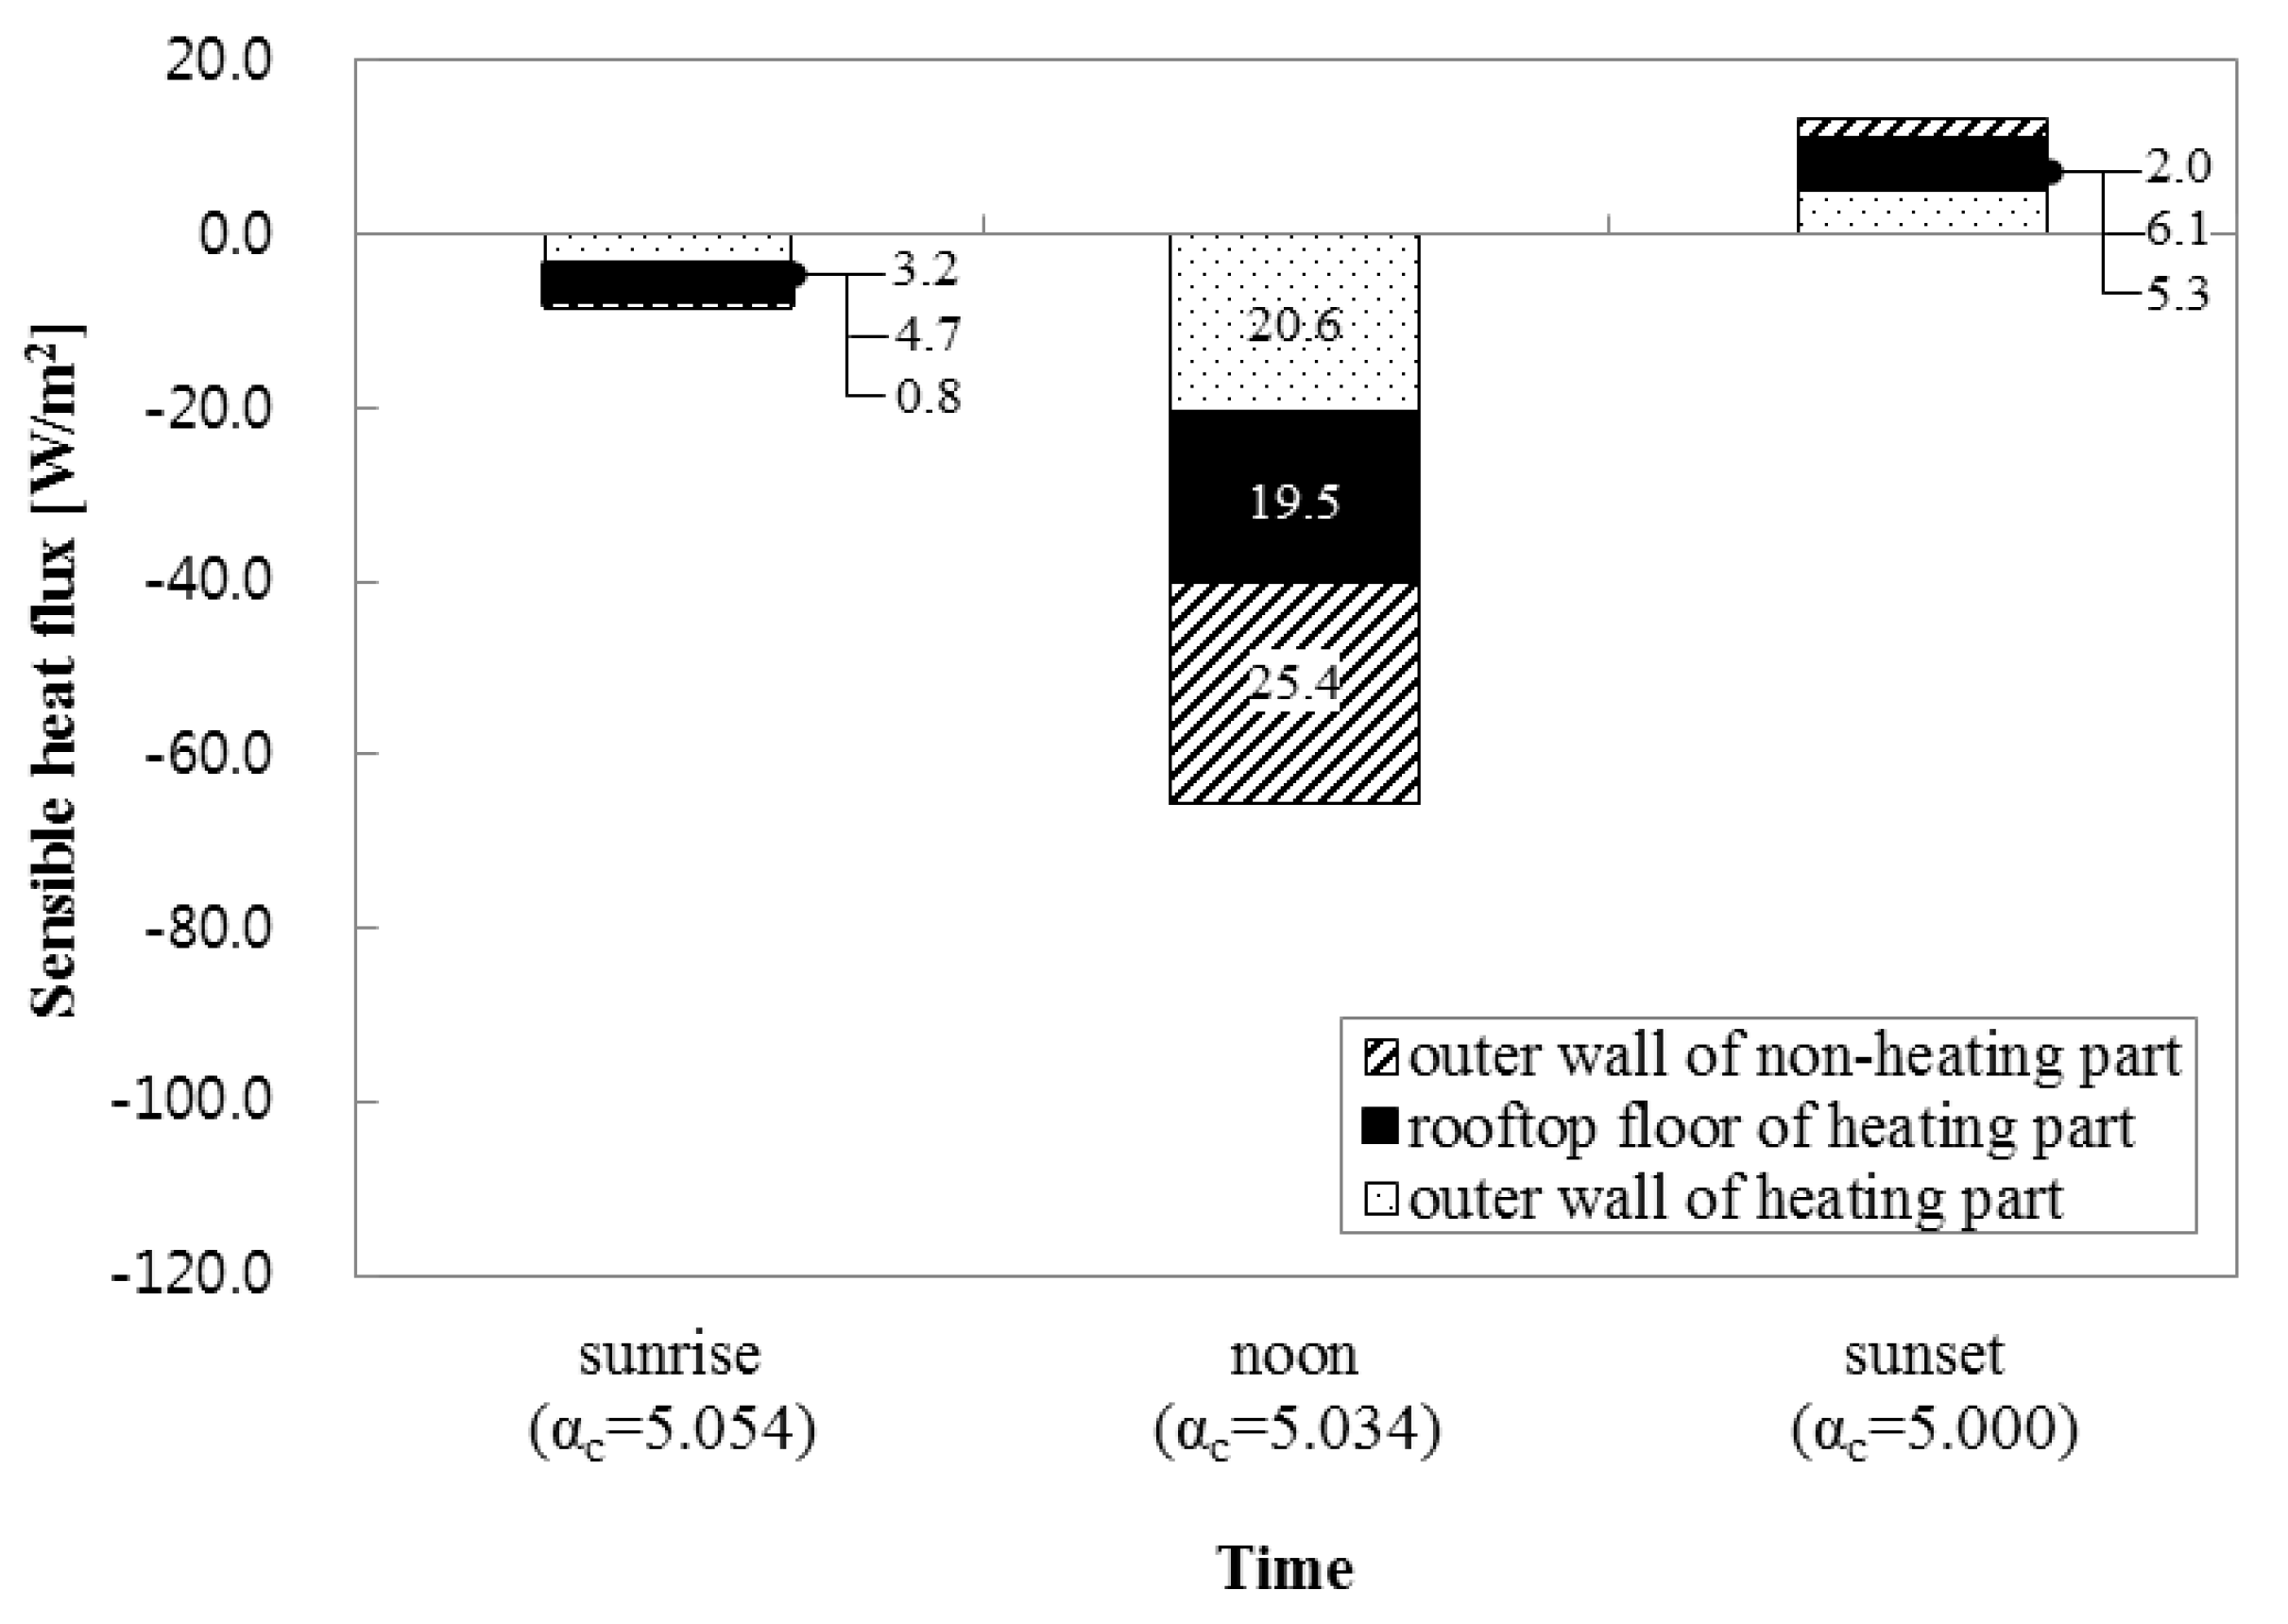
Figure 9.
Sensible heat flux values of outdoor surface area by material composition.
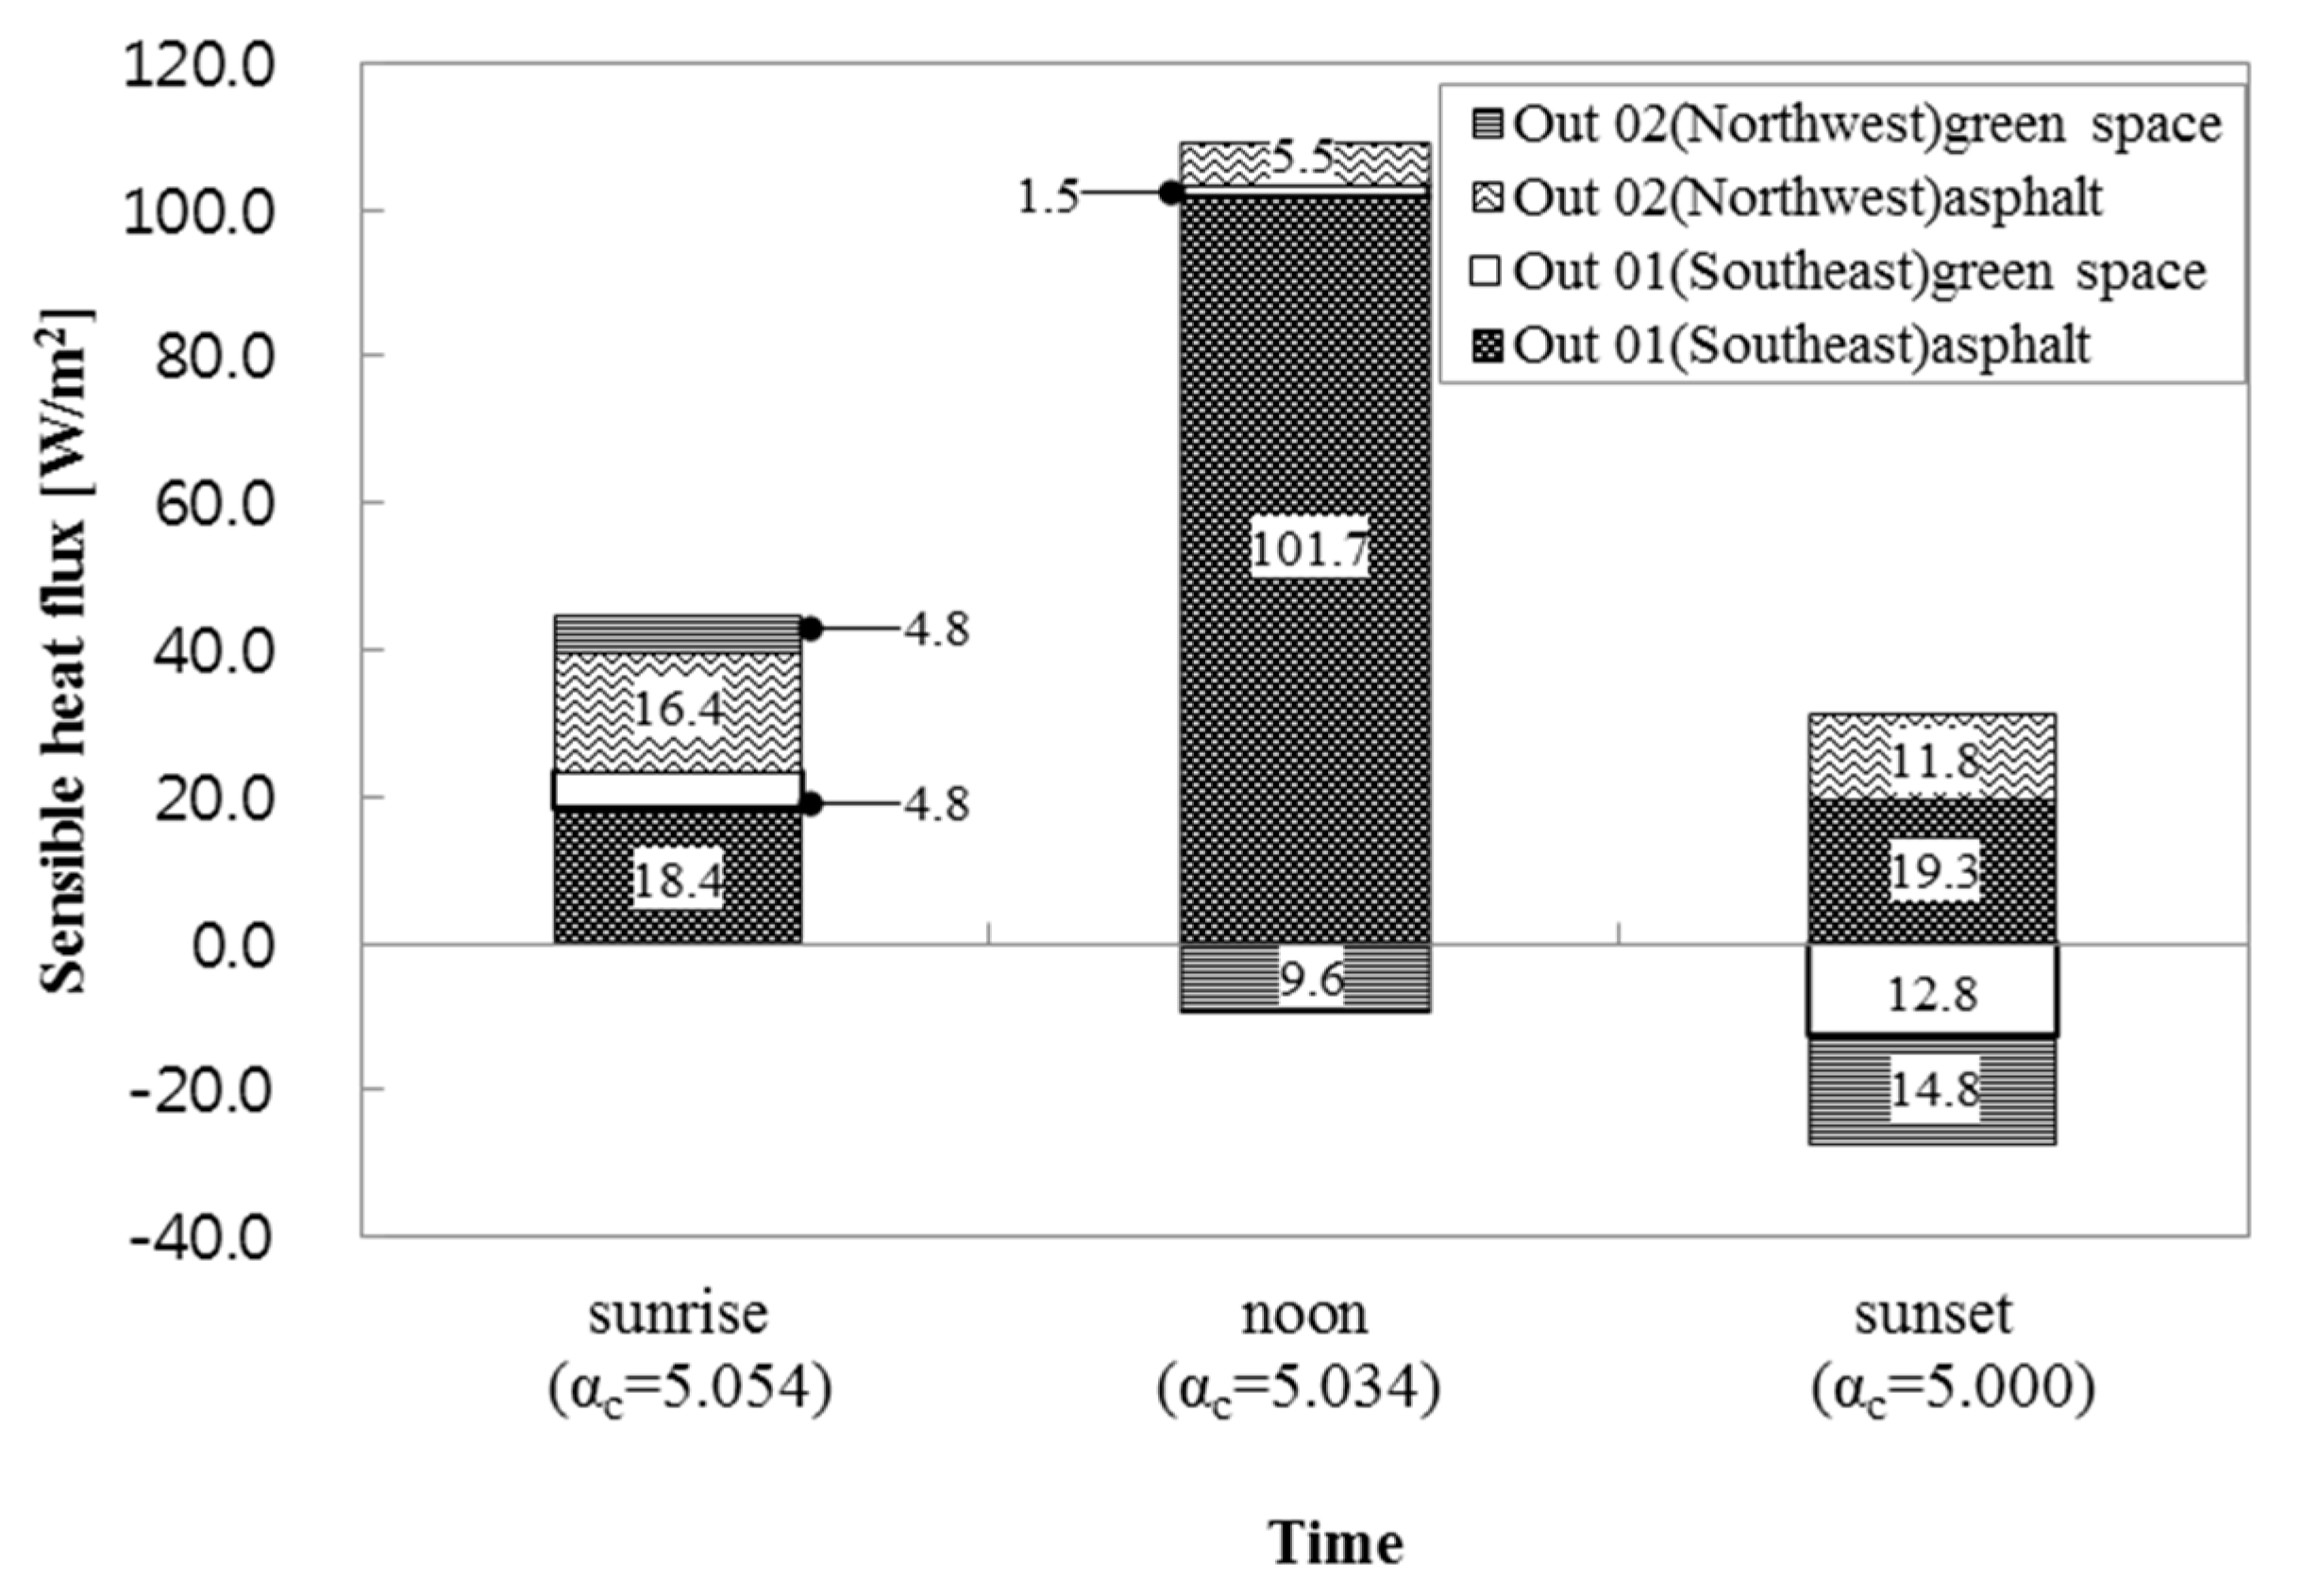
Figure 10.
HIP during single day.
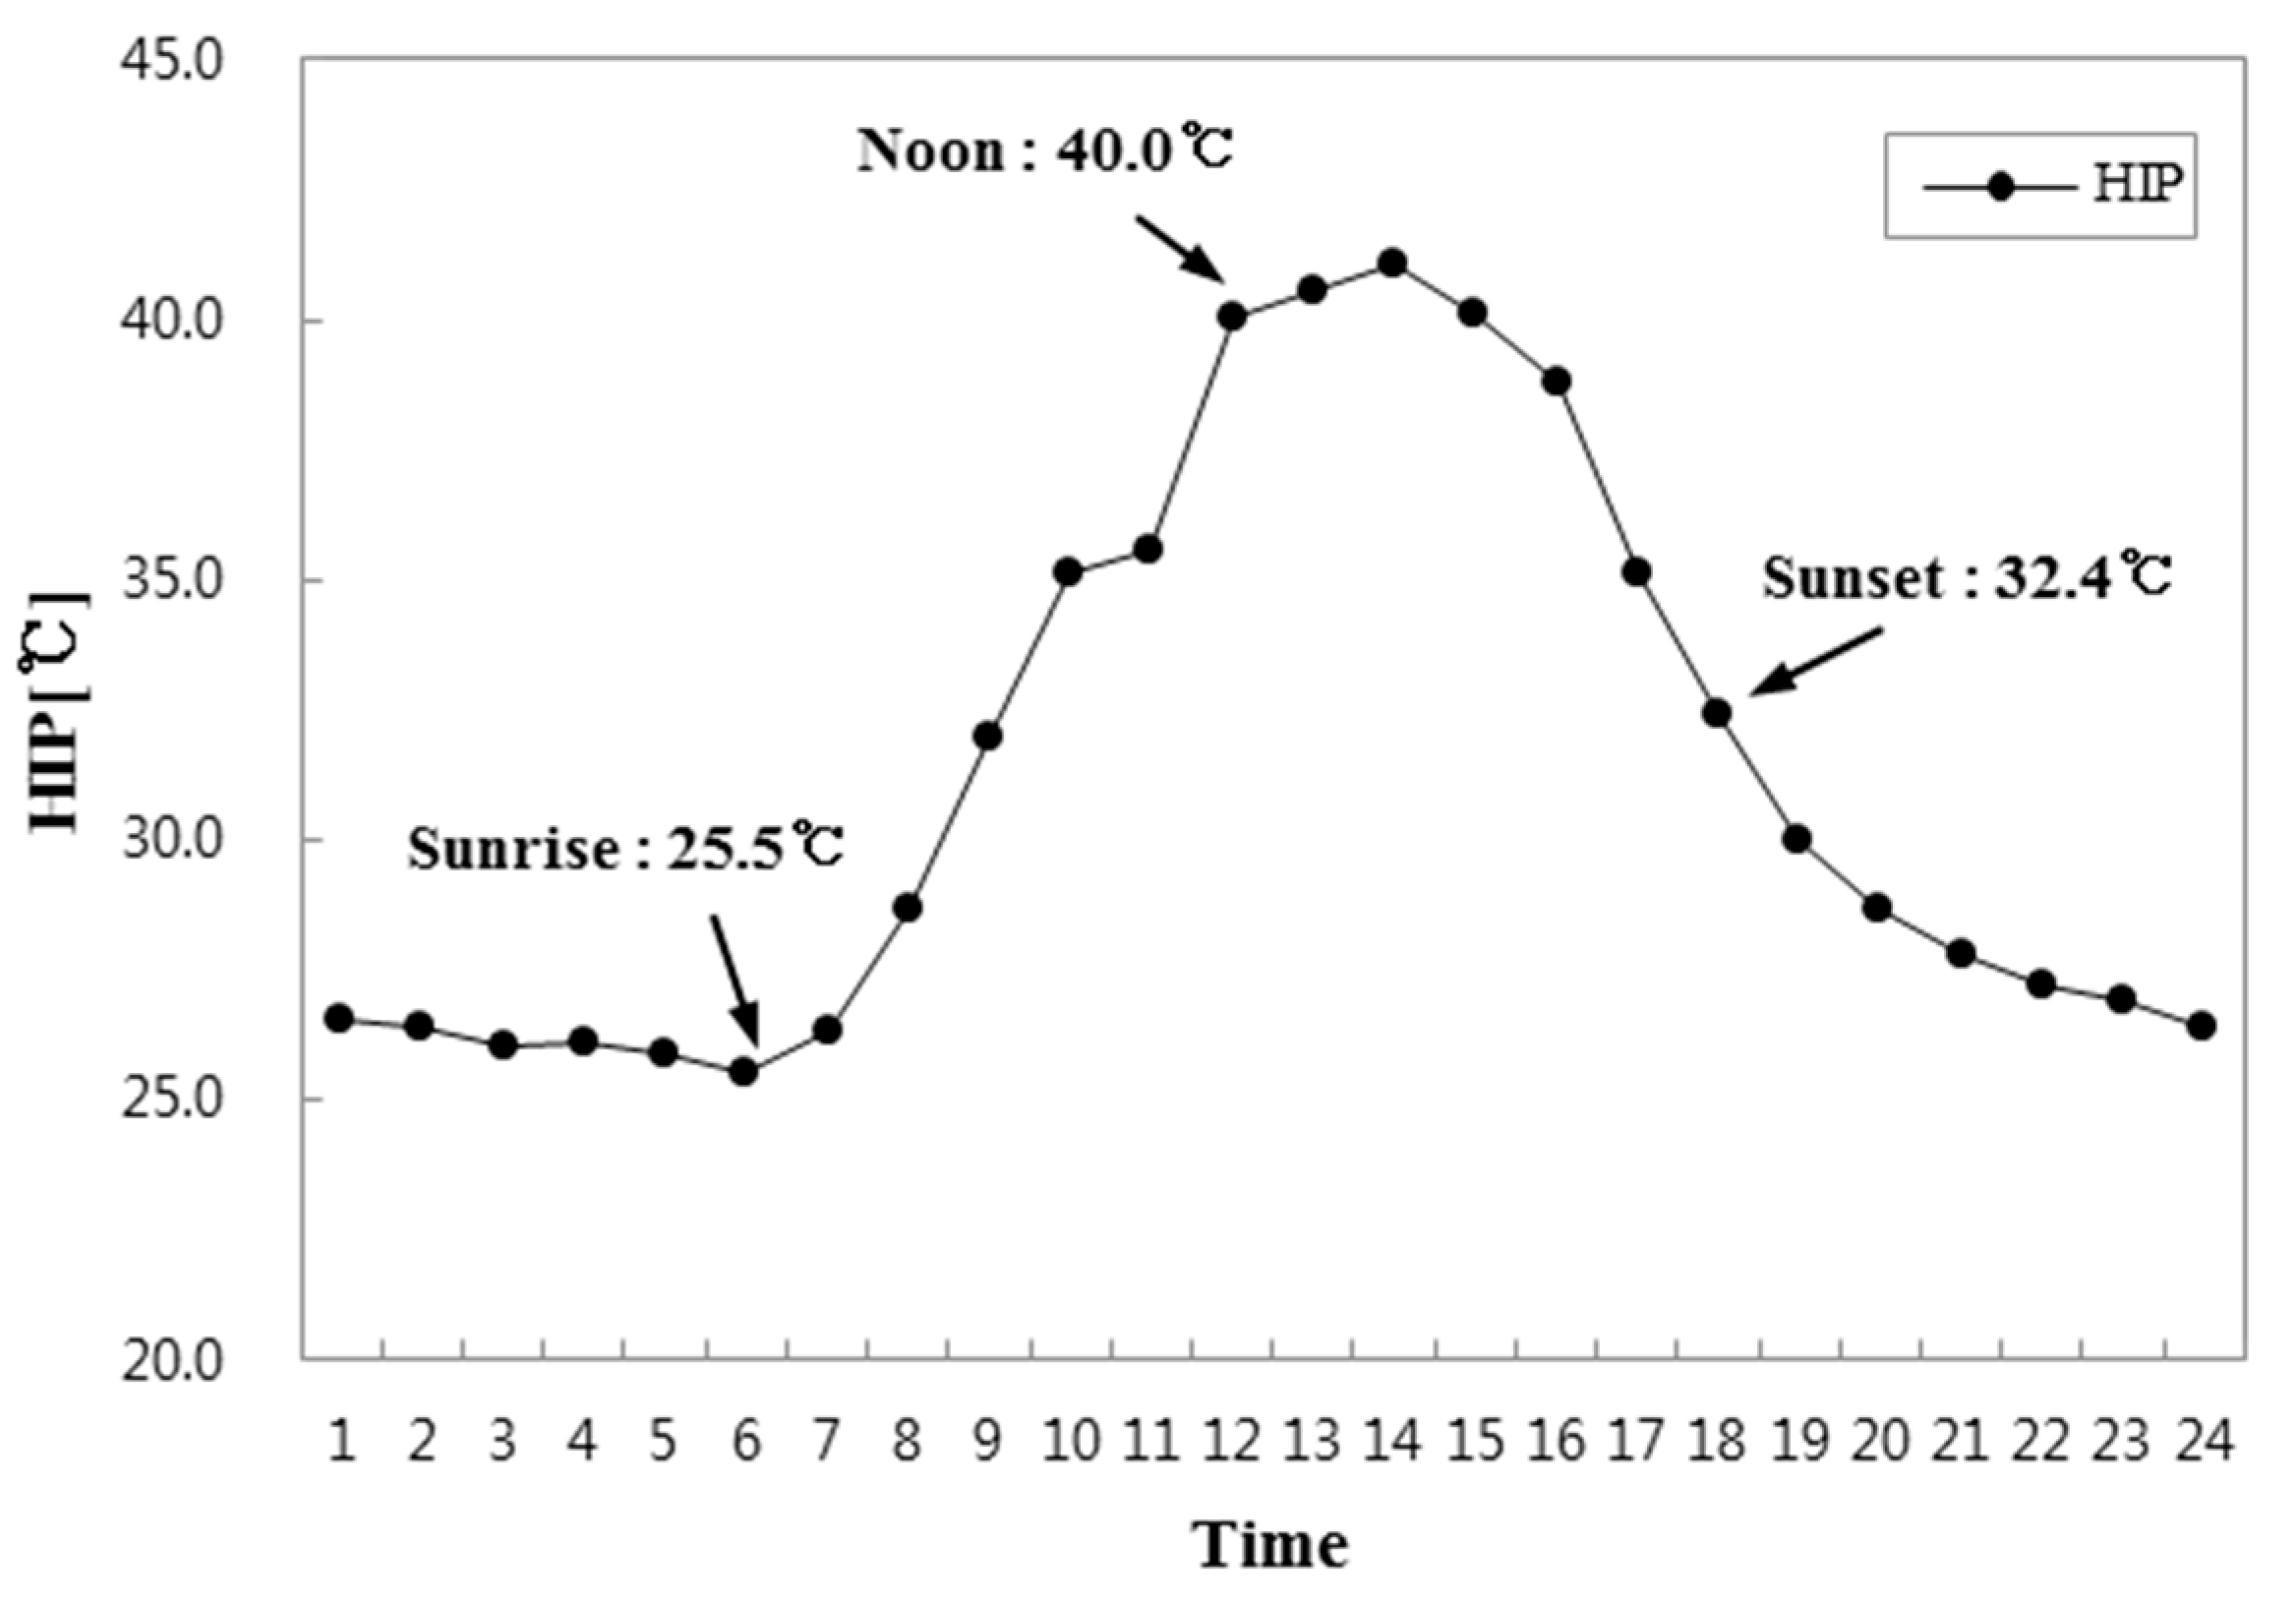
Figure 11.
Comparison of measured thermal image surface temperature value and value calculated in numerical simulation; (a) Residential building A; (b) Residential building B; (c) Residential building C; (d) Residential building D.
Figure 11.
Comparison of measured thermal image surface temperature value and value calculated in numerical simulation; (a) Residential building A; (b) Residential building B; (c) Residential building C; (d) Residential building D.

Table 1.
Design parameters and levels.
| Level | Plan for Window | Plan for Insulation | Plan for Roof Surface Materials | Plan for Surface Cover |
|---|---|---|---|---|
| WWR [%] | [W/m2·K] | |||
| A | B | C | D | |
| 1 | 30 | 0.15 | high reflectivity paints | green space |
| 2 | 50 | 0.21 | lawn grass | bare soil |
| 3 | 70 | 0.27 | soil depth | porous pavement |
| 4 | 90 | 0.36 | concrete | asphalt |
Table 2.
Orthogonal array of L16.
| No. | Coded Value | Combination | ||||
|---|---|---|---|---|---|---|
| A | B | C | D | |||
| 1 | 1 | 1 | 1 | 1 | A1B1C1D1 | WWR 30%, 0.15 W/m2·K, High reflectivity paints, Green space |
| 2 | 1 | 2 | 2 | 2 | A1B2C2D2 | WWR 30%, 0.21 W/m2·K, Lawn grass, Bare soil |
| 3 | 1 | 3 | 3 | 3 | A1B3C3D3 | WWR 30%, 0.27 W/m2·K, Soil depth, Porous pavement |
| 4 | 1 | 4 | 4 | 4 | A1B4C4D4 | WWR 30%, 0.36 W/m2·K, Concrete, Asphalt |
| 5 | 2 | 1 | 2 | 3 | A2B1C2D3 | WWR 50%, 0.15 W/m2·K, Lawn grass, Porous pavement |
| 6 | 2 | 2 | 1 | 4 | A2B2C1D4 | WWR 50%, 0.21 W/m2·K, High reflectivity paints, Asphalt |
| 7 | 2 | 3 | 4 | 1 | A2B3C4D1 | WWR 50%, 0.27 W/m2·K, Concrete, Green space |
| 8 | 2 | 4 | 3 | 2 | A2B4C3D2 | WWR 50%, 0.36 W/m2·K, Soil depth, Bare soil |
| 9 | 3 | 1 | 3 | 4 | A3B1C3D4 | WWR 70%, 0.15 W/m2·K, Soil depth, Asphalt |
| 10 | 3 | 2 | 4 | 3 | A3B2C4D3 | WWR 70%, 0.21 W/m2·K, Concrete, Porous pavement |
| 11 | 3 | 3 | 1 | 2 | A3B3C1D2 | WWR 70%, 0.27 W/m2·K, High–reflectivity paints, Bare soil |
| 12 | 3 | 4 | 2 | 1 | A3B4C2D1 | WWR 70%, 0.36 W/m2·K, Lawn grass, Green space |
| 13 | 4 | 1 | 4 | 2 | A4B1C4D2 | WWR 90%, 0.15 W/m2·K, Concrete, Bare soil |
| 14 | 4 | 2 | 3 | 1 | A4B2C3D1 | WWR 90%, 0.21 W/m2·K, Soil depth, Green space |
| 15 | 4 | 3 | 2 | 4 | A4B3C2D4 | WWR 90%, 0.27 W/m2·K, Lawn grass, Asphalt |
| 16 | 4 | 4 | 1 | 3 | A4B4C1D3 | WWR 90%, 0.36 W/m2·K, High-reflectivity paints, Porous pavement |
Table 3.
Surface temperatures of residential buildings where field measurements were conducted.
| Result | Entire Surface Temperature of Residential Buildings [°C] | |||
|---|---|---|---|---|
| Residential Building | Sunrise | Noon | Sunset | |
| A | 24.2 | 30.7 | 28.6 | |
| B | 24.3 | 30.2 | 28.2 | |
| C | 24.2 | 30.6 | 28.2 | |
| D | 24.2 | 30.2 | 28.2 | |
Table 4.
MRT at 1.5 m from ground in measurement area.
| Result Time | MRT [°C] |
|---|---|
| 12:00 (noon) | 25.5 |
| 13:00 | 31.2 |
| 14:00 | 30.5 |
| 15:00 | 28.9 |
Table 5.
Differences in outdoor thermal environment for various surface plans.
| Result | Outdoor Thermal Environment | |||||||||
|---|---|---|---|---|---|---|---|---|---|---|
| Entire Surface Temperature of Residential Buildings [°C] | MRT [°C] | HIP [°C] | ||||||||
| Case | 06:00 | 12:00 | 14:00 | 19:00 | 14:00 | 06:00 | 12:00 | 14:00 | 19:00 | |
| 1 | A1B1C1D1 | 26.6 | 33.7 | 35.1 | 30.3 | 35.2 | 27.5 | 45.6 | 44.5 | 29.6 |
| 2 | A1B2C2D2 | 26.8 | 34.2 | 35.5 | 30.4 | 38.6 | 29.0 | 48.9 | 47.4 | 30.6 |
| 3 | A1B3C3D3 | 26.8 | 34.1 | 35.4 | 30.4 | 37.6 | 29.3 | 47.7 | 46.5 | 31.0 |
| 4 | A1B4C4D4 | 26.8 | 34.5 | 35.9 | 30.5 | 39.2 | 29.3 | 49.7 | 48.3 | 31.1 |
| 5 | A2B1C2D3 | 26.4 | 33.8 | 35.1 | 29.9 | 37.5 | 28.7 | 47.2 | 46.0 | 30.2 |
| 6 | A2B2C1D4 | 26.1 | 33.1 | 34.4 | 29.9 | 38.8 | 28.1 | 47.5 | 46.0 | 30.1 |
| 7 | A2B3C4D1 | 26.3 | 34.1 | 35.4 | 29.9 | 35.2 | 27.2 | 47.5 | 45.1 | 29.0 |
| 8 | A2B4C3D2 | 26.4 | 33.8 | 35.1 | 29.9 | 38.5 | 28.3 | 47.5 | 46.7 | 29.8 |
| 9 | A3B1C3D4 | 26.1 | 33.4 | 34.7 | 29.4 | 38.9 | 28.1 | 47.5 | 46.5 | 29.3 |
| 10 | A3B2C4D3 | 26.1 | 33.8 | 35.1 | 29.5 | 37.4 | 28.1 | 47.2 | 46.0 | 29.5 |
| 11 | A3B3C1D2 | 26.1 | 33.4 | 34.7 | 29.4 | 38.9 | 28.1 | 48.0 | 46.5 | 29.3 |
| 12 | A3B4C2D1 | 26.5 | 34.3 | 35.6 | 30.2 | 35.5 | 27.6 | 46.6 | 45.4 | 29.4 |
| 13 | A4B1C4D2 | 26.1 | 33.9 | 35.2 | 29.5 | 38.4 | 27.7 | 48.4 | 46.8 | 29.1 |
| 14 | A4B2C3D1 | 26.0 | 33.3 | 34.6 | 29.3 | 35.2 | 26.6 | 44.9 | 43.9 | 28.0 |
| 15 | A4B3C2D4 | 26.1 | 33.4 | 34.7 | 29.5 | 38.9 | 28.2 | 48.0 | 46.5 | 29.5 |
| 16 | A4B4C1D3 | 26.1 | 33.4 | 34.7 | 29.4 | 37.4 | 28.0 | 46.5 | 45.3 | 29.3 |
| MAX | 26.8 | 34.5 | 35.9 | 30.5 | 39.2 | 29.3 | 49.7 | 48.3 | 31.1 | |
| AVE | 26.3 | 33.8 | 35.1 | 29.8 | 37.6 | 28.1 | 47.4 | 46.1 | 29.7 | |
| MIN | 26.0 | 33.1 | 34.4 | 29.3 | 35.2 | 26.6 | 44.9 | 43.9 | 28.0 | |
Table 6.
Significance probability analysis by design of experiments.
| Factor | F | P |
|---|---|---|
| plan for window: WWR (A) | 11.47 | 0.038 |
| plan for insulation (B) | 5.08 | 0.108 |
| plan for roof surface materials (C) | 9.09 | 0.051 |
| plan for surface cover (D) | 159.94 | 0.001 |
Significance level < 0.05.
Table 7.
Correlation between surface plan design factors and outdoor thermal environment.
| Result | Outdoor Thermal Environment | |||
|---|---|---|---|---|
| Design Factors | Entire Surface Temperature of Building | MRT | HIP | |
| building skin | plan for window (WWR) | −0.734 | −0.027 | −0.499 |
| 0.001 | 0.460 | 0.025 | ||
| plan for insulation ( Thermal transmittance ) | 0.324 | 0.045 | 0.199 | |
| 0.110 | 0.434 | 0.240 | ||
| plan for roof surface materials | 0.337 | −0.005 | 0.187 | |
| 0.101 | 0.493 | 0.244 | ||
| plan for surface cover | −0.133 | −0.751 | −0.604 | |
| 0.311 | 0.000 | 0.007 | ||
 Correlation coefficient,
  Significance probability, Significance level < 0.05.
Table 8.
Design factors that affect outdoor thermal environments.
| Result | Correlation Coefficient | Significance Probability | |
|---|---|---|---|
| Design Factors | |||
| plan for window | Entire surface temperature of building | −0.734 | 0.001 |
| HIP | −0.499 | 0.025 | |
| plan for surface cover | MRT | −0.751 | 0.000 |
| HIP | −0.604 | 0.007 | |
Significance level < 0.05.
© 2017 by the authors. Licensee MDPI, Basel, Switzerland. This article is an open access article distributed under the terms and conditions of the Creative Commons Attribution (CC BY) license (http://creativecommons.org/licenses/by/4.0/).
Share and Cite
MDPI and ACS Style
Jung, S.; Yoon, S. Deduction of Optimum Surface Design Factors for Enhancement of Outdoor Thermal Environment in a Micro-Scale Unit. Sustainability 2017, 9, 1381. https://doi.org/10.3390/su9081381
AMA Style
Jung S, Yoon S. Deduction of Optimum Surface Design Factors for Enhancement of Outdoor Thermal Environment in a Micro-Scale Unit. Sustainability. 2017; 9(8):1381. https://doi.org/10.3390/su9081381
Chicago/Turabian StyleJung, Sukjin, and Seonghwan Yoon. 2017. "Deduction of Optimum Surface Design Factors for Enhancement of Outdoor Thermal Environment in a Micro-Scale Unit" Sustainability 9, no. 8: 1381. https://doi.org/10.3390/su9081381
Note that from the first issue of 2016, this journal uses article numbers instead of page numbers. See further details here.