1. Significance and Purpose of This Research
In recent years, energy consumption (carbon dioxide emissions) has increased significantly in many developing countries along with economic development. In the tropics, people run air conditioners all day long. This puts a huge burden on the environment. Traditional houses in Thailand, like other tropical countries, have developed the ingenuity to control heat without using air conditioners. However, not all modern-type houses inherit such ingenuities. There are several factors that reduce carbon dioxide emissions in traditional houses, including the ways of living there. In order to reduce the load from the use of air conditioners, it is important to determine the factors which we can pass on to modern-type houses.
The previous studies on low carbon research and the policies of residential buildings have primarily focused on the technology and daily living activities aiming for low carbon use [
1,
2,
3,
4]. Likewise in Thailand, there exist a number of studies on building technology for reducing carbon emissions in Thai houses. Also, there are not many, but some studies on the low carbon lifestyle including the temperature setting of air conditioners and the use of low carbon houses and appliances [
5,
6,
7]. Although these are important, it is necessary to take another approach considering the growing speed of energy consumption.
It is difficult for developing countries to make energy consumption efficiency, including energy saving activities, as high as the increase in energy consumption caused by the dependency on air conditioners. On the other hand, traditional lifestyles with economic and technological limitations offer wisdom for living in comfort without using air conditioners, and that may decelerate the consumption increase.
Studies on traditional houses focus primarily on changes in ethnological, architectural and historical perspectives [
8,
9], and few look at low carbon aspects [
10]. The wisdom of traditional houses and lifestyles can be made better use of in low carbon lifestyles.
A stilt house is one of the traditional Thai houses. In many stilt houses, the renovations are made to add an indoor space to an outdoor open space on the first floor. On the other hand, modern houses, not built as a stilt house, are currently increasing in Thailand [
8,
10]. It is assumed that there is a relation between changes of house styles in rural Thailand and changes in people’s living behavior.
This study focuses on the length of time staying both outside in the shade and inside a room, where in a house people prefer to stay, and the activities taking place in those places. Communication with neighbors may happen outside a house more than inside, and watching TV and using a PC would take place inside a house. The length of use of air conditioners is assumed to be longer for those who stay inside. Even in the house, among those who stay with the family in the living room and those prefer respective bedrooms, the use of air conditioners becomes lower for the former.
A lifestyle in this study indicates a preference for daily activities in and around a house; staying with neighbors and family, relaxing and spending time outside on hobbies, watching TV and browsing the internet in a bedroom, using air conditioners, and others.
Previous studies have reported that outdoor space, semi-outdoor space, and indoor space in Thai houses vary depending on the type of house and play different roles. However, there are few reports that have analyzed houses in Thailand from the viewpoint of energy consumption.
We aim to determine the characteristics of the relation among the spatial characteristics of houses, the favorite place to stay in houses, and the living behaviors and energy consumption from the use of air conditioners.
In the choice of favorite place in the house and living behaviors, except for the necessity of work and economic reasons, comfort is an influential factor. Comfort may come from physiological comfort such as coolness, and may also be the social and psychological satisfaction derived from social capital such as communication with neighbors and one’s sense of value. However, comfort is not sufficient to grasp the social and psychological factors. In recent years, while studies on subjective happiness associated with comfort from various perspectives and life satisfaction have been developed, subjective happiness has not sufficiently been taken as a motive for activities. Not just the comfort of the place, but also the various factors of happiness can be considered as the reasons for selecting a place to stay, and social and cultural observations can possibly be added to the motivation analysis of place selection.
To this end, we conducted a questionnaire survey in rural areas where traditional Thai houses still exist.
2. Methods and Subject Area
In relation to the selection of place for Thai people, the shape of outdoor space is thought of as being associated with the types of houses to some extent [
9,
10,
11]. There are semi-open spaces called
rabiang and
chan ban in traditional Thai houses. There are four types of house in Thailand: the first floor of a stilt house is left open (stilt house); the first floor is covered in part by walls (semi-renovated house); renovation is made to fully cover the four sides by walls (fully-renovated house); and a concrete house not derived from stilts (traditional) house and is connected to the ground (modern house). While there is a wide open space for stilt and semi-renovated houses, it is limited for fully-renovated and modern houses. There are some cases where outdoor space is created by an extended eave.
In many cases, people take a nap and spend time with a family and neighbors in the outdoor space. In our survey, we asked what kind of activities take place in the outdoor space and the reasons why the space is preferred. This is because the selection of place is determined both by the necessity of daily activities and by preference for the place.
People’s daily activities are considered to be linked with the feeling of happiness (satisfaction). Satisfaction (happiness) in space selection is thought to be related not only to physical satisfaction such as coolness, but also to the social relationship such as chatting with neighbors and family.
Also, quite a number of studies have shown that happiness is associated with life satisfaction. Thus, by conducting a relational analysis, we will clarify how much being outside is associated with one’s happiness comparing to other factors. In other words, if being outside makes one’s happiness greater, there is a possibility to reduce carbon emissions by seeking the way of designing outdoor spaces where people feel happy.
The questionnaire is composed of the following categories; (a) households—family number and income; (b) house—the types of houses and the floor area; (c) residential valuation—the types and the number of rooms, the types and the number of electronic appliances; (d) valuation of indoor, semi-outdoor and outdoor space—the length of staying period, activities, preferred places and the reasons for preference; (e) energy consumption—the cost of electricity and the time of use of air conditioners; (f) the level of happiness (on a five point rating); and (g) the satisfaction of multiple factors in lifestyle.
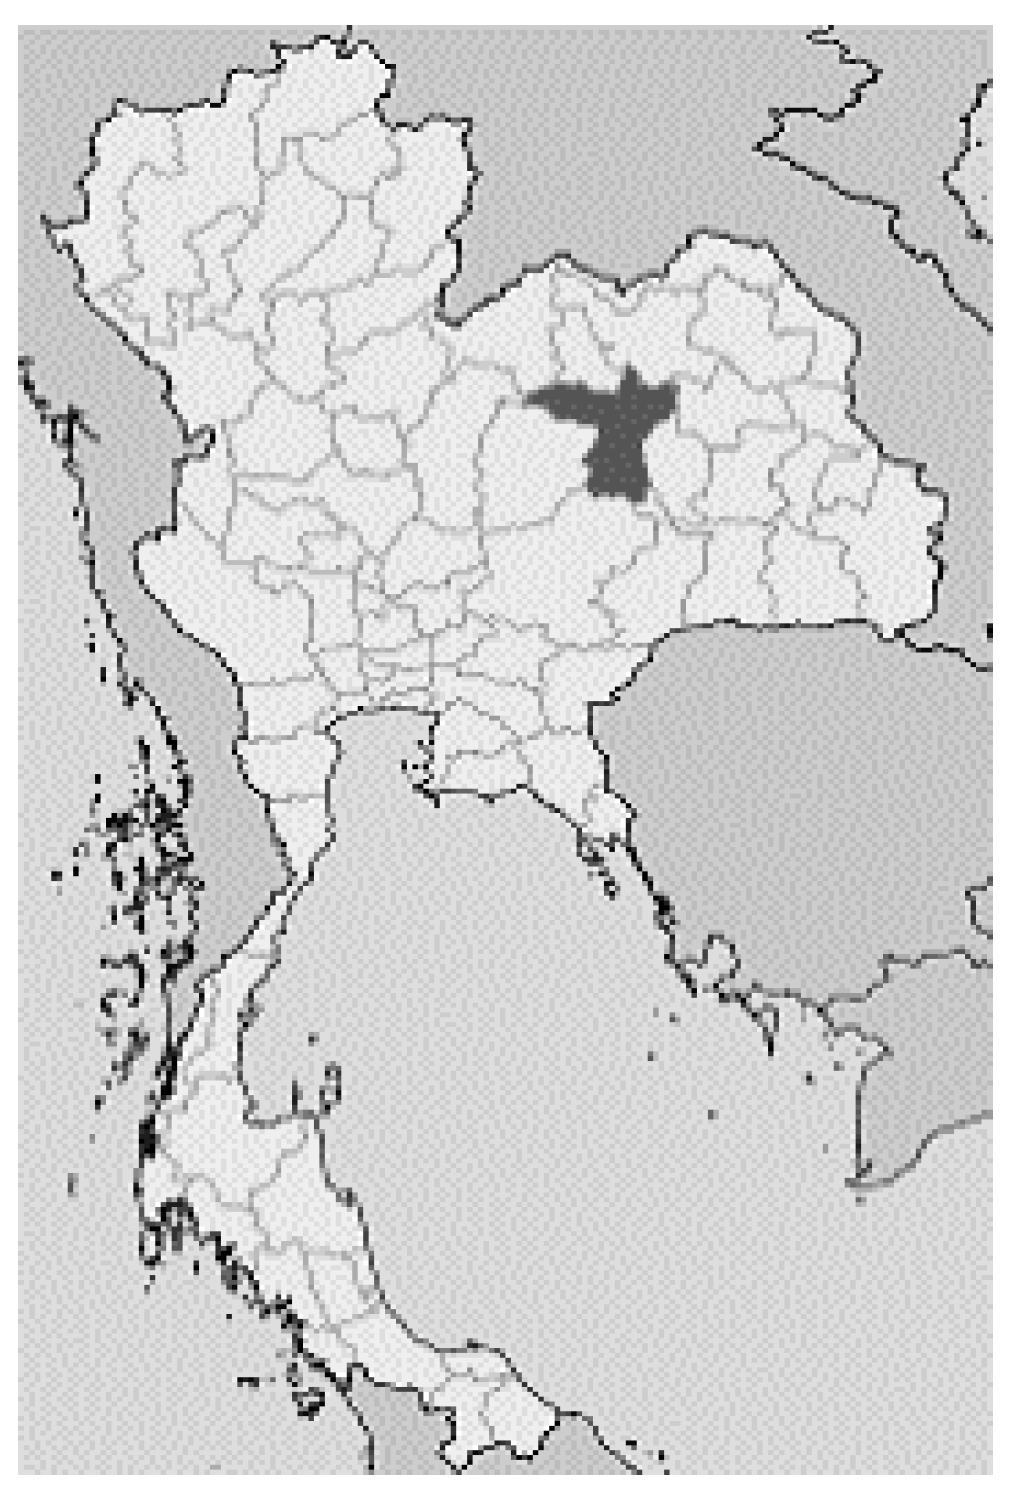
The survey area was the villages of Khon Kaen Province in the center of the Korat plateau in the northeastern part of Thailand (
Figure 1). Khon Kaen Province is the second largest province in the northeastern part of Thailand and has developed as an economic center of South Isaan.
We conducted this questionnaire survey in collaboration with CAS (College of Asian Scholars). We reflected variations in house style, living standards, and home electronics usage in the sample selection. CAS selected 100 samples in ten villages in Khon Kaen Province. CAS carefully selected them so that we could avoid bias. Between September and October 2016, the researchers visited these houses from door to door, held the interviews and filled out the questionnaire forms.
The social survey based on the questionnaires was conducted after the preliminary surveys two times in Khon Kaen. The categories of house type in Khon Kaen is more or less comparative to those in the previous studies. Today, however, various types of houses have been built, and the categories here are applicable to Khon Kaen, but not to the whole country in general. A further study is necessary on this point. In this light, this social survey is considered as a case study.
3. Type of Houses
3.1. Stilt House
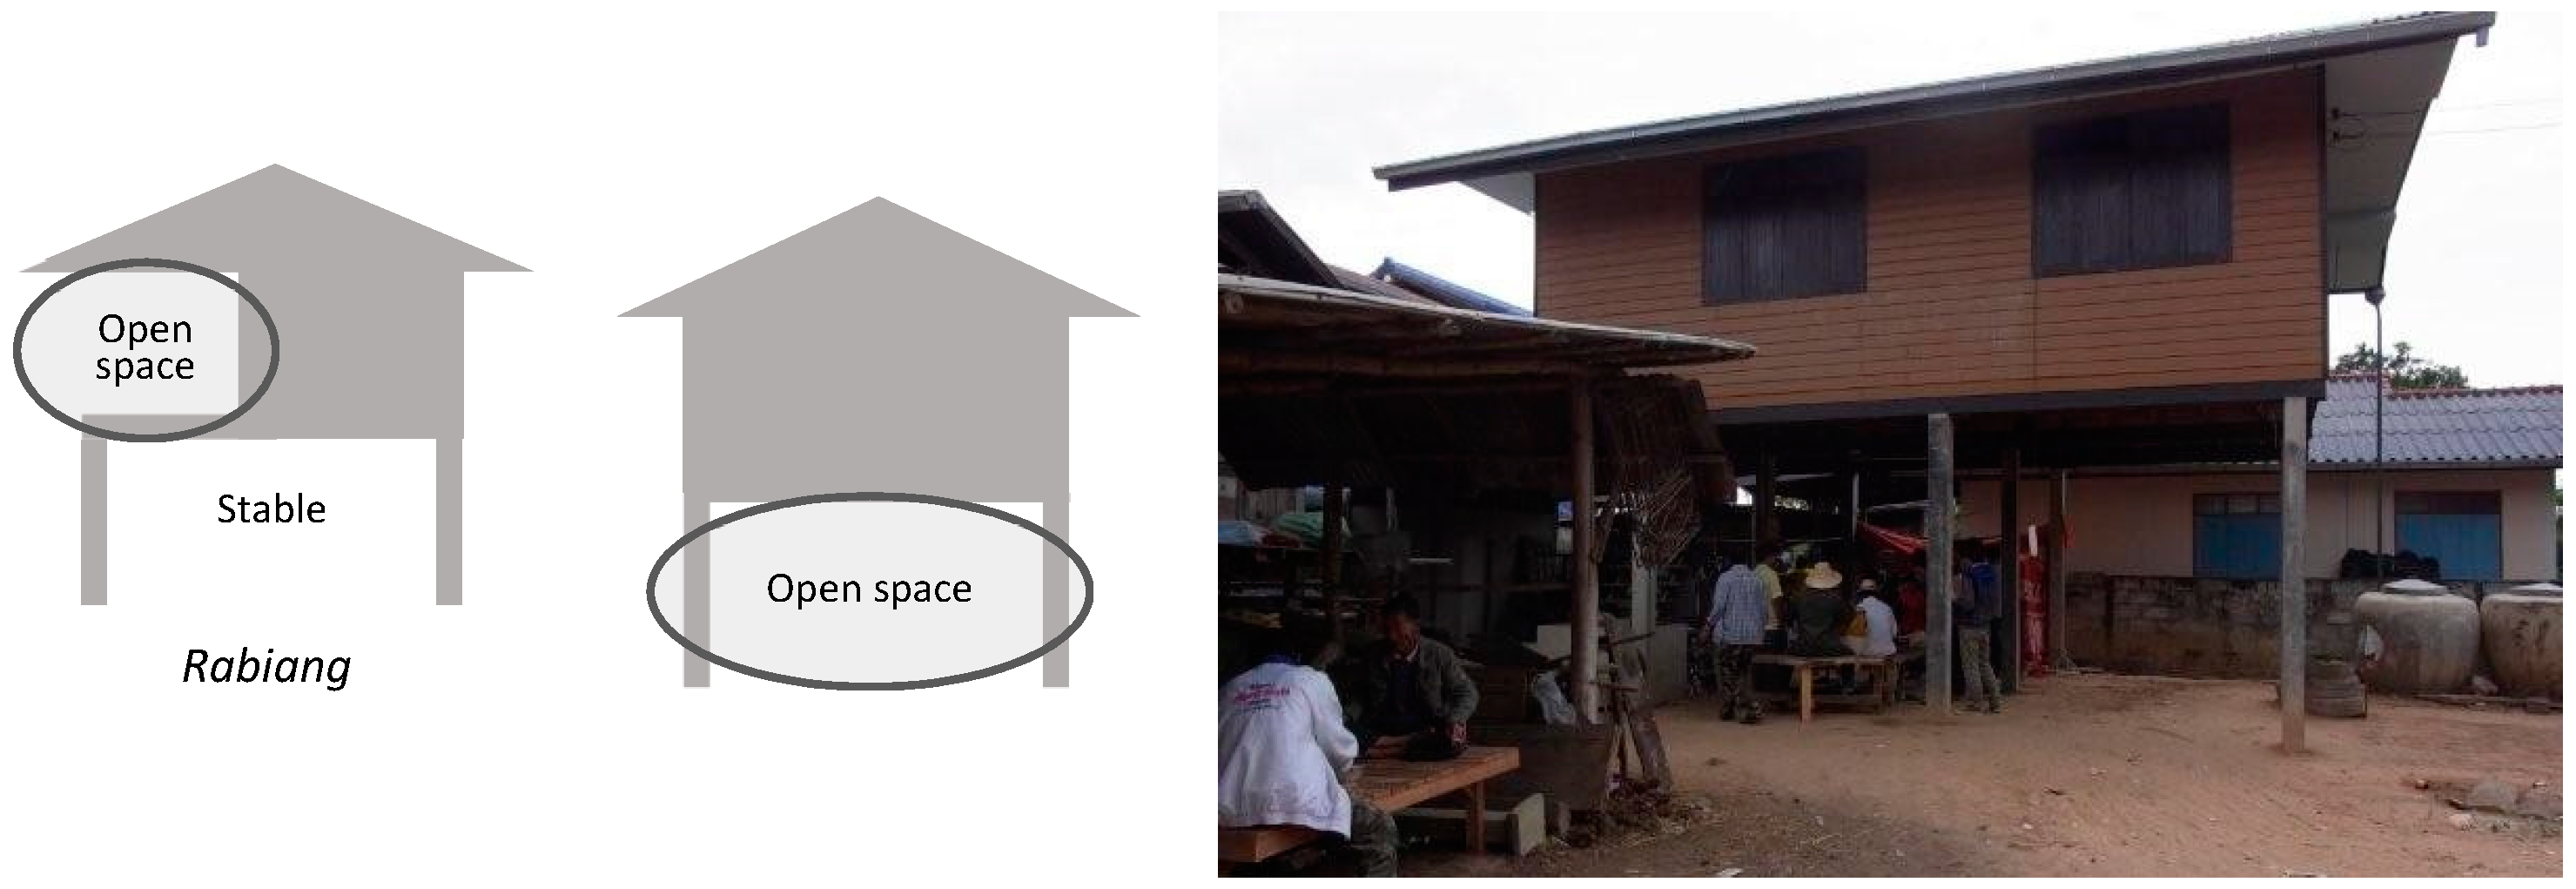
The first floor of a stilt house (
Figure 2) is an open space called
rabiang, on which the overhanging house is supported by poles. A bedroom and other rooms are in the house. Traditionally, an open area beneath the house was often used to keep farm animals, and there was partially an open space on the house. Currently, chairs and tables are placed in the open area on the first floor, often used as a living space. Many of the daily housewares are placed in this space, and the family members and neighbors gather.
3.2. Semi-Renovated House
There are two methods of renovation. The first is to partially cover the open space with walls to make an indoor space (
Figure 3). The second is to add a room outside the open space. The home electronics are placed to the new room. Both the open space and the new room have a function as a living space and both are considered as a favorite place to relax.
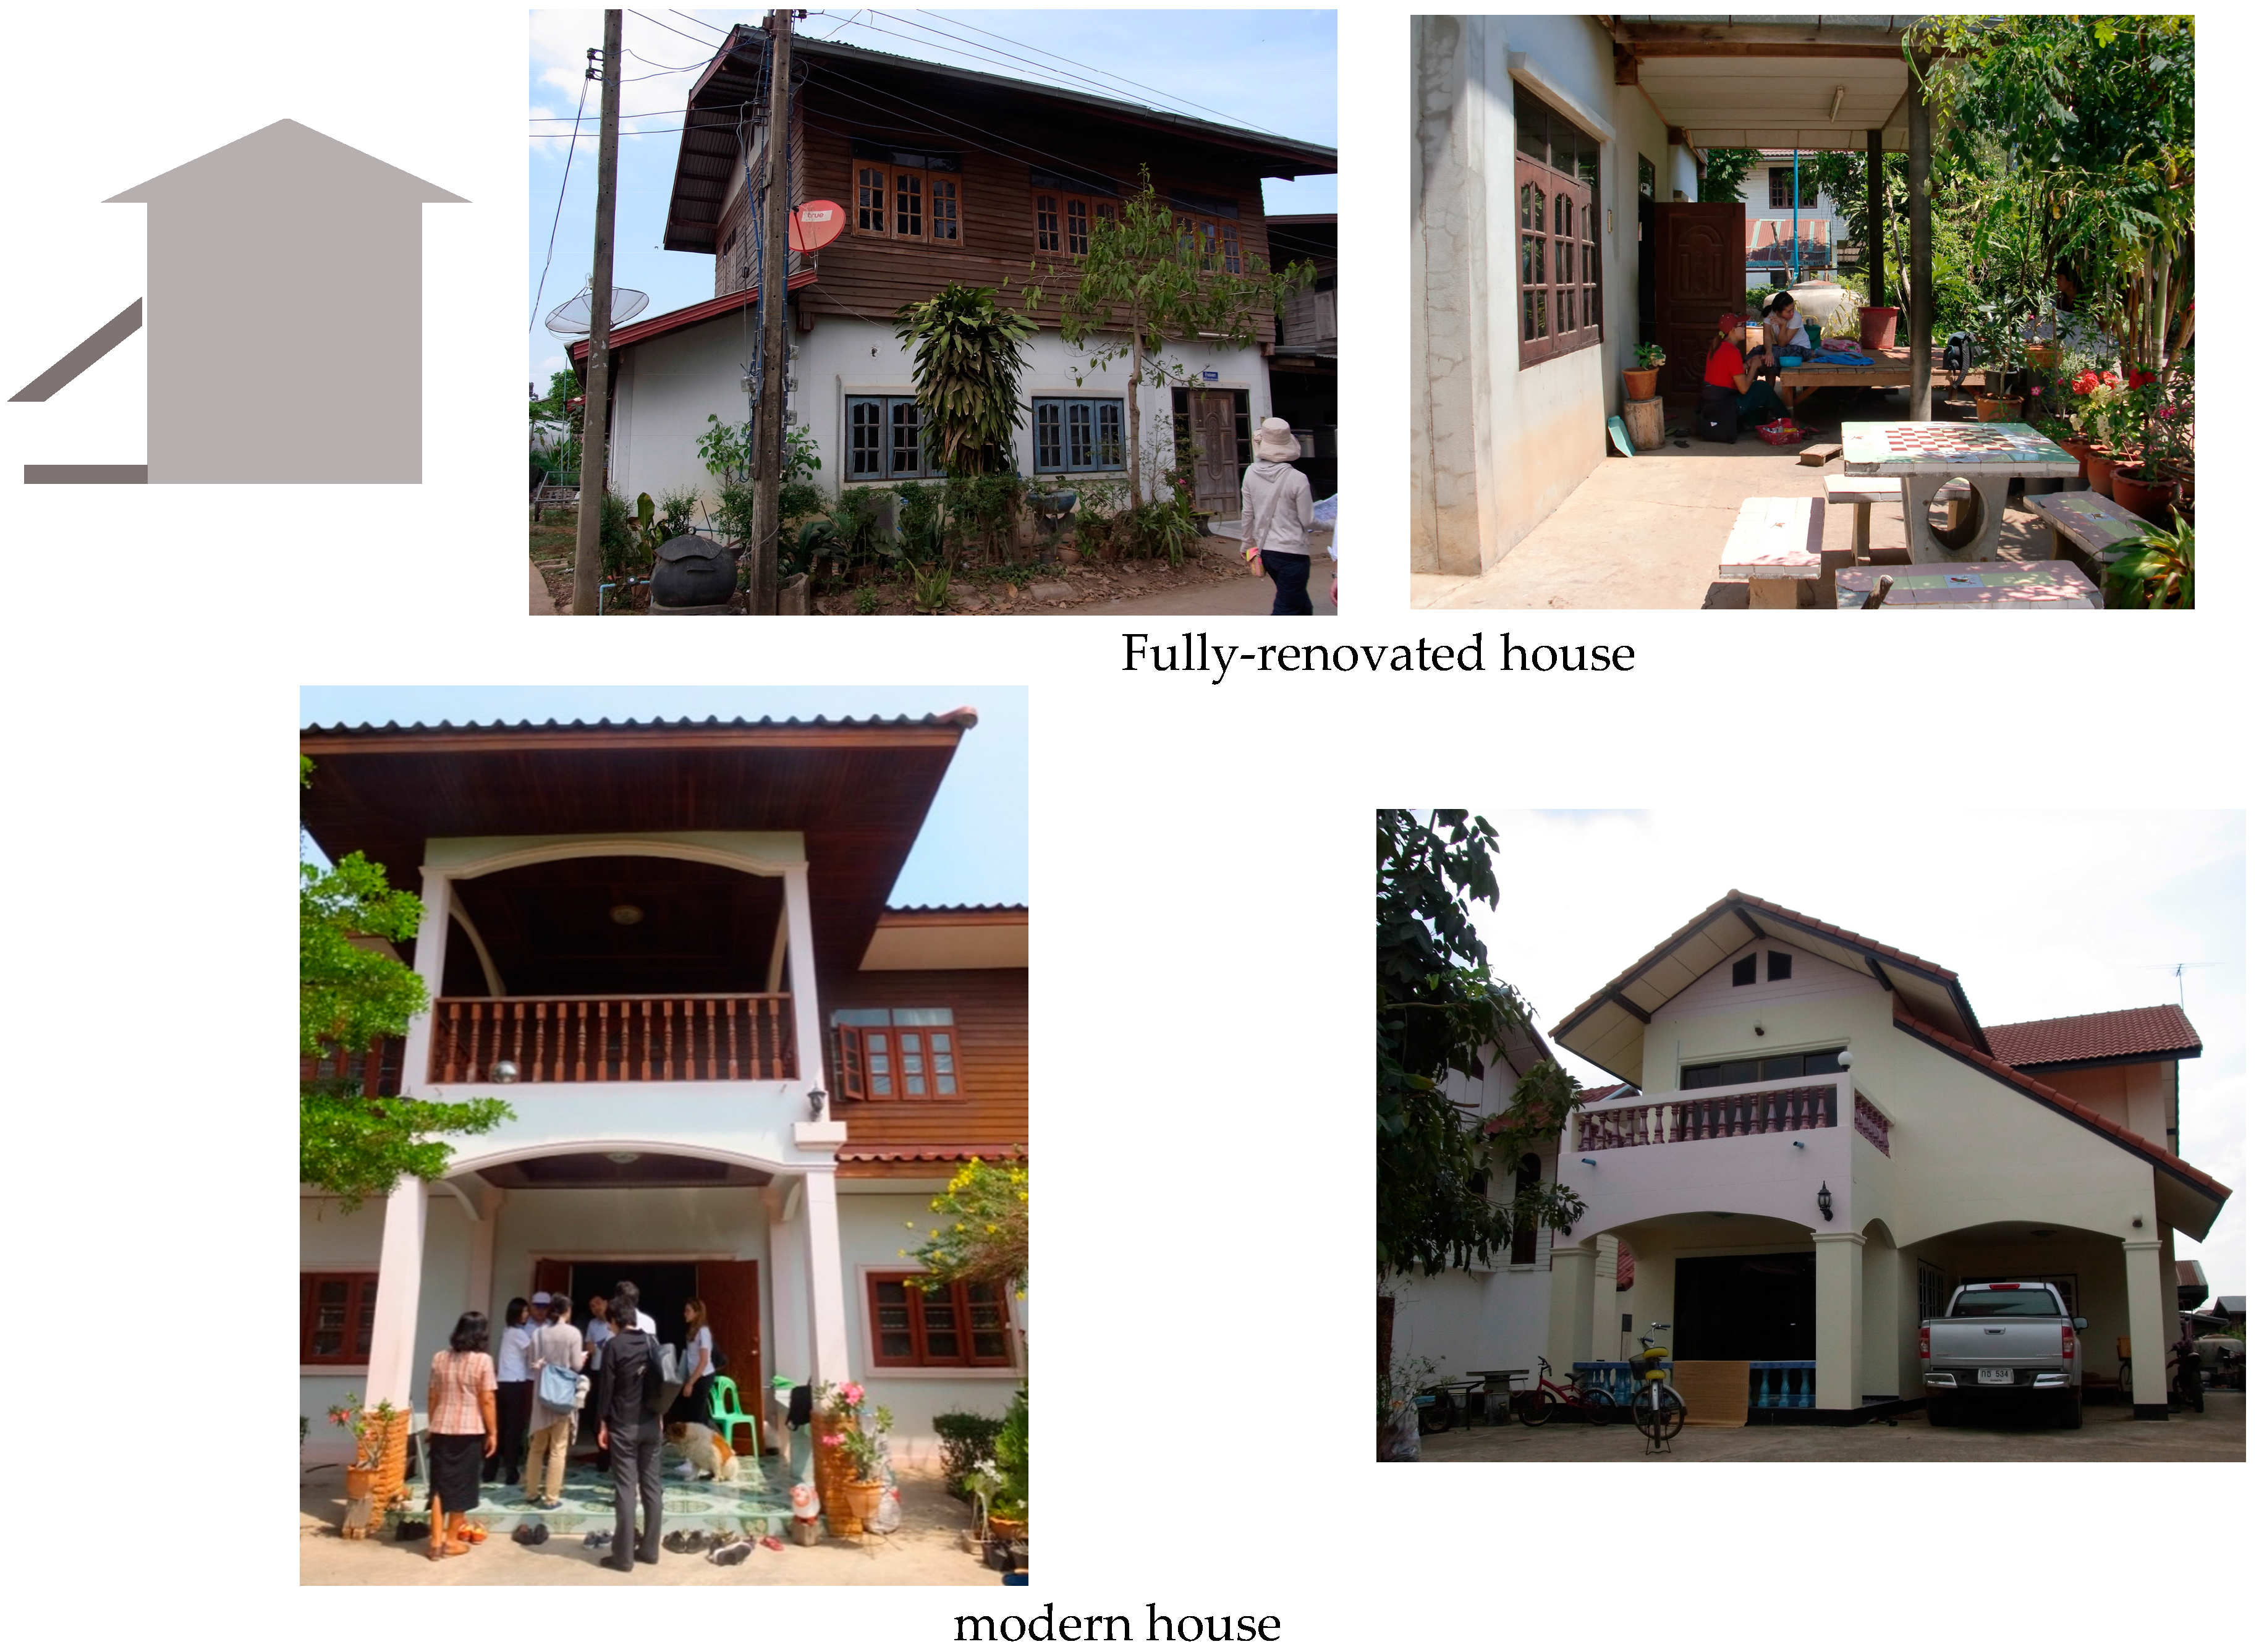
3.3. Fully-Renovated House and Modern House
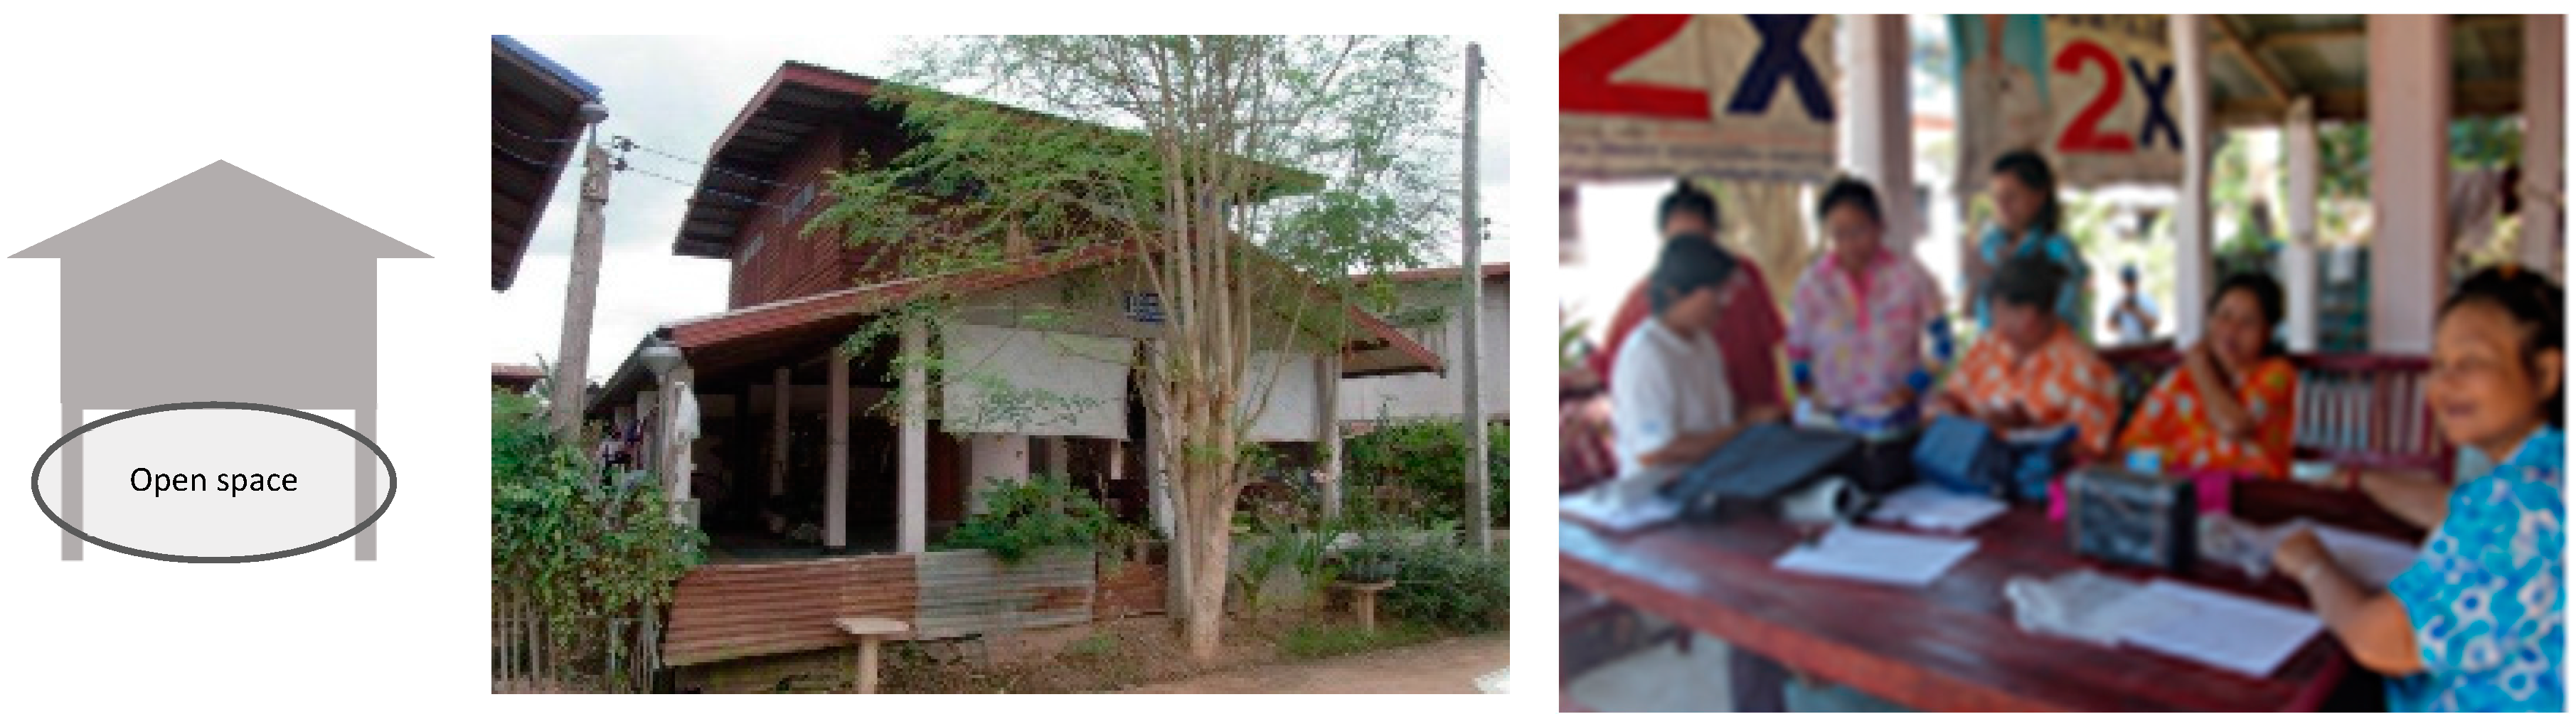
In a fully-renovated house (
Figure 4), the four sides are all covered by the walls on the first floor. The function of a living room is attached to the indoor space. The only space to stay outside is under the overhanging eave. The two house styles have in common the limitation of outdoor space. In many fully-renovated houses, there is shade on the first floor, but many modern-type houses have a successive wall from the first floor to the house and have no shade. Basically, there is no place to relax outside the house. In some fully-renovated and modern houses, an open space is created with an eave on the first floor.
4. Results
4.1. Basic Information of Sample
The number of samples in this survey was 100 consisting of 21 men and 79 women. The age group with the largest number of people was the 50’s (24 persons), followed by the 40’s (23 persons), 60’s (21 persons), 30’s (14 persons) and 70’s (9 persons). The most common households had four members (27 households), followed by three members (20 households) and six members (15 households). In occupation, 35 were farmers, followed by 18 housewives. The households that owned air conditioners were 25, and the houses of those households were either fully-renovated or modern-type houses. In total, there were 47 fully-renovated houses, 36 modern-type houses, 14 semi-renovated houses and three stilt houses.
4.2. Cost of Electricity and Its Influencing Factors
4.2.1. Cost of Electricity and Basic Information
Table 1 shows the average electricity cost per month.
Table 2 shows the results of the correlation analysis between several factors and electricity cost. In
Table 1 and
Table 2, the variables used for the correlation analysis were real numbers except for “house types” and “favorite place”. Regarding the house types, we reflected our hypothesis in the scoring system as follows. Score 1 was allocated to the stilt house, score 2 to the semi-renovated house, score 3 to the fully-renovated house and score 4 to the modern-type house. Regarding the favorite place in the house, according to our hypothesis, score 1 was allocated to rooms such as the living room and bedroom, and score 2 to outdoor places such as the space beneath the house and garden.
The number of household members, the amount of income and the total floor space of the house were correlated with the electricity cost. This is reasonable and natural. The amount of income showed the highest correlation coefficient, followed by the factors related to indoor energy use including TV-watching time and personal computer (PC) usage time. Also, the correlation coefficient of the number of household members with electricity cost was more or less equivalent to that of the favorite place with electricity cost. There was also a significant correlation between the house style and electricity cost.
There was a significant correlation between the house style and electricity cost except for in the rainy season. The electricity cost of the modern-type houses is high. The reason for this may be that there are many home electronics in the modern-type houses and that air conditioners and ceiling fans are used for a long time. Because the stilt houses and semi-renovated houses maintain good ventilation, inhabitants frequently use open spaces, such as space under the overhanging eave and the open area beneath the house. This is believed to be the reason for the lesser use of electricity.
There was also a significant correlation between all of the selected favorite places and electricity cost. The reason for this is assumed that people who like to stay in the outdoor or semi-outdoor spaces use air conditioners less, so the cost of electricity is low.
4.2.2. Favorite Place and Electricity Cost
We made a comparison of the mean value of the electricity cost and the average usage time of air conditioners by the favorite places in
Table 3. Fifty-one percent of people responded that they want to spend time in the open area beneath the house, and their electricity cost was the lowest. Thirteen percent of respondents preferred staying at the garden. The electricity cost of those who selected the garden as a favorite place was lower than that of people who responded that the living room or bedroom is their favorite. The electricity cost of the people preferred the bedroom was the highest. The cost was about twice as much as that of people whose favorite place was the open area beneath the house. The average usage time of air conditioners of people who chose the bedroom and the living room as their favorite was longer than that of those who chose an outdoor space as their favorite.
The average air conditioner usage time of the households who preferred to stay in the garden was the shortest, followed by the open space beneath the house, then the living room and bedroom. The electricity costs had a tendency similar to the usage time. However, the electricity cost of the households who preferred the garden was higher than that of households preferring the open space beneath the house.
Table 4 shows the relation between the house style and the choice of favorite place in the house. The result showed that all the people living in the stilt houses want to spend time in the open space beneath the house. People living in the semi-renovated houses prefer two spaces, the space under the overhanging eave and the garden, and the former is much higher. Among people living in fully-renovated houses and modern-type houses, although lower in proportion than those living in the stilt houses and semi-renovated houses, there is still a preference for staying at the area under the overhanging eave. In some of the fully-renovated houses and modern-type houses, eaves are extended to add semi-outdoor spaces. It is a trend for those living in the semi-renovated houses that people prefer to stay in the spaces beneath the house, but also there are a certain number of people living in the modern-type and fully-renovated houses who prefer staying in the open spaces. Such a tendency suggests a reduction of air conditioner usage time and electricity costs. People who prefer staying in their bedrooms are observed only in the fully-renovated and modern houses.
Table 5 shows the reasons for choosing the favorite place. The respondents were allowed to select more than one answer from the multiple choices. The reasons why people want to spend time in the open area beneath the house and in the garden derive mainly from comfort and coolness. When people stay outdoors, the usage time of air conditioners and electric fans becomes shorter. The open spaces such as space under the eaves and in the garden are people’s favorite places. Spending time in such spaces contributes to saving energy.
4.2.3. Lifestyle and Electricity Cost
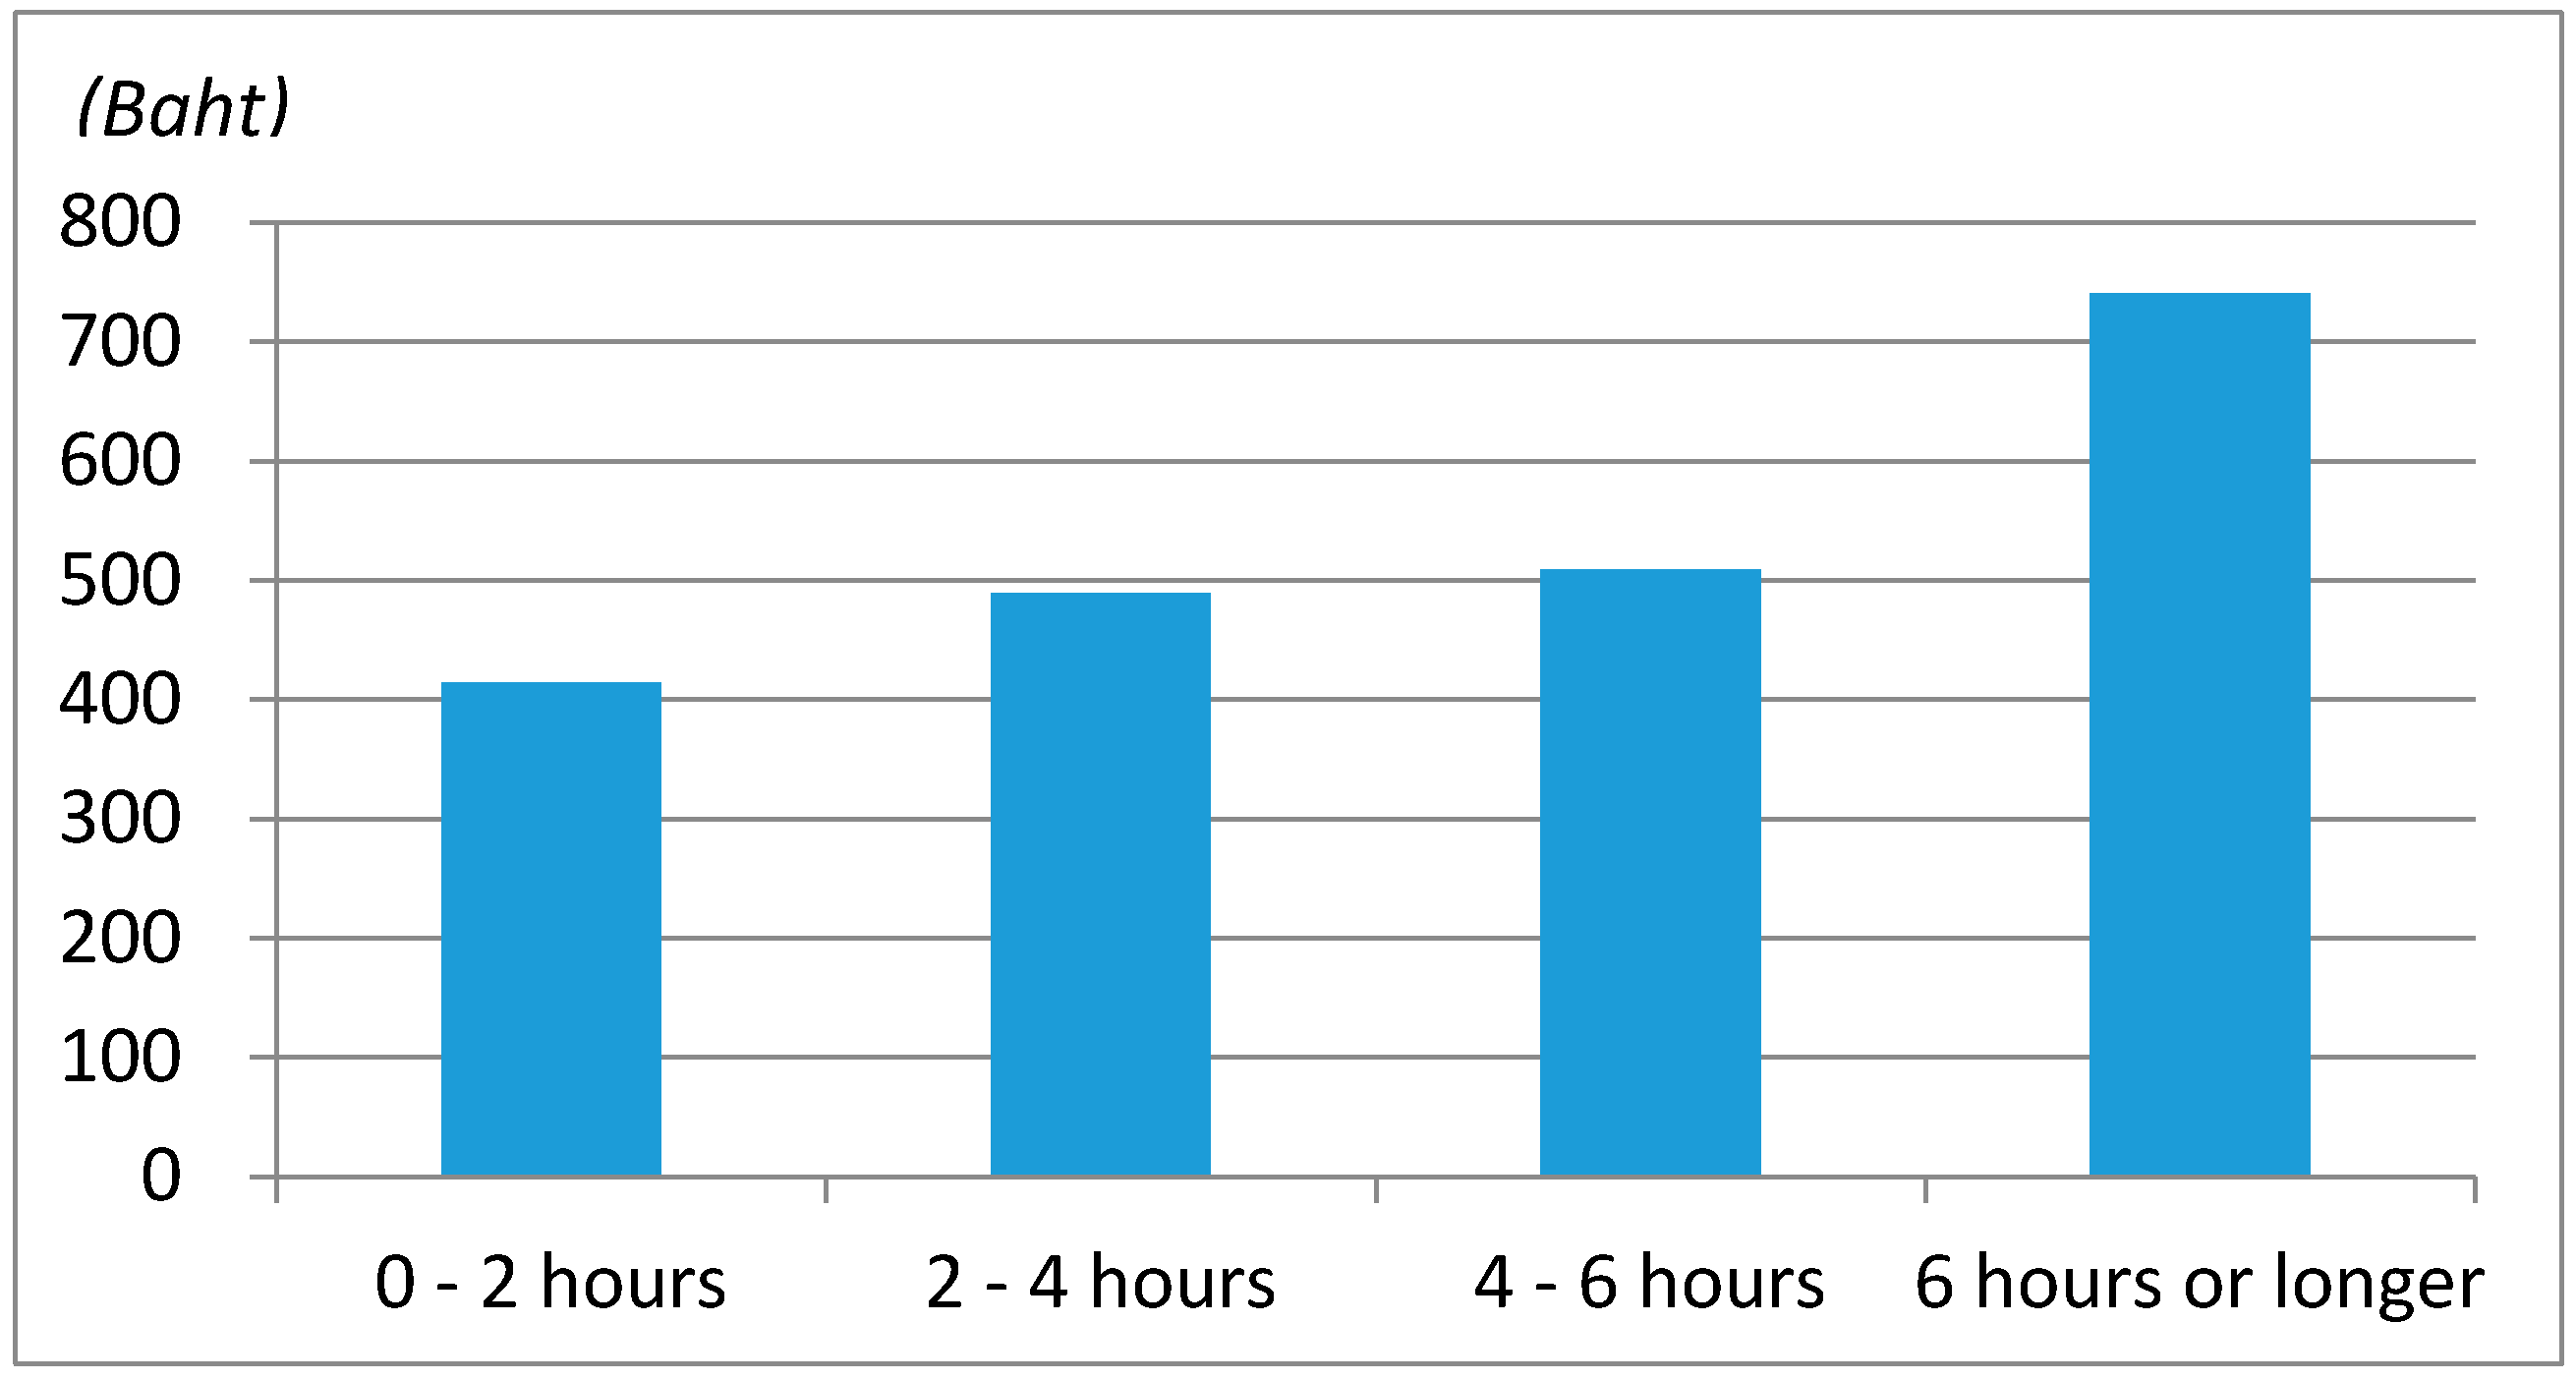
Figure 5 shows that the longer the usage time of the TV and PC, the higher the electricity costs.
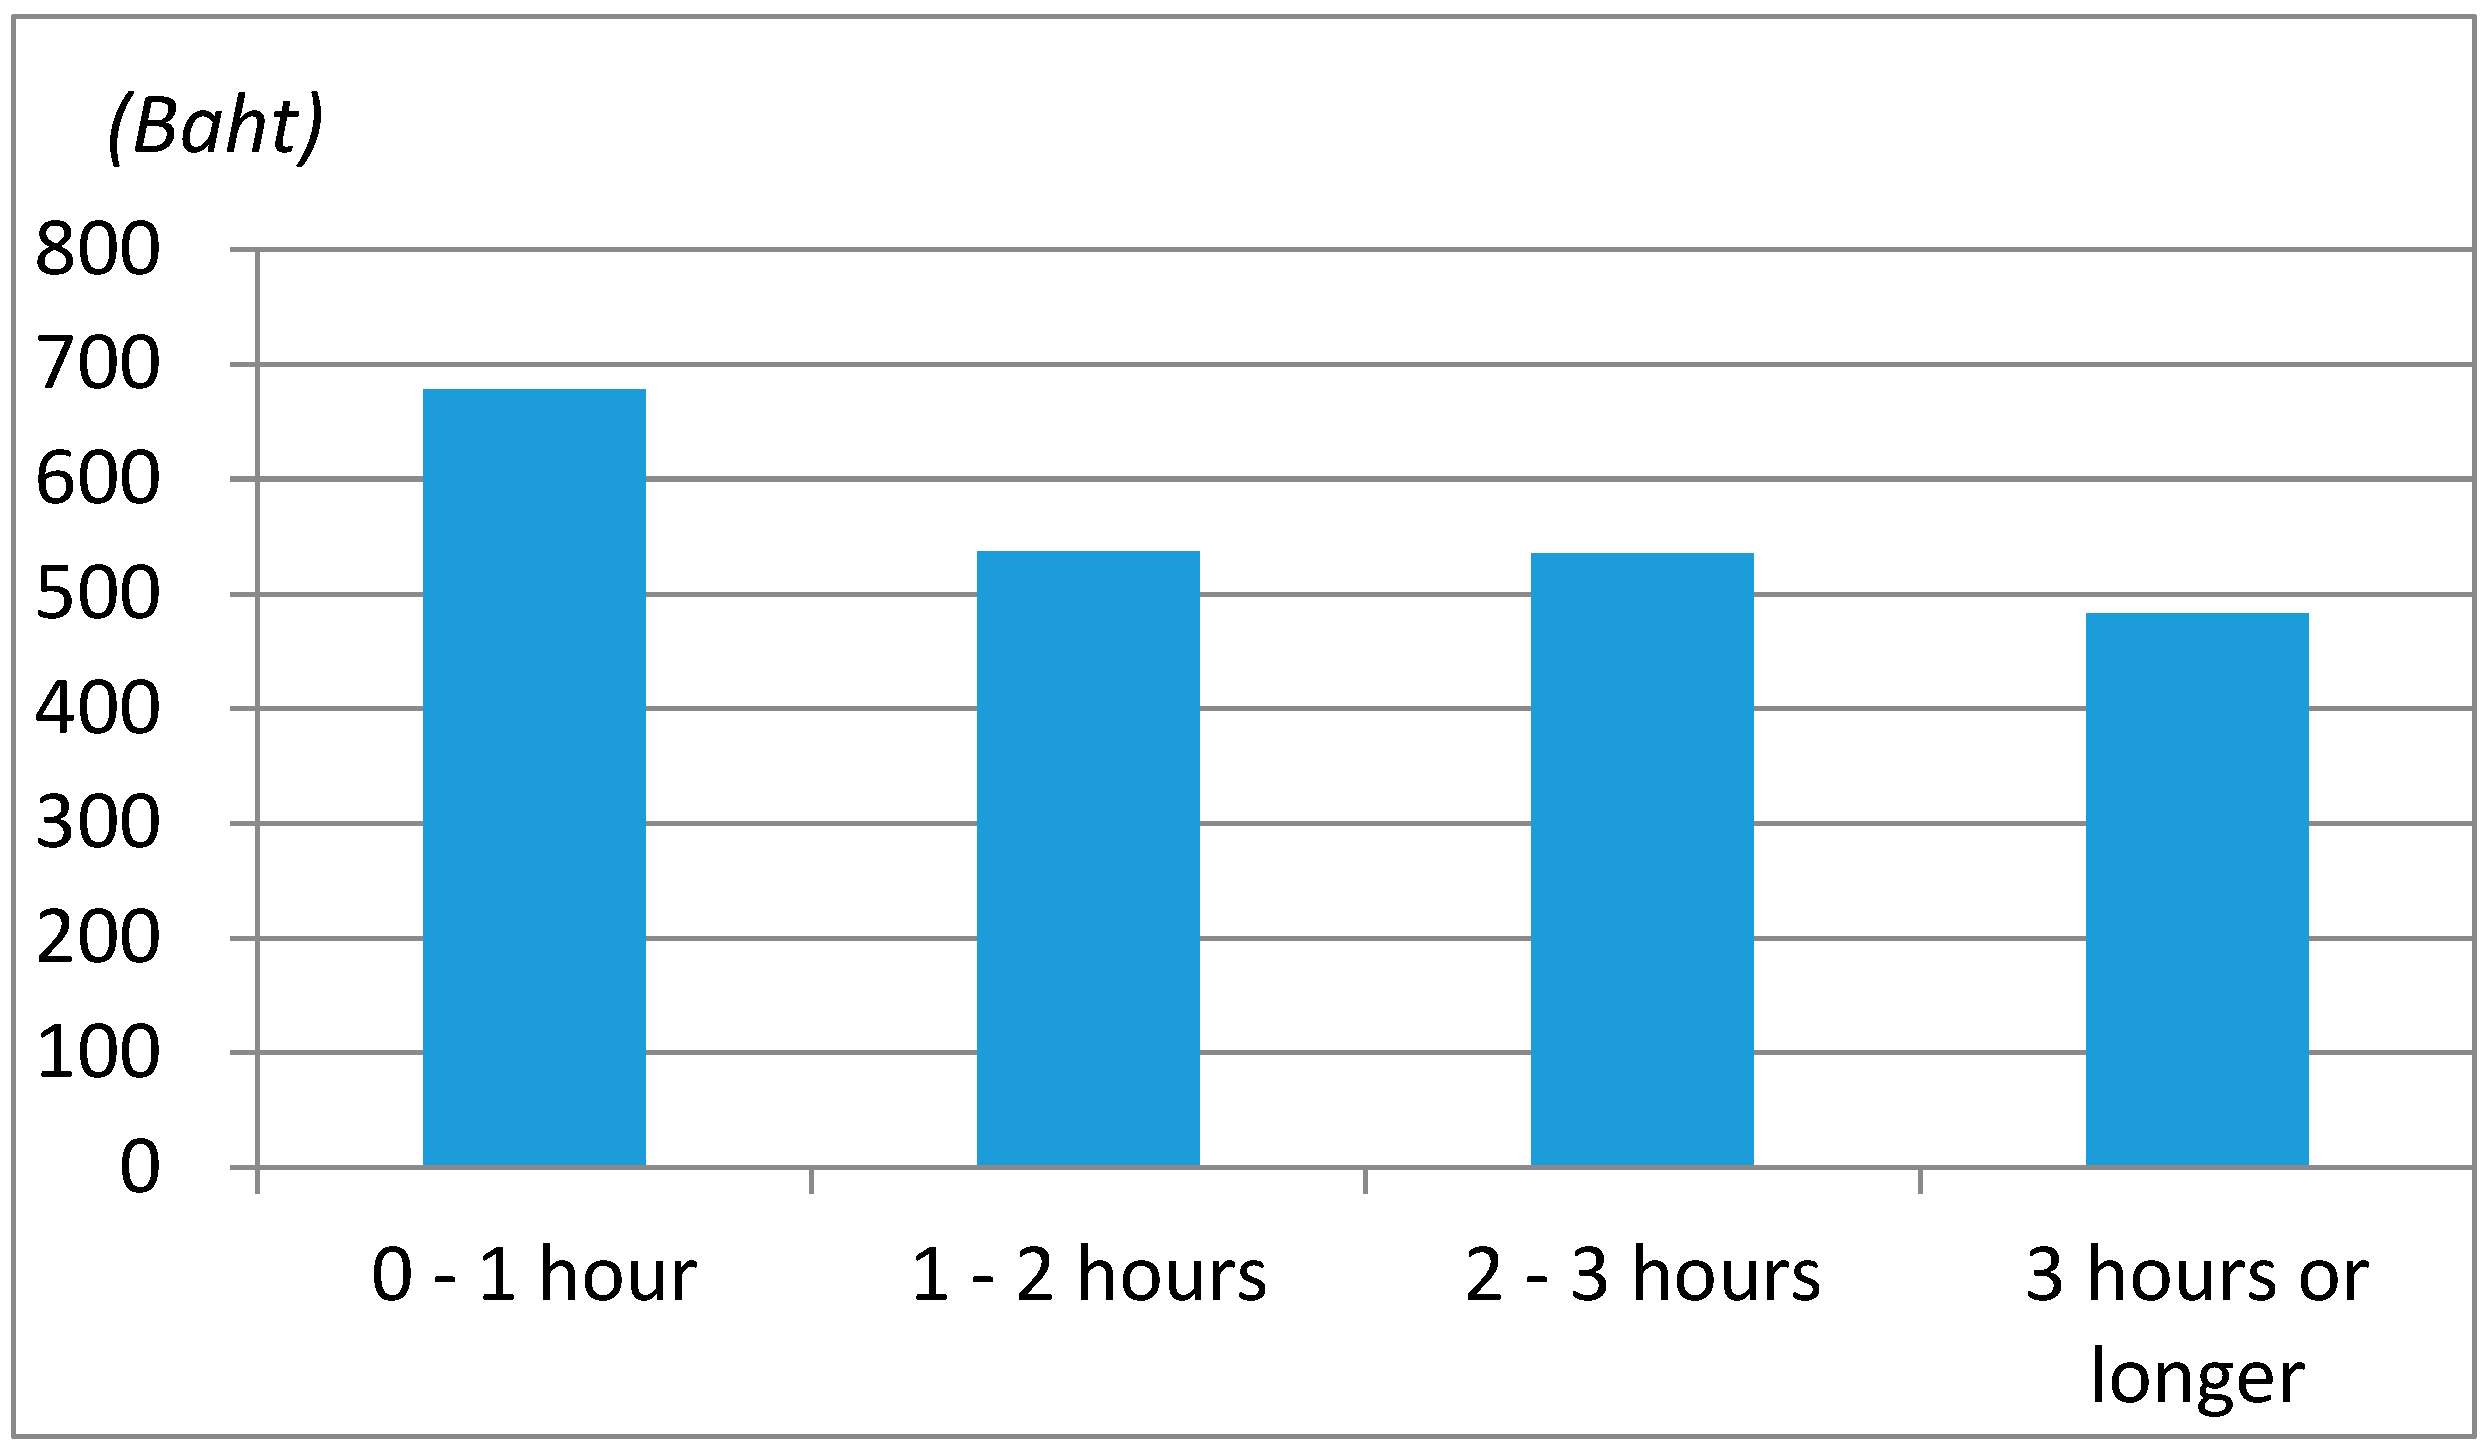
Figure 6 shows that the longer the communication with neighbors, the lower the electricity costs.
Table 6 shows that 66% of the people (the largest proportion) choose the space under the eave as a communicating place with their neighbors, followed by the garden (27%). In the houses with open spaces such as space under the eave or the garden, the time spent indoors is supposedly shorter in order to communicate with neighbors. Also, while people are communicating with neighbors, they use the TV and PC less. As a result, communicating with neighbors effectuates the saving of electricity costs and energy.
What we discussed above is also supported by the results regarding house styles to a certain extent.
Table 7 shows that both the TV-watching time and PC usage time were the shortest in the stilt houses, followed by semi-renovated houses and fully-renovated houses. In the modern-type houses, both times were the longest. While the time spent communicating with the neighbors was the longest for people living in semi-renovated houses, it was the shortest for people living in fully-renovated houses. In some modern-type houses, open spaces are created by extending the eave on the first floor or having a large garden. This is assumed to be a cause of the longer communicating time with neighbors of people living in the modern-type houses than that of people living in stilt houses or fully-renovated houses. In the modern-type houses, the usage time of air conditioners was also long.
4.3. Evaluation of House
Table 8 shows the evaluation of the indoor and outdoor environments for each house style. We requested inhabitants to evaluate the environments by giving a score of 1, 2 and 3 for “bad”, “normal” and “good”, respectively, for each item concerning the environment. For the evaluation result, items exceeding a score of 2.5 were marked with ●, and items not reaching 2 were marked with x. The indoor environment of the stilt house got a good grade for coolness, electricity saving and communication with neighbors, while the house got a bad grade for comfort, robustness, cleanliness, bug proofness, etc. The indoor environment of the fully renovated house got a good grade for crime prevention and communication with family members. In addition, its outdoor environment got a good grade for coolness and electricity saving.
4.4. Expectations for Future Houses
Table 9 shows the survey results on what type of house people want to live in sometime in the future. This was answered separately from the question on the reasons for selecting favorite places in the house as shown in
Table 5. It is assumed that the preference for a particular place in the house and the selection of house types differ, and it is important to identify what factors affect the choice of place in the house and the house types, individually. People who want to live in modern-type houses accounted for 90%, and these houses were the most popular. The stilt houses were the least popular. For every house style, the proportion of people who chose comfort, coolness, and spaciousness as the reason for the choice was high. These are considered basic housing needs. Among the people who want to live in the modern-type houses, the proportion of people who chose cleanliness and crime prevention as the reason for the choice was higher than in other house styles. Among the people who want to live in modern-type houses, the proportion of people who chose the ease of communicating with their neighbors as the reason for living in that type of house was only 1%, which was very low.
4.5. Happiness
Table 10 shows the results of the correlation analysis between the happiness level and lifestyle. The higher the figure becomes, the stronger the relationship between happiness and the other variables (lifestyle in this case). The modernization of their houses increased the feeling of happiness of the inhabitants. The longer the inhabitants communicated with their neighbors, the stronger a sense of happiness they felt. There was also a correlation between the happiness level and the people’s favorite places. The inhabitants who stayed outdoors felt a stronger sense of happiness. We requested that the inhabitants rate their levels of satisfaction with various lifestyle factors on a scale of 1 to 5.
Table 11 shows the results of the correlation analysis between the happiness level and satisfaction. There is a significant correlation between the happiness level and various lifestyle factors including economic situation, the convenience of life, and the natural environment. The lifestyle factors which had the highest correlation coefficient (0.522) were communication with the community, followed by trust in others (0.51), and the housing environment (0.402).
These results showed that the improvement of the housing environment is deeply involved in happiness for rural Thai people. Moreover, it has become clear that the relation of trust in others and communication with the community are more important for the feeling of happiness than the improvement of the housing environment. These results suggest that staying outdoor plays an important role in communication with others.
5. Conclusions
Based on the results mentioned above, we identified the following:
The favorite place, whether outdoor or indoor, has a great influence on electricity costs. The electricity cost of the people who chose the outdoor spaces, such as the space beneath the house and the garden, as their favorite place is low. The electricity cost of people who chose the bedroom or the living room as their favorite place is high.
The longer the time of TV and PC use becomes, the higher the cost of electricity; the longer the communication with neighbors becomes, the lower the cost of electricity.
Thai traditional houses have outdoor spaces in and among houses. There is a custom of spending time outside a house. As the renovation of houses is progressing, the shape of outdoor spaces has been changed, and the comfort of indoor spaces has been improved. While people spend most of the daytime outdoors in a stilt house and a semi-renovated house, the length of time spent outdoors has been shortened in fully-renovated and modern houses. 50 to 30% of people still prefer staying outside, including their garden and under an eave.
The survey results on the relation between the happiness level and housing selection showed that people who like to communicate with neighbors and people who prefer staying outdoors felt a strong sense of happiness. While there was a significant correlation between the happiness level and the improvement of the housing environment, the correlation of the happiness level with the relation of trust in others and communication with the community showed higher significance.
Reasonable consideration is not being given to securing an outdoor space, which is used as a living space in traditional houses, in the growing number of modern-type houses in Thailand. We need to pay attention not only to the indoor environment but also to the comfort of the outdoor environment. We also need to extract excellent elements from the climate-adapted lifestyle observed in the traditional lifestyle and make use of them in today’s housing designs. In addition, we need to use such elements to make people's lives comfortable and to reduce carbon emissions.
This study was based on a social survey conducted in Khon Kaen, Thailand, and there is a limitation in securing the generality of the results. Therefore, it is expected that similar studies be further developed in other areas in the future.


