Effects of Different Land-Use Systems on Soil Aggregates: A Case Study of the Loess Plateau (Northern China)
by
Shahmir Ali Kalhoro
1,2, 
Xuexuan Xu
1,*,
Wenyuan Chen
1,
Rui Hua
1,
Sajjad Raza
3 and
Kang Ding
1 1
Institute of Soil and Water Conservation, Northwest A&F University, Yangling 712100, Shaanxi, China
2
Faculty of Agriculture, Lasbela University of Agriculture, Water and Marine Sciences, Uthal 90150, Pakistan
3
Institute of Soil and Environmental Sciences, University of Agriculture, Faisalabad 38040, Pakistan
*
Author to whom correspondence should be addressed.
Sustainability 2017, 9(8), 1349; https://doi.org/10.3390/su9081349
Submission received: 6 May 2017
/
Revised: 19 July 2017
/
Accepted: 26 July 2017
/
Published: 1 August 2017
(This article belongs to the Special Issue Soil Science in Conservation Agricultural Systems)
Abstract
:Soil aggregate stability is an important indicator for controlling soil losses and can improve soil quality, particularly in an area such as the Loess Plateau. The objective of this study was to estimate the differences in soil aggregates across six different land-use systems (grassland, apple orchard, abandoned apple orchard, cropland maize, cropland wheat, and shrub-grassland). For this purpose, dry and wet sieving techniques were employed to assess aggregate content and aggregate stability. Higher percentages of water stable aggregates were observed in the abandoned apple orchard and shrub-grassland at 63% and 61%, respectively. The maximum dry aggregate stability (%) was recorded at 78% and 77% in both wheat cropland and common apple orchard, and the abandoned apple orchard was only 74%. Both mean weight diameters and geometric mean diameters of aggregate were recorded as higher in grassland, shrub-grassland, and the abandoned apple orchard, than the other land uses. The formation of soil aggregates and their stability were positively correlated with soil organic carbon content and root biomass of different plant communities. Higher amounts of soil organic carbon content were noted in the abandoned apple orchard, common apple orchard, and natural grassland at the 0–20 cm soil layer. The results of the correlation coefficient showed a positive significant correlation between the mean weight diameter, geometric diameter, root biomass, and soil organic carbon content. Conclusively, the type of land use affected the soil aggregation and distribution of size fractions; the small fractions of the aggregates formed large fractions by combining with fresh organic matter, and increased soil organic carbon concentrations were closely linked with the formation of macro-aggregates. Thus, converting slope farmland to forestland and grassland could improve water-stable aggregate and reduce soil disturbances in areas (like the Loess Plateau) with the highest erosion risk.
1. Introduction
The Loess Plateau of Northern China is well known for its deep loess deposits, distinctive landscape, and intense soil erosion. Most agricultural practices usually occur on the top surface and the adjacent steep slopes while little agriculture is conducted in the areas with terraces. Most farmers in this region struggle for their livelihood because of hard climatic uncertainties, few make profits from farming. Cropland is the main land use type—with crops of wheat, maize, foxtail, and pearl millet—while the other types of land under farming practices are orchards (apple and pear), grasslands, and forestland [1].
Tillage practice in the Loess Plateau by reducing the soil aggregation process aggravates soil loss through erosion. The government of China has noticed the severity of soil erosion and has introduced various research projects (e.g., the EROCHINA project) and conservation measures in the area [2]. The Chinese government has also urged farmers to convert their farmlands into grassland or forest in order to minimize the tillage and, consequently, protect the soil from being lost [1]. In the existing literature, various studies have been conducted on soil erosion. Soil organic matter (SOM) and soil aggregate stability are two substantial properties that are closely associated with each other and commonly considered as key indicators of soil quality (productivity), decreasing soil erosion as they improve. In fact, aggregate stability is a complex parameter and a significant factor affecting soil structure, soil organic carbon, infiltration, aeration, water retention, soil compaction, and hydraulic conductivity. Therefore, it is important to maintain soil aggregate stability to protect soil efficiency, productivity, and to minimize soil losses [1,3,4].
Additionally, the existence of soil organic matter (SOM) affects aggregate stability and soil structure [3,5]. Plenty of influential work reported by various researchers has suggested that SOM can improve the formation of soil aggregates and increase the mechanical stability of aggregates by binding soil mineral particles, which determines the coherence of inter-particle bonds [1,2,6,7]. Similarly, the presence of soil organic carbon (SOC) in different soil layers or in aggregate sizes is imperative for soil quality assessments, which can be easily lost in the erosion process (since large aggregates are more stable). However, in existing studies, limited information is available on the effects of carbon content in different soil layers of different land-use systems. Previous studies [8,9,10] suggested that macro-aggregates in the soil are stabilized mainly due to carbohydrate-rich roots. The government of China introduced a special project, “Grain for Green” in 1999 with the aim of the “enhancement of soil superiority and a decrease of soil erosion” in the Loess Plateau [1,11].
In addition; there are four different methods, which are generally used for the determination of soil aggregate stability, three of which were proposed by [12] and the other was modified from two different methods that were introduced by [13,14]. Among these methods, dry and wet sieving is considered a reliable approach for the measurement of soil aggregates [15,16,17].
This study had three objectives: first, to determine the distribution of soil aggregates in different land-use systems; second, to evaluate the effects of water stable aggregates (WSA) and dry stable aggregates (DSA) on soil organic carbon (SOC) in relation to the plant roots of different plant types and in different land-use systems; and, third, to determine the impact of different land uses on soil physical properties. This study mainly focuses on the effects of different land-use systems on the Loess Plateau of China. Numerous studies have been done on different aspects of the soil of the Loess Plateau, such as the impacts of land use change and climate variability [11], soil aggregate and crop yield changes with different rates of straw [18], the impact of land-use changes on soil hydraulic properties [1], soil organic carbon and nitrogen fractions, and the effects of re-vegetation on soil organic carbon storage [19], but limited work has been collectively done on the different land-use systems in the Loess Plateau. Therefore, we hope that our study will be of great significance in the decision-making process and future research on the Loess Plateau, China.
2. Materials and Methods
2.1. Soil Sampling and Analysis
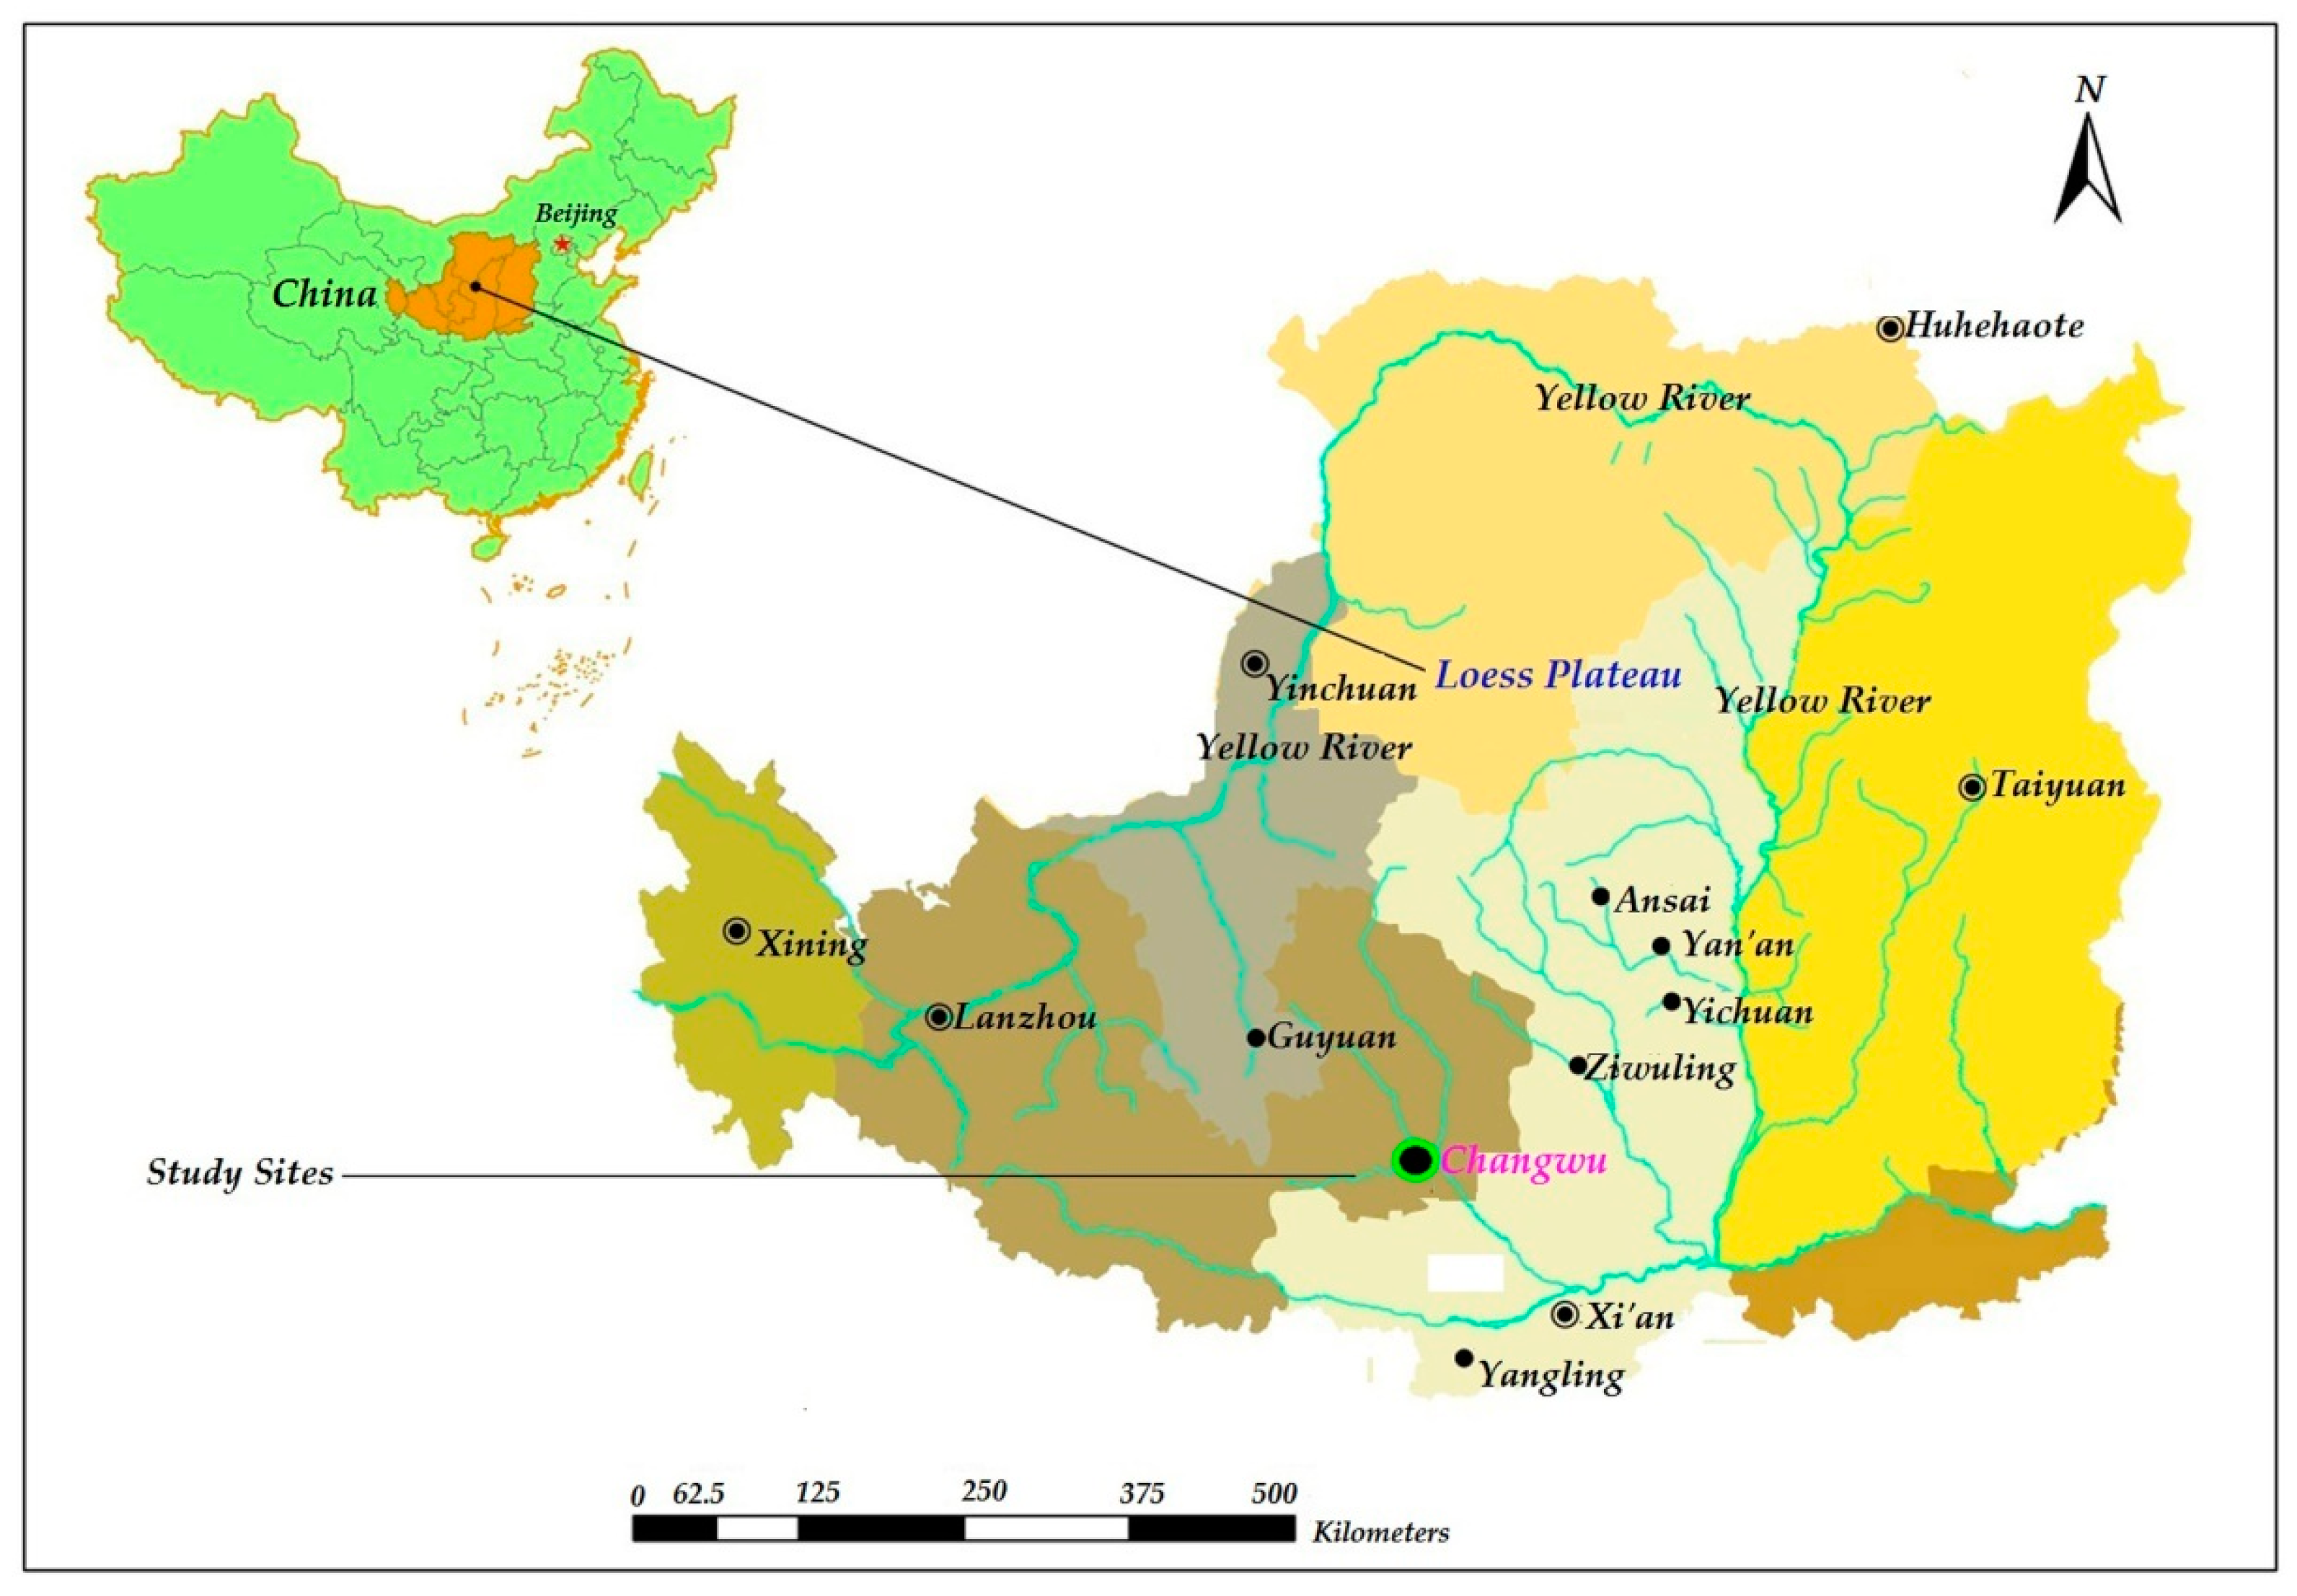
The field experiment was conducted in Changwu County (107°40′30″–107°42′30″ E, 35°12′16″–35°16′00″ N) of Xianyang city (Figure 1). The county spreads over an area of 525 km2 at heights of 946 to 1226 m above sea level, 582 mm is the average annual rainfall, and 9.2 °C is the average temperature. The area is very vulnerable to soil erosion with approximately 10,000 to 25,000 t km−2 y−1 in soil losses [1].
2.2. Soil Sampling and Analysis
To fulfil the objectives of this study, six study sites, i.e., GL (grassland), CAO (common apple orchard), AAO (abandoned apple orchard), Clm (cropland maize), Clw (cropland wheat), and SGL (shrub-grassland), were chosen from the Loess Plateau (Table 1). Apart from maize fields (grown thrice in two years) and wheat fields which are regularly tilled before sowing, all other types of land (grassland, abandoned apple orchard, and shrub-grassland) in the Loess Plateau do not undergo any tillage operation throughout the year. A total of 54 soil samples were collected from three depths (0–20, 20–40, and 40–60 cm). Samples were randomly collected in triplicate from different locations of every site and depth. Stainless steel shovels were used for soil sampling, and the samples were analyzed for soil particle distribution (sand, silt, and clay), electrical conductivity (EC), and soil organic carbon. The EC of the soil was determined by using a digital EC meter, and the extract was prepared in a 1:5 ratio of soil sample to distilled water, with 30 min of shaking. The distribution of soil particles, sand, silt, clay (Beckman Coulter, North Rhine-Westphalia, Germany; LS™ 200 laser particle analyzer; the instrument is laser-based technology that permits analysis of particles without the risk of missing either the largest or the smallest particles in a sample), and the soil organic carbon were assessed by standardized procedures [20,21,22,23], whereas the bulk density (BD) was determined from undisturbed soil samples collected in triplicate from each site and each depth using the standardized procedure [20].
2.3. Sampling Procedure for Determination of Aggregate Size Fractions
To estimate Dry Stable Aggregate (DSA) and Water Stable Aggregate (WSA), individual soil samples were collected randomly in different locations from the same plot, in triplicate. Undistributed soil core samples were collected in a stainless steel box (length × width × height = 20 × 12.5 × 6 cm) at the 0–20, 20–40, and 40–60 cm soil layers. Samples were sealed in polyethylene bags and transported to the laboratory to determine the dry and wet stability of the soil aggregates. Soil samples were air-dried at room temperature for 48 h. Plant roots and stones were removed from the samples, and the samples were placed on the rotary device for sieving (oscillatory sieving analyzer, JH-200, Beijing, China) for the analysis of DSA. The rotary device contained different sizes of sieves that were 5, 5–2, 2–1, 1–0.5, and 0.5–0.25 mm. Each sample was separately put on the top of the sieve (5 mm), and the fixed sieve analyzer shook at 270 rpm for 2 min. The distributed soil aggregates were collected separately in each sieve and weighed on an electrical balance to calculate the distribution of the 5, 5–2, 2–1, 1–0.5, and 0.5–0.25 mm soil aggregates [15,16,17], whereas for WSA 50 g of soil samples were placed in sieves and dipped into water, and the sieves were moved up and down for 2 min at 30 cycles/min. The remaining soil sample in each sieve was recorded to calculate the water aggregate stability [15,16,17,24,25], dry aggregate stability [25], mean weight diameter, and geometric mean diameter [25,26] by using the following formulas [17,24,25,26].
where the mass of dry aggregate means the remaining mass of soil (before wetting) after each sieve and mass of dry soil sample means the total mass of soil sample, whereas for WSA, the mass of dry aggregate means the remaining mass on dry soil (after wetting) after each sieve
where, MWD represents mean weight diameter and GMD represents geometric mean weight diameter, Sum of products of , the mean diameter , of each size fraction and is the proportional of the total sample mass, occurring in the corresponding size fraction, and the summation was carried out over all n size fractions, including the one that passes through the finest sieve.
2.4. Determination of Root Biomass in Different Land-Use Systems
To assess the available amount of root biomass in the different soil layers and in the different land-use systems, stainless steel rings (5 cm in diameter) were used for soil sampling and soil samples were individually collected randomly from different locations within the same plot in triplicate at 0–20, 20–40, and 40–60 cm soil depths, and then, the samples were kept in sealed polyethylene bags and transported to the laboratory for further analysis. In addition, roots were manually separated from the soil particles, and root biomass was calculated with mass density (roots) divided by the inner volume of the soil core [1].
2.5. Statistical Analysis
To explore the influence of different land-use systems on the distribution of soil aggregate, MWD, GMD, and SOC, the mean values and standard errors, analysis of variance (two-way ANOVA), and Pearson correlation coefficient were applied and significant differences among data were determined at p ≤ 0.05 and p ≤ 0.01 The statistical analysis was conducted using SPSS 13.0 (SPSS Inc., Chicago, IL, USA).
3. Results and Discussion
3.1. Physicochemical Properties of the Soil in the Different Land-Use Systems
The results of the basic soil properties are presented in Table 2. Generally, soils were a silty loam in texture (Table 2). Subsequently, the bulk density (BD) at 0–20 cm in all land-uses was different from each other and the difference was not statistically significant (Table 2). There is a tendency of increase in BD in all land-uses with the largest increase with CAO, followed by AAO, SGL, Clw, GL and Clm. The tendency of the increase in BD, Clm, and Clw is an indication of the effects of tillage and the higher application of inorganic fertilizer than Clw and other land-uses (Table 3). The results are in line with the findings of [27,28,29,30,31], which revealed that the BD of the soil surface layers could be reduced with no tillage compared to conventional tillage; and this study showed that the BD in the soil surface layers of AAO, GL, CAO, and SGL were slightly lower compared to Clm and Clw.
The results of electrical conductivity (EC dS m−1) are presented in Table 2, which generally showed minute differences (not statistically significant) in EC (dS m−1) among different land-uses in all three sampling layers. A tendency of the increase was recorded in CAO in all three sampling layers at 0–20 (0.258 ± 0.020), 20–40 (0.212 ± 0.106), and 40–60 cm (0.445 ± 0.146) compared to the other land-use systems (Table 2). The higher concentration of EC may be due to the influence of inorganic fertilizers (NPK), which are applied in higher amounts in orchards as compared to croplands by local farmers to achieve maximum yields (Table 3). The results are supported by numerous researchers [11,18,32,33] that have demonstrated that cultivated land has a higher EC compared to grassland and abandoned land, possibly due to the presence of soil fauna and flora and the high amount of SOM. The data recorded at sampling time showed that farmers applied high doses of NPK fertilizers in the field (Table 3), which might be the result in higher concentrations of EC in CAO compared to the other sites. The minimum EC was obtained in SGL at 0–20 cm, and this may be because the study site was situated on a 5° slope with continuous runoff water from rainfall. In addition, the different land-use systems resulted in different land-use behaviors according to the EC, BD, and soil particle size distribution (Table 2). Statistically, results are not significantly different (p < 0.05). The results revealed that cropland had been affected by tillage operations and the study suggested that there would be an improvement in soil quality if land-uses are changed.
3.2. The DSA and WSA Distribution of Soil Aggregate Compositions (%)
Soil aggregates are a reflection of soil structure and texture. The combined group of soil particles is stronger rather than a single one. Aggregate stability is prominently a multi-parameter effect on the soil properties, and Table 4 and Table 5 present the particle size distribution from the analysis of DSA and WSA results. The dominance of aggregate size of fractions >5 mm were observed in the 0–20 cm soil surface layer across all study sites (GL, CAO, AAO, Clm, Clw, and SGL).The percentage of DSA in the surface soil (0–20 cm) in the different land-use systems was 78%, 77%, 74%, 69%, 64%, and 62% for Clw, CAO, AAO, GL, Clm, and SGL respectively (Table 4) while the percentage of the WSA was 65%, 61%, 52%, 50%, 50%, and 46% for SGL, GL, AAO, CAO, Clw, and Clm respectively (Table 5). Furthermore, the observations of this study illustrate that croplands (Clm and Clw) have lower WSA percentages in the soil than the other types of land (Table 5) while Clw had a higher WSA percentage than Clm (Table 5). Higher DSA (Table 4) and higher concentration of EC in CAO may be the effects of more labor and fertilizer usage in the field compared to those in the other types of land-use. Higher WSA was observed in AAO and GL compared to the other types of land use because the lands had not been used for the last 20 years. Our results are in accordance with the available literature [32,34,35], which revealed that the WSA of cropland could be affected by the use of heavy farm machinery, animals, and human activity [1].
The results of the different aggregate size fractions in terms of DSA indicated that the 2–1 mm and 1–0.5 mm fractions were both affected in cropland (Table 4), with the DSA at 0–20 cm increasing in the order of Clm, Clw, CAO, GL, SGL, and AAO. As many authors revealed before, farm machinery could disturb the soil aggregate fractions and ultimately affect WSA [2,4,7,36], our findings also indicated that the 2–1 mm and 1–0.5 mm fractions were destroyed by ploughing; the study findings suggest that plant restoration and a change in crop cultivation patterns could improve WSA formation in cropland, particularly in the study areas. Soil aggregation can be increased with cropland conversion to no-tillage due to the rapid turnover of SOC in the soil layers [37]. Soil aggregate stability is also supported by constantly increasing SOC levels up to the 20 cm soil layer (Table 4 and Table 5). The mean results of the different size fractions of DSA and WSA in the different land-use systems (GL, CAO, AAO, Clm, Clw, and SGL) are not significantly different. Aggregation is the outcome from the rearrangement of the particle size distribution, flocculation, and cementation by SOC, biota, clay and carbonates, plant roots, and organisms and their exudates [4,37,38]. The results of our study indicate that the formation of WSA was improved in GL, AAO, and SGL compared to CLm and CLw. The variation of WSA in different land use systems might be the effect of the interruption of farmer practices. This is in line with the existing studies [4,37,38,39,40].
3.3. MWD and GMD in Different Land-Uses
The results of the mean weight diameter (MWD) and the geometric mean weight diameter (GMD) of DSA and WSA are presented in Table 4 and Table 5. Significant differences between the different soil layers with the different land-use systems were observed. The MWD and GMD were observed in a decreasing order of SGL, AAO, GL, CAO, Clm, and Clw with the maximum in SGL. The mean MWD and GMD of Clm and Clw were the lowest in the entire soil profile (0–60 cm). This may be due to the presence of the lowest amount of SOM, limited microbial activity, and the lowest root biomass, which may play a major role in the formation of soil aggregates and is important for MWD and GMD [41]; similar experiments were conducted, indicating that the MWD of the surface soil layer was higher in grassland compared to cropland. By using the same techniques, our findings are in line with previous studies [2,6,15,42,43]. The removal of plant residue from the soil surface layer and animal grazing are the main causes of the disturbance of soil aggregates [28,44]. The protection of the land from disturbance is not only essential for aggregates, but also important for the management of the soil ecosystem, which ultimately influences agricultural yield [18,45,46].
3.4. Differences in SOC between Different Land-Use Systems
SOC is the main source of energy that facilitates soil aggregate formation. Figure 2 displayed the results of SOC percentage in the different land use systems. The maximum SOC was observed in AAO (3.3%), followed by GL (3.2%), Clm (2.6%), Clw (2.5%), CAO (2.1%), and SGL (1.2%) at the soil surface layer (0–20 cm). The reason why SGL contained the lowest percentage of SOC among the different types of land use might be that SGL is normally situated near the edge of steep slopes, which experience frequent water erosion due to prevalent rainfall in the area. Meanwhile, SOC percentage decreased with soil depth. SOC played a significant role in the improvement of the physicochemical properties of the soil and the formation of soil aggregates [47,48]. Our results are in line with similar findings of other researchers [49,50,51,52,53,54,55] and demonstrate that grassland contains a high amount of SOC and a significantly higher SOC content was observed in AAO. This is perhaps due to slightly higher WSA, GMD, and MWD in AAO and GL compared to the other types of land use. Similarly, according to the AAO and GL soil data, a slightly lower BD, higher WSA, MWD, GMD, and SOC in AAO and GL is due to less soil disturbance and higher SOM [27,29,31,37,40,56,57,58].
3.5. Effects of Root Biomass in the Different Land-Use Systems
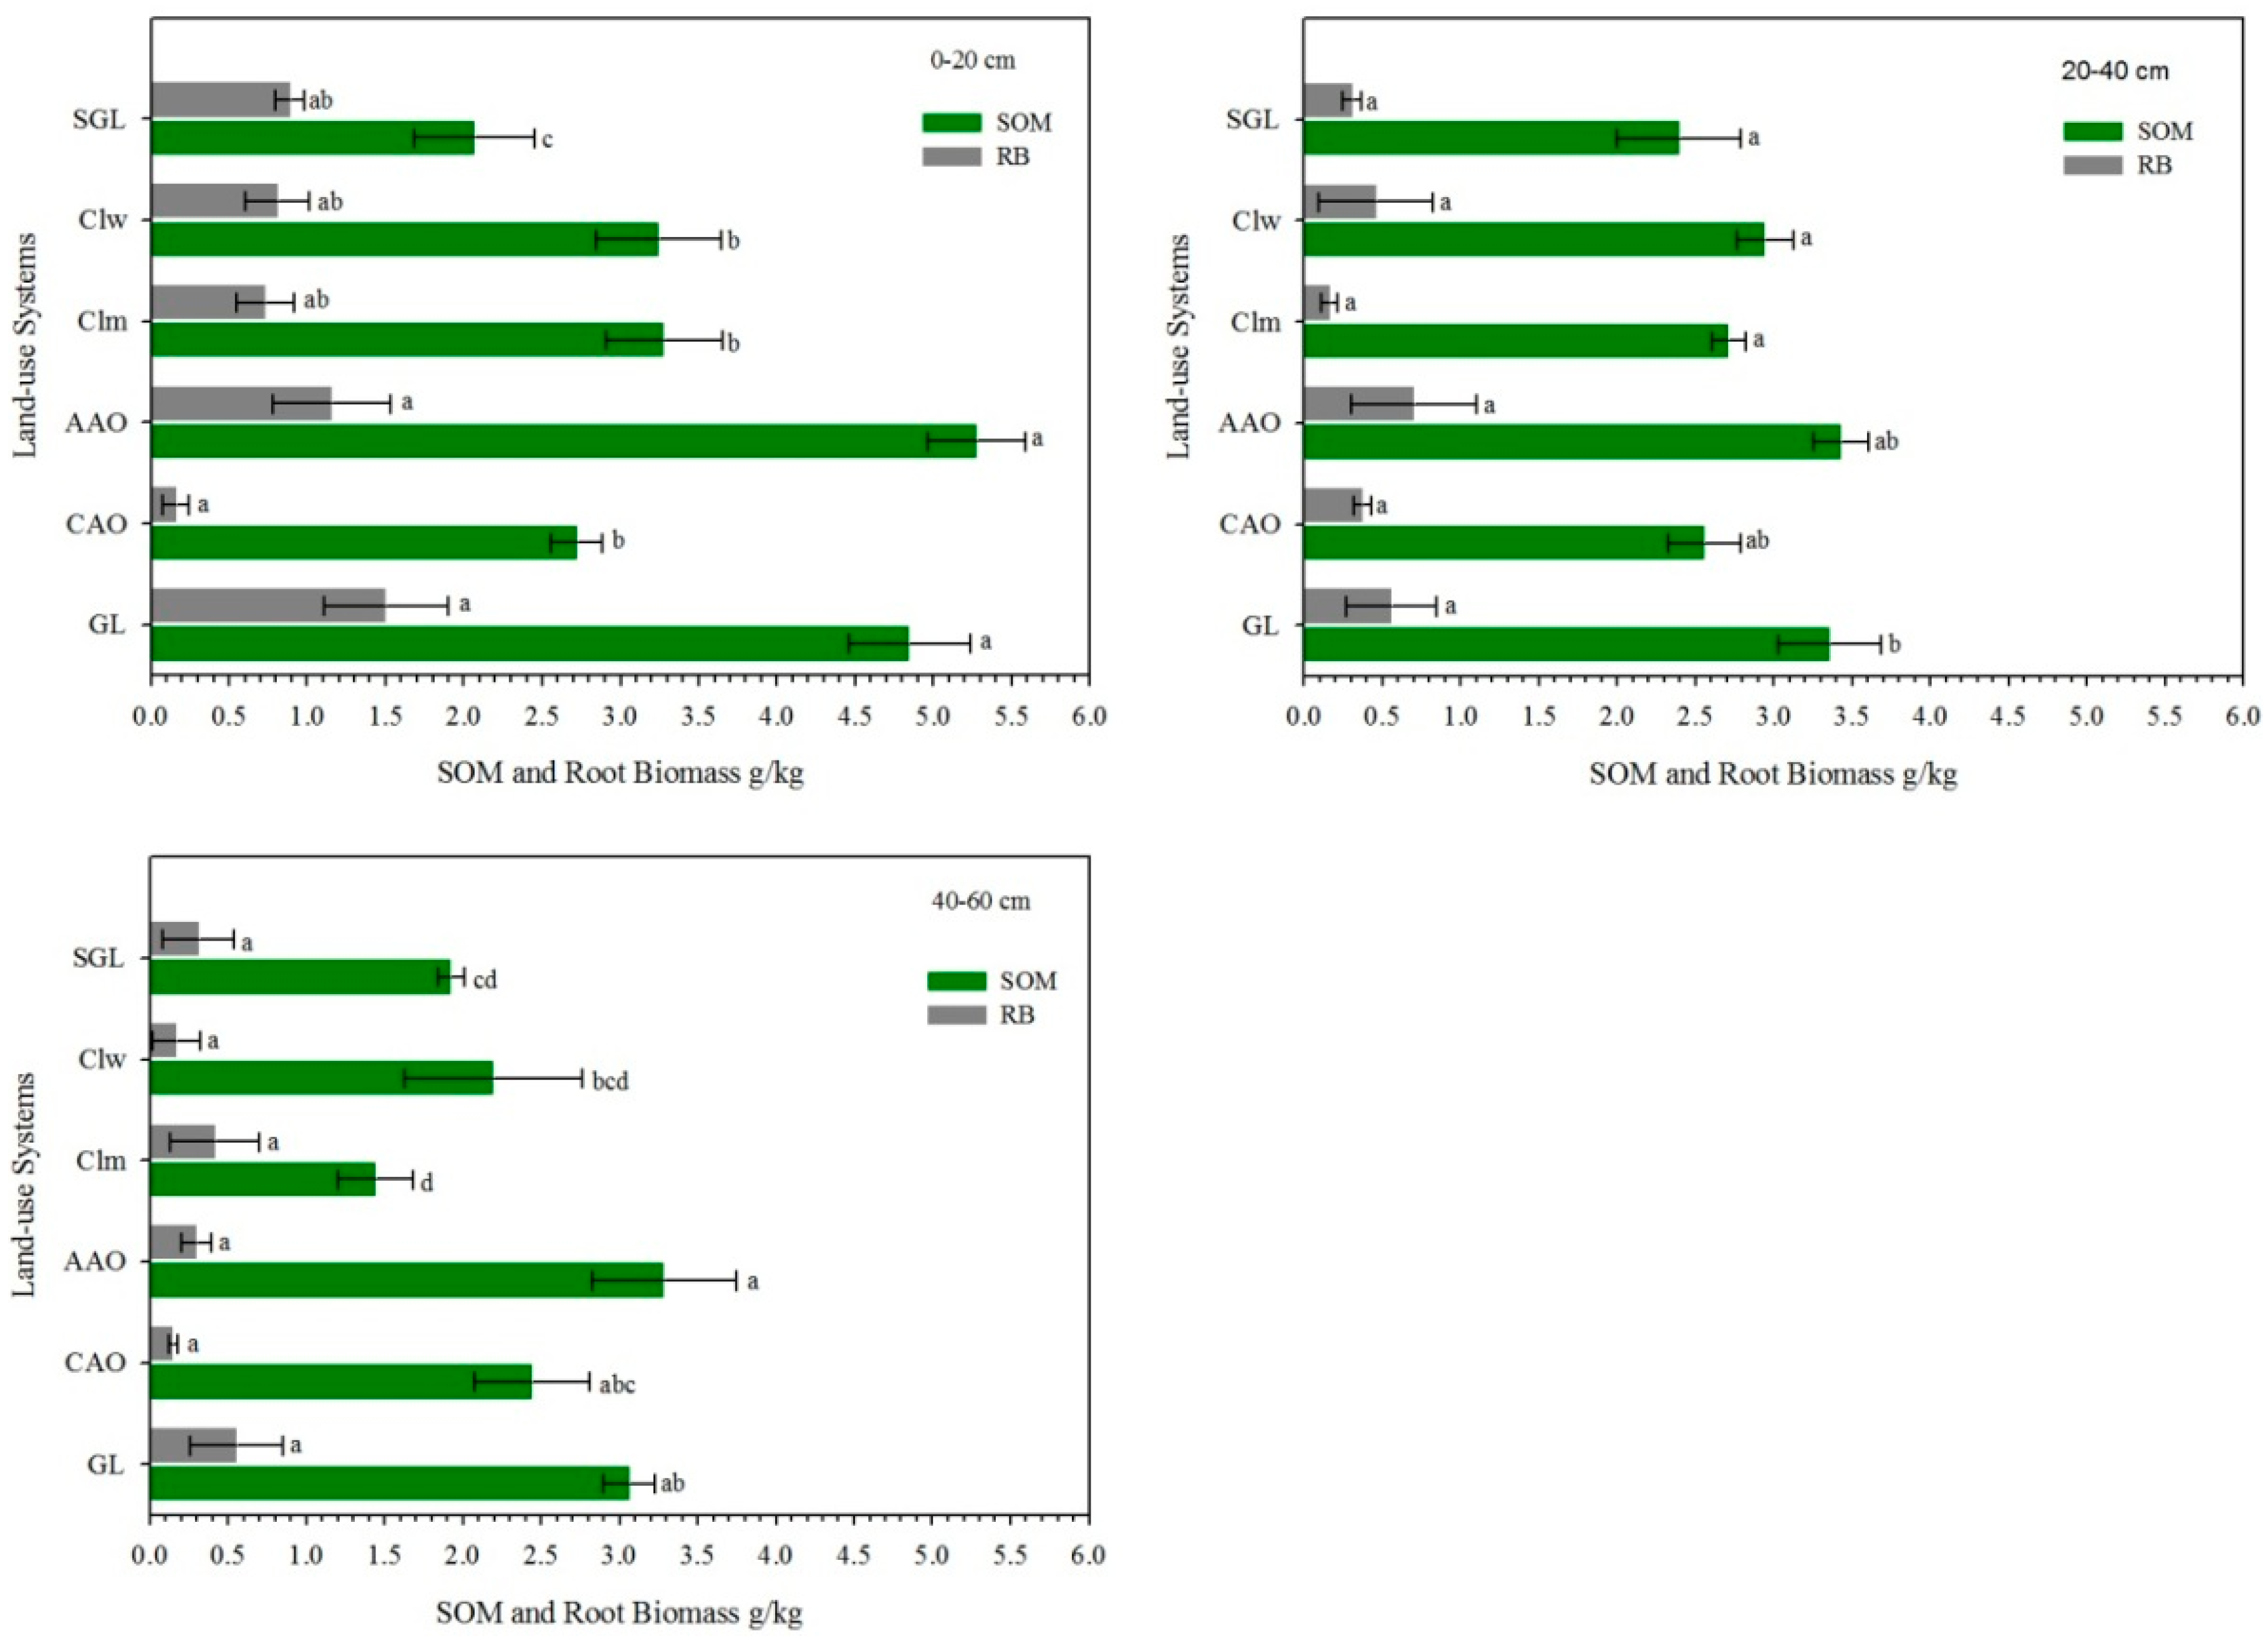
The decay and growth of roots are the main supporters of SOM pools in the soil. Root biomass and SOM were observed as supporting material for the formation of aggregates (Figure 3). In many studies, it has been revealed that GL and AAO have the annual mean maximum root biomass, and an estimated annual root biomass was noted in grassland at 1360 kg and 6803 kg hac−1 year−1 [59,60,61]. The findings of this study showed that the surface soil at 0–20 cm in GL and AAO contained the highest amounts of root biomass and SOM (Figure 3) while that in CAO contained the lowest root biomass and Clw contained a greater amount than Clm. We assume that it may be affected by the activities of farmers, who remove all types of unwanted vegetation from the soil in cultivated lands. Across the six study sites, there was a decreasing root biomass pattern beginning with GL, followed by AAO, SGL, Clw, Clm, and CAO at the 0–60 cm soil layers (Figure 3). In addition, root biomass decreased with the increase of the soil depth. Similar trends were also observed in SOM (Figure 3). Root biomass plays a vital role in the decomposition of SOM and helps in the formation of soil aggregates [10,45,60]. Generally, the study observations showed that animal grazing, the regular use of farm machinery, and several anthropogenic activities were assumed to be the reasons for low root biomass production in the CAO, Clm, and Clw; similar findings were observed by many researchers in their studies [62,63,64].
3.6. Relationship between Soil Aggregates (DSA and WSA) and Soil Properties
It is well known that the stability of soil water-stable aggregate is associated with the composition of soil organic matter. The study showed positive correlations among fraction sizes of DSA, WSA, MWD, GMD, and SOC. A highly significant correlation (p < 0.01) between the aggregate fraction (>5 mm) and DSA WSA, MWD, and GMD was observed, in contrast to other size fractions and related soil properties (Table 6). The results of present study are aligned with the published papers [36,52,64,65]. Soil organic matter is the key compound affected by a range of microbial activities (living and dead organisms, decomposable SOM, and dead plant materials). Our results also show a highly significant and positive correlation between SOC and soil aggregates (p < 0.01). A negative correlation between bulk density and SOC, GMD, and MWD indicates that macro-aggregates are not stable [32], and bulk density decreased with increasing SOC. Accordingly, the changes in the relationship between the soil properties (DSA and WSA with the different size fractions) and land-use systems indicate that the soil factors would have effects on soil aggregation and their fraction sizes.
4. Conclusions
The effects of the different land-use systems on soil aggregates and their size distributions are evident in grassland, abandoned apple orchard, and shrub-grassland compared to the common apple orchard, cropland wheat, and cropland maize. Higher water-stable aggregate was observed in shrub-grassland, abandoned apple orchard, and grassland compared to cropland maize, cropland wheat, and apple orchard. In addition, a reduced percentage of water-stable aggregate was an indication of low soil organic matter, root biomass, and limited microbial activity.
Pearson’s correlation showed a positive correlation between mean weight diameter, geometric mean diameter, and soil organic matter in grassland, abandoned apple orchard, and shrub-grassland, in contrast to cropland maize, cropland wheat, and common apple orchard. We recommend cropland maize and cropland wheat to retain more residues and soil organic matter as a better way to improve soil aggregation.
Conclusively, the type of land use affected soil aggregation and distribution of size fractions, the small fractions of the aggregates formed large fractions by combining with fresh organic matter, and the increased soil organic carbon concentrations were closely linked with the formation of macro-aggregates. Thus, converting slope farmland to forestland and grassland could improve water-stable aggregates and reduce soil disturbances in areas with the highest erosion risk, such as the Loess Plateau.
Acknowledgments
This study is financially supported by the National Natural Science Foundation of China (NSFC) under projects (41471439, 41171421), and the China Scholarship Council (CSC) for supporting the first author. Thanks to Changwu State Key Agro-Ecological Experimental Station for logistic and scientific assistance during the field campaigns.
Author Contributions
Shahmir Ali Kalhoro conceived study and conducted experiments. Yuan CW helped during laboratory analysis. Hua rui and Ding Kang helped in field experiments. Sajjad Raza helped with statistical analysis and figure design. Shahmir Ali Kalhoro wrote the first draft of the manuscript. Xu Xuexuan design the project and critically revised the final draft and checked language accuracy as well supervised the experiments through the study period. All authors read and approve the manuscript for publication.
Conflicts of Interest
All authors certify that they have no financial arrangement with a company whose product figures prominently in the submitted manuscript or with a company making a competing product and, therefore, no conflict of interest exists.
References
- Yu, M.; Zhang, L.; Xu, X.; Feger, K.H.; Wang, Y.; Liu, W.; Schwärzel, K. Impact of land-use changes on soil hydraulic properties of Calcaric Regosols on the Loess Plateau, NW China. J. Plant Nutr. Soil Sci. 2015, 178, 486–498. [Google Scholar] [CrossRef]
- Peng, X.; Yan, X.; Zhou, H.; Zhang, Y.Z.; Sun, H. Assessing the contributions of sesquioxides and soil organic matter to aggregation in an Ultisol under long-term fertilization. Soil Tillage Res. 2015, 146, 89–98. [Google Scholar] [CrossRef]
- Onweremadu, E.U.; Onyia, V.N.; Anikwe, M.A.N. Carbon and nitrogen distribution in water-stable aggregates under two tillage techniques in Fluvisols of Owerri area, southeastern Nigeria. Soil Tillage Res. 2007, 97, 195–206. [Google Scholar] [CrossRef]
- Six, J.; Bossuyt, H.; Degryze, S.; Denef, K. A history of research on the link between (micro)aggregates, soil biota, and soil organic matter dynamics. Soil Tillage Res. 2004, 79, 7–31. [Google Scholar] [CrossRef]
- Durigan, M.R.; Cherubin, M.R.; de Camargo, P.B.; Ferreira, J.N.; Berenguer, E.; Gardner, T.A.; Barlow, J.; Dias, C.T.S.; Signor, D.; Junior, R.C.O.; et al. Soil Organic Matter Responses to Anthropogenic Forest Disturbance and Land Use Change in the Eastern Brazilian Amazon. Sustainability 2017, 9, 379. [Google Scholar] [CrossRef]
- An, S.S.; Mentler, A.; Mayer, H.; Blum, W.E.H. Soil aggregation, aggregate stability, organic carbon and nitrogen in different soil aggregate fractions under forest and shrub vegetation on the Loess Plateau, China. CATENA 2010, 81, 226–233. [Google Scholar] [CrossRef]
- Somasundaram, J.; Reeves, S.; Wang, W.; Heenan, M.; Dalal, R. Impact of 47 years of No. tillage and stubble retention on soil aggregation and Carbon distribution in a Vertisol. Land Degrad. Dev. 2016, 28, 1589–1602. [Google Scholar] [CrossRef]
- Curtin, J.S.; Mullen, G.J. Physical properties of some intensively cultivated soils of Ireland amended with spent mushroom compost. Land Degrad. Dev. 2010, 18, 355–368. [Google Scholar] [CrossRef]
- Golchin, A.; Oades, J.M.; Skjemstad, J.O.; Clarke, P.; Golchin, A.; Oades, J.M.; Skjemstad, J.O.; Clarke, P. Structural and dynamic properties of soil organic-matter as reflected by 13C natural-abundance, pyrolysis mass-spectrometry and solid-state 13C NMR-spectroscopy in density fractions of an oxisol under forest and pasture. Aust. J. Soil Res. 1995, 33, 59–76. [Google Scholar] [CrossRef]
- Li, Y.; Jiao, J.; Wang, Z.; Cao, B.; Wei, Y.; Hu, S. Effects of Revegetation on Soil Organic Carbon Storage and Erosion-Induced Carbon Loss under Extreme Rainstorms in the Hill and Gully Region of the Loess Plateau. Int. J. Environ. Res. Public Health. 2016, 13, 456. [Google Scholar] [CrossRef] [PubMed]
- Zhi, L.; Liu, W.Z.; Zhang, X.C.; Zheng, F.L. Impacts of land use change and climate variability on hydrology in an agricultural catchment on the Loess Plateau of China. J. Hydrol. 2009, 377, 35–42. [Google Scholar]
- Le Bissonnais, Y. Aggregate stability and assessment of soil crustability and erodibility: I. Theory and methodology. Eur. J. Soil Sci. 1996, 47, 425–437. [Google Scholar] [CrossRef]
- Kemper, W.D.; Rosenau, R.C. Aggregate stability and size distribution. In Methods of Soil Analysis Part 1, 2nd ed.; Klute, A., Ed.; American Society of Agronomy: Madison, WI, USA, 1986; pp. 425–442. [Google Scholar]
- De Leenheer, L.; De Boodt, M. Determination of aggregate stability by the change in mean weight diameter. Mededelingen van de Land Bouwhoge School Gent 1959, 24, 290–300. [Google Scholar]
- John, B.; Yamashita, T.; Ludwig, B.; Flessa, H. Storage of organic carbon in aggregate and density fractions of silty soils under different types of land use. Geoderma 2005, 128, 63–79. [Google Scholar] [CrossRef]
- Oades, J.M.; Waters, A.G. Aggregate hierarchy in soils. Aust. J. Soil Res. 1991, 29, 815–828. [Google Scholar] [CrossRef]
- Singh, M.J.; Khera, K.L. Physical Indicators of Soil Quality in Relation to Soil Erodibility under Different Land Uses. Arid Land Res. Manag. 2009, 23, 152–167. [Google Scholar] [CrossRef]
- Zhang, P.; Wei, T.; Jia, Z.; Han, Q.; Ren, X. Soil aggregate and crop yield changes with different rates of straw incorporation in semiarid areas of northwest China. Geoderma 2014, 230–231, 41–49. [Google Scholar] [CrossRef]
- Li, X.G.; Zhang, P.L.; Yin, P.; Li, Y.K.; Ma, Q.F.; Long, R.J.; Li, F.M. Soil organic carbon and nitrogen fractions and water-stable aggregation as affected by cropping and grassland reclamation in an arid sub-alpine soil. Land Degrad. Dev. 2009, 20, 176–186. [Google Scholar] [CrossRef]
- Jackson, M.L. Soil Chemical Analysis. Verlag: Prentice Hall, Inc., Englewood Cliffs, NJ. 1958, 498 S. DM 39.40. Z. Pflanzenernaehr. Dueng. Bodenk. J. Plant Nutr. Soil Sci. 1958, 85, 251–252. [Google Scholar]
- Goossens, D.; Buck, B. Dust dynamics in off-road vehicle trails: Measurements on 16 arid soil types, Nevada, USA. J. Environ. Manag. 2009, 90, 3458–3469. [Google Scholar] [CrossRef] [PubMed]
- Stanley, K.E.; Schaetzl, R.J. Characteristics and paleoenvironmental significance of a thin, dual-sourced loess sheet, north-central Wisconsin. Aeolian Res. 2011, 2, 241–251. [Google Scholar] [CrossRef]
- Walkley, A.J.; Black, I.A. An Examination of the Degtjareff Method for Determining Soil Organic Matter, and A Proposed Modification of the Chromic Acid Titration Method. Soil Sci. 1934, 37, 29–38. [Google Scholar] [CrossRef]
- Mazurak, A.P. Effect of gaseous phase on water-stable synthetic aggregates. Soil Sci. 1950, 69, 135–148. [Google Scholar] [CrossRef]
- Chepil, W.S. Properties of soil which influence wind erosion; III. Effect of apparent density on erodibility. Soil Sci. 1951, 71, 141–153. [Google Scholar] [CrossRef]
- Van Bavel, C.H.M. Mean weight diameter of soil aggregates as a statistical index of aggregation. Soli Sci. Soc. Am. J. 1949, 14, 20–21. [Google Scholar] [CrossRef]
- Brzeziska, M.; Sokolowska, Z.; Alekseeva, T.; Alekseev, A.; Hajnos, M.; Szarlip, P. Some characteristics of organic soils irrigated with municipal wastewater. Land Degrad. Dev. 2011, 22, 586–595. [Google Scholar] [CrossRef]
- Mukherjee, A.; Lal, R. Tillage effects on quality of organic and mineral soils under on-farm conditions in Ohio. Environ. Earth Sci. 2015, 74, 1815–1822. [Google Scholar] [CrossRef]
- Sokołowska, Z.; Szajdak, L.; Boguta, P. Effect of phosphates on dissolved organic matter release from peat-muck soils. Int. Agrophys. 2011, 25, 173–180. [Google Scholar]
- Tebrügge, F.; Düring, R.A. Reducing tillage intensity—A review of results from a long-term study in Germany. Soil Tillage Res. 1999, 53, 15–28. [Google Scholar] [CrossRef]
- Walczak, R.; Rovdan, E.; Witkowskawalczak, B. Water retention characteristics of peat and sand mixtures. Int. Agrophys. 2002, 16, 161–166. [Google Scholar]
- Abid, M.; Lal, R. Tillage and drainage impact on soil qualityI. Aggregate stability, carbon and nitrogen pools. Soil Tillage Res. 2008, 100, 89–98. [Google Scholar] [CrossRef]
- Mamedov, A.I.; Huang, C.; Aliev, F.A.; Levy, G.J. Aggregate stability and water retention near saturation characteristics as affected by soil texture, aggregate size and polyacrylamide application. Land Degrad. Dev. 2016, 28, 543–552. [Google Scholar] [CrossRef]
- Saygn, S.D.; Gunay, E.; Mustafa, B. Comparison of aggregate stability measurement methods for clay rich soils in asartepe catchment of turkey. Land Degrad. Dev. 2017, 28, 199–206. [Google Scholar] [CrossRef]
- Six, J.; Elliott, E.T.; Paustian, K. Soil macroaggregate turnover and microaggregate formation: A mechanism for C sequestration under no-tillage agriculture. Soil Biol. Biochem. 2000, 32, 2099–2103. [Google Scholar] [CrossRef]
- Tisdal, J.M.; Oades, J.M. Organic matter and water-stable aggregates in soils. J. Soil Sci. 1982, 33, 141–163. [Google Scholar] [CrossRef]
- Bronick, C.J.; Lal, R. Soil structure and management: A review. Geoderma 2005, 124, 3–22. [Google Scholar] [CrossRef]
- Beare, M.H.; Cabrera, M.L.; Hendrix, P.F.; Coleman, D.C. Aggregate-Protected and Unprotected Organic-Matter Pools in Conventional-Tillage and No-Tillage Soils. Soil Sci. Soc. Am. J. 1994, 58, 787–795. [Google Scholar] [CrossRef]
- Beare, M.H.; Hus, S.; Coleman, D.C.; Hendrix, P.F. Influences of mycelial fungi on soil aggregation and organic matter storage in conventional and no-tillage soils. Appl. Soil Ecol. 1997, 5, 211–219. [Google Scholar] [CrossRef]
- Presley, D.A.R.; Sindelar, A.J.; Buckley, M.E.; Mengel, D.B. Long-Term Nitrogen and Tillage Effects on Soil Physical Properties under Continuous Grain Sorghum. Agron. J. 2012, 104, 749. [Google Scholar] [CrossRef]
- Emadi, M.; Baghernejad, M.; Memarian, H.R. Effect of land-use change on soil fertility characteristics within water-stable aggregates of two cultivated soils in northern Iran. Land Use Policy 2009, 26, 452–457. [Google Scholar] [CrossRef]
- Bottinelli, N.; Jouquet, P.; Capowiez, Y.; Podwojewski, P.; Grimaldi, M.; Peng, X. Why is the influence of soil macrofauna on soil structure only considered by soil ecologists? Soil Tillage Res. 2015, 146, 118–124. [Google Scholar] [CrossRef]
- Pulido Moncada, M.; Gabriels, D.; Cornelis, W.; Lobo, D. Comparing Aggregate Stability Tests for Soil Physical Quality Indicators. Land Degrad. Dev. 2013, 26, 843–852. [Google Scholar] [CrossRef]
- Chirinda, N.; Olesen, J.E.; Porter, J.R.; Schjønning, P. Soil properties, crop production and greenhouse gas emissions from organic and inorganic fertilizer-based arable cropping systems. Agric. Ecosyst. Environ. 2010, 139, 584–594. [Google Scholar] [CrossRef]
- Le, G.C.; Angers, D.A.; Maron, P.A.; Leterme, P.; Menasseriaubry, S. Linking microbial community to soil water-stable aggregation during crop residue decomposition. Soil Biol. Biochem. 2012, 50, 126–133. [Google Scholar]
- Reynolds, W.D.; Drury, C.F.; Tan, C.S.; Fox, C.A.; Yang, X.M. Use of indicators and pore volume-function characteristics to quantify soil physical quality. Geoderma 2009, 152, 252–263. [Google Scholar] [CrossRef]
- Aksakal, E.L.; Sari, S.; Angin, I. Effects of Vermicompost Application on Soil Aggregation and Certain Physical Properties. Land Degrad. Dev. 2016, 27, 983–995. [Google Scholar] [CrossRef]
- Saroa, G.S.; Lal, R. Soil restorative effects of mulching on aggregation and carbon sequestration in a Miamian soil in central Ohio. Land Degrad. Dev. 2003, 14, 481–493. [Google Scholar] [CrossRef]
- Chen, H.; Shao, M.; Li, Y. Soil desiccation in the Loess Plateau of China. Geoderma 2008, 143, 91–100. [Google Scholar] [CrossRef]
- Gelaw, A.M.; Singh, B.R.; Lal, R. Organic Carbon and Nitrogen Associated with Soil Aggregates and Particle Sizes Under Different Land Uses in Tigray, Northern Ethiopia. Land Degrad. Dev. 2015, 26, 690–700. [Google Scholar] [CrossRef]
- Lal, R. Challenges and opportunities in soil organic matter research. Eur. J. Soil Sci. 2009, 60, 158–169. [Google Scholar] [CrossRef]
- Liu, M.Y.; Chang, Q.R.; Qi, Y.B.; Liu, J.; Chen, T. Aggregation and soil organic carbon fractions under different land uses on the tableland of the Loess Plateau of China. CATENA 2014, 115, 19–28. [Google Scholar] [CrossRef]
- Schmidt, M.W.; Torn, M.S.; Abiven, S.; Dittmar, T.; Guggenberger, G.; Janssens, I.A.; Kleber, M.; Kögel-Knabner, I.; Lehmann, J.; Manning, D.A. Persistence of soil organic matter as an ecosystem property. Nature. Nature 2011, 478, 49–56. [Google Scholar] [CrossRef] [PubMed]
- Varvel, G.E.; Wilhelm, W.W. Long-Term Soil Organic Carbon as Affected by Tillage and Cropping Systems. Soil Sci. Soc. Am. J. 2010, 74, 915–921. [Google Scholar] [CrossRef]
- Wen, D.; He, N.; Zhang, J. Dynamics of Soil Organic Carbon and Aggregate Stability with Grazing Exclusion in the Inner Mongolian Grasslands. PLoS ONE 2016, 11, e0146757. [Google Scholar] [CrossRef] [PubMed]
- Havlin, J.L.; Kissel, D.E.; Maddux, L.D.; Claassen, M.M.; Long, J.H. Crop rotation and tillage effects on soil organic carbon and nitrogen. Soil Sci. Soc. Am. J. 1990, 54, 448–452. [Google Scholar] [CrossRef]
- Hussain, I.; Olson, K.R.; Ebelhar, S.A. Long-Term Tillage Effects on Soil Chemical Properties and Organic Matter Fractions. Soil Sci. Soc. Am. J. 1999, 63, 1335–1341. [Google Scholar] [CrossRef]
- Koga, N.; Tsuji, H. Effects of reduced tillage, crop residue management and manure application practices on crop yields and soil carbon sequestration on an Andisol in northern Japan. Soil Sci. Plant Nutr. 2009, 55, 546–557. [Google Scholar] [CrossRef]
- Banger, K.; Kukal, S.S.; Toor, G.; Sudhir, K.; Hanumanthraju, T.H. Impact of long-term additions of chemical fertilizers and farm yard manure on carbon and nitrogen sequestration under rice-cowpea cropping system in semi-arid tropics. Plant Soil. 2009, 318, 27–35. [Google Scholar] [CrossRef]
- Poeplau, C.; Don, A.; Vesterdal, L.; Leifeld, J.; Van, W.B.; Schumacher, J.; Gensior, A. Temporal dynamics of soil organic carbon after land-use change in the temperate zone—Carbon response functions as a model approach. Glob. Chang. Biol. 2011, 17, 2415–2427. [Google Scholar] [CrossRef]
- Saha, D.; Kukal, S.S. Soil Structural Stability and Water Retention Characteristics under Different Land uses of Degraded Lower Himalayas of North-West India. Land Degrad. Dev. 2015, 26, 263–271. [Google Scholar] [CrossRef]
- Nippert, J.B.; Knapp, A.K. Linking water uptake with rooting patterns in grassland species. Oecologia 2007, 153, 261–272. [Google Scholar] [CrossRef] [PubMed]
- Qiao, Y.; Miao, S.; Li, N.; Xu, Y.; Han, X.; Zhang, B. Crop species affect soil organic carbon turnover in soil profile and among aggregate sizes in a Mollisol as estimated from natural 13 C abundance. Plant Soil 2015, 392, 163–174. [Google Scholar] [CrossRef]
- Wang, J.G.; Yang, W.; Yu, B.; Li, Z.X.; Cai, C.F.; Ma, R.M. Estimating the influence of related soil properties on macro- and micro-aggregate stability in ultisols of south-central China. CATENA 2016, 137, 545–553. [Google Scholar] [CrossRef]
- Zhang, J.; Bo, G.; Zhang, Z.; Kong, F.; Wang, Y.; Shen, G. Effects of Straw Incorporation on Soil Nutrients, Enzymes, and Aggregate Stability in Tobacco Fields of China. Sustainability 2016, 8, 710. [Google Scholar] [CrossRef]
Figure 1.
The geographical location of the study site of Changwu County, Loess Plateau, China.

Figure 2.
Soil organic carbon (SOC) under different land-use systems, the mean value results are not significantly different (p < 0.05), under different land uses of GL, CAO, AAO, Clm, Clw, and SGL. Different lowercase letters (a, b, c, d) indicate significant differences at p < 0.05.
Figure 2.
Soil organic carbon (SOC) under different land-use systems, the mean value results are not significantly different (p < 0.05), under different land uses of GL, CAO, AAO, Clm, Clw, and SGL. Different lowercase letters (a, b, c, d) indicate significant differences at p < 0.05.
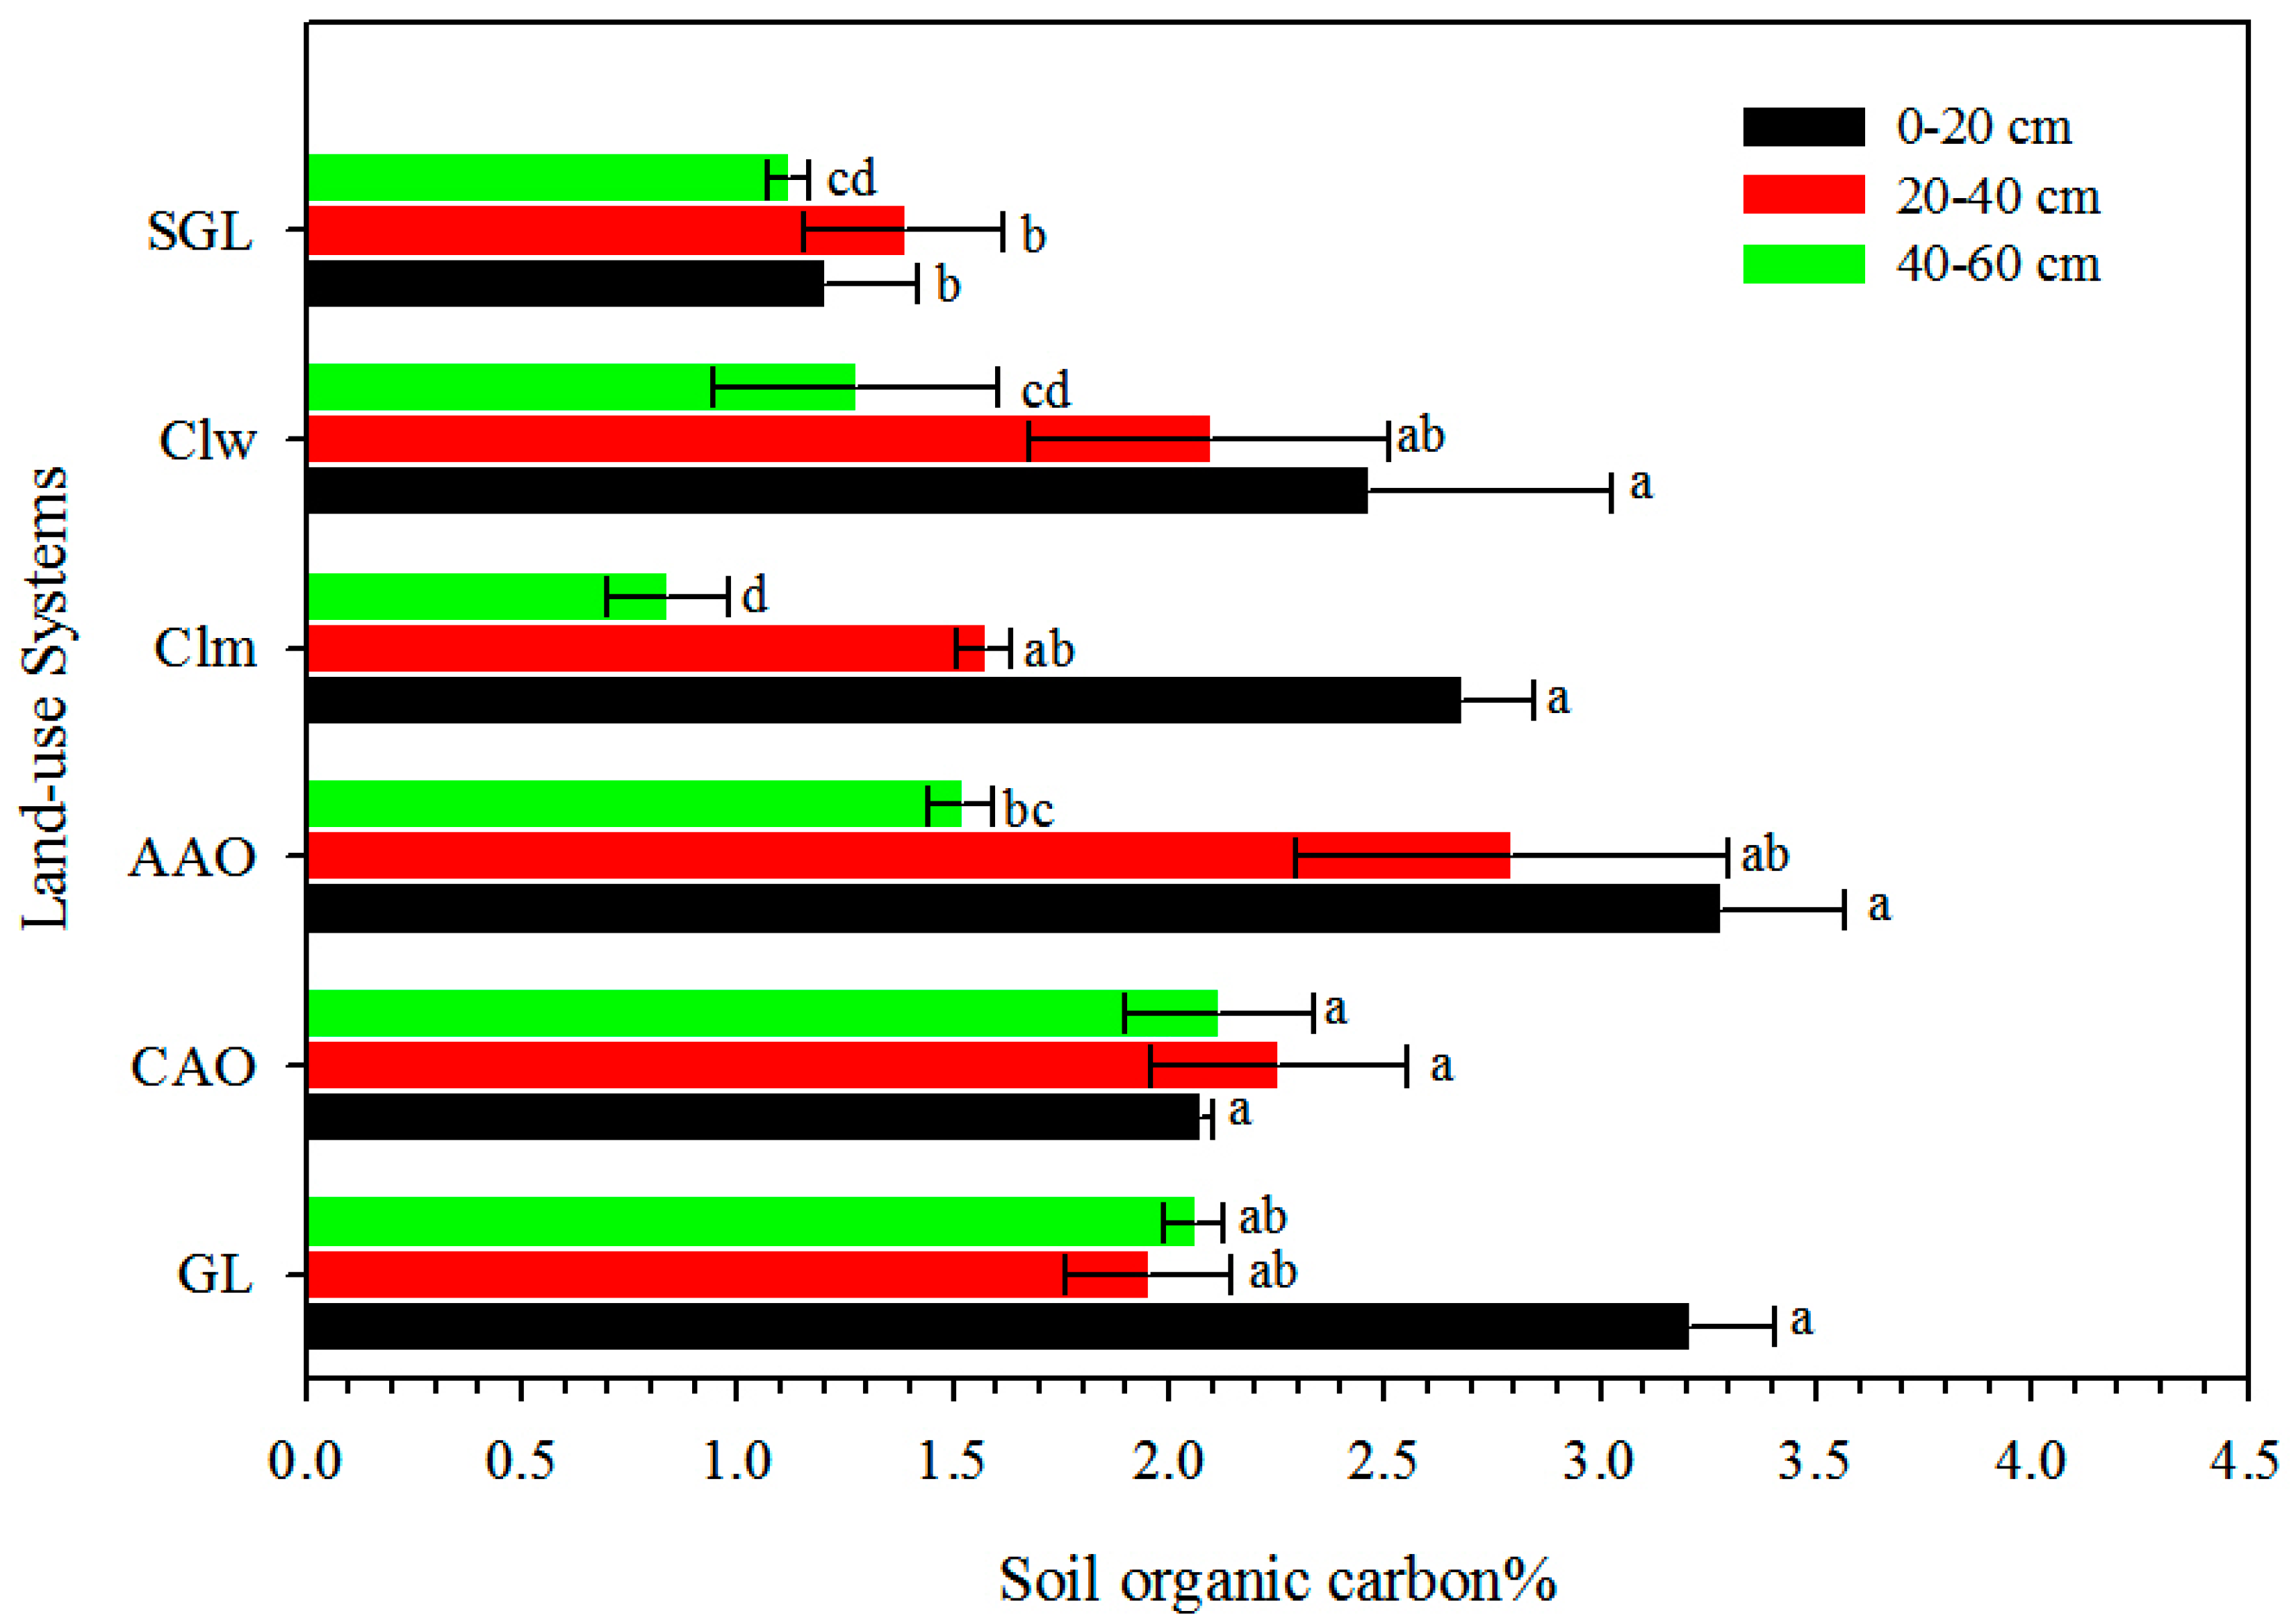
Figure 3.
Percentage of soil organic matter (SOM) and root biomass (RB) in different soil layers, mean value with a standard error, the results are not significantly different (p < 0.05), under different land uses of GL, CAO, AAO, Clm, Clw, and SGL. Different lowercase letters (a, b, c, d) indicate significant differences at p < 0.05.

Table 1.
Summary of abbreviations of different land uses with their brief history.
| Types of Land Use | Abbreviation | Utilization History |
|---|---|---|
| Grassland | GL | The land was used as apple orchard and its conversion to grassland started in 2000 and all the woody material of apple trees was removed from the field at the same time. |
| Common apple orchard | CAO | Before 2006, the land was used for the cultivation of field for crops like wheat, maize, and millet and has been used as an apple orchard since 2006. |
| Abandoned apple orchard | AAO | The utilization as apple orchard was abandoned some 16 years ago. Some apple trees are still in the field and grow naturally. |
| Cropland maize | Clm | The land has been under regular maize cultivation for the last 20 years. |
| Cropland wheat | Clw | The land is cultivated for wheat currently but was an apple orchard 4–5 years ago. |
| Shrub-grassland | SGL | This land has not been not under cultivation for the last 10 years. |
Table 2.
Characteristics of the soil at study sites under six land-use systems.
| Soil Layers (cm) | Land-Use System | Bulk Density (Mg/m3) | Electrical Conductivity (dS m−1) | Soil Particle Size Distributions | ||
|---|---|---|---|---|---|---|
| Sand % | Silt % | Clay % | ||||
| 0–20 | GL | 1.01 (0.35) a | 0.238 (0.008) ab | 8.69 (2.07) c | 70.11 (0.94) a | 21.20 (1.14) a |
| CAO | 0.82 (0.19) a | 0.258 (0.020) a | 15.45 (4.13) a | 64.91 (2.24) b | 19.64 (2.02) a | |
| AAO | 0.97 (0.12) a | 0.225 (0.012) b | 13.21 (3.54) a | 66.61 (1.62) ab | 20.18 (2.03) a | |
| Clm | 1.11 (0.03) a | 0.181 (0.010) c | 11.00 (3.06) ab | 70.46 (0.96) a | 18.53 (2.54) a | |
| Clw | 0.99 (0.02) a | 0.192 (0.003) c | 10.79 (0.70) b | 69.15 (0.97) a | 20.06 (1.29) a | |
| SGL | 0.99 (0.14) a | 0.209 (0.005) bc | 9.46 (0.65) c | 70.95 (0.34) a | 19.59 (0.94) a | |
| 20–40 | GL | 1.10 (0.05) b | 0.179 (0.005) b | 9.20 (1.30) a | 71.73 (0.48) c | 19.07 (1.03) ab |
| CAO | 1.09 (0.06) b | 0.212 (0.106) a | 7.84 (3.54) a | 70.10 (0.63) bc | 22.06 (3.18) a | |
| AAO | 0.99 (0.21) ab | 0.210 (0.031) a | 15.43 (2.48) a | 69.27 (0.71) c | 15.29 (1.96) ab | |
| Clm | 1.19 (0.01) a | 0.176 (0.003) b | 14.97 (3.58) a | 68.39 (0.99) c | 16.64 (2.81) b | |
| Clw | 1.07 (0.01) b | 0.182 (0.002) a | 7.55 (0.40) a | 72.34 (0.43) ab | 20.11 (0.27) a | |
| SGL | 0.89 (0.10) c | 0.184 (0.007) b | 8.35 (2.54) a | 69.41 (0.20) a | 22.24 (2.39) a | |
| 40–60 | GL | 1.13 (0.02) a | 0.182 (0.005) b | 22.21 (8.85) a | 64.04 (3.67) b | 13.75 (5.18) b |
| CAO | 1.13 (0.05) a | 0.445 (0.146) a | 7.60 (4.40) b | 69.22 (1.18) ab | 23.18 (3.29) a | |
| AAO | 1.20 (0.07) a | 0.166 (0.006) b | 11.99 (3.33) ab | 69.66 (1.35) a | 18.35 (1.98) ab | |
| Clm | 1.20 (0.04) a | 0.167 (0.003) b | 9.87 (0.53) ab | 70.72 (0.26) a | 19.41 (0.68) ab | |
| Clw | 1.17 (0.06) a | 0.186 (0.003) b | 8.31 (0.22) ab | 72.90 (0.28) a | 18.79 (0.24) ab | |
| SGL | 1.09 (0.17) a | 0.165 (0.005) b | 7.07 (0.57) b | 73.61 (0.11) a | 19.32 (0.51) ab | |
The mean value of GL, CAO, AAO, Clm, Clw, SGL, Bulk Density, and Electrical Conductivity in triplicate data with standard error is within the brackets. Different lowercase letters (a, b, c) indicate significant differences at p < 0.05 within a column.
Table 3.
Historical data of area and fertilizer usage by different land use types in the Loess Plateau.
Table 3.
Historical data of area and fertilizer usage by different land use types in the Loess Plateau.
| Period of Land Use (Years) | Area (ha m−2) | Maize Crop Lands | Wheat Crop Lands | Apple Orchard Lands | |||||
|---|---|---|---|---|---|---|---|---|---|
| Crop Cultivated Areas | Orchard lands Areas | Grass Land Areas | N kg ha−1 | P kg ha−1 | N kg ha−1 | P kg ha−1 | N kg ha−1 | P kg ha−1 | |
| 1986–1990 | 267.76 | 36.4 | 55.8 | 103.5 | 39 | 173 | 39 | 346 | 78 |
| 1990–2000 | 238.61 | 96.83 | 23.14 | 138 | 39 | 173 | 39 | 346 | 78 |
| 2000–2008 | 133.09 | 191.99 | 62.5 | 138 | 59 | 138 | 39 | 346 | 78 |
| 2008–2012 | After this; conversion of land use systems was not made. | ||||||||
Table 4.
Size distribution of soil aggregates by dry sieving, under six land-use systems.
| Soil Layers (cm) | Land-Use System | Dry Stable Aggregate and Size Class Distributions (Mass %) | MWD | GMD | DSA | |||||
|---|---|---|---|---|---|---|---|---|---|---|
| >5 | 5–2 | 2–1 | 1–0.5 | 0.5–0.25 | <0.25 | |||||
| 0–20 | GL | 52.12 (4.34) ab | 16.51 (1.99) d | 13.72 (1.94) a | 9.61 (0.98) a | 3.93 (0.05) c | 4.11 (0.52) b | 4.78 (0.11) b | 3.19 (0.05) c | 69 (2.3) b |
| CAO | 65.10 (3.90) a | 11.89 (0.33) d | 10.94 (1.26) ab | 7.12 (1.29) b | 2.63 (0.45) d | 2.33 (0.57) c | 5.53 (0.13) a | 4.10 (0.04) a | 77 (3.6) a | |
| AAO | 41.78 (6.43) b | 32.00 (1.34) a | 11.47 (0.40) ab | 8.40 (2.43) a | 3.65 (1.24) bc | 2.70 (1.02) c | 4.51 (0.24) bc | 3.23 (0.10) c | 74 (5.1) a | |
| Clm | 45.54 (7.11) b | 18.07 (2.26) c | 11.86 (2.31) ab | 10.58 (2.84) a | 4.86 (0.85) b | 9.08 (3.37) a | 4.34 (0.12) c | 2.52 (0.03) d | 64 (9.4) b | |
| Clw | 50.91 (0.97) ab | 26.96 (1.27) ab | 9.49 (0.19) b | 5.81 (0.53) c | 2.96 (0.13) b | 3.87 (0.17) b | 4.36 (0.02) c | 3.58 (0.01) b | 78 (0.3) a | |
| SGL | 37.85 (5.52) b | 24.36(2.97) b | 14.95 (1.27) a | 9.38 (0.48) a | 5.44 (0.57) a | 8.01 (1.19) a | 4.42 (0.41) b | 2.41 (1.19) cd | 62 (2.5) c | |
| 20–40 | GL | 70.77 (1.64) a | 10.19 (0.32) d | 8.03 (0.80) b | 5.81 (0.13) b | 2.47 (0.18) c | 2.73(0.21) b | 5.84 (0.13) a | 4.43 (0.12) a | 74 (1.3) ab |
| CAO | 68.22 (2.20) a | 13.35 (0.74) c | 8.44 (1.55) b | 5.66 (1.06) b | 2.19 (0.24) c | 2.13 (0.09) b | 5.76 (1.01) a | 4.45 (0.09) a | 76 (2.9) ab | |
| AAO | 56.11 (8.15) ab | 20.24 (3.57) a | 9.79 (0.83) ab | 7.42 (1.73) b | 3.28 (1.03) b | 3.15 (0.99) b | 5.14 (1.11) ab | 3.69(0.19) ab | 79(4.6) ab | |
| Clm | 61.51 (7.94) a | 14.37 (1.64) ab | 8.13 (1.64) b | 6.42 (2.35) b | 3.84 (1.76) ab | 5.72 (3.83) a | 5.31 (1.35) ab | 3.59 (0.03) ab | 64 (9.6) b | |
| Clw | 56.96 (4.46) ab | 16.42 (6.34) ab | 8.03 (0.83) b | 7.08 (0.01) b | 4.07 (0.50) ab | 7.44 (2.22) a | 5.04 (0.01) ab | 3.23 (0.21) ab | 76 (1.9) b | |
| SGL | 40.22 (2.88) b | 21.92 (7.57) a | 13.58 (1.15) a | 9.20 (1.48) a | 5.78 (0.79) a | 9.30 (3.57) a | 4.09 (1.41) b | 2.37 (0.03) b | 83 (4.7) a | |
| 40–60 | GL | 55.50 (9.10) b | 14.54 (2.87) a | 14.63 (5.81) a | 7.35 (0.09) b | 3.60 (0.05) a | 4.37 (0.46) b | 4.96 (0.09) b | 3.36 (0.14) b | 78 (6.2) ab |
| CAO | 64.17 (8.75) ab | 11.44 (1.11) ab | 9.88 (2.04) a | 7.72 (2.16) a | 3.30 (1.50) a | 3.49 (1.93) b | 5.44 (1.16) ab | 3.85 (0.19) ab | 73 (7.6) ab | |
| AAO | 60.99 (1.84) ab | 17.91 (6.53) a | 8.73 (2.05) a | 6.87 (3.03) b | 2.89 (1.49) a | 2.62 (1.80) ab | 5.40 (0.13) ab | 4.00 (0.11) ab | 83 (8.4) a | |
| Clm | 72.23 (1.38) a | 11.09 (0.20) b | 8.96 (3.02) a | 3.32 (0.40) c | 1.72 (0.34) b | 2.68 (1.10) bc | 5.97 (0.40) a | 4.70 (1.10) a | 64 (1.2) b | |
| Clw | 74.01 (2.48) a | 8.90 (0.57) c | 4.95 (0.61) b | 3.76 (0.78) c | 2.39 (0.81) a | 5.98 (0.86) a | 5.98 (0.71) a | 4.32 (0.18) ab | 63 (3.1) b | |
| SGL | 70.11 (6.85) ab | 13.51 (4.33) a | 6.69 (0.98) a | 4.46 (0.61) c | 2.01 (0.31) a | 3.23 (0.62) b | 5.88 (0.61) a | 4.52 (0.31) a | 84 (2.5) a | |
The mean value of GL, CAO, AAO, Clm, Clw, SGL, DSA, MWD, and GMD in triplicate data with standard error is in the brackets. Different lowercase letters (a, b, c, d) indicate significant differences at p < 0.05 within a column.
Table 5.
Size distribution of soil aggregates by wet sieving, under six land-use systems.
| Soil Layers (cm) | Land-Use System | Water Stable Aggregate and Size Class Distributions (Mass %) | MWD | GMD | WSA | |||||
|---|---|---|---|---|---|---|---|---|---|---|
| >5 | 5–2 | 2–1 | 1–0.5 | 0.5–0.25 | <0.25 | |||||
| 0–20 | GL | 51.8 (1.4) b | 9.1 (1.6) b | 10.3 (0.0) a | 9.5 (0.8) b | 11.5 (0.6) b | 7.8 (0.0) d | 4.5 (0.02) a | 2.5 (0.02) a | 61 (0.2) b |
| CAO | 38.9 (2.6) b | 11.5 (0.2) b | 5.6 (0.2) d | 7.9 (2.1) bc | 3.5 (1.3) c | 6.5 (0.3) e | 3.5 (0.09) c | 2.1 (0.09) c | 50 (2.4) c | |
| AAO | 48.2 (5.8) b | 3.8 (0.3) c | 10.2 (1.5) a | 12.2 (1.6) a | 10.7 (2.4) b | 14.9 (0.5) b | 4.1 (0.15) b | 1.8 (0.15) d | 52 (6.0) c | |
| Clm | 27.8 (2.0) b | 18.6 (0.2) a | 2.0 (0.0) e | 5.7 (1.4) c | 23.1 (2.0) a | 22.8 (2.4) a | 2.9 (0.11) d | 1.1 (0.13) f | 46 (1.8) cd | |
| Clw | 35.5 (4.1) a | 14.3 (3.2) b | 7.4 (1.3) b | 9.6 (3.3) b | 5.7 (1.5) c | 27.6 (3.8) a | 3.4 (0.01) c | 1.3 (0.02) e | 50 (7.3) c | |
| SGL | 52.0 (0.5) b | 12.8 (1.2) b | 5.9 (0.9) c | 7.7 (0.2) bc | 11.6 (2.5) b | 9.9 (0.3) c | 4.6 (0.31) a | 2.4 (0.01) b | 65 (1.7) a | |
| 20–40 | GL | 54.2 (4.0) a | 9.5 (1.1) a | 5.6 (1.7) c | 11.2 (1.7) ab | 11.5 (2.5) a | 8.1 (2.5) a | 4.6 (0.02) b | 2.5 (0.01) b | 64 (5.1) a |
| CAO | 56.9 (2.2) a | 6.8 (3.8) ab | 8.0 (3.4) bc | 11.5 (0.7) ab | 8.0 (2.2) b | 8.9 (0.1) a | 4.8 (0.8) ab | 2.6 (0.06) b | 64 (2.1) a | |
| AAO | 62.2 (6.4) a | 6.6 (2.5) ab | 12.3 (1.3) b | 7.4 (4.4) a | 6.0 (2.2) b | 5.5 (4.1) a | 5.2 (0.19) a | 3.3 (0.11) a | 69 (1.7) a | |
| Clm | 42.0 (1.8) b | 9.7 (0.4) a | 16.1 (1.5) a | 13.6 (2.5) b | 11.6 (0.1) a | 7.0 (1.1) a | 5.2 (0.11) a | 3.1 (0.17) a | 51 (3.9) b | |
| Clw | 36.7 (3.2) c | 11.7 (3.4) a | 8.1 (0.2) b | 9.3 (3.3) b | 10.0 (1.9) a | 24.2 (7.7) b | 3.4 (0.07) c | 1.3 (0.01) c | 48 (6.6) b | |
| SGL | 59.1 (3.4) a | 4.8 (2.5) b | 8.2 (0.3) b | 6.1 (1.2) ab | 8.6 (0.2) b | 13.4 (0.8) b | 4.8 (0.11) ab | 2.5 (0.03) ab | 64 (0.9) a | |
| 40–60 | GL | 57.4 (0.2) b | 6.0 (4.0) b | 8.1 (1.3) b | 7.2 (3.9) a | 12.0 (0.3) a | 9.3 (1.7) a | 4.7 (0.11) b | 2.5 (0.04) c | 64 (3.8) b |
| CAO | 52.0 (7.8) b | 8.4 (0.2) b | 14.3 (2.1) a | 5.7 (1.2) a | 10.2 (1.6) b | 9.4 (2.7) ab | 5.1 (0.13) a | 2.9 (0.06) b | 60 (0.1) c | |
| AAO | 63.7 (1.8) a | 9.8 (1.9) a | 2.6 (1.6) c | 1.0 (0.5) a | 9.7 (2.7) b | 13.3 (0.7) a | 5.2 (0.08) a | 2.8 (0.11) b | 50 (2.3) d | |
| Clm | 36.8 (5.0) c | 12.9 (1.1) a | 9.6 (1.0) b | 11.2 (2.7) a | 5.2 (3.1) c | 24.3 (3.0) a | 3.5 (0.05) c | 1.4 (0.05) d | 50 (7.6) d | |
| Clw | 60.0 (1.4) a | 6.5 (1.0) b | 9.8 (1.7) b | 7.4 (0.3) a | 10.7 (0.4) b | 9.2 (0.7) b | 5.0 (0.05) a | 2.8 (0.04) b | 66.5 (3.9) b | |
| SGL | 60.5 (0.1) a | 11.9 (2.6) a | 8.3 (1.2) b | 7.8 (1.0) a | 3.3 (0.6) c | 8.2 (2.9) ab | 5.2 (0.12) a | 3.2 (0.05) a | 72 (2.5) a | |
The mean value of GL, CAO, AAO, Clm, Clw, SGL, WSA, MWD, and GMD in triplicate data with standard error is in the brackets. Different lowercase letters (a, b, c, d) indicate significant differences at p < 0.05 within a column.
Table 6.
Pearson’s correlation coefficients between soil aggregation parameters (size classes, DSA, WSA, MWD, and GMD), RB, and measured soil properties (SOC, EC, and BD).
Table 6.
Pearson’s correlation coefficients between soil aggregation parameters (size classes, DSA, WSA, MWD, and GMD), RB, and measured soil properties (SOC, EC, and BD).
| >5 | 5–2 | 2–1 | 1–0.5 | 0.5–0.25 | <0.25 | MWD | GMD | DSA | WSA | RB | SOC | BD | EC | |
|---|---|---|---|---|---|---|---|---|---|---|---|---|---|---|
| >5 | 1.00 | |||||||||||||
| 5–2 | −0.35 | 1.00 | ||||||||||||
| 2–1 | −0.43 | 0.64 ** | 1.00 | |||||||||||
| 1–0.5 | −0.66 ** | −0.34 | −0.08 | 1.00 | ||||||||||
| 0.5–0.25 | −0.67 ** | 0.05 | −0.09 | 0.44 | 1.00 | |||||||||
| <0.25 | −0.82 ** | −0.10 | 0.12 | 0.75 ** | 0.48 | 1.00 | ||||||||
| MWD | 0.59 ** | −0.39 | −0.12 | −0.39 | −0.39 | −0.41 | 1.00 | |||||||
| GMD | 0.55 ** | −0.32 | −0.04 | −0.43 | −0.32 | −0.42 | 0.95 ** | 1.00 | ||||||
| DSA | 0.87 ** | −0.48 | −0.84 ** | −0.91 ** | −0.95 ** | −0.74 ** | 0.94 ** | 0.97 ** | 1.00 | |||||
| WSA | 0.15 | 0.57 ** | −0.28 | 0.16 | 0.01 | 0.13 | 0.05 | 0.92 ** | 1.00 | 1.00 | ||||
| RB | 0.58 ** | 0.60 ** | 0.54 ** | 0.51* | 0.32 | 0.03 | 0.54 ** | −0.44 | −0.43 | −0.28 | 1.00 | |||
| SOC | −0.33 | 0.27 | 0.41 | 0.55 ** | 0.19 | −0.15 | −0.32 | −0.33 | −0.32 | −0.36 | 0.53 ** | 1.00 | ||
| BD | 0.54 ** | −0.48 | −0.46 | −0.44 | −0.39 | −0.21 | 0.52 * | 0.46 | 0.44 | 0.36 | −0.80 ** | −0.34 | 1.00 | |
| EC | 0.03 | −0.11 | 0.13 | 0.23 | 0.01 | −0.21 | 0.01 | 0.01 | −0.06 | 0.20 | −0.07 | 0.32 | 0.28 | 1.00 |
** Highly Significant = 0.01%; * Significant = 0.05%, probability level (2-tailed).
© 2017 by the authors. Licensee MDPI, Basel, Switzerland. This article is an open access article distributed under the terms and conditions of the Creative Commons Attribution (CC BY) license (http://creativecommons.org/licenses/by/4.0/).
Share and Cite
MDPI and ACS Style
Kalhoro, S.A.; Xu, X.; Chen, W.; Hua, R.; Raza, S.; Ding, K. Effects of Different Land-Use Systems on Soil Aggregates: A Case Study of the Loess Plateau (Northern China). Sustainability 2017, 9, 1349. https://doi.org/10.3390/su9081349
AMA Style
Kalhoro SA, Xu X, Chen W, Hua R, Raza S, Ding K. Effects of Different Land-Use Systems on Soil Aggregates: A Case Study of the Loess Plateau (Northern China). Sustainability. 2017; 9(8):1349. https://doi.org/10.3390/su9081349
Chicago/Turabian StyleKalhoro, Shahmir Ali, Xuexuan Xu, Wenyuan Chen, Rui Hua, Sajjad Raza, and Kang Ding. 2017. "Effects of Different Land-Use Systems on Soil Aggregates: A Case Study of the Loess Plateau (Northern China)" Sustainability 9, no. 8: 1349. https://doi.org/10.3390/su9081349
Note that from the first issue of 2016, this journal uses article numbers instead of page numbers. See further details here.