Spatiotemporal Decoupling between Population and Construction Land in Urban and Rural Hubei Province


1
School of Resource and Environmental Sciences, Wuhan University, Wuhan 430079, China
2
Key Laboratory of Geographic Information Systems, Ministry of Education, Wuhan University, Wuhan 430079, China
*
Author to whom correspondence should be addressed.
Sustainability 2017, 9(7), 1258; https://doi.org/10.3390/su9071258
Submission received: 4 June 2017
/
Revised: 7 July 2017
/
Accepted: 13 July 2017
/
Published: 18 July 2017
Abstract
:In urban and rural areas under rapid urbanization, a proper understanding of the relationship between population and construction land use is important for regional sustainable development. The decoupling method is a particularly useful way to examine this relationship. However, the decoupling method only considers the current relationship between population and construction land, ignoring the initial status in the base year. Based on an improved decoupling model, vector land-use data (1:10,000 scale) from two National Land Investigations, and demographic data from the China Statistics Bureau, this paper analyzes population and construction land use change patterns as well as the types of coupling in urban and rural Hubei. The results better reflect the relationship between population and construction land use. The outcomes show that from 2009 to 2014, both the urban population and urban construction land use increased while the rural population decreased as rural settlement land use expanded. In 61 counties, the relationship between the urban population and construction land use showed expansive negative decoupling; that is, the growth rate of urban population was less than the growth rate of the urban construction land use. In 72 counties, the relationship between the rural population and rural settlement land showed a strong negative decoupling; that is, the rural population decreased while the rural settlement land use increased. The relationship between the urban–rural population and construction land use can be divided into eight types. Only nine counties are somewhat coordinated, while the other counties were all uncoordinated. Suggestions are provided by comparing per capita urban construction land and per capita rural settlement land in the base and current years with the national standard and considering the coupling types for population and construction land use change in urban and rural settings. Finally, we discuss approaches to optimize urban–rural space organization and promote coordinated urban–rural development.
1. Introduction
With rapid economic development and population growth, urbanization has become a global phenomenon, especially in developing countries, such as China [1,2]. Urbanization has grown dramatically since the economic reforms and open-door policy of 1978 [3,4,5]. In China, over the period 1978–2014, the urbanization level (i.e., urban proportion of total population) increased from 17.92% to 54.77%, with an annual growth rate of 3.15% [6]. The number of cities increased from 193 to 653 [7]. The demand for urban land occurred gradually through rapid urbanization and industrialization [8]. The urban built-up area increased from 35,469.65 km2 in 2007 to 49,772.63 km2 in 2014 [7]. The supply of urban construction land has been decreasing, due to a very strict farmland protection system. However, with the rapid decrease of the rural population, the efficiency of rural settlement land utilization decreased and phenomena such as “one household, multiple housing lands”, and “hollow villages” became commonplace [9,10,11]. There is a great potential for rural land consolidation [12,13]. From 2007 to 2014, the rural population decreased from 714.96 million to 618.66 million [6], while the area of rural land increased from 138,991.87 km2 to 139,411.79 km2 [7]. In 2008, to effectively relieve the contradictions of built land in urban and rural areas, China’s Ministry of Land and Resources issued a document, “The management method for the pilot of increasing vs. decreasing balance of urban-rural built land.” In practice, some plots of rural construction land, which are reclaimed into arable land, and plots of urban land, which are planned to be used for urban development, consist of project area of “construct new while demolish the old” [14]. This ensures that the total area of land used for construction does not increase, prevents the quantity and quality of farmland from decreasing, and leads to rational land-use patterns.
In China, rapid urbanization and industrialization following high-speed economic development and population increases have greatly affected land-use change through urban sprawl and the increase of rural settlements [15,16]. On the one hand, since Chinese economy relies firmly on land inputs, and local governments have quickly expanded urban land [14]. A strange phenomenon exists: urbanization of land has increased faster than the urban population, which caused low urban population density [17]. On the other hand, many rural peasants have migrated, either temporarily or seasonally, from rural areas to cities in search of higher incomes and better living conditions [18]. Due to the urban–rural dual system, there is no perfect rural homestead exit mechanism. Farmers needed houses in the city but also had houses in rural areas. Moreover, as their incomes rose, they actively built new houses in the rural areas, expanding the rural settlement land [19]. Moreover, the expansion of construction land has encroached on productive cropland and waters, and has ultimately impacted food security, leading to ecological issues [15,20,21]. Analyzing the patterns of population and construction land changes in urban and rural areas, as well as their coupling relationship, is of great significance. This analysis helps to describe the rationality of urbanization and promotes the coordinated development of urban and rural areas.
The relationship between population and land use changes is a hot topic among scholars. The demand for space for human settlements is the original driver of urban expansion. For example, Turner et al. (1995) discovered that demographic factors such as population size or density would be likely determinants of land use [22]. López et al. (2001) demonstrated that a linear regression between the urban area and population growth offered a more robust approach to predict urban growth in the City of Morelia, Mexico [23]. Li et al. (2003) found that the internal driver of urban expansion is population density and that economy is an external driver of urban expansion [24]. Xiao (1997) constructed the urban expansion coefficient index to evaluate the relationship between the urban area and population growth [25]. Chen et al. (2014) explored the relationship between rural out-migration and land use change in China [18]. A particularly useful way to examine the relationship between population and construction land is by viewing it within the framework of decoupling. The OECD (2001) set up the decoupling index to measure the decoupling of environmental pressure from economic growth [26]. Tapio (2005) improved the decoupling index to analyze the relationship between GDP, traffic volumes and CO2 emissions in the EU [27]. Chen et al. (2006) introduced the decoupling method to land use research and analyzed the correlations between farmland occupation and GDP growth [28]. Li et al. (2008) used the decoupling method to analyze the forms of decoupling of urban and rural construction land changes in China, assuming that the urban population would continue to increase while the rural population declined through urbanization [29]. Song et al. (2014) evaluated the decoupling status between the rural settlement area and rural population in China [30]. Wang et al. (2014) analyzed the relationship between population and residential land changes in urban and rural China [31]. Shi et al. (2016) analyzed the spatiotemporal changes in rural settlement land and the rural population in the Middle Basin of the Heihe River in China [19]. However, there are still many shortcomings in current studies: with respect to the study scale and research content, most studies pay more attention to the national scale and only mainly analyze urban construction or rural residential land. Studies involving a systematic analysis of the changes in urban–rural system elements at the provincial scale are relatively weak. For data sources, land use data are always taken from the statistics yearbook, which is inaccurate. As for the research method, the decoupling method only considers the coordination status between population and construction land, ignoring the initial status in the base year. This paper improves the decoupling method, with the result better reflecting the relationship between the population and construction land. Finally, suggestions are made by comparing per capita urban construction land and per capita rural settlement land in the base and current years with the national standard and considering the coupling types for population and construction land use changes in urban and rural settings. This paper not only takes into account whether the utilization of construction land complies with the requirements of the new national urbanization policy for a single year but also considers the dynamic coordination relationship, making reliable and targeted suggestions.
Hubei Province is a traditional agricultural province and plays an important part in the national production of commodity grains. However, with rapid urbanization and industrialization, the use of cultivated land for purposes other than food production has gradually increased. It is important to effectively resolve the contradictions of built land in urban and rural areas while guaranteeing economic development, protecting arable land and coordinating urban–rural land allocation. The topics addressed by this paper are as follows: (1) the patterns of urban–rural construction land change; (2) the patterns of urban–rural population change; (3) the coupling types of population and construction land use changes in urban and rural areas as well as corresponding suggestions; and (4) the approaches to coordinating the relationship between population and construction land in urban and rural areas.
2. Materials and Methods
2.1. Study Area
Located in Central China and the middle reaches of the Changjiang (Yangtze) River, Hubei Province covers an area of 185,900 km2 and is within 108°21′–116°07′ E and 29°05′–33°20′ N (Figure 1). The eastern, western and northern areas of Hubei Province are surrounded by mountains, and the Jianghan Plain is located in the central and southern area, which is commonly known as “a land of rice and fish”. The province has a dense hydrological network, and its water resources are abundant. Hubei Province includes 13 prefecture-level cities and 103 counties.
With rapid urbanization, over 1981–2014, the gross domestic product (GDP) in Hubei Province increased from 21.98 to 2737.92 billion yuan. While primary industry increased slowly, the growth trend of secondary and tertiary industries was similar to that of the GDP. From 1981–2014, the total population increased from 47.40 to 58.16 million. Within this change, the urban population continued to increase, while the rural population fluctuated by approximately 39 million during 1981–1999, and subsequently decreased. From 2009 to 2014, the total construction land area increased yearly, with urban construction land growing rapidly and rural areas increasing slowly as cultivated land decreased in area (Figure 2). Overall, the economic, construction land use and population changes are out of sync.
In 2014, the urban construction area of Hubei Province was 4240.27 km2, accounting for 2.28% of the total land and 32.96% of the urban–rural construction land. The urban population was 32.38 million people, accounting for 55.68% of the total population. The per capita urban construction land was 130.93 m2, which is higher than the 110 m2 national standard “Code for classification of urban land use and planning standards of development land” (GB50137-2011). The rural settlement land of Hubei was 8623.02 km2, accounting for 4.64% of the total land and 67.04% of the urban–rural construction land. The rural population was 25.78 million people, accounting for 44.32% of the total population. The per capita rural settlement land was 334.55 m2, which is much higher than the 150 m2 national standard “Standard for planning of rural villaged and town” (GB50188-93). This indicates that the relationship between population and construction land is out of sync and that construction land is being used at a low level of efficiency. There is great potential for land consolidation.
2.2. Data Sources
The construction data for 2009 and 2014 were extracted from two land use land cover (LULC) vector format maps at a 1:10,000 scale, which was derived from the second national land survey and the subsequent land use change survey by the Department of Land and Resources of China. The government participation, a strict verification system, and sufficient financial support ensured the most systematic, accurate, comparable, and coherent land use data. The smallest construction area of map in land use survey is 4 mm2, while that in land use planning is 20 mm2. The results of the two surveys are more accurate and reliable for this study. Construction land includes urban construction and rural construction land. Urban construction land is subdivided into three types: city, town and industry/mining land. Rural construction land refers to rural settlement land in this paper. Taking into account the availability of data and the feasibility of the analysis, some counties are merged, such as the downtown of Wuhan, Huangshi, Yichang, among others. Thus, the administrative region is divided into 85 regional units. The social, economic and demographic data were derived from the Hubei Statistical Yearbook and the China Statistical Yearbook, from 2009 to 2014.
2.3. Method
To ascertain the status and degree of decoupling, we used Tapio’s model (2005) [27], which can be expressed in terms of elasticity values, as shown in Equation (1):
In Equation (1), α is the elasticity values of population and construction; and are the construction land areas in the current year and the base year, respectively; and and are the population numbers for the current year and base year, respectively.
According to Tapio’s model, eight types can be distinguished (Figure 3). The rate of change in population and construction land area can exhibit a decoupling, negative decoupling or coupling relationship. Decoupling can be further divided into three subcategories: weak decoupling, with the population and construction land area both increasing (and 0 < α < 0.8); strong decoupling, which occurs when the population grows while the construction land area decreases (and α < 0); and recessive decoupling, which occurs when the population and construction land area both decrease (and α > 1.2). Similarly, negative decoupling includes three subcategories: expansive negative decoupling, in which the population and construction land area both increase (and α > 1.2); strong negative decoupling, in which the population decreases while the construction land area increases (and α < 0); and weak negative decoupling, in which both variables decrease (and 0 < α < 0.8). To avoid over-interpreting slight changes as significant, a ±20% variation of the elasticity values around 1.0 are here still regarded as coupling. Thus, coupling is defined as the elasticity values where 0.8 < α < 1.2.
However, due to policy-driven effects and the scale effects of economic activity, some regions may adopt development strategies, such as expanding construction areas prior to population growth, resulting in a decoupling phenomenon between population growth and land growth. Tapio’s model only considers the coordination status between population and construction land, which ignores the strategy of making expansion a priority. This may affect the coordination status between the population and land during a certain period of time. Therefore, we improved the formula. After the calculation using Equation (1), if α is in the first and second quadrants, the β value is calculated according to Equation (2) as a modified elasticity coefficient. If α is in the third and fourth quadrants, β is calculated according to Equation (3).
In Equations (2) and (3), is the revised elasticity values of the population and construction land area, is the initial elasticity values of the population and construction land area, is per capita urban construction land or per capita rural settlement land in the base year, and is the national standard of per capita urban construction land (110 m2) or the national standard of per capita rural settlement land (150 m2).
3. Results
3.1. Changes in Urban–Rural Construction Land
During 2009–2014, urban–rural construction land use in Hubei changed significantly (Table 1). All types of construction land use show a growth trend, and the growth rate of urban construction land is much higher than that of rural construction land. As for the variations within urban construction land, towns increased the fastest, followed by cities, and industry/mining land increased slowly. From 2009 to 2014, the inner structural variation of urban construction land (i.e., city to town to industry/mining land) changed by a proportion of 3.12:2.97:1 to 3.93:4.26:1. Rural settlement land increased slowly, with an average annual growth of 0.37%. Figure 4 shows the landscape pattern change of urban–rural construction land during the study period. As shown in Table 1 and Figure 4, the distribution of urban construction land is concentrated, while that of rural settlement land is scattered. The absolute quantity of construction land change was relatively small, and the variation ratio was obvious.
Using the natural breaks method of ArcGIS, we classified the total construction land area, urban construction area and rural settlement area of Hubei Province for 2014 into three grades (Figure 5). Overall, the construction area in the central and eastern parts of Hubei Province was significantly larger than that of the western region. The urban construction land concentrated in the Wuhan metropolitan area, and the urban construction area of downtown Wuhan was 432.26 km2, which was the largest. The rural settlement land in the central zone was the largest, followed by the eastern land, and the western land was the lowest.
From 2009 to 2014, the construction land area of all counties increased except for one county in Shiyan, and, in 11 counties, the construction land area growth rate was higher than 20%. The urban construction land area of all counties increased except for a county in Enshi, and the growth rate of the construction land area in 12 counties was higher than 50%. The rural settlement land decreased in 10 counties, while that of the other counties increased. The growth rate of rural settlement land in Shennongjia, downtown Yichang, downtown Huangshi, and a county in Wuhan were higher than 10%.
3.2. Changes in Population
The population change in Hubei Province from 2009–2014 is shown in Table 2 and Figure 5. Based on the large baseline population and positive natural growth rate, the total population increased by 922,300, with an annual growth rate of 0.32%. The urban population growth rate was 13.85%, while the rural population reduction rate was 10.48%. This was due to many rural peasants migrating to the cities in search of a higher income and better living conditions because of rapid urbanization and industrialization.
Using the natural breaks method of ArcGIS, we classified the total population and rural population of Hubei Province in 2014 into four grades. According to the “Notice on Adjusting the Standard of Urban Scale (2014)”, the urban population was classified into four grades (Figure 5). Overall, the total population of the eastern region was significantly larger than that of the western region. In most counties (73 of all 85), the urban population was less than 500,000. The urban population of the downtown areas of Jingzhou, Yichang, Shiyan, Huangshi and Xiaogan, as well as Ezhou, Tianmen, Xiantao and a county in Xiaogan, was between 500–1000 thousand persons. The urban population in downtown of Wuhan was 6,332,400, which was the largest. In 2014, the rural population of the eastern region was significantly larger than that of the western region.
The total population of most counties (63 of all 85) showed a growth trend, and two counties in Wuhan grew the fastest, with a growth rate higher than 10%. The urban population of all counties showed a growth trend. The rural population of all counties decreased, except for one county in Wuhan and Shiyan, and in 42 counties, the rural population reduction ratio was higher than 10%.
3.3. Decoupling States Compared across Time and Space
3.3.1. Spatiotemporal Decoupling between the Total Population and the Construction Land Area
From 2009 to 2014, the relationship between the total population and construction land showed expansive negative decoupling, with an elasticity of 6.24. The total population increased by 1.61%, while the construction land area increased by 10.05%, indicating that the growth rate of population was less than the growth rate of construction land area.
The relationship between the total population and construction land could be divided into four types: recessive decoupling (1 of all 85 counties), strong negative decoupling (21 of all 85 counties), expansive negative decoupling (62 of all 85 counties) and weak decoupling (1 of all 85 counties) (Figure 6). The total population of most counties (63 of all 85 counties) showed a growth trend, while the construction land area decreased in only one county. In 63 counties, both the population and construction land increased. Sixty-two counties showed expansion negative decoupling, that is, the growth rate of total population was less than the growth rate of the construction land. A county in Huanggang exhibited a weak decoupling state, in which the growth rate of total population was faster than the growth rate of the construction land. The 21 counties with strong negative decoupling were mainly distributed in Huangshi, Tianmen, Xiantao, Jingmen and Yichang, in which the total population decreased as construction land increased. A county in Shiyan was in a state of recessive decoupling, in which the rate of reduction of the total population was less than the rate of reduction of construction land.
3.3.2. Spatiotemporal Decoupling between the Urban Population and the Urban Construction Land Area
At the provincial level, during 2009–2014, the changes in urban population and urban construction land showed expansive negative decoupling, with an elasticity α of 2.29. In 2014, the per capita urban construction land area was 146.61 m2 in Hubei Province, which exceeded the 110 m2 national standard. From 2009 to 2014, the urban population increased by 13.85%, while the urban construction land area increased by 31.68%, indicating the emergence of an expansive negative decoupling between them. This indicates that the pace of population urbanization was obviously slower than land urbanization, leading to the extensive and low-efficiency use of urban land.
The number of counties belonging to each category during this period was as follows: expansive negative decoupling (59 of all 85 counties), expansive coupling (10 of all 85 counties), weak decoupling (15 of all 85 counties) and strong decoupling (1 of all 85 counties) (Figure 6). The urban population of all of the counties showed a growth trend, whereas urban construction land decreased in only one county. The urban population and urban construction land of 84 counties both increased. Among them, approximately 59 counties of all counties displayed expansive negative decoupling, that is, the growth rate of the urban population was less than the growth rate of urban construction land. Ten counties were in a state of expansive coupling, where the growth rate of the urban population was similar to the growth rate of urban construction land. The 15 counties with weak decoupling states were mostly distributed in Enshi, Suizhou and Huanggang, where the growth rate of the urban population was faster than the growth rate of urban construction land. A county in Enshi displayed strong decoupling, where the urban population increased as urban construction land decreased.
The revised relationship between the urban population and urban construction land could be divided into four types: expansive negative decoupling (61 of all 85 counties), expansive coupling (11 of all 85 counties), weak decoupling (12 of all 85 counties) and strong decoupling (1 of all 85 counties). Ten counties changed types (Figure 7). Both Suizhou and Huanggang had a county that converted from weak decoupling to expansive coupling. The per capita urban construction land of the two counties in 2009 was 173.03 m2 and 137.78 m2, respectively, which exceeded the national standard. During 2009–2014, the growth rate of the urban population was higher than the growth rate of urban construction land, which made the per capita urban construction land appear to be reasonable. Wuhan, Shiyan and Huanggang each had a county that shifted from expansive negative decoupling to expansive coupling. The per capita urban construction land of the three counties in 2009 was 62.86 m2, 65.31 m2 and 88.10 m2, respectively, which was lower than the national standard. During these five years, the growth rate of the urban population was lower than the growth rate of urban construction land, which made the per capita urban construction land appear to be reasonable. A county in Huangshi converted from weak decoupling to expansive negative decoupling. The per capita urban construction land of this county was 212.05 m2 in 2009, which was higher than the national standard. However, the urban construction land continued to grow during the five years. Controlling the urban expansion in this county is urgent. Two counties in Wuhan and one in Jingzhou and Huanggang, respectively, shifted from expansive decoupling to expansive negative coupling. Although the growth rate of the urban population and urban construction land was more appropriate, the lowest per capita urban construction land of these counties was 186.12 m2 in 2009, which was in considerable excess of the national standard. If allowed to continue, a surplus of urban construction land would continue to exist and would ultimately cause extensive and low-efficiency use of urban construction land. It is important that the urban expansion in this county be controlled.
3.3.3. Spatiotemporal Decoupling between the Rural Population and Rural Settlement Land Area
From 2009 to 2014, at the provincial level, the relationship between the rural population and rural settlement land was strongly negatively decoupled, with an elasticity α of −0.18. The rural population decreased by 10.48%, while the rural settlement land increased by 1.91%, showing the emergence of a strong negative decoupling between them.
The number of counties belonging to each category during this period was as follows: weak negative decoupling (10 of all 84 counties), strong negative decoupling (72 of all 84 counties), expansive negative decoupling (1 of all 84 counties) and weak decoupling (1 of all 84 counties) (Figure 6). Except for two counties that increased, the rural population of all of the counties showed a declining trend. The rural settlement land decreased in 10 counties, while the other counties increased. Most counties (72 of all 84) displayed strong negative decoupling, in which the rural population decreased while the rural settlement land increased. Ten counties were in a state of week negative decoupling, that is, the rate of decline in rural population was faster than the rate of decline of the rural settlement land. A county in Shiyan displayed expansive negative decoupling, in which the growth rate of the rural population was less than the growth rate of the rural settlement land. A county in Wuhan showed a weak decoupling state, in which the growth rate of the rural population was faster than the growth rate of the rural settlement land. That is, in most of the counties in Hubei Province, the change in rural settlement land was not in sync with the change in the rural population.
After the revision, the relationship between the rural population and rural settlements land did not change. Most counties (72 of all 84) displayed strong negative decoupling, and the adjustment had no effect on this type. While the values of localities within other types were adjusted, they did not reach the level of the changing type.
3.3.4. The Coordination Relationship of the Urban–Rural Population and Construction Land Change and Classification
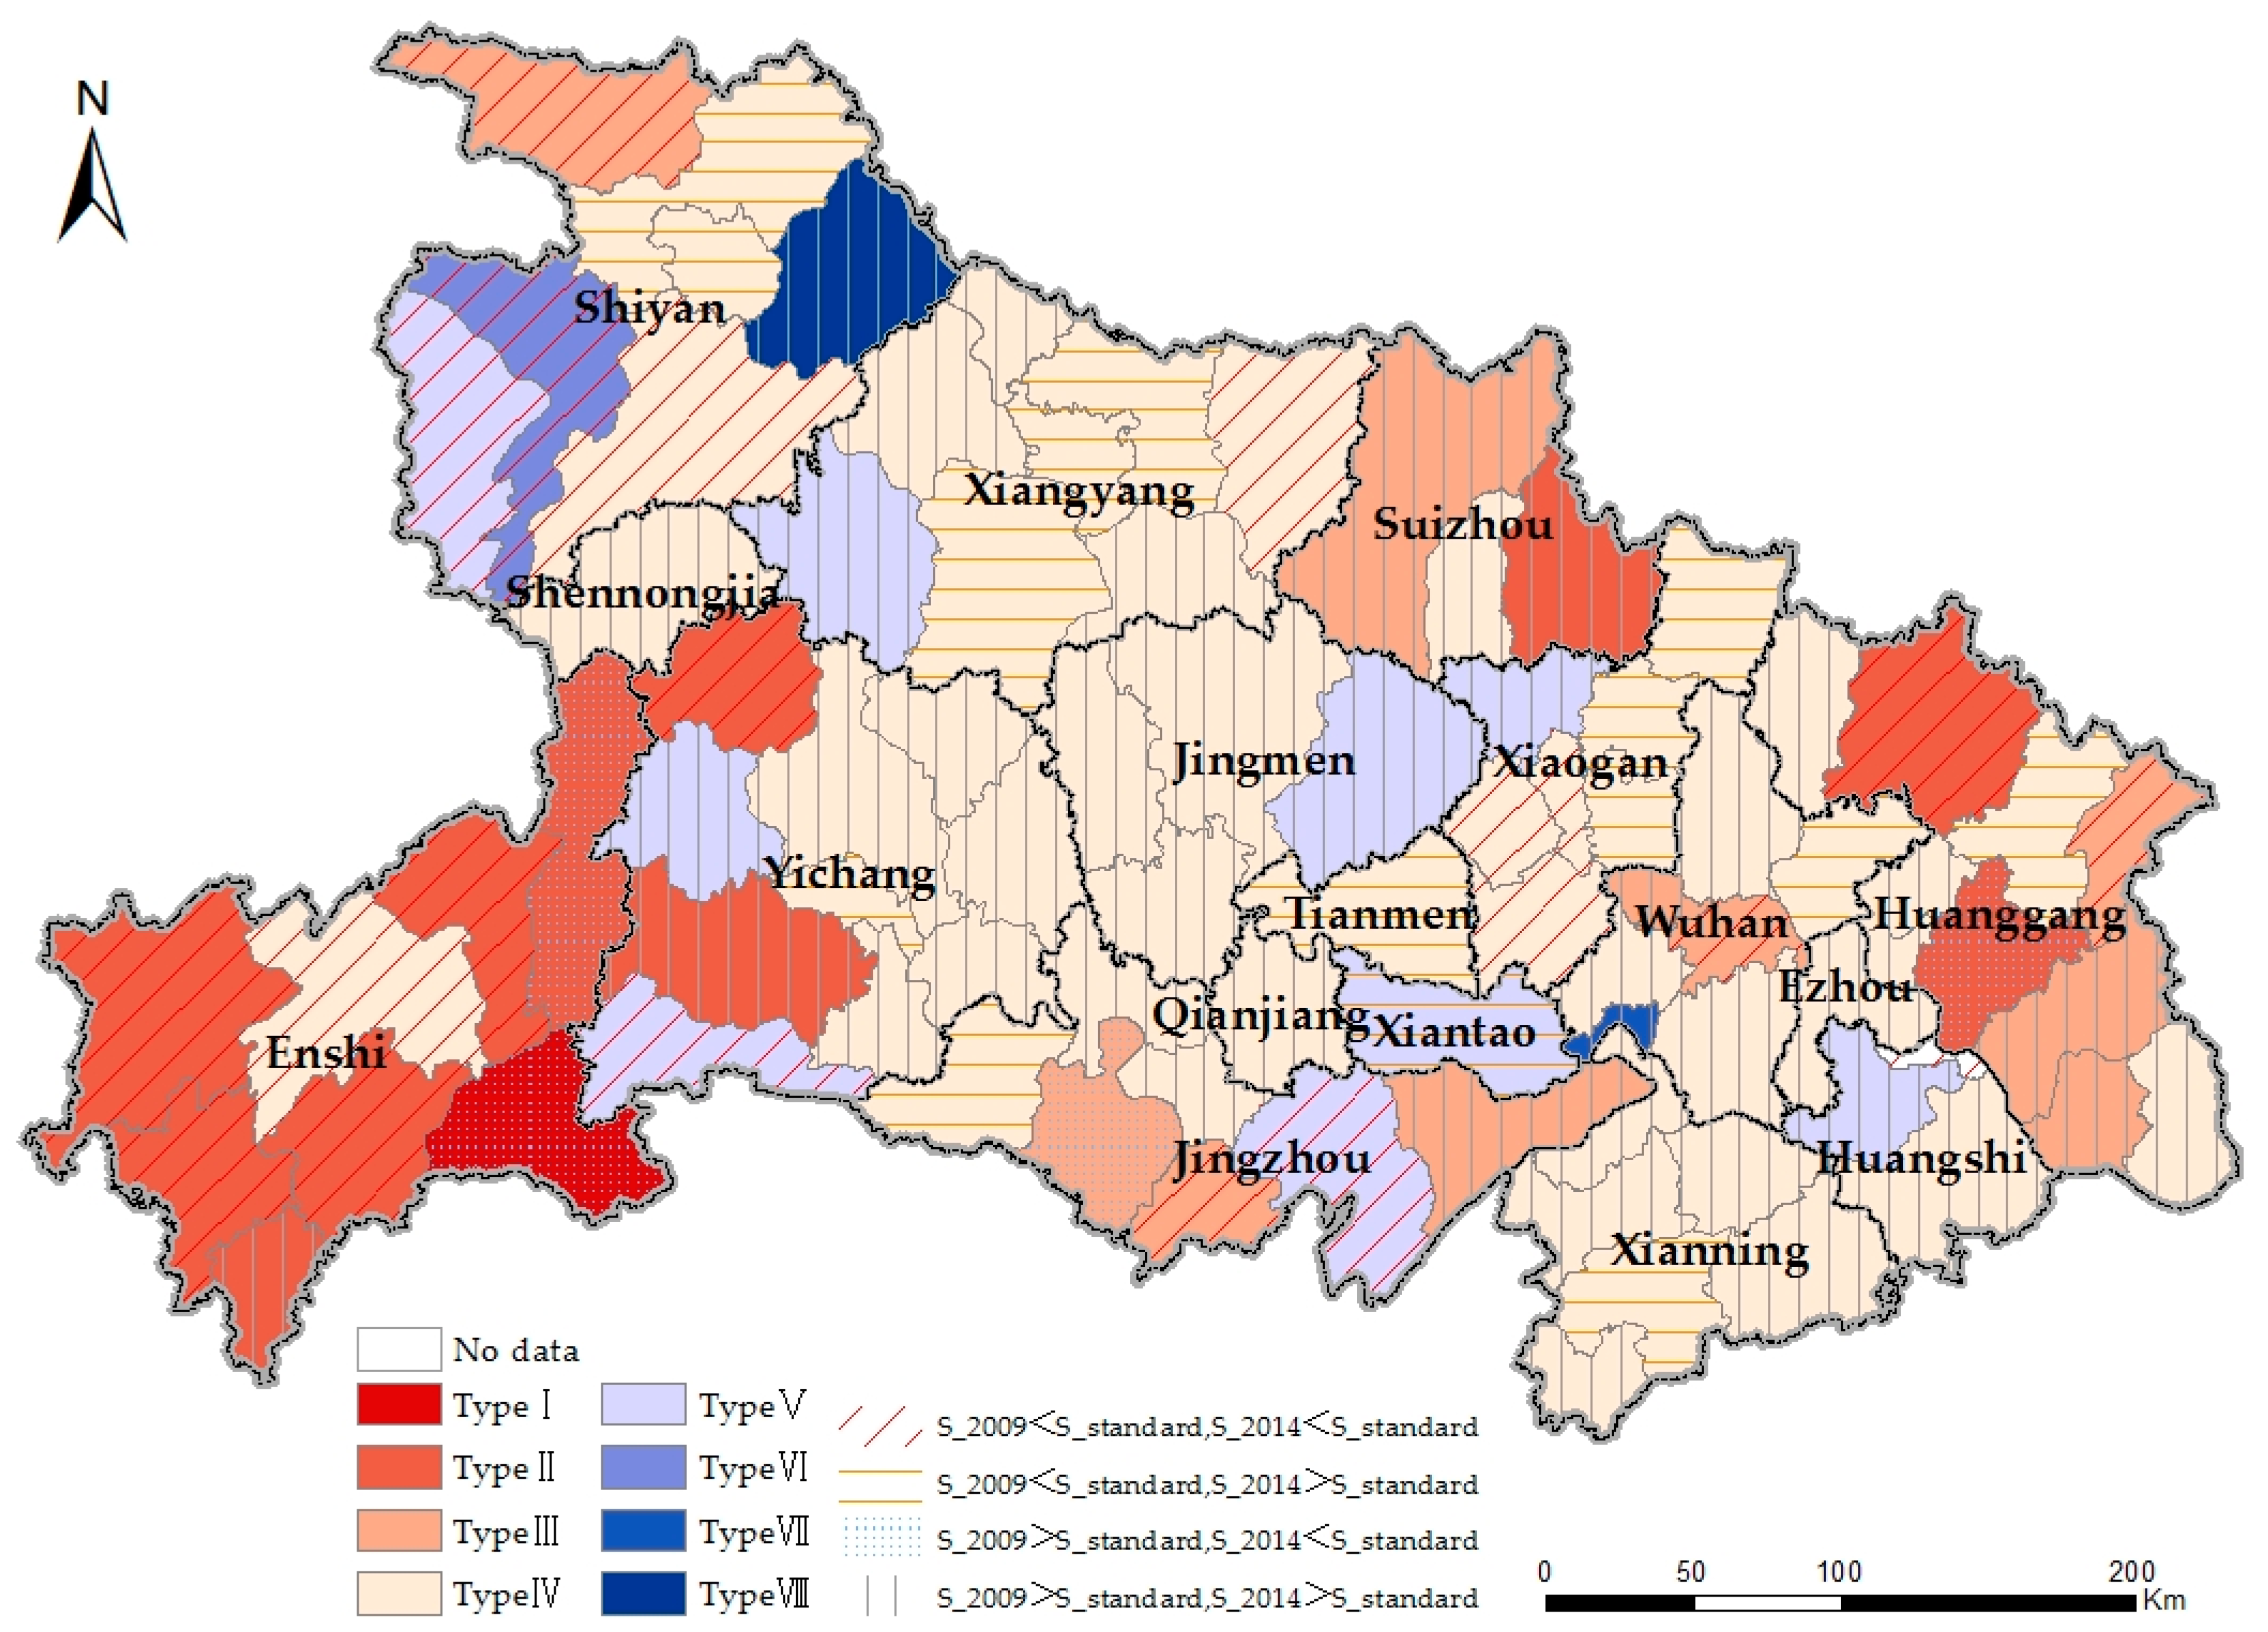
To analyze the relationship between the urban–rural population and construction land, we combined the coupling types of population and land change in urban and rural areas. They were divided into eight types (Table 3 and Figure 8). The main types were Type II to Type V; only one county each belonged to Type I, Type VI, Type VII, and Type VIII. As the per capita rural settlement land in 2009 and 2014 were both higher than the national standard, we distinguished the subtypes based on a comparison of the per capita urban construction land with the national standards. The result indicated that there were 8 types and 16 subtypes, and corresponding suggestions for each were then put forward.
Type I: Strong decoupling in urban land and strong negative decoupling in rural land. This type has the following characteristics: an increase in the urban population, a decrease in urban construction land, a decrease in the rural population and an increase in rural settlement land. A county in Enshi belonged to this type, and its per capita urban construction land was higher than the national standard in 2009, but lower than the national standard in 2014. The per capita rural settlement land was higher than the national standard in both 2009 and 2014. The relationship between the urban–rural population and construction land in this county had been decoupling significantly. For the future, the approval of urban construction land should be relaxed. In addition, it is suggested to strictly control the land expansion of rural settlement, prevent the loss of rural population and strengthen the rural residential land consolidation.
Type II: Weak decoupling in urban land and strong negative decoupling in rural land. This type has the following characteristics: an increase in the urban population, a decrease in the rural population, and an increase in both urban construction land and rural settlement land. The growth rate of the urban population is faster than the growth rate of urban construction land. There were 11 counties, situated in Enshi, Suizhou and Huanggang, which belonged to this type. This type was divided into three subtypes: II-1 (six counties): The per capita urban construction land was lower than the national standard in both 2009 and 2014. II-2 (two counties): The per capita urban land area was higher than the national standard in 2009, but lower than the national standard in 2014. It is suggested that the approval of urban construction land should be appropriately relaxed for the two types. II-3 (three counties): The per capita urban construction land was higher than the national standard in both 2009 and 2014, and it is suggested that the urban expansion should be appropriately controlled and the stock construction land should be actively revitalized.
Type III: Expansive coupling in urban land and strong negative decoupling in rural land. This type has the following characteristics: an increase in the urban population, a decrease in the rural population, and an increase in both urban construction land and rural settlement land. The growth rate of the urban population was similar to the growth rate of the urban construction land. This type included ten counties distributed in Wuhan, Jingzhou, Huanggang and Jingmen. Among them, three counties converted from expansive negative decoupling, and two were converted from weak decoupling. This type was divided into three subtypes: III-1 (four counties): The per capita urban construction land was lower than the national standard in both 2009 and 2014, and it is suggested that the approval of urban construction land should be appropriately relaxed. III-2 (five counties): The per capita urban land area was higher than the national standard in both 2009 and 2014, and it is suggested that the urban expansion should be controlled. III-3 (one counties): The per capita urban construction land was higher than the national standard, but lower than the national standard in 2014, and it is suggested that the approval of urban construction land should be appropriately relaxed.
Type IV: Expansive negative decoupling in urban land and strong negative decoupling in rural land. The characteristics of this type include: an increase in the urban population, a decrease in the rural population, and an increase in both urban construction land and rural settlement land. The growth rate of the urban population was lower than that of urban construction land. This was the main type in Hubei Province, and there were 50 counties that belong to it. Among them, four counties were converted from expansive coupling, and one county was converted from weak decoupling. This type was divided into three subtypes: IV-1 (six counties): The per capita urban construction land was lower than the national standard in both 2009 and 2014, and it is suggested that the relationship between urban expansion and population growth should stay the same. IV-2 (14 counties): The per capita urban construction land was lower than the national standard in 2009, but higher than the national standard in 2014. IV-3 (30 counties): The per capita urban construction land was higher than the national standard in both 2009 and 2014. The suggestions for the latter two types are to strictly control the expansion of urban construction land, and to actively revitalize the stock of construction land.
Type I–IV of the rural settlement land displayed strong negative decoupling, and the per capita rural settlement land was much higher than the national standard. The utilization of the rural settlement land was of low efficiency. This indicates that the relationship between the rural population and rural settlement land was asynchronous. It is imperative to strictly control the expansion of rural settlement land, prevent the loss of rural population and strengthen the rural residential land consolidation.
Type V: Expansive negative decoupling in urban land and weak negative decoupling in rural land. This type has the following characteristics: an increase in both the urban population and urban construction land, and the growth rate of the urban population is lower than that of urban construction land. There was also a decrease in both the rural population and rural settlement land, and the rate of reduction of the rural population was higher than that of the rural settlement land. Nine counties belonged to this type, which, while in a more reasonable status than those mentioned above, were not in the ideal situation. This type was divided into three subtypes: V-1 (three counties): Per capita urban construction land was lower than the national standard in both 2009 and 2014, and it is suggested that the relationship between urban expansion and population growth stays the same. V-2 (one county): The per capita urban construction land was lower than the national standard in 2009, but higher than the national standard in 2014. V-3 (five counties): The per capita urban land area was higher than the national standard in both 2009 and 2014. It is suggested that a more strictly land approval system should be applied to prevent the uncontrolled urban sprawl for the latter two types. For Type V, in all of the counties, the per capita rural settlement land was higher than the national standard in 2009. Though there was a reduction in rural area, the rate of decrease of rural settlement land was lower than the rate of decrease in the rural population, with the per capita rural settlement land in 2014 being much higher than the national standard. It is suggested that the decreasing trend of rural settlement land should continue, and strengthen the rural settlements land consolidation.
Type VI: Weak decoupling in urban land and weak negative decoupling in rural land. This type has the following characteristics: an increase in both the urban population and urban construction land, with the growth rate of the urban population being higher than that of urban construction land. There was a decrease in both rural population and rural settlement land, and the rate of reduction of the rural population was higher than that of rural settlement land. A county in Enshi was of this type, where the per capita urban construction land was 76.08 m2 in 2009 and 64.05 m2 in 2014, lower than the national standard. The per capita rural settlement land was 248.65 m2 in 2009, and 271.03 m2 in 2014, higher than the national standard. In the future, the approval of urban construction land should be appropriately relaxed. In addition, the declining trend of rural settlement land should continue and strengthen the rural settlements land consolidation.
Type VII: Expansive negative decoupling in urban land and weak decoupling in rural land. This type has the following characteristics: an increase in both the urban population and urban construction land, and the growth rate of the urban population is lower than that of urban construction land. There was an increase in both the rural population and rural settlement land, and the growth rate of rural population was higher than that of the rural settlement land. A county in Wuhan was of this type, where the per capita urban construction land was 277.54 m2 in 2009 and 334.89 m2 in 2014, much higher than the national standard. The per capita rural settlement land was 220.14 m2 in 2009 and 213.42 m2 in 2014, higher than the national standard. It is suggested that a stricter land approval system should be adopted to prevent the uncontrolled urban sprawl. In addition, it is necessary to reduce the growth rate of rural settlement land and strengthen the rural settlements land consolidation.
Type VIII: Expansive negative decoupling in urban land and expansive negative decoupling in rural land. This type has the following characteristics: an increase in both the urban population and urban construction land, with the growth rate of the urban population being lower than that of urban construction land. There was an increase in both the rural population and rural settlement land, with the growth rate of the rural population being lower than the growth rate of rural settlement land. A county in Shiyan was of this type, where the per capita urban construction land was 175.44 m2 in 2009 and 240.48 m2 in 2014, much higher than the national standard. The per capita rural settlement land was 225.48 m2 in 2009 and 245.75 m2 in 2014, far beyond the national standard. It is suggested that a stricter land approval system should be adopted to control the expansion of urban–rural construction land.
4. Discussion
4.1. Dynamic Allocation of New Construction Land Use Indicators
Construction land is a special way of land use and it is irreversible if other types of land use transformed to construction land. In China, the management of the allocation of new construction land use indicators was through general land use planning and annual land use planning, which was taken a “top-down” planning mode [32]. The new construction land indicators are usually subdivided by land demand indicators, such as GDP, population, among others. The allocation of construction land use indicators under strong administrative intervention is often a kind of interest game between local government and their superior government, which ignore the human-oriented land demand. Thus, this phenomenon exists. The construction land indicators are serious shortage in some areas and the contradiction between land supply and demand is prominent, which caused the increase of illegal land use. Meanwhile, the construction land indicators are relatively comfortable in some areas and land maybe used to replace other production factors, which resulted in low efficient utilization of land resources. The application period of land use planning is 15 years, and the regional allocation of land use indicators is a prearranged planning. From the perspective of dynamic planning, the rapid socio-economic development and population mobility increase the difficulty of rational allocation of land use indicators [33]. The dynamic coupling relationship between population and construction land should be taken into account in the regional allocation of land use indicators. According to this relationship, the indicators are allocated during the planning period, which consider the regional balance.
4.2. From “Increasing vs. Decreasing Balance” to “Population Land Hook”
Due to the urban–rural dual system, the gap between urban and rural development in China is widening. The urban–rural inequalities based on the dual household registration system, such as education, employment, housing, health care, social security and so on, harms social fairness and justice, affecting the sustainable development of the economy and social stability [34,35,36]. From 1978 to 2014, the income gap between rural and urban residents increased from 2.57:1 to 2.97:1 [6]. Farmers are disadvantaged by the disparity between artificially low prices for agricultural products and the high cost of industrial goods [37]. Urban–rural income differences and employment opportunities are the main reasons for the flow of rural population to the city. However, a large amount of rural peasants migrated to cities during urbanization. There are no regulations or laws stipulating how residential land should be properly disposed when the house occupant migrates out of the village, either temporally or permanently [14]. This caused the phenomenon of an increase in rural settlement land, with a reduction of rural population, resulting in a waste of land resources. Thus, the hukou system should be reformed to make rural migrants completely settle in cities, while land laws should also be improved to bring rural houses into the land market [14]. The perfect homestead exit mechanism has contributed to the land supply, improved the utilization of rural settlement land, and constrained unordered expansion. Rural homestead exit should be fully aware of the willingness of farmers and pay more attention to recovering compensation, such that farmers’ compensation is greater than, or at least not less than, the retention of homestead welfare. This is imperative to improve a diversified rural housing security system [38].
To relieve the contradictions of built land in urban and rural areas, the Chinese government issues some policies, such as “increasing vs. decreasing balance” and “population land hook”. The latter is the expansion and extension of the former. It emphasizes that the increase in urban construction land should be linked to the decrease in rural settlement land. Additionally, the increase in urban construction land should be linked to the population that the city absorbs from rural areas and other cities [39]. The new policy should pay more attention to the balance between land and population. In 2012, to support the balanced development of different regions within the country, China’s State Council officially approved the “Planning for a Central Plains Economic Zone (2012–2020)”. In the plan, it is suggested that some pilot cities be selected to explore the new policy in Henan Province and then expand to other areas of the Central Plains Economic Zone. At present, the two policies have been proposed and allowed to take effect in some areas [40]. Analyzing the relationship of population and construction land change in urban and rural areas could serve as a useful reference for the implication of the “population land hook” policy.
4.3. Priorities in Further Study
Based on an improved decoupling model, this paper systematically analyses the coupling relationship between population and construction land in urban and rural area. This study could provide the basis for construction land intensive use and rational allocation of construction land use indicators. However, there are still improvements for further study. First, the coupling relationship between population and construction land in different temporal dimension could represent different pattern. This paper only analyses the relationship from 2009–2014, which has some limitations. It could be better to reflect the dynamic relationship if we add the time series data during the study. Second, the population mobility was less considered. Further study should focus on the patterns of population mobility between urban and rural areas, the relationship between resident population and registered population, which effectively improve the applicability and accuracy of the proposed method.
5. Conclusions
Rapid urbanization has had a significant influence on the relationship between population and land in Hubei Province. This paper analyzed the urban–rural population and construction land changes of Hubei from 2009 to 2014, as well as the relationship between urban–rural population and construction land, by using the improved decoupling model. The results show that the construction land area increased significantly and that the growth rate of urban construction land was much greater than that of rural construction land during the five years. The urban population and construction land both increased while the rural population decreased as rural settlement land increased. In most counties (71.76%), the growth rate of urban population was less than the growth rate of urban construction land. In 85.71% of counties, the rural population decreased while the rural settlement land increased. The relationship between urban–rural population and construction land was divided into eight types, but only nine counties were relatively synchronous, while the rest were all uncoordinated.
The results of the study provided valuable information for planners, officials, and developers. It helps to manage the dynamic allocation of construction land use and provide references for the implication of the “population land hook” policy. Adding time series data and paying more attention to the population mobility in a future study are suggested.
Acknowledgments
The study was supported by the National Natural Science Foundation of China (No. 41401196).
Author Contributions
Chengcheng Wang and Xuesong Kong conceived and designed the experiments; Yanfang Liu and Jiwei Li helped in data analysis; and Chengcheng Wang and Xuesong Kong wrote the paper.
Conflicts of Interest
The authors declare no conflict of interest.
References
- Bai, X.; Shi, P.; Liu, Y. Realizing China’s urban dream. Nature 2014, 509, 158–160. [Google Scholar] [CrossRef] [PubMed]
- Liu, Y.; Wang, L.; Long, H. Spatio-temporal analysis of land-use conversion in the eastern coastal China during 1996–2005. J. Geogr. Sci. 2008, 18, 274–282. [Google Scholar] [CrossRef]
- Deng, X.; Huang, J.; Rozelle, S.; Uchida, E. Growth, population and industrialization, and urban land expansion of China. J. Urban Econ. 2008, 63, 96–115. [Google Scholar] [CrossRef]
- Liu, J.; Zhan, J.; Deng, X. Spatio-temporal Patterns and Driving Forces of Urban Land Expansion in China during the Economic Reform Era. Ambio 2005, 34, 450–455. [Google Scholar] [CrossRef] [PubMed]
- Chan, K.W. Urbanization and Rural-Urban Migration in China since 1982: A New Baseline. Mod. China 1994, 20, 243–281. [Google Scholar] [CrossRef]
- National Bureau of Statistics of China. China Statistical Yearbook; China Statistics Press: Beijing, China, 2015. [Google Scholar]
- Ministry of Housing and Urban-Rural Development, P.R. China. China Urban-Rural Construction Statistical Yearbook; China Statistics Press: Beijing, China, 2014. [Google Scholar]
- Tan, M.; Li, X.; Lu, C.; Luo, W.; Kong, X.; Ma, S. Urban population densities and their policy implications in China. Habitat Int. 2008, 32, 471–484. [Google Scholar] [CrossRef]
- Long, H.; Li, Y.; Liu, Y.; Woods, M.; Zou, J. Accelerated restructuring in rural China fueled by ‘increasing vs. decreasing balance’ land-use policy for dealing with hollowed villages. Land Use Policy 2012, 29, 11–22. [Google Scholar] [CrossRef]
- Zhou, G.; He, Y.; Tang, C.; Yu, T.; Xiao, G.; Zhong, T. Dynamic mechanism and present situation of rural settlement evolution in China. J. Geogr. Sci. 2013, 23, 513–524. [Google Scholar] [CrossRef]
- Liu, Y.; Liu, Y.; Chen, Y.; Long, H. The process and driving forces of rural hollowing in China under rapid urbanization. J. Geogr. Sci. 2010, 20, 876–888. [Google Scholar] [CrossRef]
- Li, Y.; Liu, Y.; Long, H.; Cui, W. Community-based rural residential land consolidation and allocation can help to revitalize hollowed villages in traditional agricultural areas of China: Evidence from Dancheng County, Henan Province. Land Use Policy 2014, 39, 188–198. [Google Scholar] [CrossRef]
- Long, H. Land consolidation: An indispensable way of spatial restructuring in rural China. J. Geogr. Sci. 2014, 24, 211–225. [Google Scholar] [CrossRef]
- Liu, Y.; Fang, F.; Li, Y. Key issues of land use in China and implications for policy making. Land Use Policy 2014, 40, 6–12. [Google Scholar] [CrossRef]
- Long, H.; Liu, Y.; Wu, X.; Dong, G. Spatio-temporal dynamic patterns of farmland and rural settlements in Su-Xi-Chang region: Implications for building a new countryside in coastal China. Land Use Policy 2009, 26, 322–333. [Google Scholar] [CrossRef]
- Xie, Y.; Fang, C.; Lin, G.C.S.; Gong, H.; Qiao, B. Tempo-Spatial Patterns of Land Use Changes and Urban Development in Globalizing China: A Study of Beijing. Sensors 2007, 7, 2881–2906. [Google Scholar] [CrossRef]
- Wang, X.; Hui, E.C.; Choguill, C.; Jia, S. The new urbanization policy in China: Which way forward? Habitat Int. 2015, 47, 279–284. [Google Scholar] [CrossRef]
- Chen, R.; Ye, C.; Cai, Y.; Xing, X.; Chen, Q. The impact of rural out-migration on land use transition in China: Past, present and trend. Land Use Policy 2014, 40, 101–110. [Google Scholar] [CrossRef]
- Shi, M.; Xie, Y.; Cao, Q. Spatiotemporal Changes in Rural Settlement Land and Rural Population in the Middle Basin of the Heihe River, China. Sustainability 2016, 8, 614. [Google Scholar] [CrossRef]
- Yang, H.; Li, X. Cultivated land and food supply in China. Land Use Policy 2000, 17, 73–88. [Google Scholar] [CrossRef]
- Tan, M.; Li, X.; Lu, C. Urban land expansion and arable land loss of the major cities in China in the 1990s. Sci. China Ser. D Earth Sci. 2005, 48, 1492–1500. [Google Scholar] [CrossRef]
- Turner Ii, B.L.; Skole, D.; Sanderson, S.; Fischer, G.; Fresco, L.; Leemans, R. Land-Use and Land-Cover Change-Science/Research Plan; IGBP Report 35/HDP Report 7; International Geosphere-Biosphere Programme: Stockholm, Sweden, 1995. [Google Scholar]
- López, E.; Bocco, G.; Mendoza, M.; Duhau, E. Predicting land-cover and land-use change in the urban fringe: A case in Morelia city, Mexico. Landsc. Urban Plan. 2001, 55, 271–285. [Google Scholar] [CrossRef]
- Li, L.; Sato, Y.; Zhu, H. Simulating spatial urban expansion based on a physical process. Landsc. Urban Plan. 2003, 64, 67–76. [Google Scholar] [CrossRef]
- Xiao, D. Urbanization process and the sustainable utilization of land resources. Yunnan Geogr. Environ. Res. 1997, 9, 34–39. [Google Scholar]
- OECD. Sustainable Development: Indicators to Measure Decoupling of Environmental Pressure from Economic Growth; The Organization for Economic Co-operation and Development (OECD): Paris, France, 2001. [Google Scholar]
- Tapio, P. Towards a theory of decoupling: Degrees of decoupling in the EU and the case of road traffic in Finland between 1970 and 2001. Transp. Policy 2005, 12, 137–151. [Google Scholar] [CrossRef]
- Chen, B.; Du, H. Analyzing decoupling relationship between arable land occupation and GDP growth. Resour. Sci. 2006, 28, 36–42. [Google Scholar]
- Li, X.; Qu, F.; Guo, Z.; Jiang, D.; Pan, Y.; Chen, X. Decoupling between urban and rural construction land. China Popul. Resour. Environ. 2008, 18, 179–184. [Google Scholar]
- Song, W.; Liu, M. Assessment of decoupling between rural settlement area and rural population in China. Land Use Policy 2014, 39, 331–341. [Google Scholar] [CrossRef]
- Wang, J.; Fang, C.; Li, Y. Spatio-temporal analysis of population and construction land change in urban and rural China. J. Nat. Resour. 2014, 29, 1271–1281. [Google Scholar]
- Guo, J.; Bao, Q.; Ou, M. Study on Incremental Construction Land Quotas Allocation in China based on Resource Endowments and Economic Development Regional Differences. China Land Sci. 2016, 30, 71–80. [Google Scholar]
- Lu, Z.; Wu, C.; Yue, W. Study on Dynamic Regional Allocation of Construction Land Quotas in General Land Use Planning. China Land Sci. 2010, 24, 59–65. [Google Scholar]
- Liu, Y.; Luo, T.; Liu, Z.; Kong, X.; Li, J.; Tan, R. A comparative analysis of urban and rural construction land use change and driving forces: Implications for urban-rural coordination development in Wuhan, Central China. Habitat Int. 2015, 47, 113–125. [Google Scholar] [CrossRef]
- Wang, Y.; Liu, Y.; Li, Y.; Li, T. The spatio-temporal patterns of urban–rural development transformation in China since 1990. Habitat Int. 2016, 53, 178–187. [Google Scholar] [CrossRef]
- Li, Y. Urban-rural interaction patterns and dynamic land use: Implications for urban–rural integration in China. Reg. Environ. Chang. 2012, 12, 803–812. [Google Scholar] [CrossRef]
- Long, H.; Zou, J.; Pykett, J.; Li, Y. Analysis of rural transformation development in China since the turn of the new millennium. Appl. Geogr. 2011, 31, 1094–1105. [Google Scholar] [CrossRef]
- Fan, H.; Liu, W.; Shan, N. Study on the exiting strategy of rural residential land in China. Sci. Technol. Manag. Land Resour. 2016, 16–25. [Google Scholar]
- The state council of the People's Republic of China. The Guiding Opinions for Supporting Henan Province to Speed up the Construction of the Central Plains Economic Zone of China by the State Council. Available online: http://www.gov.cn/zwgk/2011-10/07/content_1963574.htm (assessed on 9 May 2017).
- National Development and Reform Commission. Planning for a Central Plains Economic Zone (2012–2020). Available online: http://www.hunan.gov.cn/2015xxgk/szfzcbm/tjbm/ghjh/201605/t20160517_3058426.html (assessed on 9 May 2017).
Figure 1.
Location and elevation of the study area.
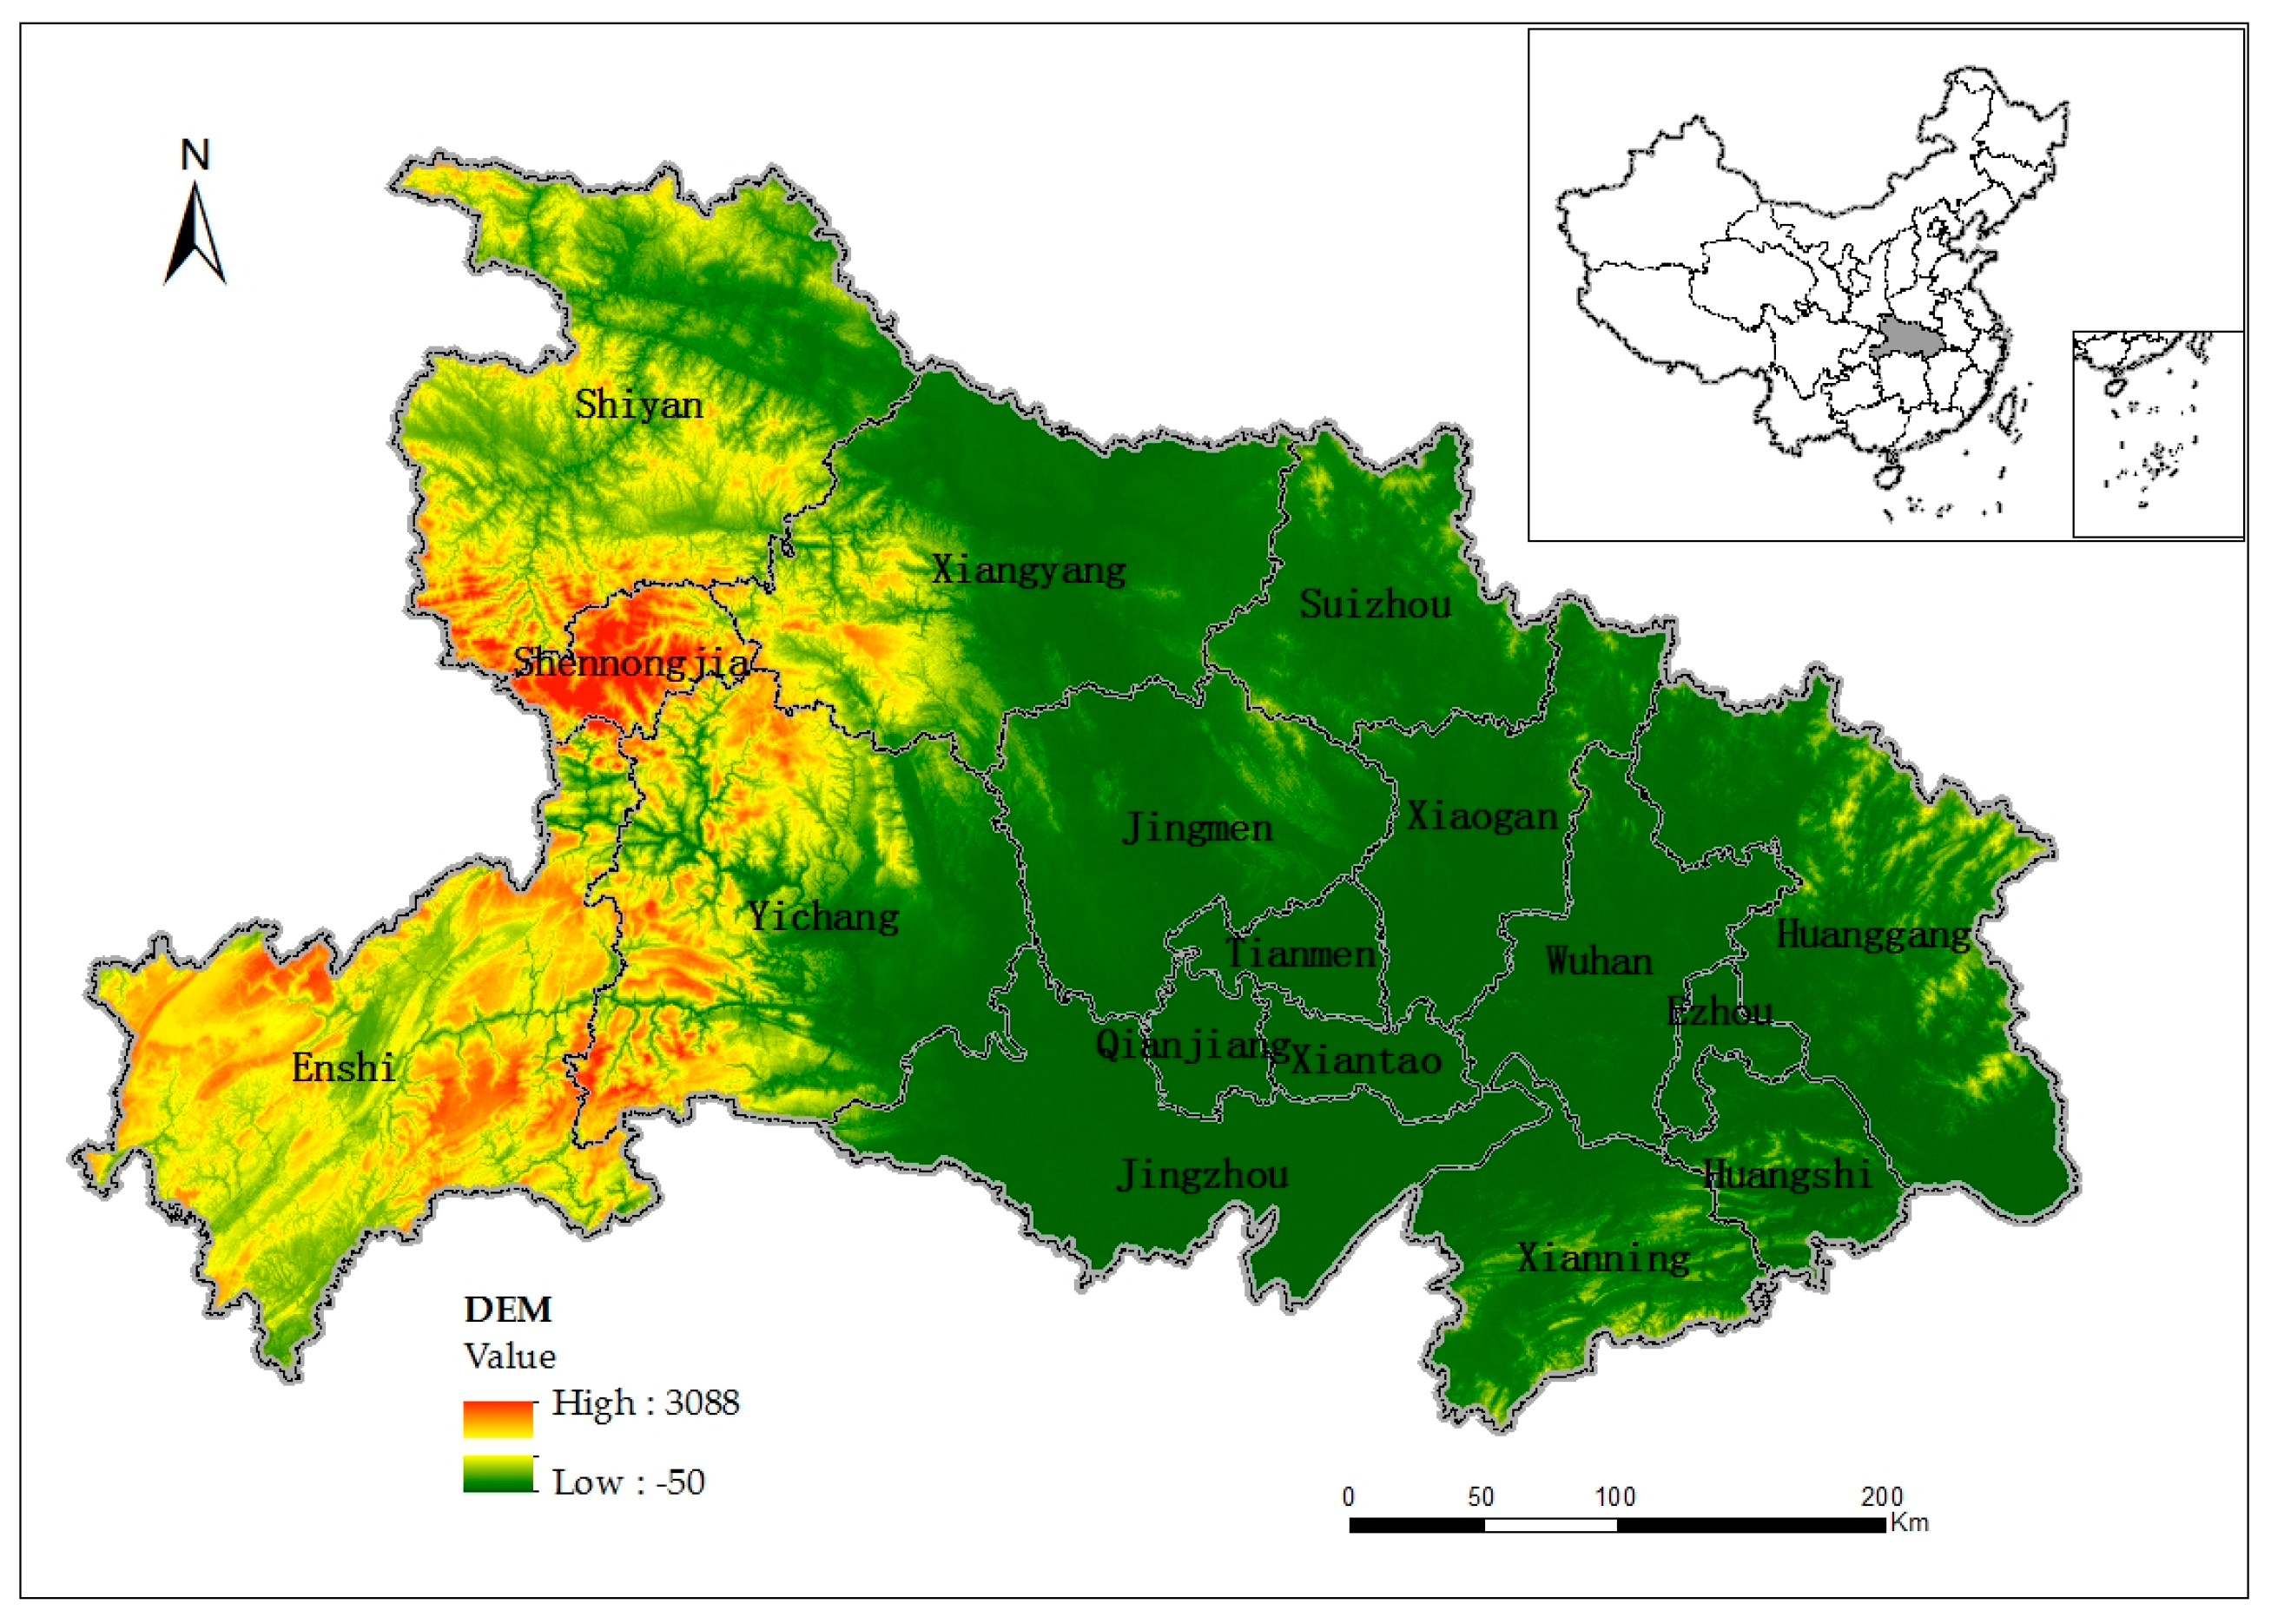
Figure 2.
The changes in: (a) economic factors and population; and (b) construction land area and farmland area in Hubei.
Figure 2.
The changes in: (a) economic factors and population; and (b) construction land area and farmland area in Hubei.
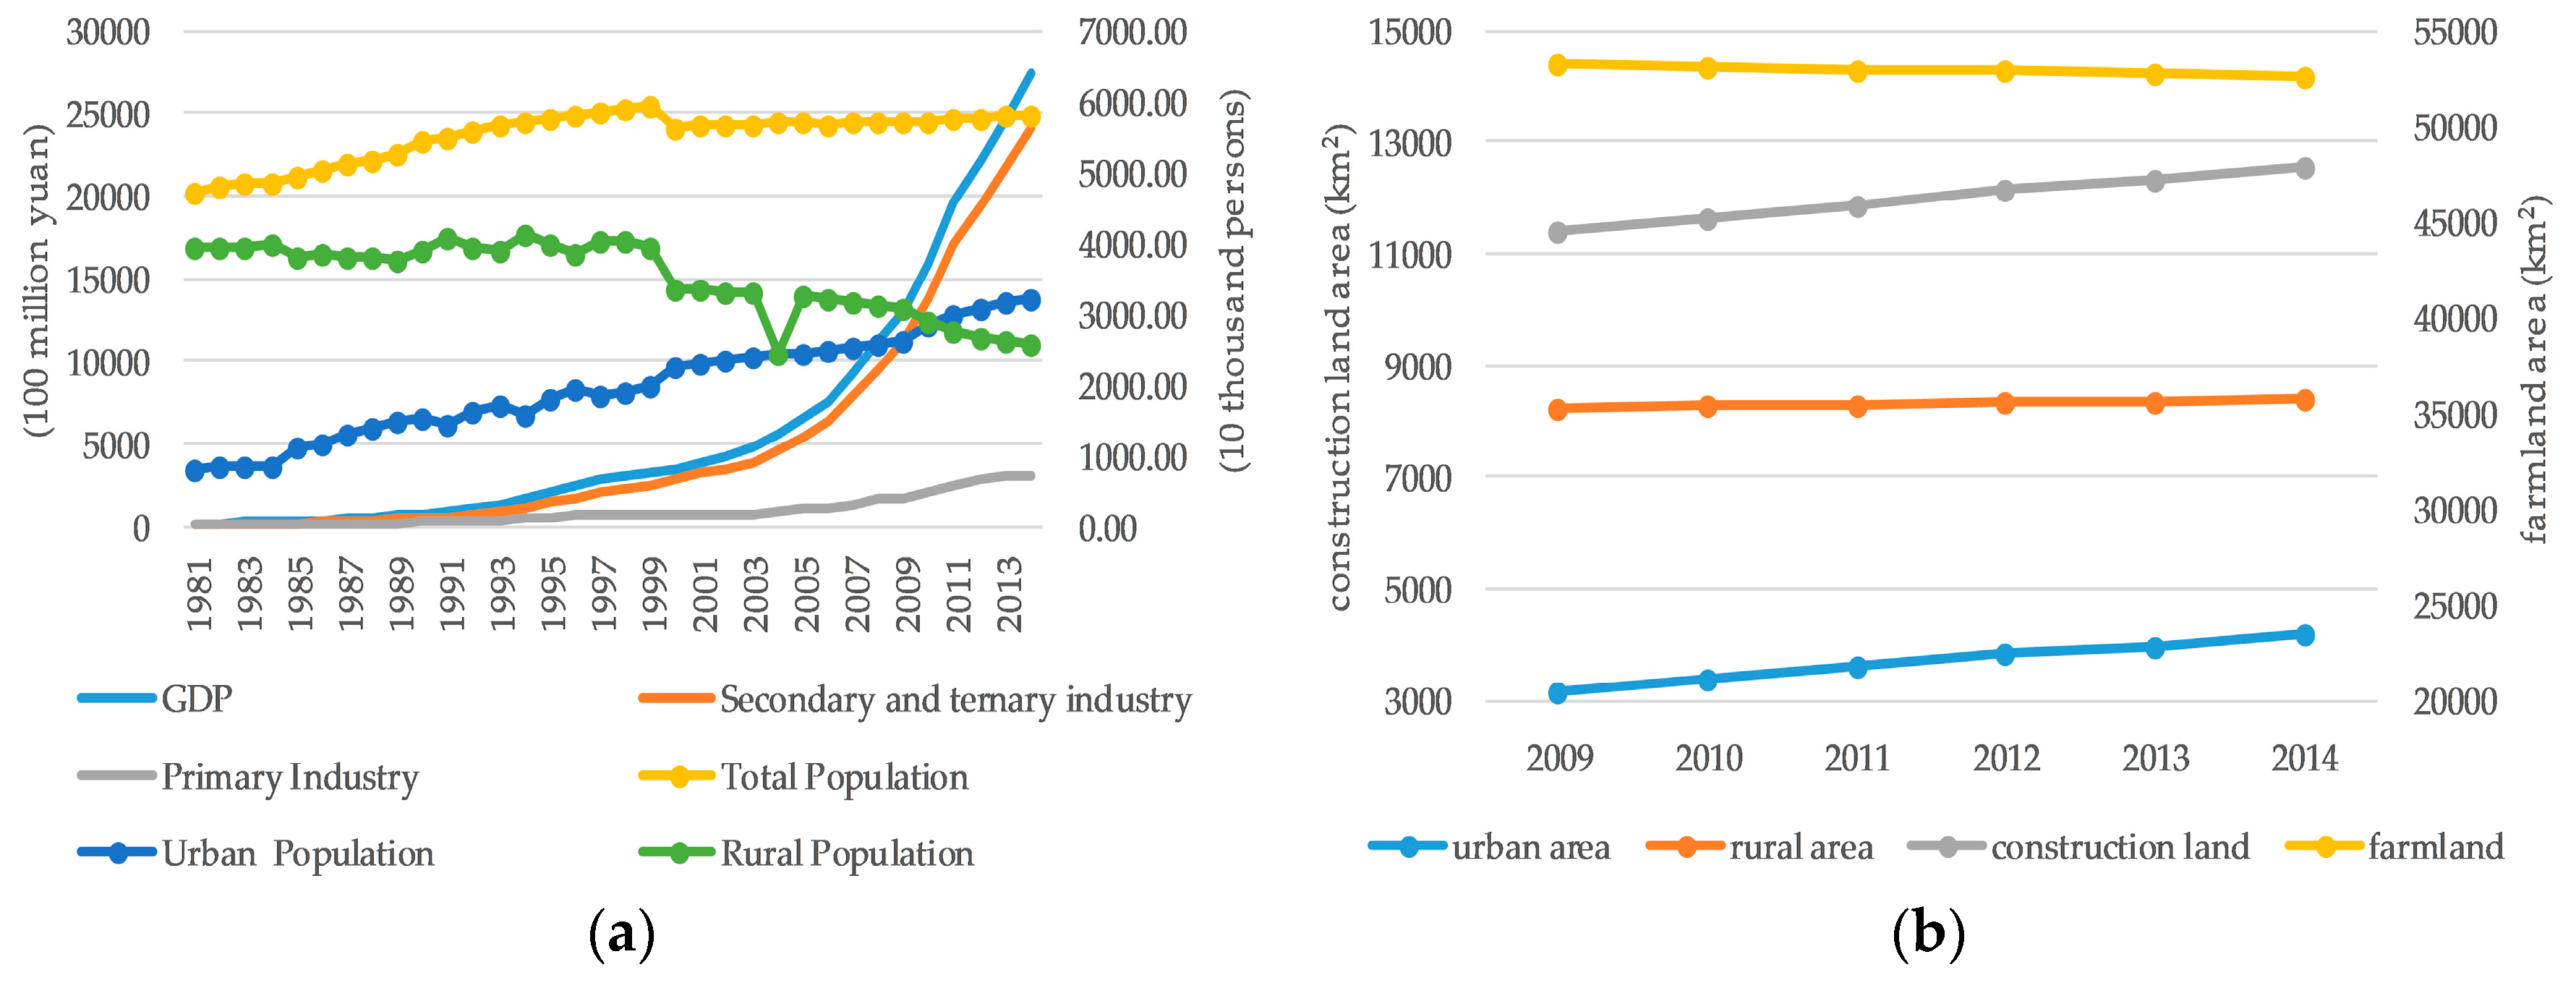
Figure 3.
The decoupling model between population and the construction land area.

Figure 4.
Spatial distribution of urban–rural construction land conversion in Hubei (2009–2014).
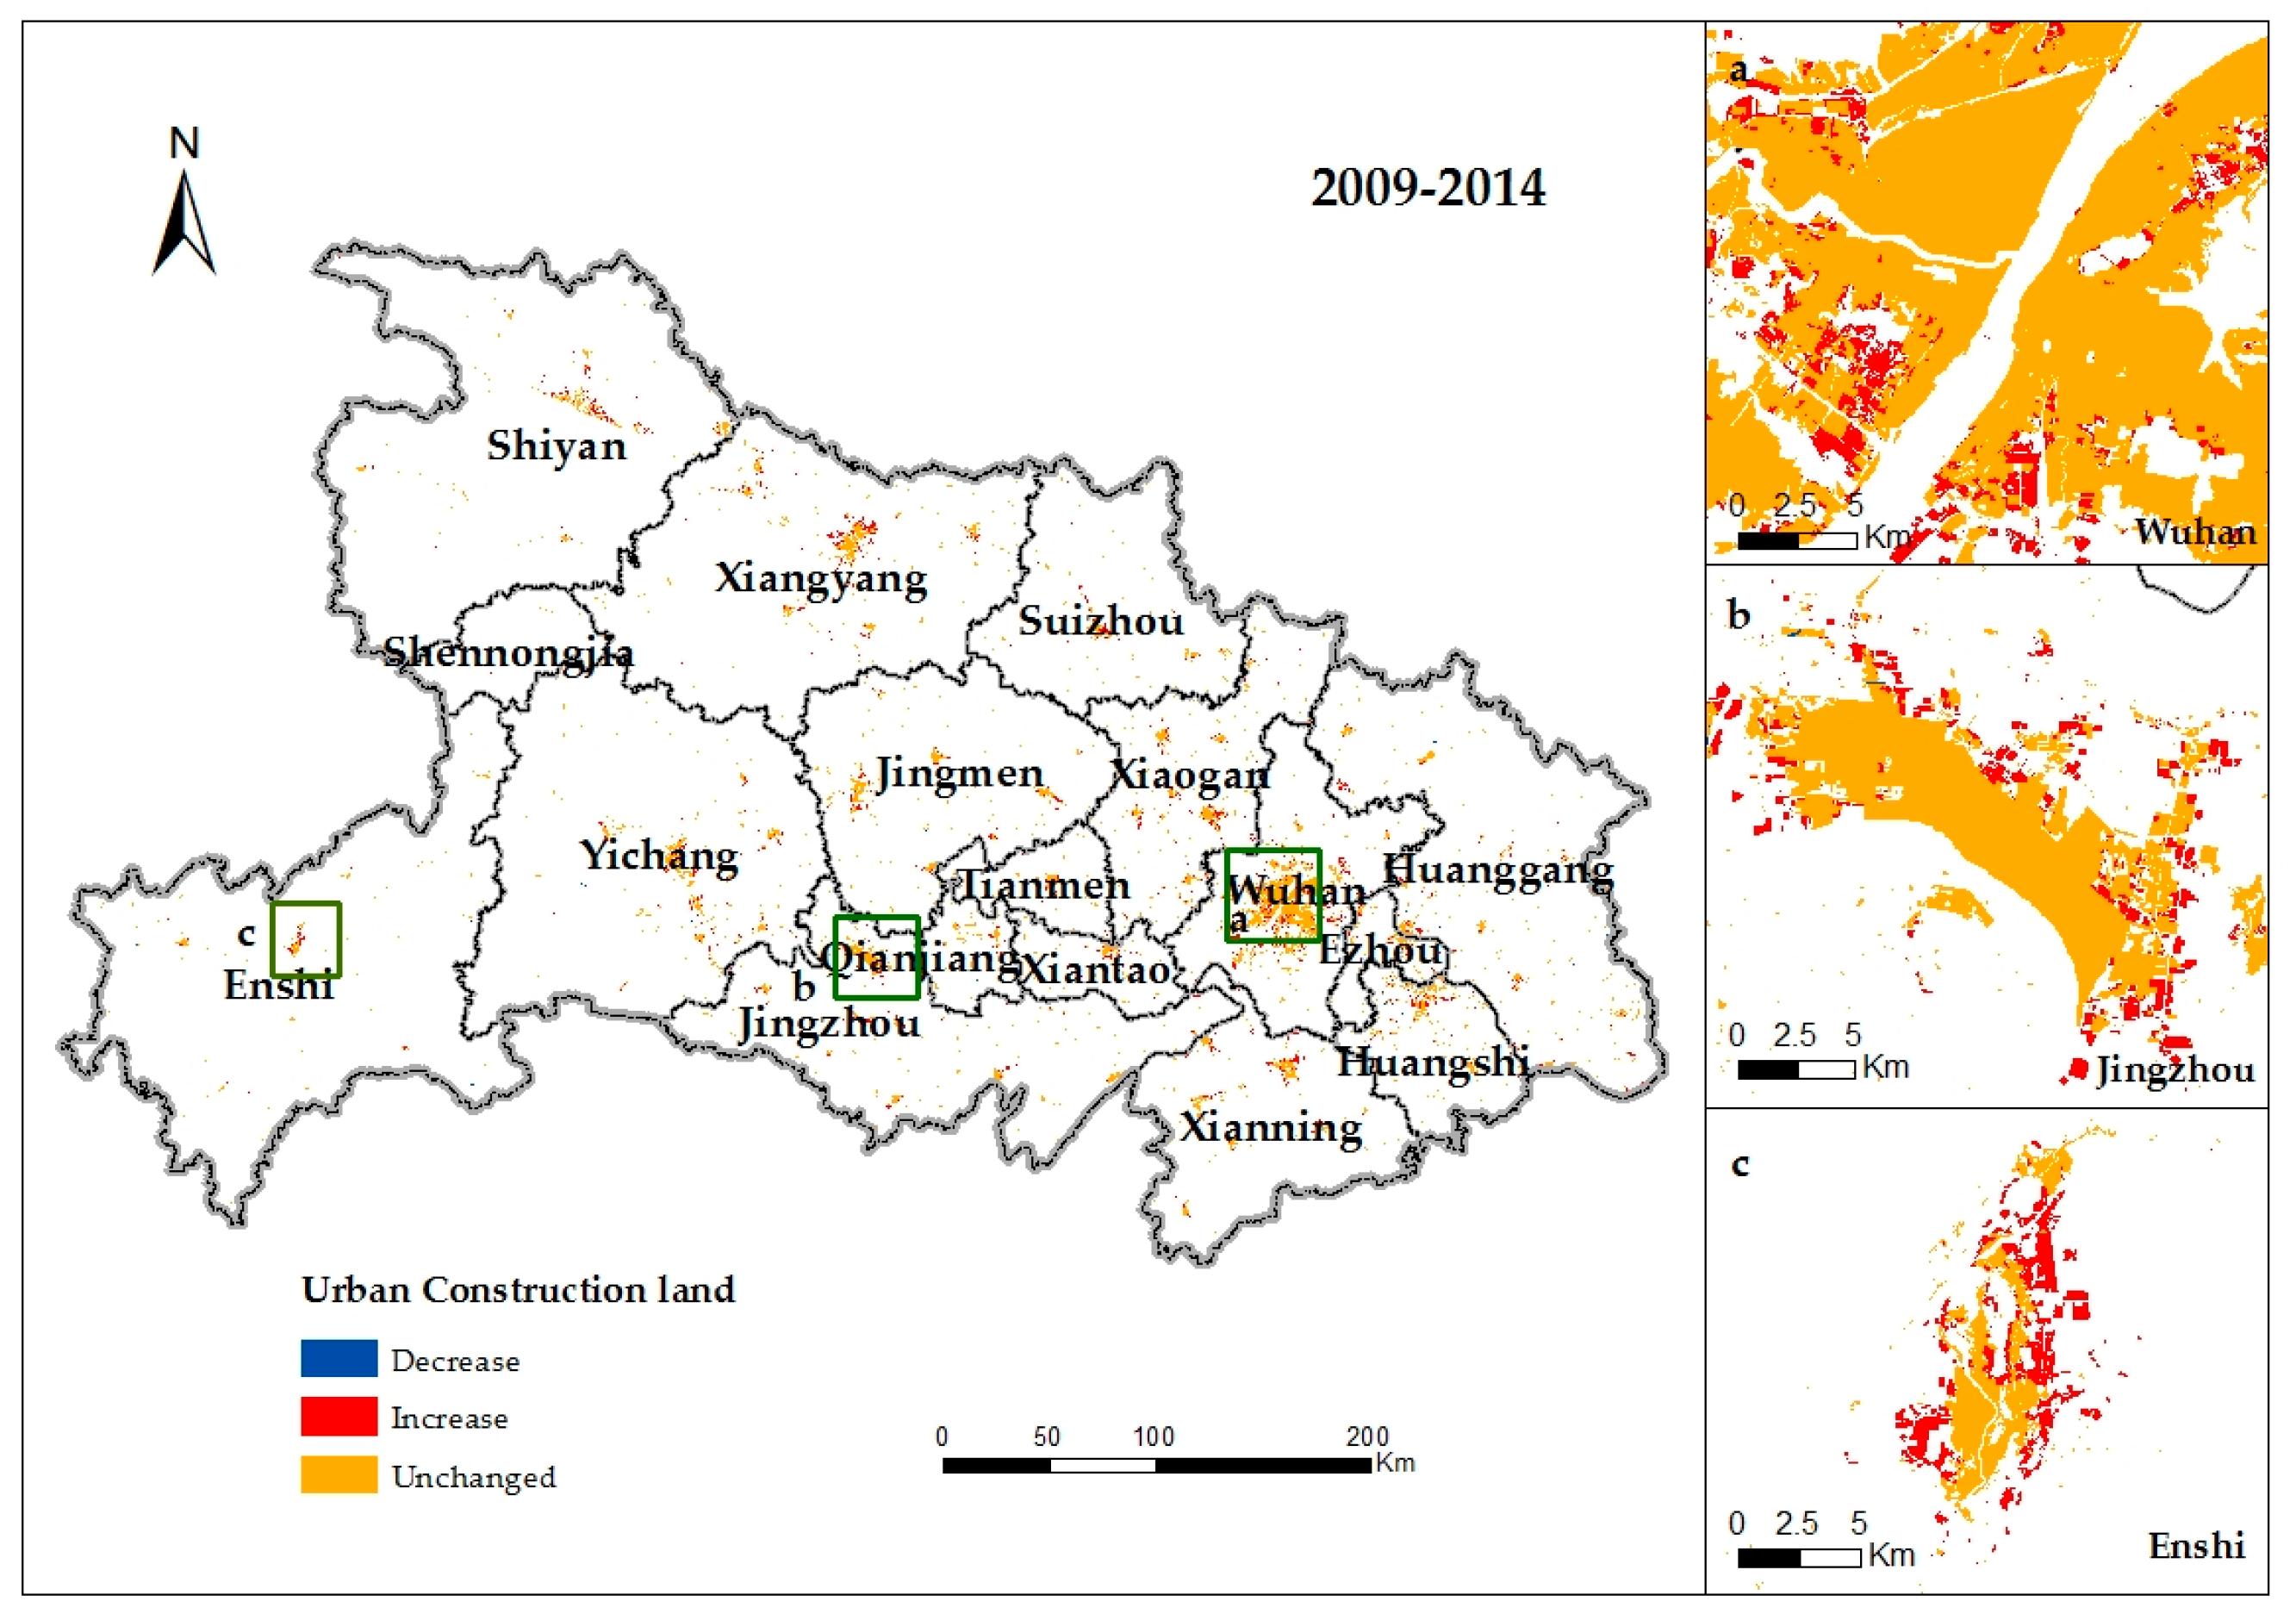
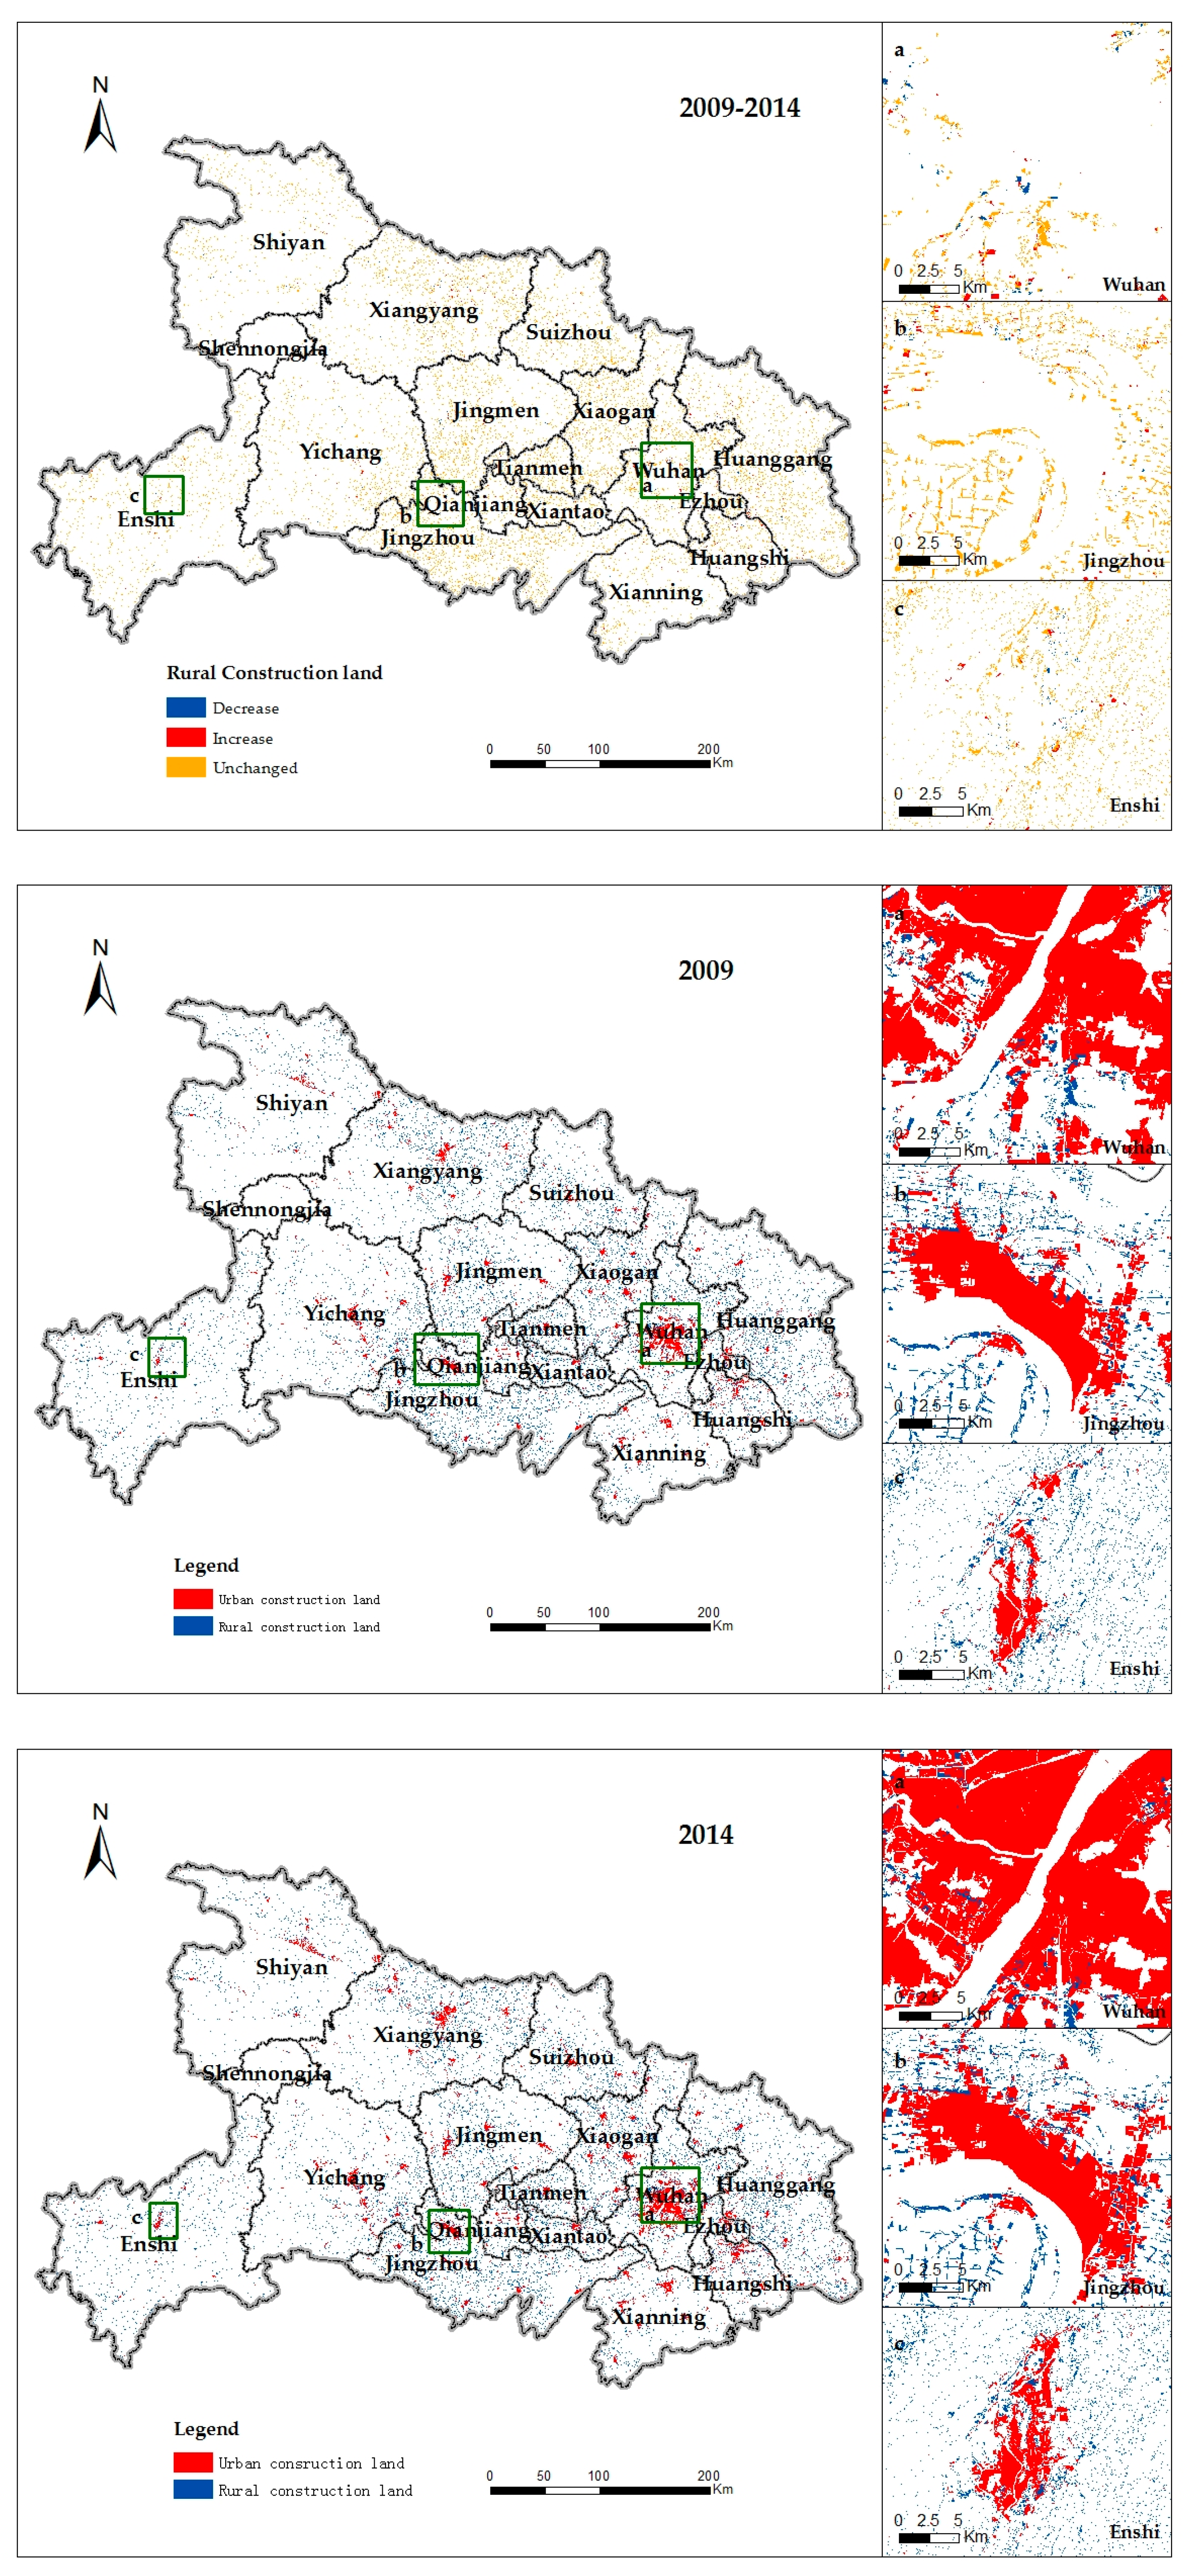
Figure 5.
Spatial distribution of the construction land area and population in Hubei in 2014.
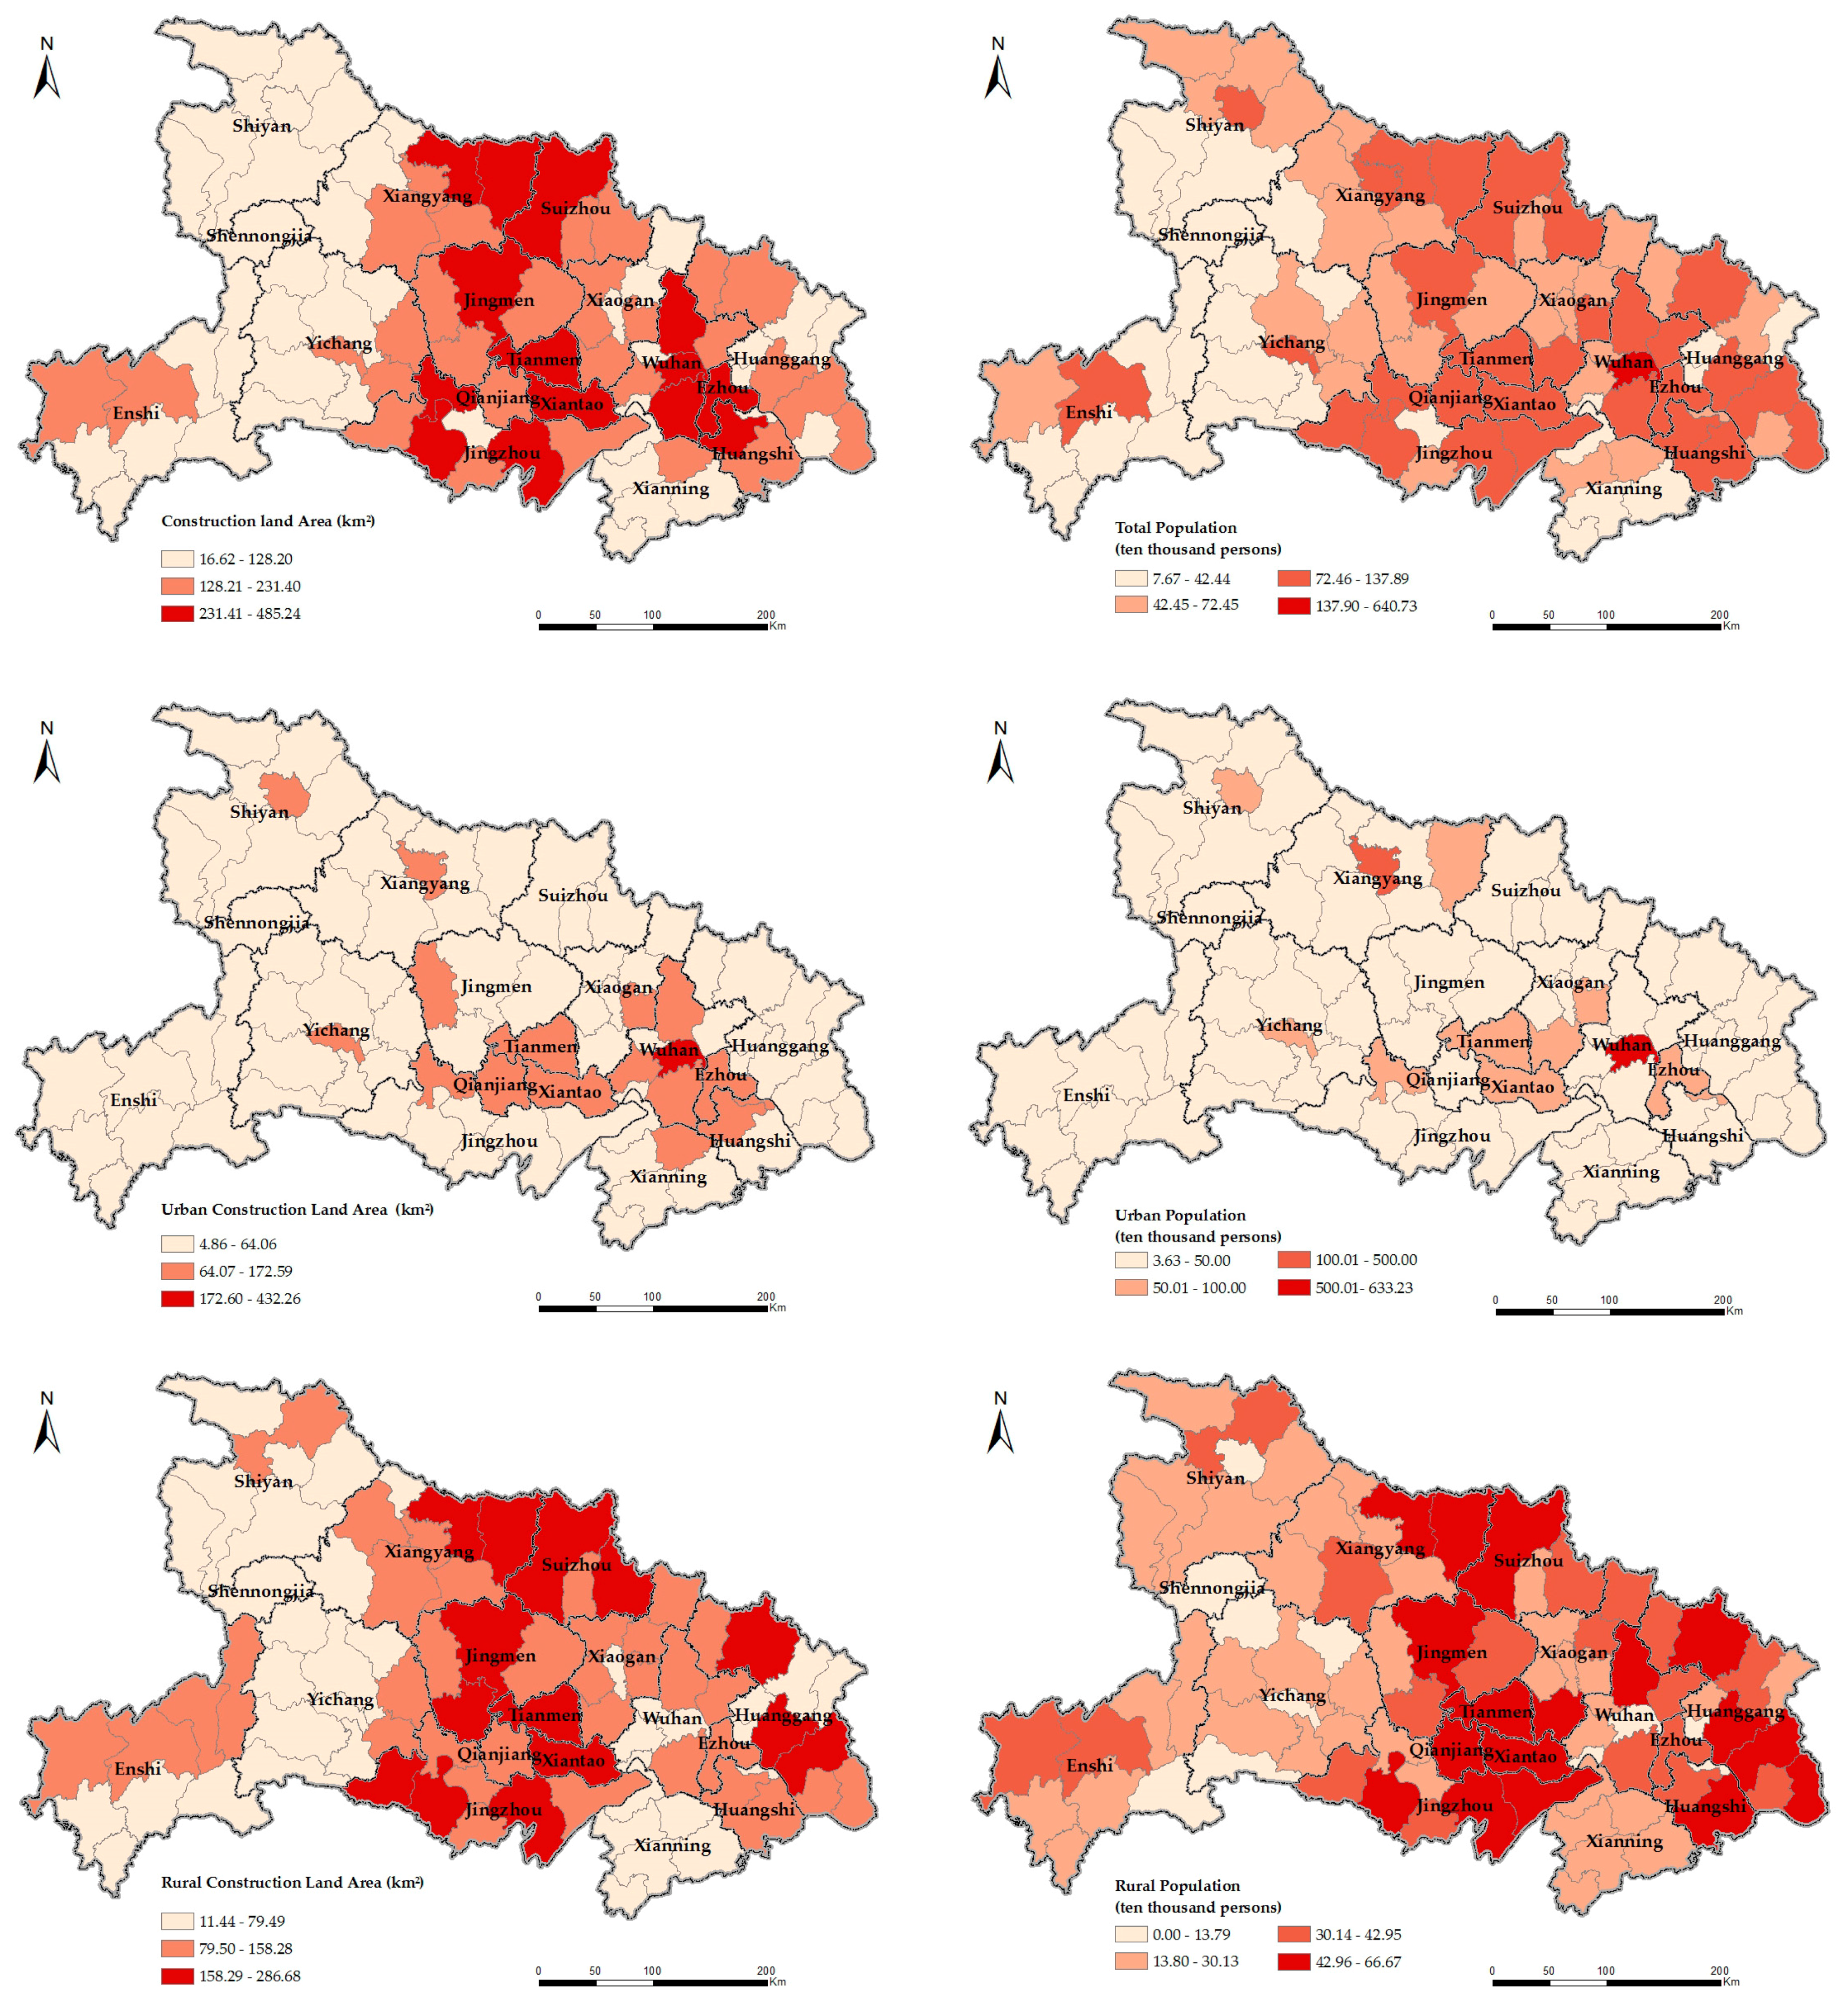
Figure 6.
Decoupling states in Hubei Province during 2009–2014.
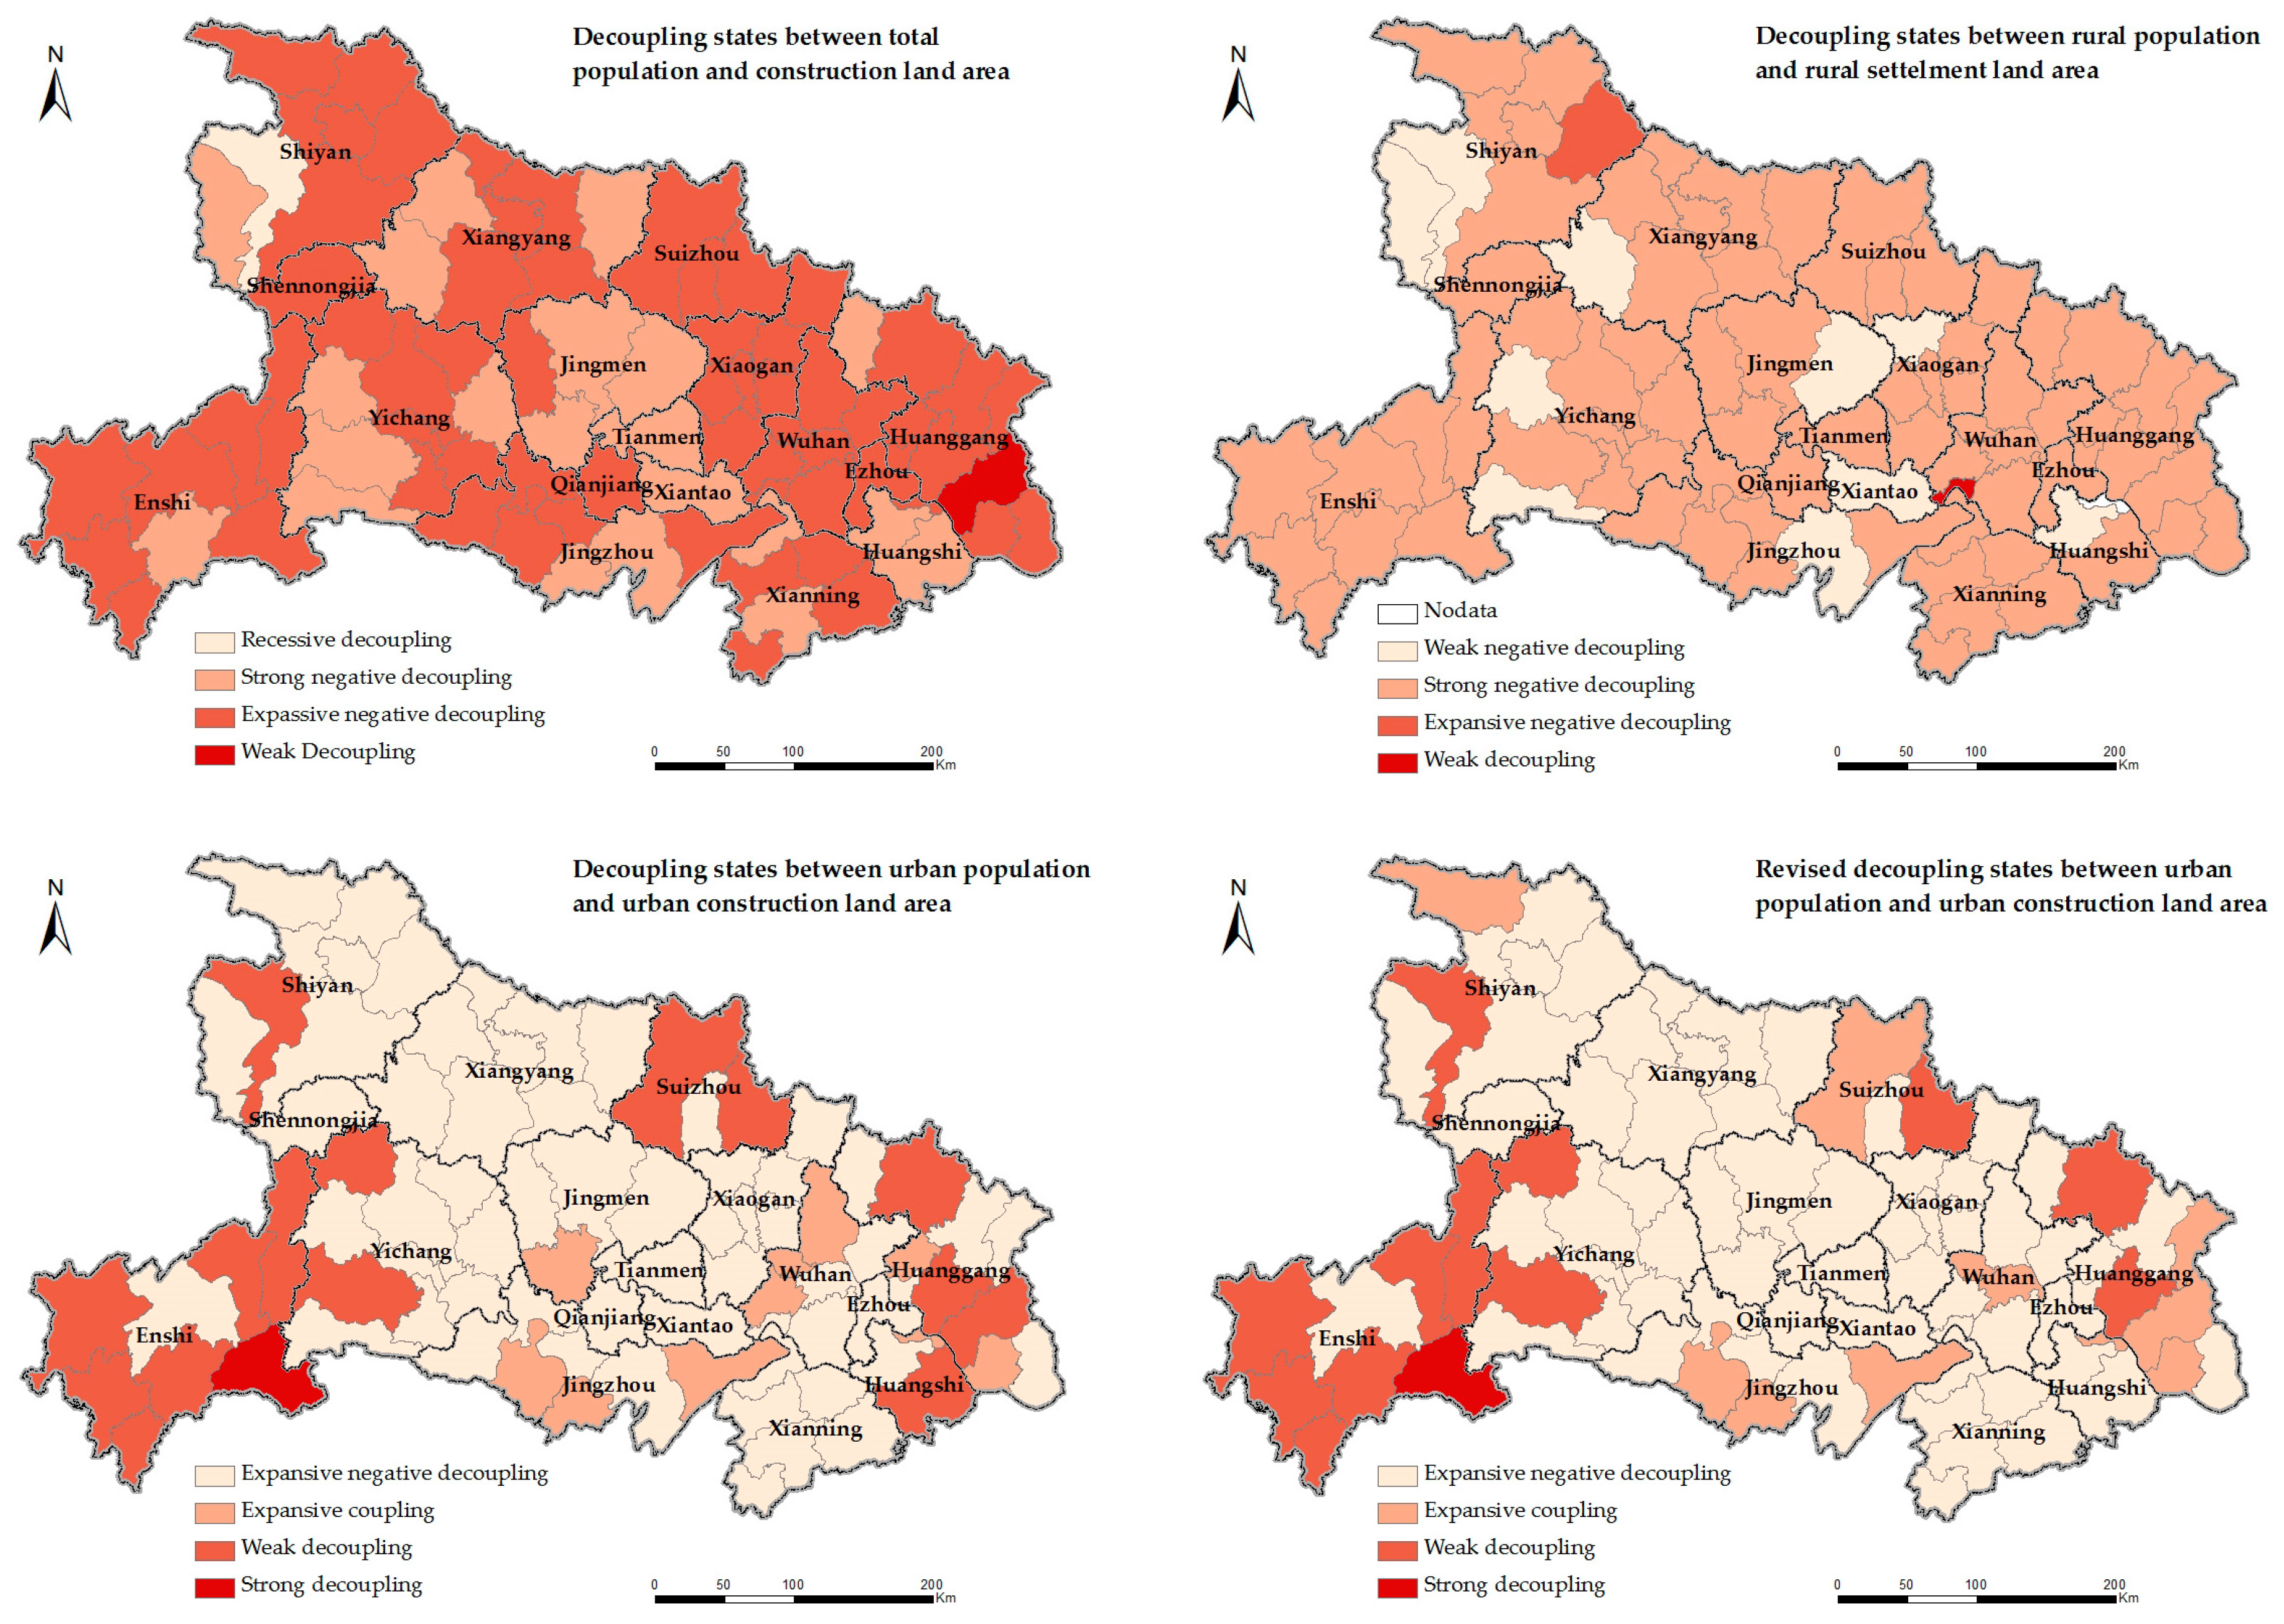
Figure 7.
Changes of decoupling types between urban population and urban construction land.

Figure 8.
Pattern of the relationship between urban–rural population and change in construction land.
Figure 8.
Pattern of the relationship between urban–rural population and change in construction land.

Table 1.
Structural changes in Urban–rural construction land use, 2009–2014, Hubei (Unit: km2).
| Land Use Type | 2009 | 2014 | 2009–2014 | |||
|---|---|---|---|---|---|---|
| Area | %Total | Area | %Total | Variation | %Rate | |
| Urban construction land | 3225.18 | 1.73 | 4240.27 | 2.28 | 1015.09 | 31.47 |
| City | 1419.32 | 0.76 | 1813.35 | 0.98 | 394.03 | 27.76 |
| Town | 1351.36 | 0.73 | 1965.51 | 1.06 | 614.15 | 45.45 |
| Industry/mining land | 454.50 | 0.24 | 461.41 | 0.25 | 6.91 | 1.52 |
| Rural construction land | 8463.48 | 4.55 | 8623.02 | 4.64 | 159.54 | 1.89 |
Table 2.
Population structural changes, 2009–2014, Hubei (unit: ten thousand).
| 2009 | 2014 | Variation | %Rate | %Average Annual Rate of Change | |
|---|---|---|---|---|---|
| Urban population | 2844.51 | 3238.47 | 393.96 | 13.85 | 2.63 |
| Rural population | 2879.26 | 2577.52 | −301.74 | −10.48 | −2.19 |
| Total population | 5723.77 | 5815.99 | 92.23 | 1.61 | 0.32 |
Table 3.
Suggestion for each type of coordination relationship of the urban–rural population and change in construction land.
Table 3.
Suggestion for each type of coordination relationship of the urban–rural population and change in construction land.
| Type | Urban Construction Land Per Capita | Number | Suggestion | ||
|---|---|---|---|---|---|
| I | > | 1 | Relax the approval of urban construction land | Strictly control the expansion of rural settlement land, prevent the loss of rural population and strengthen the rural settlements land consolidation | |
| II | II | 6 | Relax the approval of urban construction land appropriately | ||
| II-2 | 2 | ||||
| II-3 | 3 | Appropriately control the urban expansion and actively revitalize the stock of construction land | |||
| III | III-1 | 4 | Relax the approval of urban construction land appropriately | ||
| III-2 | 5 | Control the urban expansion | |||
| III-3 | 1 | Relax the approval of urban construction land appropriately | |||
| IV | IV-1 | 6 | Maintain the relationship between urban expansion and population growth | ||
| IV-2 | 14 | Strictly control urban expansion and actively revitalize the stock of construction land | |||
| IV-3 | 30 | ||||
| V | V-1 | 3 | Maintain the relationship between urban expansion and population growth | Maintain the declining trend of rural land | |
| V-2 | 1 | Strictly control urban expansion and actively revitalize the stock of construction land | |||
| V-3 | 5 | ||||
| VI | 1 | Relax the approval of urban construction land appropriately | |||
| VII | 1 | Strictly control urban expansion | Reduce the growth rate of rural settlement land | ||
| VIII | 1 | Strictly control the expansion of rural settlement land | |||
© 2017 by the authors. Licensee MDPI, Basel, Switzerland. This article is an open access article distributed under the terms and conditions of the Creative Commons Attribution (CC BY) license (http://creativecommons.org/licenses/by/4.0/).
Share and Cite
MDPI and ACS Style
Wang, C.; Liu, Y.; Kong, X.; Li, J. Spatiotemporal Decoupling between Population and Construction Land in Urban and Rural Hubei Province. Sustainability 2017, 9, 1258. https://doi.org/10.3390/su9071258
AMA Style
Wang C, Liu Y, Kong X, Li J. Spatiotemporal Decoupling between Population and Construction Land in Urban and Rural Hubei Province. Sustainability. 2017; 9(7):1258. https://doi.org/10.3390/su9071258
Chicago/Turabian StyleWang, Chengcheng, Yanfang Liu, Xuesong Kong, and Jiwei Li. 2017. "Spatiotemporal Decoupling between Population and Construction Land in Urban and Rural Hubei Province" Sustainability 9, no. 7: 1258. https://doi.org/10.3390/su9071258
Note that from the first issue of 2016, this journal uses article numbers instead of page numbers. See further details here.