Article

Experts’ Analysis of the Quality and Usability of SILVANET Software for Informing Sustainable Forest Management

by
Jose Eugenio Martínez-Falero
,
Esperanza Ayuga-Tellez
,
Concepcion Gonzalez-Garcia
*,
M. Angeles Grande-Ortiz
and
Alvaro Sánchez De Medina Garrido
Ingeniería y Gestión Forestal y Ambiental, Universidad Politécnica de Madrid, ETSI Montes, Ciudad Universitaria s/n, 28040 Madrid, Spain
*
Author to whom correspondence should be addressed.
Sustainability 2017, 9(7), 1200; https://doi.org/10.3390/su9071200
Submission received: 26 April 2017 / Revised: 1 July 2017 / Accepted: 2 July 2017 / Published: 7 July 2017
(This article belongs to the Special Issue Ecological Restoration for Sustainable Forest Management)

Abstract

:
It is important today to take account of the opinions of both experts and stakeholders in the sustainable management of forests. SILVANET (Universidad Politécnica de Madrid, Madrid, Spain) is a software package that offers a useful methodology for assessing the preferences of individuals or groups, and applying them to the design of a sustainable forest management plan. The program starts by identifying the personal preferences of the evaluators based on information provided individually when comparing and selecting sustainability options from a series of site pairs. The evaluator is given information on certain sustainability indicators obtained in the area to be assessed. The scope of the evaluator’s knowledge of sustainable forest management and the consistency of his/her decisions is assessed, and he/she is then included in a group of people with similar systems of preferences to encourage interaction between evaluators in the same group. The preferences are characterized by matrices that encode individual assessments, the maximization of their utility and the analysis of past decisions. Finally, by identifying preferences, we are able to design the forest management system that maximizes the concept of sustainability for each individual or group of individuals. In this paper, we present the results of its application to mono-specific conifer forest stands, although it can be adapted to other forest types. The forestry management experts classify its usability as good, although non-expert users give it a lower rating.

1. Introduction

Natural systems provide a wide spectrum of goods and services that contribute to the socio-economic development of the communities that depend on them [1,2,3,4]. In many countries, the wide variety of stakeholders concerned with the diversity of these natural systems makes Sustainable Forestry Management (SFM) difficult to achieve. According to Food and Agriculture Organization of United Nations (FAO) definition, Sustainable Forest Management addresses forest degradation and deforestation while increasing direct benefits to people and environment [5]. Thus, several studies recommend the decentralization of forestry management and public participation as important processes for integrating ecological, economic and social issues in forestry management, which has been recognized as a key element in SFM [6,7,8,9].
SILVANET is software that allows design of a forest management plan, based on public preferences. These preferences are obtained by combination of individual preferences, the knowledge of group opinions with a similar preference system and the information provided by some sustainability indicators calculated in the assessed area [10]. The overall value of sustainability is obtained by integrating different partial sustainability measurements known as indicators [11]. Indicators are a very widely-used tool in SFM, they are defined for a number regions in numerous studies [12,13,14,15]. Although most sustainability indicators are widely accepted, there is no single objective measurement that integrates them all [16,17]; this must be developed by the stakeholders themselves in order to be applicable [18]. Several approaches have been set out to transform the principles of SFM into generic and practical tools that facilitate inclusion and participation [19], and it is therefore necessary to compile and communicate the advances achieved in this field of research.
The methodology developed to implement public participation in decision-making is based on ensuring access to the process, the power to influence processes and results, access to information, the possibility of encouraging constructive interactions between participants, people’s ease of access to the information they need to conform their personal opinions, an adequate analysis, and the enablement of future processes [20].
The most recent works on the management of public assets highlight key aspects to be taken into account when developing the processes that integrate sustainable forest management; among them, the importance of including different social groups, the transparency of these processes [21,22,23] and the need for the participants to see their efforts as being worthwhile [24,25].
Some recent works on public participation in forestry management illustrate the different methods that have been put into practice in recent years [26,27,28,29,30,31,32].
Public participation can be enhanced by the incorporation of these methods on the Internet. However, the works of Cantiani [28], Bruña-García et al. [32], and Brown and Reed [33] assess the advantages and disadvantages of using Internet, and conclude that the results could lead to a distortion of the opinions of the general public.
Elsewhere, Cantiani [28] highlights the importance of developing technological platforms for integrating public participation in forestry management. Martínez-Falero et al. [34] review some of the software applications developed in recent years: MultCSync (University of Texas, Austin, USA) [35] and CIMCAT (Ontario Ministry of Natural Resources, Ontario, Canada) [36] in North America; the HIPRE program (Aalto University, Helsinki, Finland ) [37], Soft OR approaches [38] and MESTA (Natural Resources Institute, Helsinki, Finland) [39] in northern Europe; MGC_Larch (Gembloux Agricultural University, Gembloux, Belgium) [40] and DSD v1.1 (Austrian Federal Ministry of Agriculture, Vienna, Austria) [41] in Western Europe; and SILVANET [42] in southern Europe.
The assessment of public participation tools provides additional information that is essential for discarding or enhancing efforts aimed at improving, applying and disseminating these tools [43]. According to Dubey et al. [44], “usability is regarded as an important quality factor for developing the successful interactive software system. It is also a key quality factor in the development of successful software applications”. The usability of tools is one of the primary features that should be assessed before using them to request public participation [45].
The goal of any Information Technology (IT) application is to obtain the necessary quality to meet the actual needs of the users. Usability is understood according to ISO 9241-10: “The extent to which a product can be used by specified users to achieve specified goals with effectiveness, efficiency and satisfaction in a specified context of use” [46].
The terms “usability” and “satisfaction” are closely linked and may give rise to confusion. Satisfaction is frequently considered to be a variable of usability, as certain tools, instruments and usability assessment scales include satisfaction as a variable, when—on the contrary—it is more of a consequence of usability and not a factor inherent in it [47].
In addition, the ISO/IEC 9126-1:2001 features a model that classifies software quality in terms of a structured set of characteristics: functionality, reliability, usability, efficiency, maintainability and portability. Usability is in turn divided into the five following sub-characteristics:
  • How easy it is to learn how to use.
  • How easy it is for new users to understand the purpose of the tool, and how it can be applied to specific tasks.
  • How easy it is to operate and control at any time.
  • How attractive it is to users.
  • The product’s capacity to adapt to usability standards, style guides and regulations.
This article evaluates the quality and usability of the SILVANET application from a technical perspective of view through the opinions of an expert panel.

2. Materials and Methods
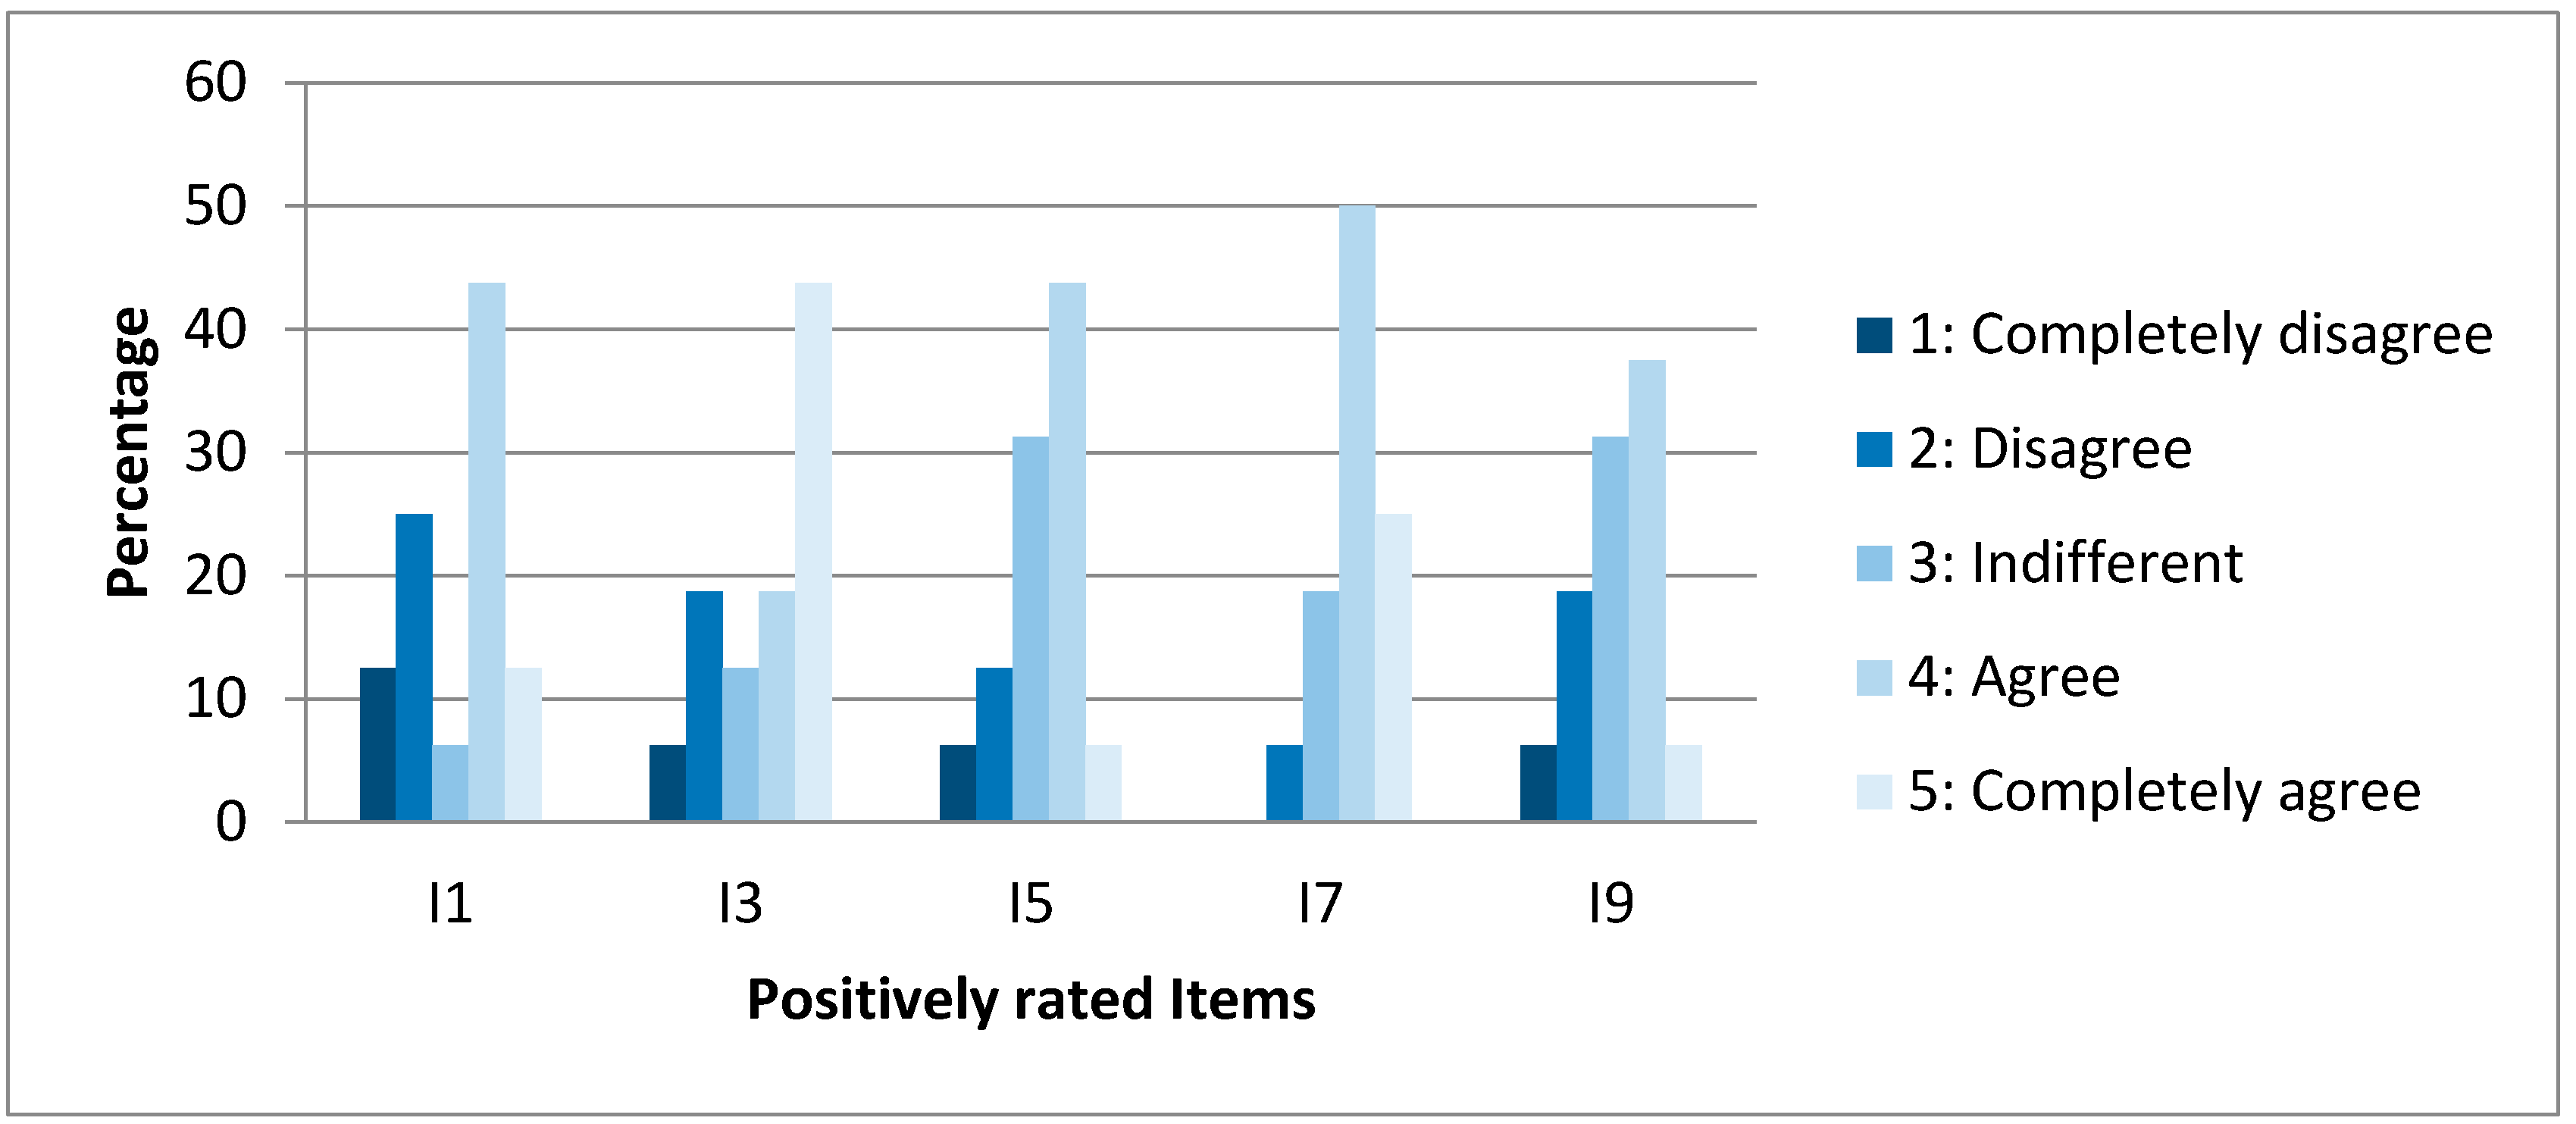
The evaluation of the quality and usability of SILVANET was made from the opinions of an expert panel consisting of 16 professionals with the following characteristics: four software design experts (SE), four sustainable forestry management experts (FE), four experts in sustainable forestry management and software design (SF), and four forestry engineers with a basic knowledge of forestry management (F). The general features of this panel of experts were: aged between 22 and 58, 75% of the SE were men, 75% of the FE were women, 50% of the SF were men and 75% of the F were men. All of them have analyzed and responded a System Usability Scale (SUS) questionnaire with 10 items. The SUS system [48] is one of the most widely-used questionnaires to measure the usability and satisfaction of IT systems [49]; we propose the SUS, owing to its suitability for this study and its relationship with the ISO standard [50]. The SUS can be used for the analysis of any technology, and since its appearance has been tested on numerous products [51]. It has become an industry standard, with references in over 600 publications. Although SUS was designed to measure only perceived ease of use (a single dimension), in recent research, Bangor et al. [52] shows that it provides a global measurement of satisfaction with the system and the subscales of usability and learnability. The questionnaire has proved its validity and reliability [53], even in the case of samples of 12 to 15 people [54].
The SUS questionnaire contains the 10 following items [55]:
I1.
I think that I would like to use this system frequently.
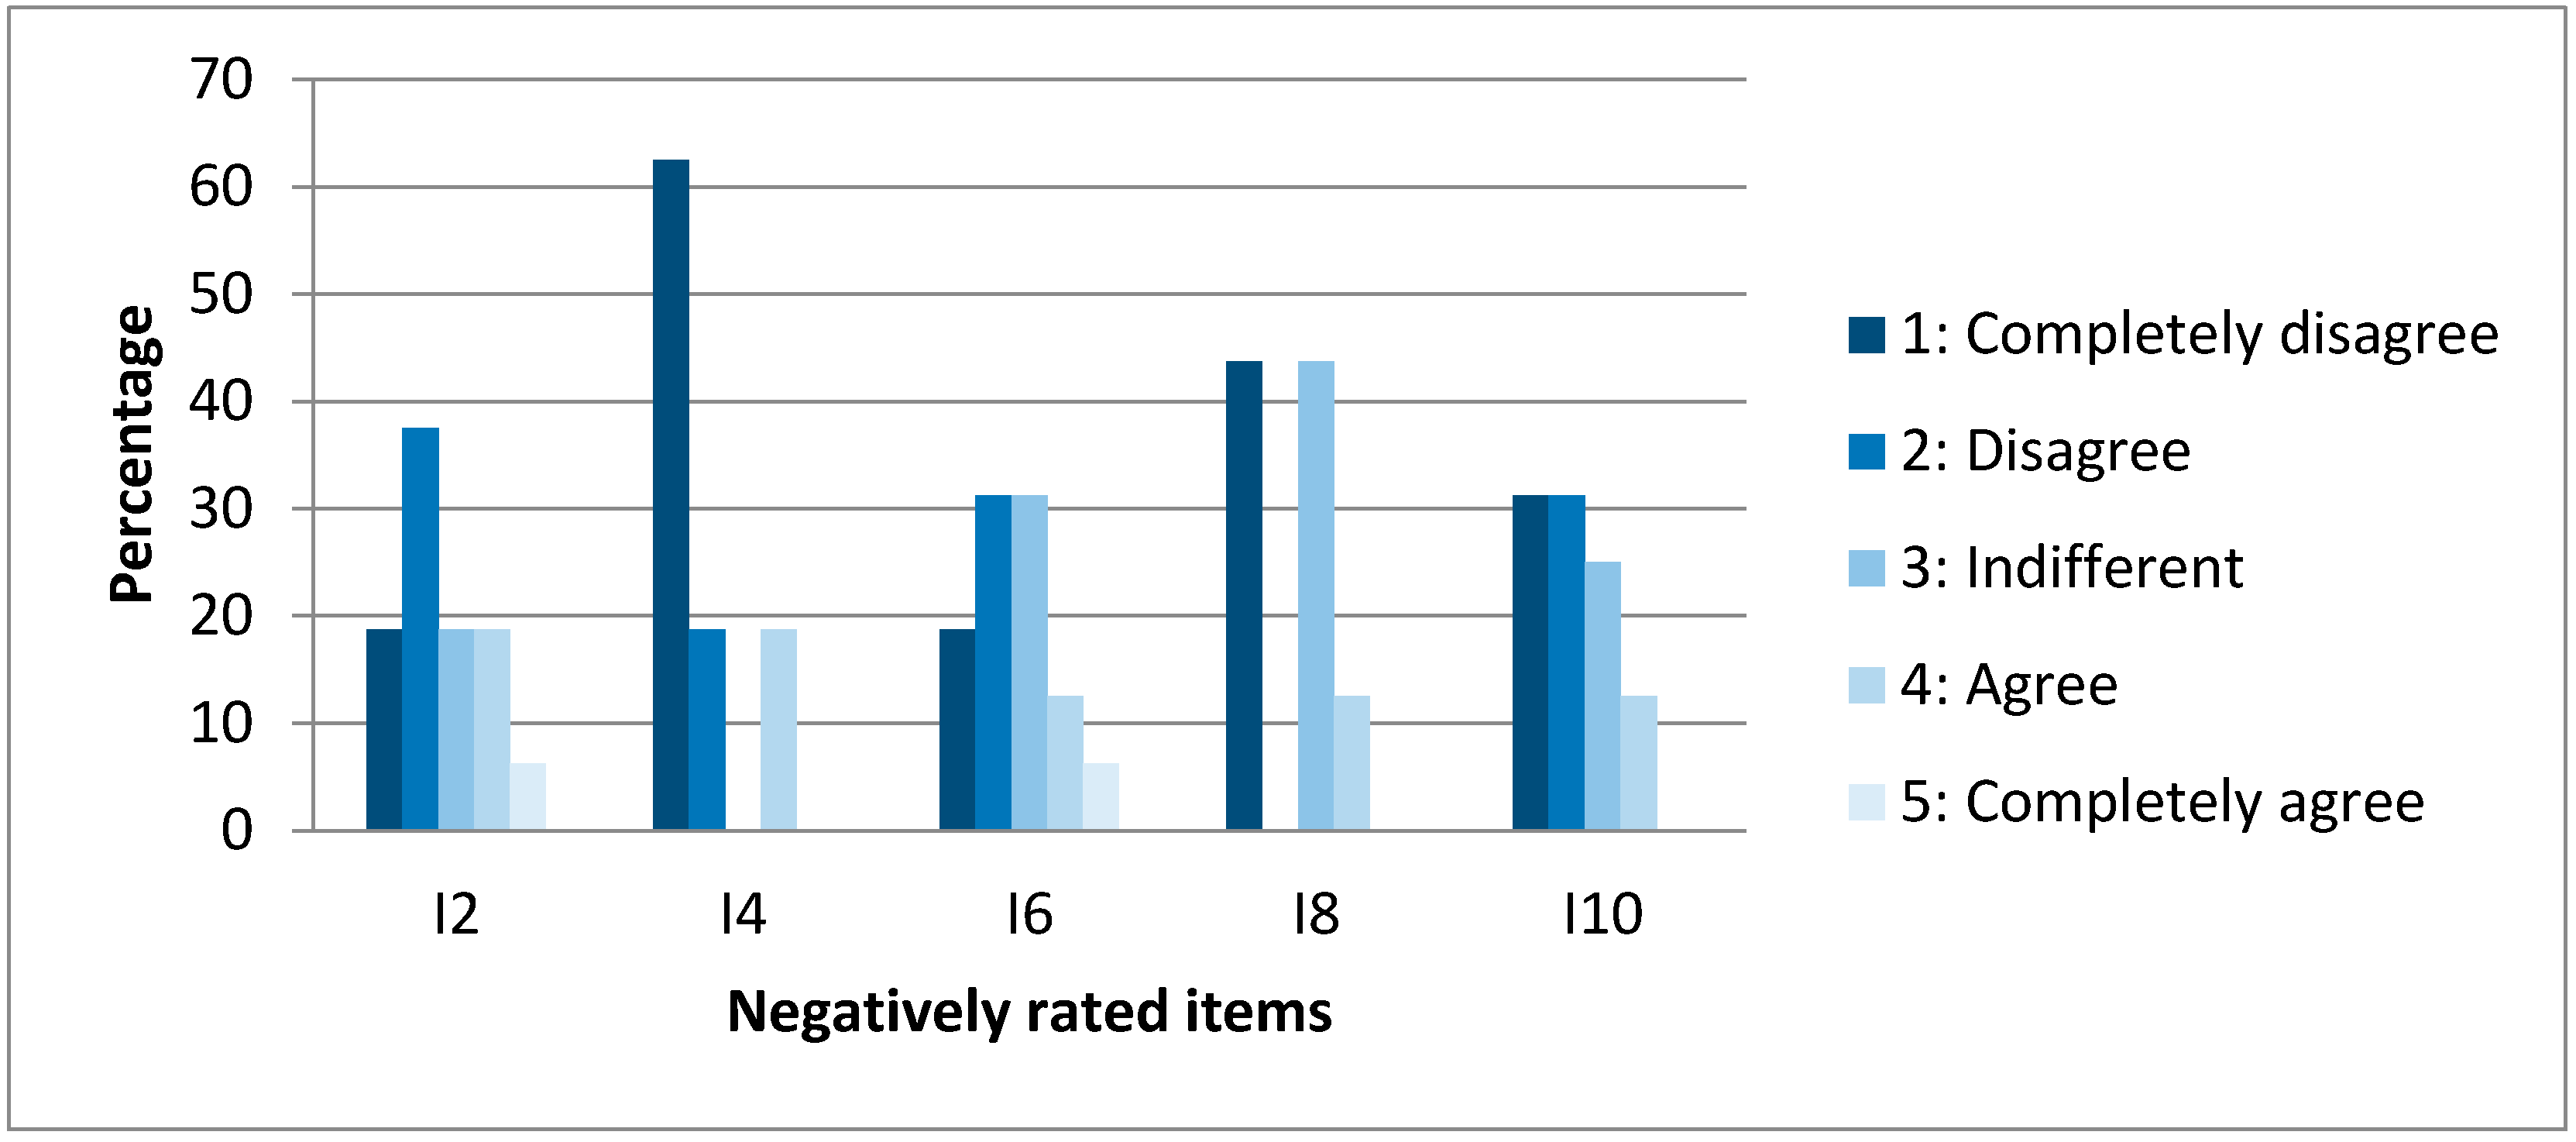
I2.
I found the system unnecessarily complex.
I3.
I thought the system was easy to use.
I4.
I think that I would need the support of a technical person to be able to use this system.
I5.
I found the various functions in this system were well integrated.
I6.
I thought there was too much inconsistency in this system.
I7.
I would imagine that most people would learn to use this system very quickly.
I8.
I found the system very cumbersome to use.
I9.
I felt very confident using the system.
I10.
I needed to learn a lot of things before I could get going with this system.
The score for each item has a scale numbered from 1 to 5, being 1 totally disagree with the statement and 5 totally agree. The participant’s scores for each question are converted to a new number, added together and then multiplied by 2.5 to convert the original scores of 0–40 to 0–100. Sauro & Lewis [56] found that a useful analog to convey a study’s mean SUS score to others involved in the product development process is the traditional school grading scale (0–51.7 = F, 51.8–62.6 = D, 62.7–72.5 = C, 72.6–78.8 = B, 78.9–100 = A). According to Sauro and Lewis [56], a SUS score of over 68 would be considered above average.
The SILVANET application has the operations diagram shown in Figure 1. The arrows in the figure show the sequence of operations in the application, and the dotted lines show optional processes that contribute additional information to the respondent.
The SILVANET application starts asking respondents the following personal data: sex, age, academic level, type of place of residence (urban, rural, and urban–rural) and type of environmental actor (forester, owner farming, town hall, ecologist, and others). Then, in this case study, the application continues by assessing individual preferences for sustainable forest management by showing the respondent six pairs of pictures (example of one pair is shown in Figure 2A,B) of different sites in the Fuenfría valley (Madrid, Spain).
This area is located at coordinates 40°45′ N, 4°5′ W, and comprises altitudes between 1310 and 1790 m, with an annual average temperature of 9.4 °C, annual average precipitation of 1180 mm and a primary vegetation consisting of Pinus sylvestris L. A more detailed description of the characteristics of the area and the data treatment can be found in Pascual et al. [57]. Personal preferences of each respondent are identified by choosing between the set of representative sites shown to the evaluator to enable him/her to state a preference in each of the possible site pairs, and the results are obtained in the form of a preference matrix for each evaluator. This represents the preference between locations through a zeros and ones matrix, having the one value when the element of a row is preferred to the column and zero when the column element is preferred or is indifferent (thus, the diagonal of the matrix consists of elements equal to zero). For the methodological basis for decision-making with multiple participants and a detailed description of the process for characterizing the preferences of groups of evaluators, see Ayuga-Téllez et al. [58].
For each pair of pictures, to make it easier to answer, the respondent is given information on two aspects that enable him/her to build a personal preference:
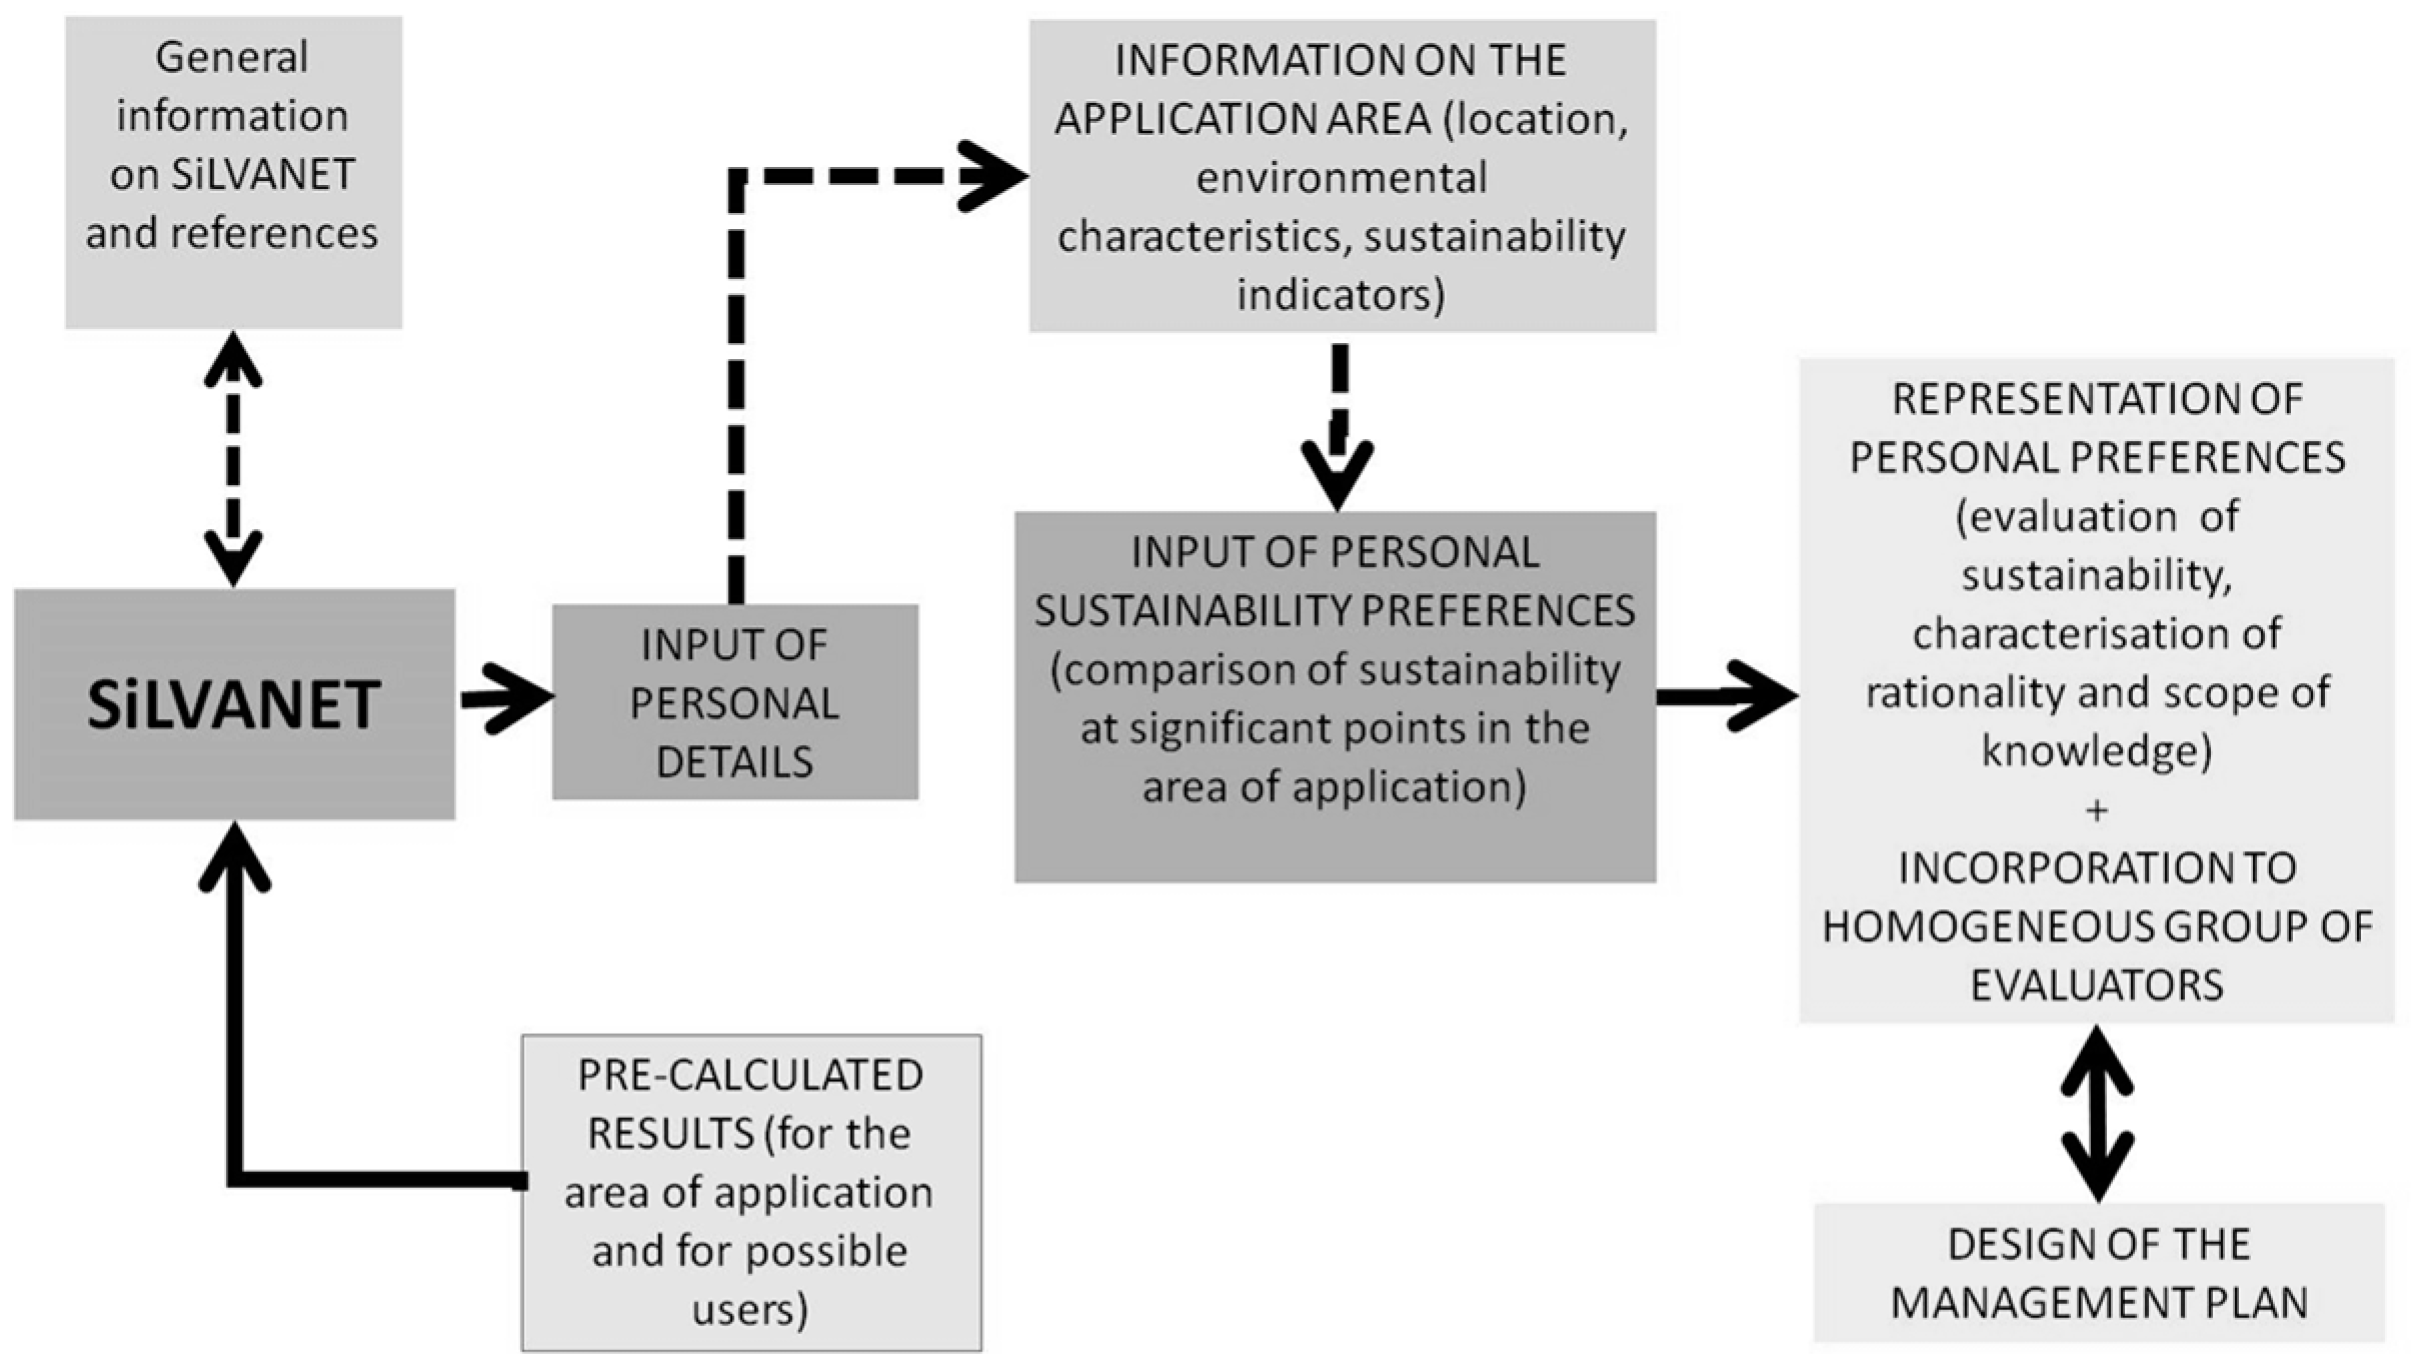
  • Descriptive statistics of the answers by type of environmental actor; and
  • Values of the sustainability indicators.
The information accessible to the respondents on sustainability in the area takes the form of the values for three sustainability indicators [59]: structural diversity, an indicator based on estimated height distribution [58]; timber production [60,61]; and biomass quantity [62]. The indicators are presented as a percentage of separation between the actual natural area and the ideal situation at the points submitted for evaluation, thereby guaranteeing the ability to access the information and enable the evaluators to build their personal opinions. The ideal situation has been obtained from Pinus sylvestris forest management tables for Sistema Central [63].
The preferences representation allows the identification of groups of people with similar systems of preferences. To obtain these groups, we proceed according to the method explained by Martínez-Falero et al. [64], using the divisive and polythetic clustering [65]. In these groups, SILVANET incorporates participatory tools that respondents can learn how different respondents interact with the system. This encourages convergence in the systems of preference. A recent investigation Martínez-Falero et al. [66] about landscape preferences shows that people can be influenced by providing information about management, although this influence is different according to the characteristics of different groups of participants. This is done by assessing the proximity to the target sustainability for the area, the individual’s value function, and the type of order relationship of their preferences, as well as the parameters of the multiple regression model (parametric) formulated with sustainability as the dependent variable (measured with the value function), and the indicators of sustainability and the products between those indicators (which are the terms of the regression function) as the independent variables. The individual’s value function assigns a sustainability preference value to each point based on the opinion of the respondents and is determined by successive approximations based on preference relationships expressed by each respondent and taking account of the general expression of the related set of functions (additive, multiplicative, etc.) [58]. The level of linearity of each individual’s value function and scope of knowledge are also considered (and classified as medium, high or low). These individual data are compared to the findings for the set of communities or evaluator groups, and the individual is assigned to one of the previously characterized groups [64].
Of the 32,766 potential matrices on individual preferences (zero and ones matrices), 5000 were taken and simulated, and all these were then grouped by means of a divisive polythetic classification method [66] in 53 groups. The general characteristics of each group in terms of sex, age, education level, occupation, place of residence and agent typology are determined by random simulation [42]. It is difficult to determine the adequate number of simulations. Most modern software applications are so complex and run in such an interdependent environment that complete testing can never done. Common factors in deciding when to stop are: deadlines, tests cases completed with certain percentage passed, test budget depleted, coverage of code, functionality, requirements or if the bug rate below a certain level [67].
The respondent is shown the descriptors of the individual and community preference and the personal characteristics of the group, along with the sustainability maps for the area generated from his/her own system of preferences and that of the community of individuals similar to him/her, in order to increase his/her knowledge.
The information obtained from respondents is then used to generate the management plan for the area that best adapts to this respondent’s system of preferences. The best management plan is obtained by applying combinatorial optimization algorithms [30]. Combinatorial algorithms follow an iterative process to determine the management plan with the greatest probability of being the best; in our case, the actions that have the greatest likelihood of maximizing the aggregated sustainability value for the whole of the area evaluated.
The application also allows the actor ultimately responsible for the management to incorporate other constraints such as the maximum budget allocated for the implementation the plan, particular actions limited to certain species, age classes or spatial locations, and minimum requirements for obtaining renewable natural resources, among others.
This application uses a modification of the Metropolis algorithm to calculate the best plan [68,69]. When calculating the best plan, it is occasionally necessary to optimize the algorithm by specifying the quantity of the minor perturbation, the different units of action (this case considers each forest structure class, a total of five for the area), and whether the solution is admissible (verifying that in the period of application of the plan all perturbation is compatible with the natural evolution of the forest stand based on current stocks). In addition to obtaining the plan, it also specifies the additional constraints of the agent ultimately responsible for the decision (budget, minimum exploitation of resources, and environmental conditions).
The language used for the programming is Visual Basic 6.0 (Microsoft, Redmond, WA, USA programming by procedures with a Windows XP, Windows Vista or Windows 2007 operating system and a minimum screen resolution requirement of 1280 per 800 pixels.
The results of the SUS were analyzed statistically and described using Statgraphics Centurion VI. To analyze the results using the appropriate statistical tests, a Shapiro-Wilk test was first done for the normality of the global score. Grubb’s test was also applied to atypical data for variables with a normal distribution. Levene’s test was applied to determine the homogeneity of variance, and multiple analysis of variance (ANOVA) to analyze the differences in score between population groups. The t test was used to verify the value of the mean.

3. Results

The odd-numbered items in the SUS questionnaire (I1, I3, I5, I7 and I9) express positive statements on the tool. Most of these scored 4 (agree with the statement), except for I3, which scored mostly 5 (completely agree) and includes the aspect of usability. In total, 56.25% of the respondents gave scores of 4 or 5 to I1; 62.5% to I3; 50% to I5; 75% to I7; and 43.75% to I9, which was the lowest rated in the set, and concerned security in the use of the tool (see Figure 3).
In I1 (“I think that I would like to use this system frequently”), the percentage that gave value 4 or 5 to this item was 56.25%. The mode or most frequent value for this item coincides with the value 4 (according) that was given by seven of the experts.
In I3 (“I thought the system was easy to use”), the percentage that gave value 4 or 5 to this item was 62.5%. The mode for this item coincides with the value 5 (totally agree) that was given by seven of the experts.
In I5 (“I found the various functions in this system were well integrated”), the percentage that gave value 4 or 5 to this item was 50%. In this item, 31.25% rated with a 3 (indifferent) n. The mode for this item matches the value 4 (agreed) that was given by seven of the experts.
In I7 (“I would imagine that most people would learn to use this system very quickly”), the percentage that gave value 4 or 5 to this item was 75%. The mode for this item coincides with the value 4 (according) that was given by eight of the experts.
In I9 (“I felt very confident using the system”), the percentage that gave value 4 or 5 to this item was 43.75%. In this item, 31.25% rated with a 3 (indifferent) this question. The mode for this item coincides with the value 4 (agreed) that was given by six of the experts.
The even-numbered items in the SUS questionnaire (I2, I4, I6, I8 and I10) express negative statements on the tool. Most of these show two modes, with the exception of I2 which has a score of 2 (disagree with the statement) and I4, with a score of 1 (completely disagree). I2 assesses the complexity of the tool, and I4 the need for expert help. In total, 56.25% of the respondents gave scores of 1 or 2 to I2; 81.25% to I4; 50% to I6; 43.75% to I8; and 62.5% to I10, while I8 was the worst rated of the set. Over 50% believe the tool is inconvenient to use (see Figure 4).
In I2 (“I found the system unnecessarily complex”), the percentage that gave value 1 or 2 to this item was 56.25%. The mode or most frequent value for this item coincides with the value 2 (little agreement) that was given by six of the experts.
In I4 (“I think that I would need the support of a technical person to be able to use this system”), the percentage that gave value 1 or 2 to this item was 81.25%. The mode for this item matches the value 1 (none of the above) was given by 10 of the reviewers.
In I6 (“I thought there was too much inconsistency in this system”), the percentage that gave value 1 or 2 to this item was 50%. In this item, 31.25% rated with a 3 (indifferent) this question. The mode for this item matches the values 2 (little agreement) and 3, with five experts for each value.
In I8 (“I found the system very cumbersome to use”), the percentage that gave value 1 or 2 to this item was 43.75%. The mode for this item coincide with values 1 (nothing agrees) and 3 (indifferent), with seven experts for each value.
In I10 (“I need to learn a lot of things before I could get going with this system”), the percentage that gave value 1 or 2 to this item was 62.5%. The mode for this item coincides with values 1 and 2 (little or no agreement) with five experts for each value and having an important weight the experts who were indifferent to this statement (25% gave a value of 3). The SUS scores are shown in Table 1.
The group that gives the lowest average score and highest VC is SE—software design experts. This group considers the usability of the tool to be unacceptable (grade F). Group F—users who are not experts in management—is the following in scoring and VC. This group considers the usability of the tool to be acceptable, but only minimally (grade D). Group FE—expert management users—is the next in scoring and VC. This group considers the usability of the tool to be good (grade B), as does the SF group, which has the lowest VC of all the groups. The total score shows a high VC, and grade D on the scale.
It should be noted that the scores obtained come from a normal distribution (Shapiro–Wilk W-test = 0.937018; p-value = 0.3116). The existence of atypical data cannot be accepted in the sample (Grubb’s test statistic = 2.13177; p-value = 0.3453).
No statistically significant differences were detected between groups, between sexes, or in the interaction between them, with a significance level of 5%, as can be seen from the ANOVA in Table 2.
The homogeneity of variances between groups was verified (Levene’s statistic = 1.92857; p = 0.178838).
The hypothesis was verified that the mean SUS scores to determine the usability of SILVANET is the same as the average value of 68, attained in over 500 tests on different products. The hypothesis that the average value is over 68 cannot be rejected with a confidence level of 95% (t statistic = −0.5685; p-value = 0.2891).
The interval for global scoring at a 95% confidence level (55.5; 75.5) shows that the respondents consider that the usability of the product is acceptable.
Finally, the respondents’ answers to the open question in the survey indicate that the tool is easy to use, but the results shown for management and its interpretation are somewhat complex. It needs to be improved in terms of the explanation of the calculations, the results of the tool and its overall utility. The appearance is rather old-fashioned and detracts from the attractiveness of the product. The help is too technical and the explanation therefore loses interest and attractiveness.

4. Discussion

The lack of a standard in the evaluation of software in public participation has often led to difficulties in comparing different participatory experiences and interpreting the real impact of participation in the sustainable management of natural resources [7]. However, it is helpful to develop various and flexible technologies to assist the process of making forest plans [32], and so more studies are required to explore the impact of these instruments. The scarcity of IT tools focused on public participation in forestry management is a clear indication of the difficulty of this approach.
Previous research shows a positive relationship between public participation activities and acceptance of forest management practices on the ground [70,71]. One of the greatest drawbacks to further participation with IT tools in forest management plans is the frustration caused by the difficulty of using them. Therefore, this work attempts to address this important aspect of public participation by improving IT tools for public participation. The ease of use and satisfaction shown by the tool by both types of experts (forest technicians and computer technicians) with the tool is encouraging; however, these results need to be confirmed by testing SILVANET with typical members of the public.
The work of Calderón et al. [72] assesses a geoportal designed without considering usability criteria, making this study comparable to the one presented in this work. In this case, the result of the SUS questionnaire was 47.5% satisfaction for basic users and 55% satisfaction with the website for advanced users; average usability in terms of satisfaction is therefore 51.25%. These results are lower than those in the present study, in which the two groups of basic users had a result of 47.5% and 61.25%, and the results for the advanced group were 75.62% and 76.25%. Average usability as a function of satisfaction with this software was 65.16%.
The average usability figure is lower than the average values for the tools studied in the work of Lewis and Sauro [52], although near the usability of the mobile phones analyzed. The usability of this tool is greater or equal to that of 41% of the products analyzed, whereas the expert management users value the usability of this tool as over or equal to 70% of the products analyzed [55].
The results of the questionnaire show an average acceptance of the usability of the product, rated grade D or C by the potential users of the tool. The IT experts were the most critical of the software, as they focus more on technical aspects such as language, graphics quality and speed, whereas the management experts focused on the advantages of the software in terms of contents and results.
If we regard the usability of a product as an iterative process, it is useful and necessary to continue the work on this project to ensure the tool responds to the requirements of its potential users and improves certain aspects where immediate action is required.

5. Conclusions

The results of this study suggest that SILVANET is easy for IT experts and forest managers to use without the help of technical personnel (Items: I3 and I4). The package does not require costly material resources and is adaptable to forest stands in different areas and with different characteristics.
The technical experts who tested SILVANET in this study found the software not to be complex (Item: I2) and were happy to use it (Item: I1).
The users found software functionalities could be improved (Items: I5 and I6) and found some inconsistencies in using the software (Items: I6, I8, and I9).
The questionnaire to evaluate the quality of use of the tool reported satisfaction of 65%, which is slightly lower than the industry standard of 68%. The forestry management experts classify its usability as good, although non-expert users give it a lower rating.
The software was applied in a specific location and with specific people. However, with more work, it could be adaptable for any kind of users. For example, further improvements can be implemented, such as an improvement in picture quality and in debugging of software. To be more useful, the tool requires improvements in its external appearance and a simplification of the technical explanations.

Acknowledgments

The study was funded by the Ministry of Science and Technology (National R + D + i plan) and the Madrid Region Department of Education.

Author Contributions

J.E.M.F. and E.A.T. conceived and designed the experiments; C.G.G. and M.A.G.O. performed the experiments; E.A.T. and A.S.D.M.G analyzed the data; E.A.T. and A.S.D.M.G wrote the paper.

Conflicts of Interest

The authors declare no conflict of interest.

References

  1. Wiersum, K.F. 200 years of sustainability in forestry: Lessons from history. Environ. Manag. 1995, 19, 321–329. [Google Scholar] [CrossRef]
  2. Berlyn, G.P.; Ashton, P.M.S. Sustainability of forests. J. Sustain. For. 1996, 3, 77–89. [Google Scholar] [CrossRef]
  3. Barrette, Y.; Gauthier, G.; Paquette, A. Aménagement de la forêt pour des fins de production ligneuse. In Manuel de Foresterie; Les Presses de l’Université Laval: Québec City, QC, Canada, 1996; pp. 648–671. [Google Scholar]
  4. Bousson, E. Gestion Forestière Intégrée: Approche Basée sur L’analyse Multicritère; Presses Agronomiques de Gembloux: Gembloux, Belgium, 2003. [Google Scholar]
  5. Food and Agriculture Organization of the United Nations (FAO). 2015. Available online: www.fao.org/forestry/sfm/en (accessed on 15 June 2017).
  6. Dávalos Sotelo, R.; Morosini Cordero, F. Desarrollo sostenible, medio ambiente y economía en el sector forestal. Madera y Bosques 2000, 6, 3–12. [Google Scholar] [CrossRef]
  7. Buchy, M.; Hoverman, S. Understanding public participation in forest planning: A review. For. Policy Econ. 2000, 1, 15–25. [Google Scholar] [CrossRef]
  8. Leskinen, L.A. Purposes and challenges of public participation in regional and local forestry in Finland. For. Policy Econ. 2004, 6, 605–618. [Google Scholar] [CrossRef]
  9. Mbairamadji, J. Ecosystemic forest management approach to ensure forest sustainability and socio-economic development of forest dependent communities: Evidence from Southeast Cameroon; Field Actions Science Reports 3; Online since 24 September 2010, connection on 16 April 2013. Field Actions Sci. Rep. 2009, 3. Available online: http://factsreports.revues.org/282 (accessed on 15 June 2017).
  10. Ayuga-Téllez, E.; González-García, C.; Grande-Ortíz, M.Á.; Martín-Fernández, S.; Martinez-Falero, J.E.; Romero-Toro-Gascueña, I. SILVANET: Aplicación informática para incorporar la opinión pública en la gestión forestal sostenible. In Proceedings of the Libro de actas del VII Congreso de Agroingeniería y Ciencias Hortícolas, Madrid, Spain, 26–29 August 2013; pp. 1716–1721. Available online: http://www.agroingenieria.es/documentos/Libro_de_actas_completo_dic_2014_final.pdf (accessed on 7 June 2017).
  11. Cabot, J.; Easterbrook, S.; Horkoff, J.; Lessard, L.; Liaskos, S.; Mazon, J.N. Integrating sustainability in decision-making processes: A modelling strategy. In Proceedings of the 31st IEEE International Conference on Software Engineering-Companion Volume (ICSE-Companion 2009), Vancouver, BC, Canada, 16–24 May 2009; pp. 207–210. [Google Scholar]
  12. Pokharel, R.K.; Larsen, H.O. Local vs. official criteria and indicators for evaluating community forest management. Forestry 2007, 80, 183–192. [Google Scholar] [CrossRef]
  13. Requardt, A. Pan-European Criteria and Indicators for Sustainable Forest Management: Networking Structures and Data Potentials of International Data Sources; Universität Hamburg: Hamburg, Germany, 2007. [Google Scholar]
  14. Hickey, G.M.; Innes, J.L. Indicators for demonstrating sustainable forest management in British Columbia, Canada: An international review. Ecol. Indic. 2008, 8, 131–140. [Google Scholar] [CrossRef]
  15. Maes, W.H.; Fontaine, M.; Rongé, K.; Hermy, M.; Muys, B. A quantitative indicator framework for stand level evaluation and monitoring of environmentally sustainable forest management. Ecol. Indic. 2011, 11, 468–479. [Google Scholar] [CrossRef]
  16. Holvoet, B.; Muys, B. Sustainable forest management worldwide: A comparative assessment of standards. Int. For. Rev. 2004, 6, 99–122. [Google Scholar] [CrossRef]
  17. Khadka, C.; Vacik, H. Comparing a top-down and bottom-up approach in the identification of criteria and indicators for sustainable community forest management in Nepal. Forestry 2012, 85, 145–158. [Google Scholar] [CrossRef]
  18. Vainikainen, N.; Kangas, A.; Kangas, J. Empirical study on voting power in participatory forest planning. J. Environ. Manag. 2008, 88, 173–180. [Google Scholar] [CrossRef] [PubMed]
  19. Glass, J.H.; Scott, A.J.; Price, M.F. The power of the process: Co-producing a sustainability assessment toolkit for upland estate management in Scotland. Land Use Policy 2013, 30, 254–265. [Google Scholar] [CrossRef]
  20. Webler, T.S. Voices from the Forest: What Participants Expect of a Public Participation Process. Soc. Nat. Resour. 1999, 12, 437–453. [Google Scholar] [CrossRef]
  21. Rogge, E.; Dessein, J.; Verhoeve, A. The organisation of complexity: A set of five components to organise the social interface of rural policy making. Land Use Policy 2013, 35, 329–340. [Google Scholar] [CrossRef]
  22. Saarikoskia, H.; Mustajoki, J.; Marttunen, M. Participatory multi-criteria assessment as “opening up” vs. “closing down” of policy discourses: A case of old-growth forest conflict in Finnish Upper Lapland. Land Use Policy 2013, 32, 329–336. [Google Scholar] [CrossRef]
  23. Raitio, K.; Harkki, S. The disappearing chain of responsibility: Legitimacy challenges in the political governance of Finnish Forest and Park Service. Land Use Policy 2014, 39, 281–291. [Google Scholar] [CrossRef]
  24. Booth, A.; Halseth, G. Why the public thinks natural resources public participation processes fail: A case study of British Columbia communities. Land Use Policy 2011, 28, 898–906. [Google Scholar] [CrossRef]
  25. Faehnlea, M.; Tyrväinen, L. A framework for evaluating and designing collaborative planning. Land Use Policy 2013, 34, 332–341. [Google Scholar] [CrossRef]
  26. Muroa, M.; Jeffreya, P. A critical review of the theory and application of social learning in participatory natural resource management processes. J. Environ. Plan. Manag. 2008, 51, 325–344. [Google Scholar] [CrossRef]
  27. Kangas, A.; Saarinen, N.; Saarikoski, H.; Leskinen, L.A.; Hujala, T.; Tikkanen, J. Stakeholder perspectives about proper participation for Regional Forest Programmes in Finland. For. Policy Econ. 2010, 12, 213–222. [Google Scholar] [CrossRef]
  28. Cantiani, M.G. Forest planning and public participation: A possible methodological approach. iFor. Biogeosci. For. 2012, 5, 72–82. [Google Scholar] [CrossRef]
  29. Raitio, K. New institutional approach to collaborative forest planning on public land: Methods for analysis and lessons for policy. Land Use Policy 2012, 29, 309–316. [Google Scholar] [CrossRef]
  30. Martín-Fernández, S.; Martínez-Falero, M.; Valentín-Gamazo, M. Optimization Methods to Identify the Best Management Plan. In Quantitative Techniques in Participatory Forest Management; Martínez-Falero, E., Martín-Fernández, S., García-Abril, A., Eds.; CRC Press: Boca Ratón, FL, USA, 2014; pp. 421–498. [Google Scholar]
  31. Maier, C.; Lindner, T.; Winkel, G. Stakeholders’ perceptions of participation in forest policy: A case study from Baden-Württemberg. Land Use Policy 2014, 39, 166–176. [Google Scholar] [CrossRef]
  32. Bruña-García, X.; Marey-Pérez, M.F. Public participation: A need of forest planning. Ital. Soc. Silvic. For. Ecol. 2014, 7, 216–226. [Google Scholar] [CrossRef]
  33. Brown, G.; Reed, P. Values compatibility analysis: Integrating public values in a forest planning decision support system. Appl. Spat. Anal. Policy 2012, 5, 31. [Google Scholar] [CrossRef]
  34. Martínez-Falero, E.; García-Abril, A.; García-Angulo, C.; Martín-Fernández, S. A Computer-Based Decision-Making Support System to Incorporate Personal Preferences in Forest Management. In Quantitative Techniques in Participatory Forest Management; Martínez-Falero, E., Martín-Fernández, S., García-Abril, A., Eds.; CRC Press: Boca Ratón, FL, USA, 2014; pp. 557–574. [Google Scholar]
  35. Moffett, A.; Garson, J.; Sarkar, S. MultCSync: A software package for incorporating multiple criteria in conservation planning. Environ. Model. Softw. 2005, 20, 1315–1322. [Google Scholar] [CrossRef]
  36. Mendoza, G.A.; Dalton, W.J. Multi-stakeholder assessment of forest sustainability: Multi-criteria analysis and the case of the Ontario forest assessment system. For. Chron. 2005, 81, 222–228. [Google Scholar] [CrossRef]
  37. Hämäläinen, R.P.; Lauri, H. HIPRE 3+ User’s Guide; Systems Analysis Laboratory; Helsinki University of Technology: Helsinki, Finland, 1995. [Google Scholar]
  38. Hjortsø, C.N. Enhancing public participation in natural resource management using Soft OR—An application of strategic option development and analysis in tactical forest planning. Eur. J. Oper. Res. 2004, 152, 667–683. [Google Scholar] [CrossRef]
  39. Pasanen, K.; Kurttila, M.; Pykäläinen, J.; Kangas, J.; Leskinen, P. MESTA-non-industrial private forest owners’ decision-support environment for the evaluation of alternative forest plans over the internet. Int. J. Inf. Technol. Decis. Mak. 2005, 4, 601–620. [Google Scholar] [CrossRef]
  40. Pauwels, D.; Lejeune, P.; Rondeux, J. A decision support system to simulate and compare silvicultural scenarios for pure even-aged larch stands. Ann. For. Sci. 2007, 64, 345–353. [Google Scholar] [CrossRef]
  41. Lexer, M.J.; Vacik, H.; Palmetzhofer, D.; Oitzinger, G. A decision support tool to improve forestry extension services for small private landowners in southern Austria. Comput. Electron. Agric. 2005, 49, 81–102. [Google Scholar] [CrossRef]
  42. Martínez-Falero, J.E.; Martín-Fernández, S.; García-Abril, A.D. SILVANET: Participación Pública para la Gestión Forestal Sostenible; Fundación del Conde del Valle de Salazar: Madrid, Spain, 2010. [Google Scholar]
  43. El-Halees, A.M. Software Usability Evaluation Using Opinion Mining. J. Softw. 2014, 9, 343–349. [Google Scholar] [CrossRef]
  44. Dubey, S.K.; Rana, A.; Sharma, A. Usability Evaluation of Object Oriented Software System using Fuzzy Logic Approach. Int. J. Comput. Appl. 2012, 43, 1–6. [Google Scholar]
  45. Jeong, J.S.; García-Moruno, L.; Hernández-Blanco, J.; Montero-Parejo, M.J. Evaluación de una aplicación web con participación pública en la planificación espacial y toma de decisiones para la integración de construcciones rurales. Informes de la Construcción 2015, 67, e098. [Google Scholar] [CrossRef]
  46. Bevan, N. International Standards for Usability Should Be More Widely Used. J. Usability Stud. 2009, 4, 106–113. [Google Scholar]
  47. Hassan, Y. Factores de diseño web orientado a la satisfacción y no-frustración de uso. Revista Española de Documentación Científica 2006, 29, 239–257. [Google Scholar]
  48. Brooke, J. SUS-A quick and dirty usability scale. Usability Eval. Ind. 1996, 189, 4–7. [Google Scholar]
  49. Serrano Angulo, J.; Cebrián Robles, D. Usabilidad y Satisfacción de la e-Rúbrica; Número monográfico dedicado a Evaluación formativa mediante Erúbricas. REDU: Revista de Docencia Universitaria 2014, 12, 177–195. [Google Scholar]
  50. Kortum, P.; Peres, S.C. The Relationship between System Effectiveness and Subjective Usability Scores Using the System Usability Scale. Int. J. Hum. Comput. Interact. 2014, 30, 575–584. [Google Scholar] [CrossRef]
  51. Kortum, P.T.; Bangor, A. Usability Ratings for Everyday Products Measured With the System Usability Scale. Int. J. Hum. Comput. Interact. 2013, 29, 67–76. [Google Scholar] [CrossRef]
  52. Lewis, J.R.; Sauro, J. The factor structure of the system usability scale. In Human Centered Design; Springer: Berlin/Heidelberg, Germany, 2009; pp. 94–103. [Google Scholar]
  53. Bangor, A.; Kortum, P.; Miller, J. Determining what individual SUS scores mean: Adding an adjective rating scale. J. Usability Stud. 2009, 4, 114–123. [Google Scholar]
  54. Tullis, T.S.; Stetson, J.N. A comparison of questionnaires for assessing website usability. In Proceedings of the Usability Professional Association Conference, Minneapolis, MN, USA, 7–11 June 2004; pp. 1–12. [Google Scholar]
  55. Sauro, J. Measuring Usability with the System Usability Scale (SUS). 2011. Available online: http://www.measuringusability.com/sus.php (accessed on 10 October 2016).
  56. Sauro, J.; Lewis, J.R. Quantifying the User Experience: Practical Statistics for User Research, 1st ed.; Morgan Kauffman: San Francisco, MA, USA, 2012; p. 295. [Google Scholar]
  57. Pascual, C.; Garcia-Abril, A.; Garcia-Montero, L.G.; Martin-Fernandez, S.; Cohen, W.B. Object-based semi-automatic approach for forest structure characterization using lidar data in heterogeneous Pinus sylvestris stands. For. Ecol. Manag. 2008, 255, 3677–3685. [Google Scholar] [CrossRef]
  58. Ayuga-Téllez, E.; González-García, C.; Martínez-Falero, J.E. Multiparticipant decision-making. In Quantitative Techniques in Participatory Forest Management; Martínez-Falero, E., Martín-Fernández, S., García-Abril, A., Eds.; CRC Press: Boca Ratón, FL, USA, 2014; pp. 499–556. [Google Scholar]
  59. Núñez, M.V.; Tejera, R.; García-Abril, A.; Ayuga-Téllez, E.; Martínez-Falero, E. Criteria and Indicators for Sustainable Forest Management, In Quantitative Techniques in Participatory Forest Management; Martínez-Falero, E., Martín-Fernández, S., García-Abril, A., Eds.; CRC Press: Boca Ratón, FL, USA, 2014; pp. 135–178. [Google Scholar]
  60. Monserud, R.A. Evaluating forest models in a sustainable forest management context. For. Biom. Model. Inf. Sci. 2003, 1, 35–47. [Google Scholar]
  61. Siry, J.P.; Cubbage, F.W.; Ahmed, M.R. Sustainable forest management: Global trends and opportunities. For. Policy Econ. 2005, 7, 551–561. [Google Scholar] [CrossRef]
  62. Prévosto, B.; Balandier, P. Influence of nurse birch and Scots pine seedlings on early aerial development of European beech seedlings in an open-field plantation of Central France. Forestry 2007, 80, 253–264. [Google Scholar] [CrossRef]
  63. García-Abejón, J.L.; Gómez-Loranca, J.A. Tablas de Producción de Densidad Variable para Pinus sylvestris L. en el Sistema Central; Instituto Nacional de Investigaciones Agrarias (INIA): Madrid, Spain, 1984; ISBN 84-7498-189-1. [Google Scholar]
  64. Martínez-Falero, E.; Martín-Fernández, S.; Orol, A. Assessment of sustainability based on individual preferences. In Quantitative Techniques in Participatory Forest Management; Martínez-Falero, E., Martín-Fernández, S., García-Abril, A., Eds.; CRC Press: Boca Ratón, FL, USA, 2014; pp. 367–420. [Google Scholar]
  65. Martínez-Falero, J.E.; Ayuga-Téllez, E.; González-García, C. Estudio comparativo de distintas funciones núcleo para la obtención del mejor ajuste según el tipo de datos. Qüestiió 1992, 16, 3–26. [Google Scholar]
  66. Martinez-Falero, E.; Gonzalez-Alonso, S. Quantitative Techniques in Landscape Planning; CRC Press: Boca Ratón, FL, USA, 1994; p. 288. [Google Scholar]
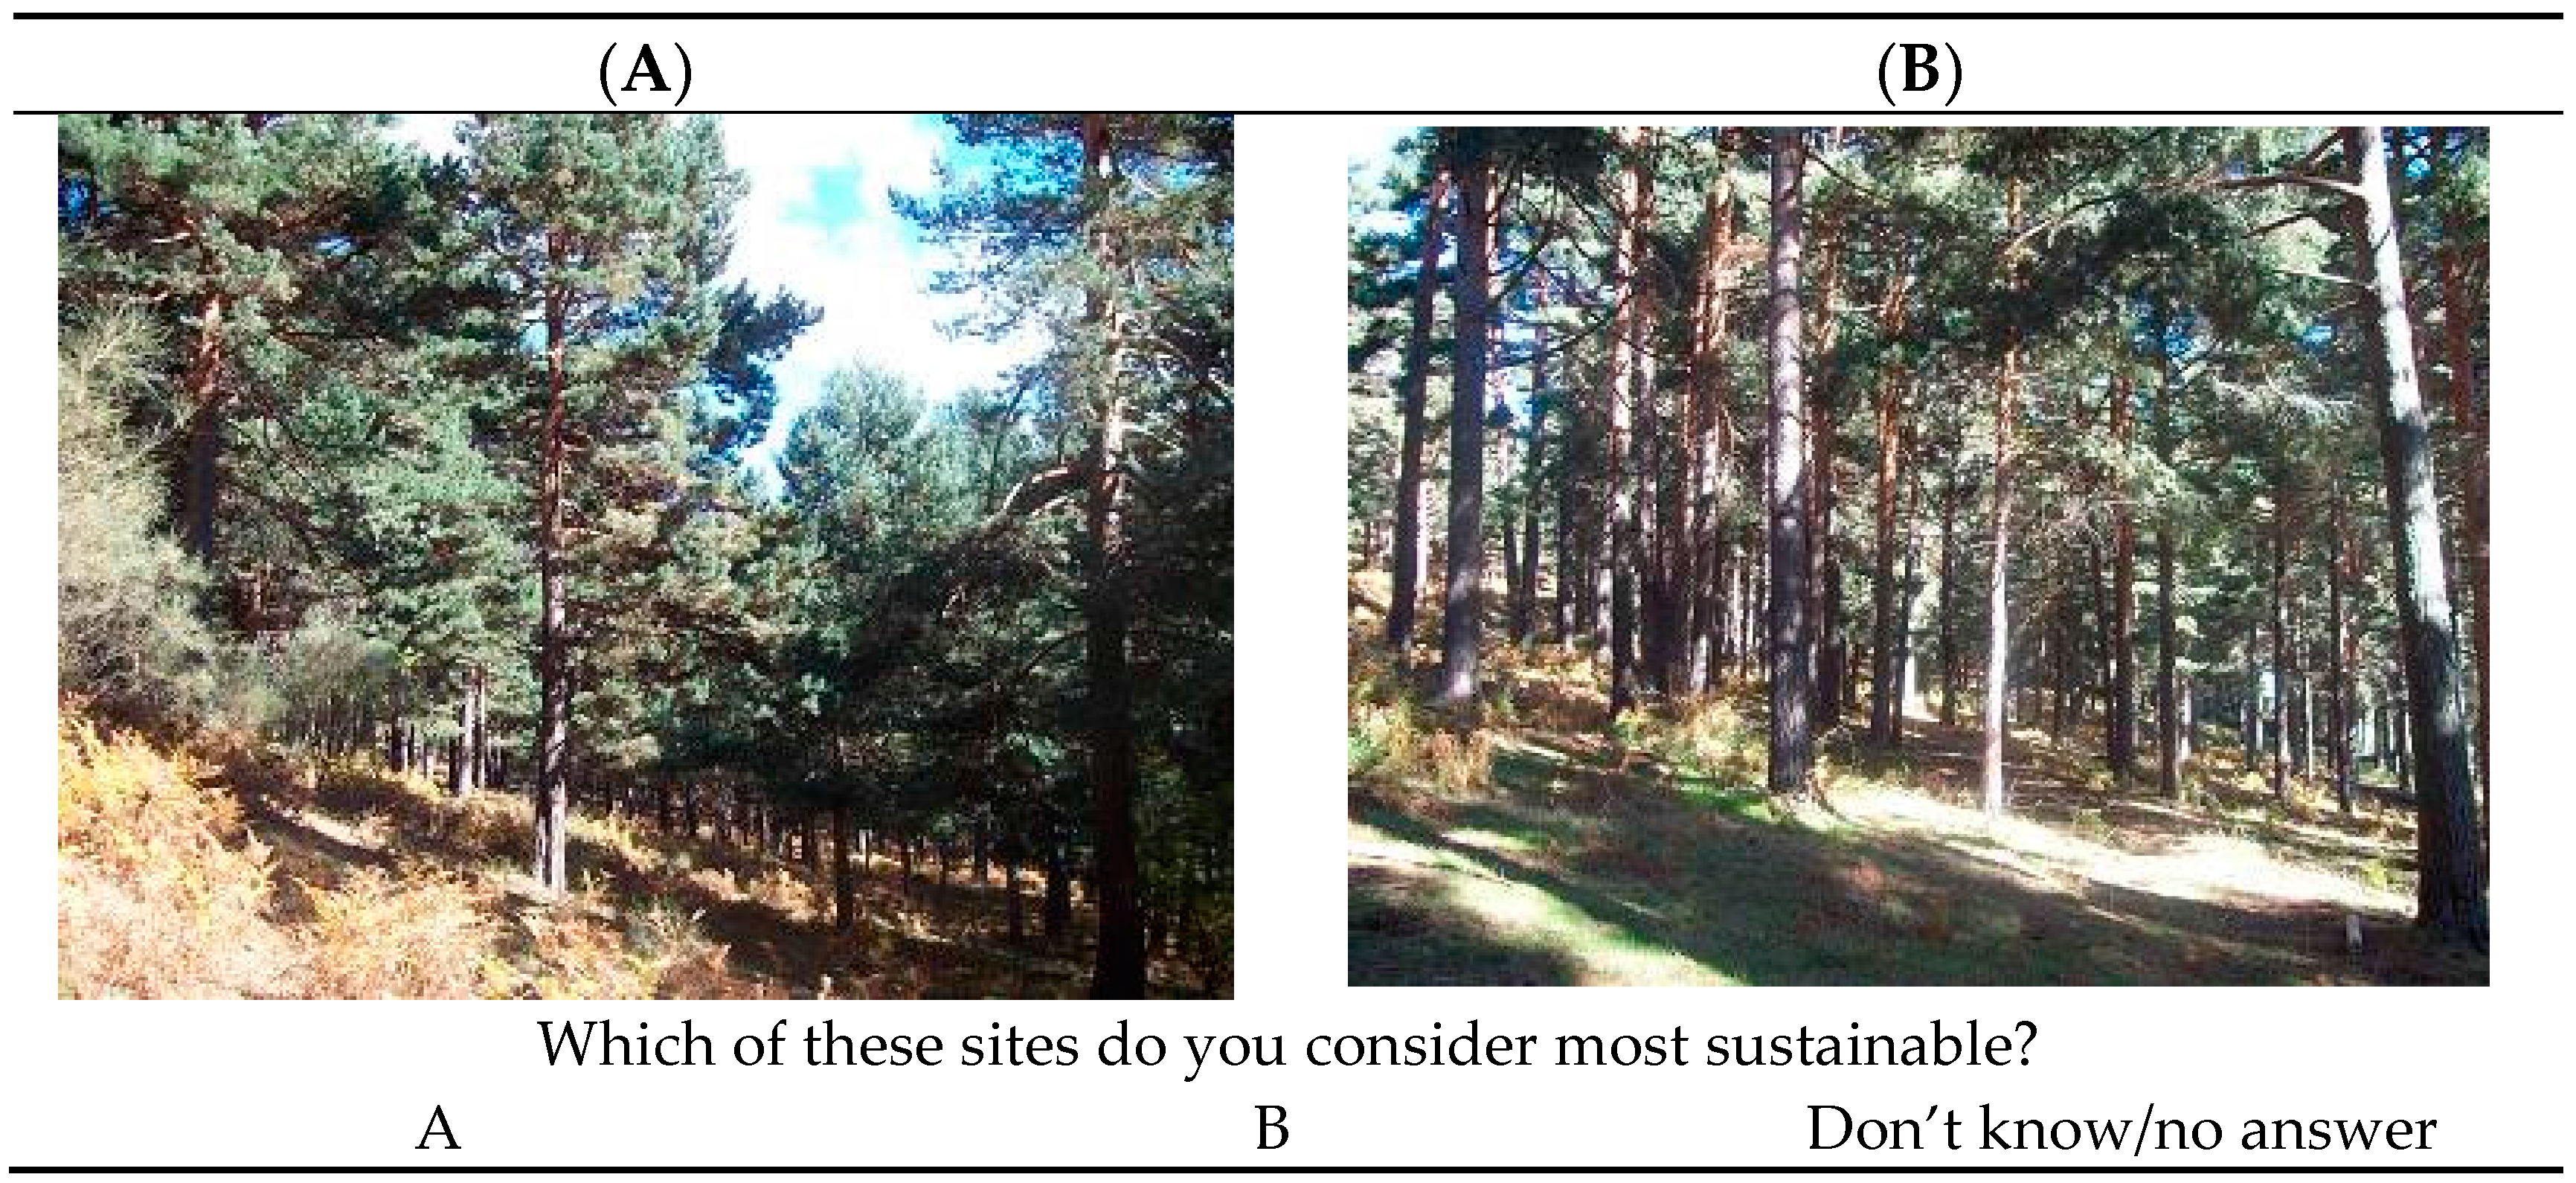
  67. Van der Wal, R.; Miller, D.; Irvine, J.; Fiorini, S.; Amar, A.; Yearley, S.; Robin, G.; Dandy, N. The influence of information provision on people’s landscape preferences: A case study on understorey vegetation of deer-browsed woodlands. Landsc. Urban Plan. 2014, 124, 129–139. [Google Scholar] [CrossRef]
  68. Software GA Test, 2015. Revised 17 December 2015. Available online: http://www.softwareqatest.com/qatfaq2.html#FAQ2_11 (accessed on 10 October 2016).
  69. Metropolis, N.; Rosenbluth, A.W.; Rosenbluth, M.N.; Teller, A.H.; Teller, E. Equations of State Calculations by Fast Computing Machines. J. Chem. Phys. 1953, 21, 1087–1092. [Google Scholar] [CrossRef]
  70. Beckley, T.; Parkins, J.; Sheppard, S. Public Participation in Sustainable Forest Management: A Reference Guide; Sustainable Forest Management Network: Edmonton, AB, Canada, 2006; p. 55. [Google Scholar]
  71. Sarvašová, Z.; Dobšinská, Z.; Šálka, J. Public participation in sustainable forestry: The case of forest planning in Slovakia. iForest 2014, 7, 414–422. Available online: http://www.sisef.it/iforest/pdf/?id=ifor1174-007 (accessed on 12 January 2017). [CrossRef]
  72. Calderón, L.J.; Campoverde, J.Y.; Hoehne, A.V. El usuario como factor de éxito en el diseño de un geoportal. GeoFocus. Revista Internacional de Ciencia y Tecnología de la Información Geográfica 2014, 14, 181–210. [Google Scholar]
Figure 1. Diagram of operations for relating the SILVANET program and the user.
Sustainability 09 01200 g001
Figure 2. Example of a screen displayed to the user to state his/her preferences.
Sustainability 09 01200 g002
Figure 3. Bar chart of positively rated items showing user satisfaction.
Sustainability 09 01200 g003
Figure 4. Bar chart of negatively rated items showing the lack of user satisfaction.
Sustainability 09 01200 g004
Table 1. Descriptive statistics of the results of the questionnaire.
FESESFFTotal
Average75.6247.5076.2561.2565.16
SD15.7320.829.2422.1320.01
VC (%)20.8143.8212.1236.1230.71
(SD: Standard Deviation; VC: Coeff. of variation).
Table 2. ANOVA results for SUS score.
SourceSum of SquaresGlMean SquareReason-Fp-Value
A: group1290.463430.151.550.2754
B: sex500.001500.001.800.2164
Interactions AB870.273290.091.040.4238
Residual2220.838277.60
Total (corrected)6005.8615
Note: All reasons-F are based on the residual mean square error.

