Using LMDI to Analyze the Decoupling of Carbon Dioxide Emissions from China’s Heavy Industry

1
Collaborative Innovation Center for Energy Economics and Energy Policy, China Institute for Studies in Energy Policy, School of Management, Xiamen University, Xiamen 361005, Fujian, China
2
The School of Economics, China Center for Energy Economics Research, Xiamen University, Xiamen 361005, Fujian, China
*
Author to whom correspondence should be addressed.
Sustainability 2017, 9(7), 1198; https://doi.org/10.3390/su9071198
Submission received: 9 May 2017
/
Revised: 29 June 2017
/
Accepted: 5 July 2017
/
Published: 7 July 2017
(This article belongs to the Section Energy Sustainability)
Abstract
:China is facing huge pressure on CO2 emissions reduction. The heavy industry accounts for over 60% of China’s total energy consumption, and thus leads to a large number of energy-related carbon emissions. This paper adopts the Log Mean Divisia Index (LMDI) method based on the extended Kaya identity to explore the influencing factors of CO2 emissions from China’s heavy industry; we calculate the trend of decoupling by presenting a theoretical framework for decoupling. The results show that labor productivity, energy intensity, and industry scale are the main factors affecting CO2 emissions in the heavy industry. The improvement of labor productivity is the main cause of the increase in CO2 emissions, while the decline in energy intensity leads to CO2 emissions reduction, and the industry scale has different effects in different periods. Results from the decoupling analysis show that efforts made on carbon emission reduction, to a certain extent, achieved the desired outcome but still need to be strengthened.
1. Introduction
The heavy industry mainly produces production and other materials, and also serves as the technical basis for the economy. According to the National Bureau of Statistics (NBS), the division as to a light or heavy industry standard is based on whether the industry produces production or consumption materials [1]. There are also some research studies which classify the heavy and light industry by the amount of energy consumed [2]. In this paper, we use the classification method of NBS to determine a heavy or light industry (see Appendix A).
Heavy industry occupies an important place in China’s economy. From 1949 to the beginning of the reform and opening up, China adopted the strategy of “heavy industry priority development”; it took the heavy industry as the top priority in the development of national economy and therefore pursued its growth. In this context, the heavy industry became the fastest-growing and the leading industry in that period. Average annual growth rate reached 15.3% during the period 1949–1981. The proportion of the heavy industry to the total industrial output also increased rapidly from 26.4% to 48.6% during the same period [3]. After the reform and opening up, the industry ushered in a new round of development. The proportion of heavy industry to total industry sector increased from 48.6% in 1981 to 75.5% in 2001, and then to 79.9% in 2016 (the NBS has published the added value of each industrial sector during 1993–2007, and the growth rate during 2008–2016; thus, the proportion of heavy industry in the total industrial output can be calculated). The industry has indeed occupied an absolutely important position in China’s industrial structure.
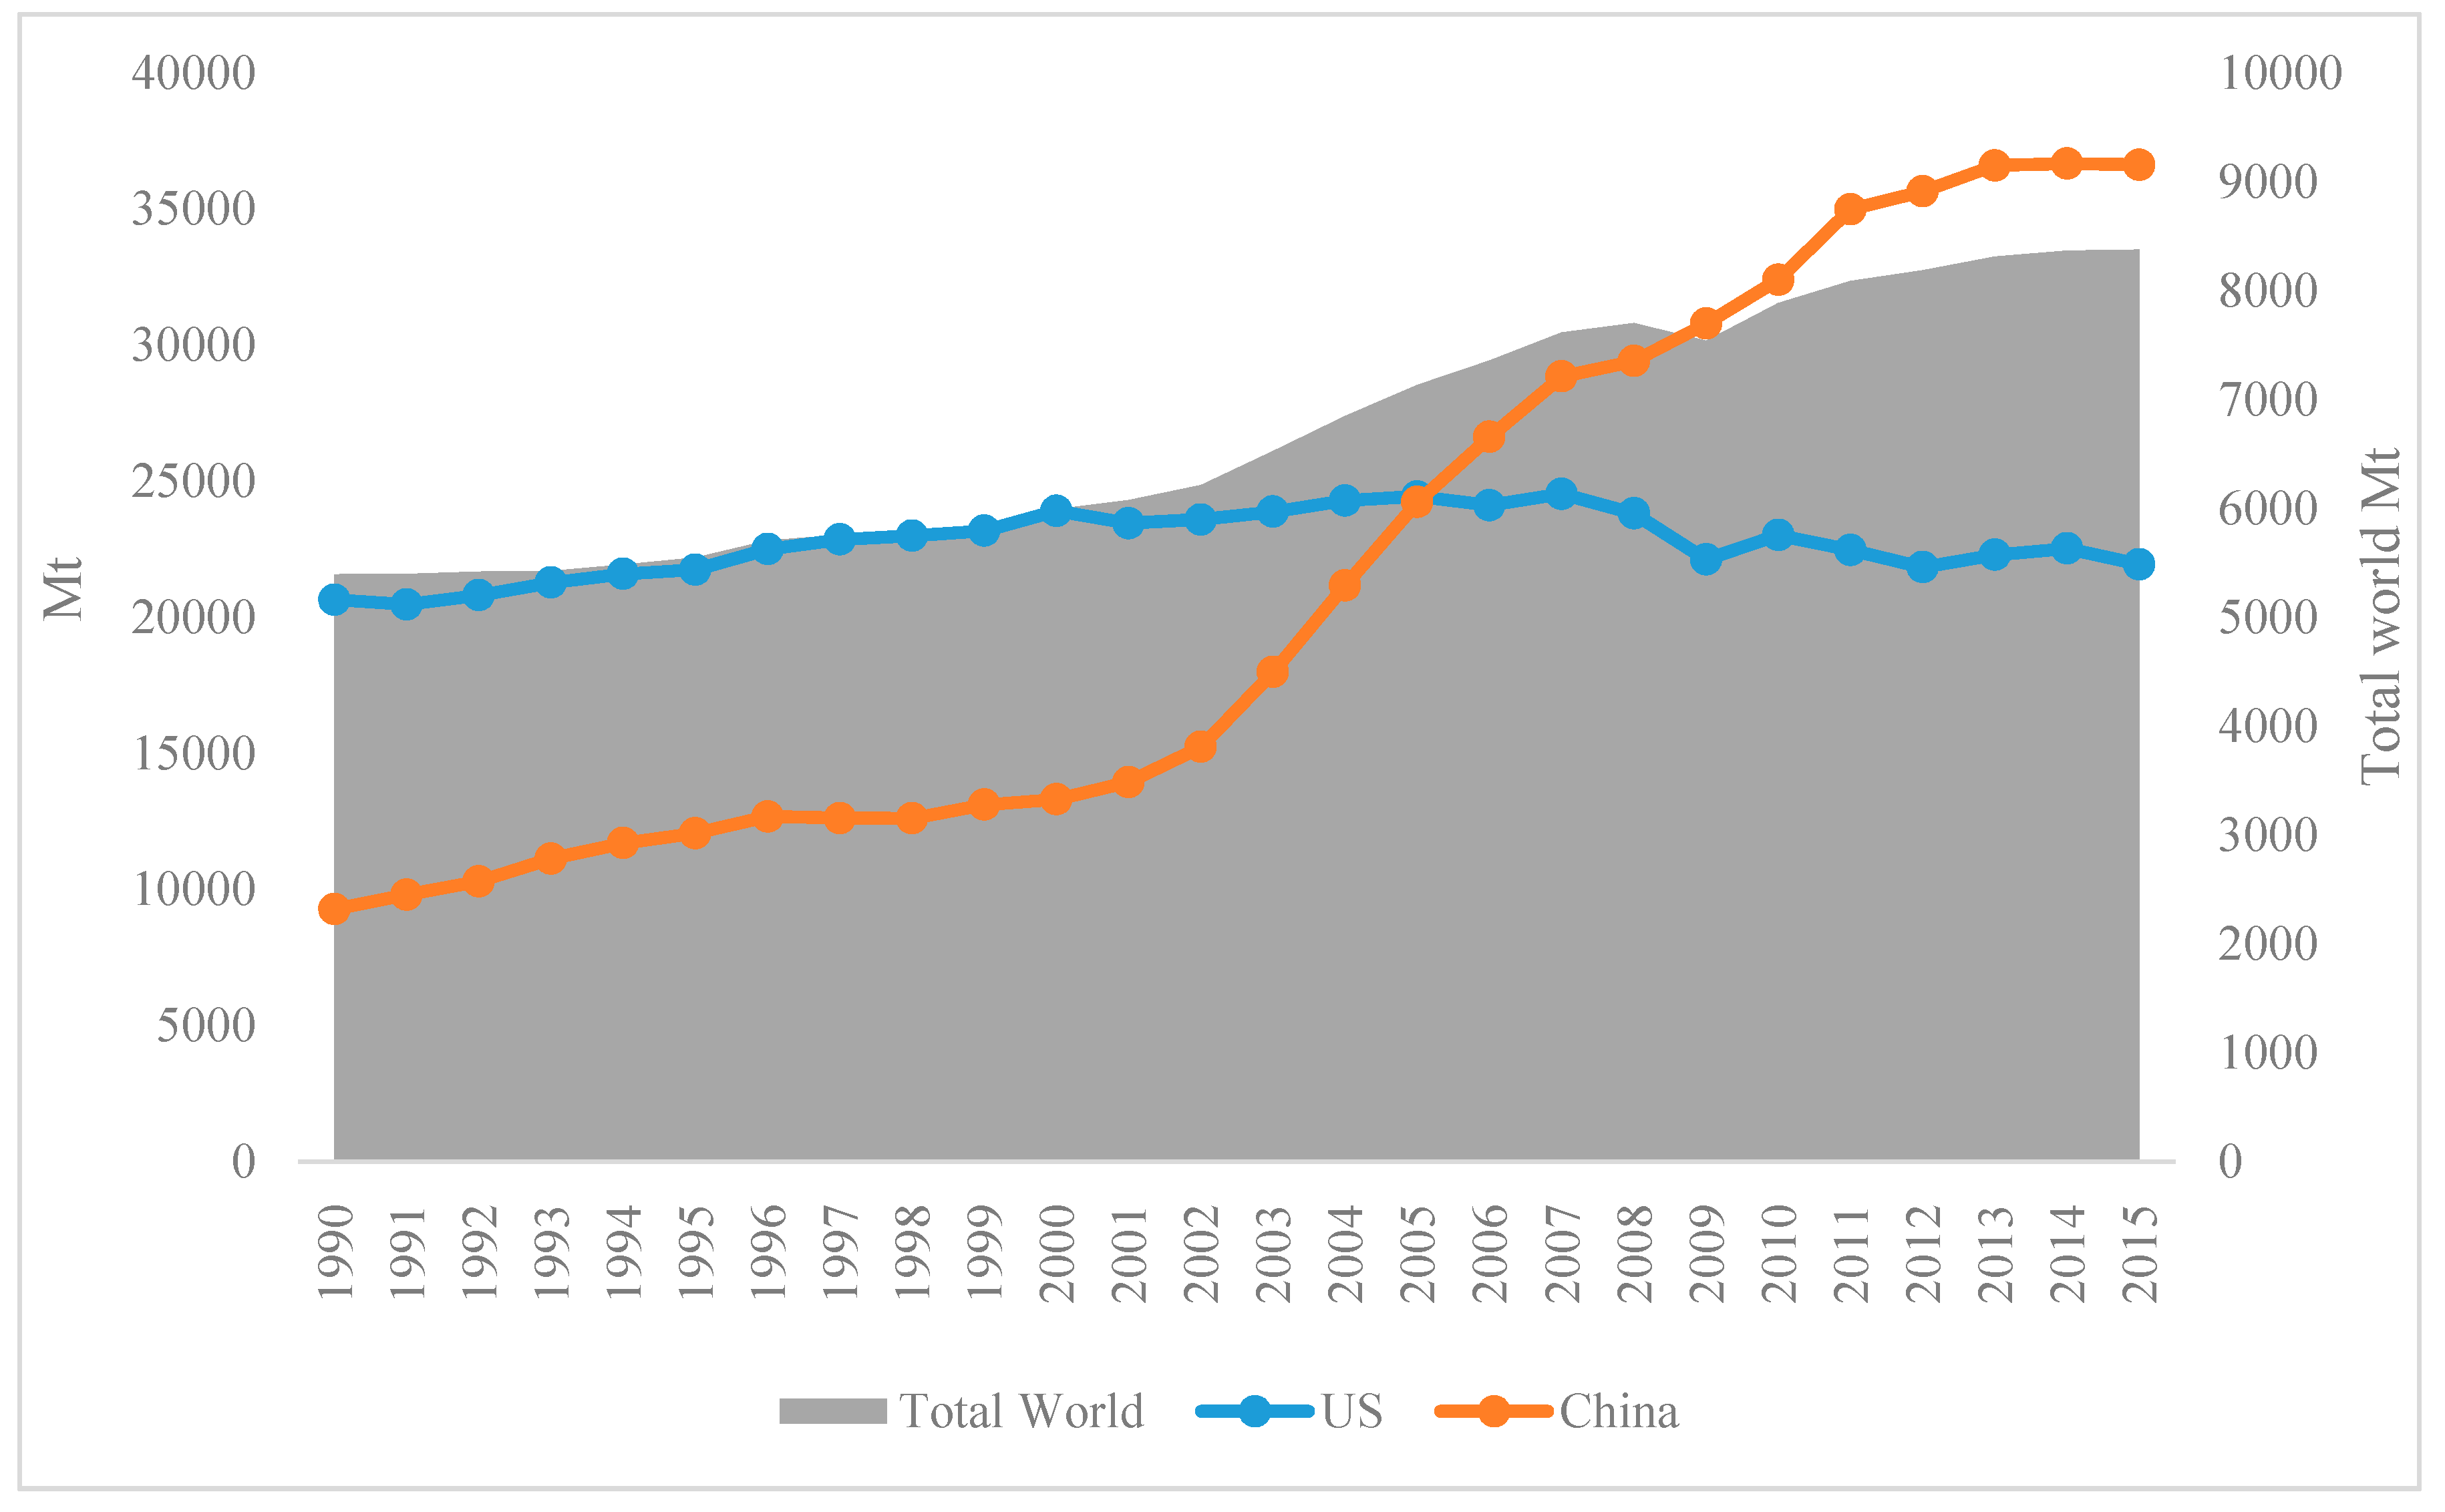
Most sub-sectors of the heavy industry are energy-intensive. With the rapid growth of economy, China’s energy consumption has also increased drastically; it accounts for over 65% of the total primary energy consumption [4]. China is in a period of industrialization and urbanization, and the heavy industry will continue to develop in the future. As the primary energy consumption in China is dominated by fossil fuels, and that the burning of fossil fuels is the main source of carbon dioxide emissions, China’s carbon emission has experienced a sharp increase over the years (Figure 1).
China overtook America as the world’s largest emitter of carbon dioxide in 2006. In 2015, China’s total carbon emission was 9153.9 million tons, accounting for 27.3% of total emission in the world. It is worth noting that total carbon emission has dropped by 0.1% compared with 2014, due to a decline in the overall growth of the economy. As China’s urbanization process continues, the energy consumption and energy-related carbon emissions are likely to grow rapidly when the economy is getting better.
In 2009, Chinese government proposed the emission reduction target, which seeks to ensure that CO2 emissions per unit of GDP in 2020 drops by 40–45% compared with the 2005 level. In order to achieve the emission reduction target, one of the most important things is to determine the driving factors of carbon emission growth and reduction. As heavy industry contains almost all the energy-intensive sectors and accounts for over 60% of China’s total energy consumption, energy conservation and emission reduction in the heavy industry is significant for the success of national energy conservation and emission reduction.
Investigating the driving forces of energy consumption, pollutant or carbon emissions, and energy efficiency is an important issue in energy economic research. Based on methodology, research on driving forces can be divided into three categories: econometric analysis, Computable General Equilibrium (CGE) analysis based on input–output (I-O), and decomposition analysis. Compared with econometric and CGE analyses, decomposition analysis is relatively simple and clear and can be used to measure the effects of related factors based on the decomposition of identities, such as the Kaya identity. It also has a certain degree of flexibility for the definition of decomposition factors. In general, decomposition analysis can be divided into three different kinds: structural decomposition analysis (SDA), production-theory decomposition analysis (PDA), and index decomposition analysis (IDA).
SDA, which is based on I-O analysis, can make full use of I-O data. In the case of energy consumption and carbon dioxide emissions analysis for an industrial or economic sector, SDA can distinguish the direct and indirect effects on the change of the production or consumption of the sector, analyzing the effect of changes in the final demand of one sector on the change of energy consumption of other sectors [5]. Compared with other methods about decomposition, the analysis of SDA on driving forces is more comprehensive and thorough, but the requirement on data is higher than the other methods. [6,7,8] have made a comprehensive review of the application of SDA.
The SDA model based on I-O analysis is widely used in energy and environment analysis. According to the double-KLEM production function, [9] analyzed the main factors for the change in energy consumption in the United States. Their results show that economic growth and the substitution between energy and other factors are the main driving forces for the increase in energy consumption, and energy conservation, whiles technical change is the main reasons for the suppression of energy consumption. With the same method, [10] extended the research into carbon emission analysis. [11] adopted the SDA to describe the relationship between terminal energy consumption and carbon emission in Australia. [12] and Butnar and [13] analyzed the effect of international trade, internal demand, external demand, and other factors on energy consumption and carbon emission in Brazil. This method is also widely used in the analysis of China’s industrial and regional energy consumption and carbon emissions [14,15], as well as analysis at the urban level [16].
In order to make an economic interpretation of the decomposition results, [17] proposed the method of PDA based on the data envelope analysis (DEA). Based on the output distance function, PDA can decompose the change in energy efficiency (the reciprocal of energy intensity) into technical efficiency changes, technological changes, and potential maximum energy efficiency change, where the potential maximum energy efficiency change includes the substitution between energy and capital, energy and labor, and structural changes in output. After this, PDA is widely used in the analysis of energy consumption and carbon emission [18,19,20].
Compared with SDA and PDA, the method of IDA has relatively lower requirements for data, especially the results of PDA on the structural effect of output and energy may be inconsistent with reality [21]. In this case, IDA is originally used in the study of industrial energy consumption, and gradually used in energy-environmental analysis. IDA has different forms, among which Laspeyres decomposition and Divisia decomposition are the commonly used ones. [22] proposed the Log-Mean Divisia Index Decomposition Method (LMDI), which is also one of the most commonly used methods in IDA. [23] reviewed IDA.
[24] analyzed the driving forces of energy consumption and carbon emission in China’s cement industry, and the results show that output growth is the most important factor driving energy consumption up, while structural shifts mainly drives energy consumption down. The results are similar in China’s transport sector [25,26]. [27] compared the differences in driving forces of residential carbon emissions in urban and rural China, and the results showed population effect to be significantly different. There are also research studies that focused on influencing factors of energy intensity [28,29].
After the decomposition analysis of driving factors for carbon emission, we also need to evaluate the effectiveness of carbon emission reduction policies, and decoupling analysis can be a good choice. Originally appearing in physics, decoupling refers to the process of eliminating the effect of mutual interference between signals. In 2000, it was used by the Organization for Economic Cooperation and Development (OECD) to investigate agricultural policies, and also assess environmental quality [30]. Research on decoupling later expanded to the field of environment, stemming from the Driver-Pressure-State-Influence-Response (DPSIR) framework; it is mainly used to reflect the relationship between the driving force and the environmental pressure during the same period. Decoupling can simply and clearly explain the relationship between the resource environment and economic development, hence, it has been applied to study the relationship between economic growth and factors like environmental pollution, energy consumption, increase in house prices, arable land occupation, etc. [31,32,33,34].
OECD countries have attached great importance to research on the “decoupling” and its application. The decoupling is divided into relative decoupling and absolute decoupling. Relative decoupling is said to occur when the growth rate of the energy variable is positive but less than that of economic output. Absolute decoupling, however, is said to occur when the growth rate of energy use is zero or negative and the growth rate of economic output is positive [35]. The OECD report showed that from the perspective of policy research, the pressure index and the corresponding decoupling index are better than the state index because they have the advantage that they can be easily changed in a short term [36]. When it comes to evaluating specific policies, they can be more effective. Therefore, decoupling is often used to establish environmental indicators, and evaluate the effect of policy implementation.
In summary, many studies have been conducted on decomposition and decoupling of different industries in different countries. However, as an industry with huge energy consumption and carbon emissions, China’s heavy industry does not get enough attention. Thus, we extend our research to the heavy industry using LMDI. We also calculate the decoupling to study the effect of each factor. The coupling state between CO2 emissions and industry development will also be tested. The results of the study can help us understand the various influencing factors of carbon emissions in China’s heavy industry. It can also help us measure the relationship between the industry development and carbon reduction.
The remainder of this paper is organized as follows. Section 2 shows the methods used in this paper. Section 3 reports the data sources as well as the data processing. Section 4 concludes the estimation results and also depicts the main conclusion. Section 5 presents some corresponding policy implications based on the empirical results.
2. Methodology
2.1. Decomposition Analysis
We use the Logarithmic Mean Divisia Index (LMDI) decomposition to analyze the influencing factors of carbon dioxide emissions of China’s heavy industry.
Based on the Kaya identity, carbon emissions can be decomposed into several affecting variables [37]:
where denotes CO2 emissions; denotes the carbon intensity of energy; denotes energy efficiency; denotes per capita income; and denotes population. According to the Kaya identity, the energy related CO2 emissions are basically determined by carbon intensity, energy efficiency, per capita income, and the total population.
Further, the kaya identity can be extended as:
In this paper, we focus on CO2 emissions from fossil energy consumption. [38] discussed several methodological and application issues related to the technique of the decomposition of industrial energy consumption. In Equation (2), denotes the fossil energy consumption; is the total energy consumption of heavy industry; Y denotes the output of heavy industry, which is represented by the added value; and denotes the labor input of heavy industry.
Table 1 shows the energy economic meaning of each factor in Equation (2).
For simplification, Equation (2) can be expressed as:
With LMDI, the cumulative change in CO2 emissions in year t can be represented in five parts:
Each part of Equation (4) can be computed as follows:
where , which is also called the logarithmic weight average. According to Equations (2)–(9), we can do the decomposition analysis of the CO2 emissions of heavy industry, and get the effect of each factor.
2.2. The Decomposition-Based Decoupling Model
The ideal state of low-carbon economy is to achieve a negative growth of greenhouse gas while the economy keeps growing, but this is just an ideal state. The transition towards a low-carbon economy is a process of decoupling between economic growth and greenhouse gas emissions. That is, the growth rate of carbon emissions is lower than that of economic growth.
The Decoupling index (DI) is defined as:
where DI is the decoupling index; Environment denotes the environment index, such as pollutant emissions and resource consumption; Drivingforce denotes factors such as economic growth rate or industrial production growth rate. The decoupling indexes in different areas or different periods are compared to determine the stress intensity and change trend.
We choose the change of CO2 emissions () to represent efforts in a certain sector to improve the environment in different periods; however, it does not imply the real efforts they have made. Because contains not only the real efforts to reduce emissions like optimizing the energy structure and reducing the energy intensity, but also the increase of emissions driven by industrial expansion. Based on the decomposition above, the real efforts to reduce CO2 emissions can be decomposed into carbon intensity (CI), energy structure (ES), and energy intensity (EI). The impetus factors are labor productivity (LP) and industry scale (IS):
Thus, the decoupling index is defined as:
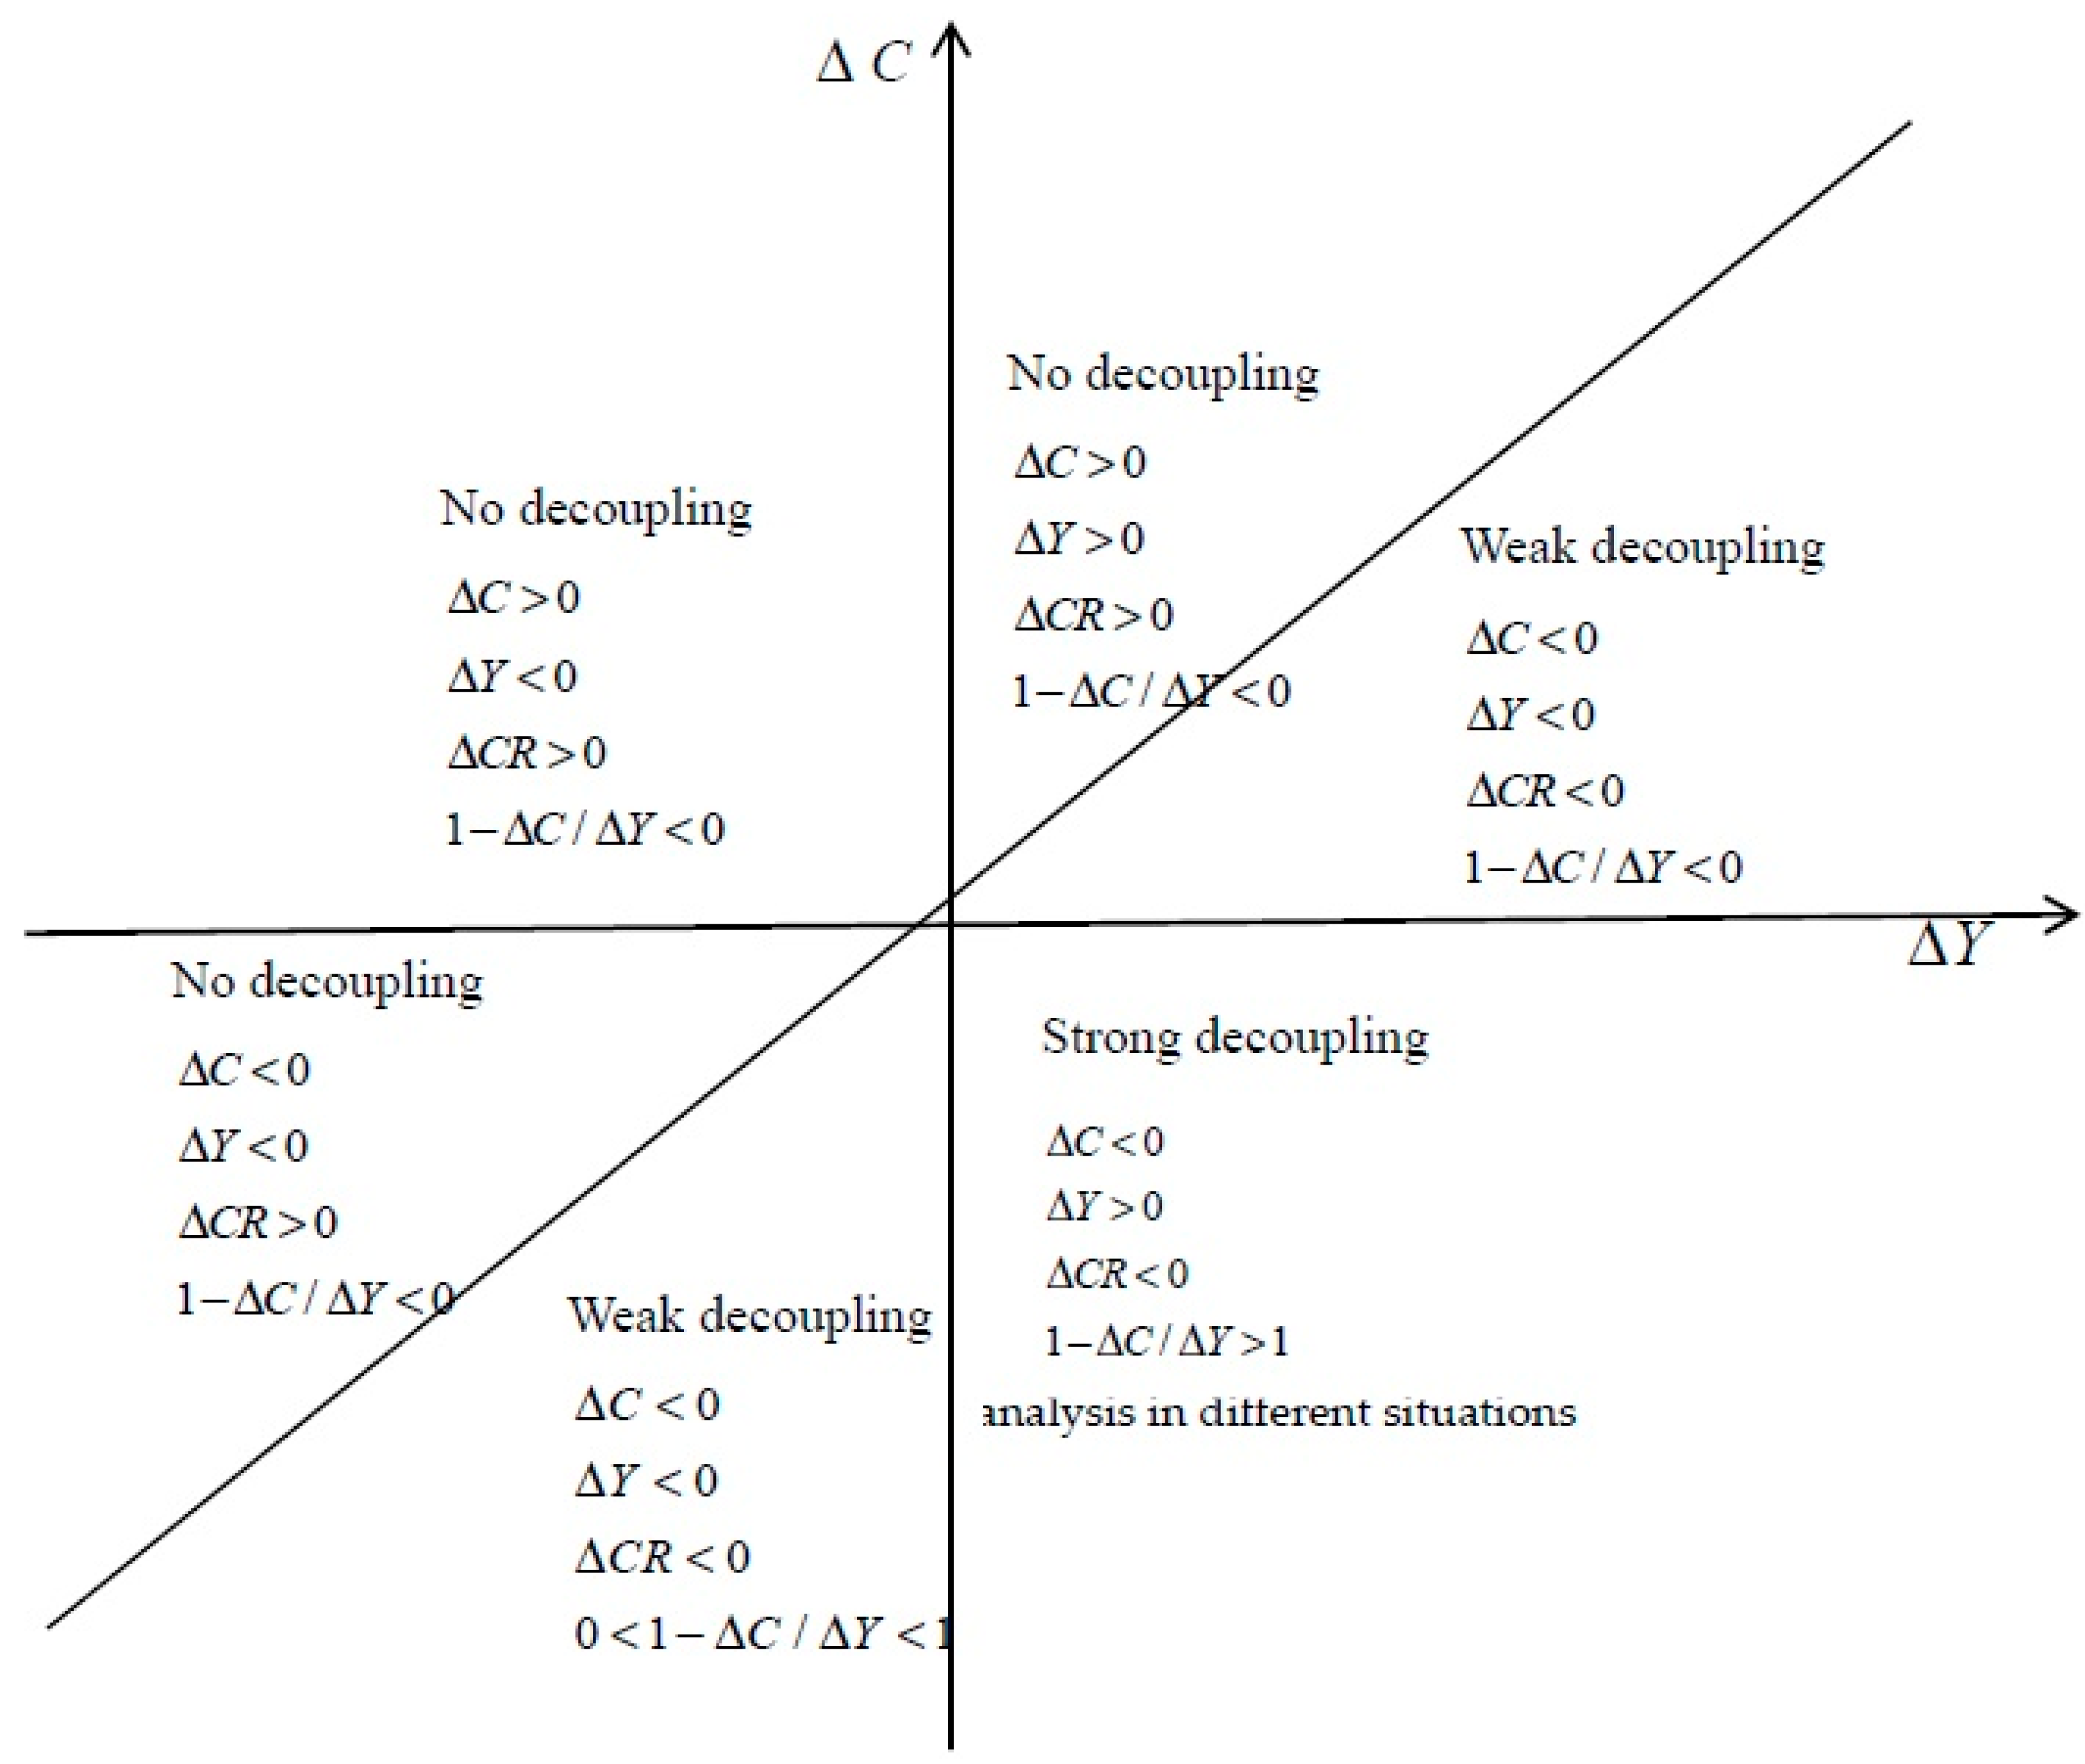
When , it indicates strong decoupling. This means that emissions reduction after implementation of existing policies is greater than the emissions growth driven by industrial expansion. The bigger the , the more obvious the CO2 reduction effect, and the energy structure is more optimized. As energy intensity decreases, the environmental stress per unit of output is relieved. That is to say, the existing emission reduction efforts are proved to be effective.
When , it indicates weak decoupling, which means that the existing emission reduction policies play a certain role in CO2 reduction, and the growth rate slows down to a certain extent. However, judging from the absolute amount, emissions reduction after the implementation of existing policies is greater than emissions growth driven by industrial expansion, implying that the total emissions are still increasing. The effectiveness and implementation efficiency of the emission reduction policies cannot be guaranteed.
When , it indicates no decoupling. That is to say, the emission reduction policies are ineffective and inefficient, and that the emission reduction goal cannot be achieved. This means that the emission reduction policies cannot optimize the energy structure and reduce the energy intensity. The total emissions are increasing rapidly along with the industrial expansion. In this case, the environment pressures caused by economic growth will continue to increase. All of the decoupling conditions are shown in Figure 2.
3. Data
In this paper, we employ China’s annual data over the period 1991–2015, since earlier terminal energy consumption by industrial sectors is unavailable. Output of the heavy industry is represented by the added-value, and, as already mentioned in the Methodology, energy consumption and labor input are used in our analysis. All data are obtained from China Statistical Yearbook, China Energy Statistical Yearbook, and China Industrial Economy Statistical Yearbook. If not specifically pointed out, all the data on prices in this paper are converted into constant prices in 1990 based on the GDP deflator. It is worth noting that the statistical criterion does not include heavy industry except the electricity consumption, so other data of heavy industry used in this paper are from the summary of the sub-sectors included in the heavy industry.
3.1. Energy Consumption
The heavy industry contains a large number of sub-sectors, some of which are sectors of energy production, conservation, and storage. In the case of double counting, we use the terminal energy consumption of each sub-sector to get the total energy input of the heavy industry.
According to OECD/IEA, terminal energy consumption is the energy used by terminal energy equipment entrance. From the definition, terminal energy consumption is equal to primary energy consumption minus energy loss in energy processing, energy conversion, and energy storage, as well as the loss associated with energy production process in energy-related industries [39].
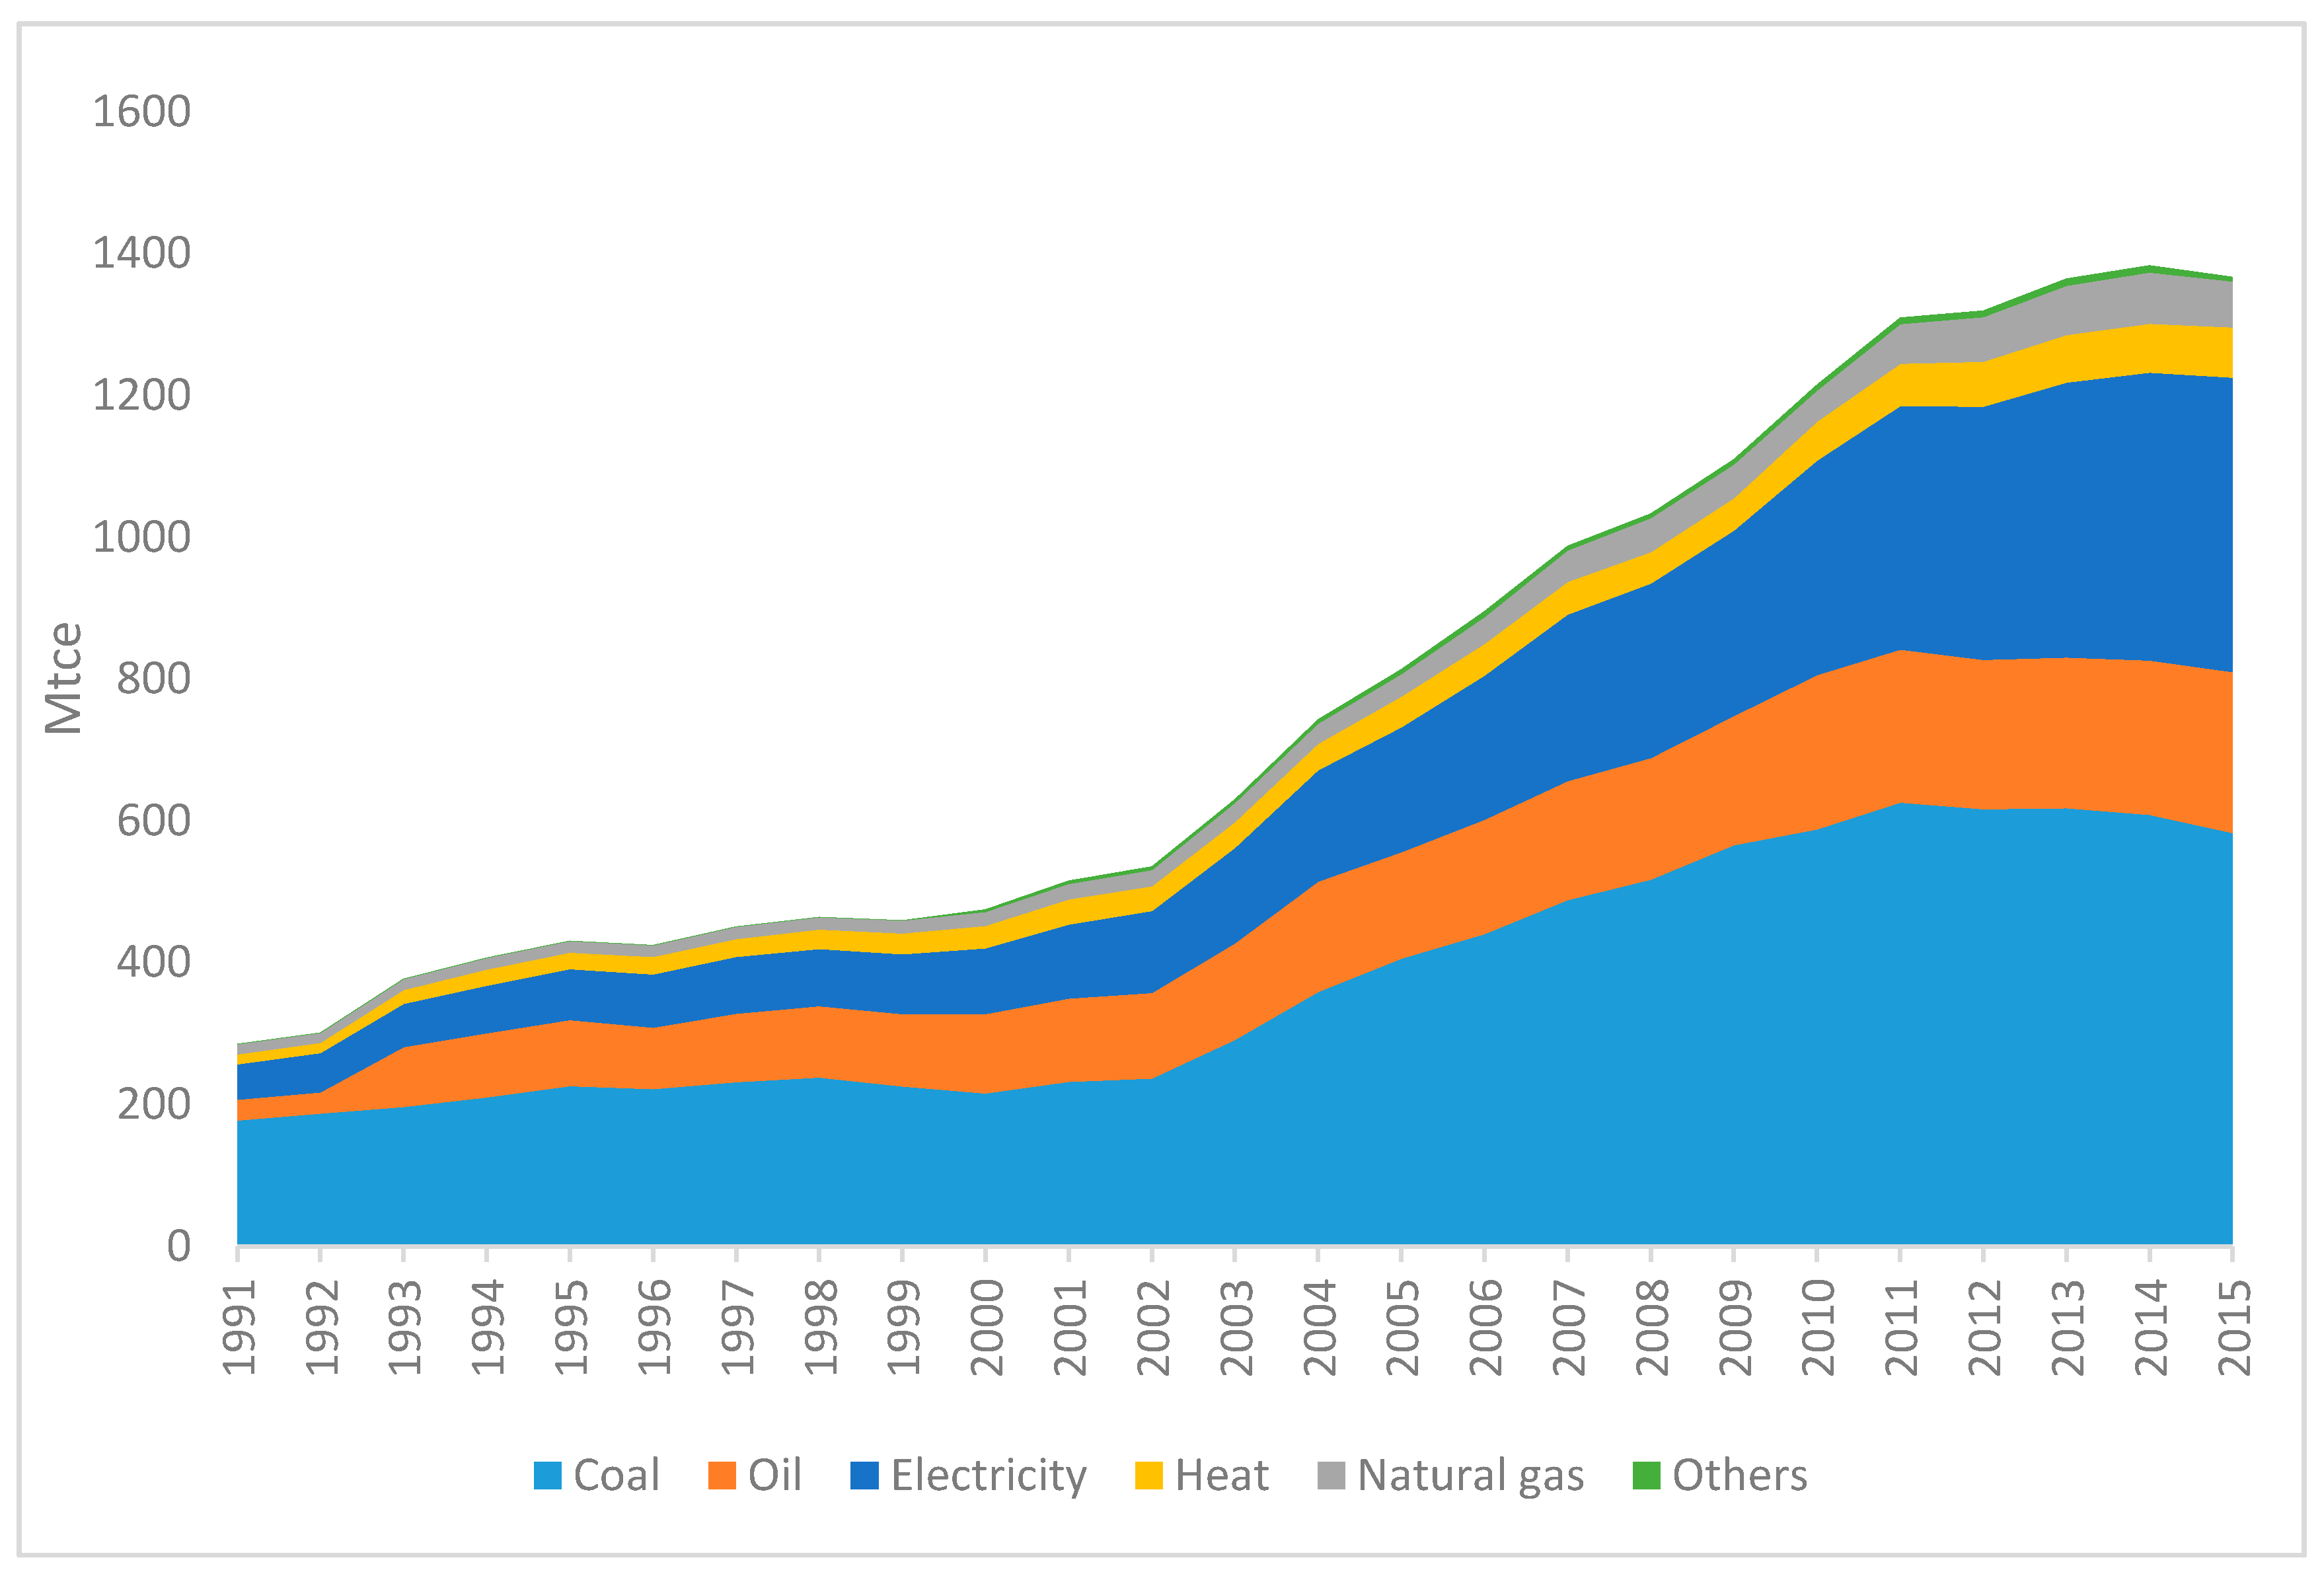
It is worth noting that the NBS adjusted the terminal energy consumption by industrial sectors in 2000, however, data before 2000 remain unchanged. To keep the coherence of data before and after 2000, we rebuilt the terminal energy consumption of the heavy industry before 2000 according to the original growth rate. Figure 3 shows the adjusted terminal energy consumption of China’s heavy industry from 1991 to 2015. For convenience, raw coal, clean coal, and coke are merged as coal; and crude oil, gasoline, kerosene, diesel, fuel oil, and PLG are merged as oil. Electricity is converted to coal equivalent by the electro-thermal equivalent. It can be seen that energy consumption has increased rapidly, especially after 2002. From the perspective of energy structure, coal has the highest proportion, followed by electricity. It is also imperative to note that the proportion of electricity has increased at a faster rate in the recent years. The proportion of natural gas and heat are relatively low.
3.2. Carbon Emission
According to [40], we can obtain energy-related carbon emissions by aggregating emissions from each type of energy consumption. China Energy Statistical Yearbook has published the physical quantity of terminal energy consumption by industrial sectors, and the carbon emissions coefficients of different energy varieties are shown in Table 2.
4. Results and Conclusion
4.1. Decomposition of Carbon Emission
We can obtain the terminal energy consumption of China’s heavy industry, together with the carbon emission coefficients of different energy varieties, we can get the total carbon emissions by aggregating emissions from each type of energy consumption. The estimated carbon emission of China’s heavy industry is shown in Figure 4.
To analyze the periodic change of carbon dioxide emissions of the heavy industry, the sample interval is divided into five sub-intervals according to the “five-year plan” by the central government: 1991–1995, 1996–2000, 2001–2005, 2006–2010, and 2011–2015. According to Equations (3)–(9), the change of carbon emission in each interval is decomposed into five driving factors, namely CI, ES, EI, LP, and IS, which can reflect the effect of change in carbon intensity, energy structure, energy intensity, labor productivity, and industry scale on the change of carbon emission, respectively. The decomposition results are shown in Figure 5.
During 1991–1995, 272.15 Mt of the total 472.74 Mt carbon emissions increase was caused by labor productivity; 138.84 Mt was due to energy intensity; 45.75 Mt resulted from growth of industry scale; 30.15 Mt was driven by energy structure; and the change of carbon intensity contributed to the only carbon emission reduction, which was −13.94 Mt during the interval.
According to the decomposition results, the principal influence factor of the increment in CO2 emission of China’s heavy industry is the improvement of labor productivity (LP). Since the end of the nineteenth century, the increase in fixed assets per capita has been the main reason for the improvement in labor productivity of industrial enterprises. This resulted in the replacement of manual labor with machinery and equipment, leading to an increase in energy consumption and carbon dioxide emissions. This effect was particularly evident in the heavy industry. The increase in industry scale (IS) and the change in energy structure (ES) also contributed to CO2 emissions increase during this period; however, the effects were relatively small. It is worth noting that the industry scale of China’s heavy industry did not expand significantly during this period; it only contributed 9.67% to the total carbon emission increases. The proportion of coal-dominated fossil energy in the energy structure of heavy industry also increased, leading to an increase of total carbon emission by 30.15 Mt. Energy intensity was also a main driving force of the carbon emission increases in this period, indicating that the energy consumption per unit of output increased rapidly during this period, which may also be the reason for the replacement of labor with machinery.
During the period 1996–2000, the increase in carbon emission was positive, however, the absolute value was small, which may be the reason for the decline in the industry scale during the Asian financial crisis. The decline in energy intensity also contributed to carbon emission reduction, which might have been caused by an improvement in energy efficiency. The decomposition of carbon emission in the periods 2001–2005 and 2006–2010 are almost the same. The only difference is the effect of energy structure, which has a positive effect in the former period and negative in the latter. It indicates that the energy structure of China’s heavy industry is moving in the direction of low-carbon. During the period 2011–2015, the change of energy structure and the decline of energy intensity, together with a low growth rate of industry scale, led to the decline of carbon emission in China’s heavy industry, which is unprecedented in the past periods.
Moreover, we find that the effects of the five factors in different periods have both similarities and differences. As for the labor productivity (LP), it had a positive effect on CO2 emissions in each period. Energy intensity (EI) had a significantly negative effect on carbon dioxide emissions since 1996. The effect of industry scale (IS) is positive except for the period 1996–2000. The influence of energy structure (ES) is positive in the periods 1991–1995 and 2001–2005, but became negative since 2006. The influences of carbon intensity (CI) are not as obvious, so we can only undertake a qualitative analysis.
To make a detailed analysis of the changes in CO2 emissions of China’s heavy industry and the effect of each factor, the annual increment of CO2 emissions and the impact of each factor are calculated. The results are shown in Figure 6:
Firstly, during the period 1991–2015, labor productivity had a positive effect on carbon emissions and the effect showed an increasing tendency except in some years. The positive correlation between labor productivity and its effect on CO2 emissions showed that too much attention had been paid to equipment and machinery. The substitution of labor with machinery increased energy consumption and carbon emissions. Output of the heavy industry depends on labor and capital. Capital includes all non-labor inputs such as machinery. The improvement of labor productivity does not only rely on workers’ technical proficiency and technical progress but also relies on the replacement of labor by machine. Different ways directly lead to different influences on CO2 emissions. If labor is replaced by a machine, the improvement of labor productivity will have a positive impact on energy consumption.
Secondly, during the observed period, the influence of industry scale varied significantly. From 1991 to 1995, the effect was positive but small. This contributed to an increment of 45.75 tons of carbon dioxide emissions. During the period 1996–2000, the influence of industry scale changed significantly. As can be seen in Figure 6, the contribution of the industry scale to carbon emissions begins to decline. The accumulated effect of industry scale became negative in 1998, and kept declining until 2002; it became positive again in 2006. In 2014, the effect of industry scale declined again.
In general, the change in the effect of industry scale is consistent with the development of China’s heavy industry. After the reform and opening up, with the rapid development of China’s economy, the heavy industry accounted for a rising proportion in economic structure, which brought about a series of problems such as economic imbalance and environmental pollution. The government started to adjust the economic structure and set the goal of “adjust industrial layout, optimize industrial structure” during the “Ninth Five-Year plan” period (1996–2000). Specifically, backward production capacity should be eliminated to reduce the proportion of heavy industry with high energy consumption and high pollution in the economic structure. This policy worked well. The growth rate of the heavy industry in 1996 started to slow down. Therefore, industry scale in this period had a negative effect on carbon dioxide emissions. The financial crisis in 1998 further strengthened the negative effect, and the proportion or number of heavy industries declined significantly during this period. After 2000, the heavy industry began to expand again until 2014, when China’s economy began to enter “new normal”. Therefore, it can be concluded that expansion of the heavy industry will cause a significant increase in carbon dioxide emissions.
Thirdly, during the period 1991–2015, the coal-dominated energy structure of the heavy industry has fundamentally not changed. Energy structure was always negatively correlated with carbon emissions, and the negative effect was particularly obvious since 2010. In 2009, China made the promise of carbon emission reduction, and began to optimize the energy structure in the “Eleventh Five-Year plan”. The results indicate that China’s energy structure has been gradually optimized. The optimization of energy structure played a positive role in reducing carbon emissions of the heavy industry. The government began to eliminate the backward production capacity in 1996. This played a role in optimizing the energy structure in the heavy industry. China then began to face tremendous pressure from the resources constraint and also from the environment, which eventually contributed to the industrial structure adjustment.
4.2. Decoupling Analysis
Based on the decomposition results and Equation (13), we can derive the decoupling indexes of carbon dioxide emissions of China’s heavy industry for the period 1992–2015. From the definition of decoupling index, when , it indicates strong decoupling, which means emissions reduction after implementation of existing policies is greater than the emissions growth driven by industrial expansion. When , it indicates weak decoupling, which means that the existing emission reduction policies play a certain role in CO2 reduction, and the growth rate slows down to a certain level. When , it indicates no decoupling, i.e., the emission reduction policies are ineffective and inefficient, thus the emission reduction goal cannot be achieved.
As can be seen in Table 3, the results of decoupling index (DI) are all smaller than 1 during the period 1992–2015, indicating weak decoupling. Though the highest (DI 0.73) appears in 1992, the DI of other years during 1992–1999 are relatively small, especially the DI in 1995, 1996, and 1998, which are −0.49, −0.13 and −0.11, respectively. The indication is that the effects on carbon emission reduction are relatively poor in this period. While the decoupling effect has been increasing since 2005, suggesting that the efforts of carbon emission reduction have accomplished a certain effect (with the absolute value of DI still less than 1), the weak decoupling indicates that it still needs to be strengthened in the efforts of carbon emission.
4.3. Conclusions and Discussions
By the results of decomposition and decoupling analysis, we can get the following important conclusions:
- (1)
- The increase of labor productivity (LP) and the industry scale (IS) are the main reason for the increase of carbon emission in China’s heavy industry. LP, which is represented by industrial added value per capita, can ethier increase the carbon emission by the replacement of labor with machine, or reduce the carbon emission by the improvement in efficiency. China’s heavy industry has experienced a rapid development in the past several decades, which has also led to the rapid increase of mechanization and energy consumption.
- (2)
- Energy intensity (EI) had a significantly negative effect on carbon dioxide emissions since 1996. The negative effect on carbon emission can reflect the progress of energy efficiency in China’s heavy industry. The effect of energy structure (ES) became negative since 2006, and the absolute value has been increased during the last two periods. This indicates that the clean and low carbon transformation of China's energy structure has a certain effect.
- (3)
- The results of decoupling analysis shows weak decoupling during 1992–2015, and the decoupling effect continued to increase since 2005. This indicates that the existing efforts of carbon emission reduction have accomplished a certain effect, but it still needs to be strengthened as the decoupling index (DI) are all smaller than 1.
5. Policy Implications
With the development of industrialization and urbanization, energy consumption and the CO2 emissions of China’s heavy industry are still rising. This paper, for the first time, applies the LMDI approach to decompose CO2 emissions and then analyze the decoupling effect of carbon emission reduction policies in China’s heavy industry.
The empirical results show that energy efficiency and labor productivity are two key factors influencing the CO2 emissions. High energy efficiency is the principal contributor to low CO2 emissions, while high labor productivity leads to high CO2 emissions. This is mainly because improvement in labor productivity in China principally depends on the substitution of manual labor with machinery and equipment, which leads to more energy consumption and more CO2 emissions. Industry scale is also an important cause of the carbon emissions. Expansion of industry scale leads to the increase of CO2 emissions, which is also verified by the empirical results during the period 1991–2015. In addition, during the observed period in this paper, energy structure had negative effects on CO2 emissions, but the effects were relatively small. We also show that the development of clean energies to phase in the fuel switch from coal-dominance to more shares of clean energy types such as natural gas and electricity will significantly reduce CO2 emissions. Overall, the upgrading of energy structure during 1991–2015 was effective, although the effect was not very obvious.
The government and academia have focused on economic development constrained by the environment for a long time. With global warming becoming more serious, reduction of CO2 emissions will be a constraint for economic growth. By analyzing CO2 emissions of the heavy industry and the decoupling, weak decoupling was found in most years except 1998, which indicated that the efforts to reduce CO2 emissions in the heavy industry achieved a certain but not significant effect. To reduce CO2 emissions while guaranteeing the development of the heavy industry, the following suggestions can be considered.
Firstly, the development pattern of the heavy industry should be transformed, and the operation efficiency and management level of enterprises should be improved. Based on the above research results, the increase in labor productivity is the main cause of the growth in CO2 emissions. That is, the increase in labor productivity depends principally on the expansion of industry scale and the replacement of manual labor by machinery and equipment. In terms of sustainable development, the improvement of labor productivity should be achieved by upgrading industrial structure and also making improvements in the management level. In this way, the effect of labor productivity growth on CO2 emissions will change from positive to negative, reducing CO2 emissions while guaranteeing the development of the heavy industry. The positive effect of labor productivity on CO2 emissions diminished during 2006–2010, which was smaller than that of the two previous time periods.
Secondly, the energy market reform should be accelerated and energy prices should be raised. Price is the core element of the market; reasonable energy prices play an important role in energy efficiency improvement and the sustainable development of the heavy industry. It also plays an important role in the regulation of energy consumption in most industries, especially the heavy industry. At present, energy prices are still controlled by the government. The government has to keep energy prices low for the sake of economic development. Once energy prices are allowed to get out of control, the increase in cost resulting from a rise in energy prices will provide a powerful incentive for the heavy industry to improve energy efficiency and lower energy intensity.
Finally, the industrial structure should be optimized and upgraded. Carbon emission per unit of output of the heavy industry is much higher than that of the service and tertiary industry because heavy industry is particularly energy intensive. Therefore, to guarantee economic growth under the restraint of carbon emissions reduction, it is necessary for China to accelerate the upgrading of industrial structure, vigorously develop hi-tech industries, and also transfer low-end industries to foreign countries. Furthermore, moving up the value chain is a prerequisite for boosting national competitiveness.
Acknowledgments
The paper is supported by the Grant for Collaborative Innovation Center for Energy Economics and Energy Policy (No. 1260-Z0210011), Xiamen University Flourish Plan Special Funding (No. 1260-Y07200) and China National Social Science Fund (No. 15ZD058).
Author Contributions
Boqiang Lin and Kui Liu conceived, designed, prepared and revised the paper. Both Boqiang Lin and Kui Liu read and approved the final manuscript.
Conflicts of Interest
The authors declare no conflict of interest.
Appendix A

Table A1.
The classification standard of heavy and light industry.
| No. | SIC Code | Heavy Industry | No. | SIC Code | Light Industry |
|---|---|---|---|---|---|
| 1 | 6 | Mining and washing of coal | 27 | 13 | Agricultural food processing |
| 2 | 7 | Extraction of petroleum and natural gas | 28 | 14 | Manufacture of food |
| 3 | 8 | Mining and processing of ferrous metal ores | 29 | 15 | Manufacture of drink |
| 4 | 9 | Mining and processing of non-ferrous metal ores | 30 | 16 | Manufacture of tobacco |
| 5 | 10 | Mining and processing of nonmetal ores | 31 | 17 | Textile industry |
| 6 | 20 | Processing of timber, manufacture of wood, bamboo, rattan, palm and straw products | 32 | 18 | Manufacture of textile and garment, shoes, hats |
| 7 | 25 | Processing of petroleum, coking, processing of nuclear fuel | 33 | 19 | Manufacture of leather, fur, feather |
| 8 | 26 | Manufacture of raw chemical materials and chemical products | 34 | 21 | Manufacture of furniture |
| 9 | 27 | Manufacture of medicines | 35 | 22 | Paper and paper products |
| 10 | 29 | Manufacture of rubber | 36 | 23 | Copy of printing and recording medium |
| 11 | 30 | Manufacture of plastics | 37 | 24 | Manufacture of cultural and educational sporting goods |
| 12 | 31 | Manufacture of non-metallic mineral products | 38 | 28 | Manufacture of chemical fiber |
| 13 | 32 | Smelting and pressing of ferrous metals | 39 | 42 | Manufacture of arts and crafts, and other |
| 14 | 33 | Smelting and pressing of non-ferrous metals | |||
| 15 | 34 | Manufacture of metal products | |||
| 16 | 35 | Manufacture of general purpose machinery | |||
| 17 | 36 | Manufacture of special purpose machinery | |||
| 18 | 37 | Manufacture of transport equipment | |||
| 19 | 39 | Manufacture of electrical machinery and equipment | |||
| 20 | 40 | Manufacture of communication equipment, computers and other electronic Equipment | |||
| 21 | 41 | Manufacture of measuring instruments and machinery for cultural activity and Office work | |||
| 22 | 44 | Production and supply of electric power and heat power | |||
| 23 | 45 | Production and supply of gas | |||
| 24 | 46 | Production and supply of water | |||
| 25 | 11 | Mining of other ores | |||
| 26 | 43 | Recycling and disposal of waste |
References
- Lin, B.; Liu, K. How efficient is China’s heavy industry? A perspective of input–output analysis. Emerg. Mark. Financ. Trade 2016, 52, 2546–2564. [Google Scholar] [CrossRef]
- Chen, S. Reconstruction of sub-industrial statistical data in China (1980–2008). China Econ. Q. 2011, 10, 735–776. [Google Scholar]
- Lin, J.Y.; Cai, F.; Li, Z. The China Miracle: Development Strategy and Economic Reform; Chinese University Press: Hong Kong, China, 2003. [Google Scholar]
- Lin, B.; Li, J. The rebound effect for heavy industry: Empirical evidence from China. Energy Policy 2014, 74, 589–599. [Google Scholar] [CrossRef]
- Alcántara, V.; Padilla, E. Input–output subsystems and pollution: An application to the service sector and CO2 emissions in Spain. Ecol. Econ. 2009, 68, 905–914. [Google Scholar] [CrossRef]
- Rose, A.; Casler, S. Input–output structural decomposition analysis: A critical appraisal. Econ. Syst. Res. 1996, 8, 33–62. [Google Scholar] [CrossRef]
- Hoekstra, R.; Van den Bergh, J.C. Comparing structural decomposition analysis and index. Energy Econ. 2003, 25, 39–64. [Google Scholar] [CrossRef]
- Su, B.; Ang, B. Structural decomposition analysis applied to energy and emissions: Some methodological developments. Energy Econ. 2012, 34, 177–188. [Google Scholar] [CrossRef]
- Rose, A.; Chen, C.-Y. Sources of change in energy use in the US economy, 1972–1982: A structural decomposition analysis. Resour. Energy 1991, 13, 1–21. [Google Scholar] [CrossRef]
- Casler, S.D.; Rose, A. Carbon dioxide emissions in the US economy: A structural decomposition analysis. Environ. Resour. Econ. 1998, 11, 349–363. [Google Scholar] [CrossRef]
- Lenzen, M. Primary energy and greenhouse gases embodied in Australian final consumption: An input–output analysis. Energy Policy 1998, 26, 495–506. [Google Scholar] [CrossRef]
- Machado, G.; Schaeffer, R.; Worrell, E. Energy and carbon embodied in the international trade of Brazil: An input–output approach. Ecol. Econ. 2001, 39, 409–424. [Google Scholar] [CrossRef]
- Butnar, I.; Llop, M. Structural decomposition analysis and input–output subsystems: Changes in CO2 emissions of Spanish service sectors (2000–2005). Ecol. Econ. 2011, 70, 2012–2019. [Google Scholar] [CrossRef]
- Xie, S.-C. The driving forces of China’s energy use from 1992 to 2010: An empirical study of input–output and structural decomposition analysis. Energy Policy 2014, 73, 401–415. [Google Scholar] [CrossRef]
- Zhang, Y. Structural decomposition analysis of sources of decarbonizing economic development in China, 1992–2006. Ecol. Econ. 2009, 68, 2399–2405. [Google Scholar] [CrossRef]
- Wang, Y.; Zhao, H.; Li, L.; Liu, Z.; Liang, S. Carbon dioxide emission drivers for a typical metropolis using input–output structural decomposition analysis. Energy Policy 2013, 58, 312–318. [Google Scholar] [CrossRef]
- Wang, C. Decomposing energy productivity change: A distance function approach. Energy 2007, 32, 1326–1333. [Google Scholar] [CrossRef]
- Zhang, Y.-J.; Da, Y.-B. The decomposition of energy-related carbon emission and its decoupling with economic growth in China. Renew. Sustain. Energy Rev. 2015, 41, 1255–1266. [Google Scholar] [CrossRef]
- Fan, W.; Li, Y.; Lin, Z.; Zhang, M. PDA research on a novel pulverized coal combustion technology for a large utility boiler. Energy 2010, 35, 2141–2148. [Google Scholar] [CrossRef]
- Lin, B.; Du, K. Decomposing energy intensity change: A combination of index decomposition analysis and production-theoretical decomposition analysis. Appl. Energy 2014, 129, 158–165. [Google Scholar] [CrossRef]
- Du, K.; Lin, B. Understanding the rapid growth of China’s energy consumption: A comprehensive decomposition framework. Energy 2015, 90, 570–577. [Google Scholar] [CrossRef]
- Ang, B.W.; Zhang, F.Q.; Choi, K.H. Factorizing changes in energy and environmental indicators through decomposition. Energy 1998, 23, 489–495. [Google Scholar] [CrossRef]
- Ang, B.W.; Zhang, F.Q. A survey of index decomposition analysis in energy and environmental studies. Energy 2000, 25, 1149–1176. [Google Scholar] [CrossRef]
- Xu, J.-H.; Fleiter, T.; Eichhammer, W.; Fan, Y. Energy consumption and CO2 emissions in China’s cement industry: A perspective from LMDI decomposition analysis. Energy Policy 2012, 50, 821–832. [Google Scholar] [CrossRef]
- Wang, W.; Zhang, M.; Zhou, M. Using LMDI method to analyze transport sector CO2 emissions in China. Energy 2011, 36, 5909–5915. [Google Scholar] [CrossRef]
- Zhang, M.; Li, H.; Zhou, M.; Mu, H. Decomposition analysis of energy consumption in Chinese transportation sector. Appl. Energy 2011, 88, 2279–2285. [Google Scholar] [CrossRef]
- Zha, D.L.; Ding, N. Elasticities of substitution between energy and non-energy inputs in China power sector. Econ. Model. 2014, 38, 564–571. [Google Scholar] [CrossRef]
- Ma, C.; Stern, D.I. China’s changing energy intensity trend: A decomposition analysis. Energy Econ. 2008, 30, 1037–1053. [Google Scholar] [CrossRef]
- Liu, L.-C.; Fan, Y.; Wu, G.; Wei, Y.-M. Using LMDI method to analyze the change of China’s industrial CO2 emissions from final fuel use: An empirical analysis. Energy Policy 2007, 35, 5892–5900. [Google Scholar] [CrossRef]
- Organisation for Economic Co-Operation and Development (OECD). Decoupling: A Conceptual Overview. OECD Pap. 2001, 5, 1–31. [Google Scholar]
- Secretariat, O. Indicators to measure decoupling of environmental pressure from economic growth. The oecd environment programme 2001. Available online: http://www.oecd.org/environment/indicators-modelling-outlooks/1933638.pdf (accessed on 3 April 2017).
- Ayres, R.U.; Ayres, L.W.; Warr, B. Exergy, power and work in the US economy, 1900–1998. Energy 2003, 28, 219–273. [Google Scholar] [CrossRef]
- Ma, Y.; Meng, S.; Yan, R. Heterogeneity Analysis on Decoupling Factor between Carbon Emissions and GDP in BRICS Countries. Int. J. Digit. Content Technol. Appl. 2013, 7, 834. [Google Scholar]
- Zhang, L.; Zhang, X. Decoupling relationship between industrial growth and carbon emissions in three northeastern provinces of China: Analysis based on stability and deviation. J. Discret. Math. Sci. Cryptogr. 2017, 20, 271–294. [Google Scholar] [CrossRef]
- Ren, S.; Yin, H.; Chen, X. Using LMDI to analyze the decoupling of carbon dioxide emissions by China’s manufacturing industry. Environ. Dev. 2014, 9, 61–75. [Google Scholar] [CrossRef]
- Organisation for Economic Co-Operation and Development (OECD). Decoupling: Illustrating some Open Questions on the Production Impact of Different Policy Instruments. OECD Pap. 2005, 5, 1–42. [Google Scholar]
- Kaya, Y. Impact of Carbon Dioxide Emission Control on GNP Growth: Interpretation of Proposed Scenarios; IPCC Energy and Industry Subgroup, Response Strategies Working Group: Paris, France, 1990; p. 76. [Google Scholar]
- Ang, B.; Lee, S. Decomposition of industrial energy consumption: Some methodological and application issues. Energy Econ. 1994, 16, 83–92. [Google Scholar] [CrossRef]
- International Energy Agency. Benign Energy? The Environmental Implications of Renewables; Massachusetts Institute of Technology: Cambridge, MA, USA, 2005; pp. 246–250. [Google Scholar]
- IPCC. 2006 IPCC Guidelines for National Greenhouse Gas Inventories. Available online: http://www/.ipcc-nggip.iges.or.jp./public/2006gl/index.html (accessed on 5 April 2017).
Figure 1.
CO2 emissions in China, USA, and the world. Source: BP Statistical Review of World Energy 2016.
Figure 1.
CO2 emissions in China, USA, and the world. Source: BP Statistical Review of World Energy 2016.

Figure 2.
Decoupling analysis in different situations.

Figure 3.
The terminal energy consumption of China’s heavy industry.

Figure 4.
Carbon emission of China’s heavy industry.
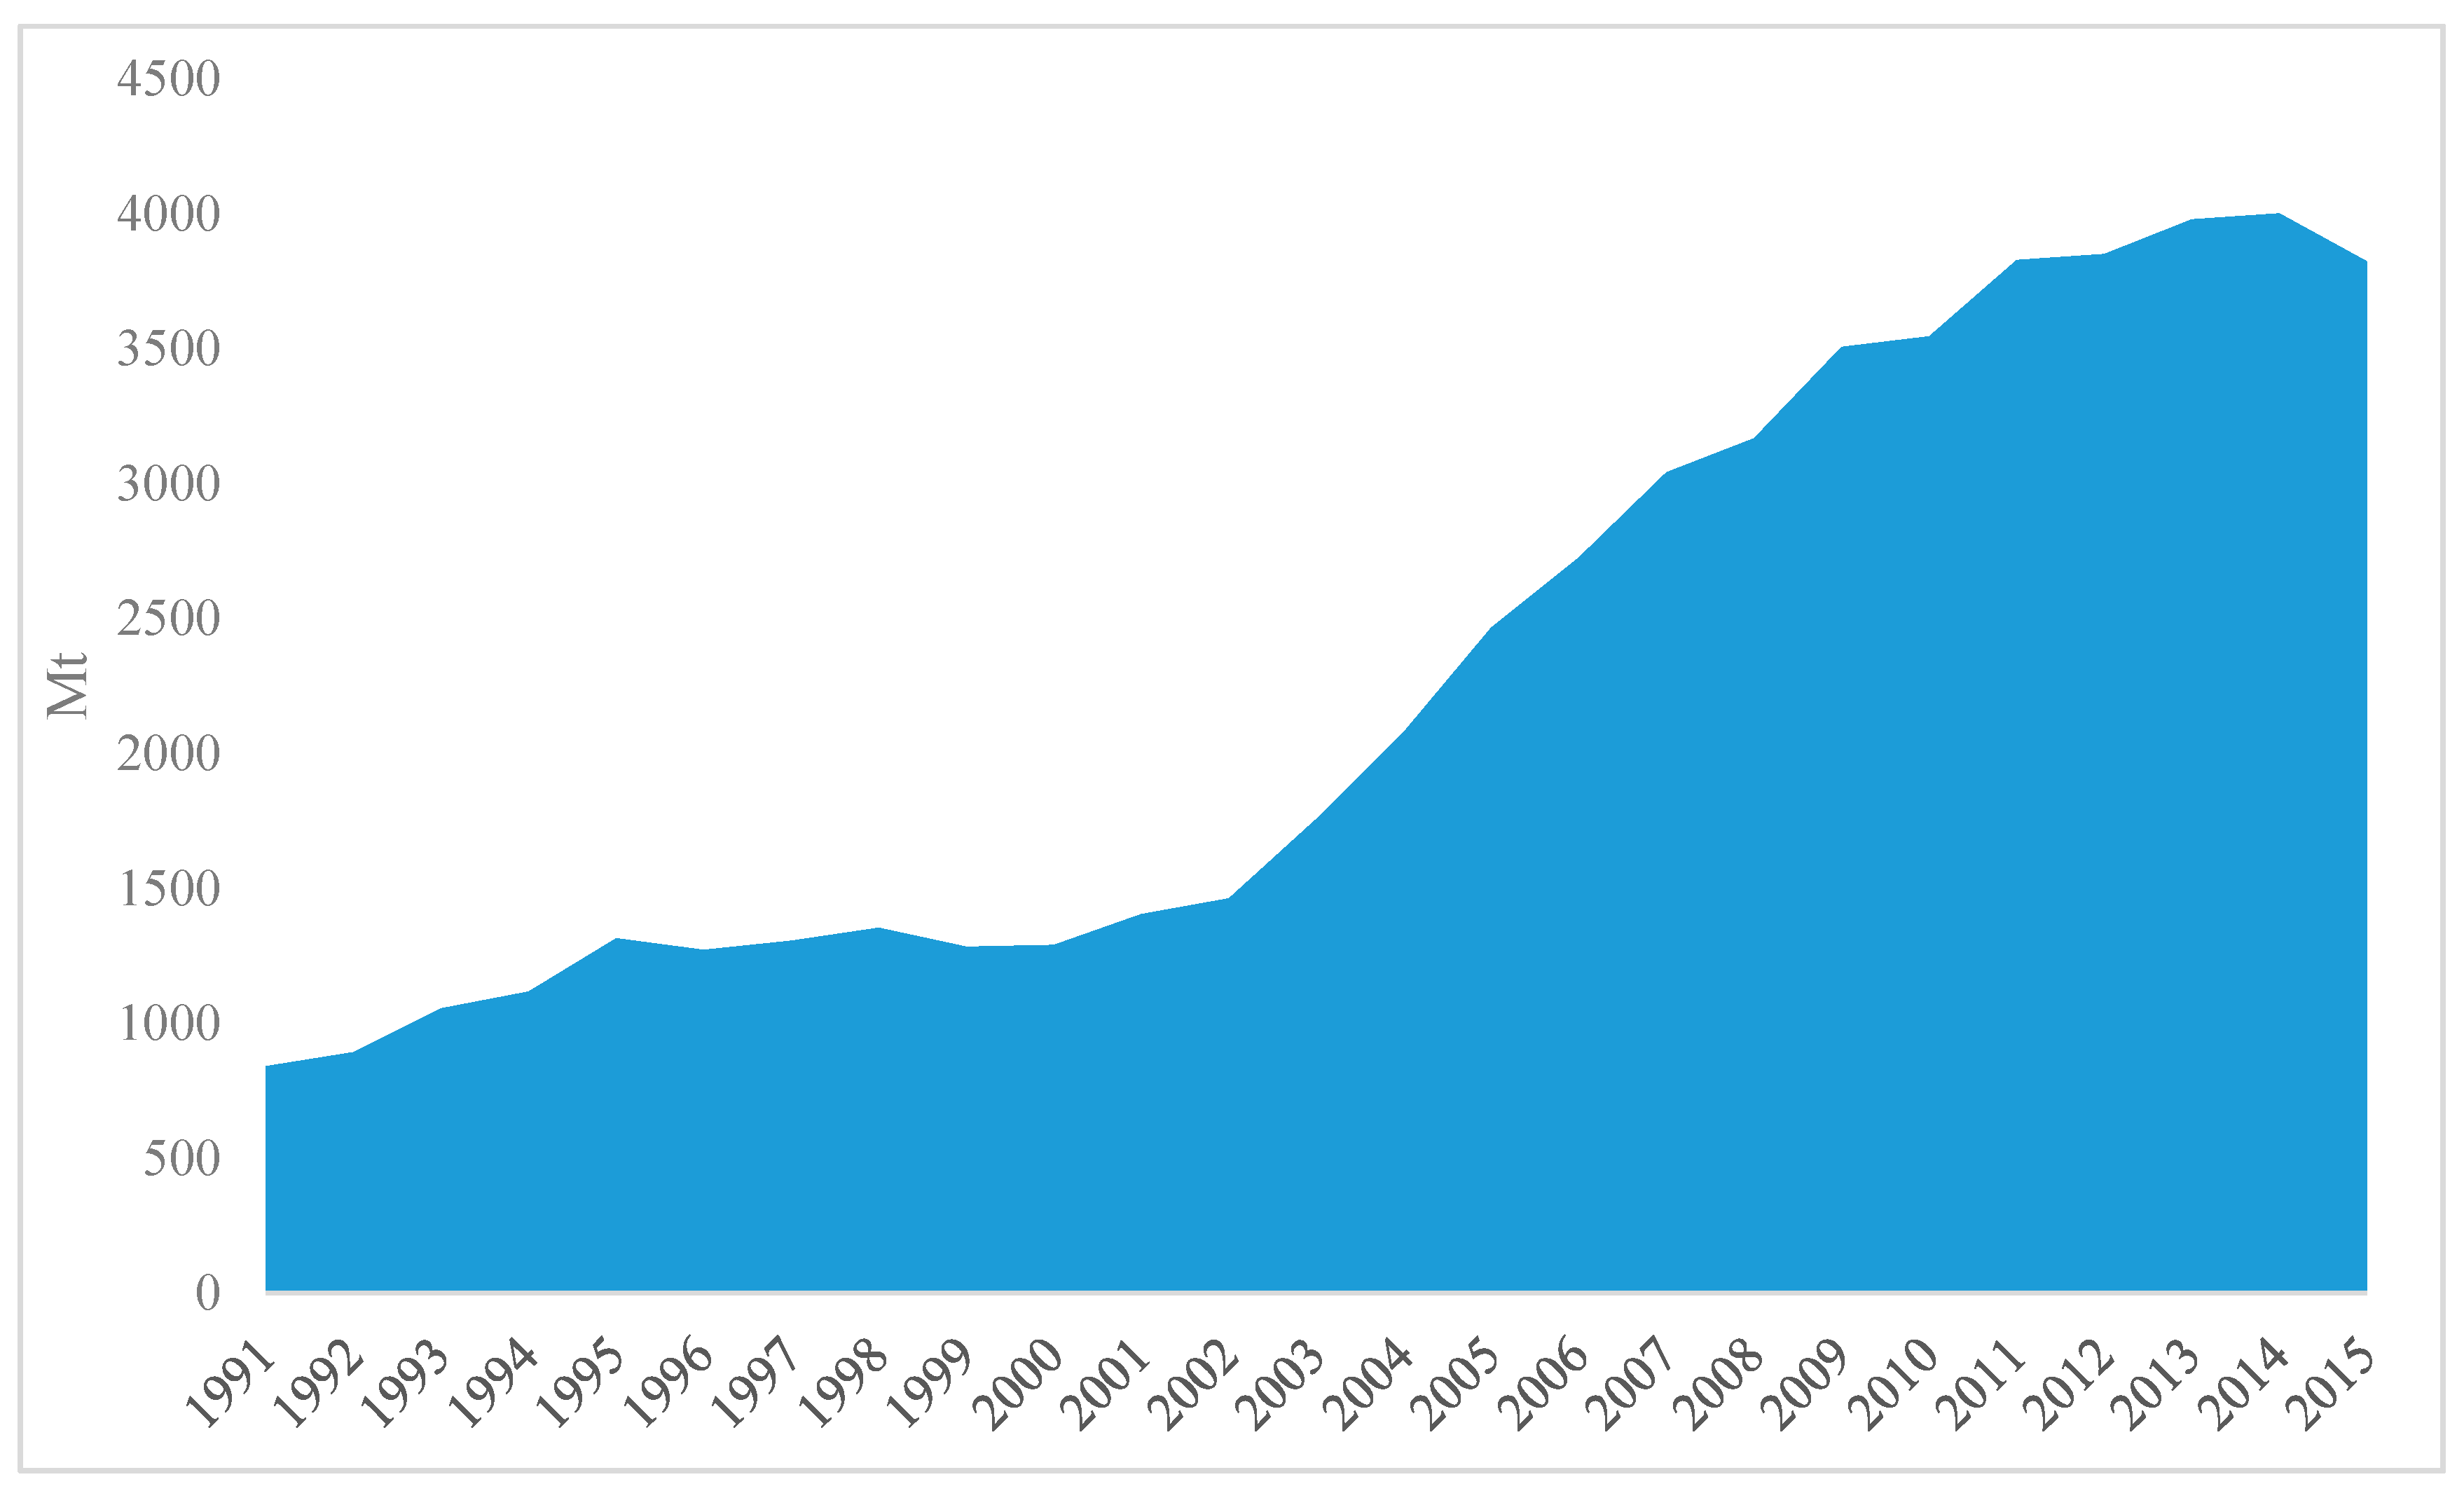
Figure 5.
Increment of carbon dioxide emissions in each sub-interval and decomposition of influencing factors.
Figure 5.
Increment of carbon dioxide emissions in each sub-interval and decomposition of influencing factors.
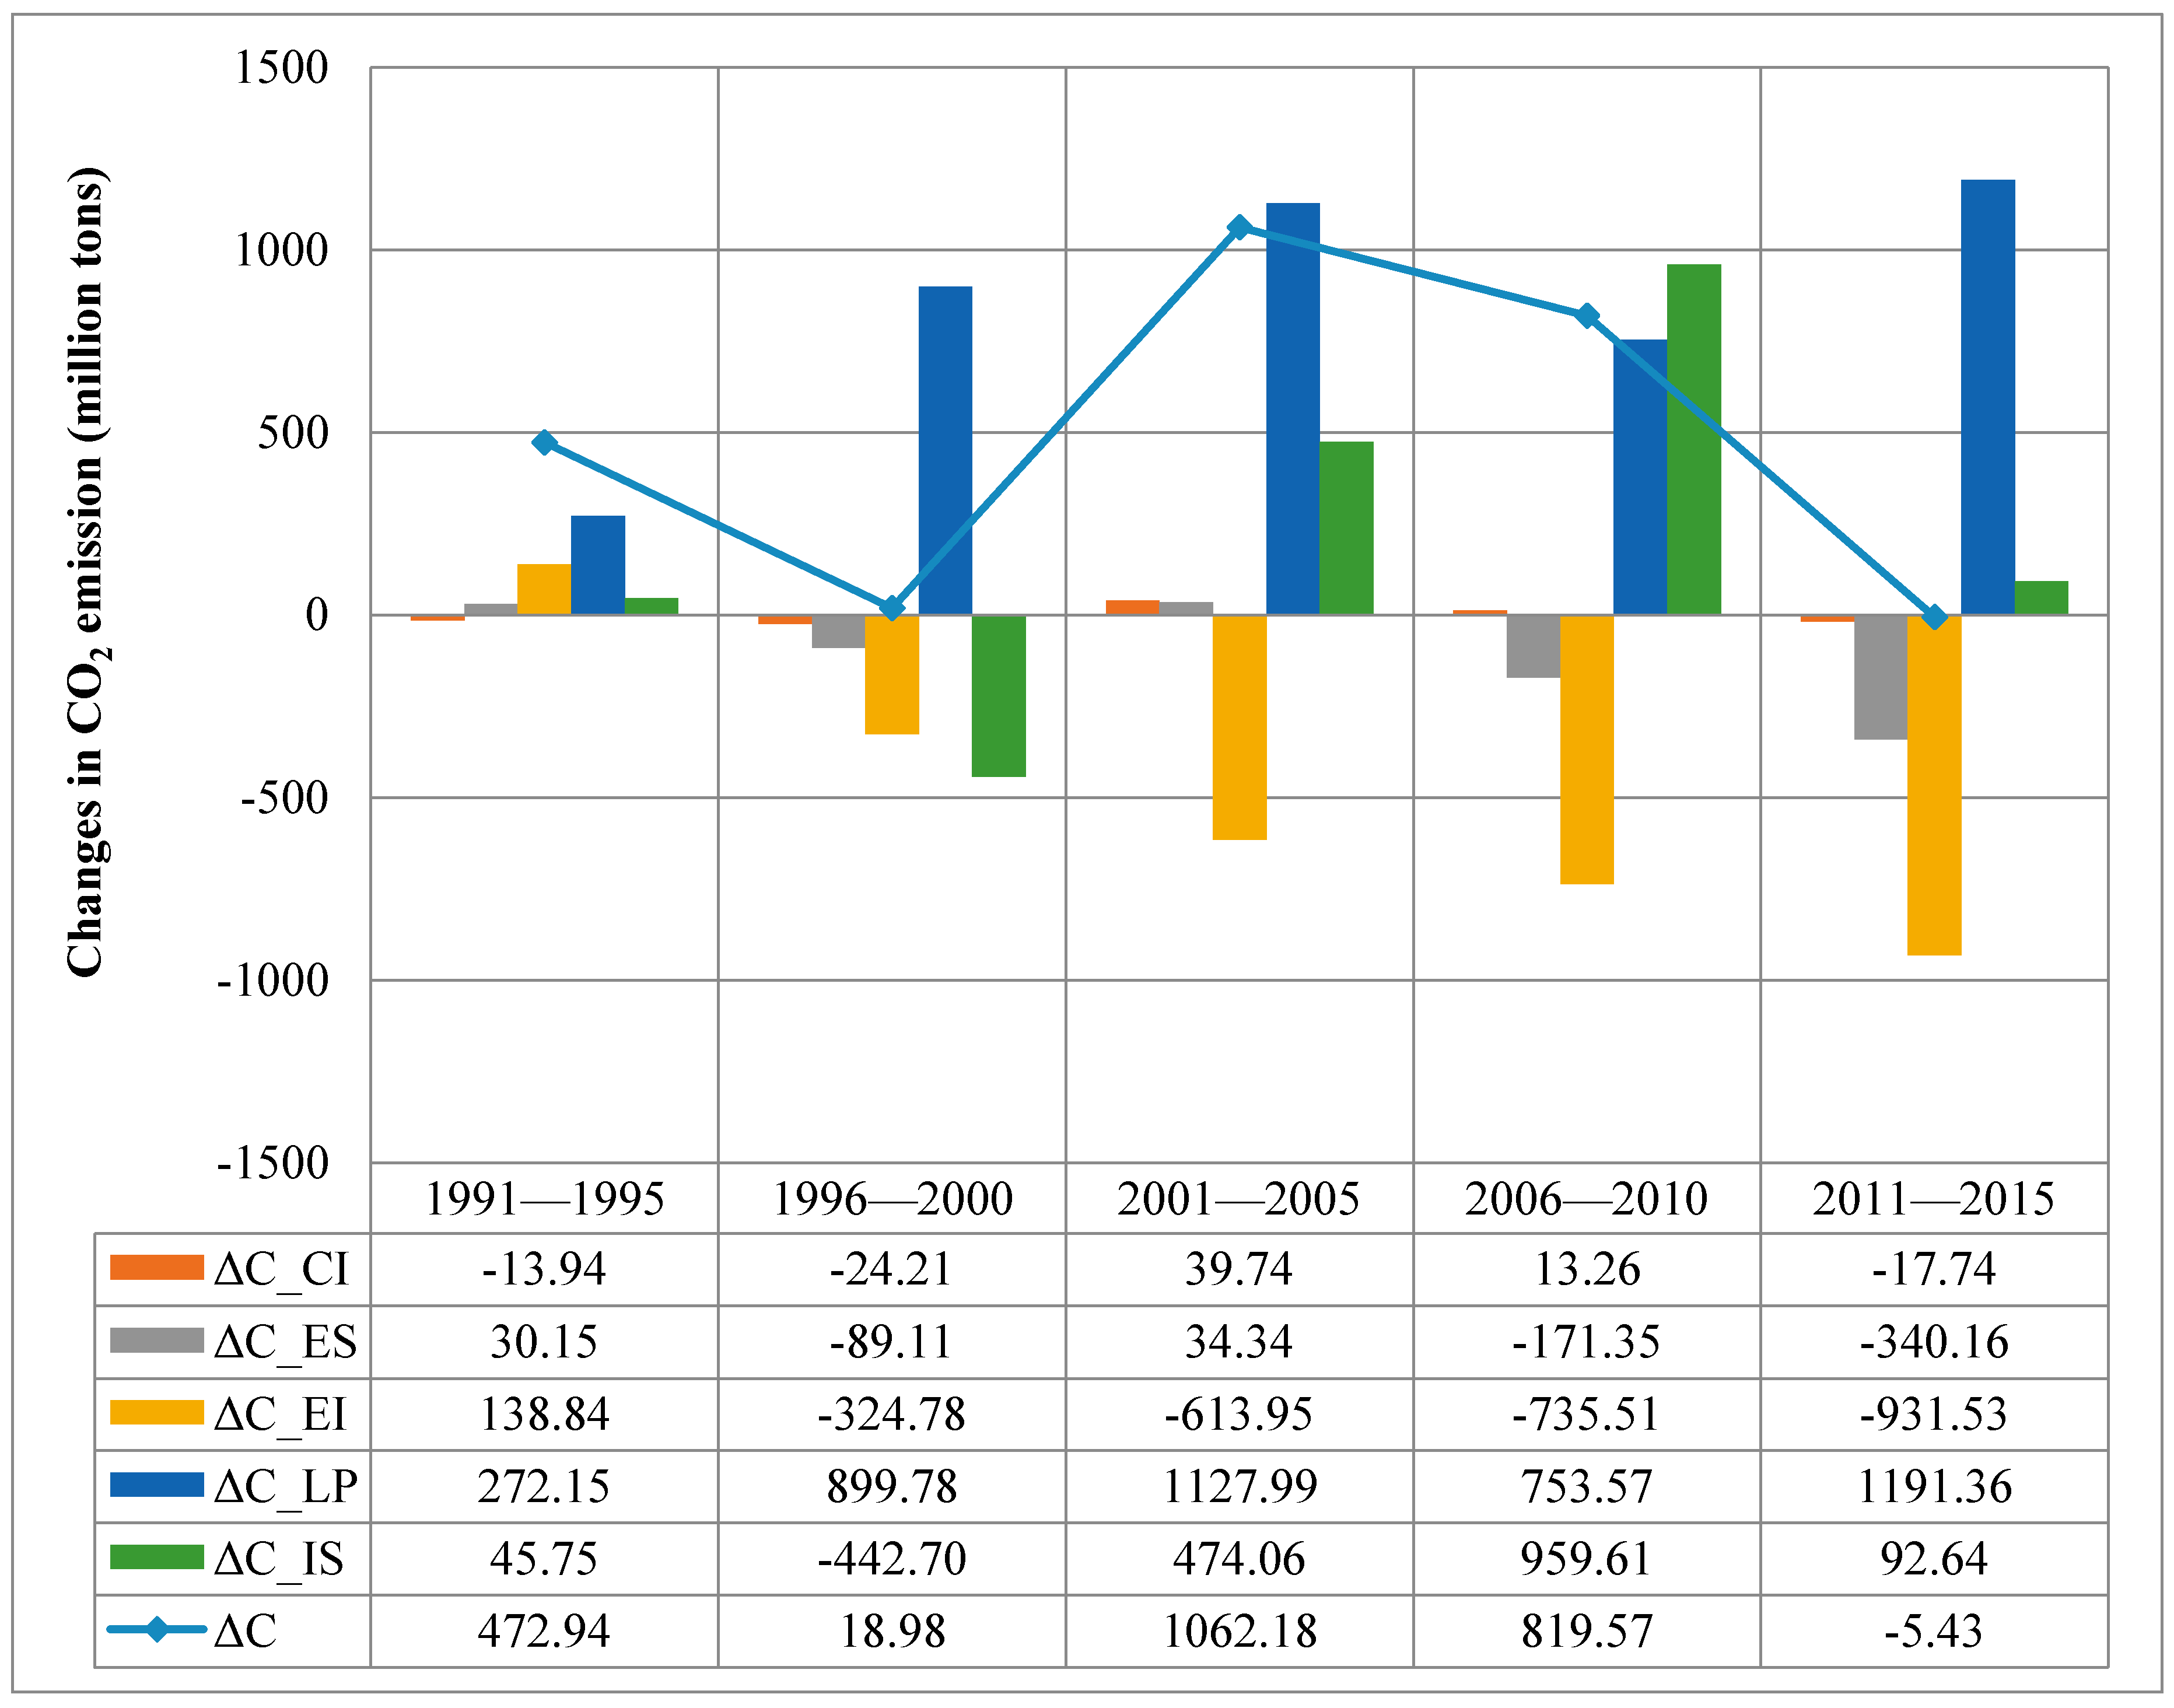
Figure 6.
The accumulated change of carbon dioxide emissions and decomposition results of influencing factors.
Figure 6.
The accumulated change of carbon dioxide emissions and decomposition results of influencing factors.
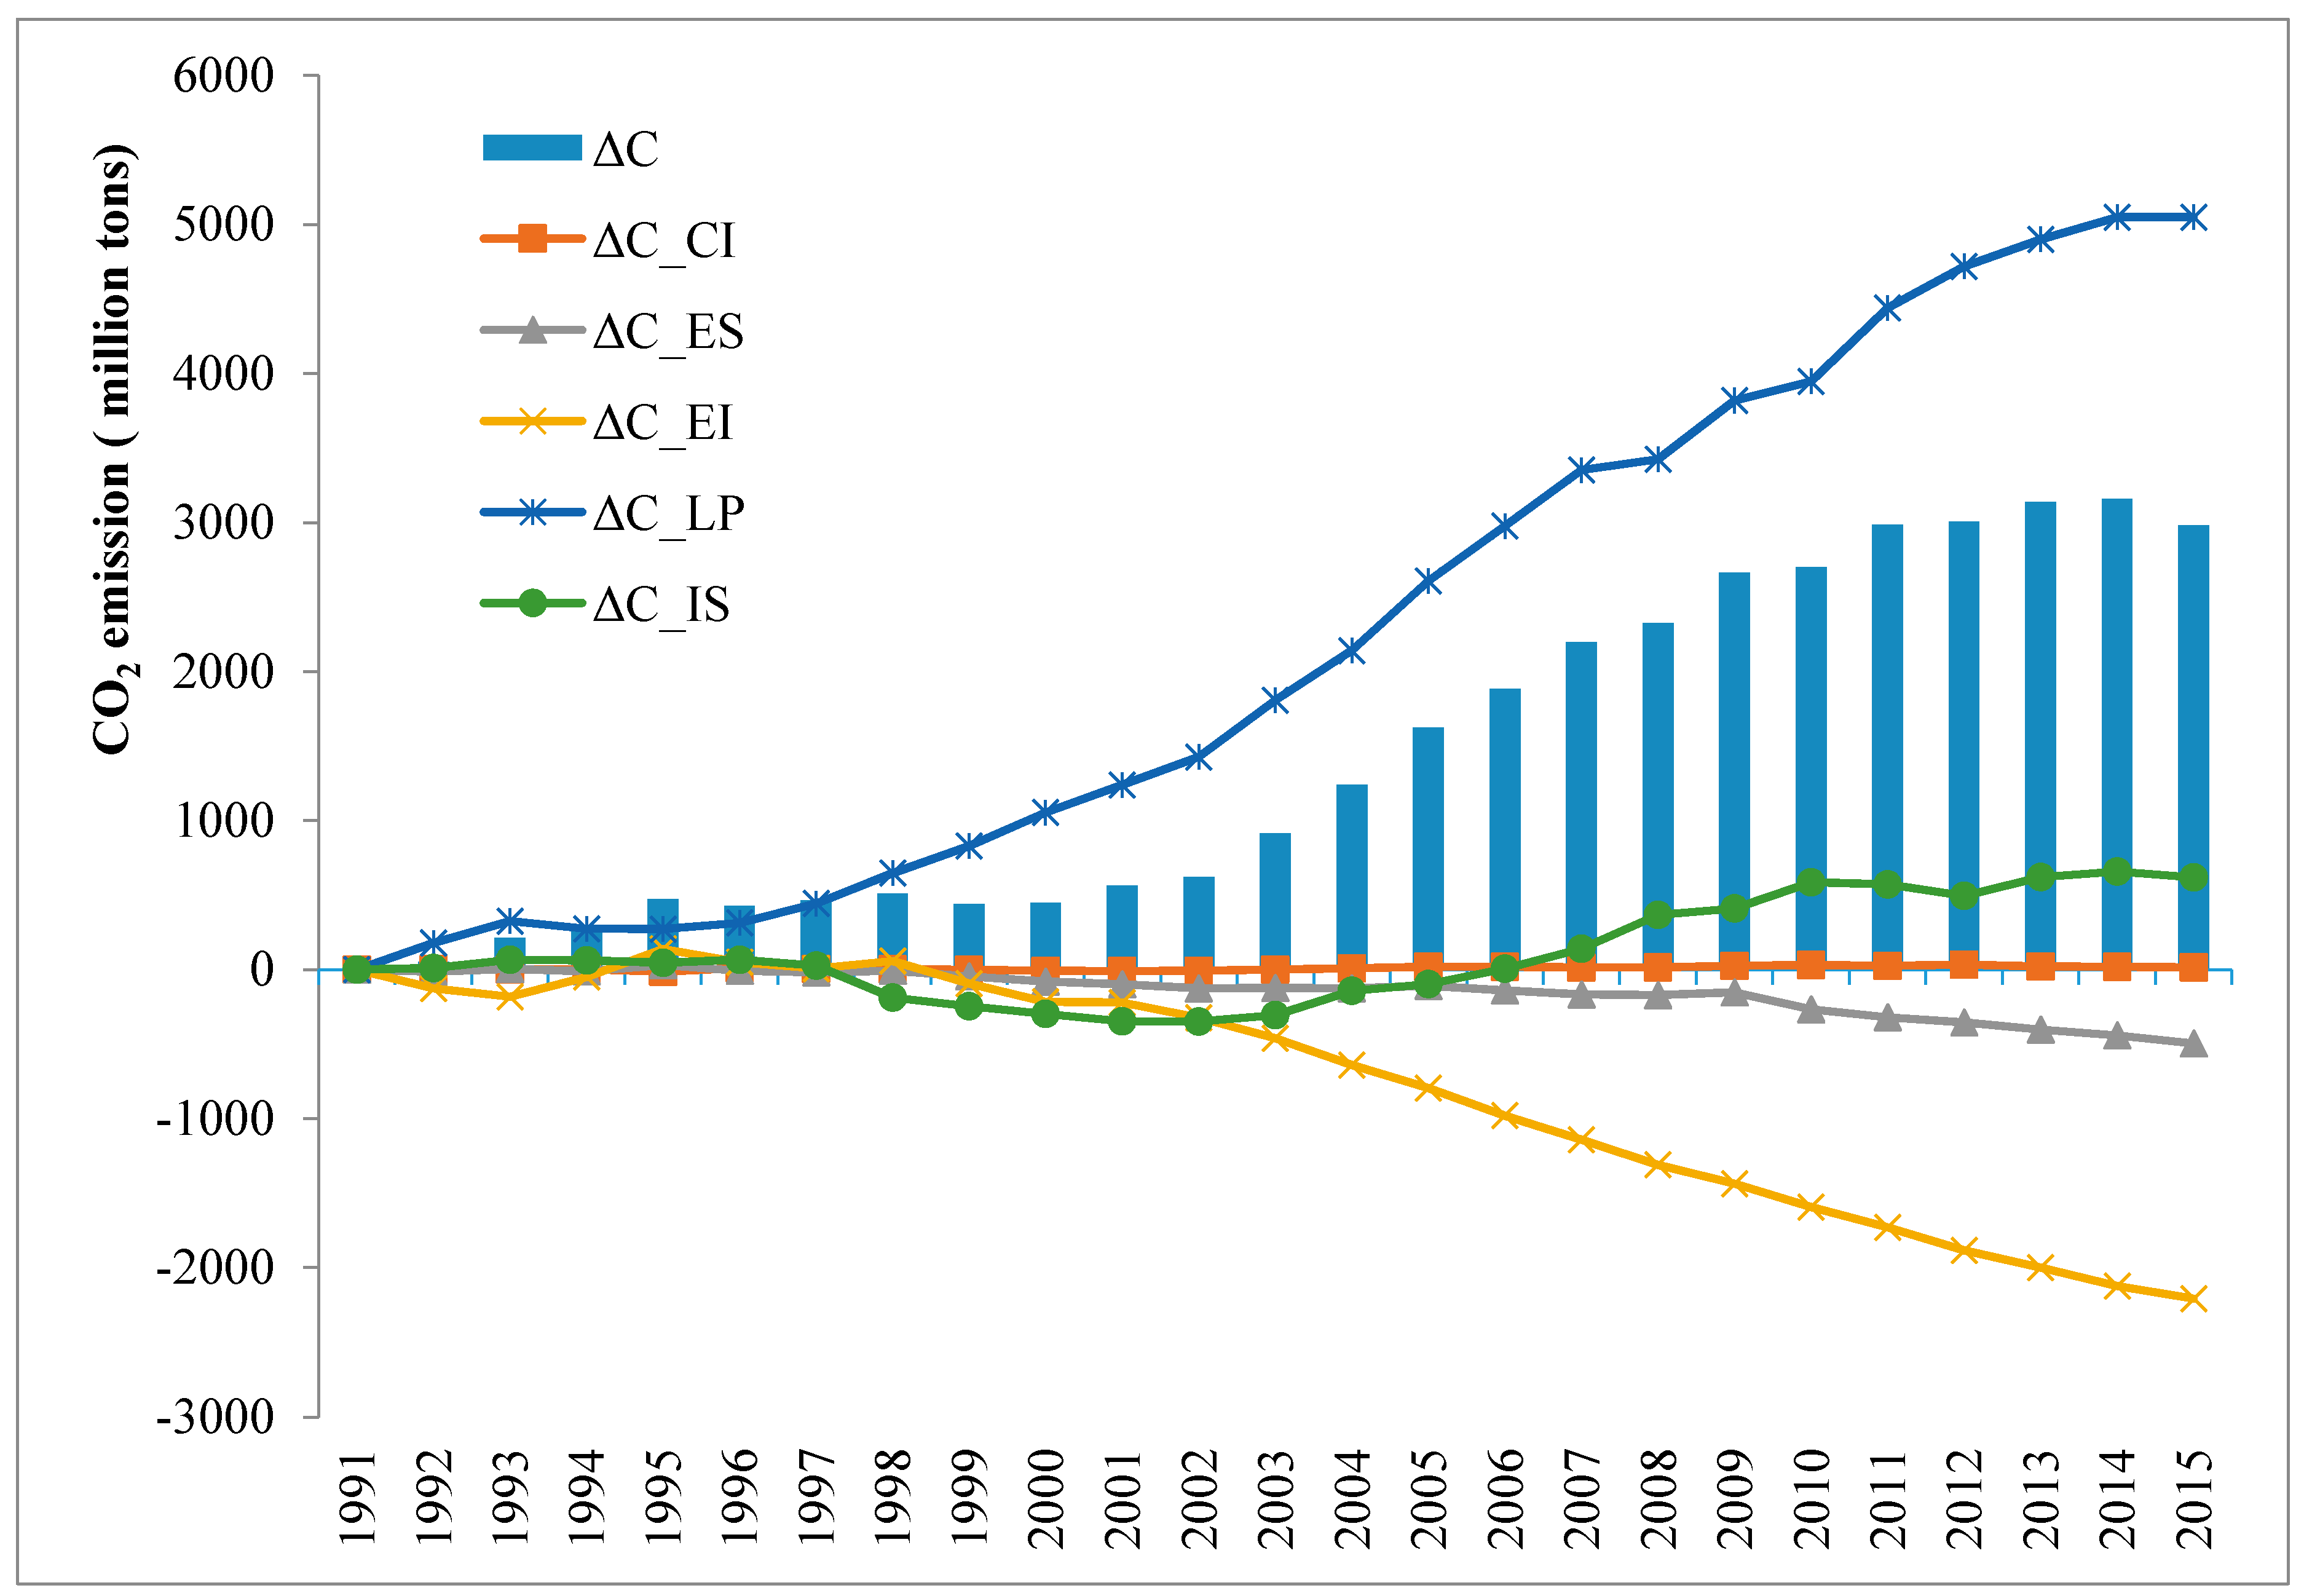
Table 1.
Definition of variables.
| Multiplier in Equation (2) | Abbreviation | Description |
|---|---|---|
| CI | Carbon intensity: The amount of carbon by weight emitted per unit of energy consumed. | |
| ES | Energy structure: the proportion of fossil energy in total energy consumption. | |
| EI | Energy intensity: energy consumption per unit of GDP. | |
| LP | Output per capita: industrial added value per capita. | |
| W | IS | Industry scale: the number of employees in the heavy industry. |
Table 2.
The carbon emissions coefficient of each type of energy.
| Energy Type | Raw Coal | Cleaned Coal | Other Washed Coal | Coke |
|---|---|---|---|---|
| Carbon emissions coefficient | 1.980356 | 2.495249 | 1.107727 | 3.046316 |
| unit | Mt/Mt | Mt/Mt | Mt/Mt | Mt/Mt |
| Energy type | Coke oven gas | Other goal gas | Other coke products | Crude oil |
| Carbon emissions coefficient | 929.4696 | 776.149 | 3.135913 | 3.409916 |
| unit | Mt/Mm3 | Mt/Mm3 | Mt/Mt | Mt/Mt |
| Energy type | Gasoline | kerosene | Diesel oil | Fuel oil |
| Carbon emissions coefficient | 3.044655 | 3.198454 | 3.174568 | 3.04218 |
| unit | Mt/Mt | Mt/Mt | Mt/Mt | Mt/Mt |
| Energy type | LPG | Refinery dry gas | Other petroleum products | Natural gas |
| Carbon emissions coefficient | 3.022209 | 3.617395 | 3.35 | 2090.427 |
| unit | Mt/Mt | Mt/Mt | Mt/Mt | Mt/Mm3 |
Table 3.
Change of CO2 emissions, driving force, reduction effect and decoupling index of China’s heavy industry in each year.
Table 3.
Change of CO2 emissions, driving force, reduction effect and decoupling index of China’s heavy industry in each year.
| DI | DI | ||||||||
|---|---|---|---|---|---|---|---|---|---|
| 1992 | 51.92 | 188.81 | −136.89 | 0.73 | 2004 | 323.87 | 1998.89 | −759.19 | 0.38 |
| 1993 | 161.43 | 390.92 | −177.57 | 0.45 | 2005 | 384.72 | 2510.61 | −886.19 | 0.35 |
| 1994 | 62.78 | 335.08 | −58.96 | 0.18 | 2006 | 259.78 | 2984.30 | −1100.10 | 0.37 |
| 1995 | 196.82 | 317.90 | 155.05 | −0.49 | 2007 | 315.24 | 3494.10 | −1294.65 | 0.37 |
| 1996 | −42.96 | 379.21 | 50.78 | −0.13 | 2008 | 126.05 | 3793.79 | −1468.29 | 0.39 |
| 1997 | 34.16 | 471.13 | −6.99 | 0.01 | 2009 | 338.89 | 4229.36 | −1564.97 | 0.37 |
| 1998 | 47.56 | 460.82 | 50.88 | −0.11 | 2010 | 39.39 | 4532.74 | −1828.96 | 0.40 |
| 1999 | −70.09 | 583.59 | −141.98 | 0.24 | 2011 | 282.43 | 5011.61 | −2025.40 | 0.40 |
| 2000 | 7.36 | 756.94 | −307.97 | 0.41 | 2012 | 22.69 | 5214.92 | −2206.01 | 0.42 |
| 2001 | 113.28 | 892.05 | −329.81 | 0.37 | 2013 | 128.41 | 5520.21 | −2382.90 | 0.43 |
| 2002 | 59.28 | 1078.33 | −456.81 | 0.42 | 2014 | 22.09 | 5705.91 | −2546.51 | 0.45 |
| 2003 | 294.31 | 1501.47 | −585.63 | 0.39 | 2015 | -178.61 | 5668.47 | −2687.68 | 0.47 |
© 2017 by the authors. Licensee MDPI, Basel, Switzerland. This article is an open access article distributed under the terms and conditions of the Creative Commons Attribution (CC BY) license (http://creativecommons.org/licenses/by/4.0/).
Share and Cite
MDPI and ACS Style
Boqiang, L.; Liu, K. Using LMDI to Analyze the Decoupling of Carbon Dioxide Emissions from China’s Heavy Industry. Sustainability 2017, 9, 1198. https://doi.org/10.3390/su9071198
AMA Style
Boqiang L, Liu K. Using LMDI to Analyze the Decoupling of Carbon Dioxide Emissions from China’s Heavy Industry. Sustainability. 2017; 9(7):1198. https://doi.org/10.3390/su9071198
Chicago/Turabian StyleBoqiang, Lin, and Kui Liu. 2017. "Using LMDI to Analyze the Decoupling of Carbon Dioxide Emissions from China’s Heavy Industry" Sustainability 9, no. 7: 1198. https://doi.org/10.3390/su9071198
Note that from the first issue of 2016, this journal uses article numbers instead of page numbers. See further details here.