Article

The Low-Carbon Transition toward Sustainability of Regional Coal-Dominated Energy Consumption Structure: A Case of Hebei Province in China

1
Institute of Energy, Environment and Economy, Tsinghua University, Beijing 100084, China
2
China Automotive Energy Research Center, Tsinghua University, Beijing 100084, China
3
School of Economics and Management, Tianjin University of Science and Technology, Tianjin 300222, China
*
Author to whom correspondence should be addressed.
Sustainability 2017, 9(7), 1184; https://doi.org/10.3390/su9071184
Submission received: 19 May 2017 / Revised: 2 July 2017 / Accepted: 4 July 2017 / Published: 6 July 2017
(This article belongs to the Special Issue Climate Change Mitigation and Adaptation - ZEMCH 2016)

Abstract

:
CO2 emission resulted from fossil energy use is threatening human sustainability globally. This study focuses on the low-carbon transition of Hebei’s coal-dominated energy system by estimating its total end-use energy consumption, primary energy supply and resultant CO2 emission up to 2030, by employing an energy demand analysis model based on setting of the economic growth rate, industrial structure, industry/sector energy consumption intensity, energy supply structure, and CO2 emission factor. It is found that the total primary energy consumption in Hebei will be 471 and 431 million tons of coal equivalent (tce) in 2030 in our two defined scenarios (conventional development scenario and coordinated development scenario), which are 1.40 and 1.28 times of the level in 2015, respectively. The resultant full-chain CO2 emission will be 1027 and 916 million tons in 2030 in the two scenarios, which are 1.24 and 1.10 times of the level in 2015, respectively. The full-chain CO2 emission will peak in about 2025. It is found that the coal-dominated situation of energy structure and CO2 emission increasing trend in Hebei can be changed in the future in the coordinated development scenario, in which Beijing-Tianjin-Hebei area coordinated development strategy will be strengthened. The energy structure of Hebei can be optimised since the proportion of coal in total primary energy consumption can fall from around 80% in 2015 to below 30% in 2030 and the proportions of transferred electricity, natural gas, nuclear energy and renewable energy can increase rapidly. Some specific additional policy instruments are also suggested to support the low-carbon transition of energy system in Hebei under the framework of the coordinated development of Beijing-Tianjin-Hebei area, and with the support from the central government of China.

1. Introduction

1.1. General Information of Hebei

Hebei province is in China’s north, bordering the Bohai Sea to its east and surrounding Beijing municipality and Tianjin municipality (the area consisting of Beijing, Tianjin and Hebei is called Beijing-Tianjin-Hebei area). In 2015, Hebei ranked 7th among all the nation’s 31 provinces in total economic development and 19th in gross domestic product (GDP) per capita (about 6445 US$), which ranks at moderate-to-low level within the whole country. This province has developed a complete industrial system, ranking first in the nation, especially in steel production [1].
Hebei has adopted a typical extensive heavy-chemical industrial development model often seen in China and the quality of the economic development is not high. The industrial structure is in a troubling situation [2], with overwhelming steel industry and a poorly developed tertiary industry. The urbanisation rate of Hebei falls below the national average. The scale of economic development of the major cities in Hebei are smaller than that of Beijing and Tianjin, for instance, even the sum of GDP in 2015 of top three cities (Tangshan, Shijiazhuang and Cangzhou) in Hebei was 1570 billion RMB (Chinese Yuan, the average exchange rate in 2015 is 6.2284 RMB to 1 US$), which is lower than 2270 billion RMB in Beijing and 1653.82 billion RMB in Tianjin in the same year.
Huge differences exist in infrastructure construction and public service levels compared with surrounding Beijing and Tianjin. In particular, a huge gap is formed in the level of economic development in 14 cities (counties) surrounding Beijing and Tianjin, as compared with Beijing and Tianjin themselves [3]. In other words, Hebei is facing gradually urgent pressure on sustainable development in the future [4,5].

1.2. Energy Consumption and CO2 Emission in Hebei

In 2015, total primary energy consumption in Hebei was 336 million tons of coal equivalent (tce), with a 45% increase from 2006 [6]. Coal consumption maintained a dominant position in primary energy consumption at around 92% from 2006 to 87% in 2015 (Figure 1). In 2015, coal, oil, natural gas, and primary electricity accounted for 86.55%, 7.99%, 3.30%, and 2.16% of total consumption, respectively [6]. Energy consumption per capita in Hebei (3.95 tce) was higher than national average levels (3.13 tce) in 2015 [1,6].
The secondary industry is the foremost contributor to energy consumption in Hebei [7]. Total energy consumption of that industry reached 227 million tce in 2014, accounting for approximately 80% of the total energy consumption. Within the secondary industry sector, energy consumption of six energy-intensive sub-industries (coal mining, oil processing and coking, chemicals, non-metallic, ferrous metal, and electricity and heat) reached 185 million tce in 2015, accounting for approximately 80% of secondary industry sector energy consumption [6]. Energy consumption types in the primary industry include coal, oil (gasoline and diesel), and electricity. In terms of total consumption, energy consumption of primary industry only accounted for 2.1% of total energy consumption in Hebei in 2015 [6]. With regard to energy intensity, energy consumption per unit of GDP of primary industry was 0.19 tce/10,000 RMB in Hebei in 2015 [6]. Energy consumption of the tertiary industry continually increases with the growth of its value-added. Energy consumption for every 10,000 RMB value-added of this industry was 0.24 tce/10,000 RMB [6]. Residential energy consumption mainly involved two sections: energy use in private transport and housing [8,9,10]. Residential energy consumption per capita in Hebei was 0.46 tce in 2015.
As Figure 2 shows, as the energy consumption increased quickly, CO2 emission in this area reached about 723 million tons, which is 10 times of the level in 1980 and the average annual growth rate was 6.3% since 2000. Hebei has been under high pressure to control its CO2 emission increasing trend due to the high ratio of CO2 emission in Hebei to all of China (about 10%).

1.3. Requirements of the Beijing-Tianjin-Hebei Area Coordinated Development Strategy

Beijing-Tianjin-Hebei area coordinated development has strategically reached an unprecedented level and the central government of China released the Beijing-Tianjin-Hebei cooperation and development plan in 2015 [11,12]. One of the key drivers is to alleviate the heavy air pollution situation in this area, majorly caused by the large scale of coal use in Hebei, whose SO2, NOx and dust pollutants accounted 6%, 7% and 10% of the total in China in 2015, respectively [8].
In the future, these two major cities in northern China (Beijing and Tianjin), along with the large industrial province Hebei, will constitute an integrated and developed region [12]. The economic development and resources utilisation in this region will be managed in a coordinated framework. Hebei is responsible for distributing several functions of Beijing, implementing low-carbon energy policies, and accelerating the industrial structure transition [13]. Hebei will also play more significant roles as an ecological service platform as well as an ecological conservation zone [14].
In early 2016, Beijing-Tianjin-Hebei area economic and social development plan during the period from 2016 to 2020 was released and it was the first inter-provincial plan in China based on the “Beijing-Tianjin-Hebei cooperation and development plan” released by the central government of China in 2015. In this plan, the Beijing-Tianjin-Hebei area will be developed in a coordinated way and realise the integrated layout of urban agglomeration development, industrial transformation and upgrading, transportation facilities, and social and livelihood improvement [15].
In April 2017, the central government of China decided to set up Xiong’an New District as a new national-level district. It is planned to develop about 100, 200 and 2000 square kilometre areas in near, medium and long term, respectively, to ease the Beijing non-capital functions, optimise the urban layout and spatial structure of Beijing-Tianjin-Hebei area, and cultivate new driver for innovative development in China [16].
Therefore, Hebei urgently needs to adjust the energy consumption structure, reduce coal use, improve the proportion of clean energy among energy consumption, and achieve diversification of energy supply to decrease fossil energy consumption, CO2 emission and air pollutants emission [5,17]. The key question is how to fulfil the low-carbon transition in Hebei’s energy system from the perspective of the future energy development strategy and policy-decision. Developing the research methodology and modelling tool, and performing in-depth study on the path to the low-carbon transition and corresponding policy suggestions are urgently needed.

1.4. Literature Review of the Studies on Regional Low-Carbon Transition of Energy Structure

Previous research on low-carbon transition of energy system can be mainly categorised into two types: research based on top-down models and research based on bottom-up sector-level analysis.
For the first type, the commonly used optimisation models, including the cost minimisation model, utility maximisation model and computable general equilibrium (CGE) model, are very complex and require abundant data, since cost and economic parameters for various types of energy use technologies are often needed when these models are adopted. For example, International Energy Agency and Nordic Energy Research (2016) [18] focused on energy and carbon technology pathways in the Nordic region through optimisation modelling. Liu et al. (2016) [19] studied the primary energy consumption and carbon emissions in different scenarios at 10-year intervals between 2010 and 2050 in whole China and showed that controlling coal consumption will have an important influence on the control of total carbon emissions and of carbon emission peaking; promotion of non-fossil fuel energies will offer a growing contribution to a low-carbon transition in the medium and long term and the establishment of a low-carbon power system is crucial for the achievement of low-carbon energy transition. Yuan et al. (2014) [20] constructed China’s 2050 energy consumption and associated CO2 reduction scenarios by simulating China’s economic development and the consideration on the impacts of urbanisation and income distribution.
For the second type, some studies are conducted by estimating energy consumption and demand through decomposing it sector-by-sector. In these studies, energy efficiency data and structural parameters are essential. For example, Emodi et al. (2017) [21] explored Nigeria’s future energy demand, supply and associated GHG emissions from 2010 to 2040 by using the Long-range Energy Alternative Planning (LEAP) model. Linda and Espegren (2017) [22] analysed how various energy and climate measures can transform Oslo into a low-carbon city by employing a technology-rich optimisation model. Zhao et al. (2017) [23] presented a study on the energy system modelling towards renewable energy and low carbon development for Beijing by using the EnergyPLAN tool. Pan et al. (2017) [24] examined China’s energy transformation towards the 2 °C global warming goal until 2100 by using integrated-assessment model (the Global Change Assessment Model (GCAM)).
These two common types of methods may not be available for the analysis on sub-region of the developing countries (including China), in which the economic and technological contexts are in a fast-evolution period [25].

1.5. Recent Studies on Hebei’s Energy Demand Projection

Most early research specified on Hebei discussed about energy demand by considering overall economy development, and about carbon emission by considering energy structure changing. For example, Du et al. (2015) [7] analysed the dynamic relationship between energy consumption and economic growth by using the time series data of output, capital, employment and energy consumption in Hebei from 1980 to 2012. Niu et al. (2011) [26] analysed the relationship between the carbon emissions and the changes in energy consumption structure in Hebei province, and predicted carbon emissions from 2010 to 2015. Wang and Yang (2015) [14] studied the relationship between regional carbon emissions and industry development of Beijing-Tianjin-Hebei economic band case.
Few studies conduct quantitative analysis on this region’s low-carbon transition of energy system since large amounts of data on efficiency and cost are indispensable if optimisation methods or cost minimisation methods are adopted. Because only sectoral activity level data are available at provincial level in China, a useful method for estimating total regional energy consumption can be employed by integrating sectoral estimation of energy consumption and resultant carbon emission with government plans, expert opinions and literature review. For example, there was a study, taken by Institute of Tsinghua University at Hebei (ITUH) [10], aimed to support the strategy decision on the coordinated development of Beijing-Tianjin-Hebei area, involving economic development, energy consumption and air pollution emission. In the study of [10], two scenarios are designed for the future development for Hebei to 2030, based on the different prediction of GDP and its structure. Future energy demand was derived on the method of energy consumption intensity by sector while energy supply structure was determined by assumptions based on trend analysis and central government expectation.

1.6. Scope and Structure of This Paper

Based on the literatures review shown in Section 1.4 and Section 1.5, we find it is meaningful to focus on the research for the low carbon transition of energy-system by develop suitable tools for the specific regions such as Hebei. This study will investigate how the more stringent plans can alter the energy structure to affect this regional low-carbon transition using Hebei as a case based on a bottom-up modelling analysis. We focus on the low-carbon transition of Hebei’s coal-dominated energy system by estimating its total end-use energy demand, primary energy supply and resultant CO2 emission up to 2030, by employing an energy demand analysis model based on settings of the economic growth rate, industrial structure, industry/sector energy consumption intensity, energy supply structure, and CO2 emission factor.
This paper has six sections. Section 2 introduces the methodology, including the model adopted and the calculation equations employed. Section 3 presents the two scenarios defined in this study and their major settings. Section 4 mainly lists the key data and assumptions. Section 5 gives out the results of energy consumption and CO2 emission, and makes some discussions. The conclusions and policy recommendations are given in Section 6.

2. Methodology

2.1. Framework of Model

The quantitative analysis model based on energy consumption intensity is chosen in the present study, as Figure 3 shows. Future end-use and primary energy demand, and direct and full-chain CO2 emission by industry/sector are calculated step by step, with the input of GDP, energy intensity of each industry/sector, emission factor of CO2, conversion and transmission loss rate from primary energy to end-use energy, and energy supply strategy.
That is, for an industry/sector, its future total end-use energy consumption can be estimated by multiplying the energy consumption per unit of GDP or product and GDP output or the products output, respectively. Future total residential end-use energy consumption can be estimated by multiplying the result of residential energy consumption per capita for an urban or rural resident and the corresponding population size.
Based on the end-use energy demand analysis results, primary energy demand and supply can be found with the research on conversion and transmission loss rate from primary energy to end-use energy, and energy supply strategy. Both direct and full-chain CO2 emission can be calculated with the determination of CO2 emission factor by energy type.

2.2. Calculation Equations

(1) End-use energy consumption
Based on the characteristics of different industries/sector, end-use energy consumption is calculated as following Equations (1)–(6) in this study.
For the year t, the total end-use energy consumption is the sum of end-use energy consumption of four industries/sectors (i) as Equation (1) shows:
E n d E t o t a l t = i = 1 4 E n d E i t
where E n d E t o t a l t represents the total end-use energy consumption, and E n d E i t is the end-use energy consumption of four industries/sector i in year t. For each industry, it is calculated by multiplying the economic value/goods output by energy intensity.
Equation (2) is adopted for the primary industry:
E n d E 1 t = G D P 1 t I n t e n s i t y 1 t
where, for the year t, E n d E 1 t is the total end-use energy consumed by primary industry, G D P 1 t is the GDP of primary industry, and I n t e n s i t y 1 t is the energy consumption per unit of GDP of primary industry.
Equation (3) is adopted for secondary industry:
E n d E 2 t = E l e c t r i c i t y o u t p u t t I n t e n s i t y E l e c t r i c i t y t + S t e e l o u t p u t t I n t e n s i t y S t e e l t + C e m e n t o u t p u t t I n t e n s i t y C e m e n t t + C o a l o u t p u t t I n t e n s i t y C o a l t + G D P o i l p r o c e s s i n g t I n t e n s i t y C o a l t + G D P C h e m i c a l t I n t e n s i t y C h e m i c a l t + G D P O t h e r s e c t o r s t I n t e n s i t y O t h e r s e c t o r s t
where, for the year t, E n d E 2 t is the total end-use energy consumed by secondary industry, E l e c t r i c i t y o u t p u t t is the electricity output, I n t e n s i t y E l e c t r i c i t y t is energy consumption per unit electricity output, S t e e l o u t p u t t is the steel output, I n t e n s i t y S t e e l t is energy consumption per unit steel output, C e m e n t o u t p u t t is the cement output, I n t e n s i t y C e m e n t t is energy consumption per unit cement output, C o a l o u t p u t t is the coal output, I n t e n s i t y C o a l t is energy consumption per unit coal output, G D P o i l p r o c e s s i n g t is the GDP of oil processing industry, I n t e n s i t y o i l p r o c e s s i n g t is the energy consumption per unit of GDP of oil processing industry, G D P C h e m i c a l t is the GDP of chemical industry, I n t e n s i t y C h e m i c a l t is the energy consumption per unit of GDP of chemical industry, G D P O t h e r s e c t o r s t is the GDP of other sectors in secondary industry, and I n t e n s i t y O t h e r s e c t o r s t is the energy consumption per unit of GDP of other sectors in secondary industry.
Equation (4) is adopted for the tertiary industry:
E n d E 3 t = G D P 3 t I n t e n s i t y 3 t
where, for the year t, E n d E 3 t is the total end-use energy consumed by tertiary industry, G D P 3 t is the GDP of tertiary industry, and I n t e n s i t y 3 t is the energy consumption per unit of GDP of tertiary industry.
For residential sector, its end-use energy consumption is calculated by multiplying the population by energy intensity as Equation (5) shows:
E n d E 4 t = P o p t I n t e n s i t y 4 t
where P o p t is the resident population in year t, and I n t e n s i t y 4 t is the energy consumption intensity per capita in year t.
The end-use energy consumption of each industry/sector can be divided by end-use energy type (j) and the total end-use energy consumption of four industries/sector by end-use energy type can be summed from each industry/sector as Equation (6) shows:
E n d E t o t a l , j t = i = 1 4 ( S h a r e i , j t E n d E i t )
where, for the year t, E n d E t o t a l , j t is the total end-use energy type j consumed by the four industries/sectors, and S h a r e i , j t is the proportion of end-use energy type j in the total end-use energy consumed by industry/sector i.
(2) Primary energy consumption
Based on the calculation results of end-use energy consumption, the total primary energy consumption can be summed from each industry/sector and divided by primary energy type k as Equation (7) shows:
P r i E t o t a l = i = 1 4 k = 1 4 j = 1 4 ( C o n j , k S h a r e i , j t E n d E i t )
where P r i E t o t a l is the total primary energy consumption, and C o n j , k is the conversion factor representing the amount of primary energy type k consumed in order to obtain one unit end-use energy type j.
(3) CO2 emission
Direct and full-chain CO2 emission can be calculated based on end-use energy consumption and primary energy consumption of each industry/sector, multiplied by different CO2 emission factors with different energy types, respectively, as Equations (8) and (9) show:
C O 2 E d i r e c t = i = 1 4 j = 1 4 ( C O 2 E F j S h a r e i , j t E n d E i t )
C O 2 E f u l l c h a i n = i = 1 4 k = 1 4 ( C O 2 E F k j = 1 4 ( C o n j , k S h a r e i , j t E n d E i t ) )
where C O 2 E d i r e c t is the total direct CO2 emission, C O 2 E F j is the direct CO2 emission factor of end-use energy type j, C O 2 E f u l l c h a i n is the total full-chain CO2 emission, and C O 2 E F k is the full-chain CO2 emission factor of primary energy type k.

3. Scenario Setting

(1) Economic development settings
Two scenarios have been designed in the study by ITUH [10], in which, the prediction of GDP and its structure in future Hebei without the coordinated development of Beijing-Tianjin-Hebei area, were the key contents. In our study, we will also set two scenarios similar to the ITUH study [10] and agree with not all of its setting but its economic settings in the two scenarios as Table 1 shows. In the conventional scenario, Hebei is assumed to follow the traditional development paradigm for implementing appropriate industrial transformation and upgrading, without considering potential impact to Hebei from Beijing-Tianjin-Hebei area coordinated development strategy: reduction of local air pollutant emission and transferring of high-level industries. Industry on the whole maintains a development trend of seeking progress in stability, while energy-intensive industries also maintain that same trend. In this scenario, the GDP growth rate in Hebei is slightly above the national average in the near term. As the industrial growth rate gradually slows, the GDP growth rate will be roughly comparable with, or slightly lower, than the national average in 2020–2030 [10]. In the coordinated scenario, Hebei vigorously compresses and reduces production capacity in the broad framework of the Beijing-Tianjin-Hebei area coordinated development strategy. It cuts steel production capacity by more than 60 million tons and plans to reduce general steel production capacity to less than 200 million tons by 2020. The province proactively limits secondary industry, particularly development of energy-intensive, highly polluting industries. It assumes industrial transfer from Beijing and Tianjin, and vigorously develops tertiary industry. In this scenario, industrial development in Hebei will be substantially restricted. It is foreseeable that the GDP growth rate in Hebei will drop from above the national average level to the bottom level in the near term. Then, it will gradually return to the national average along with completion of industrial upgrading and vigorous development of tertiary industry [10].
The GDP and other key economic-related data used in two scenarios in future Hebei are shown in Table 2.
(2) Energy demand and supply related settings
The energy intensity data in future by industry/sector of each year will not be set differently varied from scenario. As a result, end-use energy demand in future by industry/sector of each year will be different in the two scenarios if their economic and production output of each year are different in different scenario.
In the conventional scenario, the future energy supply strategy will follow the local development plan before 2020, and will keep the coal supply stable from 2020 to 2030 while expand clean energy (natural gas, renewable energy, nuclear power and transferred electricity) to fulfil the incremental energy demand during this period.
In the coordinated scenario, the future coal supply will decrease at a quicker speed than the local development plan before 2020 and will continually decrease by one half from 2015 to 2030. Natural gas, nuclear power and transferred electricity in this scenario will be expanded to the bigger scale than the level in the conventional scenario, while the renewable energy will expand to a bit smaller scale than the level in the conventional scenario, though the percentages of renewable energy in total energy supply of each year will be the same in the two scenarios.

4. Key Data and Assumption

4.1. Macro-Economic, Demographic and Urbanisation Rate Assumption

Economic output is referred from the ITUH study [10] on future development of Hebei province, as Table 1 and Table 2 show, in the two designed scenarios as mentioned in the Section 3. Total population and urbanisation rate data are referred from the yearbook and future plans of Hebei [6,27] as Table 3 shows. Population in Hebei will sustainably increase and peak after 2030, since China began to relax the family planning (one-child) policy in 2014. Meanwhile, urbanisation rate in Hebei will increase rapidly, since China has determined to relax the conditions for transference from rural to urban household registration, and employment opportunities in cities are much more abundant than that in rural areas.

4.2. Energy Intensity Data

The energy intensities of different industries/sectors in the future are calculated by authors by referring [8,28,29,30,31,32,33] (see Table 4). The details are shown in the following paragraphs.
(1) Primary industry
Energy consumption per unit of GDP of primary industry was 0.19 tce/10,000 RMB in Hebei in 2015 [6,8,9]. The electricity consumption intensity of primary industry in Hebei exceeded the national average, while the corresponding oil consumption intensity was below the national average [28]. With the saturation of mechanisation in the primary industry, process of agricultural modernisation will mainly depend on development of biotechnologies and information technologies in future. Consequently, energy consumption per unit of GDP of primary industry will potentially further decrease in the future. Energy consumption per unit of GDP of primary industry is set to 0.14 tce/10,000 RMB for 2030, which declines by nearly 26% compared with that in 2015 (0.19) and approaches the national level in 2014 (0.13) [9].
(2) Secondary industry
Substantial decreases (about 10–40%) will occur in energy consumption per unit of product in the electricity, steel, cement, and coal mining and processing industries in the period 2015–2030 [29,30,31]. Future downswing of energy consumption per unit of product is mainly derived from technology progress. Current energy consumption per unit of product in the electricity industry in Hebei is 20% higher than that in the advanced world level. Adopting advanced technology will help improve energy efficiency in Hebei. In the steel industry, there is an enormous potential of energy consumption reduction if the proportion of short-flow production line, which uses scrap steel as feedstock, increases and energy-saving technologies are adopted. Hebei will spread several advanced energy-saving technologies in the cement industry, for instance, new-dry-process, and gradually bridge the gap between energy consumption level in Hebei and the advanced world level. As for the coal mining and processing industry, Hebei will continuously improve the mining level, enlarge the application of energy-saving technologies, and gradually improve the energy consumption level.
Energy consumption per unit of value-added in oil processing and chemical industry dropped considerably, from 6.1 and 7.2 tce/10,000 RMB in 2005 to 0.83 and 1.38 tce/10,000 RMB in 2015, respectively. Given that the decline in energy consumption intensity is not unlimited, the rate of decline tended to slow from 2015 to 2030. Energy consumption intensity in other sub-industries will be lower than that in chemical industry in future [10,31]. Future downswing of energy consumption per unit of value-added in these key sub-industries is mainly derived from technology progress and proportion increase of high-value products, for instance, a greater proportion of high value-added petrochemicals will be produced in oil processing and chemical industry.
(3) Tertiary industry
Energy consumption intensity of tertiary industry in Hebei was 0.24 tce/10,000 RMB in 2015. Oil product consumption was 0.057 tons/10,000 RMB, natural gas consumption was 11.68 m3/10,000 RMB, and electricity consumption was 313 kWh/10,000 RMB [6,8,9]. The future energy consumption intensity of the tertiary industry in Hebei shows a downward trend [32,33]. Based on the current level of energy consumption intensity of the tertiary industry in the country and at the international advanced level [33], we assume that energy consumption intensity of tertiary industry in Hebei will drop by nearly 40% in 2030 compared with 2015.
Developing tertiary industry significantly orients optimisation of industrial structure and transformation of major engine of economic growth in Hebei. As the process of industrial upgrading accelerates, high value-added sub-industries will develop rapidly, proportion of coal use among total energy consumption will decrease simultaneously, and proportion of electricity and steam demand among total end-use energy consumption will increase steadily in tertiary industry. As the added value of transportation industry will increase rapidly, the demand of oil products and other fuels will increase consequently.
(4) Residential sector
In 2015, Hebei has expanded to a total population of about 74.45 million and reached a 52% urbanisation level, with a total urban population of around 38 million [9]. Residential energy consumption per capita in Hebei was 0.46 tce, with a combination of 0.50 tce per capita for urban resident and 0.40 for rural resident [8]. Overall, Residential energy consumption per capita in Hebei will be 1.43 tce in 2030, growing by approximately 200% compared with the level in 2015 [10].
Increase of residential energy consumption per capita results from upturn living standards, urbanisation rate increase and development of electrification level. Residential demand of electricity and natural gas will increase, while demand of coal and liquefied petroleum gas will decrease. Along with increased vehicle population and frequent commuting, oil product consumption will also increase rapidly in future in Hebei.

4.3. Other Key Data and Assumptions

(1) End-use energy consumption structure of secondary industry
End-use energy consumption structure of secondary industry shown in Figure 4 is adopted for energy-intensive sectors in Hebei in 2015 [8]. In the future, this kind of structure will be optimised by increasing the share of clean energy (electricity and natural gas).
(2) Status and development plan of non-fossil energy in Hebei
In general, renewable energy resources are abundant in Hebei. There are ample wind energy resources in Hebei, in which technically exploitable resource surpasses 80 million kilowatts. Solar energy resources in Hebei rank in the forefront in China, with 90 million kilowatts available for exploitation. Biomass resources are abundant in Hebei. Total amount for energy-oriented use is over 20 million tons, within which crop straw and forestry resources are 10.46 million tons and 5.7 million tons, respectively. Annual surficial geothermal resource in Hebei is equivalent to 285 million tce, with 11 million tce available for exploitation. Geothermal resource reserve in middle-deep beds is equivalent to 23.52 billion tce, with 4.97 billion tce available for exploitation. Potential exploitation amount of capacity of pumped storage electricity plant is over 16 million kilowatts [34,35].
Renewable energy resource in Hebei has been well developed and utilised [35,36]. The gross of renewable energy use in Hebei increased from 4 million tce in 2010 to approximately 10 million tce in 2015, while proportion that renewable energy consumption accounts for of primary energy consumption rose from 2.4% to about 5% during the same period. In 2015, generated electricity from renewable energy in Hebei was 21.3 billion kilowatts, accounting for 6.7% of total electricity consumption.
Hebei will exert efforts to raise renewable energy supply in near future according to development plan [34]. In 2020, Utilisation amount of renewable energy will reach 23 million tce, and non-fossil energy consumption will account for 7% of total energy consumption. Generated electricity from renewable energy will account for over 13% of total electricity consumption in Hebei.
Hebei has also exerted efforts to put forward low-carbon transition by constructing several nuclear plants [36]. Site selection of nuclear power plants in Kuancheng, Funing, Qianxi and Haixing has already been accomplished. Obvious progress has been made in early stage works of Haixing nuclear plants’ construction and the first unit will be put into production in December 2020, while the second one will be commissioned 10 months later. Four other nuclear plants may also be constructed, and the total installed capacity will be 7.5 million kilowatts.
As mentioned in the Section 3 (Energy demand and supply related settings of future development scenario setting), in the conventional scenario, the future energy supply strategy in this study will follow the renewable energy development plan before 2020 and expand renewable energy and nuclear power, along with transferred electricity, to keep the coal supply stably from 2020 to 2030.
In the coordinated scenario, because the future coal supply will be decreased at a quicker speed than the local development plan before 2020 and will continually decrease to cut one half from 2015 to 2030, nuclear power, along with transferred electricity, in this scenario will be expanded to the bigger scale than the level in the conventional scenario, while the renewable energy will expand to a bit smaller scale than the level in the conventional scenario, though the percentages of renewable energy in total energy supply of each year will be same in the two scenarios.
From the methodological point of view, we will build the energy development plans summarised here to our primary energy supply projections up to 2030 by following approach. For a specific year during 2016 to 2030, we will analyse the primary energy supply by type one by one, based on the result of total demand:
  • Coal supply both for direct use and power generation;
  • Oil supply;
  • Natural gas supply for direct use and power generation; and
  • Non-fossil energy demand for power generation and other energy service.
During the period from 2015 to 2020, energy supply in the conventional scenario basically conform to the relevant development plan for 2015–2020 promulgated by Hebei government. In the coordinated scenario, coal assumption will reduce by 20%, and energy consumption of natural gas, nuclear power and electricity transferred from other provinces will consequently increase to ensure total energy consumption in Hebei in the same period. Besides, we assume the proportion of renewable energy among total energy consumption in the coordinated scenario remains the same as that in the conventional scenario, while their actual quantity in the coordinated scenario will slightly decrease compared to that in the conventional scenario.
During the period from 2020 to 2030, the major variable considered in energy supply is coal assumption. In the conventional scenario, coal demand will remain the same from 2020 to 2030, while oil product demand will increase slightly. Demand of natural gas will employ an annual 5% increase. Electricity and steam will be guaranteed by rapid development of nuclear power and moderate development of renewable energy. Electricity transferred from other provinces will also help meet the redundant electricity demand. In the coordinated scenario, coal demand from 2020 to 2030 will reduce by about 50% compared with that in 2015. Oil product demand will slightly increase. Natural gas demand will double its original status in 2015. Electricity demand will be guaranteed by rapid development of nuclear power and moderate development of renewable energy. Electricity transferred from other provinces will also help meet the redundant electricity demand.
To sum up, proportions of renewable energy demand among total energy demand in both the conventional scenario and coordinated scenario are about 5%. Nuclear power will gradually develop and finally account for about 50% of total available exploited resources in 2030 in the conventional scenario, while this proportion in the coordinated scenario will be about 67%.
(3) Loss rates of coal and oil during production and transmission
It is supposed that loss rates of coal and oil during production and transmission are 9% and 3%, respectively [9]. The primary energy demand can be derived by these loss rates and the obtained end-use energy demand by Ref. [25].

5. Results and Discussion

5.1. Results of End-Use Energy Consumption

(1) Total end-use energy demand
Table A1 and Table A2 and 
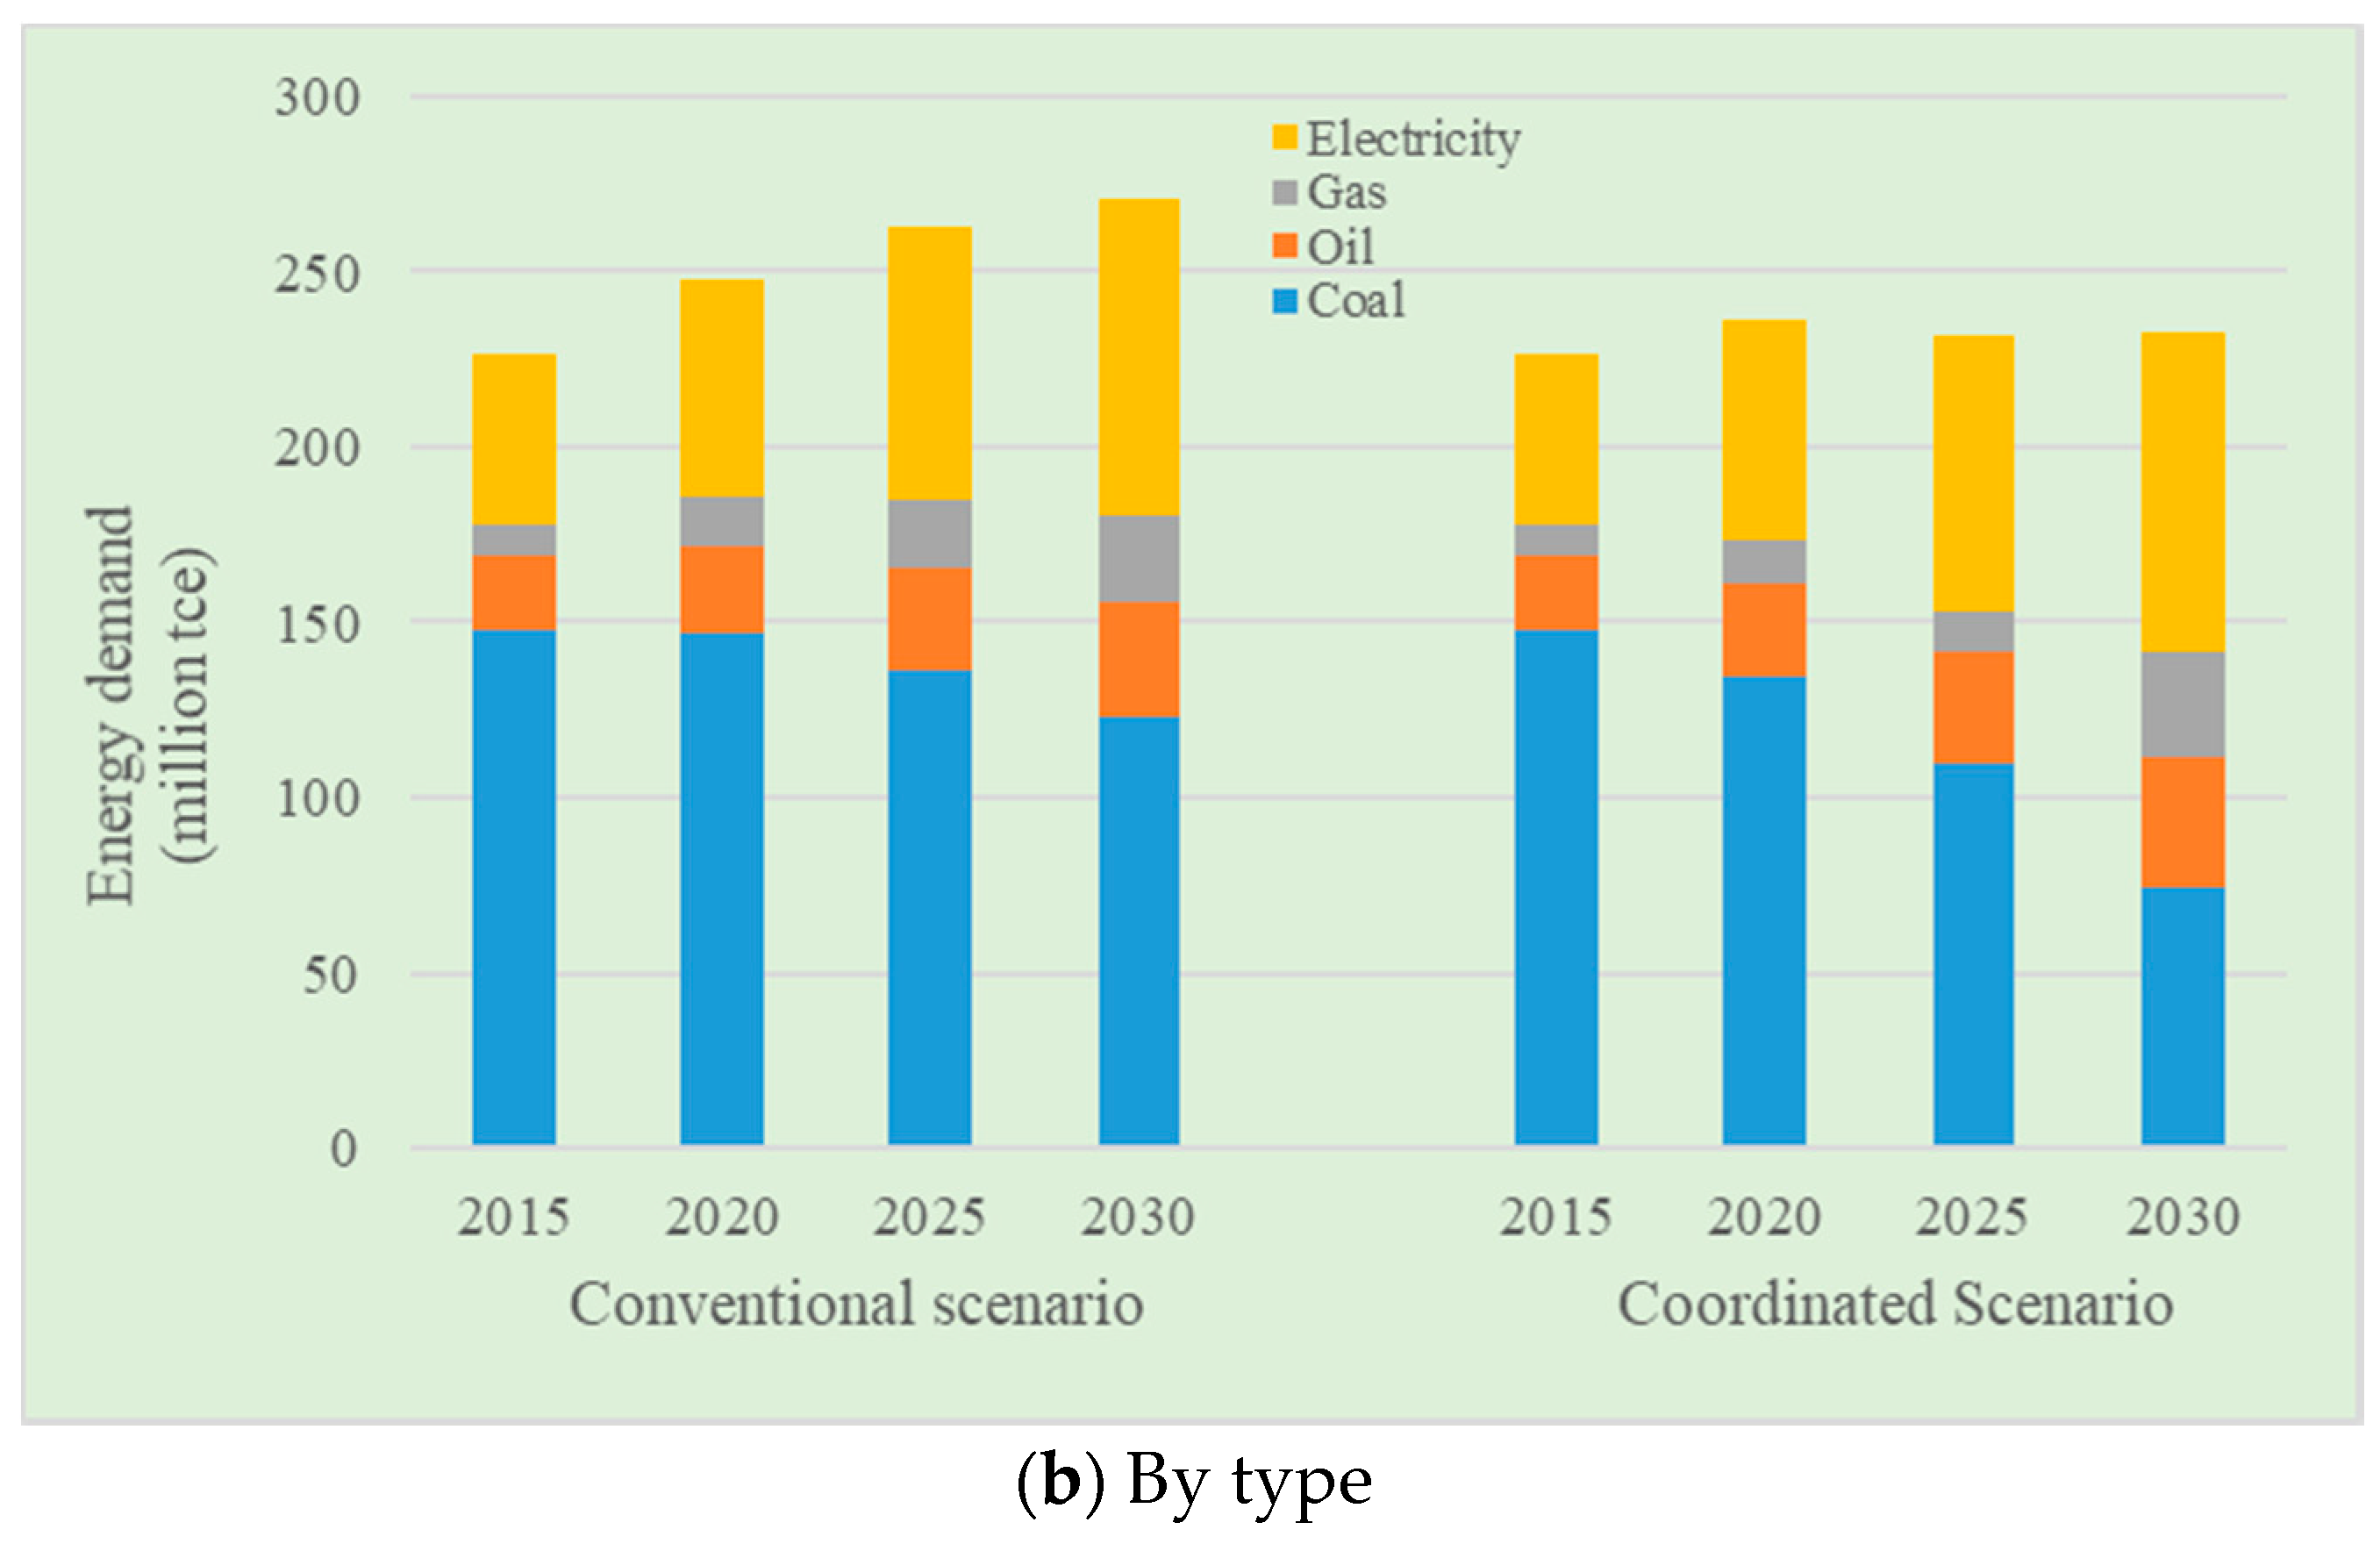
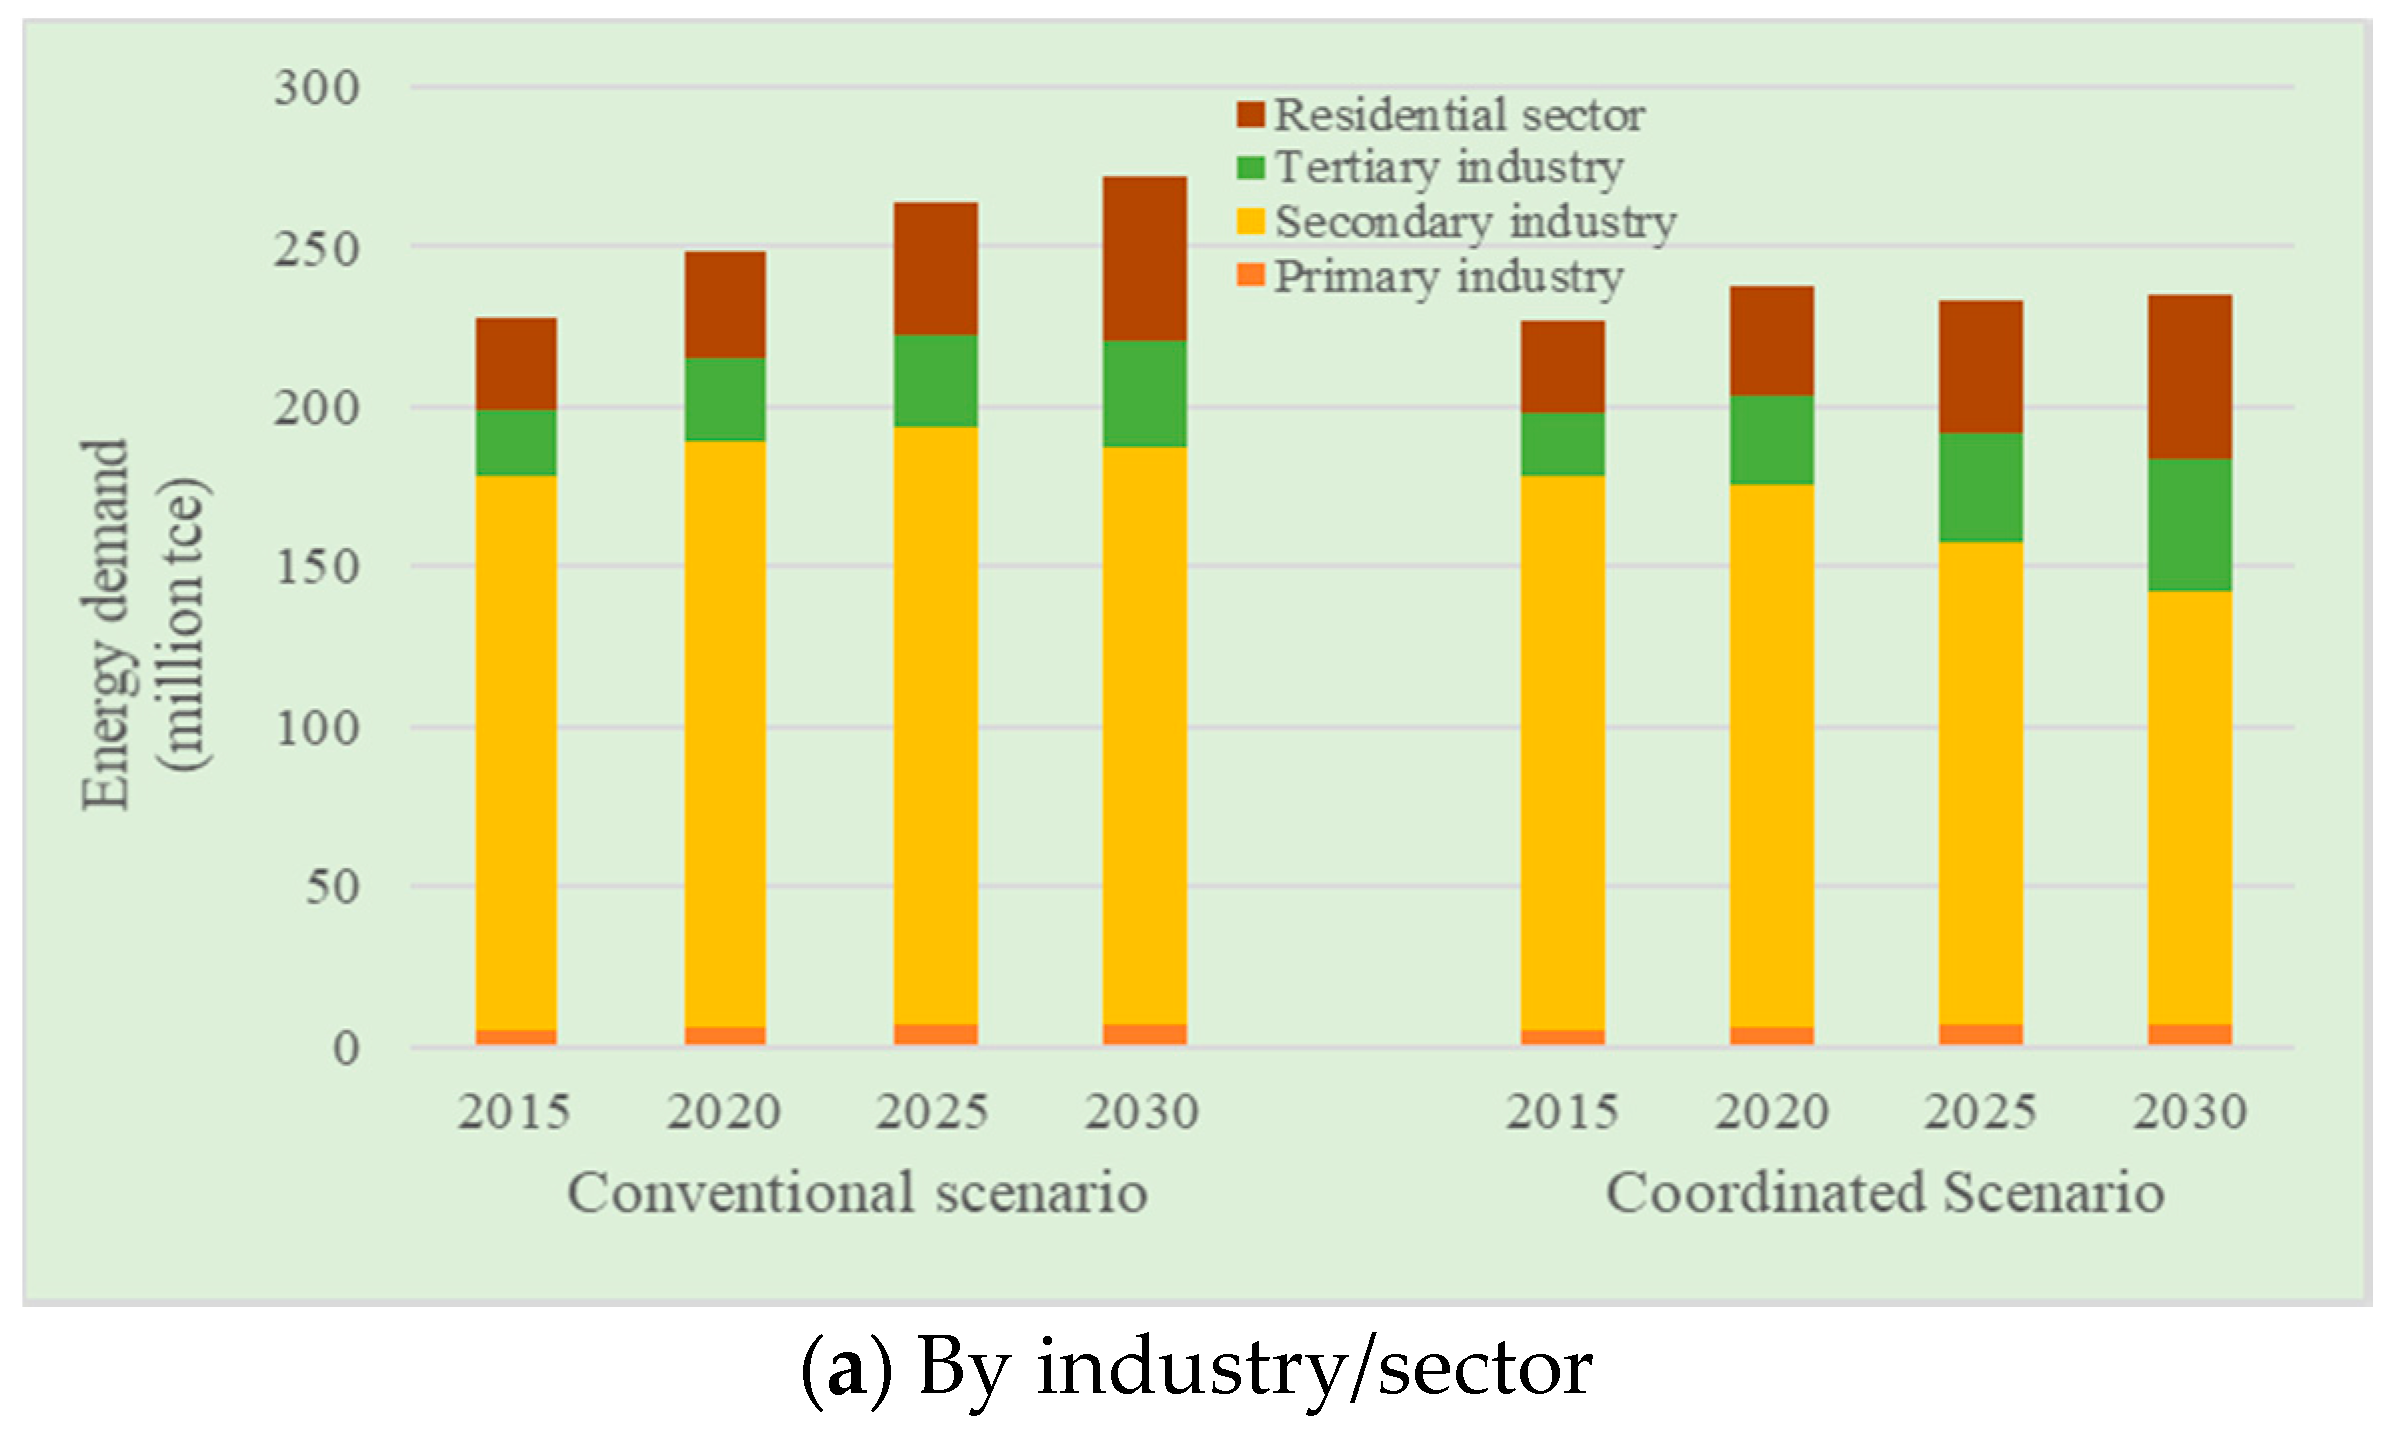
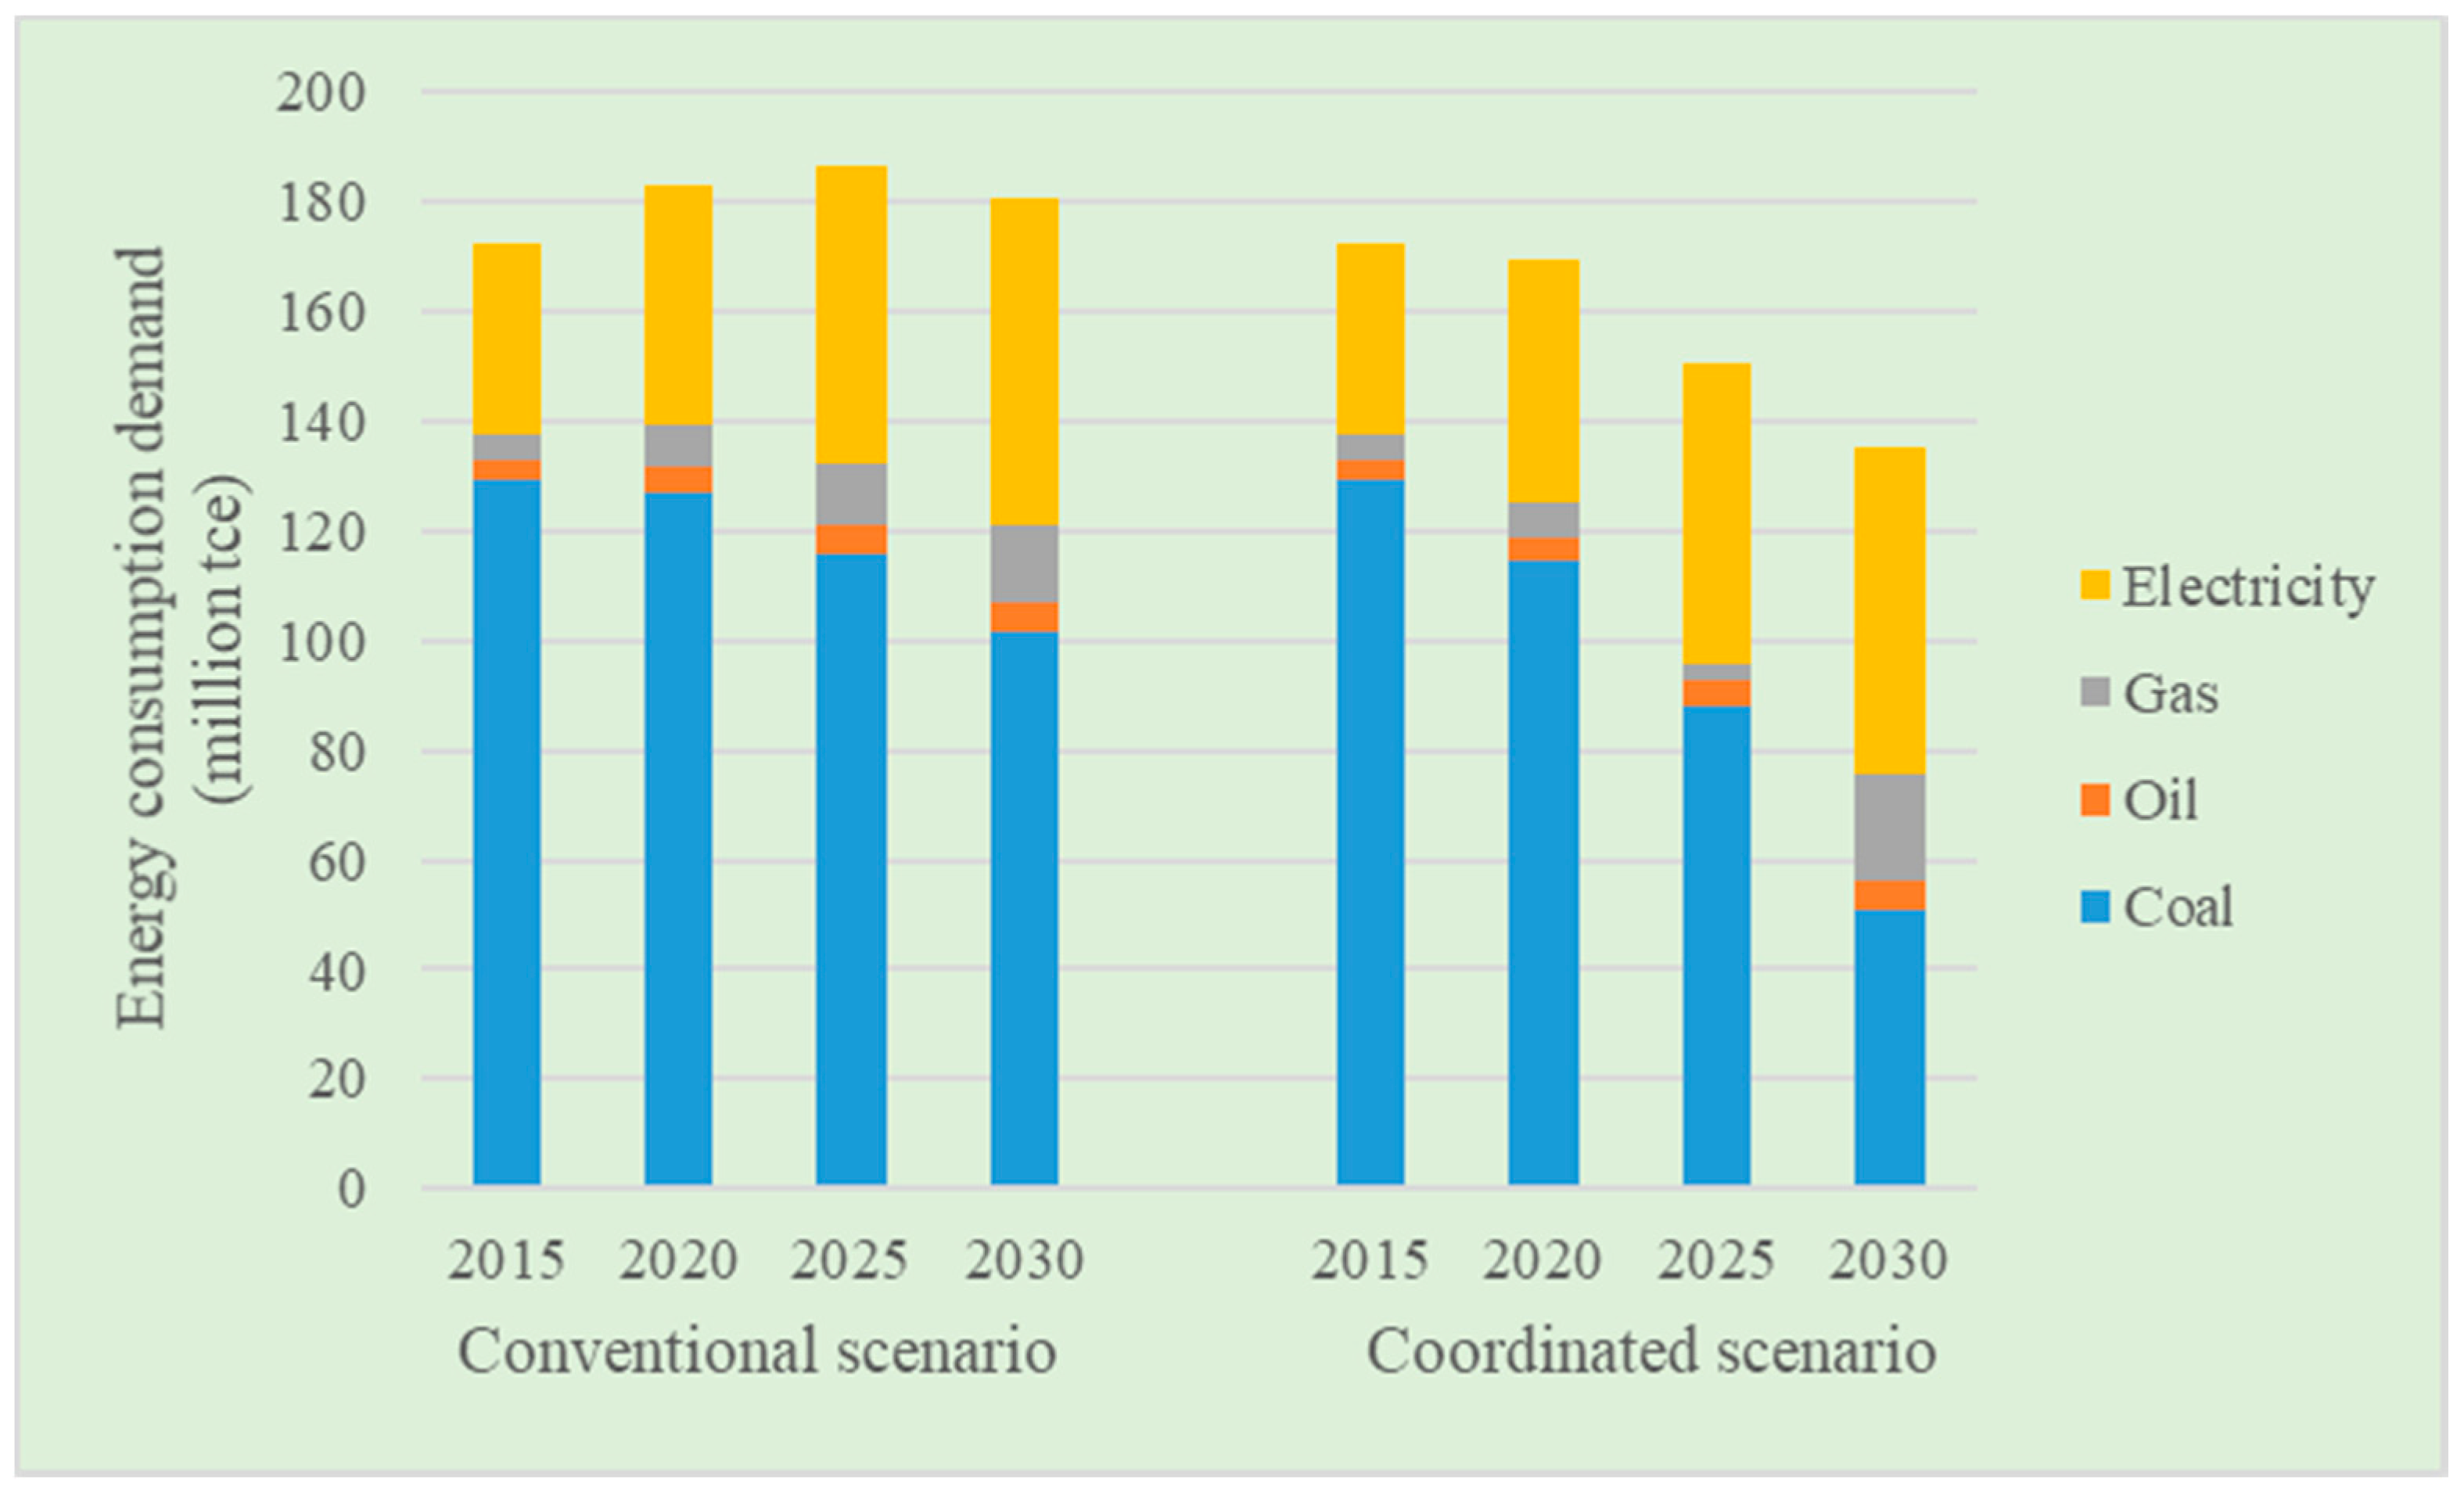
Figure 5 indicate end-use energy consumption by industry/sector and fuel type in the conventional and coordinated scenarios.
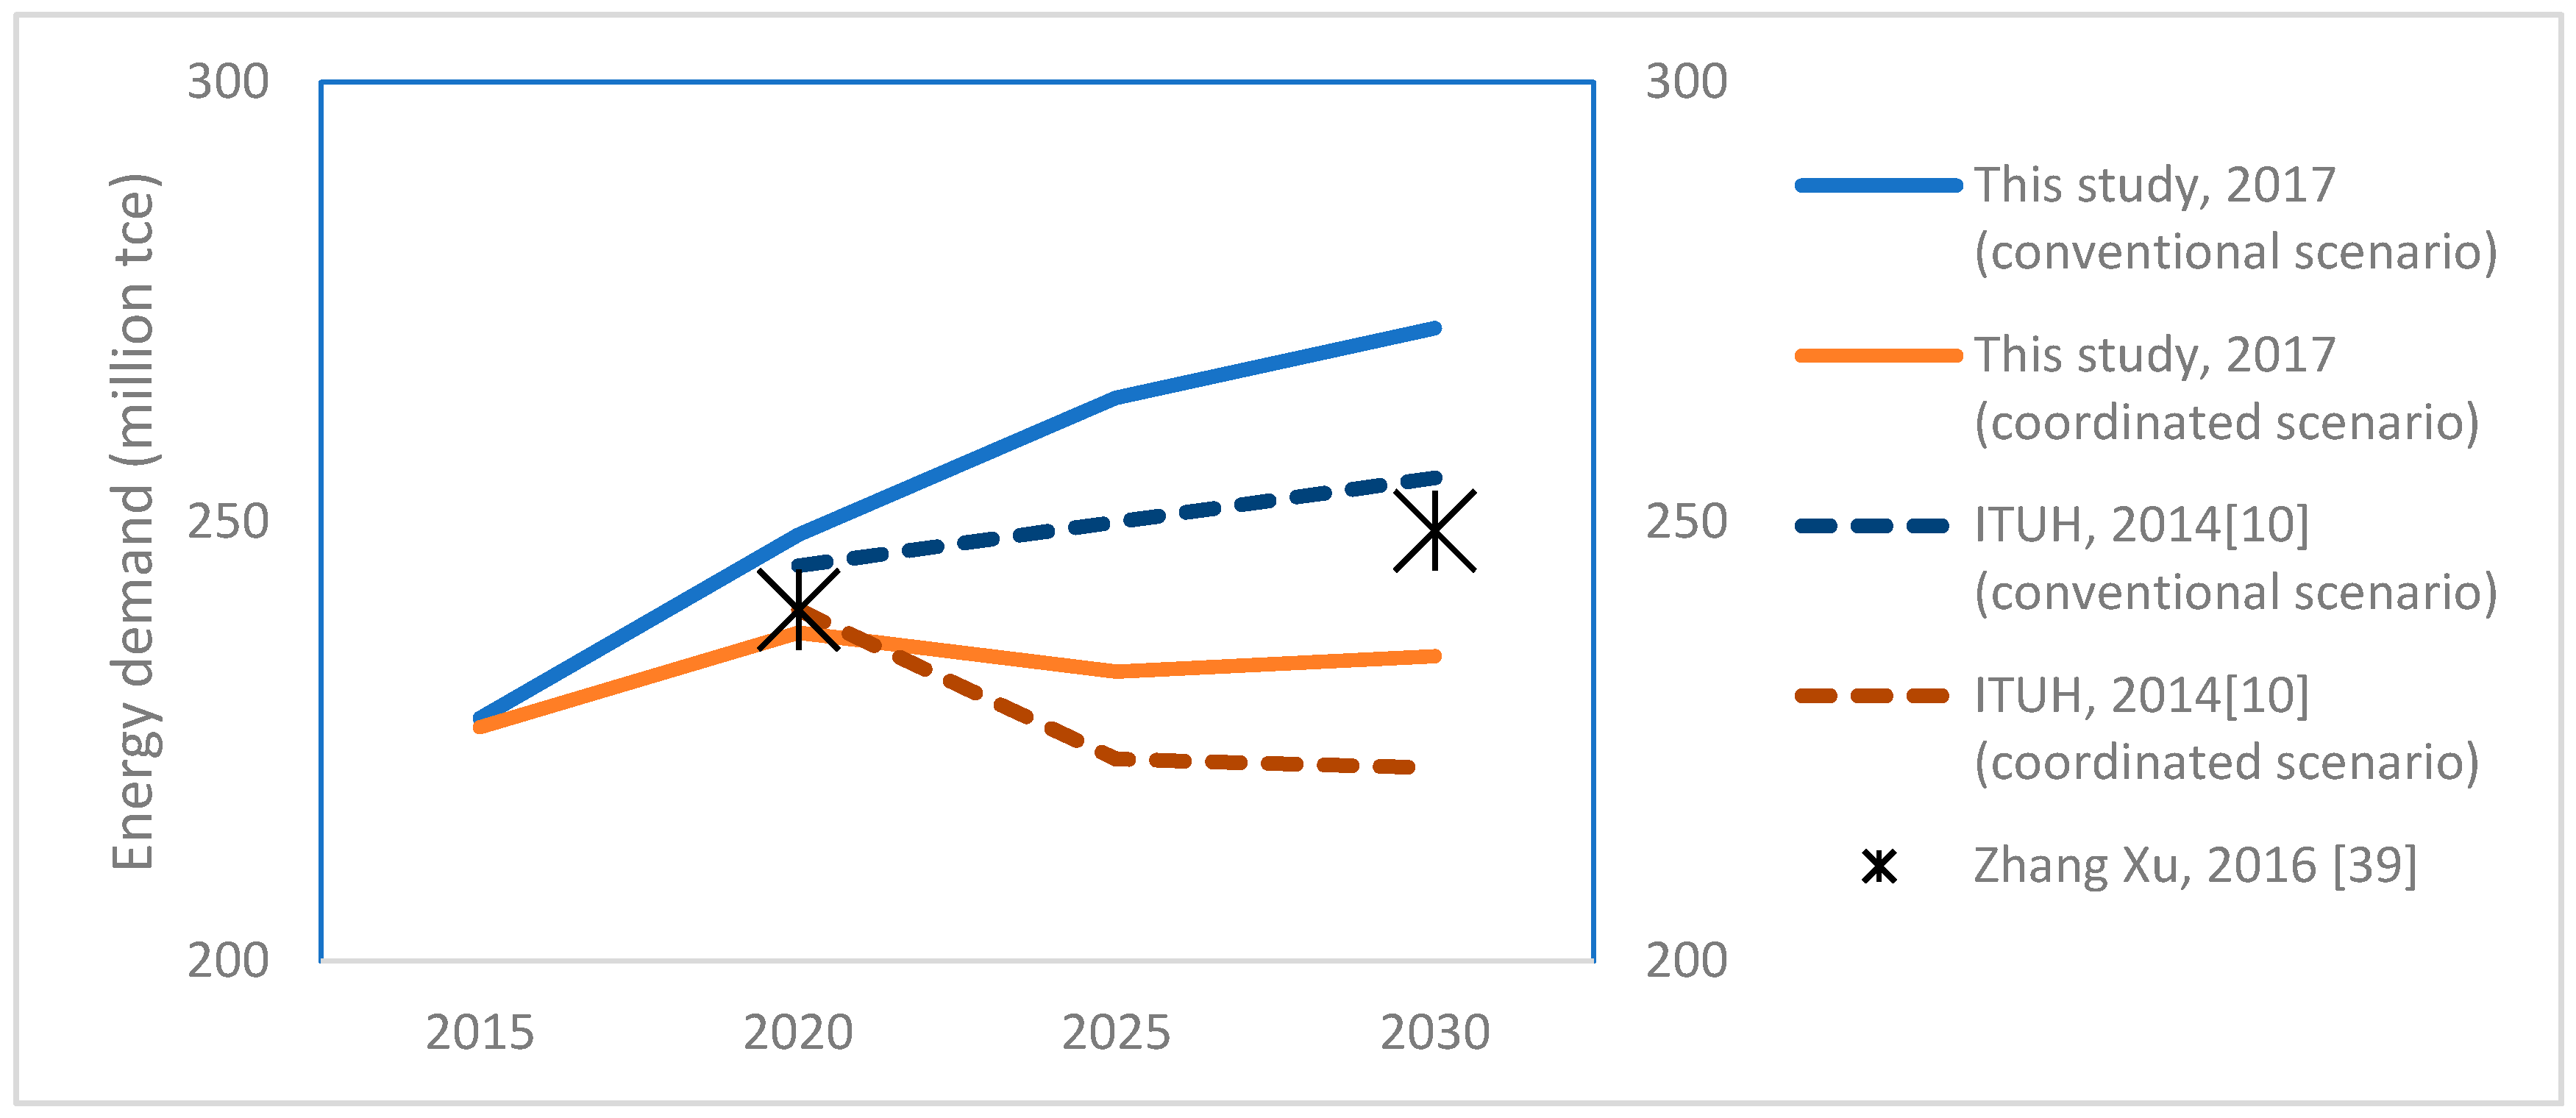
In the conventional scenario, the total end-use energy consumption in Hebei will increase from 228 million tce in 2015 to 272 million tce in 2030, and the growth ratio will be 19%. The ratio of energy consumption of secondary industry will drop from 76% to around 66% in 2030. Coal will be gradually replaced by gas and electricity. Therefore, its proportion among the total energy consumption will decrease from approximately 65% in 2015 to 45% in 2030.
In the coordinated scenario, the total energy consumption in Hebei in 2030 can be 235 million tce (about 37 million tce less than that in the conventional scenario). Energy structure can be sufficiently optimised, since the proportion of secondary industry sector’s energy consumption among the total energy consumption can drop to below 60%, and the proportion of coal among the total energy consumption can decrease to 32% in 2030, which are much better than the results in the conventional scenario.
Coal utilisation of end-use energy consumption in the coordinated scenario is 40% below that in the conventional scenario, while natural gas utilisation in the coordinated scenario is 23% more than that in the conventional scenario, resulting from gradually incremental utilisation of natural gas substituting the direct use of coal.
Oil utilisation of end-use energy consumption in the coordinated scenario is 12% more than that in the conventional scenario, while electricity utilisation in the coordinated scenario is 2% more than that in the conventional scenario, resulting from growth of the tertiary industry.
(2) Primary industry
It can be estimated that future energy demand in primary industry of Hebei will remain stable, from about 6 million tce in 2015 to 7 million tce in 2030.
(3) Secondary industry
In the conventional scenario, energy consumption of the secondary industry in Hebei will gradually increase, from 172 million tce in 2015 to 183 million tce in 2020, and then 181 million tce in 2030 as 
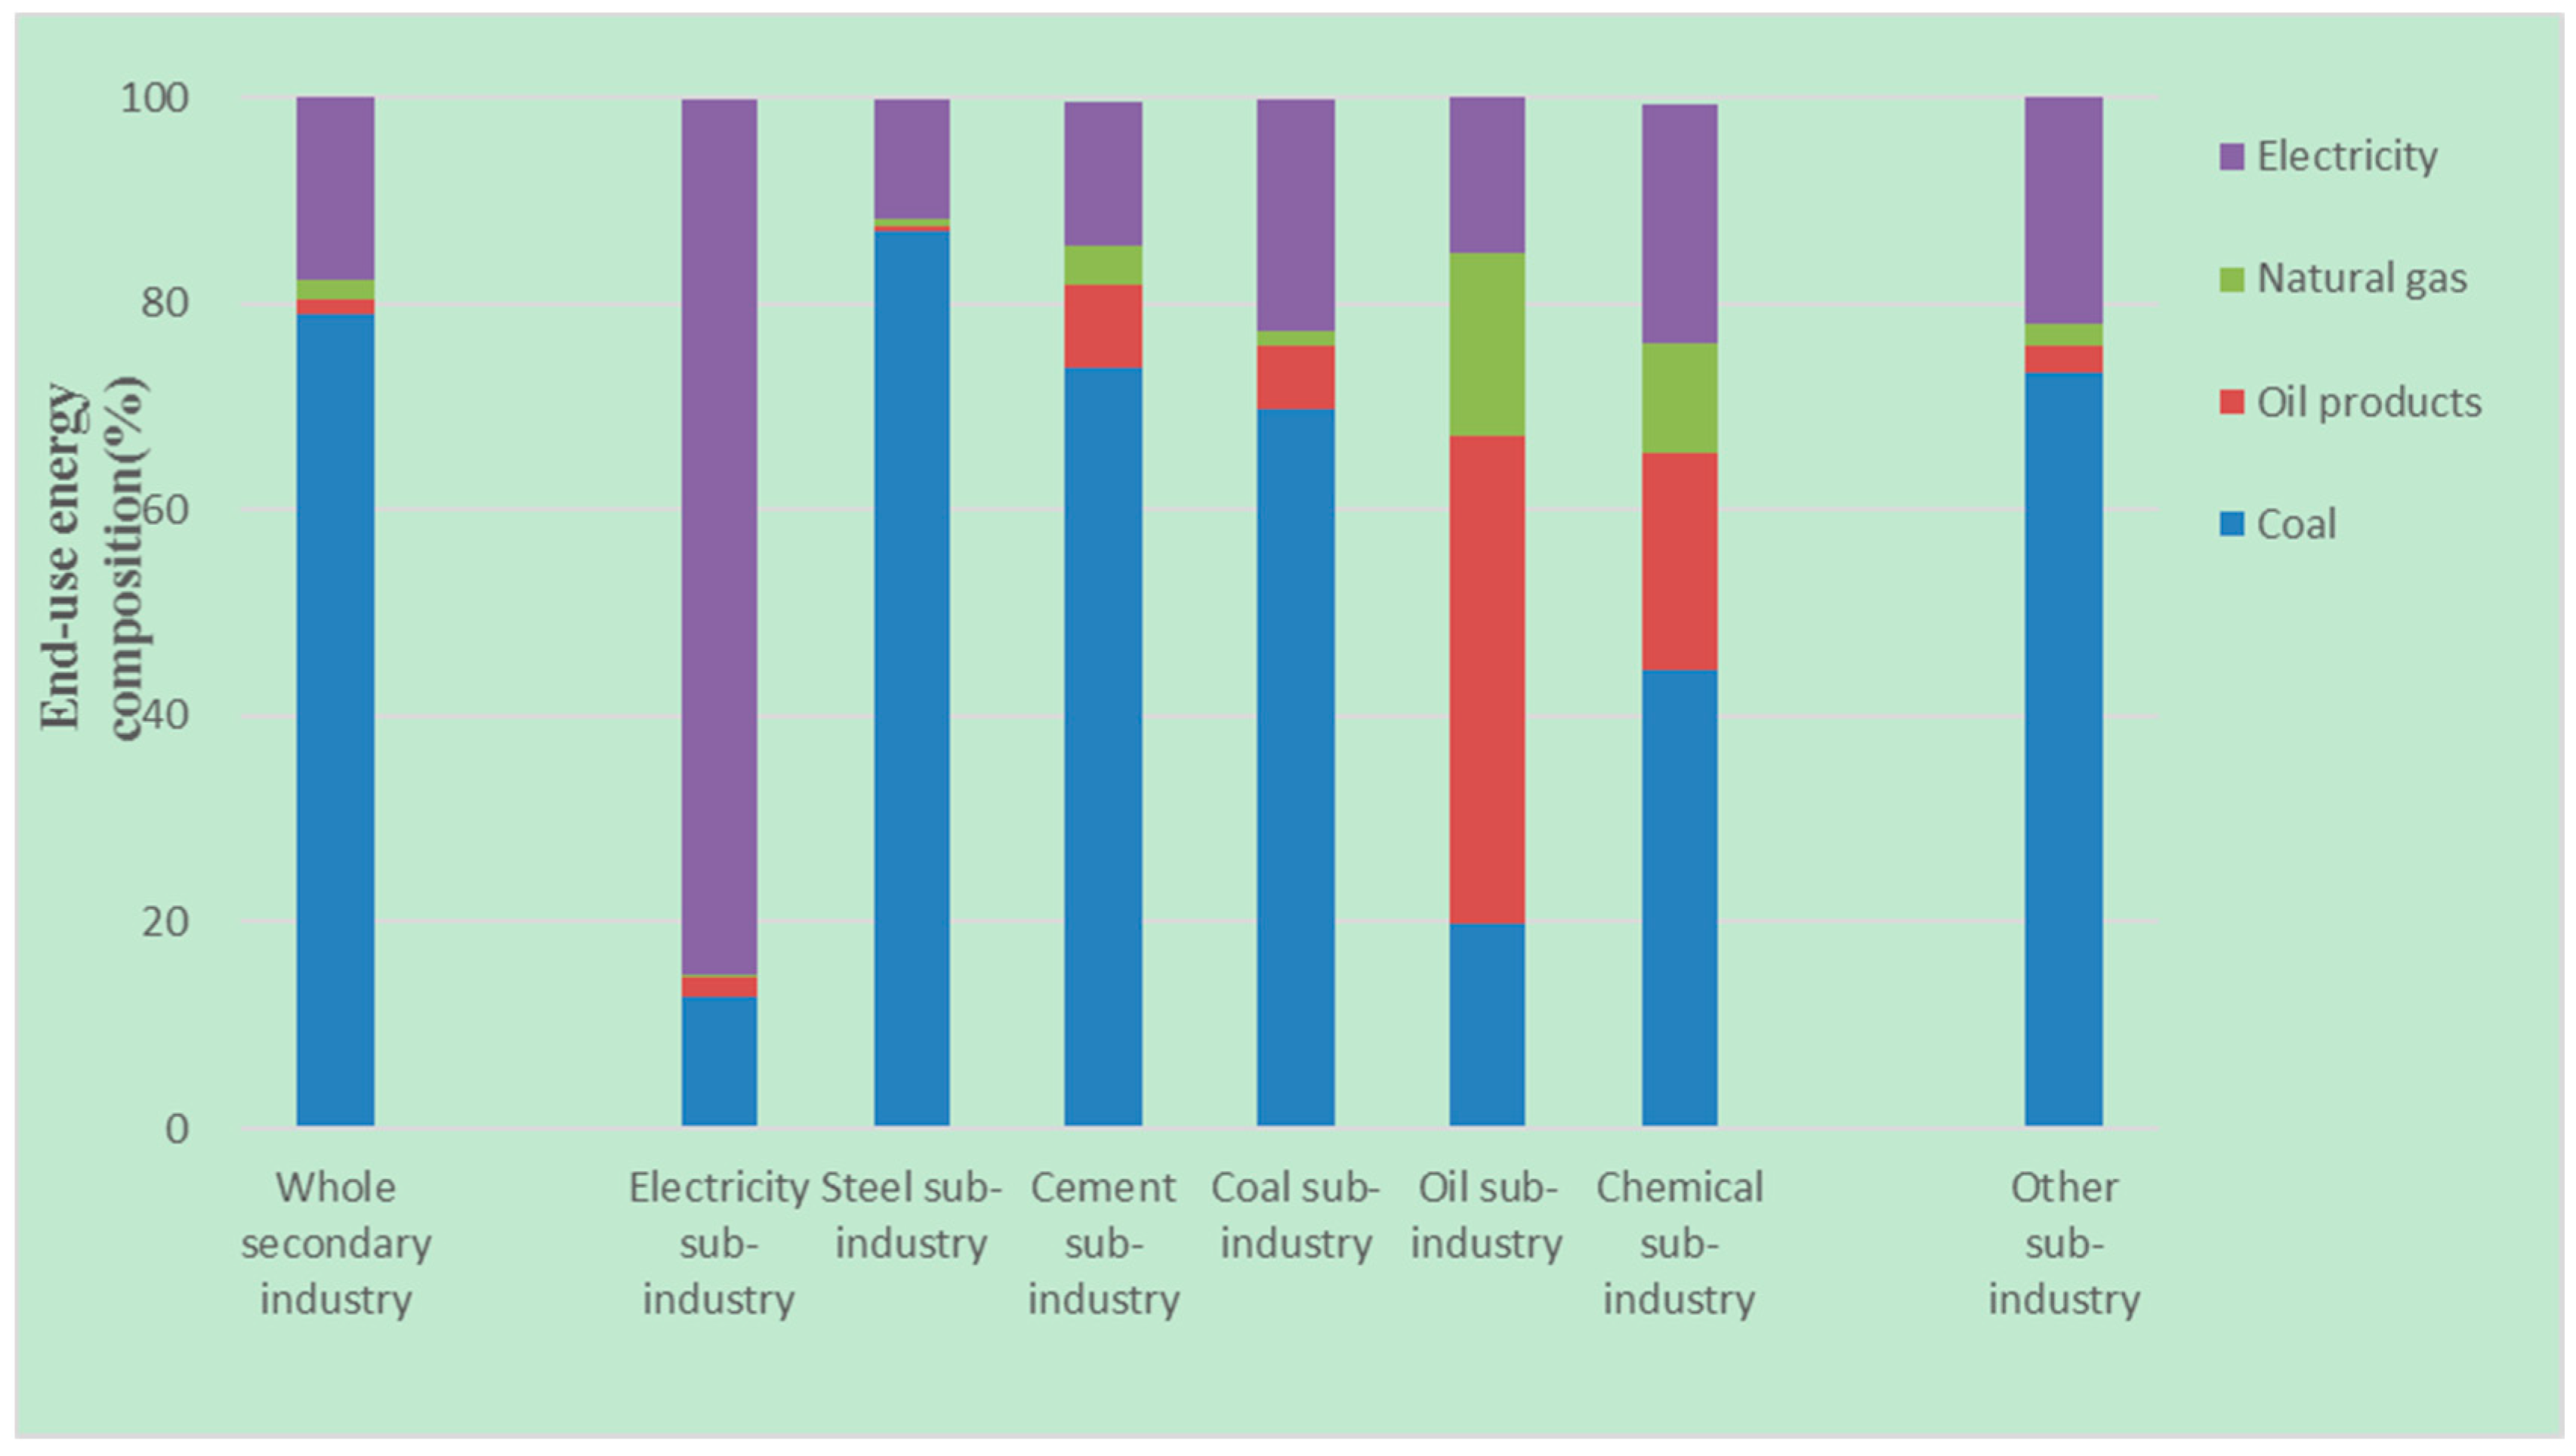
Figure 6 shows. Energy structure of the secondary industry in Hebei is based on coal and electricity, at the proportions of 75% and 20%, respectively, in 2015; the proportions of oil and gas were lower, at 2% and 3%, respectively. Owing to the increase in non-energy-intensive industry energy consumption, particularly the substantial increase in the proportions of oil and gas in non-energy-intensive sub-industries, the proportion of gas in the electricity sub-industry will increase markedly; the proportions of coal, electricity, oil, and gas in 2030 will be 56%, 33%, 3%, and 8%, respectively.
In the coordinated scenario, total energy consumption of the secondary industry sector will decrease, reaching 170 million tce in 2020 and 135 million tce in 2030. In 2030, proportions of coal, electricity, oil, and gas will be 38%, 44%, 4%, and 14%, respectively. In the coordinated scenario, the proportion of energy consumption will decrease by 39% for coal and increase by 24% for electricity; the increases for oil and gas will be 2% and 12%, respectively, in 2030 compared with 2015.
Energy consumption of energy-intensive industries accounted for 80% of total energy consumption of the secondary industry sector in 2015. In the conventional scenario, the proportion will drop to about 60% and about 50% in 2020 and 2030, respectively; in the coordinated scenario, to about 55% and 40% in 2020 and 2030, respectively.
(4) Tertiary industry
End-use energy demand of the tertiary industry in Hebei is estimated to grow from 21 million tce in 2015 to around 33–41 million tce in 2030; a growth rate of around 56–106%. This study shows that energy demand in tertiary industry will rapidly increase, and its proportion in total energy demand will increase from 9% in 2015 to around 12–18% in 2030.
(5) Residential sector
Future energy demand of Hebei residents in Hebei is estimated to grow from 29 million tce in 2015 to 51 million tce in 2030 with a growth rate of around 75%. This study shows that future energy consumption of Hebei residents will also increase rapidly, with increasing demand for electricity, oil and gas, among the different types of high-quality energy.

5.2. Results of Primary Energy Demand

Table A3 and Figure 7 indicate primary energy consumption by industry and fuel type in the conventional and coordinated scenarios. Primary energy consumption will increase from 336 million tce in 2015 to 471 million tce in 2030 in the conventional scenario. In the coordinated scenario, primary energy consumption will be 431 million tce in 2030. The growth ratio in both scenarios will be 40% and 28%, respectively. Primary energy consumption of the secondary industry will still dominate as the major contributor to the total primary energy consumption, and it will account for 86% and 84% of the total primary energy consumption in 2030 in the conventional scenario and coordinated scenario, respectively, while the proportion in 2015 was 87%.

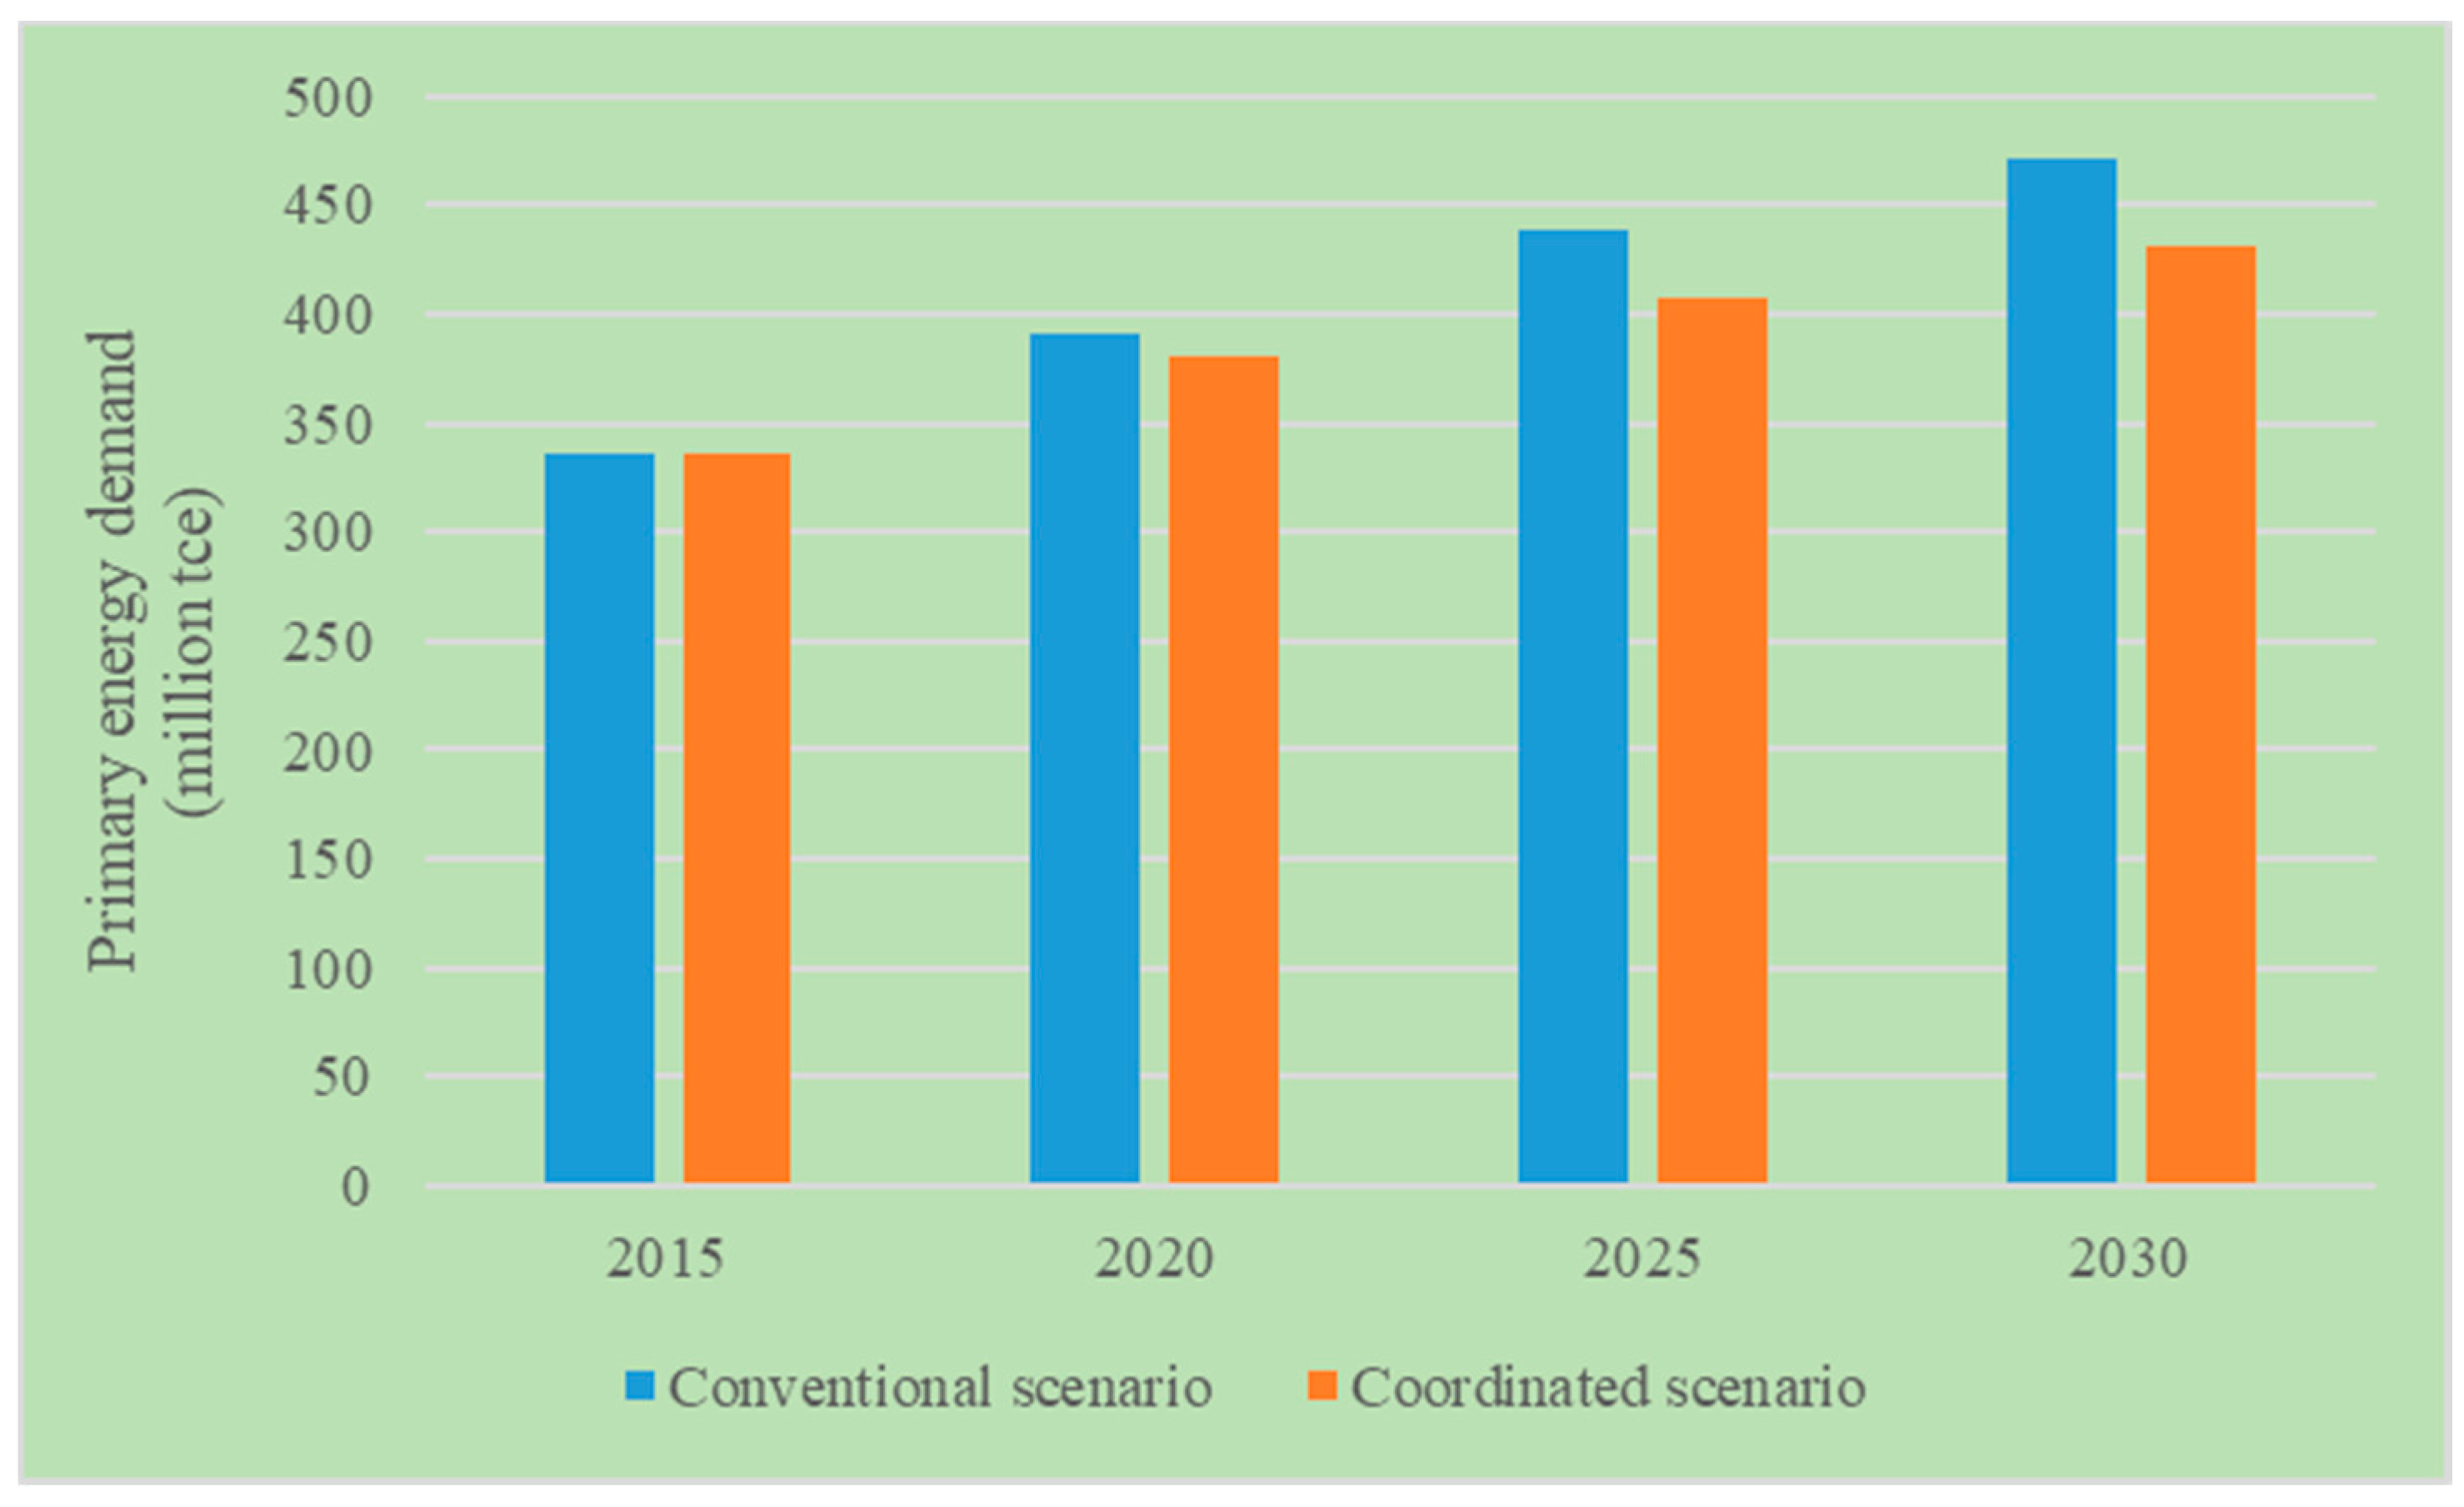
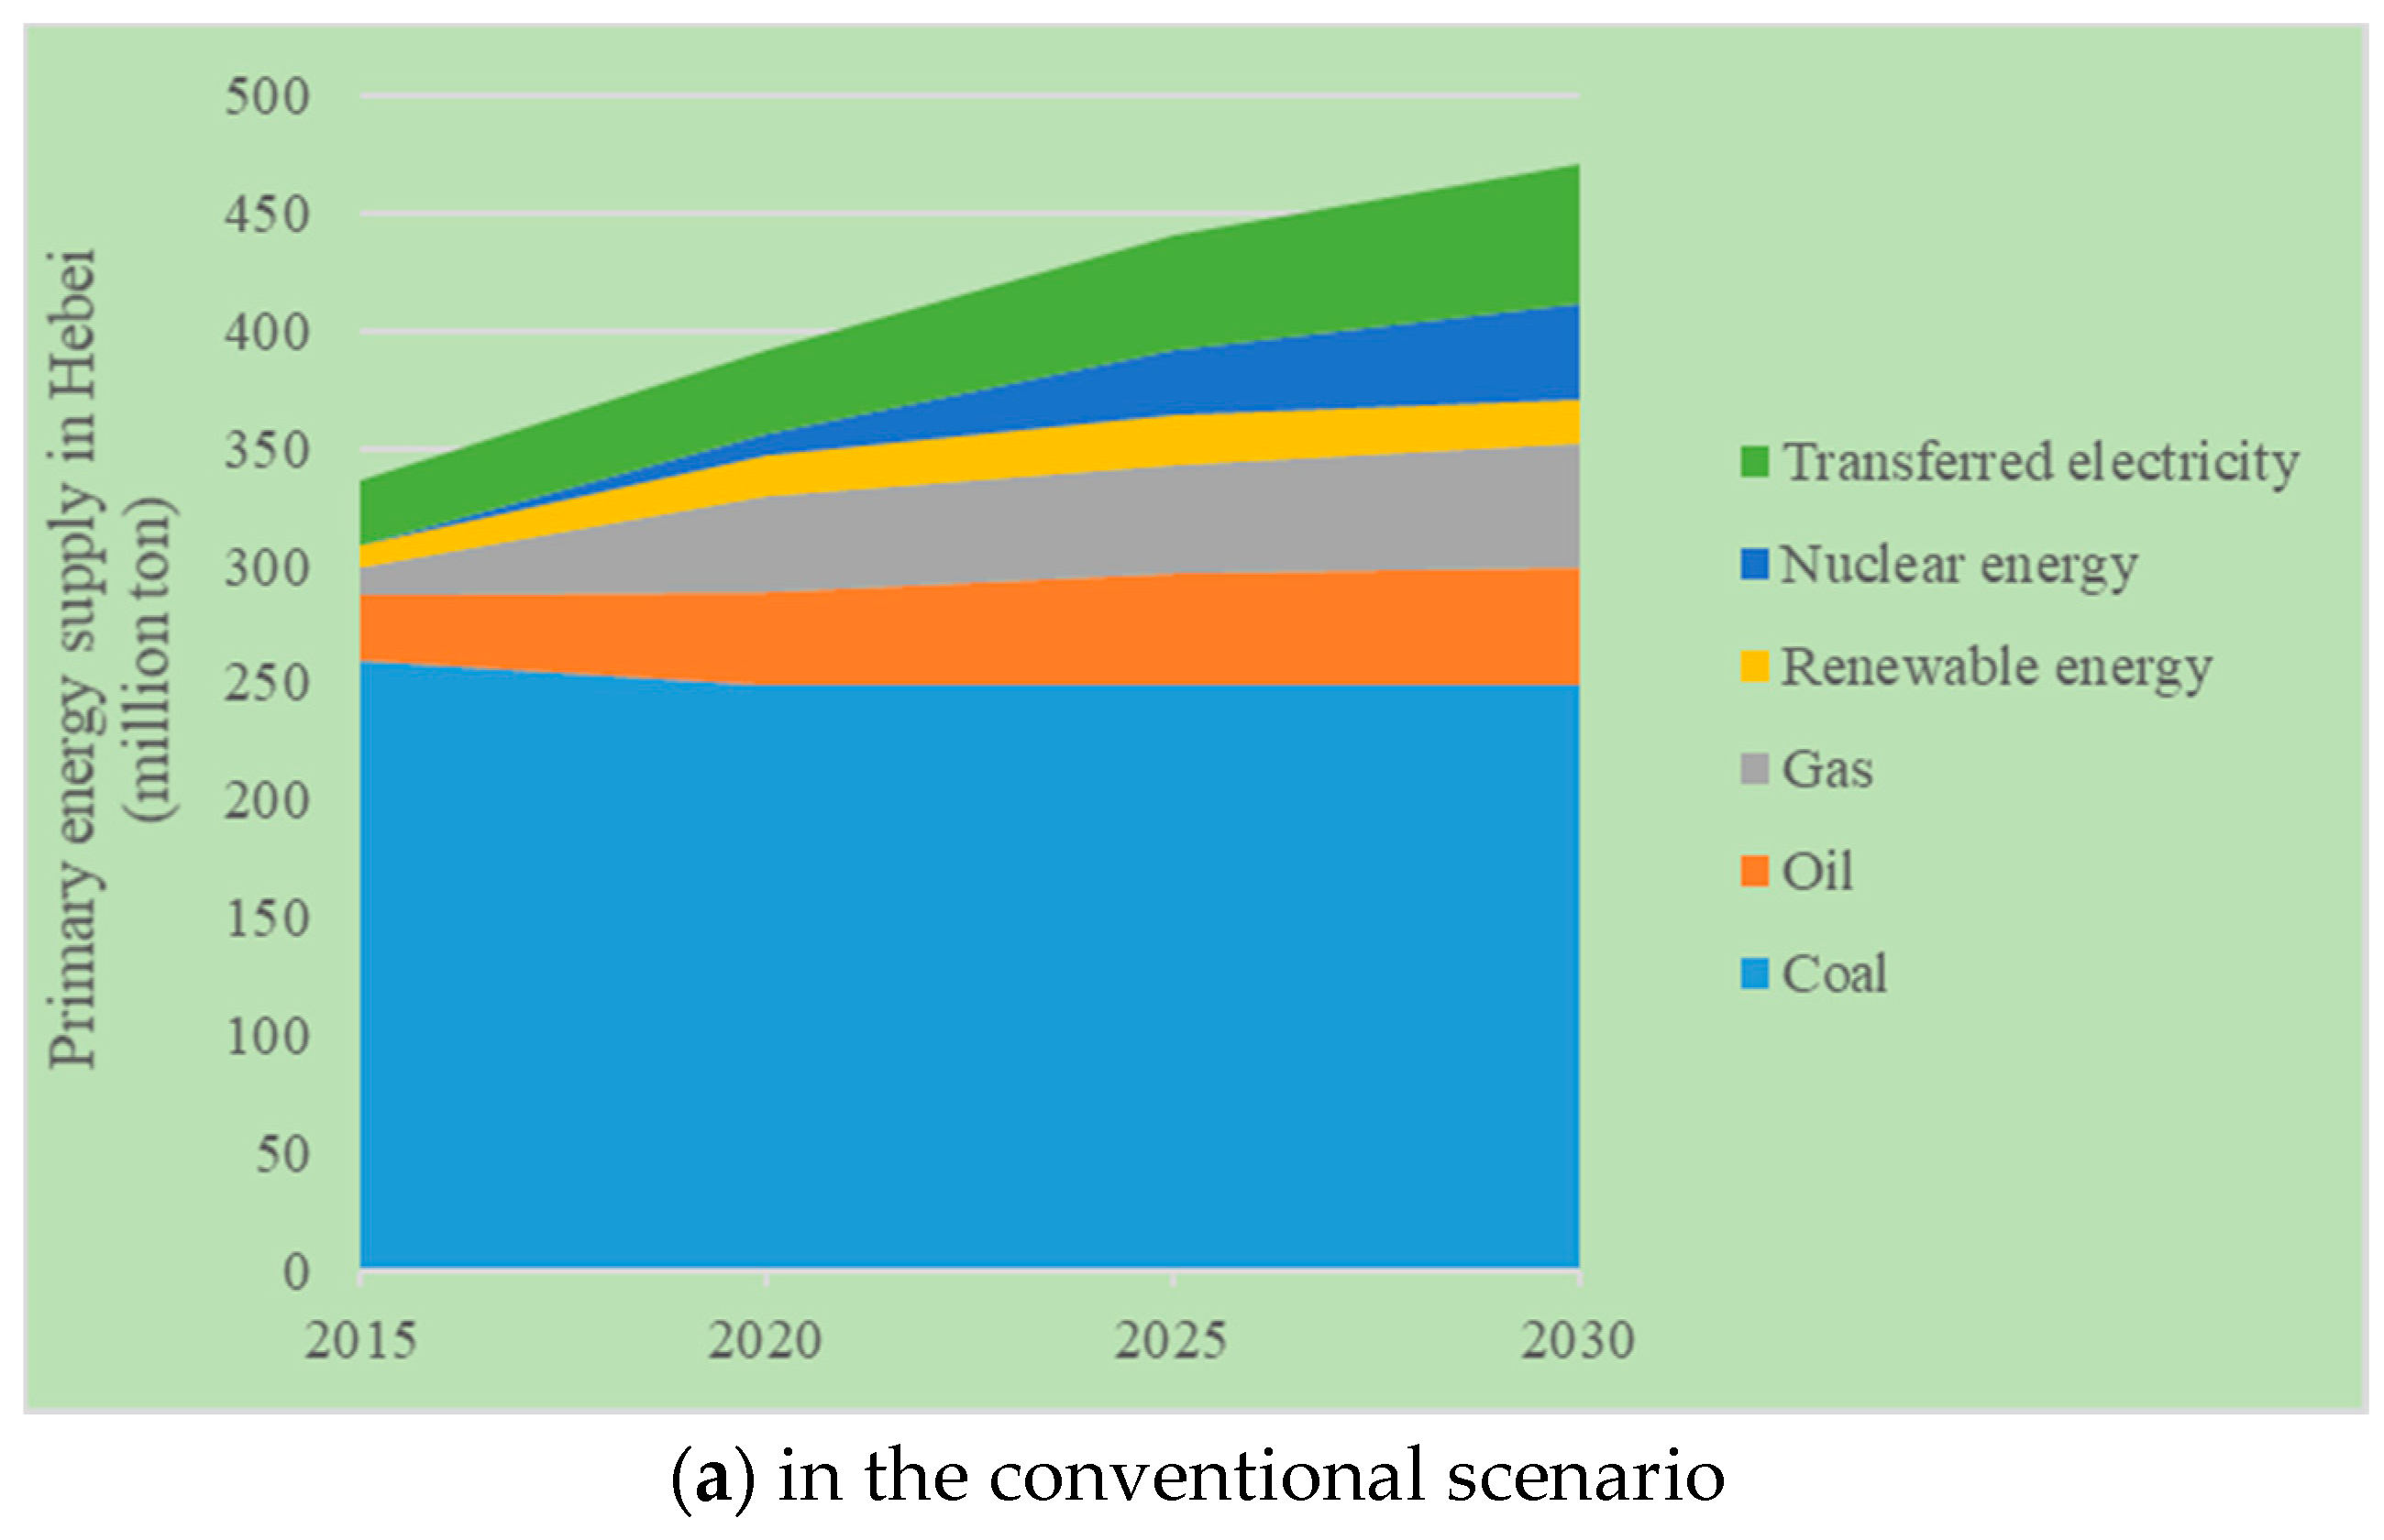
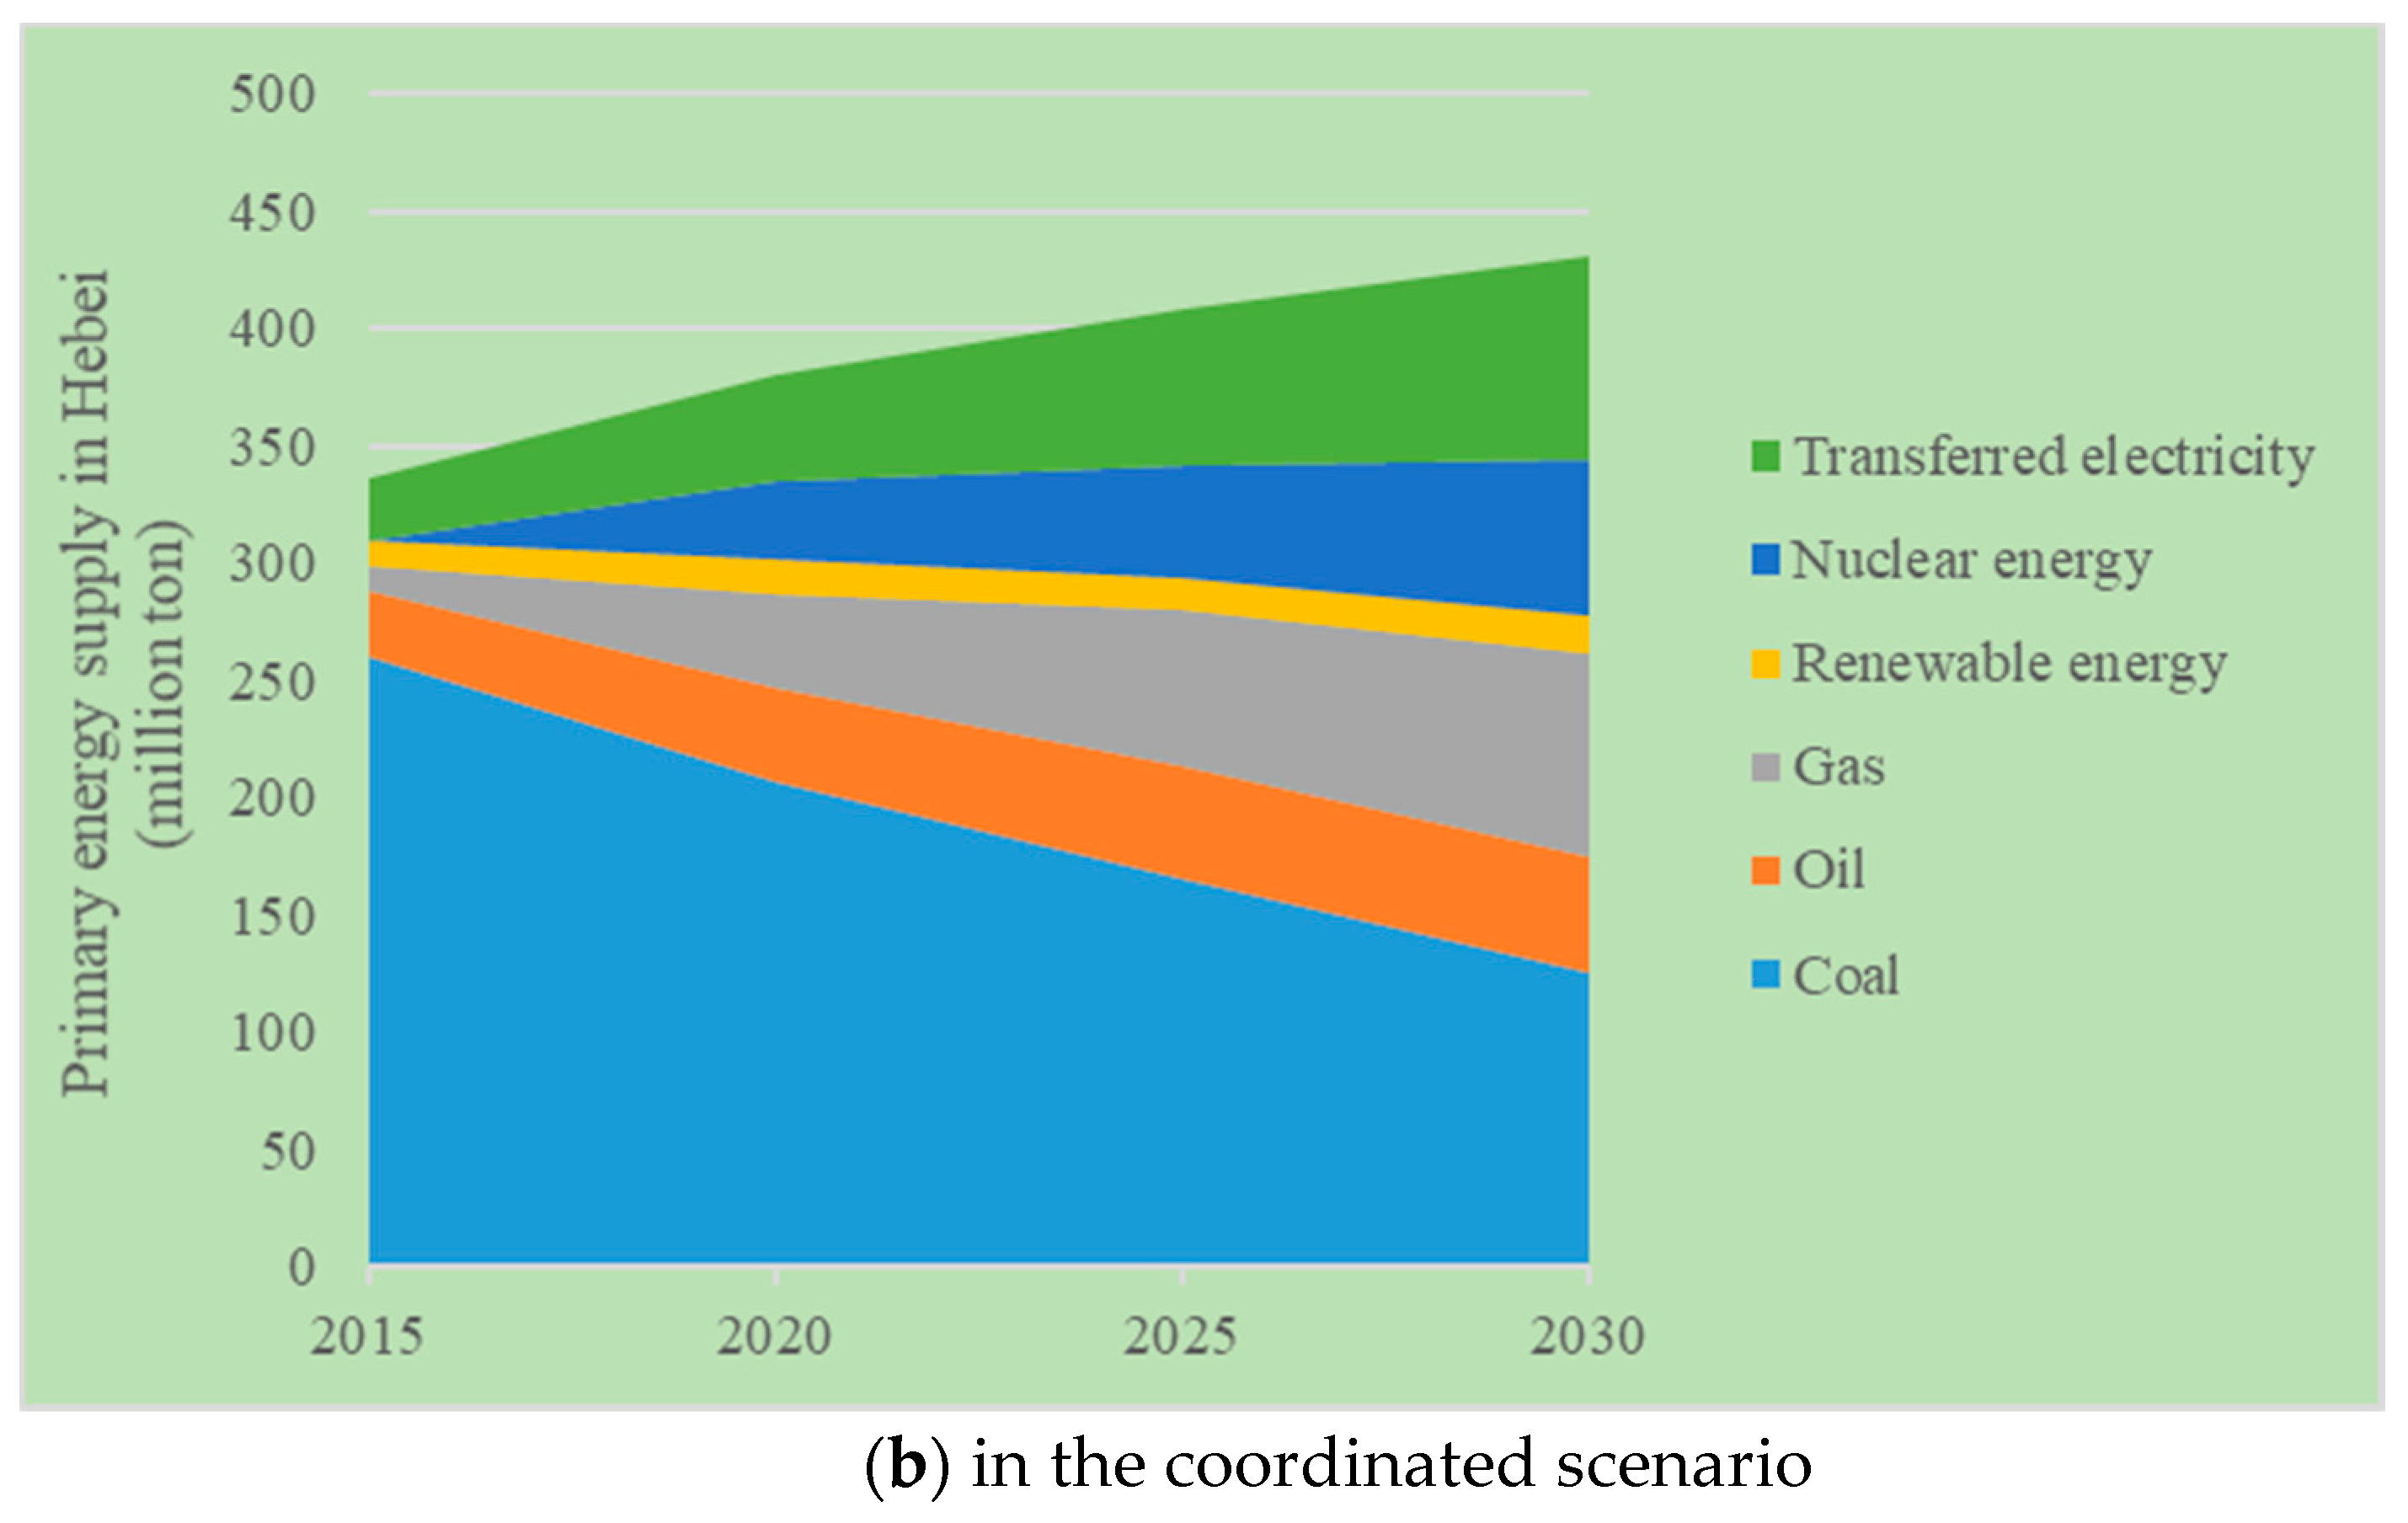
5.3. Results of Primary Energy Supply Structure in Future

Primary energy supply in future will be more diversified and cleaner in the defined two scenarios as shown in Table A3 and Figure 8.
Coal consumption used to be 314 million tons (equivalent to 260 million tce) in 2015, and will decrease to 150 million tons (equivalent to 125 million tce) in 2030 in the coordinated scenario, merely accounting for about 30% of total energy supply.
Utilisation amount of natural gas will increase from 8.5 billion cubic meters in 2015 to 40–65 billion cubic meters in 2030, and account for 10–20% of total energy consumption.
Utilisation amount of electricity transferred from other provinces will increase rapidly, and its proportion among total electricity consumption will increase from 28% in 2015 to over 30% in 2030. The quantity will increase from 90 trillion kWh in 2015 to 200–300 trillion kWh.
As for nuclear power, several nuclear plants will be put into production from 2020, and the proportion of nuclear power among total electricity supply will be 14% and 28% in 2020 and 2030, respectively.
Energy supply from renewable energy will develop smoothly, increasing from 10 million tce in 2015 to about 20 million tce in 2030. As Table A4 indicates, in the conventional scenario, non-fossil energy supply ratios in Hebei are 7% and 13% in 2020 and 2030, respectively. In contrast with the conventional scenario, the non-fossil energy supply ratios in the coordinated scenario fulfil the goal set by Chinese government and reach the average level in the country.

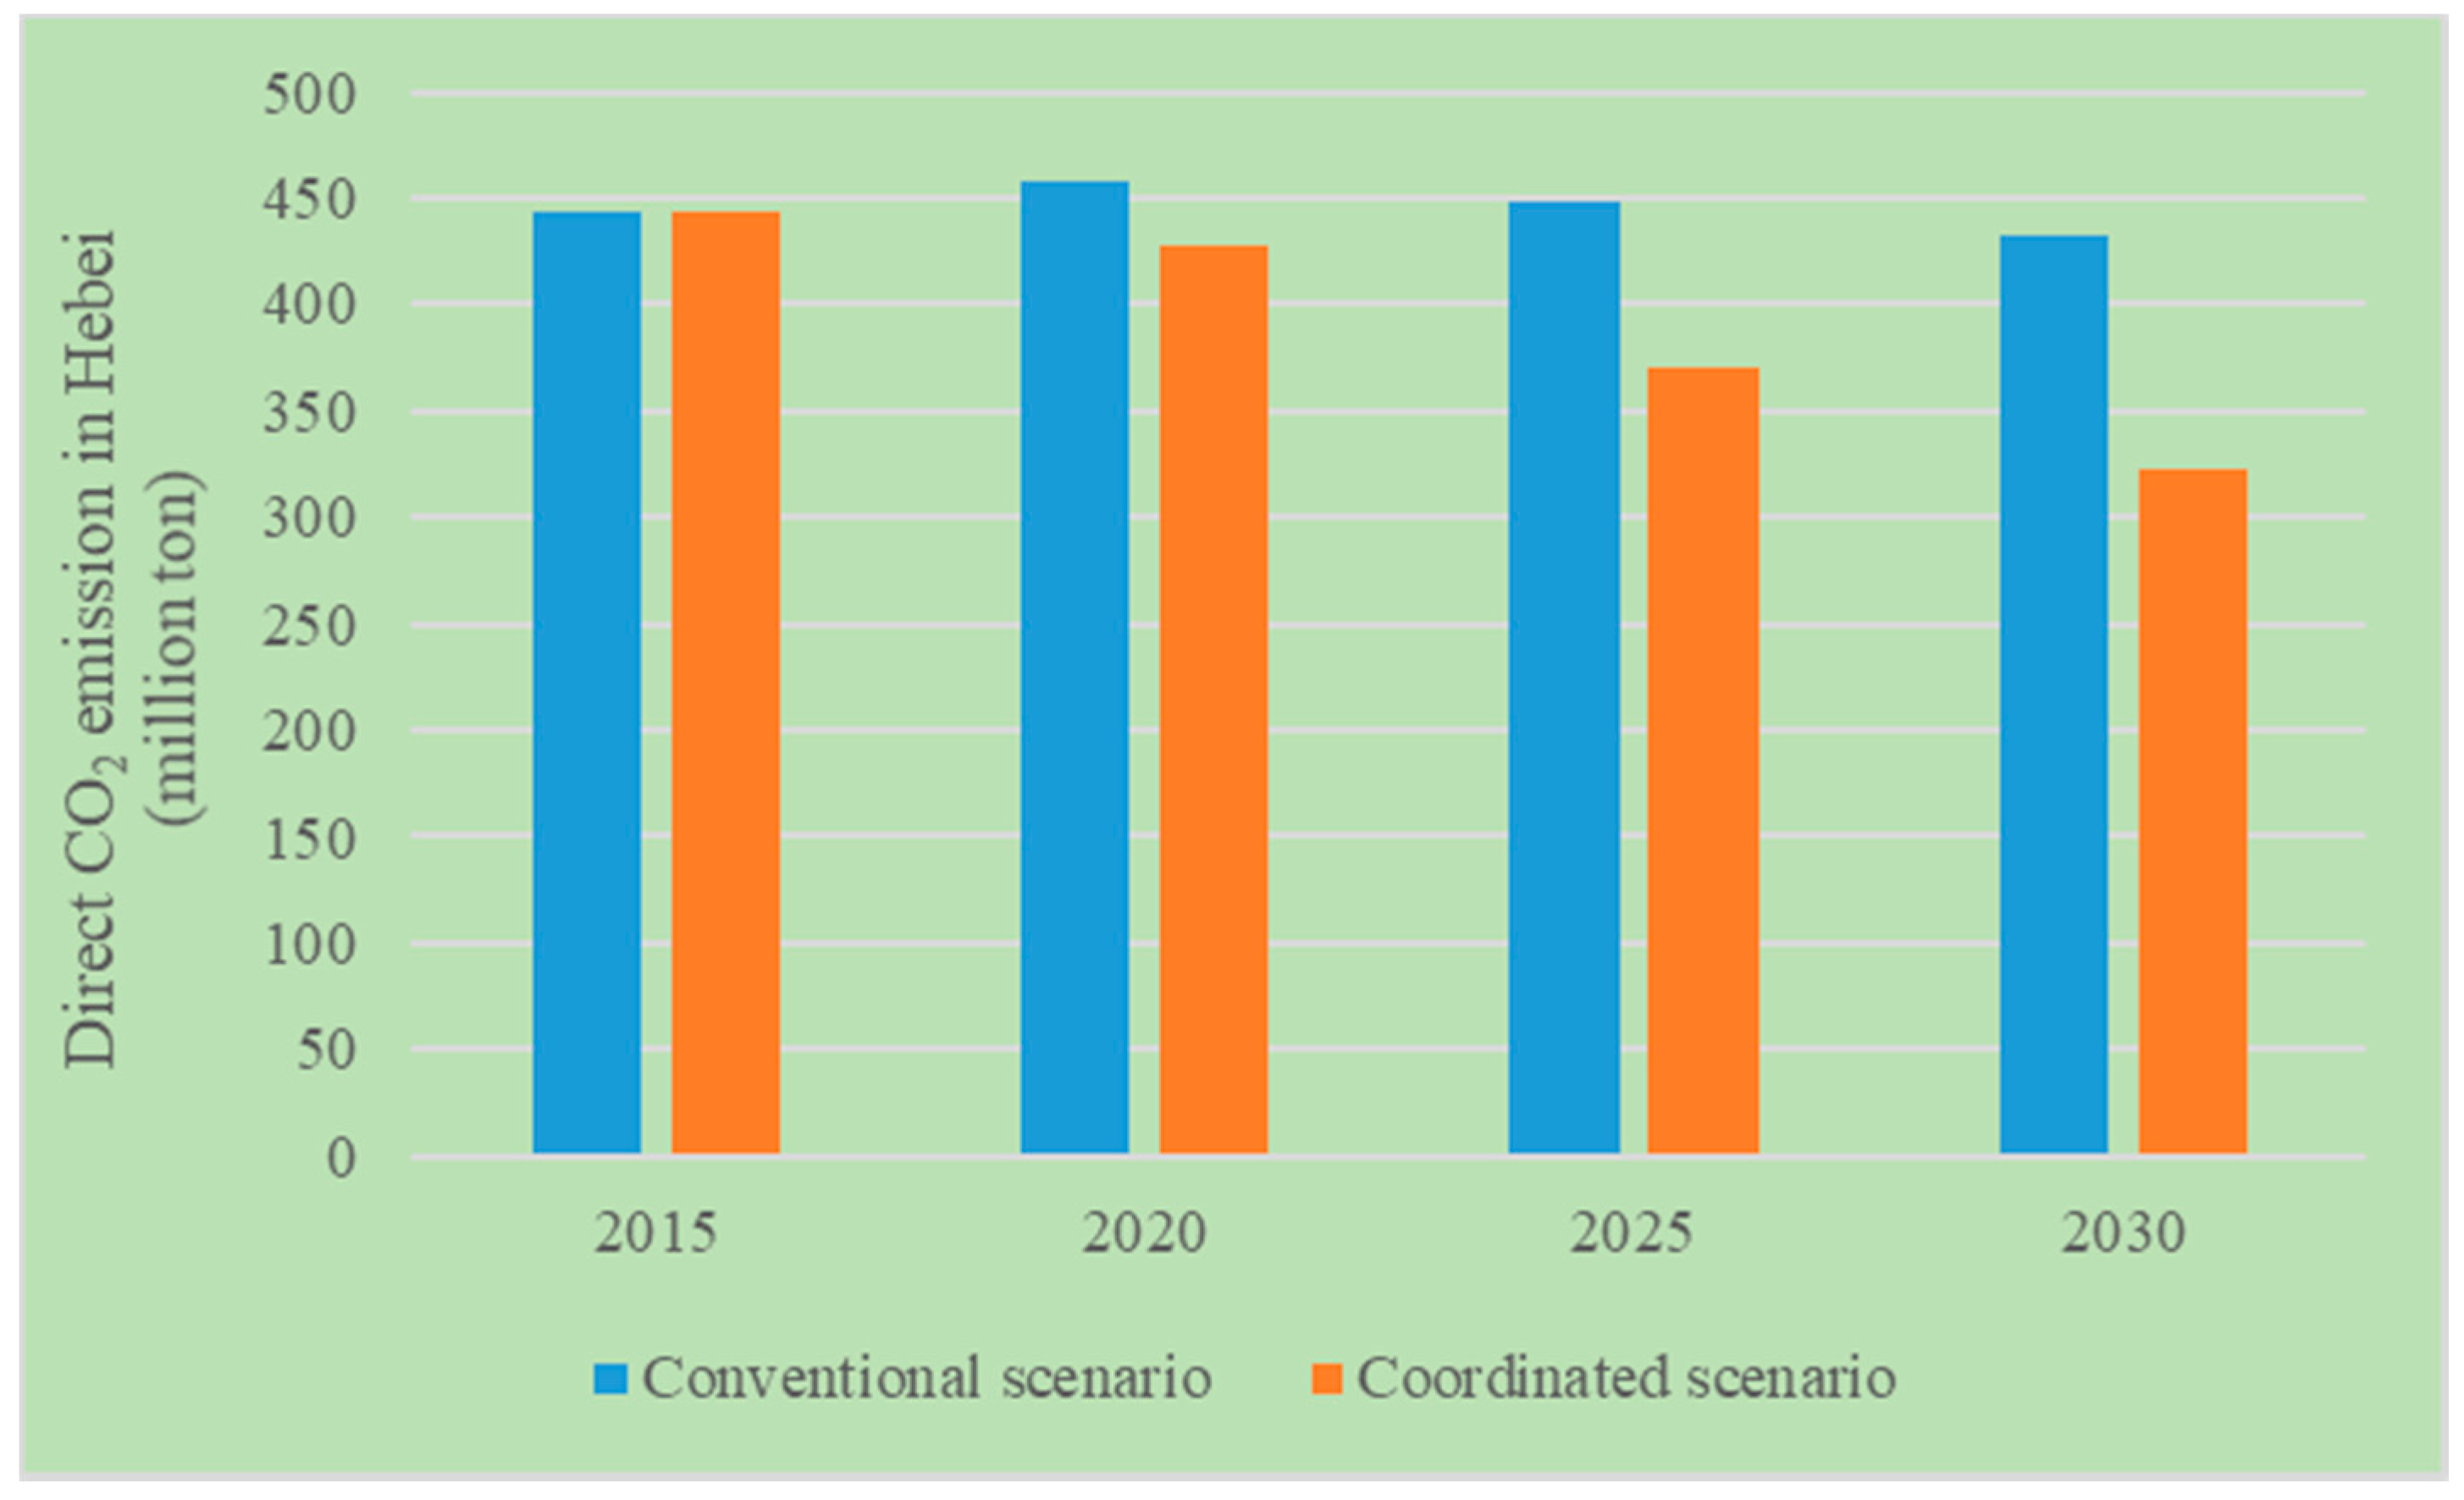
5.4. Results of CO2 Emission

(1) Direct CO2 emission
As Figure 9 indicates, in the conventional scenario, direct CO2 emission will increase slightly from 444 million tons in 2015 to 456 million tons in 2020, and then peak, decreasing to 432 million tons in 2030. In the coordinated scenario, direct CO2 emission will constantly decrease from 444 million tons to 323 million tons in 2030, the rate of descent reaching 27%.
(2) Full-chain CO2 emission
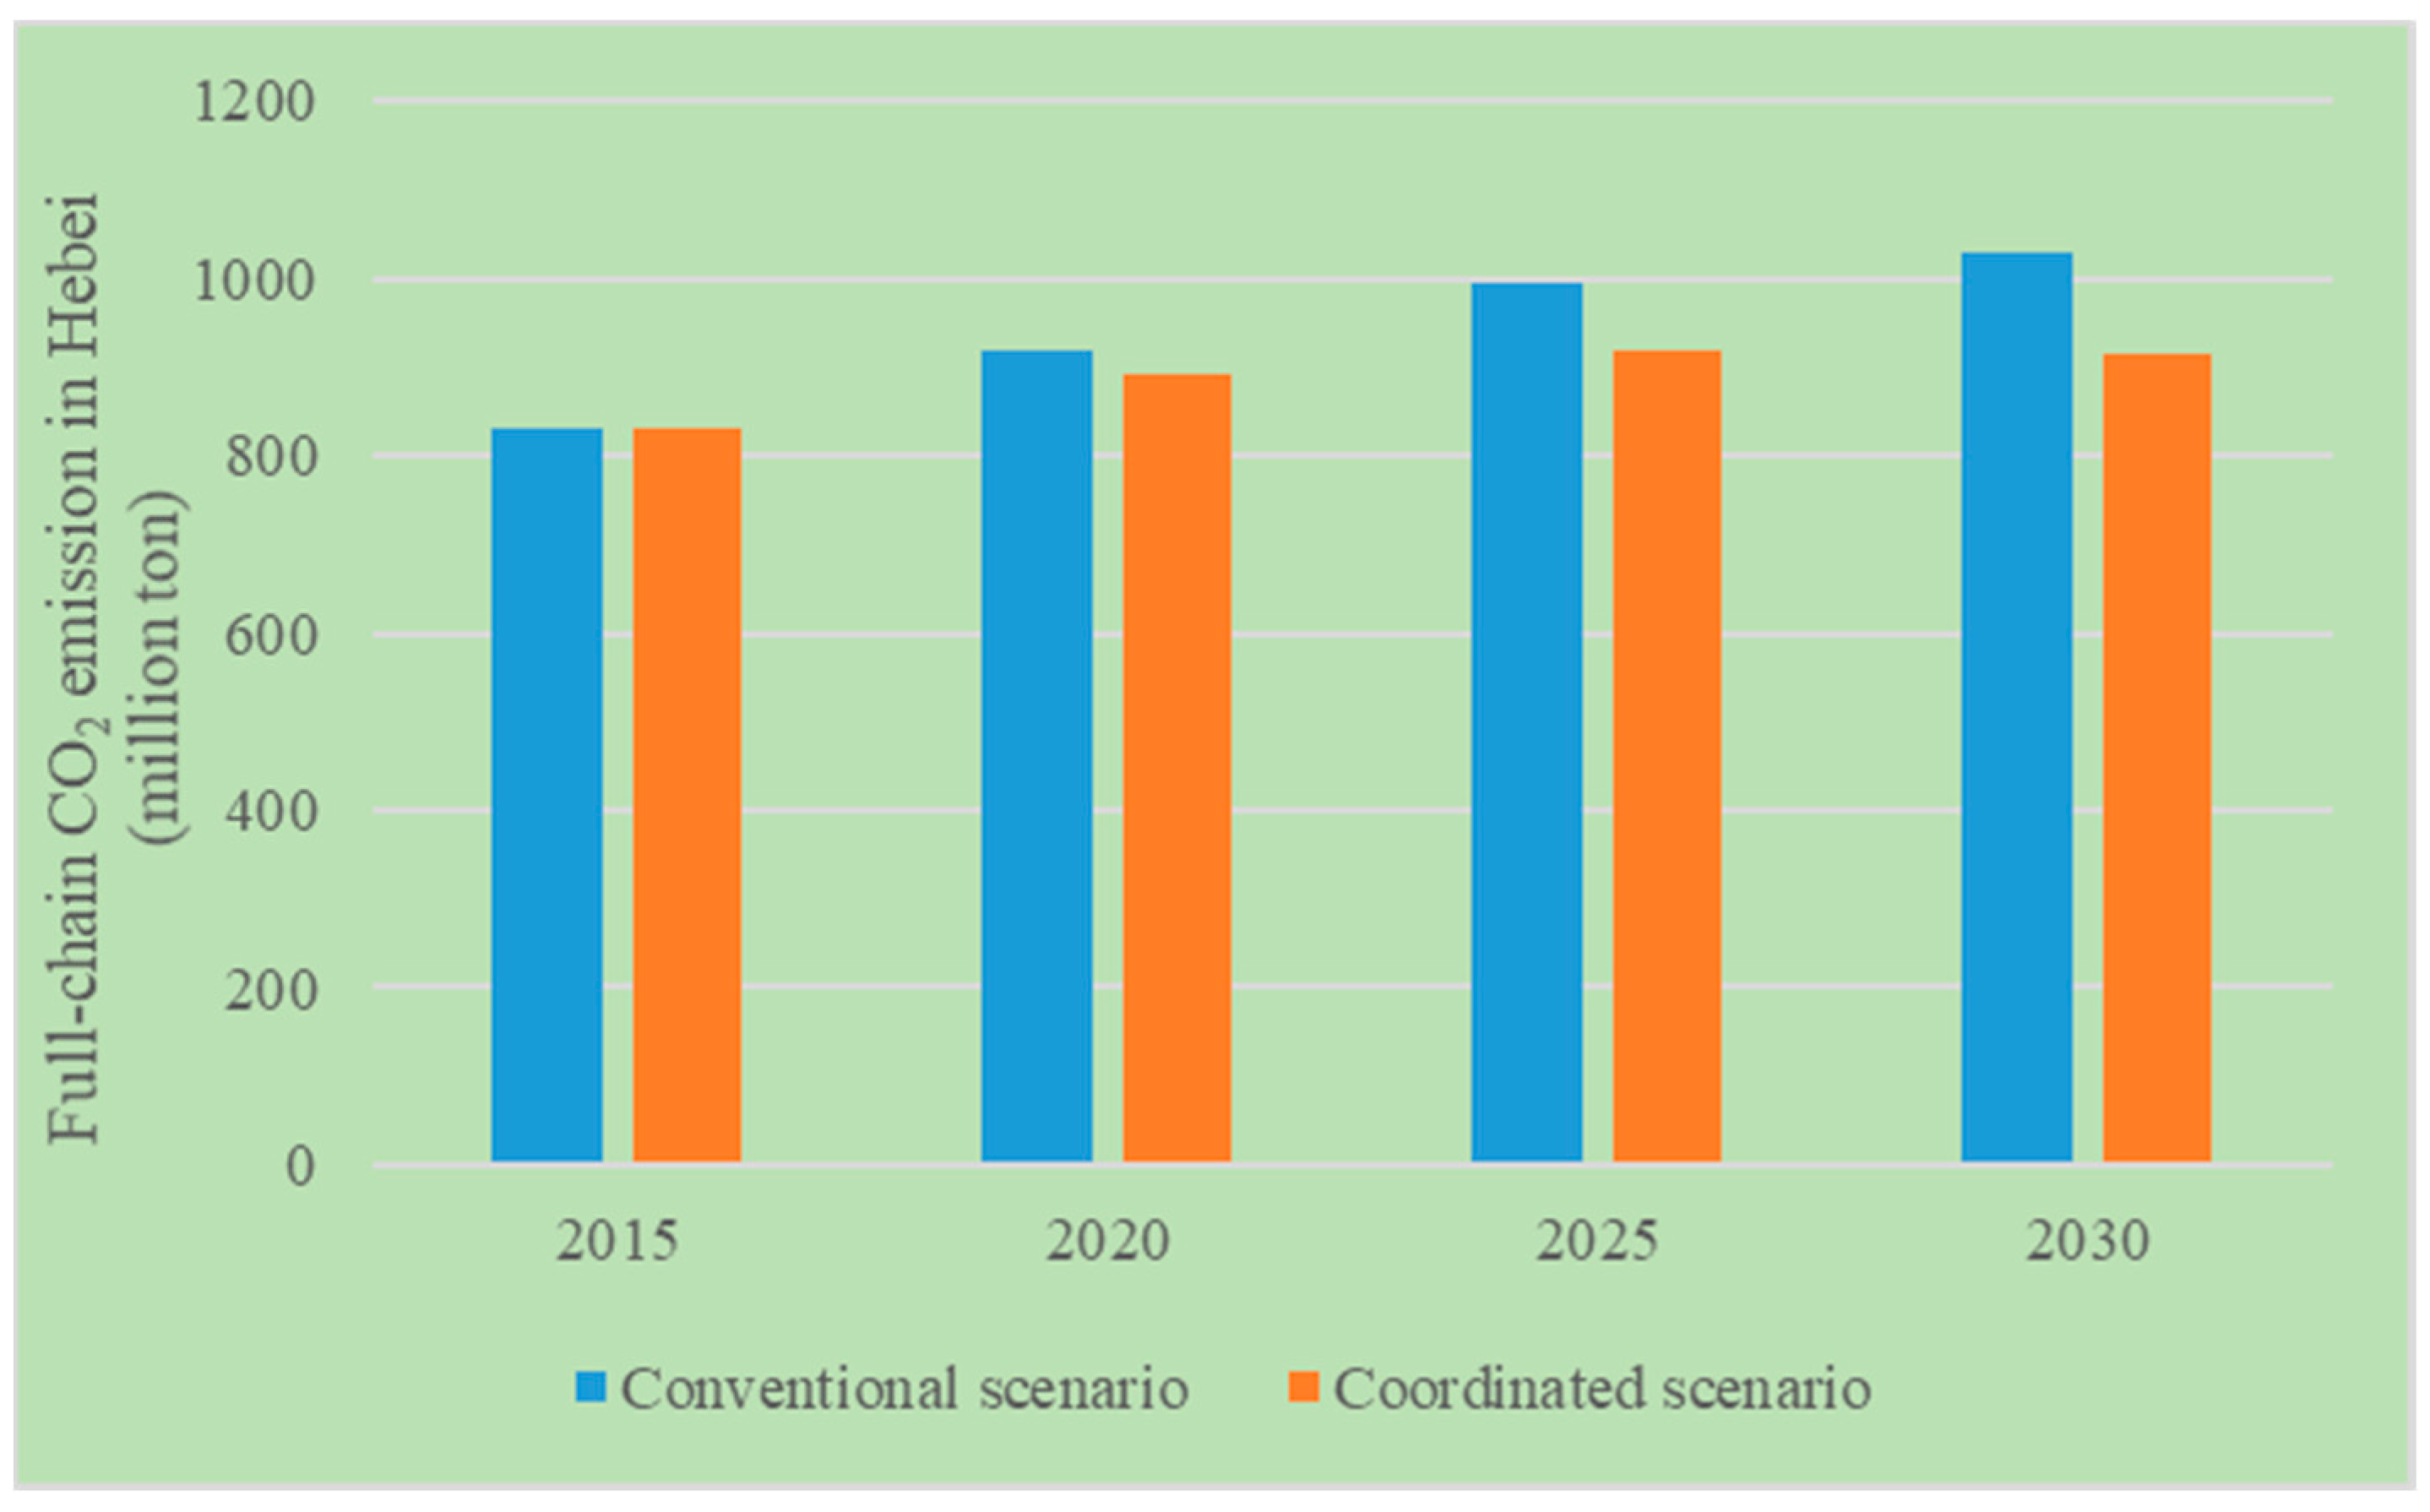
In the conventional scenario, full-chain CO2 emission will increase from 831 million tons in 2015 to 1027 million tons in 2030, and the growth ratio will reach 24%, while, in the coordinated scenario, full-chain CO2 emission peaked in 2025, and will constantly decrease to 916 million tons in 2030. Detailed results are shown in Figure 10.
It should be noted that CO2 emission of electricity transferred from other provinces is considered here. The CO2 emission factor of electricity adopted here is that in the north China electricity grid, which Hebei electricity grid is affiliated with [37]. CO2 emission of electricity transferred from other provinces account for about 10% of total full-chain CO2 emission in Hebei.
(3) Accounted CO2 emission
The accounted CO2 emission in Hebei in 2015–2030 is shown in Table A4. In the conventional scenario, CO2 emission will increase from 723 million tons in 2015 to about 800 million tons in 2030, and the growth ratio will reach 10%, while, in the coordinated scenario, CO2 emission will constantly decrease to 528 million tons in 2030.
Accounted CO2 emission, which is reported to the central government of China, can be calculated following the standard process [38] by counting up each type of end-use energy consumption multiplied by homologous CO2 emission factor. The projection of electricity CO2 emission factor is important during the accounted CO2 emission calculation. Electricity CO2 emission factors are different in different regions’ power grids in China. The emission factors of electricity used in Hebei in 2015, 2020 and 2030 are 0.837, 0.755 and 0.725 kg/kWh, respectively, same as North China Power Grid, which Hebei is attached to [38].

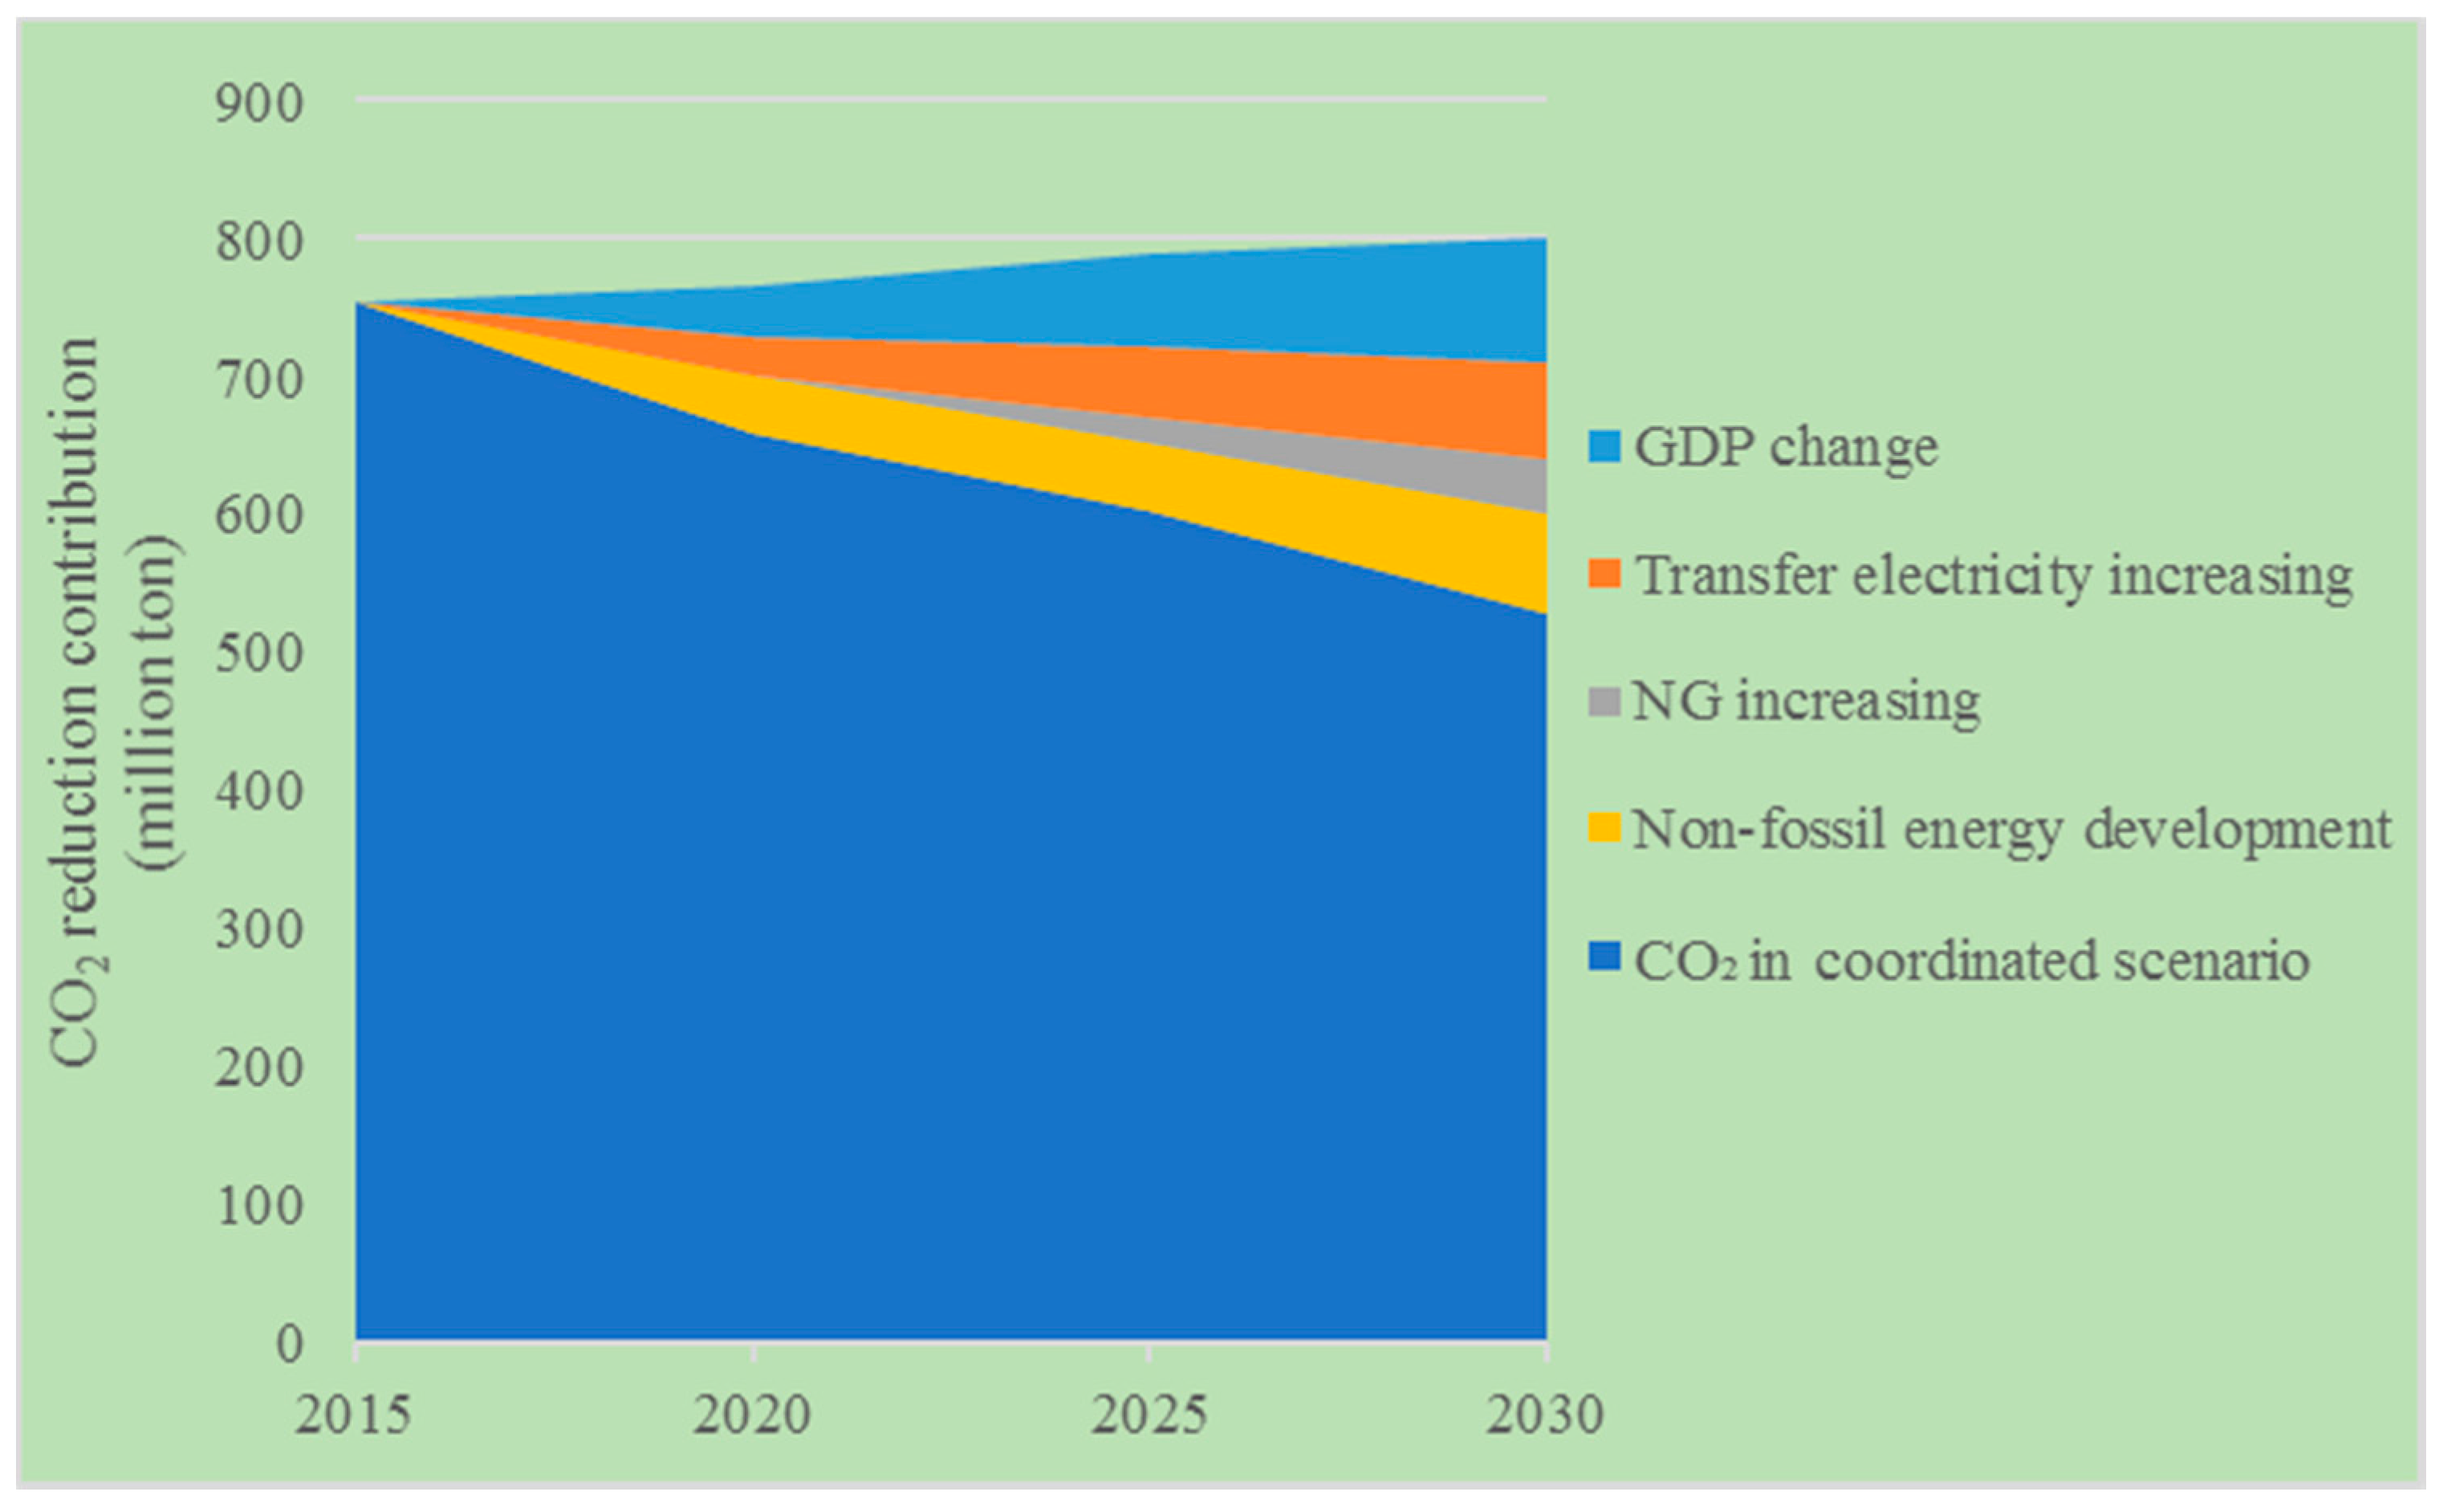
5.5. CO2 Reduction Contribution Analysis

It should be noted that clean trend of energy structure can help reduce CO2 emission resulted from energy consumption, especially when nuclear power and electricity generated from renewable energy are promoted. CO2 emission in the coordinated scenario will keep decreasing, since nuclear power and electricity generated from other renewable energies will bring zero CO2 emission.
Supposed that CO2 emission from electricity in Hebei is calculated based on its actual production status, CO2 emissions from 2015 to 2030 in Hebei are shown in Figure 11. Comparing CO2 emissions in the coordinated scenario with that in the conventional scenario, the reduction ratios will be 14%, 23% and 34% in 2020, 2025 and 2030, respectively.
GDP changes will maintain about 1/3 of contribution to CO2 emission reduction in the long run. Increasing transferred electricity’s contribution to CO2 emission reduction will gradually increase, and turn out to be about 1/4 in 2030. In the short term, non-fossil energy development will be the most effective method to reduce CO2 emission, since non-fossil energy development can sharply reduce the demand of coal electricity, and it will account for about 40% and about 70% of CO2 emission reduction in 2020 and 2030, respectively.

5.6. Comparison of Energy Demand Results with Other Studies

As Figure 12 shows, the results of end-use energy demand for 2020 and 2030 in the two defined scenarios of this study are larger than the results in the study of [10]. The main reason for the difference is that a more detailed analysis of the seven sub-sectors of secondary industry has been carried out in this study. The declining trend of energy intensity coefficient of secondary industry used in this study is more moderate than the study of [10]: the decrease rate from 2015 to 2030 is about 50% in this study while about 70% in the study of [10].
The end-use energy demand for 2020 and 2030 in Hebei reported in Zhang Xu [38], which studied the whole China’s energy demand up to 2030 by considering interactions among different provinces, is on the result-range of the two defined scenarios of both this study and the study [10]. More efforts on controlling the energy demand in Hebei have been required to accelerate the coordinated development for Hebei in the coordinated scenario in this study than the study of Zhang Xu [38], which has partly considered controlling the energy demand in Hebei to help the regional synergistic development.

5.7. Comparison of CO2 Emission and Energy Structure in Hebei and Whole China in Future

As Table A4 shows, Hebei’s CO
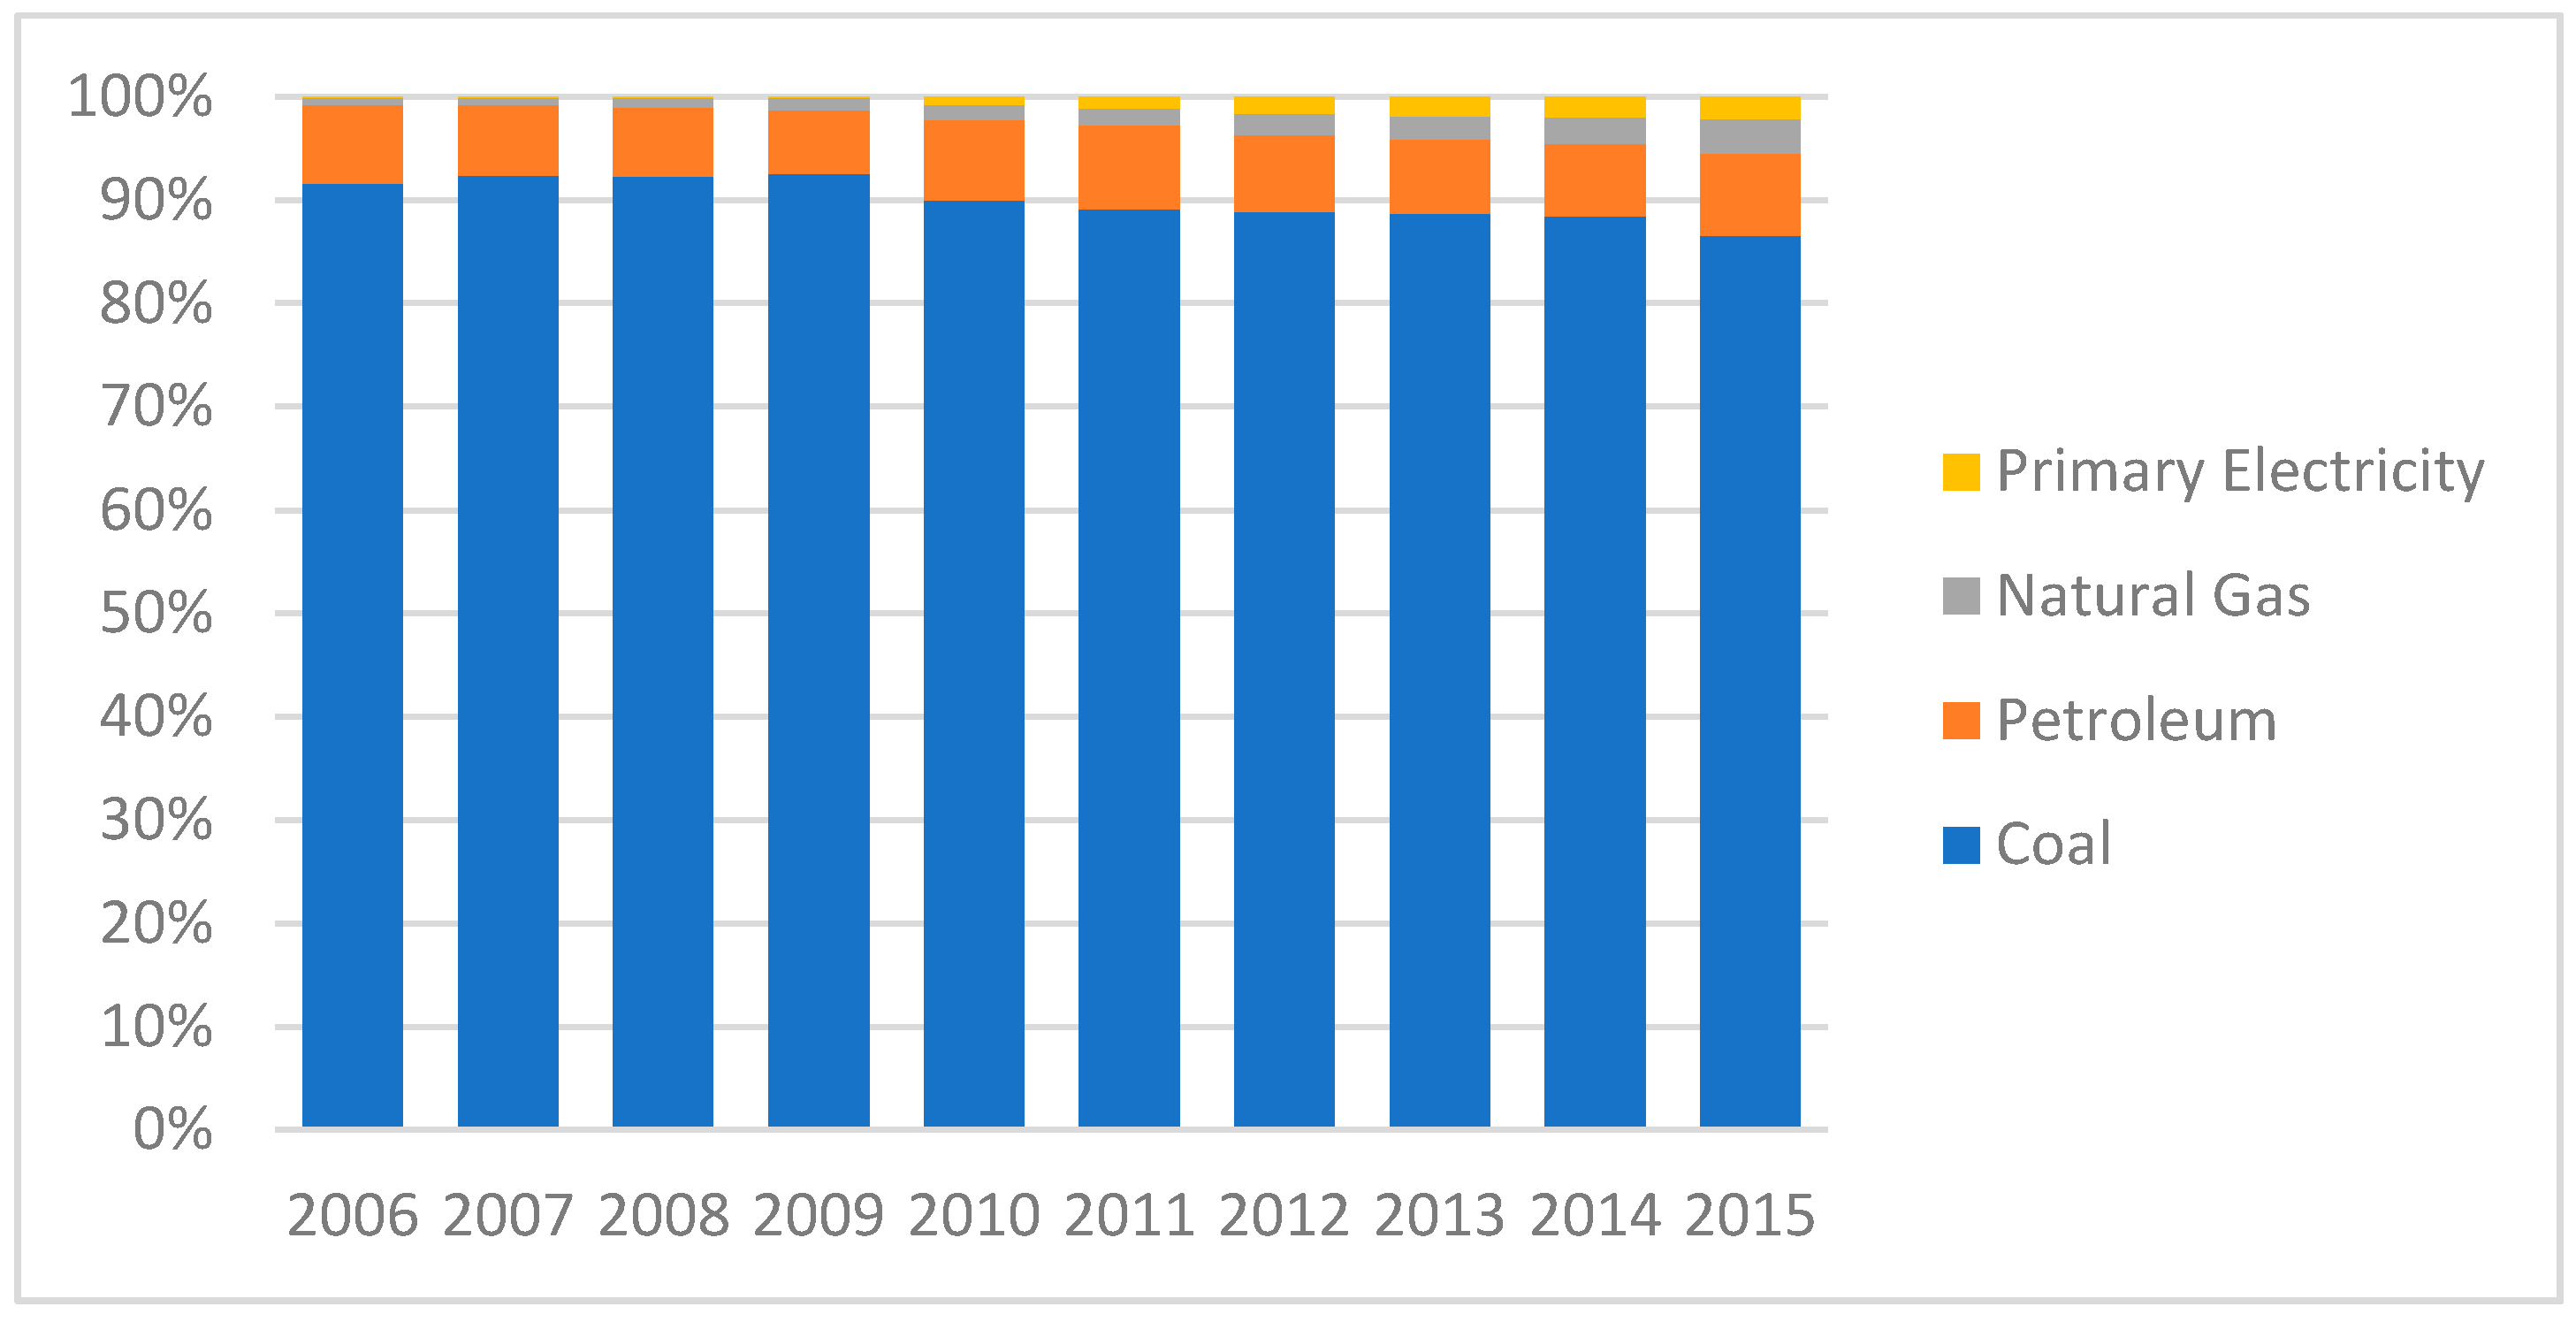
2 emission (accounted number following the inventory guideline) has peaked in the year of 2015 and will decrease about 30% from 2015 to 2030 in the coordinated scenario, accompanied by lower proportion of coal and higher of non-fossil energy in the energy structure than in in conventional scenario. The proportion of coal (which is carbon intensive) in the total primary energy consumption will fall from around 80% in 2015 to 53% in 2030 and the proportion of non-fossil energy (which is carbon free) will finally grow to 13% in 2030 in the conventional scenario. In the coordinated scenario, the proportion of coal in the total primary energy consumption will fall to about 30% in 2030 and the proportion of non-fossil energy will finally grow to 20% in 2030.
As mentioned in Section 5.4, according to the calculation method proposed by provincial accounted CO2 emission reports to the central government of China, indirect CO2 emissions from transferred electricity is equal to the product of actual quantities of transferred electricity times average emission factor of its regional power grid.
China government has pledged to peak the CO2 emission around 2030 and planned to enforce the non-fossil energy ratio of total energy consumption to reach 12% and 20% in 2020 and 2030, respectively, while decreasing coal consumption to decrease its proportion in the total primary energy consumption below 50% [39,40].
It is found that the effect of energy saving and GHG reduction in future in Hebei can surpass the national average level through efforts to decrease the total energy consumption of Hebei, increase the clean energy and greatly optimise the energy structure in the coordinated development scenario.

5.8. Possibility of Realiazation of Coordinated Scenario in Hebei

Whether the coordinated scenario in Hebei can be realised or not mainly depend on how much effort Hebei, the whole area of Beijing-Tianjin-Hebei, and even whole China exert, since this scenario is quite ideal. Major risks that can jeopardize the coordinated scenario’s results include: optimisation level of the industrial structure, actual natural gas supply and infrastructure construction level that can be ensured, development rate of local nuclear power plants, transferred electricity that can be guaranteed and Hebei’s bearing capacity for future increase of electricity price.
Some critical factors that help evade the risks mentioned above include: coordinated development of the whole Beijing-Tianjin-Hebei area, introduction of high-level industries and strong energy supply and financial support from the central government of China.

5.9. Major Implication of the Findings on Hebei Case for Other Regions

The findings in this study of Hebei can be applied to understand the energy system low-carbon transition in the regions with similar economy and energy structure in China and beyond. A deeply collaborated development mode will bring out CO2 reduction benefit with stronger energy consumption constraints. There are three key factors to driven the low-carbon transition of the regional energy system dominated by coal: GDP structure optimisation, the introduction of external low-carbon energy and the improvement of local low-carbon energy development and utilisation.
In addition, we should pay more attention to the co-benefit of environmental protection with low-carbon energy system transition: the substitution of non-fossil energy on fossil energy can reduce SO2, NOx and dust soot emissions.

6. Concluding Remarks

This paper adopts a provincial energy demand analysis model based on energy intensity analysis, conducts a quantitative analysis on energy consumption and discusses the low-carbon transition path of Hebei province in China. The research method can by referred by other studies to research on similar energy demand of a specific region without abundant sectoral data.
It is found that future energy consumption and CO2 emission in Hebei are substantially different when following different development paths. Several achievements can be realised though efforts. The total primary energy consumption and accounted CO2 emission will be 431 million tce and 528 million ton in the coordinated scenario in 2030, 40 million tce and 272 million ton less than in the conventional scenario. The energy structure of Hebei will be optimised, since the proportion of coal in total primary energy consumption can fall from around 80% in 2015 to 53% and 29% in 2030 in the two defined scenarios and the proportions of transferred electricity, natural gas, nuclear energy and renewable energy can increase rapidly.
In the coordinated scenario, Hebei’s CO2 emission has peaked in 2015 and will decrease about 30% from 2015 to 2030 accompanied by lower proportion of coal and higher of non-fossil energy in the energy structure than in in conventional scenario.
Hebei is supposed to fulfil the objective toward sustainable development and obtain the effect of energy saving and GHG reduction which can surpass the national average level through efforts to decrease the total energy consumption of Hebei, increase the clean energy and greatly optimise the energy structure in future.
There are three key factors driving the low-carbon transition of the regional energy system dominated by coal: GDP structure optimisation, the introduction of external low-carbon energy and the improvement of local low-carbon energy development and utilisation.
Some specific additional policy instruments are suggested to support the low-carbon transition of energy system in Hebei under the framework of the coordinated development of Beijing-Tianjin-Hebei area:
(1)
Accelerate the backward production capacity elimination and compression of the scale of energy-intensive industries currently by taking over high-end industry from Beijing and Tianjin, ensuring the steady development of the economy.
(2)
Transfer more electricity from outside than planned, by determining the source of electricity supply, constructing the electricity transmission channel and developing the low-price mechanism.
(3)
Exert efforts to utilise natural gas at a bigger scale than planned by determining natural gas supply source, building the piping with the full support of the central and local government and implementing the low-price mechanism to promote the efficient supply of natural gas and large-scale use for electricity generation, industry and residents.
(4)
Introduce nuclear power rapidly, by constructing several nuclear power parks in the coastal and inland area gradually and operating the nuclear power plant safely and efficiently in near future.
It is worth noting that several listed instruments cannot be implemented by only Beijing-Tianjin-Hebei area, and require overall coordination of the central government of China. These instruments include: assurance of natural gas supply source, support for quick nuclear power development in Hebei and guarantee of transferred electricity source to Hebei.
In this way, revolutionary change in the energy system can support the coordinated targets of economic growth and CO2 emission control, and environmental governance by 2030, and benefit the sustainable development of this region dominated by coal energy currently.

Acknowledgments

This project was co-sponsored by key project of the China National Social Science Foundation (16AGL002) and the National Natural Science Foundation of China (71690240, 71373142 and 71673165).

Author Contributions

Xunmin Ou and Sheng Zhou conceived and designed the research framework; Xunmin Ou performed the model development and analyzed the data; Xunmin Ou, Zhiyi Yuan, Tianduo Peng, Zhenqing Sun and Sheng Zhou wrote the paper.

Conflicts of Interest

The authors declare no conflict of interest.

Appendix A

Table A1. End-use energy consumption demand up to 2030 in conventional scenario (million tce).
2015202020252030
Primary Industry
Sub-total5.596.266.756.99
Coal1.311.802.353.01
Oil2.873.033.042.81
Gas0.000.000.000.00
Electricity1.201.181.070.81
Secondary Industry
Sub-total172.25183.24186.68180.53
Coal129.46127.11115.65101.51
Oil3.524.345.145.36
Gas4.337.6611.3513.97
Electricity34.9544.1354.5459.70
Tertiary Industry
Sub-total21.0625.4429.1033.24
Coal5.216.297.208.23
Oil10.6112.8114.6616.75
Gas0.981.181.351.54
Electricity3.474.204.805.48
Residential Sector
Sub-total28.7333.5641.6051.25
Coal11.6111.2810.7410.09
Oil4.275.146.618.37
Gas3.644.836.819.18
Electricity9.2212.3017.4423.61
Total
Sub-total227.63248.50264.13272.01
Coal147.59146.48135.94122.84
Oil21.2725.3229.4533.29
Gas8.9513.6719.5124.69
Electricity48.8461.8177.8589.60
Data source: calculated by the authors.
Table A2. End-use energy consumption demand up to 2030 in coordinated scenario (million tce).
2015202020252030
Primary Industry
Sub-total5.596.266.756.99
Coal1.311.802.353.01
Oil2.873.033.042.81
Gas0.000.000.000.00
Electricity1.201.181.070.81
Secondary Industry
Sub-total172.25169.50150.37135.06
Coal129.46114.4087.9050.75
Oil3.524.345.145.36
Gas4.336.632.7919.24
Electricity34.9544.1354.5459.70
Tertiary Industry
Sub-total21.0628.0534.2341.42
Coal5.216.948.4710.25
Oil10.6114.1317.2420.87
Gas0.981.301.591.92
Electricity3.474.635.646.83
Residential Sector
Sub-total28.7333.5641.6051.25
Coal11.6111.2810.7410.09
Oil4.275.146.618.37
Gas3.644.836.819.18
Electricity9.2212.3017.4423.61
Total
Sub-total227.63237.37232.95234.72
Coal147.59134.42109.4674.10
Oil21.2726.6432.0337.41
Gas8.9512.7611.1930.34
Electricity48.8462.2478.6990.95
Data source: calculated by the authors.
Table A3. Primary energy consumption demand up to 2030 in Hebei in two scenarios.
ScenarioUnitConventional ScenarioCoordinated Scenario
20152020202520302015202020252030
Primary energy consumptionmillion tce336391439471336380407431
By type
Coalmillion tce260249249249260207166125
Oilmillion tce2840475028404750
Gasmillion tce1140475311406786
Renewable energymillion tce1018211910141416
Nuclear energymillion tce0928400344867
Transferred electricitymillion tce2736486027456687
Coal%7764575377554129
Oil%81011118101212
Gas%31011113111620
Renewable energy%35553555
Nuclear energy%0269091415
Transferred electricity%8911138121620
Data source: calculated by the authors.
Table A4. Primary energy consumption and accounted CO2 emission up to 2030 in Hebei in two scenarios.
ItemUnitConventional ScenarioCoordinated Scenario
20152020202520302015202020252030
Primary energy consumptionmillion tce336391439471336380407431
Accounted CO2 emissionmillion ton723766788800723659604528
CO2 emission intensity of primary energy consumptionton/tce2.151.961.791.702.151.741.481.22
The share of coal in total primary energy consumption%7764575377554129
The share of non-fossil energy in total primary energy consumption%3711133131519
Data source: calculated by the authors.

References

  1. National Bureau of Statistics, China. China Statistical Yearbook; China Statistics Press: Beijing, China, 2015.
  2. Chen, H.X.; Li, G.P. Empirical Study on Effect of Industrial Structure Change on Regional Economic Growth of Beijing-Tianjin-Hebei Metropolitan Region. Chin. Geogr. Sci. 2011, 6, 708–714. (In Chinese) [Google Scholar] [CrossRef]
  3. Lian, J.T. Research on the Economic Strategy of Hebei Province in the Coordinated Development of Beijing, Tianjin and Hebei. Ph.D. Thesis, Dongbei University of Finance and Economics, Dalian, Liaoning, China, December 2015. (In Chinese). [Google Scholar]
  4. Liu, H.Y.; Xiao, L.; Xu, X.L.; Ban, Z.J. Analysis of Energy Consumption and Influence Factors of Carbon Emissions in Hebei Province. J. Agric. Sci. 2016, 20, 81–84. (In Chinese) [Google Scholar]
  5. Zhang, J.W.; Gong, X.G. Research on the impact of industry structure change on energy consumption based on a case study of Hebei Province. J. Yanshan Univ. 2010, 11, 106–110. [Google Scholar]
  6. Bureau of Statistics of Hebei, Hebei, China. Hebei Economic Statistical Yearbook; China Statistics Press: Beijing, China, 2016.
  7. Du, Y.; Xiao, R.G.; Zhao, H.Q.; Fan, J.; Zhu, C.H. Dynamic analysis of the relationship between energy consumption and economic growth in Hebei: Based on the state space model. China Min. Mag. 2015, 21, 42–47. (In Chinese) [Google Scholar]
  8. Department of Energy Statistics; National Bureau of Statistics, China. China Energy Statistical Yearbook 2016; China Statistics Press: Beijing, China, 2016.
  9. Bureau of Statistics of Hebei, Hebei, China. Statistical Communique of Hebei on the 2014 National Economic and Social Development. Available online: http://info.hebei.gov.cn/hbszfxxgk/329975/330000/330496/6398050/index.html (accessed on 15 June 2017).
  10. Institute of Tsinghua University at Hebei (ITUH). Coordinated Development of Beijing, Tianjin and Hebei: Economic Development, Energy Consumption and Pollution Emission in Hebei Province; ITUH: Beijing, China, 2015. (In Chinese) [Google Scholar]
  11. Wu, Y.Q.; Zhao, Y.N. Beijing-Tianjin-Hebei Energy Consumption, Carbon Emissions and Economic Growth. Econ. Manag. 2014, 28, 5–12. [Google Scholar]
  12. Bo, W.G.; Chen, F. The Coordinated Development among Beijing, Tianjin and Hebei: Challenges and Predicaments. J. Nankai Univ. 2015, 1, 110–118. [Google Scholar]
  13. Zhang, G.; Wang, S.Q.; Liu, S.; Jia, S.J. Study on Co-ordination between Beijing-Tianjin-Hebei Based on Industry Matching and Transfer. Econ. Manag. 2014, 28, 14–20. [Google Scholar]
  14. Wang, Z.H.; Lin, Y. Delinking indicators on regional industry development and carbon emissions: Beijing–Tianjin–Hebei economic band case. Ecol. Indic. 2015, 48, 41–48. [Google Scholar] [CrossRef]
  15. Xinhuanet. Special Focus on Beijing-Tianjin-Hebei Cooperation and Development Plan. Available online: http://www.xinhuanet.com/syzt/jjjxtfz/index.htm (accessed on 27 June 2017).
  16. Xinhuanet. The Central Government of China Decides to Set up Xiong’an New District. Available online: http://news.xinhuanet.com/politics/2017-04/01/c_1120741571.htm (accessed on 27 June 2017).
  17. Zhu, E.J.; Wen, K.; Ye, T.L.; Zhang, G.X. Annual Report on Beijing-Tianjin-Hebei. Metropolitan Region Development; Social Science Academic Press: Beijing, China, 2016. (In Chinese) [Google Scholar]
  18. International Energy Agency and Nordic Energy Research. Nordic Energy Technology Perspectives 2016 (Paris: OECD, 2016). Available online: www.iea.org/etp/Nordic (accessed on 15 June 2017).
  19. Liu, Q.; Chen, Y.; Tian, C.; Zheng, X.-Q.; Li, J.-F. Strategic deliberation on development of low-carbon energy system in China. Adv. Clim. Chang. Res. 2016, 7, 26–34. [Google Scholar] [CrossRef]
  20. Yuan, J.; Xu, Y.; Hu, Z.; Zhao, C.; Xiong, M.; Guo, J. Peak energy consumption and CO2 emissions in China. Energy Policy 2014, 68, 508–523. [Google Scholar] [CrossRef]
  21. Emodi, N.V.; Emodi, C.C.; Murthy, G.P.; Emodi, A.S.A. Energy policy for low carbon development in Nigeria: A LEAP model application. Renew. Sustain. Energy Rev. 2017, 68, 247–261. [Google Scholar] [CrossRef]
  22. Lind, A.; Kari, E. The use of energy system models for analysing the transition to low-carbon cities—The case of Oslo. Energy Strategy Rev. 2017, 15, 44–56. [Google Scholar] [CrossRef]
  23. Zhao, G.L.; Guerrero, J.M.; Jiang, K.J.; Chen, S. Energy modelling towards low carbon development of Beijing in 2030. Energy 2017, 121, 107–113. [Google Scholar] [CrossRef]
  24. Pan, X.Z.; Chen, W.Y.; Clarke, L.E.; Wang, L.; Liu, G. China’s energy system transformation towards the 2 °C goal: Implications of different effort-sharing principles. Energy Policy 2017, 103, 116–126. [Google Scholar]
  25. Qiu, D.X.; Institute of Energy, Environment and Economy, Tsinghua University, Beijing. Energy Planning and System Model; Tsinghua University Press: Beijing, China, 1987. (In Chinese) [Google Scholar]
  26. Niu, X.G.; Niu, J.G.; Dan, M. Energy Consumption and Carbon Emissions: Analysis and Prediction—The Case of Hebei Province in China. Energy Procedia 2011, 5, 2271–2277. [Google Scholar]
  27. The Thirteenth Five-Year Plan of Hebei. Available online: http://www.hbdrc.gov.cn/web/web/t.xhtml?template=erji/fazhanguihua (accessed on 15 June 2017).
  28. National Bureau of Statistics, China. Statistical Communique of the People’s Republic of China on the 2014 National Economic and Social Development. Available online: http://www.stats.gov.cn/tjsj/zxfb/201502/t20150226_685799.html (accessed on 15 June 2017).
  29. The Thirteenth Five-Year Plan of Hebei on Energy Conservation and Emission Reduction. Available online: http://info.hebei.gov.cn/eportal/ui?pageId=1962757&articleKey=6737879&columnId=329982 (accessed on 15 June 2017).
  30. State Grid Energy Research Institute. Analysis Report on Power Supply and Demand of China 2016; China Electric Power Press: Beijing, China, 2016. [Google Scholar]
  31. Dai, Y.D.; Bai, Q. Scenario Analysis of Industrial Energy Conservation of China; China Economic Publishing House: Beijing, China, 2015. [Google Scholar]
  32. Wang, H.L. Model Simulation of China’s Low-carbon Transportation Transformation Mechanism and Policy. Ph.D. Thesis, Tsinghua University, Beijing, China, 31 May 2016. [Google Scholar]
  33. Institute of Energy Conservation in Buildings, Tsinghua. 2016 Annual Report on China Building Energy Efficiency; China Architecture & Building Press: Beijing, China, 2016. [Google Scholar]
  34. The Thirteenth Five-Year Plan of Hebei on Renewable Energy. Available online: http://info.hebei.gov.cn/eportal/ui?pageId=1966210&articleKey=6675503&columnId=330035 (accessed on 15 June 2017).
  35. The Thirteenth Five-Year Plan of Hebei to Address Climate Change. Available online: http://info.hebei.gov.cn/eportal/ui?pageId=1966210&articleKey=6710248&columnId=330035 (accessed on 15 June 2017).
  36. Nuclear Project Construction in Hebei Speed up—Nuclear Plants in Cangzhou Plans to be Constructed in 2016. Available online: http://www.china5e.com/news/news-889570-1.html (accessed on 15 June 2017).
  37. Xiong, W.M. Development of the China Renewable Electricity Planning and Operations Model and Its Application. Ph.D. Thesis, Tsinghua University, Beijing, 6 September 2016. [Google Scholar]
  38. Zhang, X. Development and Application of Regional Energy Emission Air-Quality Climate Health Model (REACH). Ph.D. Thesis, Tsinghua University, Beijing, China, 2016. [Google Scholar]
  39. National Development and Reform Commission, CHINA. Revolutionary Innovation and Action Plan of the Energy Technologies. Available online: http://www.gov.cn/xinwen/2016-06/01/content_5078628.htm (accessed on 15 June 2017).
  40. The State Council, CHINA. Strategic Action Plan of Energy Development. Available online: http://www.mlr.gov.cn/xwdt/jrxw/201411/t20141119_1335668.htm (accessed on 15 June 2017).
Figure 1. Primary energy consumption composition in Hebei (2006–2015). Data source: [6].
Sustainability 09 01184 g001
Figure 2. Energy consumption and CO2 emission in Hebei (1980–2015). Data source: [6,9].
Sustainability 09 01184 g002
Figure 3. Framework of the quantitative analysis model in this study.
Sustainability 09 01184 g003
Figure 4. End-use energy consumption structure of secondary industry and its sub-industries in 2015. Data source: [8].
Sustainability 09 01184 g004
Figure 5. End-use energy demand in Hebei from 2015 to 2030 in two scenarios by industry/sector (a) and by type (b).
Sustainability 09 01184 g005aSustainability 09 01184 g005b
Figure 6. End-use energy demand of Hebei secondary industry in 2015, 2020, 2025 and 2030 in the two scenarios.
Sustainability 09 01184 g006
Figure 7. Primary energy demand in Hebei (2015–2030).
Sustainability 09 01184 g007
Figure 8. Primary energy supply in Hebei (2015–2030) in the conventional scenario (a) and in the coordinated scenario (b).
Sustainability 09 01184 g008aSustainability 09 01184 g008b
Figure 9. Direct CO2 emission in Hebei (2015–2030).
Sustainability 09 01184 g009
Figure 10. Full-chain CO2 emission in Hebei (2015–2030).
Sustainability 09 01184 g010
Figure 11. CO2 reduction contribution of different factors (2015–2030).
Sustainability 09 01184 g011
Figure 12. End-use demand in Hebei research results in different studies.
Sustainability 09 01184 g012
Table 1. Scenarios setting on GDP for Hebei development in future.
ScenarioContent
Conventional scenarioGDP growth rate decreases each year, to around 4.5% in 2030.
Secondary industry still leads the economy and its growth rate will not decrease much; the development rate of tertiary industry will match the GDP growth rate.
Development of the coal mining and washing, oil processing, coking, and nuclear fuel processing industries are still under strict governmental control, and the output value growth rate is likely zero. Taking into account their inherent factors, the other three industries may have 1–3% output value growth.
Coordinated scenarioGDP growth rate somewhat recovers in a few years, starts to decrease in 2017, and falls to around 3.7% in 2030.
The secondary industry decline rate is higher than the tertiary industry decline rate. The future tertiary industry growth rate will inevitably exceed the secondary industry growth rate and become the major contributor to the GDP. However, the industrial growth rate will be slightly inferior to the GDP, which is considerably different from in the conventional scenario.
Energy-intensive industries are further restricted and reduced after 2020. Zero growth of six such industries is gradually achieved during 2020–2030. The GDP in Hebei no longer relies on these industries as a driver for development and the growth rate gradually becomes zero.
Data source: [10].
Table 2. GDP and other key economic data in two scenarios in future Hebei.
ItemUnitConventional ScenarioCoordinated Scenario
20152020202520302015202020252030
GDPTrillion RMB (constant price in 2015)29814432601077322981420054046610
Share of GDP
Primary industry%1087610987
Secondary industry%5459626554535250
Among which, the energy-intensive sub-industries%1918151219161311
Tertiary industry%3633312936384043
Output of Key Products/Sub-Industries
Electricity productionTrillion kWh233284378473233254480571
Steel productionMillion ton142181181181142147126108
Cement productionMillion ton12412912912912411211091
Coal productionMillion ton9711811811897110105100
Oil processing industry outputTrillion RMB (constant price in 2015)67.394.6128.3165.167.389.7115.4141.1
Chemical industry outputTrillion RMB (constant price in 2015)45.864.487.3112.345.861.078.596.0
Data source: [10].
Table 3. Population and urbanisation rate of China from 2010 to 2030 in Hebei.
Unit2015202020252030
Populationmillion74.4577.1479.9382.82
Urbanisation rate%52556166
Data source: [6,27].
Table 4. Energy intensity of different industry/sector in Hebei (2015–2030).
Unit2015202020252030
Primary Industry
Energy consumption per unit of GDPtce/10,000 RMB (constant price in 2015)0.190.170.150.14
Secondary Industry
Energy consumption per unit of product: electricitygce/kWh320310300290
Energy consumption per unit of product: steeltce/ton0.540.390.340.32
Energy consumption per unit of product: cementkgce/ton92807470
Energy consumption per unit of product: coal mining and processingkgce/ton8.57.56.66.0
energy consumption per unit of value-added: oil processing industrytce/10,000 RMB (constant price in 2015)0.830.780.780.78
Energy consumption per unit of value-added: chemical industrytce/10,000 RMB (constant price in 2015)1.381.181.161.16
Energy consumption per unit of value-added: other industrytce/10,000 RMB (constant price in 2015)1.470.990.780.63
Tertiary Industry
Energy consumption per unit of value-addedtce/10,000 RMB (constant price in 2015)0.240.200.160.14
Residential Sector
Energy consumption per capitatce/person0.460.821.251.43
Note: (1) The data in 2015 are derived from the energy consumption data in [6,8] and economic/production output data in [6,9]; and (2) the data beyond 2015 are calculated by authors based on the trend analysis by referring to [29,30,31,32,33] with details explained in main text.

