Relationship among Concentrations of Indoor Air Contaminants, Their Sources, and Different Mitigation Strategies on Indoor Air Quality


1
Department of Civil/Environmental Engineering, Washington State University, 405 Spokane St. Sloan 108, Pullman, WA 99164-2910, USA
2
Civil and Environmental Engineering, Lamar University, P.O. Box 10024, Beaumont, TX 77550, USA
*
Author to whom correspondence should be addressed.
Sustainability 2017, 9(7), 1149; https://doi.org/10.3390/su9071149
Submission received: 5 April 2017
/
Revised: 26 June 2017
/
Accepted: 28 June 2017
/
Published: 30 June 2017
Abstract
:To ensure that indoor air quality mitigation approaches, such as ventilation, are providing the desired indoor air quality, it is necessary to better understand the varied sources of indoor air contaminants and how different mitigation approaches will affect those sources. This article describes a generalized model that describes the efficacy of different indoor air quality improvement strategies as a function of the primary source(s) of indoor air contaminants of concern. The model is then used as a framework to compare the impact of two different ventilation approaches (a continuous exhaust ventilation strategy compared to a runtime ventilation strategy) on two indoor air compounds (CO2 and formaldehyde) based on primary data gathered in 10 homes in Gainesville, FL. The findings from the Gainesville data suggest that the two approaches provided similar efficacy for reducing CO2 concentrations, but the continuous exhaust system was not as effective at decreasing interior concentrations of formaldehyde, as compared to the runtime ventilation strategy. The simplified, generalized model could be used as a framework to analyze and compare existing detailed modeling and experimental results to bring about a greater understanding of the relative efficacy and tradeoffs of different IAQ mitigation strategies in homes, as well as inform guidance or standards addressing indoor air quality in residential buildings and serve as a decision-making tool for building industry professionals responsible for specifying ventilation systems in homes.
1. Introduction
Maintaining adequate indoor air is a critical element of high-performance, sustainable homes. Mechanical ventilation is a typical strategy for maintaining healthy indoor air quality in residential buildings, which is intended to dilute indoor air pollutants with outdoor air with the goal of maintaining concentrations below levels that may lead to negative health impacts [1]. Other components that make up a comprehensive strategy for indoor air quality include limiting materials and activities that provide the source of pollutants, and employing local exhaust in dedicated areas where high concentrations of contaminants are likely to occur (e.g., kitchens or bathrooms) [1]. However, there is currently no simplified and well-understood framework for comparing the relative efficacy of different indoor air quality mitigation approaches or understanding how multiple strategies may work together to address various indoor air contaminants. To enable indoor air quality standards and building science practitioners to compare and contrast the efficacy of various indoor air quality mitigation approaches, alone or in combination, it is necessary to better understand the varied sources of indoor air contaminants and how different mitigation approaches will affect those sources. This article describes a generalized model for describing the relationship between indoor air quality contaminant sources and the effectiveness of different indoor air quality mitigation strategies. We believe that such a model can be used to compare and develop recommendations about different approaches in different climates and housing types. The article also illustrates application of the model to data collected in 10 homes in Gainesville, FL [2].
1.1. Background on Existing Mitigation Approaches
ASHRAE Standard 62.2, “Ventilation and Indoor Air Quality in Low-Rise Buildings” [3], is the most commonly referenced residential standard relating to indoor air quality in the United States. It is currently required by ENERGY STAR Version 3 (V3), the 2012 International Energy Conservation Code, U.S. Department of Energy’s (DOE’s) Zero Energy Ready Home Program, many state weatherization programs, and many other home performance programs [4,5]. ASHRAE 62.2-2016 relies primarily on mechanical ventilation to intentionally introduce outside air and dilute indoor air pollutants; additional requirements include minimal particulate filtration and exhaust-based spot ventilation in the kitchen and bathroom. Typical mechanical ventilation strategies include supply-based systems, exhaust-based systems, and balanced systems, any of which can be distributed or non-distributed (i.e., single-point). Previous reports have provided good summaries of the various ventilation technologies and approaches [6].
Whole-house mechanical ventilation, such as that required by ASHRAE Standard 62.2, has proven to be an effective strategy for some contaminants. Consistent with this assumption, higher levels of ventilation air have been shown to reduce concentrations of many VOCs [7,8]. However the rate of decrease with increasing ventilation air is variable based on the contaminant, suggesting that for some contaminants ventilation may be increasing the effective source strength of the contaminant, the contaminant may have multiple sources that are not as effectively addressed with ventilation, or both. That is, for some contaminants, ventilation may not be having the desired mitigation effect and may result in inadequate indoor air quality. For example, research has also shown that some pollutants, such as formaldehyde, exhibit a non-linear, or concentration-dependent, emission rate, whereby increased ventilation rates do not decrease concentrations as much as would be expected based on the increased dilution rate [8].
The degree to which increased ventilation air reduces concentrations of some contaminants has also been shown to be dependent on the ventilation system type, particularly with respect to formaldehyde concentrations [2,9,10,11]. Specifically, Hun et al. [9] and Rudd and Bergey [10] have also demonstrated that supply-based systems may be more effective at reducing formaldehyde concentrations than exhaust-only systems. This may be a result of the ventilation air coming from the attic or through the building envelope in the exhaust-only systems, increasing the exposure of ventilation are to areas of the home may have been constructed with formaldehyde-emitting materials (some building materials contain formaldehyde as a product of their manufacturing, while other emit formaldehyde as a product of secondary reactions [12]). In addition, in some climates, exhaust-only ventilation systems may serve to increase the temperature and relative humidity in such interstitial spaces through the continual introduction of hot-humid outside air. The emission rate of formaldehyde, similar to many VOCs, has been shown to be linearly related to temperature and relative humidity [11,13]. In such cases, the dilution efficacy of the exhaust-based ventilation strategy may be significantly decreased. However, ASHRAE 62.2-2016 does not differentiate based on the specific ventilation strategy used to provide the requisite quantity of ventilation air [3]. In addition, the recommended amount of ventilation air is not related to the degree of filtration, source control, or other indoor air quality mitigation strategies that may be occurring in the home. Specifically, the required amount of outside air that must be provided to a home is calculated using a simplified equation based on the conditioned floor area of the home, the number of bedrooms in the home, and the measured infiltration of a home, as shown in Equation (1) [3].
where Qmech is the air flow rate required to be provided by mechanical ventilation, in cubic feet per minute (CFM); CFA is the conditioned floor area in square feet (sqft); # Bedrooms is the number of bedrooms in the home expressed as an integer; and Qinf is the flow rate provided by natural infiltration, determined in accordance with the standard [3]. The generalized terms in the ASHRAE 62.2 equation are designed to address the primary sources of pollutants in homes, where the conditioned floor area is meant to represent building-material-related pollutants and the number of bedrooms is meant to represent occupant-related pollutants.
Qmech = 0.03 × CFA + 7.5 × [(# Bedrooms) + 1] − Qinf
While not exact, the general form of the ASHRAE 62.2 ventilation equation provides a useful and straightforward method to determine the amount of ventilation that must be provided to a home based on an estimate of several major sources of contaminants in homes. However, as noted above, the ASHRAE 62.2 ventilation equation does not account for additional sources of contaminants, such as outdoors, and does not provide a mechanism to account for other IAQ mitigation strategies that may be employed in a home, such as source control.
More flexible and advanced modeling techniques exist that can address the complex relationship between contaminant concentration and relative sources of contaminants in homes at any given point in time. For example, ASHRAE describes modeling of indoor air quality, along with temperature and relative humidity conditions, based on computational fluid dynamic (CFD modeling) or multi-zone network airflow modeling [14]. CFD modeling involves solving coupled differential equations, which must be worked simultaneously or successively and no analytical solutions are available. Multi-zone network airflow modeling is more simplified than CFD in that is describes each building as a combination of zones, each of which is modeled as a steady-state, well-mixed space. The most widely used indoor air quality model is CONTAM, which is a multi-zone network indoor air quality and ventilation analysis software developed and maintained by the National Institute of Standards and Technology [15]. Both CFD and multi-zone network airflow modeling are designed to model specific contaminant concentrations in specific buildings and situations and relies on detailed and comprehensive information regarding home pressurization and leakage rates (sometimes on a zonal basis), exact emission source strength data, as well as temperature and relative humidity data for the specific site [14]. Such modeling is time consuming and resource-intensive to implement on large groups of homes and is not well understood by many in the building industry, including builders, architects, or mechanical contractors who specify the ventilation systems in most homes. In addition, the modeling results are specific to the inputs assumed in the model, which may not properly account for the variability and unpredictability observed in the field.
Detailed models such as CONTAM are a useful tool for generating detailed data regarding the introduction and transport of contaminants under certain conditions. However, a more general and simplified approach is needed, similar to the ASHRAE 62.2 ventilation equation, to describe aggregate effects of different indoor air quality mitigation approaches on indoor air quality contaminants of concern in the field. The generalized model described herein proposes a simplified method for gathering general trends on ventilation and other indoor air quality mitigation strategies in homes. The proposed model is simpler than the existing simulation-based models and, therefore, more widely implementable in standards and as a decision-making tool for the building industry. The proposed model also expands on the contaminants and mitigation strategies addressed in the existing, simplified ASHRAE 62.2 equation such that is may provide a more flexible and comprehensive framework to provide recommendations regarding indoor air quality in homes. While such a model may not describe what is actually occurring in a detailed, dynamic model of a home, a generalized model, with its simplicity, may be effective in capturing the overall average impacts and trends. Such a simplified model could be used to supplement existing detailed modeling and data collection efforts to help bring about a greater understanding from the growing body of literature on indoor air quality in homes. The model may also expand the use of generalized models, such as ASHRAE 62.2, to describe how to improve indoor air quality in homes and inform recommendations regarding more effective strategies and tradeoffs. This type of more simplified information may be used to inform guidance and standards addressing indoor air quality in residential buildings and can serve as a decision-making tool for building industry professionals responsible for specifying ventilation systems in homes.
1.2. Theory
Indoor air pollutants are introduced by a variety of sources, including building materials or activities within the building, mold growth, combustion appliances, and outdoor pollutants [16]. In general, contaminants enter the indoor air from three locations:
- Indoors: Indoor contaminants are introduced periodically as a result of occupant activities (e.g., cooking, cleaning, showering, painting, crafts, etc.) or may be continuously emitted from materials and furnishings in the building (e.g., carpeting, cabinets, drapes, new furniture, etc.). Common sources of building-related pollutant sources consist of paints, adhesives, carpets and fabrics, stored pesticides or cleaning products, synthetic building materials, and indoor combustion sources [16,17,18]. The indoor air pollutants most commonly associated with building materials and building-related activities are formaldehyde and volatile organic compounds (VOCs), while indoor combustion presents a significant source of VOCs and particles [18,19].
- Outdoors: Outdoor contaminants can be introduced incidentally into the building through natural and/or mechanically-induced air infiltration, as well as intentionally as part of the mechanical ventilation system. Typical pollutants in outdoor air include smog (NOx, SOx, and ozone), particulates (dust, allergens, molds), and toxins (accidental or intentional releases) [1]. (While accidental or intentional release of toxins are a real threat to air quality, both indoor and outdoor, such events tend to be infrequent and result in short-duration acute exposures. This research aims to address those chronic contaminants that are generally found in indoor and outdoor environments and, therefore, does not address protection against the infrequent release of large quantities of toxins in the environment or other periodic extreme events (e.g., wildfires).) Radon, is also a known indoor air contaminant that originates outdoors.
- Interstitial or unconditioned spaces: Some contaminants can be introduced into the indoor air from components or spaces that are part of the building (e.g., garages, crawlspaces, attics, and the building envelope itself). In this case, the contaminant of concern may or may not have originated in the space, but it is introduced into the indoor air via such adjacent unconditioned spaces. The type of contaminants found in these locations will vary based on the space; VOCs, moisture, and particles are the most common indoor air contaminants introduced from adjacent interstitial or unconditioned spaces.
For any given air contaminant i, regardless of the source, the average, steady-state concentration of the contaminant indoors for a steady-state, fully mixed airspace may be modeled as:
where Ci is the concentration of contaminant i in the indoor air, ST,i is the sum of the source strength or rate of introduction of contaminant i in mass per time from all sources (SA,i, SP,i, and SO,i, as defined in the next paragraphs), V is the volume of the space, and N is the air exchange rate in air changes per time [14]. As volume (V) of the space/building is constant for a given home, the concentration of any contaminant can be reduced by decreasing the source strength (ST,i) or increasing the air exchange rate (N). Note that the product of the volume (V) of the space/building and the air exchange rate (N) can also be expressed as the flow rate of outside air into the space (Q) in volume per unit time (e.g., m3/h). While the model presented in Equation (2) is developed based on steady-state mass balance equations, this article hypothesizes that such can be applied to a population of homes to understand general, aggregate responses of contaminants to certain mitigation approaches and the efficacy of those mitigation approaches over sufficiently long time scales (a period of seven days is evaluated in this study) The authors acknowledge that the nature of contaminant introduction is dynamic nature and that several additional variables, such as secondary reactions, the dependency of emission rates on ambient conditions, and contaminant-specific deposition rates, would be necessary to accurately model the concentration of a given contaminant in a home at any given time. However, this article proposes that the simplified model proposed in Equation (2) can, for the purposes of describing long-term aggregate responses, be applied to large populations of homes to model the relative concentration response independent of the specific reaction and deposition conditions experienced in each home and over a period of at least one week, such that the average concentration approaches or can be approximated as steady-state.
The source strength, in this context, refers to the rate at which any given contaminant is introduced into the space. For some indoor contaminants and contaminants from adjacent interstitial or unconditioned spaces, such as building materials, the emission rate can generally be modeled as:
where SA,i is the source strength of areal contaminant i, Ei is the emission rate in mass per unit surface area of contaminant i per time and Ai is the surface area of source containing the contaminant i that is in contact with the indoor air (or ventilation air). Therefore, the source strength of any contaminant i can be reduced by decreasing the emission rate of the contaminant from these areal sources, or decreasing the surface area of the contaminant that is in contact with the indoor air or ventilation air. Research has shown that that some contaminants may have emission rates that depend on the concentration of that contaminant in the air, the ambient temperature and relative humidity, or other factors [1,2,8,13].
For other indoor contaminants, the source strength is not surface area dependent, but may depend on some other mechanism (e.g., the rate of vaporization or combustion for showering or cooking, respectively).
where SP,i is the source strength of point source contaminant i, qi is the emission rate in mass of contaminant i per time and ki is an arbitrary variable for each source of contaminant i that describes the intermittency or other dependency of the emission rate.
For most outdoor contaminants, the source strength is a function of the concentration of the contaminant in the outdoor air and the rate of introduction of outdoor air:
where SO,i is the source strength of outdoor source i, N is the air exchange rate in air changes per hour, Cout is the concentration of contaminant in the outdoor air in mass per unit volume, and F is the rate of filtration or removal of the contaminant from the outdoor air. In this equation, F may be unitless, when calculated as the ratio of the concentration of contaminant i in the air after the filtration or removal apparatus over the concentration of contaminant i in the outdoor air. The variable F may also be thought of as the single-pass efficiency of the removal or filtration apparatus, presented as a decimal. It is important to note that, for outdoor contaminants, the air exchange rate is now in the numerator and increased air exchange will lead to increases, rather than decreases in the source strength of these contaminants.
Similarly, the air exchange rate (N) is a combination of both natural and mechanically-induced air flows. Natural air flows are primarily due to stack effect (the stack effect describes air flow induced by temperature differentials between indoor and outdoor air due to conditioning of indoor air or solar heat gain) and wind, while sources of induced air flows include intentional ventilation systems and natural or induced draft combustion appliances [1].
Therefore, it is hypothesized that a simplified model can be created to model the concentration of any contaminant in the indoor space, accounting separately for the three primary sources of contaminants:
where Ci is the total concentration of contaminant i in the conditioned space, CA,i is the contribution to the total concentration of contaminant i from surface area-dependent contaminant sources, CP,i represents the non-surface area-dependent indoor contaminant sources, and CO,i represents the contaminant sources that are dependent on the outdoor air concentration of that contaminant.
Based on the previous analysis regarding determination of the sources and the general equation for concentration as the source strength over the volume of the space and the air exchange rate, the equation can be further expanded as follows, with all variables as defined previously:
In the expanded equation, the first term addresses surface-area related contaminants, the second term addresses point source contaminants, and the third term addresses outdoor contaminants. As can be seen in Equation (7), concentrations of indoor air contaminants can be reduced in two primary ways: (1) minimizing sources of the contaminants; and/or (2) providing effective removal of the contaminants, which may include removal via dilution as in whole-house ventilation. Due to the varied mechanisms for introduction of source contaminants, the mechanism for reducing the source strength or removing the contaminant may vary based on where the contaminant originates and/or how it is introduced.
The relationship between contaminant concentration and effective mitigation or reduction strategies is complicated by the fact that many contaminants have multiple sources, some of which are dependent on additional variables, such as temperature and relative humidity. In addition, many contaminants are highly influenced by occupant behavior, which makes detailed, home to home comparisons difficult. This generalized model makes a number of simplifying assumptions to develop an approach that may provide a useful tool for understanding and comparing results from various studies and for decision-making in the residential building construction and retrofit industry. Specifically, we propose that the generalized model can be used to describe and compare the relative efficacy of different indoor air quality approaches for different contaminants of concern. The model does not purport to investigate the mechanism of concentration response; merely to describe the relative response, which can be used to make generalized recommendations regarding effective indoor air quality approaches to employ for different contaminants.
It is worth pointing out that a number of criteria can be used to evaluate the “efficacy” of different indoor air quality mitigation approaches and there are currently no clear and comprehensive criteria for determining the acceptability of indoor air [1]. While establishing quantitative criteria for evaluating indoor air quality is outside the scope of this research program, we assume that reducing indoor concentrations of identified contaminants can be viewed as positively impacting indoor air quality. Therefore, this study evaluates the efficacy of different indoor air quality improvement approaches at decreasing the concentrations of indoor air contaminants in homes.
2. Materials and Methods
This article evaluates the validity of the simplified model previously described by applying field data of two common indoor air constituents in homes: carbon dioxide (CO2) and formaldehyde. CO2 and formaldehyde were chosen for the initial validation because they are contaminants that are commonly found indoors with generally well-understood sources. The authors acknowledge that, while CO2 is not necessarily a “contaminant” of indoor air in the concentrations usually observed in homes, it is a useful indicator for effective ventilation and dilution of other contaminants with similar sources that may have more harmful health impacts [1]. All uncertainty is calculated as the 95 percent confidence interval assuming the student’s t-statistic applies. However, the authors acknowledge that given the size of the samples, the assumptions of normally distributed values and large sample size to not hold. Therefore, the descriptions of uncertainty are meant to give an indication of the strength of an observed trend, but should not be treated as unequivocal determinations of significance in the statistical sense.
2.1. Data Source
The validation is based, primarily, on data from a previous study which evaluated the impact of two ventilation strategies on energy use, temperature, relative humidity, indoor air quality contaminant levels, and comfort [2]. The data were gathered in 10 homes in Gainesville, FL that were all newly occupied in the 2009–2010 time frame, are in the same subdivision, have similar specifications, and were built to Builders Challenge 1.0 guidelines. (The Builders Challenge was a program sponsored by the U.S. Department of Energy’s Building America Program to promote high-performance new homes and new homebuilders. Since the construction of the study homes, this program has been revised and renamed it is now referred to as the Zero Energy Ready Home (ZERH) program: http://energy.gov/eere/buildings/zero-energy-ready-home.) The two ventilation strategies compared are a continuous exhaust ventilation (CEV) strategy to a runtime ventilation (RTV) strategy that varied in terms of amount of ventilation air and the strategy to deliver that air. The CEV strategy removed approximately 60 cfm (102 m3/h) of conditioned air 24/7 via an exhaust fan in a central bathroom and relied on natural and mechanically-induced infiltration to introduce dilution air. The RTV strategy supplies approximately 35 cfm (59 m3/h) of outdoor dilution air directly to the air handler when the air handler is operating which is then distributed about the house through the homes ductwork.
The study design grouped the homes into two cohorts: Flip-flop homes and control homes. The first cohort of homes consisted of six of the 10 homes that were flip-flopped between the two ventilation strategies approximately every 2 weeks. The second cohort of homes consisted of two homes that remained in the RTV configuration throughout the study period and two homes that were maintained in the CEV configuration throughout the study period. This study design allows for the effects of individual occupants, inconsistencies between the homes, as well as the impact of climate, outdoor concentrations, or other biasing variables to be identified and accounted for in the analysis.
Table 1 outlines the key characteristics of the homes.
The data set consists of over a year of continuous data of space-conditioning energy use, indoor temperature, indoor relative humidity (RH), and outdoor conditions, as well as seasonal sampling of indoor air quality contaminants, including formaldehyde, acetaldehyde, total and speciated volatile organic compounds, and nitrogen dioxide (NO2) in the homes. (Not all 10 homes participated throughout the entire study due to extenuating circumstances (i.e., sale of home, birth of twins, and extended vacation).) The indoor air quality samples represent average concentrations over a seven-day period taken with passive methods. The indoor air quality samples were taken twice each season, once in each ventilation mode for the flip-flop cohort and twice in the same ventilation mode for the control homes. The flip-flop homes allow for comparison of the differences between continuous exhaust and runtime. In the control homes, each week-long sampling period can be compared to give an indication of the consistency of measured concentrations within each season in addition to the comparison between seasons. Indoor air quality sampling occurred in the second week of a two-week ventilation period (to enable achievement of equilibrium). One-week sampling periods were chosen to characterize longer-term exposures in homes, including any weekly or daily variations. While the passive sampling method does not allow for quantifying the time-dependent variation of these parameters, the average long-term impact of any increased or decreased concentrations are reflected in the weekly time-averaged sample and lends itself to the average analytical approach proposed by the general model discussed in Section 1.2 [2] contains more details regarding the passive samplers used and quality assurance methods applied to data collection.
All subjects who participated in the study gave their informed consent for inclusion before they participated in the study. The study was conducted in accordance with the Declaration of Helsinki and the protocol was approved by the Institutional Review Board of Pacific Northwest National Laboratory (IRB No. 2013-15), with review and approval also granted by the Washington State University Human Subjects Protection Program.
2.2. CO2 Analysis
The simplified model was first evaluated based on CO2, which is an indoor air quality constituent with both outdoor and point sources, but essentially no surface-area-dependent sources. That is, CO2 is introduced from outdoor air, as well as people in the space and cooking or other combustion events. In the FL data set, the CO2 concentrations indoors and outdoors, as well as the volume and air exchange rate in each home is known. Therefore, the only unknown variable in the overall concentration equation described in Equation (7) for any given home is the point source emission strength, as shown in Equation (8):
where H is the specific home, #occ is the number of occupants in the home and all other variables are as defined previously.
As shown in Equation (8), in the case of CO2, the point source emission term (qCO2) is assumed to be a function of the number of people in the home [22]. Indoor sources include breathing and cooking, which will generally increase with the number of people in the home. Of course the specific CO2 emission rate of each person will vary from person to person and over time based on the activity level of the individual, how often they are home, how much the family cooks, etc. However, on average, the point source emission rate of CO2 is assumed to be constant in a given home and roughly correlated to the number of occupants in the home [22]. That is, in order to normalize the point source emission rate over a population of homes, it is assumed that over a large number of homes and long periods of time, the CO2 emission rate per person should be roughly constant. This allows the qCO2 term to be normalized by the number of occupants in each home and compared across the population of homes. Similar approaches are currently employed in ASHRAE Standard 62.2 and the U.S. Green Building Council’s Leadership in Energy and Environmental Design program in specifying required mechanical ventilation rates [3,19].
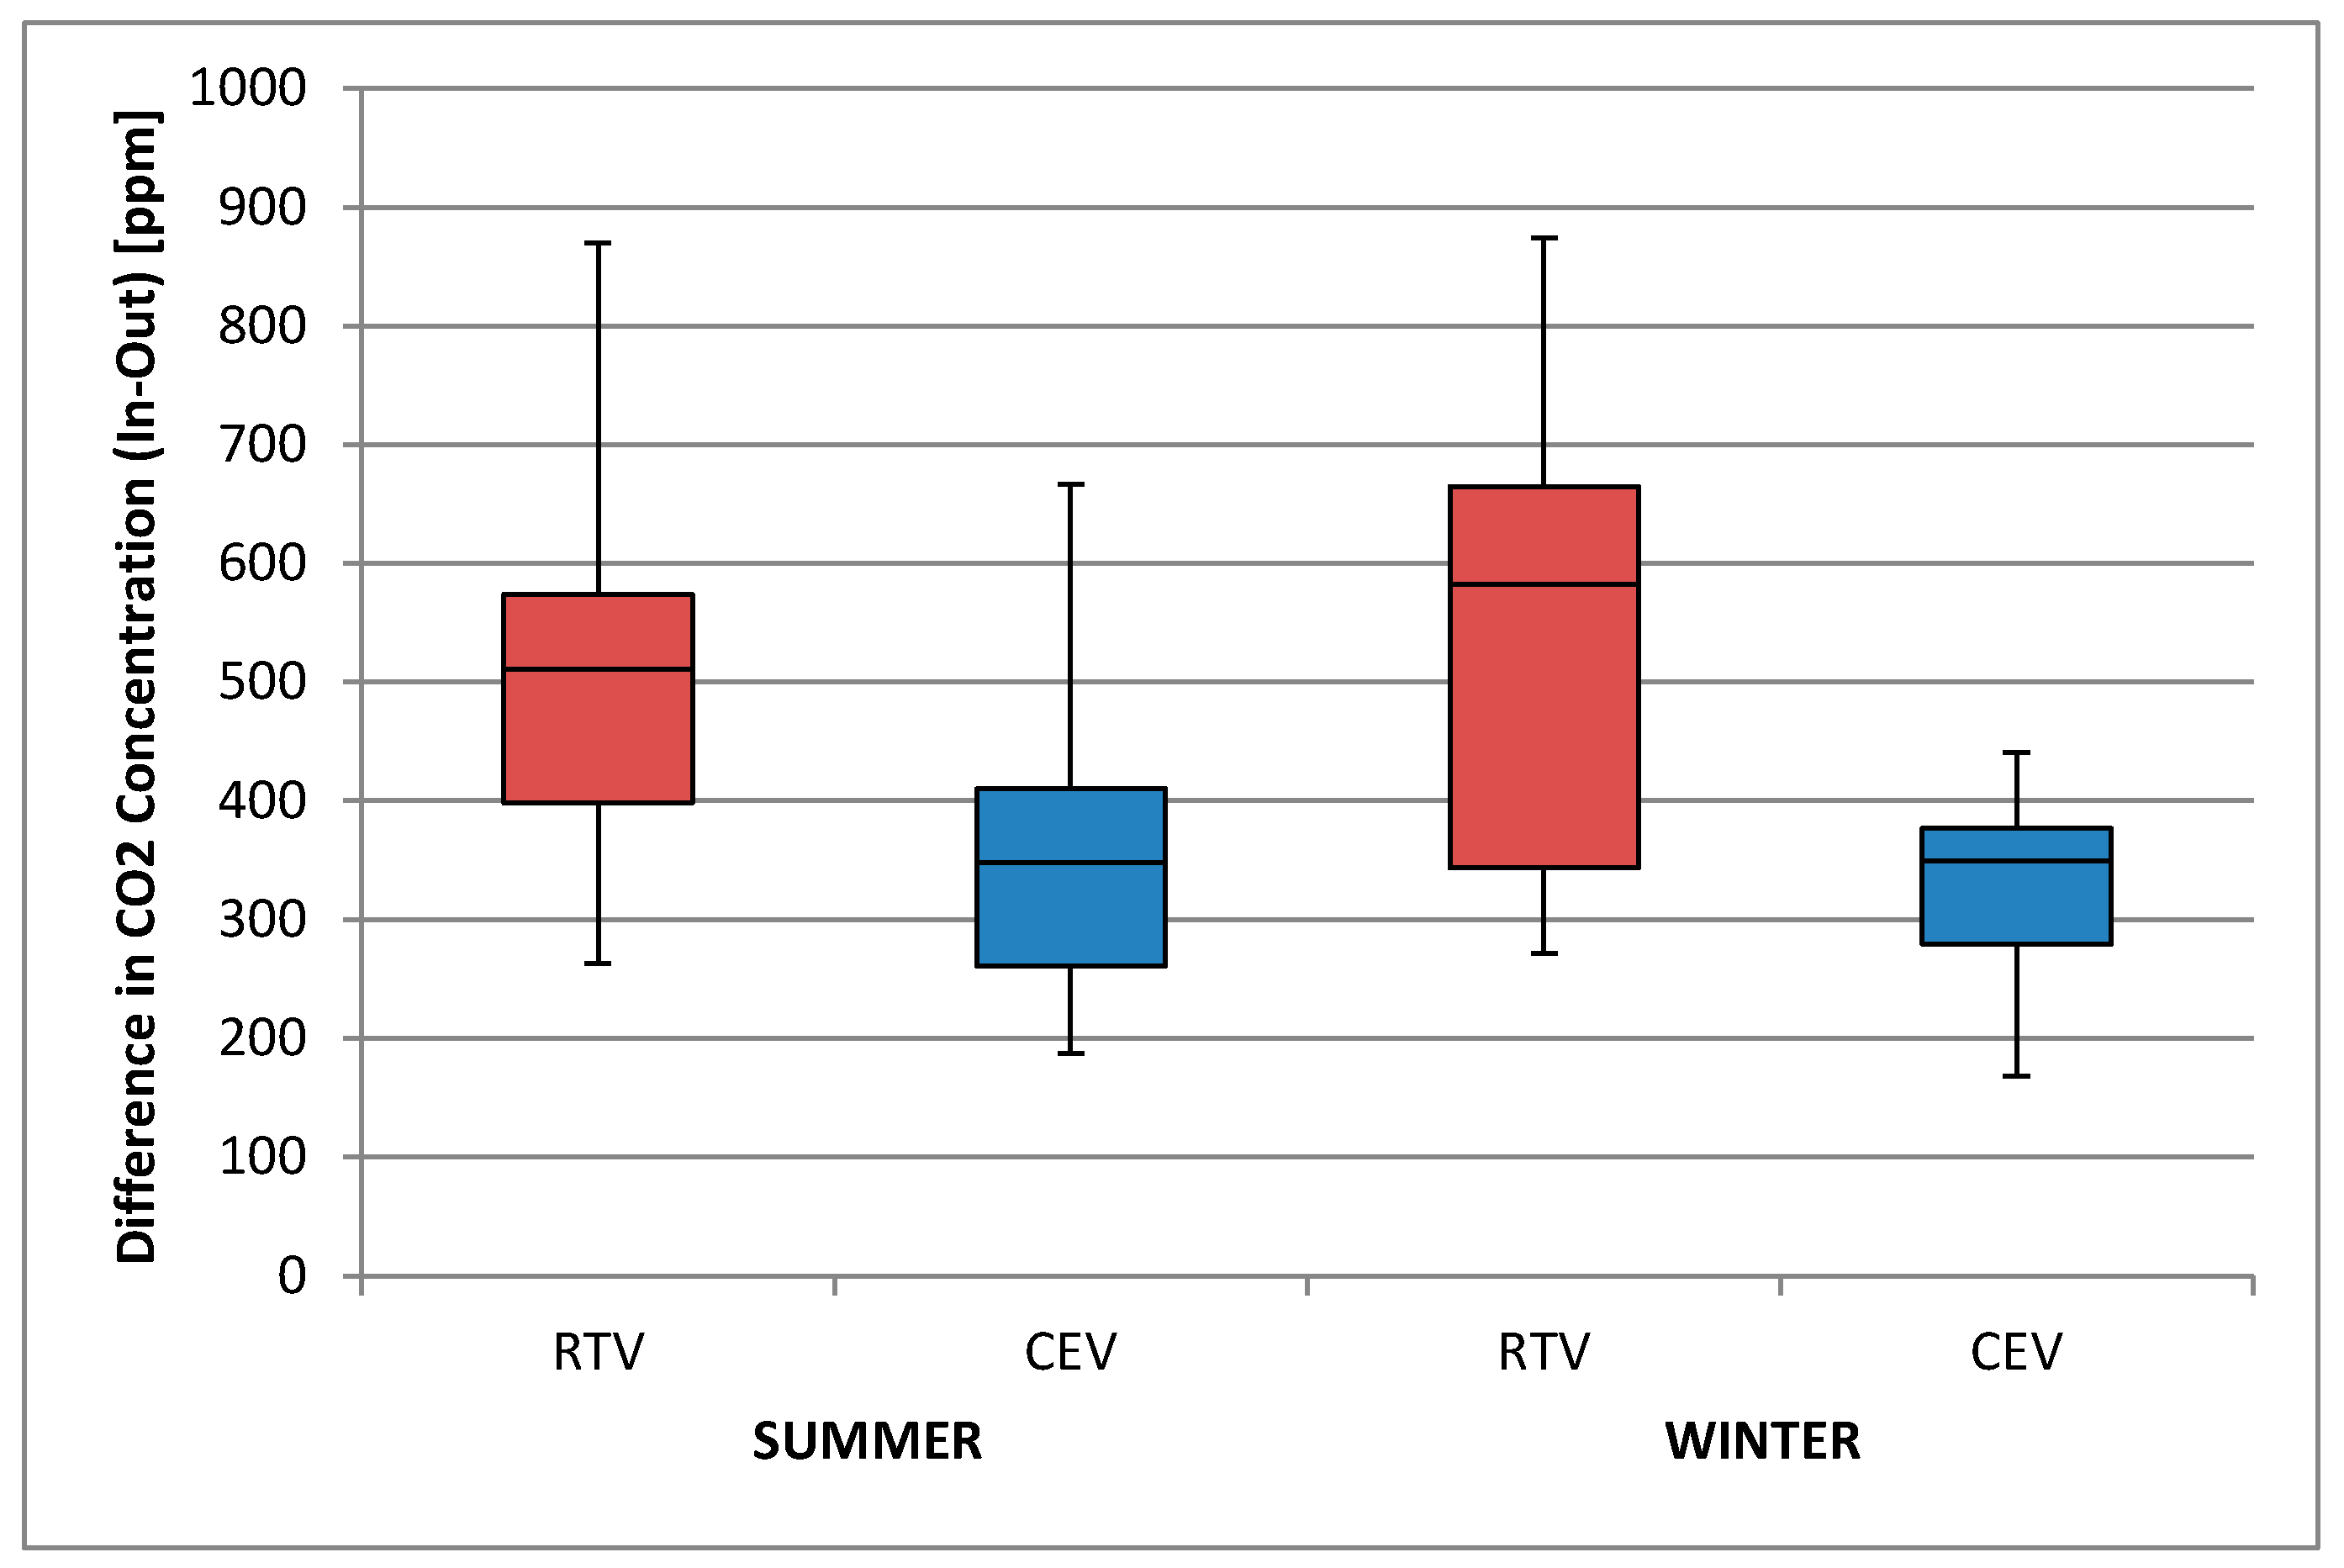
Therefore, for constant V and qCO2, the concentration of CO2 can be decreased by increasing N, the air exchange rate. Consistent with this understanding, the Gainesville data suggest significant differences between CO2 concentrations as a function of ventilation system approach, as shown in Figure 1.
The CO2 data suggest that the continuous exhaust ventilation approach may result in a greater air exchange rate, where the continuous exhaust ventilation approach employed a higher ventilation rate than the runtime ventilation approach. The data from the Gainesville study can be applied to Equation (8) directly to determine and compare the average per-person emission rate of CO2 in each cohort of homes, in each season (winter or summer) or over the entire data set. We suggest that if the per-person CO2 concentration is not be statistically different between the ventilation strategies, as we would expect, this would validate the application of the generalized model to real world indoor air quality data for a simple contaminant, such as CO2.
2.3. Formaldehyde Analysis
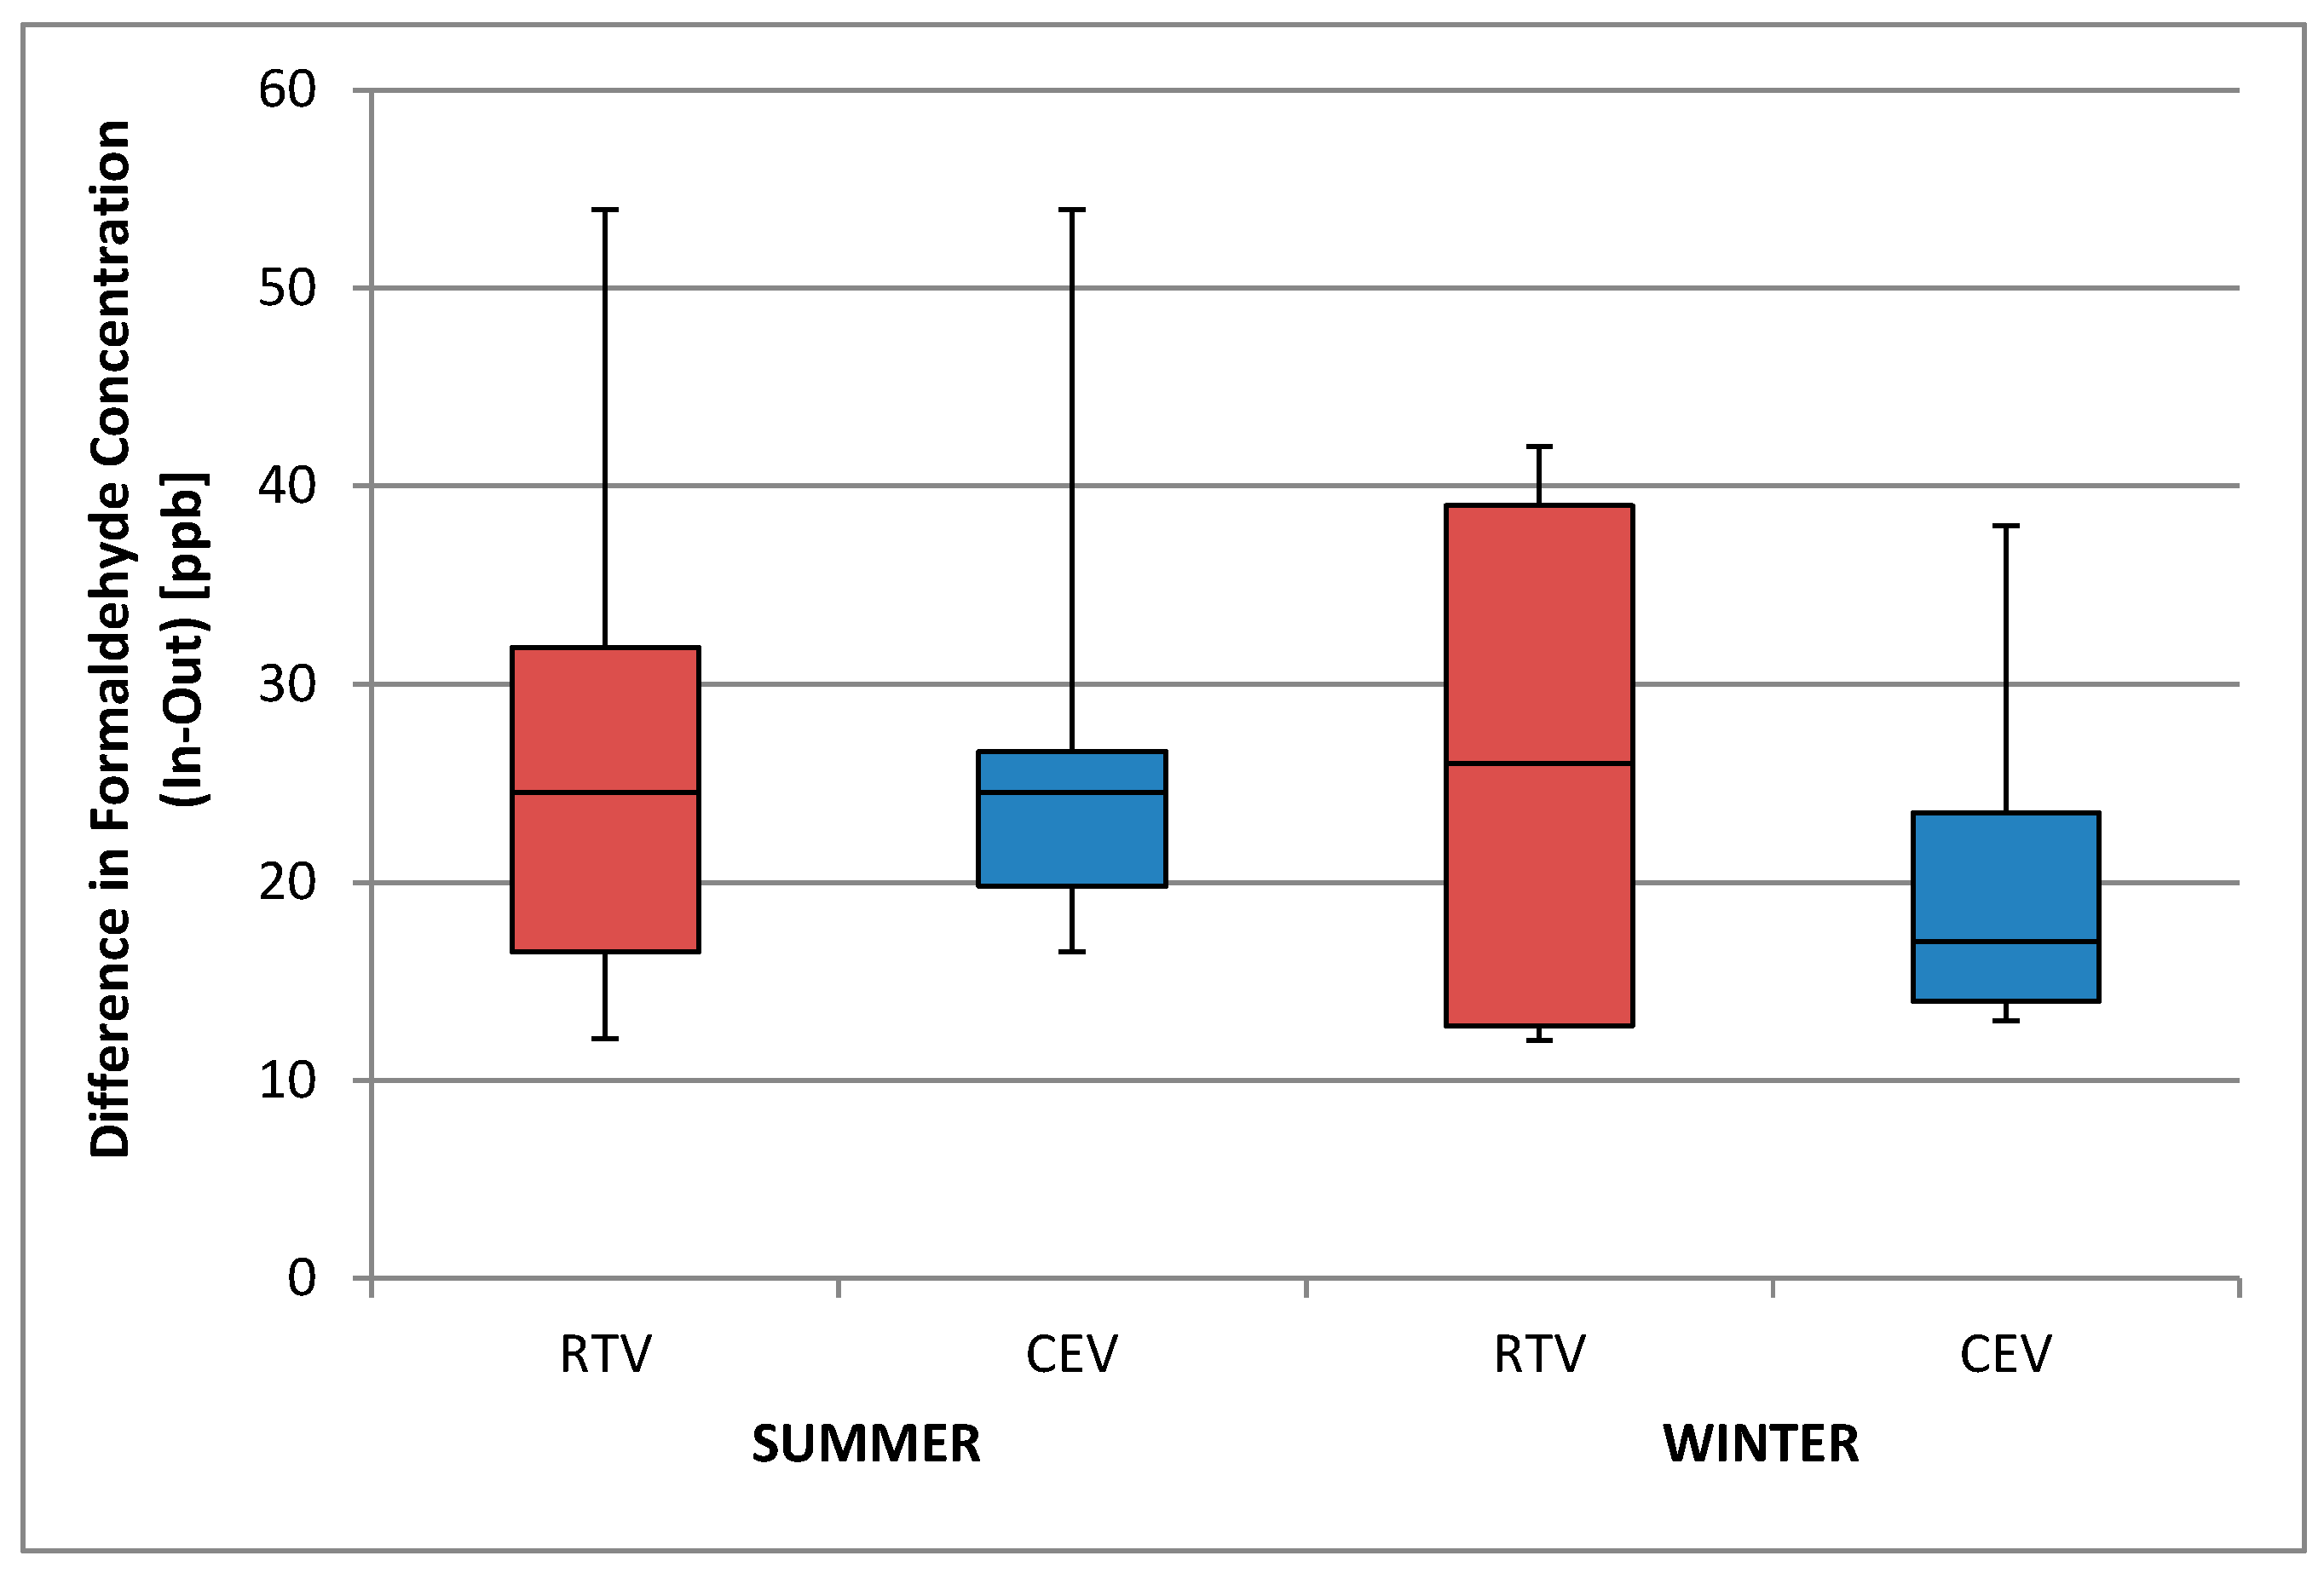
The formaldehyde data collected in the Gainesville study do not demonstrate a similar consistent reduction in concentration associated with the higher flow rate, continuous exhaust ventilation approach, as shown in Figure 2. This may suggest that, for formaldehyde, which is likely to have surface-area dependent sources, the indoor air quality mitigation strategy may impact the emission rate or exposed surface area for that contaminant.
By applying Equation (7), the impact of the different ventilation strategies on formaldehyde can be evaluated directly. Specifically, the overall concentration equation can be modeled in each home based on the following known variables: indoor and outdoor concentration of formaldehyde, the house volume and air change rate, the number of occupants, the surface area of formaldehyde-containing components, and ventilation system effectiveness from the CO2 analysis. This leaves the surface-area-related emission rate (EHCHO) and point source emission rate (qHCHO,H) as unknown variables in the equation, shown in Equation (9). Note that, for formaldehyde, there are outdoor, surface area, and point sources of formaldehyde.
Equation (9) can be evaluated for each home, season, and/or for each ventilation type to simultaneously determine the surface-area-related and point source emission rates in each evaluation period. Such analysis is accomplished via linear regression of the unknown variables where the term on the left hand side of Equation (9) is regressed against the surface area normalized based on the number of occupants and ventilation effectiveness. The slope of the resultant line is the surface-area-dependent emission rate and the intercept represents the per person point source emission rate of formaldehyde. Note that the point source emission rate for formaldehyde is also assumed to scale based on the number of occupants in the home (). As the typical point sources of formaldehyde are related to occupant activities (e.g., cooking and cleaning), it is reasonable to assume that the formaldehyde emission rate would also increase or decrease based on the number of occupants. However, the authors acknowledge that this relationship is less direct than for CO2 and different homeowners may employ different amounts of formaldehyde-containing materials based on their activities and lifestyle choices.
3. Results and Discussion
The determined air exchange rate (mechanical and natural), CO2 concentration, and formaldehyde concentration for each of the ventilation systems (RTV and CEV) are summarized in Table 2. As shown in the table, the continuous exhaust ventilation system provided an 80 percent higher air exchange rate than the runtime ventilation system. This resulted in a 40 percent reduction in measured CO2 concentrations, which is approximately inversely proportional to the air exchange rate. However, the formaldehyde concentration was not similarly affected.
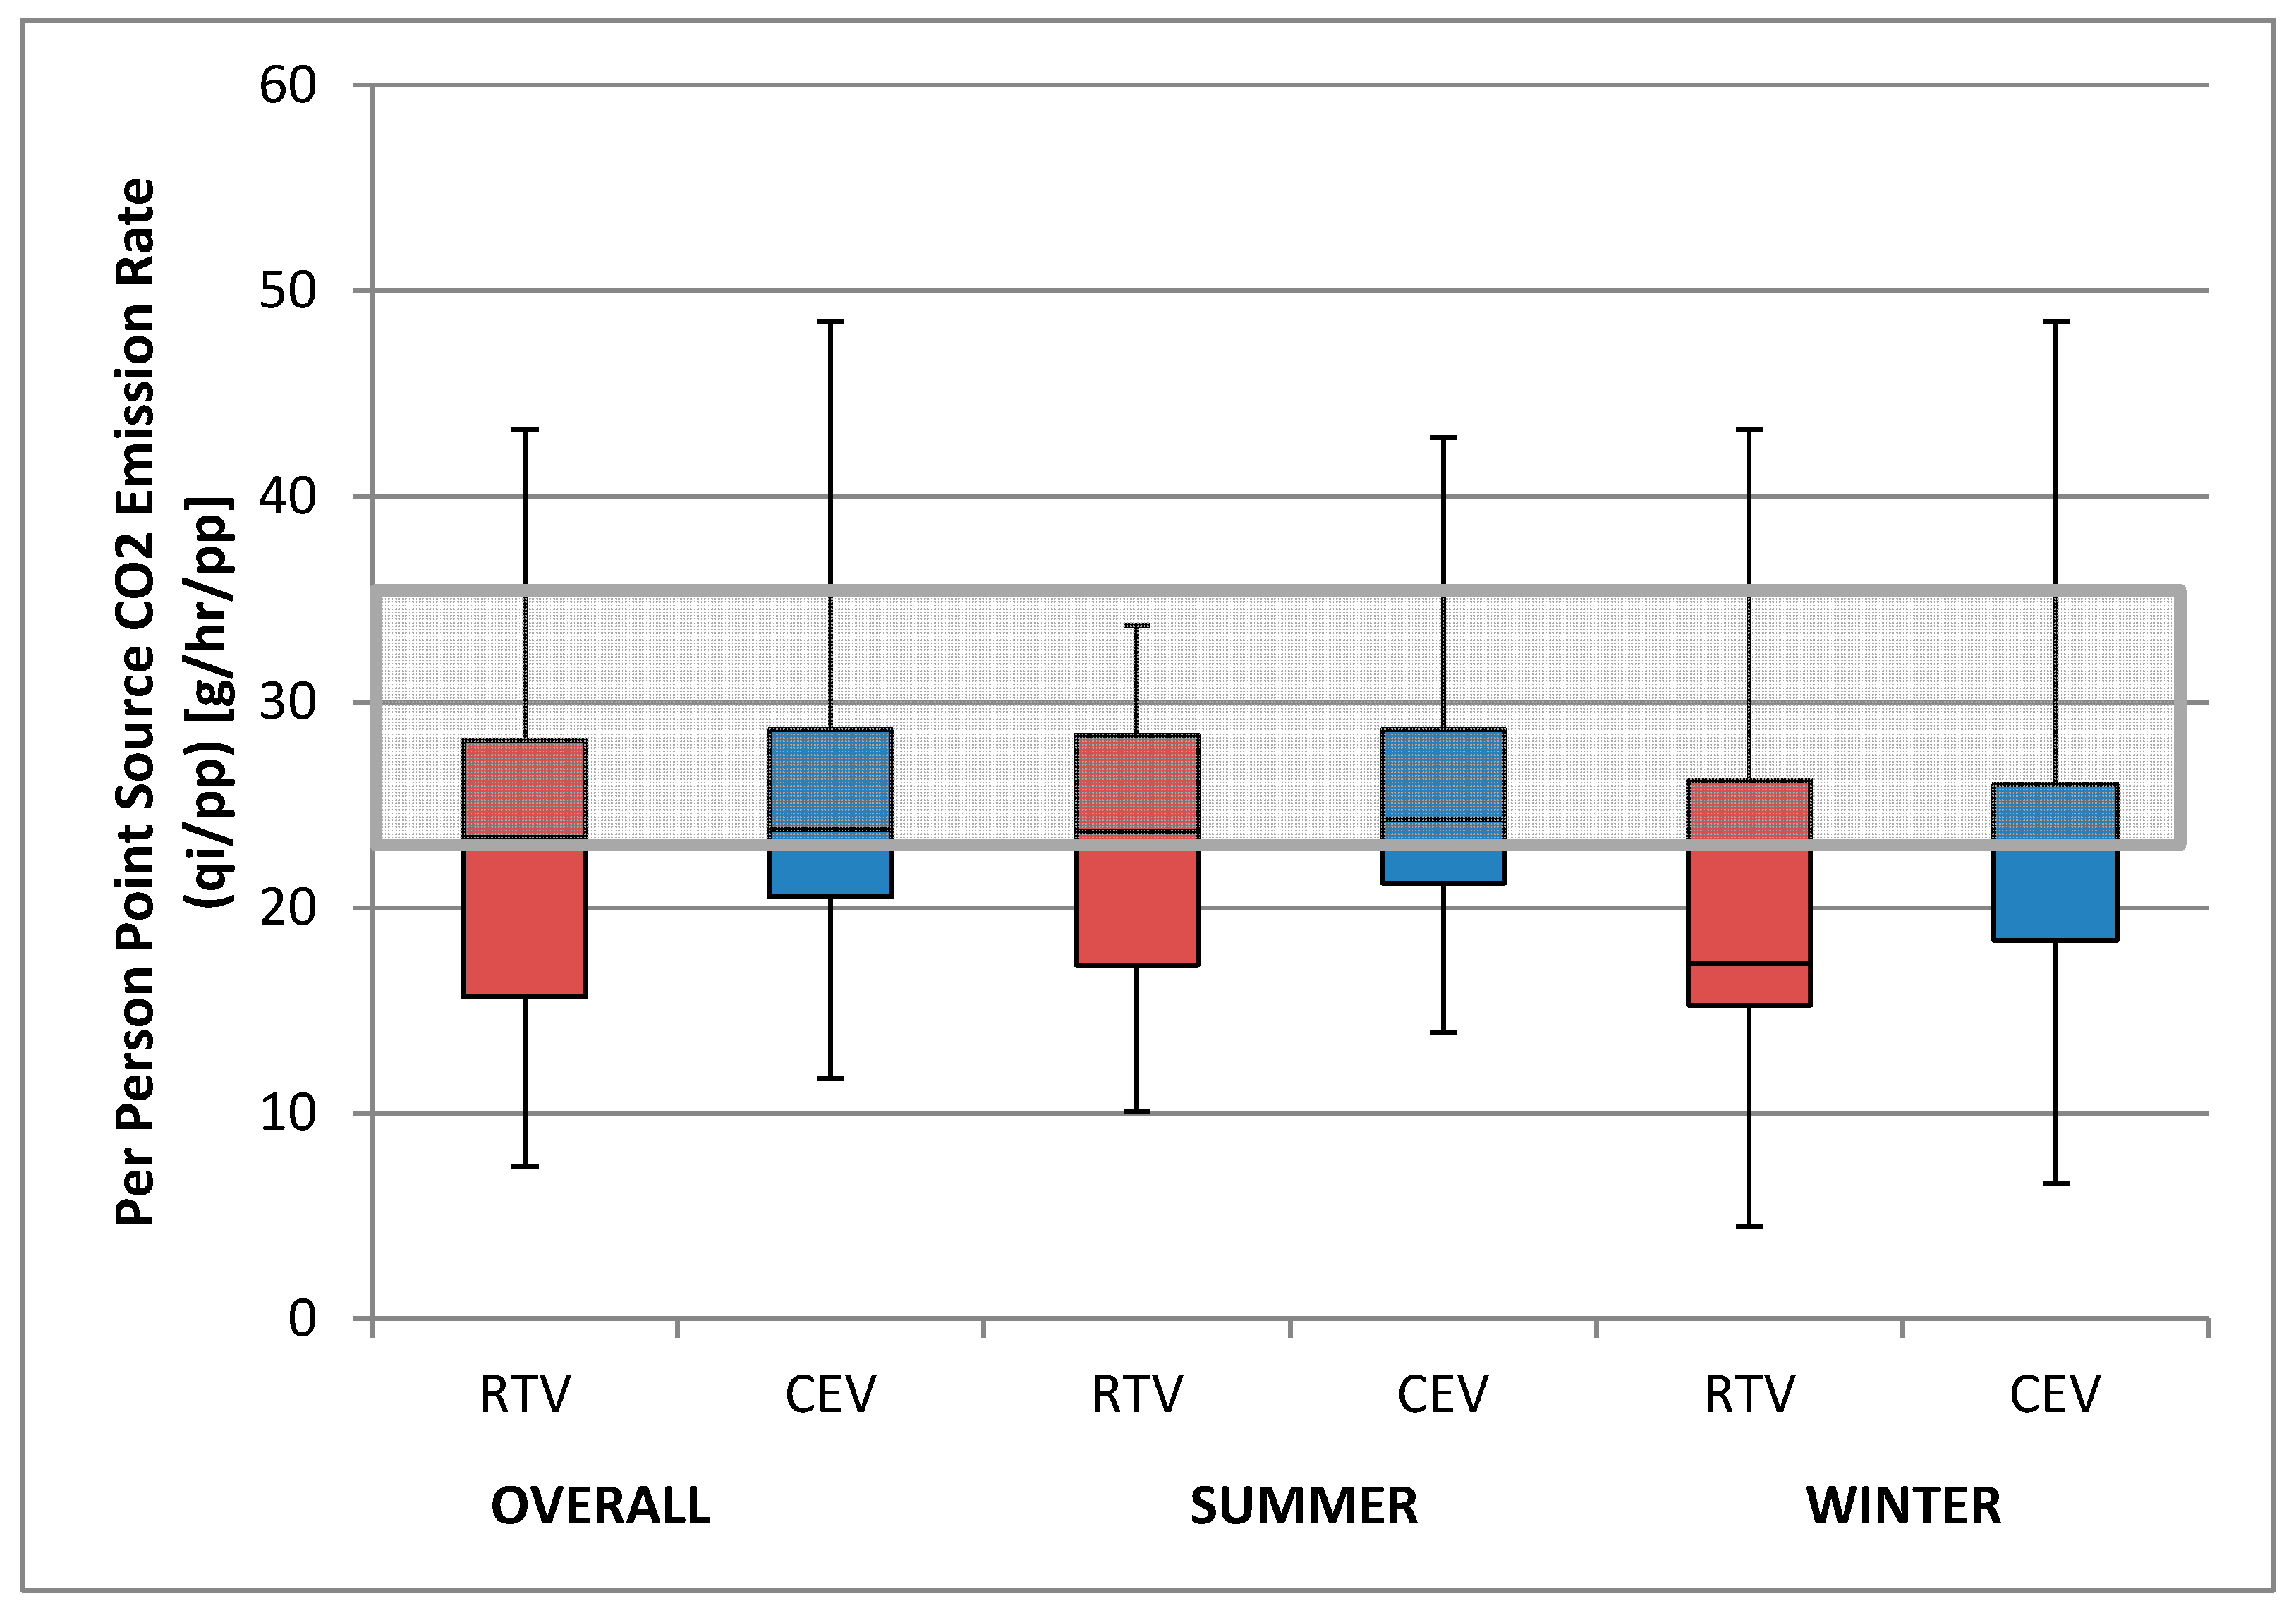
The simplified model shown in Equation (7) was applied to CO2 data for each house, season, and for each ventilation approach. That is, an individual per-person CO2 emission rate (i.e., ) was found for each data point from the Gainesville data. While a generalized equation should also be valid for average data, it is more precise to evaluate the equation based on individual homes, since the volume and number of occupants is specific to each home. On this basis, the per-person CO2 emission rate was not found to be significantly different at the 95 percent confidence level between continuous exhaust and run-time ventilation strategies when accounting for the difference in theoretical air exchange rate, as shown in Figure 3. In addition, the average per person point source emission rate of CO2 corresponds well with average CO2 emission rates for a person at rest of 24–37 g/h/pp at standard temperature and pressure [23].
The application of the Gainesville data is meant to validate the application of the general theoretical model to real-life situations. The model was found to reasonably estimate the per person CO2 emission rate expected from the literature.
To demonstrate the ability to generalize this analysis approach to larger populations of homes or for “general” data where the specific house volume or occupancy may not be known precisely, the same analysis was done based on the average flow rate (V × N), occupancy, and CO2 concentrations for each ventilation strategy. The average analysis yielded the same results, with per person point source CO2 emission rates within five percent of the values observed based on the home-specific analysis approach, shown in Figure 3. That is, the comparison of “average” and “individual” per person point source emission rates (i.e., was within five percent for both run-time ventilation and continuous exhaust ventilation strategies overall, in the summer analysis period, and, for runtime ventilation, in the winter analysis periods. The continuous exhaust ventilation strategy was nine percent different in the winter analysis period, likely due to the smaller sample size
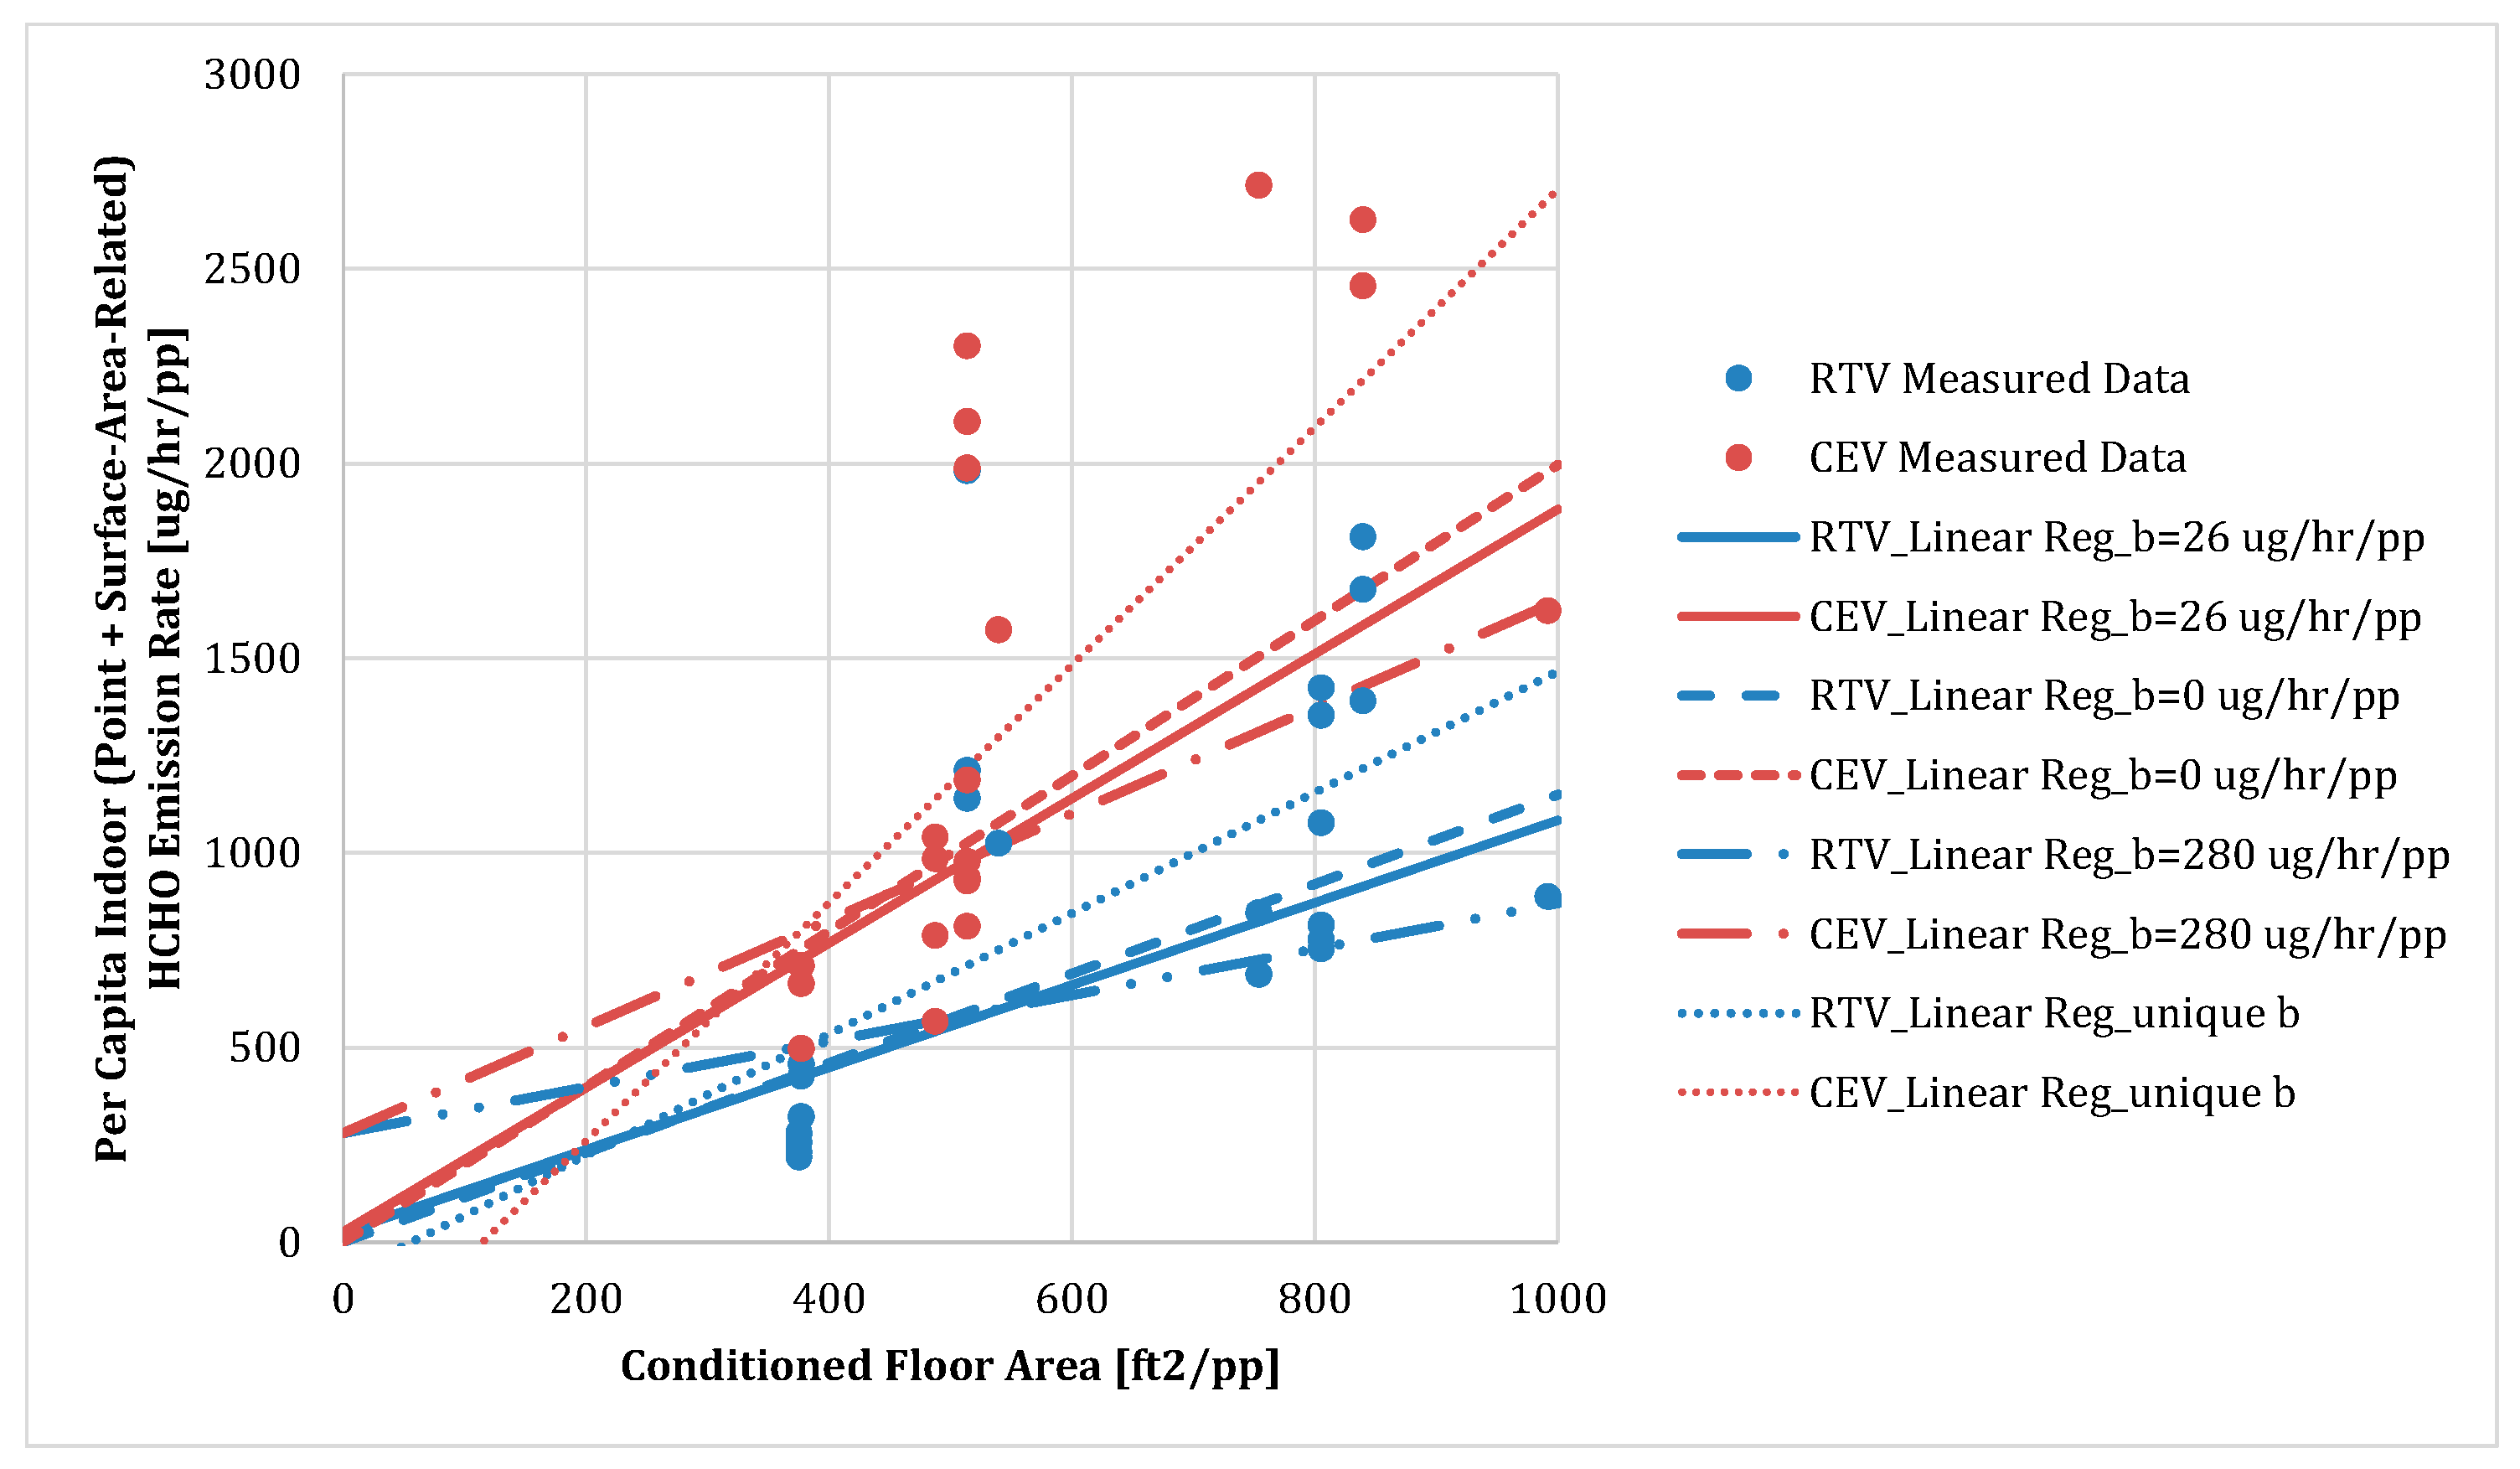
When applying the ventilation source model to formaldehyde, outdoor, point, and surface-area-related sources are accounted for via a linear regression, as shown in Equation (9). However, the per capita emission rate of formaldehyde is not expected to vary based on ventilation strategy. As such, the data are first regressed together to yield an overall per person point source emission rate (y-intercept) for the homes of 26 ± 254 μg/h/pp. Based on this average per person point source emission rate, different slopes are determined for the two ventilation strategies, which represent the surface-area-related portion of the formaldehyde emission rate. This results in two relationships, one for each ventilation strategy, with the same assumed per capita point source emission rate, but different surface-area-related emission rates. Comparing the two equations, as shown in Figure 4 and Table 3, the surface-area related emission rate of formaldehyde was found to be significantly greater in the continuous exhaust ventilation homes, as compared to the home with the runtime ventilation strategy. Specifically, the ratio of surface-area-related emission rates (CEV/RTV) was found to be 1.75 ± 0.53, as shown in Table 3.
Significant variability was observed in the per person point source emission rate (y-intercept), suggesting significant variability in the per person point source emission rates of formaldehyde. To test the sensitivity of the findings on the magnitude of the per person point source emission rate, the analysis was performed with various y-intercepts, including the minimum theoretical per person point source emission rate (0 μg/h/pp), the maximum value likely to be observed in this population of home (i.e., the average plus the standard error of the y-intercept, or 280 μg/h/pp), and unique per person point source emission rates determined uniquely for each ventilation strategy. Note that 0 μg/h/pp is the most theoretically consistent value, as one would expect zero formaldehyde emissions at zero floor area and occupancy, and the average value (26 ± 254 μg/h/pp) is not statistically different than zero. The unique per person point source emission rate analysis tests the sensitivity of the result to the assumption that the per person point source emission rates are the same among the population of homes. These sensitivity analyses showed that the magnitude of the y-intercept did not significantly affect the emission rate ratio observed between runtime ventilation and continuous exhaust ventilation strategies, as shown in Figure 4. That is, the continuous exhaust ventilation strategy consistently yielded higher surface-area-related emission rates than the runtime ventilation strategy. The equations for the various regressions and associated uncertainty are provided in Table 3.
The analysis of formaldehyde emission rates was also performed for each ventilation strategy overall and seasonally. Similar results were observed in each season, with the emission rate of formaldehyde significantly higher in the homes with continuous exhaust ventilation than that in the runtime ventilation homes, demonstrating the consistency of the finding in all analysis periods, as shown in Table 4.
One cause of the elevated surface-area-related emission rates in the continuous exhaust homes could be the higher ventilation flow rates, as formaldehyde has been observed to be a constant concentration pollutant source where decreasing concentrations are associated with increased emission rates. For example, Willem et al. [8] has observed a 27 percent average increase in formaldehyde emission rate associated with approximately doubling the ventilation rate, although significantly variability was observed home to home. A range of (–10) to 150 percent increase in formaldehyde emission rates was observed for a range of ventilation rates in the nine homes evaluated in the study, likely due to the variability of materials and formaldehyde sources in these homes. The results from the Gainesville data analyzed in this study are generally consistent with the findings of [8], observing similar increases in emission rates, as shown in Table 5.
However, the Gainesville study shows slightly higher increases in formaldehyde emission rate than that observed in Willem et al. [8], as Willem et al. [8] isolated the impact of ventilation rate, increasing the amount of ventilation air provided with the same ventilation strategy. The results based on the Gainesville data suggest that ventilation strategy may also influence the overall efficiency of ventilation systems and that, despite significantly higher ventilation flow rates, the continuous exhaust ventilation strategy was not more effective than the runtime ventilation strategy at diluting formaldehyde concentrations. This result is consistent with other research that has analyzed different ventilation system types. Specifically, Hun et al. [9] have also observed reduced efficacy of exhaust-only ventilation in reducing formaldehyde concentrations. Another study measured lower formaldehyde concentrations in a study house ventilated with the supply-based continuous fan integrated supply (CFIS) system than in the same house when ventilated with an exhaust fan and similar effective ventilation rates [10]. The fact that a lower than expected emission rate ratio (RTV/CEV) was observed in the Gainesville data could be due to the fact that the continuous exhaust ventilation system results in increased building depressurization that leads to in an increase in formaldehyde-containing surface area that is exposed to the incoming air stream. Building depressurization caused by the continuous exhaust system may also result in increased temperature and relative humidity in those adjoining spaces, or both. This study did not explore the cause of the difference in observed emission rate.
4. Conclusions
By applying the generalized model to the Gainesville data, the continuous exhaust ventilation strategy was observed to result in an 80 percent higher air exchange rate, which had the desired effect of reducing CO2 concentration by approximately 40 percent, as compared to the runtime ventilation strategy. The CO2 response was observed to be approximately inversely proportional to the change in air exchange rate. This indicates that the two ventilation strategies did not have a significant difference in their “effectiveness” at diluting CO2, assuming a relatively constant per person point source emission rate of CO2, meaning that both ventilation strategies resulted in approximately the same concentration reduction per cfm of dilution air. The per person point source emission rate determined from applying the general model to the measured data agrees reasonably well with the literature values for per person CO2 emission rates for persons at rest, validating the integrity of the simplified model in predicting the behavior of contaminants based on limited input information for a simple contaminant, such as CO2.
Applying the generalized model to the formaldehyde data, the Gainesville data agreed with previous studies that an increase in ventilation rate resulted in an increase in surface-area-related formaldehyde emission rate due to the concentration-dependence of formaldehyde [8]. However, the difference between the runtime ventilation and continuous exhaust ventilation strategies observed in this study of 75 ± 53 percent was greater than that observed by [8], potentially because it also accounted for the decreased efficacy of continuous exhaust ventilation at reducing formaldehyde concentrations. The findings from applying the generalized indoor air quality source model to the Gainesville formaldehyde data illustrate how the model can be used to identify the efficacy of different indoor air quality mitigation approaches at decreasing the concentration of different contaminants of concern even when the data does not include identical air exchange rates or number of occupants. For formaldehyde, the Gainesville data suggest that the continuous exhaust ventilation was not as effective at decreasing interior concentrations of formaldehyde, as compared to the runtime ventilation strategy.
While these initial data contribute to our understanding of the relative efficacy and impact of different indoor air quality measures, including ventilation strategies, they do not provide a comprehensive assessment of any single variable in all housing types or climates, as such is outside the scope of this research program and will likely take decades to collect. However, the model provides a generalized methodology to normalize for different air exchange rates and number of occupants when comparing data from different homes and ventilation systems. Thus, the generalized model proposed in this study can be applied by other researchers in the field to understand and analyze these relationships for additional contaminants and indoor air quality mitigation approaches, as well as to corroborate the results presented here in other climates and situations.
Supplementary Materials
The following are available online at www.mdpi.com/2071-1050/9/7/1149/s1, Table S1: Air Exchange Rate, Table S2: Primary CO2 Data, and Table S3: Primary Formaldehyde Data.
Acknowledgments
The authors would like to acknowledge Eric Martin, Dave Chasar, Janet McIlvaine, and Bryan Amos of the Florida Solar Energy Center, and Ken Fonorow of Florida Home Energy Resources Organization for their contributions to the data collection effort, underlying this analysis.
Funding
The data collection underlying this work was supported by the Department of Energy’s Building America Program. The model development and validation did not receive any specific grant from funding agencies in the public, commercial, or not-for-profit sectors.
Author Contributions
Sarah Widder conceived and designed the experiments, performed the experiments, analyzed the data, and was the primary author on the paper. Liv Haselbach provided technical assistance and review of the data analysis and contributed to the paper.
Conflicts of Interest
The authors declare no conflict of interest. The founding sponsors had no role in the design of the study; in the collection, analyses, or interpretation of data; in the writing of the manuscript, and in the decision to publish the results.
References
- American Society of Heating, Refrigerating, and Air-Conditioning Engineers (ASHRAE). Guideline 24—Ventilation and Indoor Air Quality in Low-Rise Residential Buildings; ASHRAE: Atlanta, GA, USA, 2015. [Google Scholar]
- Widder, S.H.; Martin, E.; Chasar, D.; McIlvaine, J.; Amos, B.; Fonorow, K. Comparative Performance of Two Ventilation Strategies in the Hot Humid Climate; PNNL-24201; Pacific Northwest National Laboratory: Richland, WA, USA, 2017. Available online: https://www1.eere.energy.gov/buildings/publications/pdfs/building_america/65457.pdf (accessed on 26 June 2017).
- American Society of Heating, Refrigerating, and Air-Conditioning Engineers (ASHRAE) Standards Committee. ASHRAE Standard 62.2—Ventilation and Acceptable Indoor Air Quality in Low-Rise Residential Buildings; ASHRAE: Atlanta, GA, USA, 2016. [Google Scholar]
- U.S. Environmental Protection Agency (EPA). Energy Star Qualified Homes, Version 3 (Rev. 07): National Program Requirements; U.S. Environmental Protection Agency: Cincinnati, OH, USA, 2013. Available online: https://www.energystar.gov/ia/partners/bldrs_lenders_raters/downloads/ES%20NPR%20v84%202015-12-09_clean_508.pdf?1625-c4b3 (accessed on 26 June 2017).
- U.S. Department of Energy (DOE). DOE Zero Energy Ready Home National Program Requirements; Rev. 04; U.S. Department of Energy Building Technologies Office: Washington, DC, USA, 2014. Available online: http://energy.gov/sites/prod/files/2014/04/f15/doe_zero_energy_ready_home_requirements_rev04.pdf (accessed on 26 June 2017).
- Russel, M.E.; Sherman, M.H.; Rudd, A. Review of Residential Ventilation Technologies; LBNL 57730; Lawrence Berkeley National Laboratory: Berkeley, CA, USA, 2005.
- Aubin, D.; Won, D.; Schleibinger, H.; Lajoie, P.; Gauvin, D.; Gingras, V.; Fugler, D. Effectiveness of Ventilation Interventions at Improving Indoor Air Quality and Ventilation Rates in Canadian Single Family Homes with Asthmatic Children. In ASHRAE Indoor Air Quality 2013 in Proceedings of the Environmental Health in Low Energy Buildings, 15–18 October 2013; American Society of Heating, Refrigerating and Air-Conditioning Engineers: Vancouver, BC, Canada, 2013. [Google Scholar]
- Willem, H.; Hult, E.; Hotchi, T.; Russel, M.; Maddalena, R.; Singer, B. Ventilation Control of Volatile Organic Compounds in New U.S. Homes: Results of a Controlled Field Study in Nine Residential Units; LBNL-6022E; Lawrence Berkeley National Laboratory: Berkeley, CA, USA, 2013.
- Hun, D.; Jackson, M.; Shrestha, S. Optimization of Ventilation Energy Demands and Indoor Air Quality in High-Performance Homes. In 2014 ACEEE Summer Study on Energy Efficiency in Buildings: Pacific Grove, CA, USA, August 2014; American Council for an Energy Efficient Economy: Washington, DC, USA, 2014. [Google Scholar]
- Rudd, A.; Bergey, D. Ventilation Systems Effectiveness and Tested Indoor Air Quality Impacts. 2014. Available online: http://www.nrel.gov/docs/fy14osti/61128.pdf (accessed on 26 June 2017).
- Wolkoff, P. Impact of air velocity, temperature, humidity, and air on long-term voc emissions from building products. Atmos. Environ. 1998, 32, 2659–2668. [Google Scholar] [CrossRef]
- Salthammer, T.; Mentese, S.; Marutzky, R. Formaldehyde in the Indoor Environment. Chem. Rev. 2010, 110, 2536–2572. [Google Scholar] [CrossRef] [PubMed]
- Hodgson, A.T.; Moyer, N.; Beal, D. Effect of Residential Ventilation Techniques for Hot and Humid Climates on Indoor Concentration of VOCs; LBNL-57030; Lawrence Berkeley National Laboratory: Berkeley, CA, USA, 2005. Available online: http://www.ba-pirc.org/pubs/pdf/LBNL-57030-Effect.pdf (accessed on 26 June 2017).
- American Society of Heating, Refrigerating, and Air-Conditioning Engineers (ASHRAE). Handbook Fundamentals—Chapter 13: Indoor Environmental Modeling; ASHRAE: Atlanta, GA, USA, 2013. [Google Scholar]
- National Institute of Standards and Technology (NIST). CONTAM. Available online: http://www.bfrl.nist.gov/IAQanalysis/index.htm (accessed on 1 December 2016).
- Spengler, J.D.; Sexton, K. Indoor air pollution: A public health perspective. Science 1983, 221, 9–17. [Google Scholar] [CrossRef] [PubMed]
- Weschler, C.J.; Nazaroff, W.W. Semivolatile organic compounds in indoor environments. Atmos. Environ. 2008, 42, 9018–9040. [Google Scholar] [CrossRef]
- Thatcher, T.L.; Layton, D.W. Deposition, Resuspension, and Penetration of Particles within a Residence. Atmos. Environ. 1995, 9, 1487–1497. [Google Scholar] [CrossRef]
- Dales, R.; Liu, L.; Wheeler, A.J.; Gilbert, N.L. Quality of indoor residential air and health. Can. Med. Assoc. J. 2008, 179, 147–152. [Google Scholar] [CrossRef] [PubMed]
- ASTM International. ASTM E779-10: Standard Test Method for Determining Air Leakage Rate by Fan Pressurization; ASTM International: West Conshohocken, PA, USA, 2010. [Google Scholar]
- American Society of Heating, Refrigerating, and Air-Conditioning Engineers (ASHRAE). ASHRAE Standard 152: Method of Test for Determining the Design and Seasonal Efficiencies of Residential Thermal Distribution Systems; ASHRAE: Atlanta, GA, USA, 2004. [Google Scholar]
- U.S. Green Building Council (USGBC). Reference Guide for Building Design and Construction—Version 4; U.S. Green Building Council: Washington, DC, USA, 2013. [Google Scholar]
- American Society of Heating, Refrigerating, and Air-Conditioning Engineers (ASHRAE). Handbook of HVAC Applications—Chapter 12: Aircraft; ASHRAE: Atlanta, GA, USA, 2015. [Google Scholar]
Figure 1.
Daily average difference and 95 Percent Confidence Interval of CO2 concentration in ppm between indoors and outdoors (indoor–outdoor), for runtime ventilation (RTV; red) and continuous exhaust (CEV; blue) during summer and winter periods. Source: [2].
Figure 1.
Daily average difference and 95 Percent Confidence Interval of CO2 concentration in ppm between indoors and outdoors (indoor–outdoor), for runtime ventilation (RTV; red) and continuous exhaust (CEV; blue) during summer and winter periods. Source: [2].

Figure 2.
Daily average difference and 95 Percent Confidence Interval of formaldehyde concentration, in ppb, between indoors and outdoors (indoor–outdoor), for runtime ventilation (RTV; red) and continuous exhaust (CEV; blue) during summer and winter periods. Source: [2].
Figure 2.
Daily average difference and 95 Percent Confidence Interval of formaldehyde concentration, in ppb, between indoors and outdoors (indoor–outdoor), for runtime ventilation (RTV; red) and continuous exhaust (CEV; blue) during summer and winter periods. Source: [2].

Figure 3.
Box and Whisker plot of the per person point source emission rate of CO2 term in g/h/pp (i.e., ) for each ventilation strategy (runtime ventilation (RTV) = blue and continuous exhaust ventilation (CEV) = red), in the summer and winter periods, as well as overall. In the box plot, the center line represents the average, the box bottom and top represent the first and third quartile, respectively; and the whiskers represent the minimum and maximum values in each data set. The grey box overlaid on the data represents a typical range for per person CO2 emission ranges for a person at rest of 24–37 g/h/pp [23].

Figure 4.
Linear Regression of Per Capita Indoor (Point and Surface-Area-Related) Formaldehyde Source Emission Rates (μg/h/pp) with respect to Conditioned Floor Area (ft2). The red and blue dots represent the measured data for runtime ventilation (RTV) and continuous exhaust ventilation (CEV), respectively. The red and blue lines represent the linear regression of the RTV and CEV data, respectively, with fixed intercepts of 0, 26, and 280 μg/h/pp, as well as a unique intercept determined based on linear regression of each ventilation strategy independently.

Table 1.
Characteristics of the study homes.
| Site | Cohort | Area (sqft) | # BRs 1 | Occup. Adult/Child | ACH50 2 (h−1) | Qn, Out 3 (cfm) | RTV Flow (cfm) | Exh. Fan Flow (cfm) | 62.2-2010/2013 Fan Req. 4 (cfm) |
|---|---|---|---|---|---|---|---|---|---|
| 1 | Flip-flop | 2158 | 5 | 2/2 | 5.1 | 3.4 | 40 | 57 | 67/71 |
| 2 | Flip-flop | 1508 | 3 | 2/2 | 4.4 | NA | 34 | 55 | 45/52 |
| 3 | CEV | 1542 | 3 | 1/2 | 3.0 | 2.2 | N/A | 54 | 45/60 |
| 4 | Flip-flop | 1984 | 4 | 2/0 | 3.4 | 3.0 | 26 | 55 | 57/73 |
| 5 | CEV | 1950 | 4 | 2/2 | 3.0 | 1.6 | NA | 59 | 57/75 |
| 6 | Flip-flop | 1679 | 3 | 2/0 | 3.5 | 1.8 | 42 | 55 | 47/60 |
| 7 | RTV | 1878 | 4 | 2/3 | 3.4 | 1.0 | 35 | NA | 56/71 |
| 8 | Flip-flop | 1508 | 3 | 1/1 | 2.9 | 1.5 | 39 | 78 | 45/60 |
| 9 | Flip-flop | 1542 | 3 | 3/0 | 4.8 | 2.0 | 24 | 64 | 45/50 |
| 10 | RTV | 2416 | 4 | 2/1 | 2.6 | 4.6 | 37 | NA | 62/87 |
| Flip-flop average | 1730 | 3.5 | 2.0/0.8 | 4.0 | 2.1 | 34 | 61 | 51/61 | |
| Control average | 1947 | 3.8 | 1.8/2.0 | 3.0 | 2.4 | 36 | 57 | 55/73 | |
| Overall average | 1817 | 3.6 | 1.9/1.3 | 3.6 | 2.2 | 35 | 60 | 53/66 |
1 # BRs = Number of bedrooms; 2 ACH50 refers to the air changes per hour measured at 50 Pascals of depressurization with respect to the outside in accordance with ASTM E779, “Standard Test Method for Determining Air Leakage Rate by Fan Depressurization” [20]; 3 Qn, out refers to the duct leakage to outdoors measured in accordance with ASHRAE 152, “Method of Test for Determining the Design and Seasonal Efficiencies of Residential Thermal Distribution Systems” [21]; 4 The value on the left refers to the required ventilation per ASHRAE 62.2-2010 and the right-hand value refers to the required ventilation per ASHRAE 62.2-2016.
Table 2.
Summary of average indoor air quality model parameters and 95 percent confidence interval.
| Parameter | Unit | Runtime Ventilation Strategy | Continuous Exhaust Ventilation Strategy | Ratio (CEV/RTV) |
|---|---|---|---|---|
| Air Exchange Rate (Mechanical and Natural) | h−1 | 0.14 ± 0.01 | 0.26 ± 0.02 | 1.81 ± 0.02 |
| CO2 Concentration | ppm | 522 ± 73 | 346 ± 48 | 0.66 ± 0.17 |
| Formaldehyde Concentration | ppb | 26 ± 5 | 24 ± 4 | 0.93 ± 0.24 |
| Formaldehyde Emission Rate | μg/h | 1.2 ± 0.3 | 2.0 ± 0.4 | 1.75 ± 0.53 |
Table 3.
Linear regression equations of per capita indoor (point-source and surface-area-related) formaldehyde emission rate [μg/h/pp] with respect to conditioned floor area (CFA) [ft2/pp], for RTV homes and CEV homes. Error presented in calculated 95 percent confidence interval.
Table 3.
Linear regression equations of per capita indoor (point-source and surface-area-related) formaldehyde emission rate [μg/h/pp] with respect to conditioned floor area (CFA) [ft2/pp], for RTV homes and CEV homes. Error presented in calculated 95 percent confidence interval.
| Y-Intercept | RTV | CEV | Emission Rate Ratio (CEV/RTV) |
|---|---|---|---|
| 26 μg/h | (1.2 ± 0.3) × CFA + (26 ± 254) | (2.1 ± 0.4) × CFA + (26 ± 254) | 1.75 ± 0.53 |
| 0 μg/h | (1.3 ± 0.3) × CFA + 0 | (2.2 ± 0.4) × CFA + 0 | 1.73 ± 0.50 |
| 280 μg/h | (0.7± 0.3) × CFA + 280 | (1.5 ± 0.5) × CFA + 280 | 2.22 ± 0.56 |
| Unique | (1.6 ± 0.4) × CFA + (−87 ± 264) | (1.6 ± 0.4) × CFA + (−87 ±2 64) | 1.97 ± 0.86 |
Table 4.
Emission rate of formaldehyde, in μg/h, for RTV homes and CEV homes calculated based on assumed per person point source emission rate of 26 μg/h for summer, winter, and overall. Error presented in calculated 95 percent confidence interval.
Table 4.
Emission rate of formaldehyde, in μg/h, for RTV homes and CEV homes calculated based on assumed per person point source emission rate of 26 μg/h for summer, winter, and overall. Error presented in calculated 95 percent confidence interval.
| Season | RTV | CEV |
|---|---|---|
| Summer | 1.2 ± 0.4 | 2.1 ± 0.6 |
| Winter | 1.1 ± 0.5 | 1.8 ± 0.9 |
| Overall | 1.2 ± 0.3 | 2.0 ± 0.4 |
Table 5.
Ratio of formaldehyde concentration, emission rate, and ventilation rate for nine homes studied in [8] compared to Gainesville data evaluated in this study.
Table 5.
Ratio of formaldehyde concentration, emission rate, and ventilation rate for nine homes studied in [8] compared to Gainesville data evaluated in this study.
| Formaldehyde | Average from [8] | Gainesville Data | ||
| Low/High | Medium/High | Overall | RTV/CEV | |
| Concentration Ratio | 2.2 | 1.5 | 1.9 | 1.1 |
| Emission Rate Ratio | 0.7 | 0.8 | 0.7 | 0.6 |
| High/Low | High/Medium | Overall | CEV/RTV | |
| Ventilation Rate Ratio | 3.2 | 1.9 | 2.6 | 1.8 |
© 2017 by the authors. Licensee MDPI, Basel, Switzerland. This article is an open access article distributed under the terms and conditions of the Creative Commons Attribution (CC BY) license (http://creativecommons.org/licenses/by/4.0/).
Share and Cite
MDPI and ACS Style
Widder, S.H.; Haselbach, L. Relationship among Concentrations of Indoor Air Contaminants, Their Sources, and Different Mitigation Strategies on Indoor Air Quality. Sustainability 2017, 9, 1149. https://doi.org/10.3390/su9071149
AMA Style
Widder SH, Haselbach L. Relationship among Concentrations of Indoor Air Contaminants, Their Sources, and Different Mitigation Strategies on Indoor Air Quality. Sustainability. 2017; 9(7):1149. https://doi.org/10.3390/su9071149
Chicago/Turabian StyleWidder, Sarah H., and Liv Haselbach. 2017. "Relationship among Concentrations of Indoor Air Contaminants, Their Sources, and Different Mitigation Strategies on Indoor Air Quality" Sustainability 9, no. 7: 1149. https://doi.org/10.3390/su9071149
Note that from the first issue of 2016, this journal uses article numbers instead of page numbers. See further details here.