Green Growth—Magic Bullet or Damp Squib?

European Commission, Joint Research Centre (JRC), Via E. Fermi 2749, I-21027 Ispra, Italy
Sustainability 2017, 9(7), 1092; https://doi.org/10.3390/su9071092
Submission received: 27 April 2017
/
Revised: 20 June 2017
/
Accepted: 20 June 2017
/
Published: 23 June 2017
(This article belongs to the Section Environmental Sustainability and Applications)
Abstract
:The paper identifies various conceptualisations of green growth with a view to identify the causal mechanisms that can support a green growth policy agenda to investigate the implications of these conceptualisations for measuring progress towards green growth, to identify possible trade-offs and integrate measures, and to explore the governance challenges that a green growth agenda is likely to pose against the background that many environmental problems have a bearing on multiple levels of governance.
1. Introduction
The purpose of this paper is to shed some light on the notion of green growth, its two conceptual components (‘green’ and ‘growth’) and possible interrelationships between both. In doing so, the paper seeks to explore the implications of possible (and plausible) ways to understand green growth for research, measurement and, ultimately, governance and policy making. The exercise is motivated by the view that, despite having become a widely accepted paradigm among scholars and policy makers, the popularity of green growth was long considered to contrast with a lack of analytical breadth and depth, as neither the theoretical nor empirical foundations of green growth had been sufficiently analysed [1]. While a host of publications on the subject has helped to close this gap in the aftermath of Schmalensee’s verdict—Google scholar counts almost 15,000 hits for the search term ‘green growth’ after 2012 (figure retrieved on 23 June 2016)—there remains, or so it will be argued, a number of issues, which need further investigation.
According to the OECD (Organisation for Economic Co-operation and Development), ‘Green growth is about fostering economic growth and development while ensuring that natural assets continue to provide the resources and environmental services on which our well-being relies. To do this it must catalyse investment and innovation which will underpin sustained growth and give rise to new economic opportunities’ [2]. In a similar vein, the World Bank proposes that ‘Green growth is about making growth resource-efficient, cleaner and more resilient without slowing it’ [3,4,5]. Finally, ‘Green economy aims for improved human well-being and social equity, while significantly reducing environmental risks and ecological scarcities’ [3,6].
There are thus reasons to suggest that the notion of green growth reflects above all two concerns: first, the recognition that economic activity has detrimental effects on the environment, which need to be addressed as an integral part of economic policy and, second, the presumption that economic growth continues to be a conditio sine qua non not only for developing countries but also for the developed world. Based on these beliefs, it is argued that economic growth and ecological sustainability can be reconciled [7,8]. Thus, in contrast to the notions of zero or even degrowth, which are strongly influenced by concerns about the ‘limits to growth’ [9], ‘green growth has emerged from the more mainstream and pragmatic community of environmental economic policymakers’ [10] for whom there is no fundamental conflict between green and growth.
What is more, a green growth policy agenda is held to contribute to further economic growth [3] and thus to chart out the pathway towards a win-win situation in which mankind is better off economically and can enjoy the fruits of a clean and biologically diverse environment [11]. This is often referred to as the strong view on green growth [8]. Rather than being a constraint that is to be met if growth is to continue, greening growth is seen as a source of growth sui generis. According to this line of reasoning, the environment is nothing but a special type of capital [12], which contributes to the production of goods and services in much the same way as do labour and man-made capital Increasing the amount and quality of natural capital is therefore naturally expected to contribute to growth. Note that nature is here framed in terms of aggregates such as an ‘aggregate natural capital rule’, which are calculable, exchangeable, substitutable, and commensurable between different spatial and temporal sites. For an ontological critique of this view see [13].
Against this background, the notion of green growth poses two fundamental questions: what is ‘green’ and, albeit to a lesser extent, what is ‘growth’? Note, however, that the paper does not aim at devising yet another definition of these notions but to explore the implications of different understandings, remaining by and large agnostic as to which of these understandings, if any, is correct. Despite that, the paper will suggest a way of ordering different understandings, which helps to clarify the discussion while pointing to unresolved or contested issues. Its aim is thus inter alia to contribute to a conceptual framework that suggests a relationship between socio-economic activities, resource use, and environmental impacts on the natural system, biodiversity, and ecosystem functioning [14,15].
The paper is organised as follows. Section 2 looks at the green part of green growth and distinguishes between a narrow understanding and an increasingly comprehensive understanding. Section 3 does the same for the notion of growth while Section 4, Section 5 and Section 6 combine the insights from the preceding sections in order to look at the some of the implications if these different understandings are employed and combined with respect to the link between greenness and growth, the measurement of green growth, and, last but not least, the institutional implications of a green growth policy agenda.
2. What Is Green?
The literature on green growth does not exhibit an explicit consensus on what exactly is meant by ‘green’. After all, the above definitions of green growth show some notable nuances. While the OECD definition emphasises the need to preserve our natural capital, the World Bank definition stresses the need to curb pollution but agrees on the quest for greater efficiency (which is a means to preserve natural capital). These nuances are of both a qualitative and quantitative nature but partly vanish again once the indicators proposed by the OECD for measuring green growth are taken into account [16]. Be that as it may, greenness does not appear to be a hotly contested issue. As Jacobs concludes, ‘[t]he core meaning of the concept of green growth can be simply stated. It is economic growth (growth of gross domestic product or GDP) which also achieves significant environmental protection’ [10]. What exactly is to be protected and how far protection should go is left unanswered.
An arguably more serious problem relates to the fact that either a one-dimensional or a multi-dimensional but fuzzy concept of greenness increases the probability of conflicts between instruments and trade-offs between objectives. For instance, an increase in the use of biomass with a view to increase the use of renewable fuels is likely to be incompatible with protecting biodiversity if biomass is to be produced on land that was previously covered by species-rich forests [17,18]. In a similar vein, devices that reduce toxic emissions such as NOx or particulate matter from combustion engines (catalytic converters, filters) may reduce the energy efficiency of these engines and thereby increase CO2 emissions. In both cases, one objective cannot be reached without (at least in part) compromising the other unless an integrated assessment is coupled with an integrated solution such as the use of hydrogen or a shift to electric vehicles.
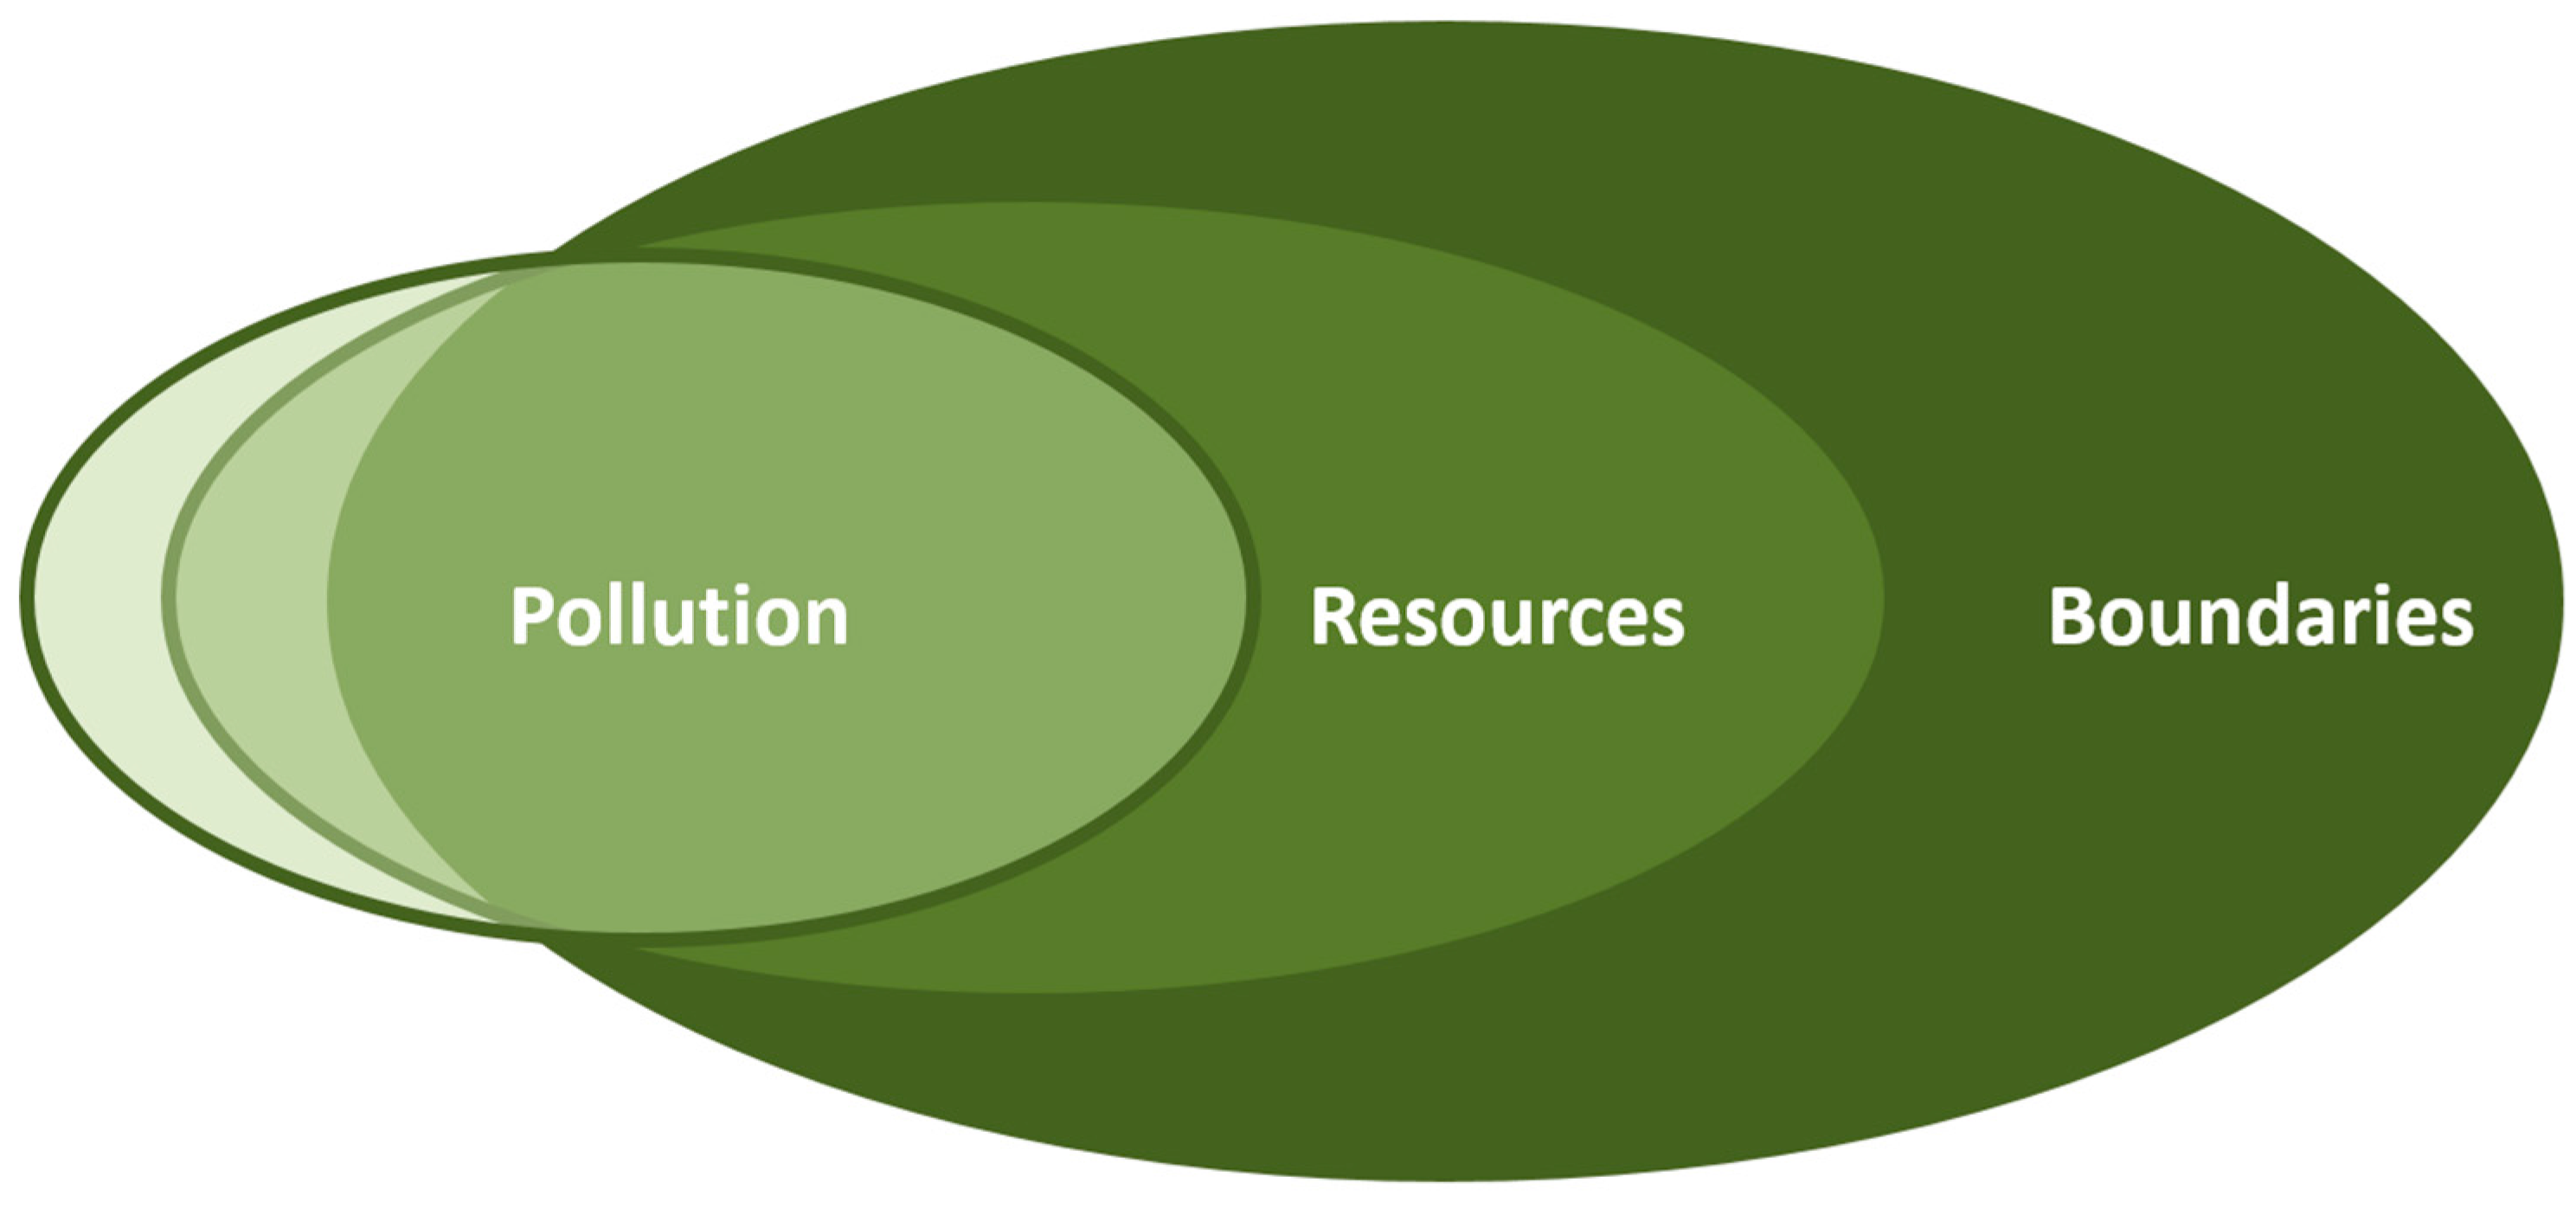
In what follows, it is suggested that a useful way of categorising the green component is based on its comprehensiveness and geographical scope. Thus, a greener growth approach would be more comprehensive and geographically larger in the sense that it includes more environmental objectives at a larger scale and therefore possibly imposes more far-reaching constraints on, or at least challenges for, growth (Figure 1). Figure 1 is supposed to capture the idea that although greenness can and should be understood in terms of its comprehensiveness, there are nevertheless some trade-offs between each sphere. A case in point would be the shift from fossil fuels to biofuels, which may ease the pressure on resource use while putting at risk biodiversity. In addition, it is also proposed (although this is clearly a normative claim) that more comprehensive approaches to green growth should contain less comprehensive approaches as subsets, thereby minimizing trade-offs between objectives and conflicts between instruments. Of course, this involves categorising environmental objectives in that way will not by itself get rid of real conflicts, but it may help to draw attention to such conflicts by putting them on the mental maps of policy makers and analysts.
Based on the idea sketched out above, greenness can therefore be understood as belonging to one out of three spheres of increasing comprehensiveness and scope. The first sphere comprises (the reduction of) rather traditional types of pollutants. Apart from immediately toxic substances, pollutants belonging to this sphere can be endocrine disruptors, i.e., chemicals that, at certain doses, can interfere with endocrine (or hormone) systems causing cancerous tumours, birth defects, and other developmental disorders in both humans and animal, or they can be carcinogenic substances, i.e., substances that have the ability or tendency to produce cancer. In addition, emissions that cause the acidification of water bodies or promote the creation of low level ozone may be included here. In a nutshell, Sphere 1 embraces what has been regarded for many years as the mainstay of environmental policies; cutting or at least keeping within safe limits emissions to air, water, and soil that are harmful to humans or their immediate natural environment.
Starting from the second sphere, the focus moves beyond reducing toxic emissions of various kinds (which can also be interpreted as using nature as a sink) to seeing the environment as a (more wide-ranging) resource that is either finite but renewable over time or finite altogether and whose exploitation often implies physical flows from natural systems to the economic system. Concomitantly, the availability of natural resources in physical and economic terms becomes an issue. For instance, economists and geologists have debated for quite some time if and when oil production is going to peak and which consequences, if any, peak oil may have [19,20]. More recently, similar concerns have been voiced about coal and natural gas, even though their peaks may come later [21,22]. Whatever the conclusions of this debate may be, a green growth agenda must be cognisant of limits to resource availability [11] raising as they do issues about the optimal use of finite stocks of resources over time [23] or about the use of renewable resources in such a way as to maintain the resource and its reproductive potential intact. To the extent that such resources can be accessed freely, their (sustainable) use raises specific problems of its own and has been analysed as a problem of the commons [24,25].
The third sphere is meant to capture those areas where the environmental consequences of economic activity are global rather than predominantly local or regional and likely to hit planetary boundaries [26,27,28]. According to [26], ‘boundaries define the safe operating space for humanity with respect to the Earth system and are associated with the planet’s biophysical subsystems or processes’. From this perspective, green growth implies that these boundaries be respected, even though they do not determine as such any ‘limits to growth’. Rather they set ceilings to the total anthropogenic impact [29] and thus may have an indirect impact on growth once the ceilings are approached and mitigating measures have to be taken. Some of the boundaries identified by [26] can already be found in Spheres 1 and 2 (e.g., freshwater use or chemical pollution), although the geographical scale may be different, or they are closely linked and hence need similar approaches such as climate change and fossil-fuel-scarcity [19]. Others appear to be idiosyncratic to the third sphere (climate change, oceanic acidification, see [26]). In fact, the crucial features of planetary boundaries are that they are to be met at a global scale and that their violation has global effects. Neither is necessarily the case for Spheres 1 and 2. At the same time, the rate of biodiversity loss, and thus one of the planetary boundaries identified by [26], is likely to be affected to a significant degree by what is happening locally in terms of land-use or agricultural practices. It is also for this reason that it makes sense to think of Spheres 1 and 2 in terms of subsets of Sphere 3.
Before moving to the growth component of green growth, two preliminary observations can be made. First, the link between greenness and growth becomes more demanding as one moves from Sphere 1 to 2 and 3; what is sufficiently green in terms of Sphere 1 is not necessarily green in terms of 2 or even 3. While emissions to air, water, and soil have been reduced significantly in most industrialised countries despite continuous economic growth, the same cannot be said for Spheres 2 and 3.
Second, policy instruments differ within spheres but also across them. There are no one-size-fits-all policy instruments or sets of instruments for each sphere, even though, traditionally, the objectives of Sphere 1 (i.e., pollution control) have been achieved by regulations, whereas economic instruments such as green taxes or emission trading have been introduced more recently and predominantly for Spheres 2 and 3, albeit not yet to any significant degree at a global level.
3. What Is Growth?
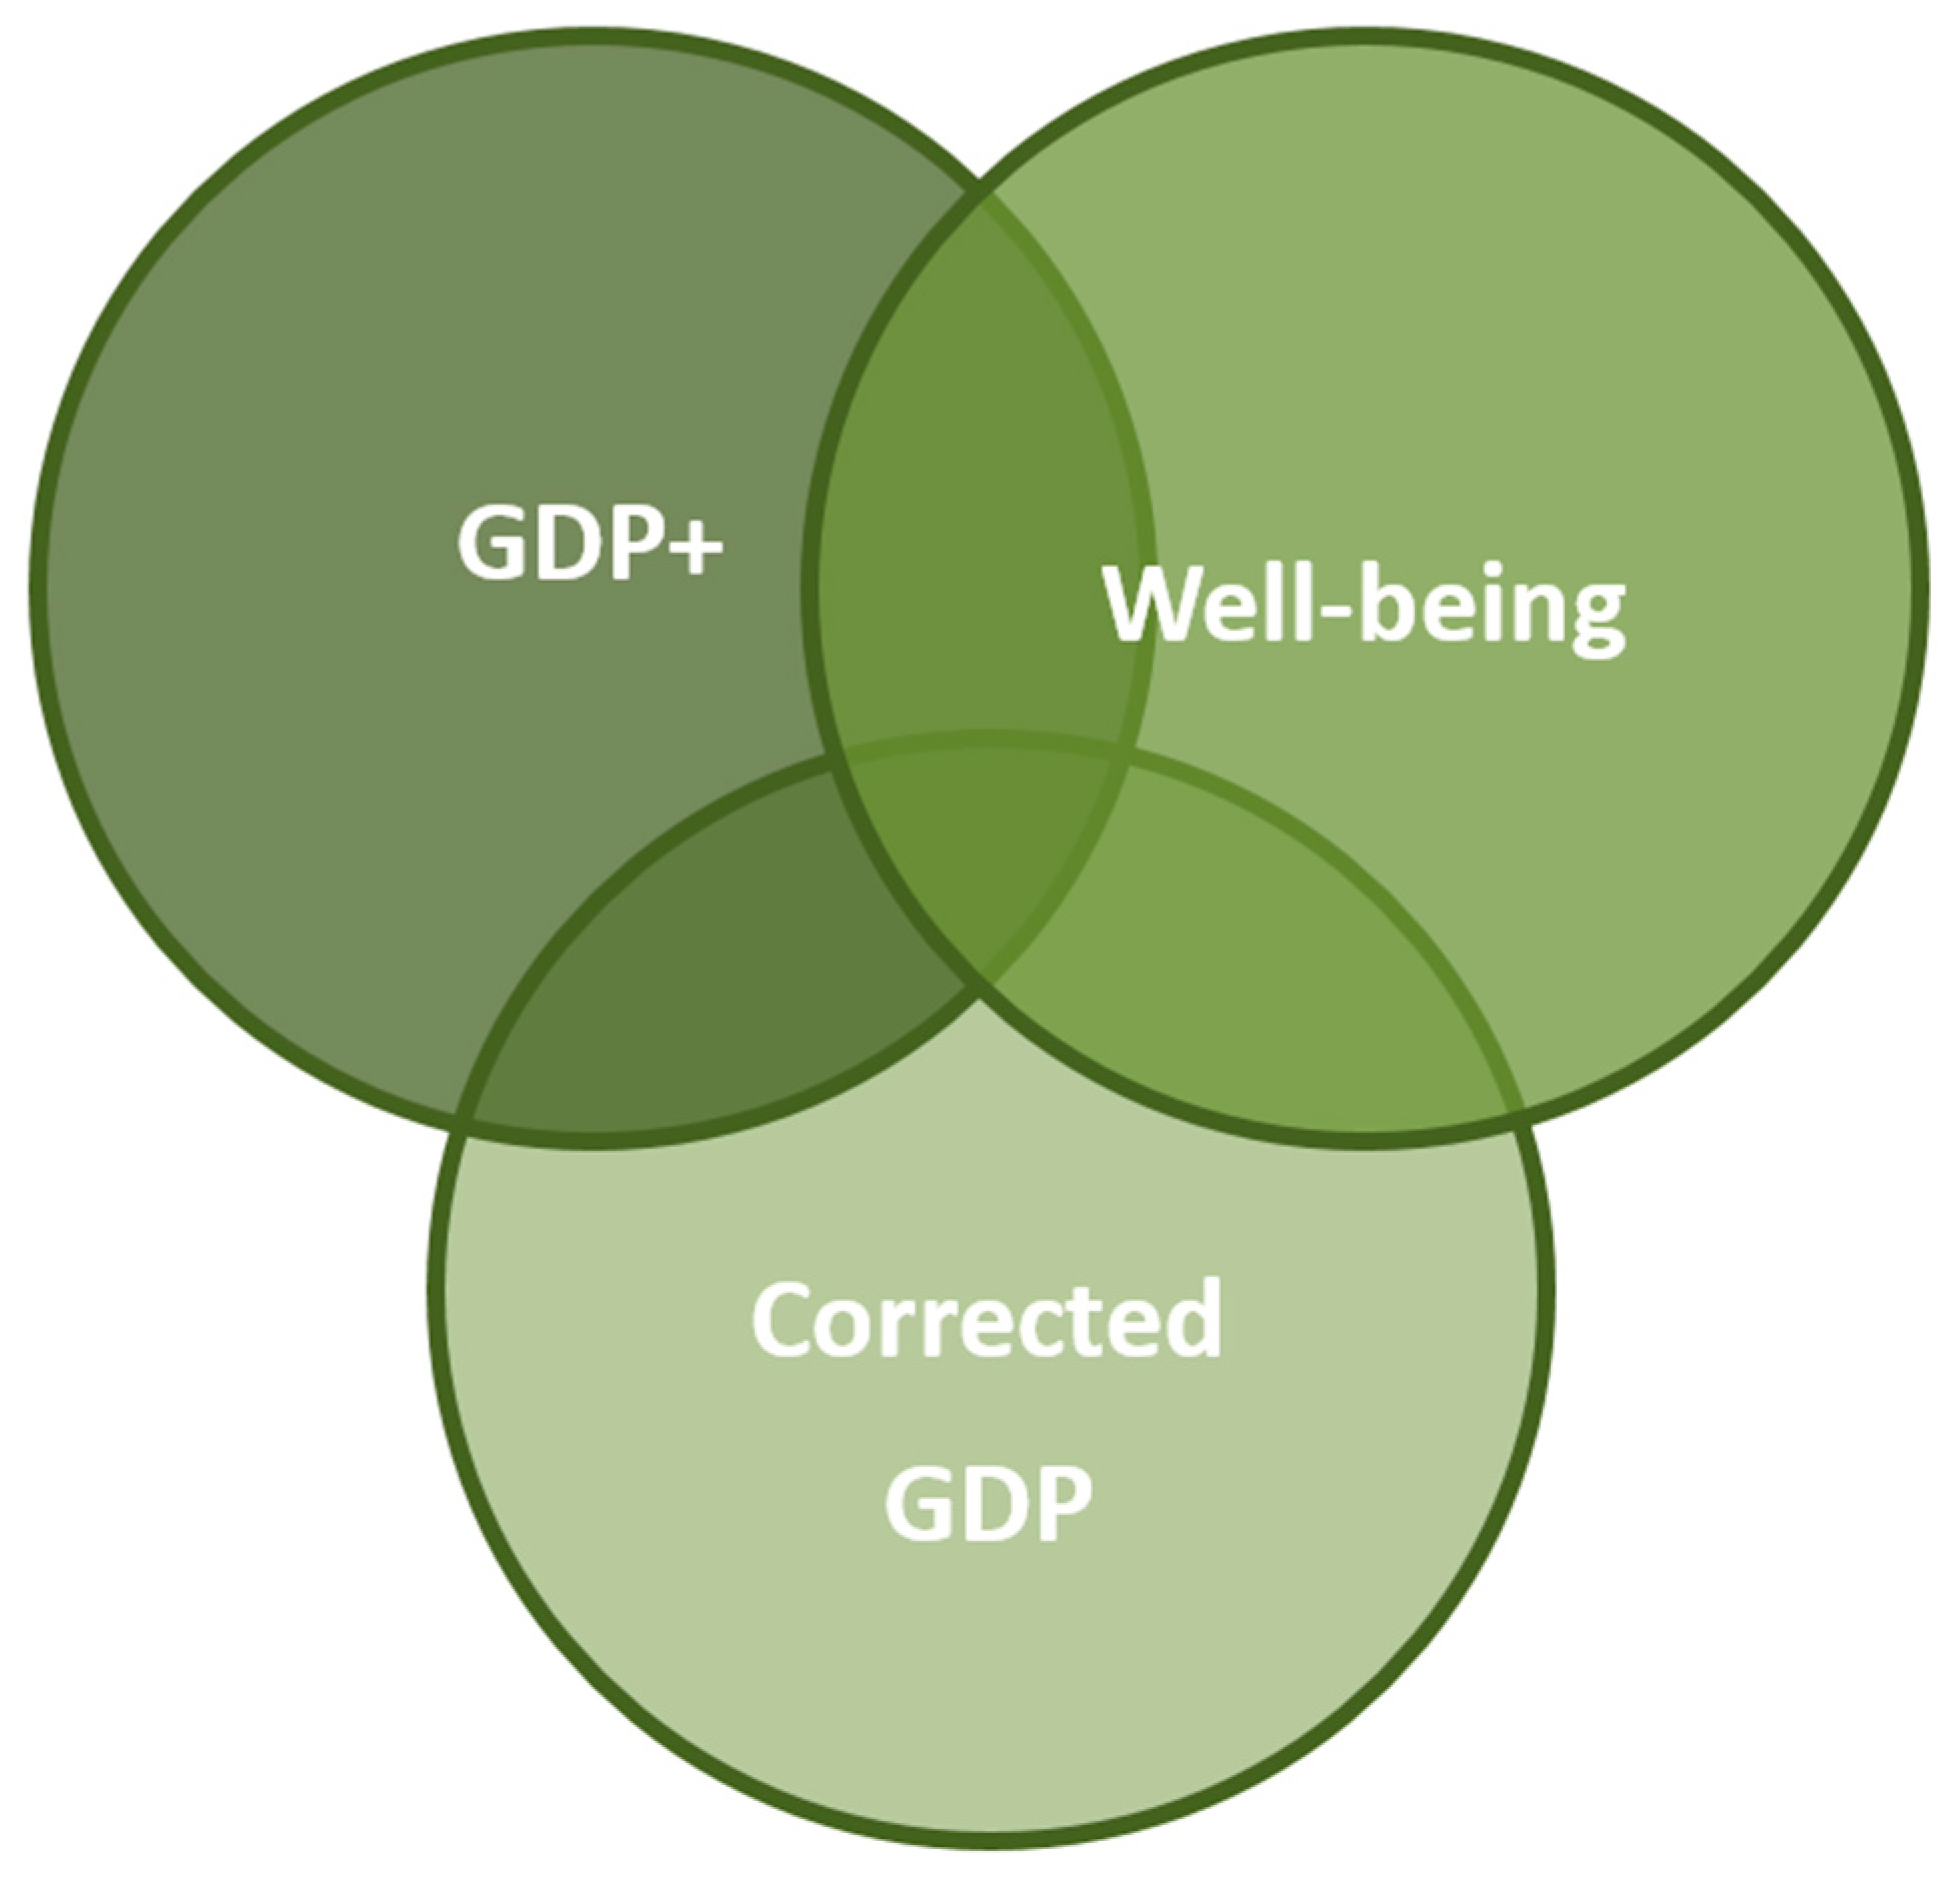
Unlike the green component of green growth, there seems to be more clarity as to the content of the growth component [30]. Growth is (any) increase in measured GDP as conventionally understood, the—occasionally tacit—assumption being that GDP is a reasonable proxy for either the current generation’s well-being or even intergenerational well-being [31,32]. This is not to say that the longstanding critique of GDP [33] has been ignored or downplayed. In fact, UNEP (United Nations Environment Programme), for instance, advocates green growth while acknowledging that it has lost some of its appeal [6] in developing countries because the satisfaction of basic needs is not always sufficiently correlated with GDP per capita and in developed countries because the link between subjective measures of well-being and GDP are rather weak [34]. The point is that this criticism has led to calls for complementing (rather than abandoning) GDP by adding indicators that provide information about, say, the distribution of income or the satisfaction of specific needs, which are not captured by GDP. This being said, there are in principle three ways in which the growth component of green growth can be understood. See Figure 2.
3.1. GDP+
The first understanding will be referred to as GDP+ and arguably mirrors the current practice in international organisations and many countries. Accordingly, GDP as conventionally accounted is complemented by additional information, be it about the state of the environment and the use of resources or the distribution of income and wealth. Additional information of this kind serves to qualify the increases or decreases (growth or degrowth) in the assessment of GDP by pointing to effects that might otherwise be ignored. However, without at least partially aggregating the information and without making trade-offs explicit, it remains unclear how to assess a situation in which further growth goes hand in hand with the deterioration of (some of) the complementary indicators. Note, incidentally, that the OECD has refrained explicitly from developing such an aggregate indicator [16].
3.2. Corrected GDP
The second understanding henceforth referred to as ‘Corrected GDP’ does not complement GDP but modifies the way it is understood and measured; for instance, the Index of Sustainable Economic Welfare (ISEW) and the Genuine Progress Indicator (GPI). This can be done using one of at least three, albeit interconnected, approaches. The first approach consists of adding to, or subtracting from, GDP appropriate values for otherwise unaccounted for negative and positive outputs using actual or shadow prices. The former, being tantamount to a cost, would reduce GDP (e.g., air pollution, which reduces the quality of life in a city), while the latter, being tantamount to additional production, would increase GDP (e.g., the aesthetic quality of a new and sustainably managed forest, which does not only produce timber but also has a recreational value people can enjoy without having to pay for it). Concomitantly, any change in the stocks of natural capital (depreciation or appreciation) implies a social loss or gain, which also needs to be accounted for [27], even though such losses or gains may only affect NDP (Net Domestic Product = GDP-depreciation) An in-depth discussion of the notion of natural capital would go way beyond the scope of the present paper. Suffice it to note perhaps that natural capital itself is difficult to measure correctly if prices in the economy are distorted. This ‘second-best-problem’ [35] poses particular challenges for conceptualisations of green growth as suggested by [30] or [36].
The second approach consists of correcting wrongly attributed outputs using again either actual or shadow prices. These are outputs that should (as least in part) be counted as inputs and thus diminish GDP. An example for the latter would be health care costs due to air pollution. While in standard accounting terms, health care costs for pollution related diseases contribute to GDP, they do not increase welfare since they do not open up new consumption possibilities. Rather, the resources spent are used to prevent the (further) deterioration of sanitary conditions and therefore could have been spent for other purposes had the air pollution not occurred.
The third approach for correcting GDP would not be applied ex post (as the first two approaches) but ex ante by correcting prices so as to reflect correctly positive and negative externalities. Thus, paying the beemaster for the pollination services of his bees (a positive externality) ensures that all agricultural produce whose production requires pollination by bees is priced correctly, including honey, given that its production costs would be lower. In a similar vein, if oil companies were obliged to take out insurance against oil spills (a negative externality), then oil prices would (again) correctly reflect these costs.
3.3. Well-Being
To account for the growth component of green growth in terms of wellbeing (the term ‘well-being’ stands here for all approaches for measuring social progress and well-being that do not or not predominantly rely on GDP) is perhaps the most radical departure from the conventional understanding of green growth, all the more so as the nexus with economic activity is becoming even weaker. Well-being indicators are used to broadly illustrate people’s general satisfaction with life or give a more nuanced picture of quality of life in relation to their jobs, family life, health conditions, and standards of living. Well-being measures can be both ‘subjective’ and ‘objective’. Subjective measures are based on self-reporting by individuals, which make it possible to capture direct measures of high complexity such as life-satisfaction. Objective measures, on the other hand, attempt to capture these complex life-satisfaction variables by looking at indicatory variables such as leisure time, marital status, and disposable income.
Before discussing the nexus of green and growth, note that GDP+, Corrected GDP, and well-being are overlapping concepts. This is obvious for GDP+ and Corrected GDP, because the basis of the latter remains GDP, but it also holds for well-being and GDP+/Corrected GDP; GDP contributes to well-being because well-being is impossible without a material basis in the form of certain products and services. Nevertheless, even a corrected version of GDP will not capture all contributors to well-being.
4. Green or Growth?
4.1. The Link between Green and Growth: Concepts and Empirics
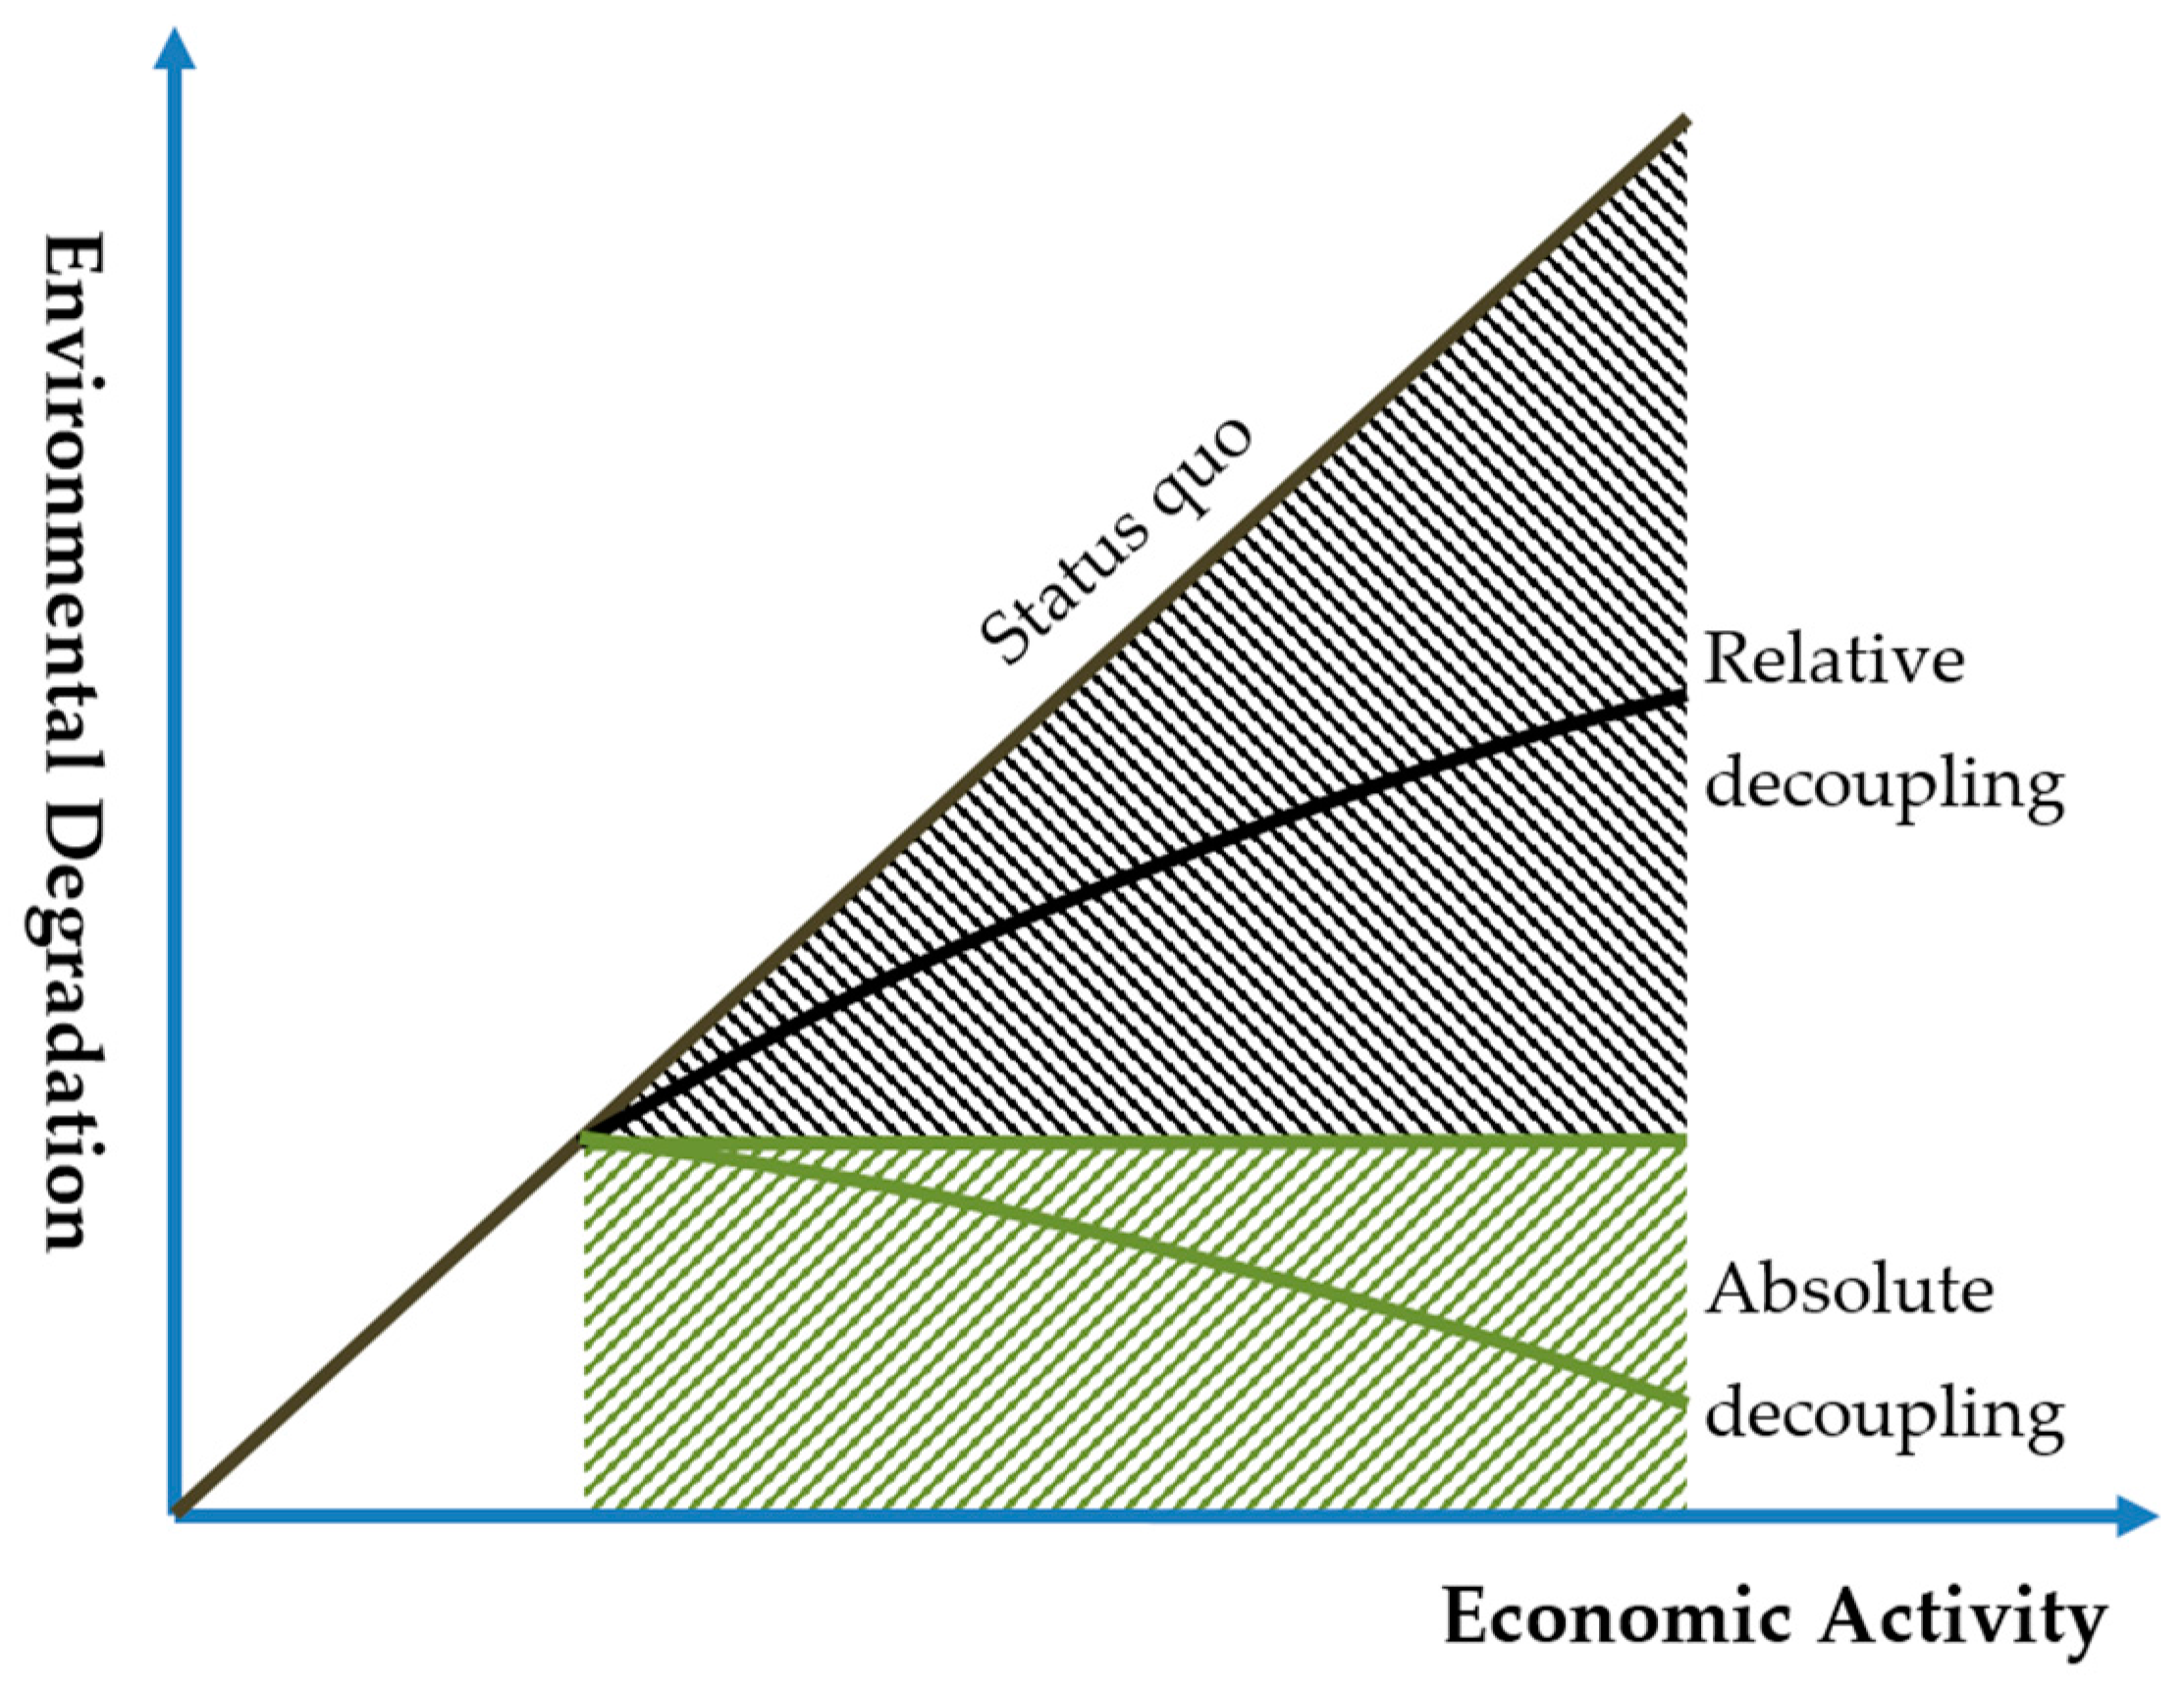
This section will take a closer look at the relationship between green and growth. The first point to be addressed here appears rather straightforward. Considering that at least two out of the three understandings of growth are likely to imply an expansion of economic activity, the aggregated environmental impact can evolve in three distinct ways. The first possibility, which would clearly be incompatible with any green growth agenda, entails that environmental impacts (continue to) increase along with economic activity. See the status quo line in Figure 3. The next equally distinct possibility entails that environmental impacts continue to grow but at a slower pace. In line with the literature on sustainable development, this relationship could be called relative decoupling [37]. In the figure, graphs falling under this category can be found in the area that is shaded black, excluding of course the status quo as a limiting case. Finally, environmental impacts decline despite growing economic activity. This possibility is usually referred to as absolute decoupling. Graphs falling under this category are located in the area that is shaded green.
From this analysis, it follows that the status quo in terms of the environmental burden per unit of output is incompatible with any kind of green growth. Thus, the notion of green growth must at least entail a relative reduction of environmental effects. Moreover, if the green part is to be understood in terms of planetary boundaries, then given the extent to which these boundaries have already been reached or even violated, economic activity and environmental degradation have to be decoupled in absolute terms. This requirement implies that the rate of efficiency improvement needs to be higher than the sum of the rate of economic growth per capita and population growth. Thus, if economic growth per capita is denoted by and population growth by , then efficiency must grow at rate
in order to ensure absolute decoupling [38,39]. To take a numerical example, if output per capita grows at 2% while population grows at 1%, then efficiency must improve by more than 3% each year, and this must, of course, be the case for every kind of emission. To put these figures into perspective, note that, for instance, energy efficiency in the European Union (EU) has improved by 1.54% on average. Thus substantial increases in energy efficiency are necessary in order to meet political objectives.
Obviously, this analysis must be qualified if environmental degradation or climate change has negative effects on growth, thus adding a dynamic perspective to environmental policies or the lack thereof. For an in-depth discussion see [40,41,42]. Note moreover that, for an open economy, a distinction can be made between decoupling consumption and decoupling production. However, from a global perspective (or if the environmental impacts of imports and exports are properly accounted for), the two notions converge. Looking at decoupling empirically, [43] finds that in almost all sectors and by almost all pollutants the median EU country had at least some decoupling. However, considerable heterogeneity in its magnitude can be observed across countries, sectors, and pollutants.
4.2. Mechanisms for Green Growth: Causalities and Effects
How is growth supposed to help the environment? Copeland and Taylor distinguish between scale effects (more production leads to more pollution but at a decreasing rate), composition effects (growth leads to cleaner consumption patterns), and technological effects (the need for cleaner technologies induced by preferences giving higher weight to a clean environment) [44]. It is probably the latter effect that enjoys the most popularity among policy makers, as it is believed to be more effective than the first (as this may lead at most to relative decoupling) and less uncertain than the second mechanism. Still, the discussion of possible rebound effects below suggests that innovation is also Janus faced. While it may provide new technologies that are inherently more environmentally friendly than their predecessors (and which will be deployed more rapidly if the economy grows faster, thereby creating a composition effect for the capital stock as old factories or power plants are replaced by new ones), innovation is also the basis for new products and services, which as such do not only generate employment (which is clearly welcome) but also additional demands for energy and resources (which is not as it threatens to undermine the beneficial environmental effects).
Except for the innovation effect, the scale and composition effects of growth do not require dedicated policies. They are essentially by-products of an expanding GDP, even though green taxes, for instance, can be used to engineer composition effects. Occasionally, it is argued that getting the price right via green taxes may also stimulate growth. However, it is not clear how that is supposed to function beyond a one-off increase in economic activity [36]. It is therefore not surprising that, in addition to R&D, green growth is more associated with dedicated and distinct macroeconomic or structural policies. For instance, policies geared towards emission reduction are expected to create jobs because:
- A Keynesian demand stimulus at times of recession would create jobs and invest in needed improvements to the energy infrastructure.
- The sponsorship of new green industries would offset job losses in older, ‘brown’ sectors.
- Savings from energy efficiency improvements could be recycled into consumption from higher-labour-intensity industries, generating net job gains even as the relative demand for labour in the energy sector fell [45].
It goes beyond the scope of this paper to discuss these mechanisms in detail. Suffice it to point out, though, that each mechanism has its downsides. See [1,11,46] for an extensive discussion. For instance, Keynesian multiplier effects do not last forever, and their magnitude is uncertain. Moreover, while multiple externalities may per se call for multiple policy instruments, different instruments may also interact in a detrimental fashion; for instance, when instruments supporting renewables reduce cap-and-trade prices [46]. As to the substitution of brown by green jobs, there is no doubt that even in a recession, some sectors will continue to create jobs. However, unless new sectors are less productive or grow faster, positive net effects are unlikely to occur [47]. Last but not least, while energy savings translate into additional available income for consumers, they also imply lower revenues for exporters of, say, fossil fuels and other actors along the supply chain, which need to be factored in at the macroeconomic level.
Occasionally it is also argued that green growth would be more labour intensive and thereby create more jobs than brown growth. However, this argument needs to be taken with a grain of salt, in particular if green growth is to come from innovation. First of all, technological progress is generally assumed to be labour saving, but if this is the case, then why should green innovation be different, in particular if it is suggested that green growth rests to an important extent on higher value-added activities such as re-use or re-cycling [48]? Alternatively, if one takes the view that labour and capital are not substitutes but change conjointly in qualitative terms (such that technologically more advanced types of capital also require higher qualified labour for its production and even its use), then it is even less obvious why the net effect should be positive.
Another argument for why green policies foster growth comes from the growth literature and was already alluded to above. Accordingly, if the quality of natural capital improves and therefore its productivity improves too (or if a cleaner environment enhances the productivity of man-made capital), then growth should accelerate in ways which are analogous to an increase in labour or capital productivity as such [49].
4.3. Green Growth and Measurement Errors
The above statement has to be qualified in one very important respect. Depending on the notion of growth, green policies may also change what is measured in ways which allegedly run counter to what these policies aim at in the first place. To illustrate the point, consider a tax that aims at internalising a negative external effect by pricing that effect. Green taxes of this kind are frequently recommended in the debate on green growth as market based instruments to curb emissions [50]. In a setting where such a tax is imposed on a product that is (also) an input to the production of other goods and services, the tax will have an impact on all prices in the economy. The direction and magnitude of that impact depends on the input-output relationships in the economy and can therefore not be ascertained a priori. Put differently, relative prices may change throughout the economy, but it will not be possible to say whether the price of the taxed good will increase or decrease relative to other prices. Since a change in relative prices affects measured GDP through the valuation of the basket of products, it is a distinct possibility (although one that needs to be explored empirically based on real input-output relationships) that green policies initially exert a negative impact on measured GDP. Of course, in a partial analysis, the effect of introducing a tax is unequivocal. It will always increase the price with the magnitude depending on the elasticities of supply and demand.
Measured GDP may also change if the other two approaches alluded to above are used, but again the direction of change remains unclear. After all, the net effect of adding or subtracting items to or from GDP does not appear unequivocal either, nor does the net effect of shuffling items from the input to the output side and vice versa, not least because it is debatable what should be counted in the first place. However, assuming that, on balance, undervalued resources or inputs pose a greater problem than undervalued outputs, a more accurate valuation is likely to decrease GDP. There is thus a potential trade-off between measuring growth correctly and achieving higher nominal growth.
5. Green Growth as Measurement Issue
No matter how green growth is defined in the end, progress towards green growth needs to be measured by means of suitable indicators in order to:
- ascertain that policy objectives are reached and that the need for further action is clearly identified (monitoring and benchmarking),
- ensure that efficient policy instruments are used (or at least in order to verify the efficiency of instruments ex post) while identifying possible trade-offs between objectives (analysis),
- help to communicate results to policy makers and the wider public [51].
By suitability, it is meant that such indicators are policy relevant, analytically sound, measurable, and useful for communication [2].
The discussion in the previous sections indicates that the conceptualization of green growth has a fundamental impact on its measurement and the concomitant choice of indicators for both the green and the growth parts of green growth. After all, our understanding of green growth determines what is supposed to be measured in the first place. On top of that, there is the issue of whether and to what extent different (sub-) measures are to be integrated into one or several composite indicators. Then there is the issue of spatial aggregation and disaggregation, which changes fundamentally as we move from one sphere to another. Last but not least, measurement may focus on policy instruments, intermediate results or final outcomes depending on the various stages of the policy making process [6], and all endpoints so understood have pros and cons. Each of these issues will be discussed briefly in the following paragraphs.
5.1. What Is to Be Measured?
A more comprehensive approach towards green growth makes it necessary to measure more things in both qualitative and quantitative terms. If not only local emissions are to be reduced, for instance, but also resource use more broadly understood, then this is what needs to be monitored as well. Further, if on top of reducing local emissions and resource use, planetary boundaries are to be respected, then these too need to be measured. Moreover, as environmental problems evolve from being local (and localized) phenomena to being global phenomena such as climate change or oceanic acidification, their spatial dimension needs to be taken into account, in particular if the environmental phenomenon at issue is not uniform across space and time so that only few measuring points suffice to give a clear picture.
By and large, the same considerations apply to the growth component of green growth. Any conceptualisation of growth that goes beyond GDP implies that more features of the socio-economic environment need to be measured. For instance, if not only average income or GDP is to be considered but also the distribution of income, then a measure of inequality is necessary. One well-known measure would be the Gini index, but there are also others such as the Theil index, the Palma ratio, or the Hoover index. The Gini coefficient is defined mathematically based on the Lorenz curve, which plots the proportion of the total income of the population (y axis) that is cumulatively earned by the bottom x% of the population. The Theil index measures an entropic ‘distance’ the population is away from the egalitarian state of everyone having the same income. The Palma ratio is defined as the ratio of the richest 10% of the population’s share of gross national income divided by the poorest 40%’s share [52]. The Hoover index is the proportion of all income that would have to be redistributed to achieve a state of perfect equality. See [53] for an overview of inequality measures. Each of these indices has not only methodological pros and cons, but their interpretation is also not always straightforward and therefore may pose problems in a political context where difficult concepts cannot easily be communicated to a non-specialist audience.
Another consideration to be addressed is to what extent indicators are supposed to link both the green and the growth sides. In other words, to what extent are indicators used that combine measures of greenness (such as resource use or measures of environmental impacts) with measures of growth (such as GDP-growth) into a single indicator such as resource efficiency, as discussed in [15].
5.2. Integration of Measures?
Methodologically, measuring progress towards a multidimensional phenomenon such as green growth can follow two distinct strategies. The first strategy uses a set of meaningful and sufficiently robust indicators to measure the different dimensions of green growth but does not seek to amalgamate these indicators into a single measure or composite indicator. This is the approach the OECD has been following so far [16]. The second strategy aims at precisely that; by combining various indicators into one composite indicator, the information provided by different indicators is amalgamated into, and thus summarized by, a single figure. Since these two strategies consist of distinct alternatives, their pros and cons essentially mirror each other.
Accordingly, composite indicators [54]:
- Can summarise complex, multi-dimensional realities with a view to supporting decision-makers.
- Are easier to interpret than a battery of many separate indicators.
- On the other hand, composite indicators:
- May send misleading policy messages if poorly constructed or misinterpreted.
- May invite simplistic policy conclusions.
- The selection of indicators and weights could be the subject of political dispute.
Moreover, as long as there is no consensus on an analytical framework or a set of indicators to monitor green growth [51], any composite indicator is likely to exhibit a considerable degree of instability, which has to be weighed against possible advantages. Behind these considerations lurks a dilemma, which is difficult to resolve. If the constituent parts of a composite indicator tend to point in the same direction (if their correlation is positive and high), then assigning weights is unlikely to be contested since the choice of specific weights does not change outcomes by much. By contrast, if the constituent parts of a composite indicator point in different directions, i.e., if they convey conflicting messages, then a consensus on weights is less likely to emerge.
At the end of the day, the choice of a strategy and, in particular, the move towards a composite indicator of green growth may be driven more by the extent to which a green growth agenda has gained political traction and less by the specific methodological arguments underpinning that choice. After all, the shortcomings of GDP have been well known for decades among both economists and policy makers. However, this has prevented neither group from according GDP centre stage in both economic analysis and policy formulation, and there are few signs to indicate that this will change any time soon.
5.3. Endpoints or Intermediate Objectives
When measuring progress towards green growth, it is natural to assume that the focus should be on the objectives that are to be reached by a green growth strategy. Thus, depending on the conceptualisation of green, measurement should focus on emission levels, resource use, or planetary boundaries together with the chosen conceptualisation of growth. While this makes sense in the light of some of the objectives of measurement highlighted above, it does by no means make sense for all of them. This has to do with the fact that the purpose of measurement may also be to assess the effectiveness of policy measures or even their efficiency. For this reason, it may not be the best option to resort to an indicator that is relatively distant from the policies that are to be assessed. After all, there may be plenty of intervening variables that disturb any straightforward statistical relationship between policies and objectives.
Consider, for example, policies that aim at lowering emissions via increasing energy efficiency by promoting R&D. Such policies may be based on the following causal chain. This is an adaptation of the linear model of innovation, which emphasizes scientific research as the basis of innovation. See [55]:
Political change/market opportunity → Additional spending on R&D → More researchers → More basic research → More applied research and development → Production and diffusions of more efficient products → Higher rate of efficiency improvements → Lower energy use.
While this causal chain is by no means exhaustive or singular, two observations come to mind. First, the causal chain presupposes that innovation is by and large science driven rather than consumer/user driven, as argued by von Hippel [56]. Second, at any of the links in the chain, one or several factors may intervene that undermine the propagation of the initial effect, be it because actors do not respond as expected or because some crucial state variables upon which the effectiveness of policy measures depends are not under the control of policy makers. See Table 1 for some examples. In the end, it can by no means be taken for granted that the expected effects will invariably occur. Third and most importantly, at least some of the possible effects would actually run counter to the objectives of the policy measure, be it directly or indirectly, thereby undermining these policies at least partially.
With regard to the issue of measurement, the above discussion suggests that an indicator such as energy efficiency, which figures prominently among the indicators featured by the OECD for instance, is likely to give a misleading signal, in particular if efficiency is calculated at the product category level and thus from a technical perspective. While it may still respond as expected to R&D policies, the (downstream) link with actual energy use appears less straightforward. At issue here is the extent to which rebound effects occur [37,57,58,59]. Rebound effects are defined as the difference in percentage terms between the initial (technical) efficiency improvement predicted by an engineering model and the actual (realised) reduction in, say, fuel consumption. Thus if the fuel efficiency of cars increases by 10% while fuel consumption decreases by only 5%, then the rebound effect would be 50%.
There are a number of mechanisms through which rebound effects may occur, but the initial effect is usually the reduction of the cost of energy services caused by an efficiency improvement [60]. Thus, to further exploit the above example, greater fuel efficiency reduces the costs of driving a car. As a consequence, people may drive more often or longer distances (direct rebound effects—income). However, people may also switch from public transport to using their own car (direct rebound effects—substitution). In addition to these direct rebound effects, there are also indirect rebound effects. Indirect rebound effects include the embodied energy, i.e., the energy that is required to achieve the efficiency improvement, and secondary effects. The latter denote the possibility that consumers use some of the saved fuel costs for other (equally energy intensive) goods and services. In addition, there is the possibility that greater energy efficiency may foster overall productivity growth, thereby boosting further economic expansion and, as a consequence, the increased consumption of goods and services. Rebound effects are therefore a key intervening variable between, on the one hand, policies that seek to achieve efficiency improvements at the product and service levels and any macro-level measure of efficiency on the other.
Estimates of the size of rebound effects differ considerably depending on the investigated type of good and service and on the used methodology, reaching from a few percent to 100%, e.g., for lighting [61]. It goes beyond the scope and the objectives of the present paper to review the extensive literature on rebound effects and their estimation. Suffice it to note that there is a considerable contrast between the (potential) role of rebound effects and their respective ignorance in the current debate on green growth and climate policies more broadly. While such agnosticism would be justified had there been a consensus that rebound effects are negligible, it becomes problematic in the absence of strong countervailing evidence for countries as diverse as China, the US, and the UK and estimates ranging from 12% (UK) to a staggering 208% (China) [62].
In the light of these considerations, measuring progress towards green growth needs to take into account a measure of rebound effects. In the absence of such a measure, neither the effectiveness of policy measures with a view to achieve efficiency improvements via R&D nor possible reasons for insufficient progress towards green growth can be elucidated.
6. Green Growth as a Governance Problem
Transforming traditional economic growth into green growth is not only a technological problem. It is also a governance problem in the sense that it requires appropriate governance mechanisms and institutional settings that enable societies to weigh scientific evidence and degrees of uncertainty with an assessment of the risks to be taken and the costs to be endured and to negotiate on this basis societal objectives and policy instruments in a comprehensive and consistent manner [29].
Empirically, environmental governance is characterised on a global scale by international treaties and on a local (i.e., mostly national) scale by predominantly regulatory approaches [63] with economic instruments such as emission trading still being the exception rather than the rule. Both governance types are based on incremental change rather than a comprehensive transformative change, and both have been increasingly criticised as inefficient and ineffective [64]. For instance, it usually takes a considerable amount of time to negotiate international treaties, and once an agreement has been forged, it often falls short of what is scientifically required while compliance and enforcement still remain insufficient. The Kyoto Protocol is a case in point in that its design (unlike that of the Montreal Protocol) failed to enforce targets and timetables, suggesting that in the future more than one treaty and more than one treaty design may be required to address GHG emissions successfully [65].
Regulatory approaches, on the other hand, often suffer from regulatory capture by various lobbies [66,67] and are generally re-active rather than pro-active. Action is only taken once some (visible) damage has occurred and political pressure has risen sufficiently. Moreover, regulatory approaches may be effective but still economically inefficient. Obviously, therefore, a successful green growth agenda has to improve on these accounts, considering that, as societies move towards a more comprehensive sphere of greenness and growth, incremental change falls increasingly short of what is required and must be superseded by a deep transformation.
To investigate the matter further, note first that, conceptually, environmental problems stemming from economic activity are often seen to be caused by basically two kinds of market failures; positive and negative externalities on the one hand and common pool resources (which may face congestion problems) and public goods (which do not) on the other. Correspondingly, the suggested policy response to the first type of market failure has been to correct prices by introducing a Pigouvian tax or some such, while the response to the second kind of market failure has traditionally been either government provision or at least government regulation and control (whether policy makers have followed this advice is, of course, a different matter).
A link between both categories of market failure is provided by the claim that these categories of environmental problems are routed in either unspecified or at least insufficiently specified property rights. Concomitantly, if these property rights were fully specified and if market participants could exchange resources freely, then an efficient allocation would emerge [68,69] and no further government intervention beyond the protection of property rights would be required.
Far from embracing fully its implications, Coase’s critique of traditional welfare economics has become one of cornerstones of new institutional economics and its emphasis on environmental problems as instances of interdependence and the acknowledgement of positive transaction costs [70]. More specifically, ‘environmental governance is understood as the resolution of conflicts over environmental resources through the establishment, reaffirmation and change of institutional arrangements’ [71], thereby going beyond the mere determination, affirmation, and protection of property rights. On the contrary, institutional economists have identified a multitude of institutional settings and governance solutions in response to different kinds of environmental and resource allocation problems [72]. Against this background, they argue that ‘[I]nstitutional change and choice are becoming increasingly critical for environmental governance as industrialisation and commercialisation of the use of environmental resources have reached a global scale and have presented new governance challenges beyond the experience of governments’ [70].
An important strand of this literature deals with Multi Level Environmental Governance (MLEG). MLEG encompasses those environmental governance solutions that involve at least two levels of decision-making [73]. Another useful distinction can be made between general-purpose, non-intersecting, and durable jurisdictions and task-specific, intersecting, and flexible jurisdictions [74]. In the following, the reasons for the emergence of MLEG will briefly be reviewed. On this basis, it will then be argued that a green growth strategy necessitates paying close attention to the institutional setting in which this strategy is to be embedded but in particular to the features highlighted by the MLEG approach.
To begin with, note that there are at least four economic reasons for Multi-Level Environmental Governance (MLEG) solutions [73]. As will be argued, a green growth strategy will be confronted with, and therefore has to address, all four reasons for MLEG; the more it does so, the more encompassing both content-wise and geographically such a strategy becomes.
6.1. Collective Action
Global boundaries and many issues of resource use and conservation constitute, in essence, problems that span a multitude of jurisdictions. Given the large number of actors, freeriding is likely to occur [75]. A possible solution to this problem consists of creating a supra-national governance level that is vested with certain decision-making powers and that takes decisions following pre-specified procedures and mechanisms. Collective action is further facilitated in such a setting if the number of actors is reduced through representation and/or majority voting, which reduces the power of actors to veto decisions. The EU is an obvious example for such a supra-national governance solution. However, limited progress with respect to climate protection demonstrates that, in general, supra-national arrangements are still struggling to make a dent. A global green growth strategy is therefore unlikely to succeed unless governance solutions are found that help to overcome obstruction and freeriding and that allow effective decisions to be made within an appropriate time frame.
6.2. Governance Costs
The diverse nature of the environmental problems highlighted in the context of a green growth agenda, ranging from land-use patterns in some regions to global emissions, suggest that a single level of implementation is neither feasible nor optimal. The EU is (again) a case in point in that environmental legislation in many areas (but not all) resides at the Union level but its implementation falls under the responsibility of member states and the competent authorities therein. This suggests that, depending on the specific governance functions required, ‘a multi-level governance solution may minimize governance costs if and when governance functions have different optimal scales of implementation’ [73]. However, while such a recommendation appears straightforward provided that environmental issues and government functions correspond to a large extent, it is less evident in the case of multi-functional resources (see below), for which it is not manifest that decision making (one government function) resides naturally with a specific governance level and enforcement (or implementation) with another. This being said, governance costs (including the costs of inaction or delayed action) may still provide a strong argument for looking for more formalised and institutionalised decision-making procedures at the supra-national level with a view to replace the current mode of governing global challenges by means of a series of international conferences, the results of which often fall short of expectations.
6.3. Path Dependence
Path dependence may be due to large set-up costs, learning and coordination effects, or adaptive expectations. If it occurs, path dependence has essentially two possible implications. On the downside, path dependence is often held responsible for institutional lock-in and thereby the maintenance of ineffective or at least inefficient solutions, e.g., the choice of regulation over more market based approaches such as emission trading. On the upside, path dependence allows for the possibility to provide additional governance functions at relatively low costs given that the overhead remains largely fixed. Irrespective of whether one or the other argument prevails, they both account for the fact that (existing) central and local governments are usually the default players when it comes to addressing environmental issues. However, in a situation where environmental issues have undergone not only quantitative but also qualitative changes, existing institutional settings may no longer be adequate for the purpose at hand and hence impede the required changes.
6.4. Multi-Functionality
Multi-functionality refers to the possible multiple use of natural resources such as forests and watercourses [73]. The concept is thus akin to the notion of characteristics introduced by Lancaster [76], which sees goods as having a multitude of attributes. Ecosystem services that benefit humans include, for example, of the recycling of nutrients, regulation of run-off and river discharge, coastal protection, and carbon sequestration [77]. What makes such multi-functionalities special from a governance point of view is that their respective beneficiaries may be spatially and temporally quite diverse. In other words, who benefits when and to what extent from a specific service may differ widely for any specific resource. In addition, the interests of different beneficiaries may not coincide, as is obvious in the case of a tropical forest, which may provide timber, help to sequester carbon, or store water but not simultaneously to the same degree and at the same time. The governance of the provisioning of a multitude of ecosystem services from multi-functional resources can therefore arguably most effectively be arranged by using many spatially divergent solutions [73].
All in all, the above considerations suggest that green growth may not be feasible without appropriate (and therefore possibly new) institutional settings and solutions. Achieving green growth is, from this perspective, not just a matter of finding the right policy instruments, but also of designing and implementing governance solutions that enable societies to identify, decide on, and carry out policies. What is more, there is an intimate link between governance and policy instruments in the sense that, in some cases, the governance solution is already (a significant part of) the solution to the environmental problem (for example when a natural resource is nationalised and its exploitation is managed by the public administration according to some predefined principles and rules), while in others the governance solution is only the precondition for choosing and implementing a policy instrument (for example an emission trading system), which, for its functioning, depends on other actors and or complementary private institutions and bodies such as (in the case of the emission trading system in Europe) the European Climate Exchange (ECX) in London or the European Energy Exchange (EEX) in Leipzig.
This issue is further compounded if (and to the extent that) economic growth is not exclusively assessed in terms of GDP but complemented, corrected, or even (partially) replaced by something else. Doing so does not only raise a host of conceptual and measurement issues, it also means that policy instruments (and possibly the governance solutions that these instruments require) need to be adapted. Consider by way of example the possible distributional effects of a green growth strategy. Not only is it necessary to measure these effects (and therefore to agree on a methodology), society must also decide on its distributional objective function and the policy instruments that help to achieve these objectives, none of which is straightforward.
7. Conclusions
The purpose of this paper was to shed some light on the notion of green growth, its two conceptual components (‘green’ and ‘growth’), and the possible interrelationships between both. In doing so, the paper seeks to explore the implications of possible (and plausible) ways to understand green growth for research, measurement and, ultimately, governance and policy making. Categorising green growth following possible understandings of its components indicates that any choice in this regard has profound implications for the respective interlinkages between green and growth, the way both concepts are measured, and its governance. This paper constitutes a first attempt at identifying some of the more salient problems in this regard but clearly cannot do so exhaustively.
What it does suggest though is that a green growth policy agenda cannot be confined to the identification of a set of suitable policy instruments, as this would only be the second step after first choosing among possible ways to conceptualise green growth. Having done that though, the choice of policy instruments is then intimately interwoven with the choice of indicators to assess the state of affairs and measure progress and with the choice of appropriate governance solutions, which in part shape already the choice of policy options while in part being necessary to implement whatever instrument is chosen. Evidently, this task becomes all the more challenging as the traditional domains and objectives of environmental policies are being superseded by the need to ensure compliance with global environmental boundaries, which almost by definition defy traditional geographical and political frontiers.
Moreover, the expectation entertained by many policy makers that green growth could become the magic bullet that allows mankind to continue on its growth path without major restraints on the magnitude and composition of economic growth may still not be unfounded. However, in order to become reality, challenges must be overcome, which the discourse on green growth is only beginning to grasp. Thus, rather than offering a ready-made solution, green growth has to be seen as a way to phrase the problem.
Acknowledgments
I would like to thank Alexandra Marques and two anonymous referees for their very helpful comments and suggestions on earlier drafts of this paper.
Conflicts of Interest
The author declares no conflict of interest.
References
- Schmalensee, R. From “Green Growth” to sound policies: An overview. Energy Econ. 2012, 34, S2–S6. [Google Scholar] [CrossRef]
- OECD. Towards Green Growth; OECD: Paris, France, 2011. [Google Scholar]
- Hallegatte, S.; Heal, G.; Fay, M.; Treguer, D.; Stephane, H.; Geoffrey, H.; David, T. From Growth to Green Growth—A Framework; National Bureau of Economic Research: Washington, DC, USA, 2012.
- Toman, M. Green Growth: An Exploratory Review; World Bank Policy Research Working Paper; The World Bank: Washington, DC, USA, 2012. [Google Scholar]
- Fay, M. Inclusive Green Growth: The Pathway to Sustainable Development; World Bank Publications; The World Bank: Washington, DC, USA, 2012. [Google Scholar]
- UNEP. Towards a Green Economy: Pathways to Sustainable Development and Poverty Eradication; UNEP: Nairobi, Kenya, 2011. [Google Scholar]
- Ahlert, G.; Meyer, B.; Zieschank, R.; Diefenbacher, H.; Nutzinger, H.G. Synopsis of Approaches to Welfare and of Green Growth Concepts Currently under Discussion. In GWS Discussion Paper 2013; GWS—Institute of Economic Structures Research: Osnabrück, Germany, 2013. [Google Scholar]
- Smulders, S.; Toman, M.; Withagen, C. Growth theory and ‘green growth’. Oxf. Rev. Econ. Policy 2014, 30, 423–446. [Google Scholar] [CrossRef]
- Daly, H.E. Steady-State Economics; Island Press: Washington, DC, USA, 1991. [Google Scholar]
- Jacobs, M. Green Growth: Economic Theory and Political Discourse; Centre for Climate Change Economics and Policy Working Paper; Centre for Climate Change Economics and Policy: London, UK, 2012. [Google Scholar]
- Bowen, A.; Fankhauser, S. The green growth narrative: Paradigm shift or just spin? Glob. Environ. Chang. 2011, 4, 1157–1159. [Google Scholar] [CrossRef]
- Barbier, E.B. Capitalizing on Nature: Ecosystems as Natural Assets; Cambridge University Press: Cambridge, UK, 2011. [Google Scholar]
- Sullivan, S. What’s ontology got to do with it? On nature and knowledge in a political ecology of the‘green economy’. J. Political Ecol. 2017, 24, 217–242. [Google Scholar]
- Huysman, S.; Sala, S.; Mancini, L.; Ardente, F.; Alvarenga, R.A.F.; De Meester, S.; Mathieux, F.; Dewulf, J. Toward a systematized framework for resource efficiency indicators. Resour. Conserv. Recycl. 2015, 95, 68–76. [Google Scholar] [CrossRef]
- Eisenmenger, N.; Giljum, S.; Lutter, S.; Marques, A.; Theurl, M.C.; Pereira, H.M.; Tukker, A. Towards a conceptual framework for social-ecological systems integrating biodiversity and ecosystem services with resource efficiency indicators. Sustainability 2016, 8, 201. [Google Scholar] [CrossRef]
- OECD. OECD Green Growth Studies. In Green Growth Indicators: 2014; OECD: Paris, French, 2014. [Google Scholar]
- Danielsen, F.; Beukema, H.; Burgess, N.D.; Parish, F.; Bruehl, C.A.; Donald, P.F.; Murdiyarso, D.; Phalan, B.; Reijnders, L.; Struebig, M. Biofuel plantations on forested lands: Double jeopardy for biodiversity and climate. Conserv. Biol. 2009, 23, 348–358. [Google Scholar] [CrossRef] [PubMed]
- Fitzherbert, E.B.; Struebig, M.J.; Morel, A.; Danielsen, F.; Brühl, C.A.; Donald, P.F.; Phalan, B. How will oil palm expansion affect biodiversity? Trends Ecol. Evol. 2008, 23, 538–545. [Google Scholar] [CrossRef] [PubMed]
- Murray, J.; King, D. Climate policy: Oil’s tipping point has passed. Nature 2012, 481, 433–435. [Google Scholar] [CrossRef] [PubMed]
- Kerschner, C.; Prell, C.; Feng, K.; Hubacek, K. Economic vulnerability to Peak Oil. Glob. Environ. Chang. 2013, 23, 1424–1433. [Google Scholar] [CrossRef]
- Milici, R.C.; Flores, R.M.; Stricker, G.D. Coal resources, reserves and peak coal production in the United States. Int. J. Coal Geol. 2013, 113, 109–115. [Google Scholar] [CrossRef]
- Maggio, G.; Cacciola, G. When will oil, natural gas, and coal peak? Fuel 2012, 98, 111–123. [Google Scholar] [CrossRef]
- Stiglitz, J. Growth with exhaustible natural resources: Efficient and optimal growth paths. Rev. Econ. Stud. 1974, 41, 123–137. [Google Scholar] [CrossRef]
- Hardin, G.; Hardin, G.; Hardin, G. The tragedy of the commons. Science 1968, 162, 1243–1248. [Google Scholar] [CrossRef] [PubMed]
- Gardner, R.O.Y.; Ostrom, E.; Walker, J.M. The Nature of Common-Pool Resource Problems. Ration. Soc. 1990, 2, 335–358. [Google Scholar] [CrossRef]
- Rockström, J.; Steffen, W.; Noone, K.; Persson, Å.; Chapin, F.S., III; Lambin, E.; Lenton, T.M.; Scheffer, M.; Folke, C.; Schellnhuber, H.J.; et al. Planetary Boundaries: Exploring the Safe Operating Space for Humanity. Ecol. Soc. 2009, 14, 32. [Google Scholar]
- Dasgupta, P.; Levin, S.; Lubchenco, J. Economic pathways to ecological sustainability. BioScience 2000, 50, 339–345. [Google Scholar] [CrossRef]
- Rockström, J.; Steffen, W.; Noone, K.; Persson, A.; Chapin, F.S.; Lambin, E.F.; Lenton, T.M.; Scheffer, M.; Folke, C.; Schellnhuber, H.J.; et al. A safe operating space for humanity. Nature 2009, 461, 472–475. [Google Scholar] [CrossRef] [PubMed]
- Biermann, F. Planetary boundaries and earth system governance: Exploring the links. Ecol. Econ. 2012, 81, 4–9. [Google Scholar] [CrossRef]
- Bowen, A.; Hepburn, C. Green growth: An assessment. Oxf. Rev. Econ. Policy 2014, 30, 407–422. [Google Scholar] [CrossRef]
- Arrow, K.J.; Dasgupta, P.; Goulder, L.H.; Mumford, K.J.; Oleson, K. Sustainability and the measurement of wealth. Environ. Dev. Econ. 2012, 17, 317–353. [Google Scholar] [CrossRef]
- Rosenbaum, E.; Ciuffo, B. Sustainability via Intergenerational Transfers in a Stock-Flow-Consistent Model. Metroeconomica 2016. [Google Scholar] [CrossRef]
- Stiglitz, J.E.; Sen, A.; Fitoussi, J.-P. Report by the Commission on the Measurement of Economic Performance and Social Progress; Commission on the Measurement of Economic Performance and Social Progress: Paris, France, 2009. [Google Scholar]
- Easterlin, R.A.; McVey, L.A.; Switek, M.; Sawangfa, O.; Zweig, J.S. The happiness—Income paradox revisited. Proc. Natl. Acad. Sci. USA 2010, 107, 22463–22468. [Google Scholar] [CrossRef] [PubMed]
- Lipsey, R.G.; Lancaster, K. The general theory of second best. Rev. Econ. Stud. 1956, 24, 11–32. [Google Scholar] [CrossRef]
- Jakob, M.; Edenhofer, O. Green growth, degrowth, and the commons. Oxf. Rev. Econ. Policy 2014, 30, 447–468. [Google Scholar] [CrossRef]
- Sorrell, S. Energy, Economic Growth and Environmental Sustainability: Five Propositions. Sustainability 2010, 2, 1784–1809. [Google Scholar] [CrossRef]
- Ehrlich, P.R.; Holdren, J.P. Impact of Population Growth. Science 1971, 171, 1212–1217. [Google Scholar] [CrossRef] [PubMed]
- Jackson, T. Prosperity without Growth: Economics for a Finite Planet; Earthscan: London, UK, 2009. [Google Scholar]
- Bretschger, L. Climate Policy and Economic Growth. Resour. Energy Econ. 2017, 49, 1–15. [Google Scholar] [CrossRef]
- Van den Bergh, J.C.J.M. A third option for climate policy within potential limits to growth. Nat. Clim. Chang. 2017, 7, 107–112. [Google Scholar] [CrossRef]
- Moore, F.C.; Diaz, D.B. Temperature impacts on economic growth warrant stringent mitigation policy. Nat. Clim. Chang. 2015, 5, 127–131. [Google Scholar] [CrossRef]
- Naqvi, A.; Zwickl, K. Fifty shades of green: Revisiting decoupling by economic sectors and air pollutants. Ecol. Econ. 2017, 133, 111–126. [Google Scholar] [CrossRef]
- Copeland, B.R.; Taylor, M.S. Trade and the Environment: Theory and Evidence; Princeton University Press: Princeton, NJ, USA, 2013. [Google Scholar]
- Huberty, M.; Gao, H.; Mandell, J.; Zysman, J. Shaping the Green Growth Economy: A Review of the Public Debate and the Prospects for Green Growth; Berkeley Roundtable on the International Economy: Berkeley, CA, USA, 2011. [Google Scholar]
- Fankhauser, S.; Hepburn, C.; Park, J. Combining multiple climate policy instruments: How not to do it. Clim. Chang. Econ. 2010, 1, 209–225. [Google Scholar] [CrossRef]
- Rosenbaum, E. Zero growth and structural change in a post Keynesian growth model. J. Post Keynes. Econ. 2015, 37, 623–647. [Google Scholar] [CrossRef]
- European Commission. Closing the Loop—An EU Action Plan for the Circular Economy; European Commission: Brussels, Belgium, 2015. [Google Scholar]
- Smulders, S. Environmental policy and sustainable economic growth. Economist 1995, 143, 163–195. [Google Scholar] [CrossRef]
- Barbier, E.B. Are There Limits to Green Growth? World Econ. 2015, 16, 163–192. [Google Scholar]
- Green Growth Knowledge Platform. Moving towards a Common Approach on Green Growth Indicators; Green Growth Knowledge Platform Scoping Paper; OCED: Paris, France, 2013. [Google Scholar]
- Palma, J.G. Homogeneous Middles vs. Heterogeneous Tails, and the End of the ‘Inverted-U’: It’s All About the Share of the Rich. Dev. Chang. 2011, 42, 87–153. [Google Scholar] [CrossRef]
- Coulter, P.B. Measuring Inequality: A Methodological Handbook; Westview Press: Boulder, CO, USA, 1989. [Google Scholar]
- European Commission and Organisation for Economic Cooperation and Development. Handbook on Constructing Composite Indicators: Methodology and User Guide; OECD: Paris, France, 2008. [Google Scholar]
- Godin, B. The Linear Model of Innovation: The Historical Construction of an Analytical Framework. Sci. Technol. Hum. Values 2006, 31, 639–667. [Google Scholar] [CrossRef]
- Von Hippel, E. The dominant role of users in the scientific instrument innovation process. Res. Policy 1976, 5, 212–239. [Google Scholar] [CrossRef]
- Greening, L.A.; Greene, D.L.; Difiglio, C. Energy efficiency and consumption—The rebound effect—A survey. Energy Policy 2000, 28, 389–401. [Google Scholar] [CrossRef]
- Jenkins, J.; Nordhaus, T.; Shellenberger, M. Energy Emergence: Rebound and Backfire as Emergent Phenomena; Breakthrough Institute: Oakland, CA, USA, 2011. [Google Scholar]
- Hanley, N.; McGregor, P.G.; Swales, J.K.; Turner, K. Do increases in energy efficiency improve environmental quality and sustainability? Ecol. Econ. 2009, 68, 692–709. [Google Scholar] [CrossRef]
- Sorrell, S. The Rebound Effect: An Assessment of the Evidence for Economy-Wide Energy Savings from Improved Energy Efficiency; UK Energy Research Centre: London, UK, 2007. [Google Scholar]
- Tsao, J.Y.; Saunders, H.D.; Creighton, J.R.; Coltrin, M.E.; Simmons, J.A. Solid-state lighting: An energy-economics perspective. J. Phys. D Appl. Phys. 2010, 43, 354001. [Google Scholar] [CrossRef]
- Brockway, P.E.; Saunders, H.; Heun, M.K.; Foxon, T.J.; Steinberger, J.K.; Barrett, J.R.; Sorrell, S. Energy Rebound as a Potential Threat to a Low-Carbon Future: Findings from a New Exergy-Based National-Level Rebound Approach. Energies 2017, 10, 51. [Google Scholar] [CrossRef]
- Dasgupta, S.; Laplante, B.; Wang, H.; Wheeler, D. Confronting the environmental Kuznets curve. J. Econ. Perspect. 2002, 16, 147–168. [Google Scholar] [CrossRef]
- Biermann, F.; Abbott, K.; Andresen, S.; Bäckstrand, K.; Bernstein, S.; Betsill, M.M.; Bulkeley, H.; Cashore, B.; Clapp, J.; Folke, C.; et al. Transforming governance and institutions for global sustainability: Key insights from the Earth System Governance Project. Curr. Opin. Environ. Sustain. 2012, 4, 51–60. [Google Scholar] [CrossRef]
- Barrett, S. Rethinking global climate change governance. Economics 2009, 3. [Google Scholar] [CrossRef]
- Laffont, J.-J.; Tirole, J. The politics of government decision-making: A theory of regulatory capture. Q. J. Econ. 1991, 106, 1089–1127. [Google Scholar] [CrossRef]
- Levine, M.E.; Forrence, J.L. Regulatory capture, public interest, and the public agenda: Toward a synthesis. J. Law Econ. Organ. 1990, 6, 167–198. [Google Scholar] [CrossRef]
- Coase, R.A. The Problem of Social Cost. J. Law Econ. 1960, 3, 1–44. [Google Scholar] [CrossRef]
- Coase, R. The Lighthouse in Economics. J. Law Econ. 1974, 17, 357–376. [Google Scholar] [CrossRef]
- Paavola, J.; Adger, W.N. Institutional ecological economics. Ecol. Econ. 2005, 53, 353–368. [Google Scholar] [CrossRef]
- Paavola, J. Institutions and environmental governance: A reconceptualization. Ecol. Econ. 2007, 63, 93–103. [Google Scholar] [CrossRef]
- Ostrom, E. Beyond Markets and States: Polycentric Governance of Complex Economic Systems. Am. Econ. Rev. 2010, 100, 641–672. [Google Scholar] [CrossRef]
- Paavola, J. Multi-Level Environmental Governance: Exploring the economic explanations. Environ. Policy Gov. 2016, 26, 143–154. [Google Scholar] [CrossRef]
- Hooghe, L.; Marks, G. Unraveling the Central State, but How? Types of Multi-level Governance. Am. Political Sci. Rev. 2003, 97, 233. [Google Scholar]
- Olson, M. The Logic of Collective Action: Public Goods and the Theory of Groups; Harvard University Press: Cambridge, MA, USA, 1965. [Google Scholar]
- Lancaster, K.J. A New Approach to Consumer Theory. J. Political Econ. 1966, 74, 132–157. [Google Scholar] [CrossRef]
- De Groot, R.S.; Wilson, M.A.; Boumans, R.M.J. A typology for the classification, description and valuation of ecosystem functions, goods and services. Ecol. Econ. 2002, 41, 393–408. [Google Scholar] [CrossRef]
Figure 1.
Spheres of Green.

Figure 2.
Conceptualisations of Growth.

Figure 3.
Growth vs. Green.

Table 1.
Expected and Possible Effects of Policies.
| Causator | Expected Effects | Risks |
|---|---|---|
| Additional spending on R&D | More researchers | Higher salaries for researchers |
| More researchers | More basic research | More research on fringe subjects |
| More basic research | More applied research and development | Deepened scientific knowledge without immediate application |
| More applied research and development | Production and diffusion of more efficient products | Production and diffusion of new products |
| Production and diffusion of more efficient products | Higher rate of efficiency improvements | Higher rate of technical progress in general |
| Higher rate of efficiency improvements | Lower energy use | Rebound effects |
© 2017 by the author. Licensee MDPI, Basel, Switzerland. This article is an open access article distributed under the terms and conditions of the Creative Commons Attribution (CC BY) license (http://creativecommons.org/licenses/by/4.0/).
Share and Cite
MDPI and ACS Style
Rosenbaum, E. Green Growth—Magic Bullet or Damp Squib? Sustainability 2017, 9, 1092. https://doi.org/10.3390/su9071092
AMA Style
Rosenbaum E. Green Growth—Magic Bullet or Damp Squib? Sustainability. 2017; 9(7):1092. https://doi.org/10.3390/su9071092
Chicago/Turabian StyleRosenbaum, Eckehard. 2017. "Green Growth—Magic Bullet or Damp Squib?" Sustainability 9, no. 7: 1092. https://doi.org/10.3390/su9071092
Note that from the first issue of 2016, this journal uses article numbers instead of page numbers. See further details here.