Biological Treatment of Fish Processing Saline Wastewater for Reuse as Liquid Fertilizer

Institute of Biological Sciences, Faculty of Science, University of Malaya, 50603 Kuala Lumpur, Malaysia
*
Authors to whom correspondence should be addressed.
Sustainability 2017, 9(7), 1062; https://doi.org/10.3390/su9071062
Submission received: 19 April 2017
/
Revised: 13 June 2017
/
Accepted: 14 June 2017
/
Published: 24 June 2017
Abstract
:The fish processing sector contributes serious organic pollution loads and high salinity to receiving waters. This research aimed to study the effect of salt (NaCl) concentration on the treatment efficiency of fish processing wastewater in a continuous flow system by natural biodegradation. This research also focused on the use of a laboratory-scale bioreactor, which is operated in an aerobic continuous flow system with a 5-day cycle treatment of three different concentrations of diluted fish processing wastewater (30-, 50-, and 100-fold) with salt concentrations varying from 0% to 7% w/v NaCl. The evaluation of system performance at nine different operating hydraulic retention times (HRT) that range from 2–10 days indicated that the substrate removal rates increase with the increase in HRT along with the increasing wastewater concentration. The optimum biomass yield was found at the 8-day HRT, and the highest substrate removal was obtained at 10-day HRT. The study on 11 different salt contents in wastewater at the optimal HRTs of 10, nine, and eight days showed the existence of inhibition effects on biomass growth and substrate removal from 3.0% salt concentration. The treated wastewater without offensive odor is feasible for its reutilization as an environmental friendly liquid fertilizer.
1. Introduction
Water use has been growing at more than twice the rate of population increase in the last century. Thus, the need for new water resources is inevitable. The reuse of treated wastewater is one of the permanent water resources that may have numerous applications [1]. In addition to reusable water production, wastewater treatment is important for health and environment protection through the reduction of waste and production of natural fertilizer, energy and many other advantages [2,3]. We can reuse the treated wastewater for beneficial purposes such as landscape irrigation and agricultural, toilet flushing, industrial processes, and replenishing a ground water basin. The reuse of treated wastewater offers a water resource and financial savings. Wastewater treatment can be tailored to meet the water quality requirements of a planned reuse [4].
Fish and fishery products represent one of the most-traded segments of the world food sector, with about 78 percent of seafood products estimated to be exposed to international trade competition [5]. In 2012, about 200 countries reported exports of fish and fishery products [6]. The fishery trade is especially important for developing nations, sometimes accounting for more than half of the total value of traded commodities. It represented about 10% of the total agricultural exports and 1% of the world merchandise trade in terms of value [5,6].
Malaysia’s total export of fish and other seafood exceeded RM 2.5 billion per annum [7]. The fisheries sector in Malaysia produced more than 1.5 million tonnes of fish, of which marine fisheries contributed more than 75% and the balance was contributed by aquaculture [8,9]. The fish processing industry is largely export-oriented and encompasses the processing of prawns, the canning of fish, and the production of surimi products. Fish processing, such as the making of pickled fish, frozen fish, salted fish, dried fish, smoked fish, fermented fish, fish crackers, fish sauce, fish noodle, fish satay, fish powder, fish balls, fish cake, and shrimp paste, was traditionally a family-operated industry in fishing villages. However, the trend toward commercial operations has increased lately with industrial-scale setups. The trend is likely to continue with the slow phase out of small family businesses in the coming years. For example, the making of fish balls and surimi is mostly industrial in nature now [9].
The intensive production of fisheries products have carried an environmental burden, as some of the fish processing factories in this region discharge untreated or partially treated effluents into the receiving streams and river have resulted in water pollution problem. In addition, fish processing industries have been known to pollute nearby beaches and shores by releasing wastewater. In terms of numbers, small and medium-sized firms dominate the food industry in Malaysia. Noncompliance is a direct result of the lack of appropriate treatment technology, over utilized capacity, and poor maintenance of the treatment systems [10,11]. At present, the fish processing industry plays an important role in South East Asia’s economy. This industry is now facing both high treatment costs and problems in the operation of conventional wastewater treatment plants. These operational problems are linked to high organic loading, high salt content and bad smell [12].
The fish processing wastewater are primarily generated from the operations of ice preservation, cleaning and grinding process in the fish processing plants. The wastewater has high loads of organic nutrients that originate primarily from carbonaceous compounds and nitrogen-containing compounds (protein, peptide, and volatile amines). In addition, the effluent may contain suspended and dissolved solids, microbes, and variable pH. Another important aspect of this industrial wastewater is its high salinity (Na+, Cl−, SO42−). In general, fish processing wastewater can be characterized by its chemical and physical characteristics. The presence of high chemical oxygen demand (COD) and organic nitrogen concentrations characterizes the wastewater in fish processing [13]. The important pollutant parameters of the wastewater are the chemical parameters of pH; the five-day biochemical oxygen demand (BOD5); the COD, ammoniacal nitrogen (NH3-N), nitrate nitrogen (NO3−-N), and phosphorus (P); and the physical parameters, such as temperature, odor, color, and solid contents [14,15].
The fish processing wastewater is subject to bacterial decay, causes heavy pollution and bad smell to receiving water. The pollutants contained in wastewater can cause eutrophication and oxygen depletion. Continual depletion of the oxygen in these waters would starve aquatic life of the oxygen it needs, and anaerobic decomposition of organic matter leads to the breakdown of proteins and other nitrogenous compounds, releasing hydrogen sulphide, methane, amines, diamines, and sometimes ammonia, all of which are potentially hazardous to the ecosystem, toxic to aquatic life in low concentrations, and also give rise to the development of obnoxious odors and unsightly scenes. Odors are very important to the public perception and acceptance of any fish processing wastewater treatment plant. Although relatively harmless, it may affect general public life by inducing stress, nausea or sickness. The spatial and temporal scale of the impacts of fish processing wastewater may vary depending on the amount and nature of the waste output [11,16,17,18]. However, local impacts are particularly obvious because wastewaters from fish processing industries are generally produced throughout a year, giving no chance for the environment to recover. Impacts are more likely to be detrimental when the same ecosystem receives wastewater from the cluster of processing industries.
Biological treatment uses microorganisms to remove organic solids and nutrients from wastewater, and it is generally considered to be more cost effective and an interesting method since it is friendly to the environment in treating high organic strength wastewaters, such as fish processing wastewater, as compared with physical and chemical treatment methods. Biological treatment involves the use of a biological reactor that contains wastewater rich in biodegradable organics and nutrients, in which organic matter is utilized by microorganisms for life-sustaining processes and as a food source to produce cell growth and reproduction; the nutrients available in the wastewater enhanced the growth of microorganisms and allowed the biological treatment to be effective. The assimilatory pathway occurs when microorganisms utilize nitrate to produce ammonia, which is then utilized as a nitrogen source to generate biomass [11,16,17,18,19]. The wastewater generated by fish processing factories after biological treatment has a high potential to be reused in agriculture since the main constituents are organic and nutrients substances capable of promoting plant growth and the wastewater do not contain known toxic or carcinogenic materials. Therefore, fish processing wastewater could be a valuable resource for agriculture. However, potential utilization of this fish wastewater has been limited because of its bad smell [11,16,17].
Fish processing wastewater was noted to contain high salinity (Na+, Cl−), caused both by the raw materials and seawater used in various processes, and salt is usually be added to a final wash to remove the last traces on the fish and improve water removal [20], the salinity of the fish processing wastewater depending on the products or species being processed and type of processing undertaken. The wastewater generated from precooking or brine treatment for canning of shrimp process is in the range of 2–3% w/v NaCl [21]. The canning process for mollusks such as mussels, oysters, clams or scallops also generates large quantities of wastewater with salt content above 2%. The mollusks are shelled and washed with 3 to 6% salt solution [22]. Characteristics of herring brine waste were found to contain 65 g/L chloride [23]. While the wastewater from the dried salted fish plant contains very high salt contents, ranging from 17 g to 46 g NaCl/L. A large volume of wastewater is produced from soaking and washing operations. The raw fish’s slime, blood and other contaminating substances are washed off using a 3% solution of clean salt in water. The dressed fish, or fish fillets, are soaked in mild brine (10%). After washing in clean brine solution, the eviscerated fish is salted in 21% brine [24].
High salinity can cause high osmotic stress or the inhibition of the reaction pathways in the organic degradation process. This results in a significant decrease in biological treatment efficiency. In addition, high salt content induces cell lysis, which causes increased effluent solids. The populations of protozoa and filamentous organisms required for proper flocculation are also significantly reduced by the elevated salt content [22,25,26,27,28]. Therefore, high salinity in fish processing wastewater will lead to difficulties in biological treatment processes [22]. In wastewater treatment, conflicting reports on the influence of salt or sodium chloride (NaCl) on the performance of biological treatment processes exist. Several reports indicated the adverse effects of high salinity or shocks of NaCl on organic removal efficiency and sludge settle ability [29,30]. Others reported that the constant application of NaCl to biological treatment systems does not upset the organic removal efficiency, thereby resulting in the good flocculation of the biomass. This shows that acclimation of the biomass and levels of salt are important factors that may explain these different observations. [26,31,32,33].
Salt concentrations above 2% (20 g/L NaCl) in the wastewater will affect the growth of the bacteria. Study from Joong et al. [34] in the experiment for examination of the salt effect on cellular growth show that there is no effect on cellular growth at concentrations of 1% and 2% NaCl, but observed that there is an effect on cellular growth at the concentration of 3.5% NaCl. Burnett [29] reported that operation of activated sludge process at salt contents higher than 20 g/L is characterized by poor flocculation, high effluent solids, and a severe decrease in substrate utilization rate. Hamoda and Al-Attar [32] published on the effect of standard sodium chloride on aerobic activated sludge treatment processes. They demonstrate that no decrease in wastewater treatment performance is observed at concentrations approaching 3% NaCl (w/w). Kargi and Uygur [35] investigated the effects of high salinity on aerobic attach growth such as trickling filter and rotating biological contactors. The results indicated that the rate and efficiency of COD removal decrease significantly with the increase in salt content above 20 g/L. The COD removal efficiency with salt-free wastewater is 95%. The COD removal decreases to 60% at 5% salt content due to the adverse effect of salt on microorganisms. The increase in salt content causes a linear reduction in the COD removal rate. Kargi and Dincer [36] reported that saline wastewaters with more than 2% salt resulted in low BOD removal and flocculation efficiencies of conventional biological processes such as activated sludge and attach-growth processes. It has been reported that a critical salinity concentration of approximately 1–2% (w/w) exists at which the mechanism governing bacteria aggregation and stability of sludge flocs changes. Below this critical concentration, double layer compression or the hydrophobic interactions improve inter bacterial interactions. However, as the concentration of salinity exceeds this limit, the tendency of bacteria aggregation or adsorption decreases [37]. Here, although salt acclimation can be expected from conventional processes, the extent of adaptation is limited, and thus conventional processes cannot be used to treat wastewaters containing more than 3% salt [27].
In nitrogen removal processes, the oxidation of ammonia to nitrite and then nitrite to nitrate (nitrification process) occurs under aerobic conditions (autotrophic bacteria), and the reduction of nitrate to nitrogen gas (denitrification process) occurs under anoxic conditions (hetetrophic bacteria) [38]. The system configuration, the instability in the experimental conditions with respect to temperature and pH, and the presence of inhibitory compounds are the factors that directly influence the extent of salt effect on the nitrification process [39,40]. Nitrification is also susceptible to inhibition by salt, which has been considered as an instability factor in many wastewater treatment plants, especially in industrial settings [39]. Kargi and Dincer [36] also reported that salt content reduces the rate and the efficiency of nitrification and denitrification at salt contents above 2% and 1%, respectively. Nitrobacter was more adversely affected by high salinity than Nitrosomonas, resulting in the accumulation of nitrite in the effluent at salt contents above 2%. The denitrification rate seemed more sensitive to salt inhibition than nitrification.
Panswad and Anan [41] investigated the effects of various salinity levels on ammonia and nitrate uptake rates of the biological nutrient removal systems (anaerobic/anoxic/aerobic). In the steady state, the specific ammonia and nitrate uptake rates decreased with increase in chloride concentrations. The total nitrogen removal dropped from 85% to 70% when the salt contents in wastewater have increased from 20 g/L to 30 g/L. Concurrently, when the salt contents in wastewater have increased from 5 g/L to 30 g/L, COD removal of the system also dropped from 90% to 71%. This indicated that the nitrifying and denitrifying bacteria are very sensitive to sudden high salt content even with a high degree of pre-acclimation. The phosphorous removal of this system decreased from 38% to 10% with gradually increase in salt content from 0 to 30 g/L. This indicates that poly-P bacteria have intense sensitivity to high salinity condition.
Currently, many saline wastewater treatment plants are able to overcome the technical problems associated with high salinity by diluting the saline waste stream with freshwater. Nevertheless, this practice is unsustainable due to the continuous pressure on industries to reduce freshwater consumption. The fish processing industry seeks cost-effective reduction and recycling technologies for fish processing wastewaters. The social and economic requirements for a low cost, simple operation, and a practical environmental technology wastewater treatment system inspired this study to design an efficient, cost-effective, and low-maintenance wastewater treatment system that is required by local fish processing industries for the treatment of fish processing saline wastewater, and the treated fish processing wastewater has high potential to be reused as liquid fertilizer in agriculture.
Industrial practice generally favors continuous processing rather than processing in single batches for relatively low overall investment and operating costs [10]. Aerobic natural biodegradation in continuous systems would be applied as a treatment option in small-scale fish processing industries to achieve treatment technology and economics. The utilization of natural biodegradation processes for the treatment of wastewaters has several reasons or benefits. Potential benefits to the environment, operations, and economics are implied in reference to the optimal operational cost of the fish processing industry in our country.
The objective of this research was to study the effect of various salt concentrations in three different types of fish processing wastewater (30-, 50-, and 100-fold diluted wastewater concentration) in an aerobic continuous flow system at the optimal HRT obtained. The performance of the continuous flow system was studied based on the efficiency of pollutants removal and the biomass yield in the wastewater containing 0% to 7% w/v NaCl with the aid of the natural microorganisms in the wastewater and the microorganisms developed inside the reactors. A better understanding of the potential inhibitory effect of salt content on biological treatment processes is necessary to consider the feasibility of fish processing saline wastewater disposal in continuous flow treatment systems.
Results from this study would be useful for determining the optimum operational conditions for fish processing wastewater treatment in a biological continuous flow system. The biological continuous flow system should minimize the amounts of pollutants in the effluent water to reduce environmental contaminant levels and improve the fish processing effluent water quality so that it can be reused satisfactorily as a liquid fertilizer for sustainable agriculture and the protection of environment quality.
2. Materials and Methods
2.1. Fish Processing Wastewater Preparation
Fish processing wastewater and fish blood were collected from the processing of edible fish species, which were purchased from a local fish market. The processing of fish involves hand-skinning, filleting, and washing with tap water. The fish processing wash water and fish blood were collected immediately in a beaker and homogenized by agitation on the stirrer plate for 30 min. The wastewater was then kept in a polyethylene bottle and subsequently stored in the freezer below 0 °C for future use.
To make the influent for feeding into the bioreactor, the raw wastewater was diluted with distilled water to achieve the required concentration. The fish processing wastewater was degraded continuously in different stages using various initial substrate concentrations with three different concentrations of wastewaters (30-, 50-, and 100-fold diluted liquids of original fish processing wastewater) at eleven different salt concentrations (0.5%, 1.0%, 1.5%, 2.0%, 2.5%, 3.0%, 3.5%, 4.0%, 5.0%, 6.0% and 7.0% w/v NaCl) and without salt content (0.0% w/v NaCl).The wastewater used as feed was maintained in a refrigerator at 4 °C. It was maintained in a feed reservoir and mixing was applied manually at regular intervals.
2.2. Experimental Setup and Operating Condition
The same was performed in two identical reactors made of Perspex with a capacity of 2000 mL (120 mm diameter and 215 mm high), at 30 °C. The working volume of the reactor was set to 1800 mL. Both reactors were operated continuously using an agitation speed of 250 rotations per minute (rpm) for uniform mixing and were supplied with air aeration using an aquarium air pump to achieve the aerobic environment. A heater in housing and a temperature sensor are embedded inside the reactor. This sensor is connected to a temperature controller and the reactor temperature was adjusted via a power control knob and set temperature switch/knob at the temperature controller. Temperature of the both reactor was set at 30 °C for operation, as it is according to the daytime temperature in Malaysia’s environment. The cycle length of each treatment is 5 days. Feeding and decanting were controlled by manual operations.
The detail of the usage cost for the laboratory scale bioreactor set up are: one unit of Perspex reactor (2 L capacity) assembled with one unit of agitation speed controller and temperature controller have cost about USD 350; the aeration unit for the reactor, one aquarium air pump connected with the silicon or Polyvinyl chloride (PVC) tube have cost USD 60, while the assembly tools and supplies for use with the bioreactor such as pliers and screw driver, silicone or grease, and the Polypropylene analytical funnels and syringe (100 mL) used for feeding and decanting of wastewater totally have cost about USD 40. Thus, for the two total identical laboratory scale aerobic bioreactor set up used in this research project, the average cost is about USD 800.
In the continuous flow system, the first phase of the experiments focused on the evaluation of system performance by evaluating the biomass yield and the substrate removal at nine different operating hydraulic retention times (HRTs) that ranged from 10–2 days (HRT of 10, 9, 8, 7, 6, 5, 4, 3, and 2 days) in 30-, 50-, and 100-fold diluted wastewaters in the reactor. The hydraulic retention time (HRT) was calculated as HRT = V/Q, where V = volume of the reactor (L), and Q = influent flow rate (L/day) [42,43]. The HRTs of 10 to 2 days were based on the working volume of the bioreactor, which was calculated using the fresh feed flow rates of 180 mL/day to 900 mL/day. The performance of the continuous system was measured every day using the samples withdrawn daily from each reactor. The fresh medium was fed into the bioreactor at a specific flow rate based on the operating HRT. The cycle length for each operating HRT was 5 days.
Nine different operating HRTs were investigated to determine the optimal HRT condition for the continuous flow reactor’s performance. HRT is an important factor that must be considered to achieve maximum biomass yields and substrate removal. To effectively treat the increased organic load, the hydraulic retention time of the bioreactor must correspond to the time required for the population to increase. The biodegradation rate might decrease if the optimum HRT and wastewater concentration are not satisfied [42,43]. Thus, the biodegradability of natural microorganisms under various HRTs and wastewater concentrations should be assessed to obtain optimal biodegradation conditions.
At the second phase, the effects of 11 different salt contents (NaCl: 0.5%–7.0%) and without salt content (NaCl: 0.0%) in the 30-, 50-, and 100-fold diluted wastewaters were then investigated in the continuous flow system at the obtained optimal HRT condition.
2.3. Analytical Methods
Wastewater characterization was performed for the prepared raw concentrated synthetic wastewater, diluted influent, daily withdrawn samples, and the final treated effluent of each operational cycle. The BOD5, COD, NH3-N, NO3−-N, P, pH, temperature, Total Suspended Solids (TSS), Volatile Suspended Solids (VSS) and biomass yield parameters were analyzed according to the procedures outlined in Standard Methods for Water and Wastewater Examinations [44,45].
2.3.1. Measurement of Physicochemical Parameter
pH Value
pH is a unit of measure which describes the degree of acidity or alkalinity of a solution at a given temperature. pH values from 0 to 7 are diminishingly acidic, whereas values of 7 to 14 are increasingly alkaline. At 25.0 °C, pH 7.0 is neutral, where the activities of the hydrogen and hydroxyl ions are equal, and it corresponds to 10−7 moles/L. Influent pH has a significant impact on wastewater treatment. The pH analysis is used to determine if the process is operating within the acceptable range of pH [42,44,45,46].
The pH value in this research was monitored by pH meter model Delta 320 (Mettler Toledo, Shanghai, P.R. China) using an integrated temperature electrode (ATC probe) method with automatic temperature compensation (ATC) measurement. For measurement, the pH ATC electrode probe was taken out from the 3 mol/L KCL (Potassium Chloride) storage solution and rinse with distilled water. Two-point calibration of pH 7.00 and pH 4.01 was done daily using calibration buffer of pH 4.01 and pH 7.00 before measurement of the sample. During 2nd point calibration; the pH meter’s screen will show the electrode probe slope value, slope value in the range of 90–105% shows that the electrode is in good condition. After calibration, the ATC probe was placing in a well-mixed sample greater than 10 mL for the pH value and temperature measurement [44,45,47].
Temperature
Temperature is the most important factor affecting biological processes. Microorganisms cannot control internal temperature so the ambient temperature determines their temperature [42,44,45]. In this research, temperature controller meter (BIOLAB, B. Braun, Melsungen, Germany) attached at the reactor. This temperature controller is a highly precise instrument that is able to control the temperature of and the power to the reactor vessel. The temperature of the vessel is also indicated on a digital display acting as an electronic reference thermometer. The temperature of bioreactor was fixed at 30 °C. Throughout the study, the temperature was kept constant at 30.0 ± 0.4 °C, while the temperature for the wastewater sample taken out from the bioreactor was measured using a pH meter with integrated temperature probe or a Mercury-filled Celsius Thermometer.
Total Suspended Solids (TSS)
In wastewater, TSS is primarily bacteria and bacterial flocs, algae and protozoa, and organic debris. TSS was determined by filtering sample through a 47 mm pre-weighed glass microfibre filter (GF/C) of 1.2 µm nominal pore size (Sartorius) using filtration set (Sartorius) and vacuum pump (Welch, Niles, IL, USA). Suspended solid is the portion retained on the filter. The filter is dry in an oven at 105 °C, cooled in a desiccator with moisture indicate silica gel inside, and reweighed. The amount of TSS is determined by weight differences between the filter paper alone and the weight plus retained solids after drying [42,44,45,46].
where:
- A = Mass of nonfilterable residue on Whatman GF/C filter after evaporation at 105 °C (mg),
- B = Mass of the filter paper prior to sample filtration (mg),
- C = Volume of the sample used for filtration (mL).
Volatile Suspended Solids (VSS)
VSS is a water quality measure obtained from the loss on ignition of TSS. The VSS analysis is applied most commonly to wastewater sludge to measure their biological stability on the basis of their volatility at 550 ± 50 °C. The organic fraction will be oxidized and will be driven off as gas at temperature of 550 ± 50 °C and are termed as “Volatile Suspended Solids”. The inorganic fraction remains as ash and is termed as “fixed suspended solids” (or mineral content of the suspended solids). Loss in weight is due to conversion of organic matter to CO2 and H2O [42,44,45,46].
The VSS is calculated by the equation below:
where:
- A = Mass of nonfilterable residue on Whatman GF/C filter after evaporation at 550 °C (mg),
- B = Mass of nonfilterable residue on Whatman GF/C filter afterignition at 150 °C (mg),
- C = Sample size that have used for filtration (mL).
Biomass Concentration
2.3.2. Measurement of Chemical Parameter: The Organic Content
5-Day Biochemical Oxygen Demand (BOD5)
The most widely used parameter of organic pollution applied to both wastewater and surface water is the 5-day BOD (BOD5). The BOD determination is an empirical test in which standardized laboratory procedures are used to determine the relative oxygen requirements of wastewaters, effluents and polluted waters used by microorganisms in the biochemical oxidation of organic matter during a specified incubation period of five, seven, or twenty days. The incubation period is usually five days at 20 °C, which is an average value for slow-moving streams in temperate climates and is easily duplicated in an incubator [42,44,45,46,48].
In this research, BOD was measured in a 5-day test period (BOD5) using a dilution method and has an accuracy check with a mixture of 150 mg/L each of glucose and glutamic acid. Since most wastewater has BODs that are much higher than the limited solubility of oxygen in water (8 mg/L at room temperature), it is necessary to make a series of dilutions containing varying amounts of sample in nutrient-containing, aerated dilution water. For samples whose BOD5 does not exceed 7 mg/L, dilution is not necessary. The fish processing wastewater sample was diluted with prepared dilution water so that adequate nutrients and oxygen will be available during the incubation period. Several dilutions with the calculated dilution factor were prepared to cover the complete range of possible values. The dilution water was prepared by adding 1 mL of each of the phosphate buffer solution, magnesium sulfate (MgSO4) solution, calcium chloride (CaCl2) solution, calcium chloride (CaCl2) solution and ferric chloride (FeCl3) solution per liter of aerated water at 20 °C [42,44,45,46].
The BOD test is performed in a specifically designed 300 mL BOD bottle with a ground-glass stopper that forms a water seal to keep out air, and the bottles are filled completely with the diluted sample. After an initial measurement of the dissolved oxygen (DO) with DO meter (YSI DO 200, YSI, Yellow Springs, OH, USA), the bottles are sealed and stored in a BOD Incubator (HACH, Loveland, CO, USA) at a controlled temperature of 20 °C in the dark for five days. The DO is measured again at the end of the 5-day period. The BOD5 is the change in DO multiplied by the dilution factor. The dilution water blank serves as a rough check on the quality of the dilution water and it should not exceed 0.2 mg/L. BOD5 of the diluted sample is calculated using this equation [42,44,45,46]:
The wastewater sample that has diluted 50 times or more has in sufficient bacteria to oxidize the organic matter that is present for carrying out the BOD test. Seeding of dilution water is required to test such sample. To make the seed solution, the contents of one dehydrated Polyseed capsule (Interlab®, The Woodlands, TX, USA, Environmental Protection Agency, EPA-approved BOD5 seed inoculum) was poured into 500 mL dilution water to dissolve and rehydrate (aerate and stir for one hour, settle 15 min after aeration has stopped for the bran and undissolved material, decant the supernatant), and the decanted seeded dilution water (seed solution) was used to dilute the sample for making up 10% of the overall sample volume. A seed control was prepared by diluting the seed solution with dilution water for correcting the sample BOD measurement. When seeding is employed, the BOD of the sample is calculated as follows [42,44,45,46]:
where:
- DS0 = initial dissolved oxygen in the diluted sample,
- DS5 =final dissolved oxygen in the diluted sample after 5 days of incubation,
- DW0 = initial dissolved oxygen in the dilution water,
- DW5 = final dissolved oxygen in the dilution water after 5 days of incubation,
- SC0 = initial DO in diluted seed solution (seed control),
- SC5 = final DO in diluted seed solution (seed control) after 5 days of incubation,
- F = dilution factor [total volume after dilution (mL)/volume of undiluted sample (mL)],
- f = ratio of seed in diluted sample to seed in seed control,
- [% seed in diluted sample/% seed in diluted seed solution (seed control)].
A variation of this test, called the carbonaceous BOD, was performed by adding an Nitrification Inhibitor (HACH, Formula 2533) into the diluted sample that inhibits and prevents the oxidation of nitrogen compounds and ammonia, so that the test is a truer measure of the amount of biodegradable organic material present [46,49].
Chemical Oxygen Demand (COD)
COD is used as a measure of the oxygen equivalent of the organic matter content of a sample that is susceptible to oxidation by a strong chemical oxidant. The measured wastewater sample is heated with a known amount of potassium dichromate-sulfuric acid solution, after which the concentration of unreacted oxidizing agent (chromate remaining) is determined by a redox back-titration or the amount of reduced chromium produce dis determined colorimetrically. The quantity of oxidant consumed is expressed in terms of its oxygen equivalence. The COD test is used to determine the degree of pollution in both wastewater and natural water. Basically, the higher the COD value, the higher the amount of pollution in the test sample [44,46,49].
In this research project, COD was measured using method 5220 C, closed reflux, and the titrimetric method according to procedures outlined in the Standard Method for the Examination of Water and Wastewater [45]. In addition, 2 mL diluted wastewater sample (for blank—2 mL distilled water, for check the accur—2 mL 500 mg/L phthalic acid (potassium acid phthalate, KHP) solution as COD standard solution)was pipet into Hach Dichromate COD Reagent vial of High Range type (0 to 1500 mg/L) or 0.20 mL diluted wastewater sample (blank—0.2 mL distilled water, accuracy check—0.2 mL 10,000 mg/L KHP solution) was pipet into Hach Dichromate COD Reagents vial of High Range Plus type: 0 to 15,000 mg/L. Closed the prepared sample digestion reagent vial with the vial screw cap tightly. Mix the contents in the vial by shaking and invert the vial several times. The prepared vials were put into the block digester and heated for two hours at 150 °C.The digested sample was cooled to room temperature, added with 2 drops of ferroin indicator solution, and then titrated with standard ferrous ammonium sulphate (FAS) 0.01 M. The sample was titrated until a sharp colour changed from blue-green to reddish brown. COD is calculated based on the following equation:
where:
- A = volume of FAS titrant used to titrate the blank (mL),
- B = volume of FAS titrant used to titrate the sample (mL),
- M = Molarity (mol/L) of FAS titrant; 0.01 M was used,
- 8000 = milliequivalent weight of oxygen × 1000 mL/L.
Chloride is the primary and the most common interference when determining COD concentration. Chloride has the greatest effect on COD test results. Chloride reacts with silver ion to precipitate silver chloride, and thus inhibits the catalytic activity of silver. Bromide, iodide, and any other reagent that inactivates the silver ion can interfere similarly. Such interferences are negative in that they tend to restrict the oxidizing action of the dichromate ion itself. However, under the rigorous digestion procedures for COD analyses, chloride, bromide, or iodide can react with dichromate to produce the elemental form of the halogen and the chromic ion. Results then are in error on the high side. The difficulties caused by the presence of the chloride can be overcome largely, though not completely, by complexing with mercuric sulfate (HgSO4) before the refluxing procedure. This ties up the chloride ion as a soluble mercuric chloride complex and greatly reduces its ability to react further. Mercuric sulfate is the most widely used reagent for masking chloride interference and is most effective when the ratio of mercuric sulfate to chloride is 10:1 [44,45,49,50,51]. HACH Dichromate COD Reagent contains enough mercuric sulfate to eliminate the interference up to 2000 mg/L chloride. The Ultra High Range COD Procedure will eliminate up to 20,000 mg/L chloride because the sample size used is 0.20 mL rather than the standard 2.00 mL [49,50,51].
2.3.3. Measurement of Chemical Parameter: The Inorganic Content/Nutrients
Inorganic forms of nitrogen (nitrate, nitrite and ammonium ions) and inorganic phosphates act as plant nutrients and increase the chance of eutrophication occurring in waterways. This can result in an abundance of opportunistic algae, weeds and plants. The increase in total biomass also increases the amount of microorganisms, which are involved in breaking down dead matter. The overall result is a decrease in the amount of dissolved oxygen present in the water due to the decomposition of plants, algae, bacteria and other microorganisms. This therefore has an adverse effect on any other organisms that reply to the dissolved oxygen to survive [52,53].
Nitrogen stimulates crop growth. Sensitive crops may be affected by nitrogen concentrations above 5 mg/L. Most other crops are relatively unaffected until nitrogen exceeds 30 mg/L. Nitrogen in the form of nitrate (NO3-N) is the usual form found in water. Plants normally use nitrate as their source of the nitrogen, and so nitrate is considered a nutrient for plants. Excessive concentrations of nitrate in lakes and streams greater than about 5 mg/L (measured as nitrogen) can cause excessive growth of algae and other plants, leading to accelerated eutrophication and occasional loss of dissolved oxygen. If nitrate-nitrogen exceeds 10 mg/L in drinking water, it can cause a condition called methemoglobinemia or “blue baby syndrome” in infants. Livestock can also suffer from methaemoglobinaemia. Some recent studies have indicated a possible connection between elevated nitrate concentrations and cancer [54].
Ammoniacal Nitrogen (NH3-N)
Concentration of NH3-N was determined by DR/2000 spectrophotometer (HACH, Loveland, CO, USA) using the Nessler Method (Method 8038) at wavelength (λ) 425 nm, and this method is applicable over the range of 0 to 2.50 mg/L in 25 mL of water samples. The matched pair of square glass 25 mL (sample cell) was used, and one sample cell was filled with the wastewater sample, another sample cell (the blank) was filled with demineralized water, and both prepared sample cells were added with reagent HACH tests kits of Nessler reagent, mineral stabilizer, and polyvinyl alcohol dispersing agent. The blank was used to set the spectrophotometer to zero. A yellow colour was developed in proportion to the present of ammonia amount in the prepared sample cell [55]. This procedure is equivalent to the USEPA Method 350.2 and Standard Methods for the Examination of Water and Wastewater, 4500-NH3 B and C for wastewater [44,45].
Nitrate-Nitrogen (NO3−-N)
For this research, NO3−-N determination employed Cadmium Reduction, High Range (HR) method (Method 8039) at wavelength (λ) 500 nm. One sample cell was filled with wastewater sample and added with the contents of one Nitra Ver 5 Nitrate reagent powder pillow, and another sample cell (the blank) was filled with wastewater sample without reagent [55]. This method is applicable over the range of 0 to 30.0 mg/L in 25 mL of water samples. This procedure is adapted from Standard Methods for the Examination of Water and Wastewater [44,45].
Phosphorus (P)/Orthophosphate (PO43−)
P/PO43− determination applied Molybdovanadate method using Molybdovanadate reagent (method 8114) where the wavelength (λ) used was 430 nm to detect mg/L PO43− or mg/L P concentration. One sample cell was filled with wastewater sample, another sample cell (the blank) was filled with demineralized water, and both prepared sample cells were added with Molybdovanadate reagent. This method is applicable over the range of 0 to 45.0 mg/L in 25 mL of water samples and a yellow colour was developed in proportion to the presence of phosphate. This procedure is adapted from Standard Methods for the Examination of Water and Wastewater [44,45].
3. Results
3.1. Fish Processing Wastewater Characteristics
Wastewater characteristics of the simulated synthetic original fish processing wastewater, and the influent of 30, 50 and 100-fold diluted liquid of the original fish processing wastewater are summarized in Table 1.
3.2. Parameter Analysis Results
3.2.1. pH Value
pH analysis is used to determine if a process is operating within the acceptable range of pH. In this study, the pH of the raw synthetic fish processing wastewater (simulated original, without dilution) had a pH range of 6.65 ± 0.02, while the pH of the diluted raw wastewater with distilled water (30-, 50-, and 100-fold diluted) for feeding into the reactor (influent) ranged from 7.33 to 7.41. Therefore, the influent feed into the reactor for treatment processes was in the best pH value range of 6.5 to 7.5 for the biological treatment system function.
In this continuous flow system, the pH value was increasing along the 5-day treatment operation. Figure 1 shows the increase percentage of the pH value in the continuous system at nine different operating HRTs of 10-, 9-, 8-, 7-, 6-, 5-, 4-, 3- and 2-day HRT. The highest pH increase percentage of 19.5% was observed at the 8-day HRT in the effluent of the 30-fold diluted fish processing wastewater. The lowest increase percentage of 10.0% was found at the 2-day HRT in the 100-fold diluted fish processing wastewater.
In the continuous flow system with various salt concentrations, the pH value increased along the 5-day treatment operation. Figure 2 shows the pH increase percentages at HRTs of 10, 9, and 8 days in the three different concentrations of fish processing wastewaters with 11 different salt concentrations of 0.5%, 1.0%, 1.5%, 2.0%, 2.5%, 3.0%, 3.5%, 4.0%. 5.0%, 6.0%, 7.0% NaCl and without salt concentration (0.0% NaCl). The highest pH percentage increase of 19.6% was observed at the 8-day HRT in the effluent of the 30-fold diluted fish processing wastewater with 1.0% salt content. The lowest percentage increase of 8.0% was found at the 8-day HRT in the 100-fold diluted fish processing wastewater with 7.0% salt content.
3.2.2. Total Suspended Solids (TSS)
Figure 3 shows the TSS removal percentage in the effluent of the continuous system without salt content at nine different operating HRTs after the 5-day treatment operations. The lowest percentage of TSS removal (7.0%) was found at the 8-day HRT in the 30-fold diluted fish processing wastewater. The highest percentage of TSS removal was 33.0% and was found in the 100-fold diluted wastewater at the 2-day HRT.
The TSS removal percentages in the continuous system at 12 different salt contents after five days of treatment operations are shown in Figure 4. The highest percentage of TSS removal was 37.0% and was achieved at the 8-day HRT in the 100-fold diluted fish processing wastewater that was added with 7% NaCl. The lowest percentage removal of 6.0% was found in the 30- and 50-fold diluted fish processing wastewaters with 1% salt concentration at the 8-day HRT and in the 30-fold diluted wastewater without salt concentration at the 8- and 9-day HRTs.
3.2.3. Volatile Suspended Solids (VSS)
Figure 5 shows the VSS increase percentage after five days of continuous system operation with nine different operating HRTs (10, 9, 8, 7, 6, 5, 4, 3, and 2 days) for the three different concentrations of fish processing wastewaters. In the reactor with continuous feeding and removal of substrates, the lowest VSS increase percentage of 9.0% was found at the 2-day HRT in the 100-fold diluted fish processing wastewater, while the highest VSS increase percentage of 49.0% was found at the 8-day HRT in the 30-fold diluted fish processing wastewater.
Figure 6 shows the VSS increase percentage after five days of continuous system operation with three different operating HRTs (10-, 9-, and 8-day HRTs) for the three different concentrations of fish processing wastewaters at 12 different salt contents. In the continuous reactor with various salt concentrations, the lowest VSS increase percentage of 9.0% was found at the 9- and 10-day HRTs in the 100-fold diluted fish processing wastewater with 7% salt content, while the highest VSS increase percentage of 50.0% was found at the 8-day HRT in the 30-fold diluted fish processing wastewater with 1% salt content.
3.2.4. Five-Day Biochemical Oxygen Demand (BOD5)
Figure 7 shows the BOD removal percentage after five days of continuous system operation at nine different operating HRTs for the three different concentrations of fish processing wastewaters without salt content. In the continuous system treatment, 10-day HRT attained the highest BOD removal rate of 81.0% in the 30-fold diluted wastewater and the lowest removal rate of 15.0% was found at the 2-day HRT in the 100-fold diluted wastewater.
Figure 8 shows the BOD removal percentage after five days of continuous system operation with three different operating HRTs (10-, 9-, and 8-day HRTs) for the three different concentrations of fish processing wastewaters at 12 different salt contents. In the continuous treatment system, the average BOD removal rates of the HRTs 8, 9 and 10 days in the 30-, 50-, and 100-fold diluted fish processing wastewaters with 1% salt content were 80.3%, 65.0%, and 38.7%, respectively; at 7% salt content, the average BOD removal rates of the three operating HRT were down to 21.3%, 20.3%, and 15.3%, respectively. The lowest BOD removal of 14.0% was found at the 8-day HRT in the 100-fold diluted wastewater with 7% NaCl content. The highest BOD removal of 82.0% was achieved at the 10-day HRT in the 30-fold diluted wastewater with 1% NaCl content. The high bacteria growth rate in the reactor was able to remove more biochemical oxygen demand in the reactor.
3.2.5. Chemical Oxygen Demand (COD)
Figure 9 shows the COD removal percentage after five days of continuous system operation at nine different operating HRTs for the three different concentrations of fish processing wastewaters without salt content. In the continuous flow treatment system, the 10-day HRT attained the highest COD removal rate of 85.5% in the 30-fold diluted wastewater and the lowest removal rate of 16.0% was found at the 2-day HRT in the 100-fold diluted wastewater.
Figure 10 shows the COD removal percentage after five days of continuous system operation with three different operating HRTs (10-, 9-, and 8-day HRTs) for the three different concentrations of fish processing wastewaters at 12 different salt contents. In the continuous flow treatment system, the highest COD removal of 86.0% was observed at the 10-day HRT in the 30-fold diluted wastewater with 1% NaCl content. The lowest COD removal of 15.0% was found at the 9-day HRT in the 100-fold diluted wastewater with 7% salt content. The 10-day HRT achieved the highest COD removal due to the longer contact time between the biomass and the substrate value. The COD removal rate increased with the increase in HRT. COD was the most affected parameter by the increase in salt concentrations in the fish processing wastewater. The average COD removal rates of the HRTs 8, 9, and 10 days for the 30-, 50-, and 100-fold diluted fish processing wastewaters dropped from 84.0% to 23.3%, 68.3% to 21.7%, and 38.7% to 16.0%, respectively, when the salinity increased from 1 to 7%. The low COD removal efficiency might be due to the adverse effect of salt on microbial activity. High salinity is generally known to cause plasmolysis and loss of cell activity [56,57].
3.2.6. Biomass Yield
Figure 11 shows the percentage of biomass yield obtained in the effluent after five days of continuous system operation of the three different concentrations of fish processing wastewaters at nine different operating HRTs. In the figure, three different diluted concentrations of salt-free fish processing wastewaters increased with the HRTs. The biomass yield decreased with the increasing dilution fold of the original fish processing wastewater. In the continuous system, the lowest biomass yield percentage of 10.0% was found at the 2-day HRT in the 100-fold diluted wastewater, while the highest biomass yield percentage of 65.0% was found in the 30-fold diluted fish processing wastewater at the 8-day HRT.
Figure 12 shows the biomass yield percentage in the effluent after five days of continuous system operation of the three different concentrations of fish processing wastewaters at three different operating HRTs of 10, 9, and 8 days with 12 different salt concentrations. In the continuous reactor with various salt concentrations, the lowest biomass yield percentage of9% was found at the 8-day HRT in the 50-fold diluted wastewater and at the 9-day HRT in the 100-fold diluted wastewater with 7% salt content. The highest biomass yield percentage of 65.0% was found at 1% salt content in the 30-fold diluted fish processing wastewater at the 8-day HRT.As the salt content in the 30-, 50-, and 100-fold diluted fish processing wastewaters increased to 7%, the average biomass growth rates of HRTs 8, 9 and 10 days were decreased to 11.0%, 10.3%, and 10.7%, respectively.
3.2.7. Ammoniacal Nitrogen (NH3-N)
Figure 13 shows the percentages of NH3-N removal found in the effluent after five days of continuous flow system operation for the three concentrations of fish processing wastewaters without salt content at nine different operating HRTs. The efficiency of NH3-N removal decreased with the increasing dilution fold of the original fish processing wastewater and decreasing of HRT from 7-day HRT to 2-day HRT. At HRTs of 8, 9, and 10 days, the removal of NH3-N was more than 70.0% in 30-fold diluted fish processing wastewater. The highest percentage of NH3-N removal, 72.5% was found in 30-fold diluted fish processing wastewater at 10 day HRT, while the lowest percentage of NH3-N removal, and 14.0% was found in 100-fold diluted fish processing wastewater at 2-day HRT.
Figure 14 shows the percentage of NH3-N removal found in the effluent after five days of continuous system operation of the three different concentrations of fish processing wastewaters with 11 different salt concentrations and without salt content as the control at three different optimum HRT operating conditions. After five days of continuous flow operation, the highest percentage of NH3-N removal of 73.0% was found at the 10-day HRT in the 30-fold diluted fish processing wastewater with 1% NaCl, while the lowest percentage of NH3-N removal of 15.0% was found in the 100-fold diluted fish processing wastewater with 7% salt content at the 8-day HRT.
3.2.8. Nitrate-Nitrogen (NO3−-N)
Figure 15 shows the percentage of NO3−-N removal found in the effluent after five days of continuous flow system operation of the three different concentrations of fish processing wastewaters at nine different HRT conditions. After five days of continuous flow operation, the highest percentage of NO3−-N removal of 70.0% was found in the 30-fold diluted fish processing wastewater at the 10-day HRT, while the lowest percentage of NO3−-N removal of 10.0% was found in the 30-fold diluted fish processing wastewater at the 2-day HRT.
Figure 16 shows the percentage of NO3−-N removal found in the effluent after five days of continuous flow operation of the three different concentrations of fish processing wastewaters with 11 different salt concentrations and without salt content as the control at three different optimum HRT operating conditions. After five days of continuous flow operation, the highest percentage of NO3−-N removal of 72.0% was found at the 9-day HRT in the 30-fold diluted fish processing wastewater with 1% NaCl, while the lowest percentage of NO3−-N removal of 12.0% was found in the 100-fold diluted fish processing wastewater with 7% salt contents at the 9-day HRT.
3.2.9. Phosphorus (P)
Figure 17 shows the percentages of phosphorus removal found in the effluent after five days of continuous system operation of the three different concentrations of fish processing wastewaters without salt content. After five days of continuous flow operation, the highest percentage of P removal of 62.0% was found in the 30-fold diluted fish processing wastewater at the 10-day HRT, while the lowest percentage of P removal of 4.0% was found in the 100-fold diluted fish processing wastewater at the 2-day HRT.
Figure 18 shows the percentage of P removal found in the effluent after five days of continuous operation of the three different concentrations of fish processing wastewaters with 11 different salt concentrations and without salt content as the control at three different optimum HRT operating conditions. The results demonstrated that phosphate removal was severely affected by the increase in salt concentrations from 3.0%, particularly in the 30- and 50-fold diluted fish processing wastewater. When the salt content increased from 2.5% to 7.0%,the highest drops of P removal efficiency rates was found in the 30-fold diluted fish processing wastewater, with 45.0% at 8-day HRT, 43.0% at 9-day HRT and 42.0% at 10-day HRT; the second highest drops of P removal rates was found in the 50-fold diluted wastewater with removal rates of 43.0% at 8-day HRT, 40.0% at 9 day-HRT and 40.0% at 10-day HRT; while the lowest removal rates of P was observed in the 100-fold diluted fish processing wastewater, with 21.0% at 8-day HRT, 19.0% at 9-day HRT and 21.0% at 10-day HRT. After five days of continuous operation, the highest percentage of P removal of 62.0% was found at the 8-day HRT in the 30-fold diluted fish processing wastewater with 1% NaCl, while the lowest percentage of P removal of 4.0% was found in the 100-fold diluted fish processing wastewater with 7% salt contents at the 8- and 10-day HRTs.
4. Discussion
The system performances of the continuous flow treatment in this research project were studied by evaluating the data of the influent feed into the reactor and the daily effluent from day one to day five treatment on the pH value, growth of biomass (VSS), biomass yield, TSS removal rate, and the substrate degradation of BOD, COD, NH3-N, NO3−-N and P for analyzing the efficiency of microorganisms in treating fish processing wastewater without salt content (0.0% NaCl) at nine different HRTs and with eleven different concentration of salt content (0.05%, 0.10%, 0.15%, 0.20%, 0.25%, 0.30%, 0.35%, 0.40%, 0.50%, 0.60%, 0.70% NaCl w/v) at the optimal HRT obtained from 8-day, 9-day, and 10-day HRTs. On the basis of the results of the laboratory investigation, the occurrence and effectiveness of the natural aerobic biodegradation processes were confirmed.
Generally, wastewater microorganisms in biological treatment systems function best in pH values from 6.5 to 7.5 for optimal biological growth. In this study, the pH of the fish processing wastewater in the reactor increasing along the treatment processes, at the range of pH 7.33 to pH 8.86. The pH value increase shows that the wastewater in the reactor had a high biomass growth rate of the naturally occurring microorganisms, the larger bacteria population yield of the ammonium ion in the media resulted in the pH value increase in the effluent of the wastewater.
In this study, the effect of nine different hydraulic retention times (HRT) on biomass growth and pollutants removal in the fish processing wastewater were studied. The experiments’ results showed that the pH value, biomass growth, biomass yield, TSS concentration, and pollutant removal rates of BOD, COD, NH3-N, NO3−-N and P in the reactor were decreased with lower concentration of fish processing wastewater influent, and showed significant linear decreases in HRT from 7-day HRT to 2-day HRT. The optimal pH value, biomass growth, biomass yield, TSS concentration, and pollutant removal rates condition were found at HRTs of 8-day, 9-day, and 10-day HRT. The optimum pH value, TSS concentration, biomass growth, and biomass yield were found at 8-day HRT in 30-fold diluted wastewater, and the lowest were verified in the 100-fold diluted wastewater at 2-day HRT, while the optimum removal percentages of pollutants were found at 10-day HRT in 30-fold diluted wastewater, and the lowest were observed at 2-day HRT in 100-fold diluted wastewater. According to Zhu et al. [58], the increase in HRT increases the wastewater contact time in the reactor and improves the removal efficiency of organic matter by promoting the growth of aerobic microorganisms.
After five days of aerobic continuous flow treatment system operation with natural biodegradation at the optimal HRT of 8-day, 9-day, and 10-day HRT, the results obtained for this study have shown that the three different concentrations (30-, 50-, and 100-fold diluted) of salt-free fish processing wastewater had higher percentages of pH value, biomass growth, biomass yield, TSS concentration, and substrate removal of BOD5, COD, NH3-N, NO3−-N, and P than the wastewater with 3.0% to 7.0% salt content. However, the wastewater with ≤2.5% salt concentration had a positive to no effect on the pH value, biomass growth, biomass yield, TSS concentration and the substrate removal rates. Inhibition was observed in the wastewater added with salt concentrations of 3.0% to 7.0%. The pH value, biomass growth, biomass yield, TSS concentration, and the substrate removal showed significant linear reduction rates from 3.0% to 7.0% salt concentrations and decreased with the increasing influent’s dilution fold of the original fish processing wastewater. The lowest substrates removal efficiencies, pH value, biomass growth, biomass yield, and TSS concentration were found in the greatest dilution of 100-fold diluted wastewater containing 7.0%NaCl, while the highest percentage was verified in the 30-fold diluted wastewater containing 1.0% NaCl. The reduced efficiencies with salt additions could have been caused by the adverse effect of salt on microbial flora and the plasmolysis of organisms resulting in the loss of metabolic activity. The addition of salt increased the respiration rate of microorganisms until it reached a specific salt concentration; thereafter, a decrease was observed [59].
The TSS concentration decreased when the salt concentration increased from 1.0% to 7.0% NaCl. The decrease in TSS concentration indicates the death and washout of biomass. Elevated salt concentrations are known to increase water density, which can potentially cause the washout of small and poor settling sludge flocs. According to Woolard [60], biological systems subjected to salt shock loads respond with increased effluent suspended solids and loss of volatile suspended solids, which are similar to those observed in this work. Panswad and Anan [61] also observed a decrease in TSS with the salt concentration increase. These authors observed a TSS reduction of 60.0% with the increase in salinity from 0 g/L to 30g/L.
Among the ten analyzed parameters in this study, COD was the most affected parameter with the increase in salt concentrations in the fish processing wastewater, followed by BOD. The results show that phosphorus-accumulating bacteria are more sensitive to the high salinity than nitrifiers and denitrifiers. The foul wastewater odor was completely removed, and the strong reddish-brown color of the wastewater was reduced after five days of treatment.
When salt concentration was increase from 3.0 to 7%, there was a significant decrease in NH3-N removal efficiency. This result demonstrates the effect of high salt concentration on nitrification. This finding is accordance with the findings of previous study [39,40,62,63,64,65,66]. Yogalakshmi and Joseph [63] have reported lower removal of ammonia at high salt concentration. They found that the ammonia removal rate was 64.0% to 84.0% at the NaCl loading of 5–30 g/L. The decrease in nitrification efficiency can be related to the more sensitive short- and long-term salt stresses of nitrite and ammonia oxidizers, to the repression of the synthesis of enzymes that utilize nitrate and nitrite as electron acceptor, and to the significant changes in osmotic pressure. Decrease in removal of NH4-N at high salt concentration could be due to the effect of plasmolysis or lower availability of saline-resistant nitrifiers [64]. The decrease in nitrification efficiency can be related to the more sensitive short- and long-term salt stresses of nitrite and ammonia oxidizers [39,57], to the repression of the synthesis of enzymes that utilize nitrate and nitrite as electron acceptor [65], and to the significant changes in osmotic pressure [66].
The NO3−-N removal efficiency generally decreased with the gradual increase in salt concentration from 3% to 7% NaCl. This means that the gradual increment of salt concentration above 3% NaCl showed inhibitory effect on NO3−-N removal efficiency in continuous flow reactor. Chen et al. [64] reported that nitrification was good up to Cl concentration of 2.5 g/L and beyond that the nitrification rate started to decrease. The decrease in NO3−-N removal efficiency with the increase in salt concentration was due to the washed out dead biomass and lysed cell constituents [31], the nitrification inhibition [31,57,58], and the denitrification process [67].
The high salt concentration was clearly seen as having an adverse impact on P removal. The effect of salt on phosphorus removal was also reported by Uygur and Kargi [68], who described a decrease in P removal from 84% to 22% when the NaCl concentration increased from 0% to 6% (w/v).
In summary, the results from this study reveal that the fish processing wastewater with 0.5–7.0% NaCl and without salt content in a well-stirred aerobic continuous flow reactor system could be biodegraded by the natural microorganisms in the wastewater without seeded with sludge (a well-grown sediment sample) taken from the fish or food processing effluent for process startup. Pollutants in the fish processing wastewater could be biodegraded by natural microbial populations in the wastewater under an aerobic condition with the supplement of sufficient oxygen using an aquarium air pump.
5. Conclusions
In conclusion, this study could potentially increase fish processing saline wastewater handling and its reuse as a liquid fertilizer in agriculture. Results from this study would be useful in determining the optimum biodegradation conditions and designing an efficient and cost-effective biodegradation system for the fish processing industries. The experiments’ results of this study show that the continuous flow treatment system at HRT 8, 9, and 10 days can be effectively used to treat fish processing wastewater with a salt concentration of as high as 2.5% w/v NaCl and beyond that started to decrease. The natural biodegradation in the continuous system can be applied as a treatment option in small-scale fish processing industries. Utilizing natural biodegradation processes for the treatment of wastewater has several reasons or benefits that can be classified as environmental, economical, and operational benefits.
The treated wastewater without offensive odor and remained with the nitrogen, protein and phosphorus content is feasible for reutilization as an environmental friendly liquid fertilizer. Wastewater from fish processing industries has high potential to be reused as a liquid fertilizer in agriculture since the main constituents are organic substance and do not contain known toxic or carcinogenic materials. Hence, this suggestion can carry forward for future analysis the potential of using fish processing treated effluent as an organic fertilizer to enhance growth of plants. Further studies should involve the investigation for the impacts on the soil, the plants and the different yields of the crops when irrigated with the treated fish processing saline wastewater of different salt content.
Overall, the usage of fish processing effluent in plants was beneficial. It has the potential to serve as a nutrient source to the plant and develop the cells of the plants. Therefore, using effluent as a feed source for the plant can reduce the demand of water resources in agriculture. In addition, effluents can substitute the fertilizer usage upon plant. By using effluent, costs to buy synthetic fertilizer can be saved periodically and less pollution will take place on land and in streams due to short term usage of synthetic fertilizer. Closing the loop for nutrients in wastewater is a necessary sustainable development objective to reduce resource consumption and greenhouse gas emissions. A new paradigm is emerging, globally. Commercial marketing of recovered nutrients as “green” fertilisers, and recycling of nutrients through biomass production to new outlets such as biofuels, are taking off.
Acknowledgments
We wish to express our thanks to the University of Malaya for providing funding for this research. Financial support from the Postgraduate Research Fund (PPP-P0227 and PS287), financed by the Institute of Research Management & Monitoring (IPPP), the University of Malaya and a University of Malaya High Impact Research Grant (HIR Ref. No.: UM.C/625/HIR/ENG/13), made this research project possible.
Author Contributions
Yun Chen Ching and Ghufran Redzwan conceived and designed the experiments; Yun Chen Ching performed the experiments, analyzed the data and wrote the paper; Ghufran Redzwan read and edited the manuscript.
Conflicts of Interest
The authors declare no conflict of interest.
References
- Amir, H.M.; Vali, A.; Leila, R. Atmospheric moisture condensation to water recovery by home air conditioners. Am. J. Appl. Sci. 2013, 10, 917–923. [Google Scholar] [CrossRef]
- Abbasi, M.; Dehghani, M.; Moussavi, G.; Azhdarpoor, A. Degradation of organic matter of municipal sewage sludge using ultrasound treatment in Shiraz wastewater treatment plant. Health Scope 2015, 4, e23507. [Google Scholar] [CrossRef]
- Igbinosa, E.O.; Okoh, A.I. Impact of discharge wastewater effluents on the physico-chemical qualities of a receiving watershed in a typical rural community. Int. J. Environ. Sci. Technol. 2009, 6, 175–182. [Google Scholar] [CrossRef]
- Andreas, N.A.; Shane, A.S. Wastewater Treatment and Reuse: Past, Present, and Future. Water 2015, 7, 4887–4895. [Google Scholar] [CrossRef]
- Food and Agriculture Organization of the United Nations. The State of World Fisheries and Aquaculture 2016: Contributing to Food Security and Nutrition for All; FAO: Rome, Italy, 2016; pp. 1–79. [Google Scholar]
- Food and Agriculture Organization of the United Nations. The State of World Fisheries and Aquaculture 2014: Opportunities and Challenges; FAO: Rome, Italy, 2014; pp. 3–69. [Google Scholar]
- Malaysia Investment Development Authority. Food Industry in Malaysia—Ideal Prospects, Immense Opportunities; Food Technology and Sustainable Resources Industries Division: Kuala Lumpur, Malaysia, 2017.
- Department of Statistics Malaysia. Selected Agricultural Indicators, Malaysia, 2016: Production of Agriculture Sector Increased in 2015; The Office of Chief Statistician Malaysia: Putrajaya, Malaysia, 2017.
- Department of Fisheries Malaysia. Status of the Fisheries Sector in Malaysia 2016; Fisheries Information Management Division, Department of Fisheries Malaysia: Putrajaya, Malaysia, 2017.
- Eric, S.L.; Ronald, A.R. Continuous bioprocessing and perfusion: Wider adoption coming as bioprocessing matures. BioProcess. J. 2014, 13, 50–55. [Google Scholar]
- Tay, J.H.; Show, K.Y.; Hung, Y.T. Seafood processing wastewater treatment. In Waste Treatment in the Food Processing Industry; Wang, L.K., Hung, Y.T., Lo, H.H., Yapijakis, C., Eds.; CRC Press Taylor & Francis Group: Boca Raton, FL, USA, 2006; pp. 29–66. [Google Scholar]
- Len, R.G.; Michael, D.P.; Pomeroy, R.S. Fisheries in Southeast Asia: Challenges and opportunities. In Transnational Trends: Middle Eastern and Asian Views; Pandya, A., Laipson, E., Eds.; The Henry L. Stimson Center: Washington, DC, USA, 2008; pp. 171–322. [Google Scholar]
- Sirianuntapiboon, S.; Nimnu, N. Management of water consumption and wastewater of seafood processing industries in Thailand. J. Sci. Technol. 1999, 6, 158–167. [Google Scholar]
- Mitchell, R. Introduction to Environmental Microbiology; Prentice-Hall, Inc.: Englewood Cliffs, NJ, USA, 1974. [Google Scholar]
- Mojiri, A.; Aziz, H.A.; Zaman, N.Q.; Aziz, S.Q.; Zahed, M.A. Powdered ZELIAC augmented sequencing batch reactors (SBR) process for co-treatment of landfill leachate and domestic wastewater. J. Environ. Manag. 2014, 139, 1–14. [Google Scholar] [CrossRef] [PubMed]
- Tay, J.H.; Show, K.Y.; Hung, Y.T. Seafood processing wastewater treatment. In Handbook of Industrial and Hazardous Wastes Treatment, 2nd ed.; Revised and Expanded; Wang, L.K., Hung, Y.T., Lo, H.H., Yapijakis, C., Eds.; Marcel Dekker, Inc.: New York, NY, USA, 2004; pp. 694–737. [Google Scholar]
- Liu, S.X. Food and Agricultural Wastewater Utilization and Treatment, 1st ed.; Blackwell Publishing Professional: Ames, IA, USA, 2007. [Google Scholar]
- Alrumman, S.A.; El-kott, A.F.; Keshk, S.M.A.S. Water Pollution: Source & Treatment. Am. J. Environ. Eng. 2016, 6, 88–98. [Google Scholar]
- Ng, W.J.; Miranda Yap, G.S.; Sivadas, M. Biological treatment of a pharmaceutical wastewater. J. Biol. Waste 1989, 29, 299–311. [Google Scholar] [CrossRef]
- Hall, G.M.; Ahmad, N.H. Surimi and Fish Mince Products. In Fish Processing Technology; Hall, G.M., Ed.; Chapman & Hall: New York, NY, USA, 1992; pp. 72–86. [Google Scholar]
- COWI. Industrial Sector Guide. Cleaner Production Assessment in Fish Processing Industry; UNEP DTIE: Paris, France; Danish Environmental Protection Agency: Copenhagen, Denmark, 1999.
- Mendez, R.; Omil, F.; Soto, M.; Lema, J.M. Pilot plant studies on the anaerobic treatment of different wastewaters from a fish-canning factory. Water Sci. Technol. 1992, 5, 37–44. [Google Scholar]
- Balslev, O.P.; Lynggaard, J.A.; Nickelsen, C. Pilot-scale experiments on anaerobic treatment of wastewater from a fish processing plant. Water Sci. Technol. 1990, 22, 463–474. [Google Scholar]
- Dan, N.P.; Visvanathan, C.; Basu, B. Comparative evaluation of yeast and bacterial treatment of high salinity wastewater based on biokinetic coefficients. Bioresour. Technol. 2003, 87, 51–56. [Google Scholar] [CrossRef]
- Cui, Y.W.; Zhang, H.Y.; Ding, J.R.; Peng, Y.Z. The effects of salinity on nitrification using halophilic nitrifiers in a Sequencing Batch Reactor treating hypersaline wastewater. Sci. Rep. 2016, 6, 24–25. [Google Scholar] [CrossRef] [PubMed]
- Sherly, T.M.V.; Harindranathan, N.; Bright, S.I.S. Physicochemical analysis of seafood processing effluents in Aroor Gramapanchayath, Kerala. IOSR J. Environ. Sci. Toxicol. Food Technol. 2015, 9, 38–44. [Google Scholar]
- Woolard, C.R.; Irvine, R.L. Response of a periodically operated halophilic biofilm reactor to changes in salt content. Water Sci. Technol. 1995, 31, 41–50. [Google Scholar] [CrossRef]
- Stewart, M.J.; Ludwig, H.F.; Kearns, W.H. Effects of varying salinity on extended aeration process. J. Water Pollut. Control Fed. 1962, 37, 1167–1177. [Google Scholar]
- Burnett, W.E. The effect of salinity variations on the activated sludge process. Water Sew. Works 1974, 121, 37–55. [Google Scholar]
- Oren, A.; Gurevich, P.; Malkit, A.; Henis, Y. Microbial degradation of pollutants at high salt concentrations. Biodegradation 1992, 3, 387–398. [Google Scholar] [CrossRef]
- Lefebvre, O.; Moletta, R. Treatment of organic pollution in industrial saline wastewater: A literature review. Water Res. 2006, 40, 3671–3682. [Google Scholar] [CrossRef] [PubMed]
- Hamoda, M.F.; Al-Attar, M.S. Effects of high sodium chloride concentrations on activated sludge treatment. Water Sci. Technol. 1995, 31, 61–72. [Google Scholar] [CrossRef]
- Mostafa, F.H.; Surabhi, S.; Loring, F.N.; James, E.A. Study of Salt Wash Water Toxicity on Wastewater Treatment; Final Report; Purdue University: West Lafayette, IN, USA, 2006. [Google Scholar]
- Joong, K.K.; Jeong, B.K.; Kyoung, S.C.; Yong, K.H. Isolation and identification of microorganisms and their aerobic biodegradation of fish-meal wastewater for liquid-fertilization. Int. Biodeterior. Biodegrad. 2007, 59, 156–165. [Google Scholar]
- Kargi, F.; Uygur, A. Biological treatment of saline wastewater in an aerated percolator unit utilizing halophilic bacteria. Environ. Technol. 1996, 17, 320–325. [Google Scholar] [CrossRef]
- Kargi, F.; Dincer, A.R. Salt inhibition of nitrification and denitrification in saline wastewater. Environ. Technol. 1999, 20, 1147–1153. [Google Scholar]
- Lee, D.; Jean, D. Effects of Salinity on Expression Dewatering of Waste Activated Sludge. J. Colloid Interf. Sci. 1999, 215, 443–445. [Google Scholar]
- Knapp, L.A. Study of Process Control Strategies for Biological Nutrient Removal in an Oxidation Ditch. Master’s Thesis, University of South Florida, Tampa, FL, USA, June 2014. [Google Scholar]
- Moussa, M.S.; Sumanasekera, D.U.; Irahim, S.H.; Lubberding, H.J.; Hooijmans, C.M.; Gijzen, H.J.; Loosdrecht, M.C.M. Long term effects of salt on activity, population structure and floc characteristics in enriched bacterial cultures of nitrifiers. Water Res. 2006, 40, 377–388. [Google Scholar] [CrossRef] [PubMed]
- Bassin, J.P.; Kleerebezem, R.; Muyzer, G.; Rosado, A.S.; Van Loosdrecht, M.C.M.; Dezotti, M. Effect of different salt adaptation strategies on the microbial diversity, activity, and settling of nitrifying sludge in sequencing batch reactors. Appl. Microbiol. Biotechnol. 2012, 93, 1281–1294. [Google Scholar] [CrossRef] [PubMed]
- Panswad, T.; Anan, C. Specific oxygen, ammonia and nitrate uptake rates of a biological nutrient removal process treating elevated salinity wastewater. Bioresour. Technol. 1999, 70, 237–243. [Google Scholar] [CrossRef]
- Metcalf and Eddy. Wastewater Engineering: Treatment, Disposal, and Reuse, 3rd ed.; McGraw-Hill, Inc.: New York, NY, USA, 1991. [Google Scholar]
- Grady, C.P.L.; Daigger, G.T.; Lim, H.C. Biological Wastewater Treatment, 2nd ed.; Marcel Dekker Inc.: New York, NY, USA, 1999. [Google Scholar]
- APHA; AWWA. Standard Methods for Water and Wastewater Examinations, 21st ed.; American Public Health Association (APHA); American Water Works Association (AWWA): Washington, DC, USA, 2005. [Google Scholar]
- APHA; AWWA. Standard Methods for the Examination of Water and Wastewater, 19th ed.; American Public Health Association (APHA); American Water Works Association (AWWA); Water Pollution Control Federation (WPCF): Washington, DC, USA, 1995. [Google Scholar]
- Radojevic, M.; Bashkin, V.N. Practical Environmental Analysis; The Royal Society of Chemistry: Cambridge, UK, 1999. [Google Scholar]
- Mettler Toledo. Delta 320 pH Meter Operation Manual; Mettler-Toledo Instruments (Shanghai) Co. Ltd.: Shanghai, China, 2005. [Google Scholar]
- Middlebrooks, E.J. A nomograph for solution of the BOD equation. Water Sew. Works J. 1965, 112, R230. [Google Scholar]
- HACH. Wastewater and Biosolids Analysis Manual: Digestion and Selected Methods for Determining Metals, Minerals, and Other Related Parameters, 1st ed.; HACH Company: Loveland, CO, USA, 1999. [Google Scholar]
- Ruttanagosrigit, W.; Boyd, C.E.J. Measurement of Chemical Oxygen Demand in Waters of High Chloride Concentration. World Aquac. Soc. 1989, 20, 170–172. [Google Scholar] [CrossRef]
- Wayne, B. The Science of Chemical Oxygen Demand; Technical Information Series, Booklet No. 9; HACH Company: Loveland, CO, USA, 1997. [Google Scholar]
- Cho, K.S.; Cho, K.J.; Park, H.D.; Jeong, S.W.; Nam, S.J.; Lee, T. Characteristics of immobilized PVA beads in nitrate removal. J. Microbiol. Biotechnol. 2006, 16, 414–422. [Google Scholar]
- Kargi, F. Enhanced biological treatment of saline waste-water by using halophilic bacteria. Biotechnol. Lett. 2002, 24, 1569–1572. [Google Scholar] [CrossRef]
- Mueller, D.K.; Spahr, N.E. Water-quality, streamflow, and ancillary data for nutrients in streams and rivers across the nation, 1992–2001. In U.S. Geological Survey Data Series 152; U.S. Geological Survey: Reston, VA, USA, 2005. [Google Scholar]
- HACH. DR/2000 Spectrophotometer Procedures Manual, 2nd ed.; HACH Company: Loveland, CO, USA, 2001. [Google Scholar]
- Campos, J.L.; Mosquera-Corral, A.; Sanchez, M.; Mendez, R.; Lema, J.M. Nitrification in saline wastewater with high ammonia concentration in an activated sludge unit. Water Res. 2002, 36, 2555–2560. [Google Scholar] [CrossRef]
- Rene, E.R.; Kim, S.J.; Park, H.S. Effect of COD/N ratio and salinity on the performance of sequencing batch reactors. Bioresour. Technol. 2008, 99, 839–846. [Google Scholar] [CrossRef] [PubMed]
- Zhu, G.F.; Li, Z.; Wu, P.; Jin, H.Z.; Wang, Z. The performance and phase separated characteristics of an anaerobic baffled reactor treating soybean protein processing wastewater. Bioresour. Technol. 2008, 99, 8027–8033. [Google Scholar] [CrossRef] [PubMed]
- Vallero, M.V.G.; Hulshoff Pol, L.W.; Lettinga, G.; Lens, P.N.L. Effect of NaCl on thermophilic (55 PoPC) methanol degradation in sulfate reducing granular sludge reactors. Water Res. 2003, 37, 2269–2280. [Google Scholar] [CrossRef]
- Woolard, C.R.; Irvine, R.L. Treatment of hypersaline wastewater in the sequencing batch reactor. Water Res. 1995, 29, 1159–1168. [Google Scholar] [CrossRef]
- Panswad, T.; Anan, C. Impact of high chloride wastewater on an anaerobic/anoxic/aerobic process with and without inoculation of chloride acclimated seeds. Water Res. 1999, 33, 1165–1172. [Google Scholar] [CrossRef]
- Sharrer, M.J.; Tal, Y.; Ferrier, D.; Hankins, J.A.; Summerfelt, S.T. Membrane biological reactor treatment of a saline backwash flow from a recirculating aquaculture system. Aquac. Eng. 2007, 36, 159–176. [Google Scholar] [CrossRef]
- Yogalakshmi, K.N.; Joseph, K. Effect of transient sodium chloride shock loads on the performance of submerged membrane bioreactor. Bioresour. Technol. 2010, 101, 7054–7061. [Google Scholar] [CrossRef] [PubMed]
- Chen, G.H.; Wong, M.T.; Okabe, S.; Watanabe, Y. Dynamic response of nitrifying activated sludge batch culture to increased chloride concentration. Water Res. 2003, 37, 3125–3135. [Google Scholar] [CrossRef]
- Münch, E.V.; Lant, P.; Keller, J. Simultaneous nitrification and denitrification in bench scale sequencing batch reactors. Water Res. 1996, 30, 277–284. [Google Scholar] [CrossRef]
- Lyssenko, C.; Wheaton, F. Impact of rapid pulse operating disturbances on ammonia removal by trickling and submerged upflow biofilters for intensive recirculating aquaculture. Aquac. Eng. 2006, 35, 38–50. [Google Scholar] [CrossRef]
- Zhao, W.; Wang, Y.; Liu, S.; Pan, M.; Yang, J.; Chen, S. Denitrification activities and NR2RO production under salt stress with varying COD/N ratios and terminal electron acceptors. Chem. Eng. J. 2013, 215–216, 252–260. [Google Scholar] [CrossRef]
- Uygur, A.; Kargi, F. Salt inhibition on biological nutrient removal from saline wastewater in a sequencing batch reactor. Enzyme Microb. Technol. 2004, 34, 313–318. [Google Scholar] [CrossRef]
Figure 1.
pH increase percentage in a continuous treatment system for three different concentrations of diluted fish processing wastewaters with nine different operating HRTs (10-, 9-, 8-, 7-,6-, 5-, 4-, 3-, 2-day HRT).
Figure 1.
pH increase percentage in a continuous treatment system for three different concentrations of diluted fish processing wastewaters with nine different operating HRTs (10-, 9-, 8-, 7-,6-, 5-, 4-, 3-, 2-day HRT).

Figure 2.
pH increase percentage in continuous system treatment for three different concentrations of diluted fish processing wastewaters with 11 different concentrations of salt (0.5, 1.0, 1.5, 2.0, 2.5, 3.0, 3.5, 4.0, 5.0, 6.0, 7.0% NaCl) and without salt content (0.0% NaCl) at the HRTs of 8, 9 and 10 days.

Figure 3.
Total Suspended Solids (TSS) removal percentage in a continuous treatment system for three different concentrations of diluted fish processing wastewaters with nine different operating HRTs.
Figure 3.
Total Suspended Solids (TSS) removal percentage in a continuous treatment system for three different concentrations of diluted fish processing wastewaters with nine different operating HRTs.

Figure 4.
TSS removal percentage in a continuous treatment system for three different concentrations of diluted fish processing wastewaters with 12 different salt concentrations at the HRTs of 8, 9 and 10 days.
Figure 4.
TSS removal percentage in a continuous treatment system for three different concentrations of diluted fish processing wastewaters with 12 different salt concentrations at the HRTs of 8, 9 and 10 days.

Figure 5.
Volatile Suspended Solids (VSS) increase percentage in a continuous treatment system for three different concentrations of diluted fish processing wastewaters at nine different operating HRTs.
Figure 5.
Volatile Suspended Solids (VSS) increase percentage in a continuous treatment system for three different concentrations of diluted fish processing wastewaters at nine different operating HRTs.
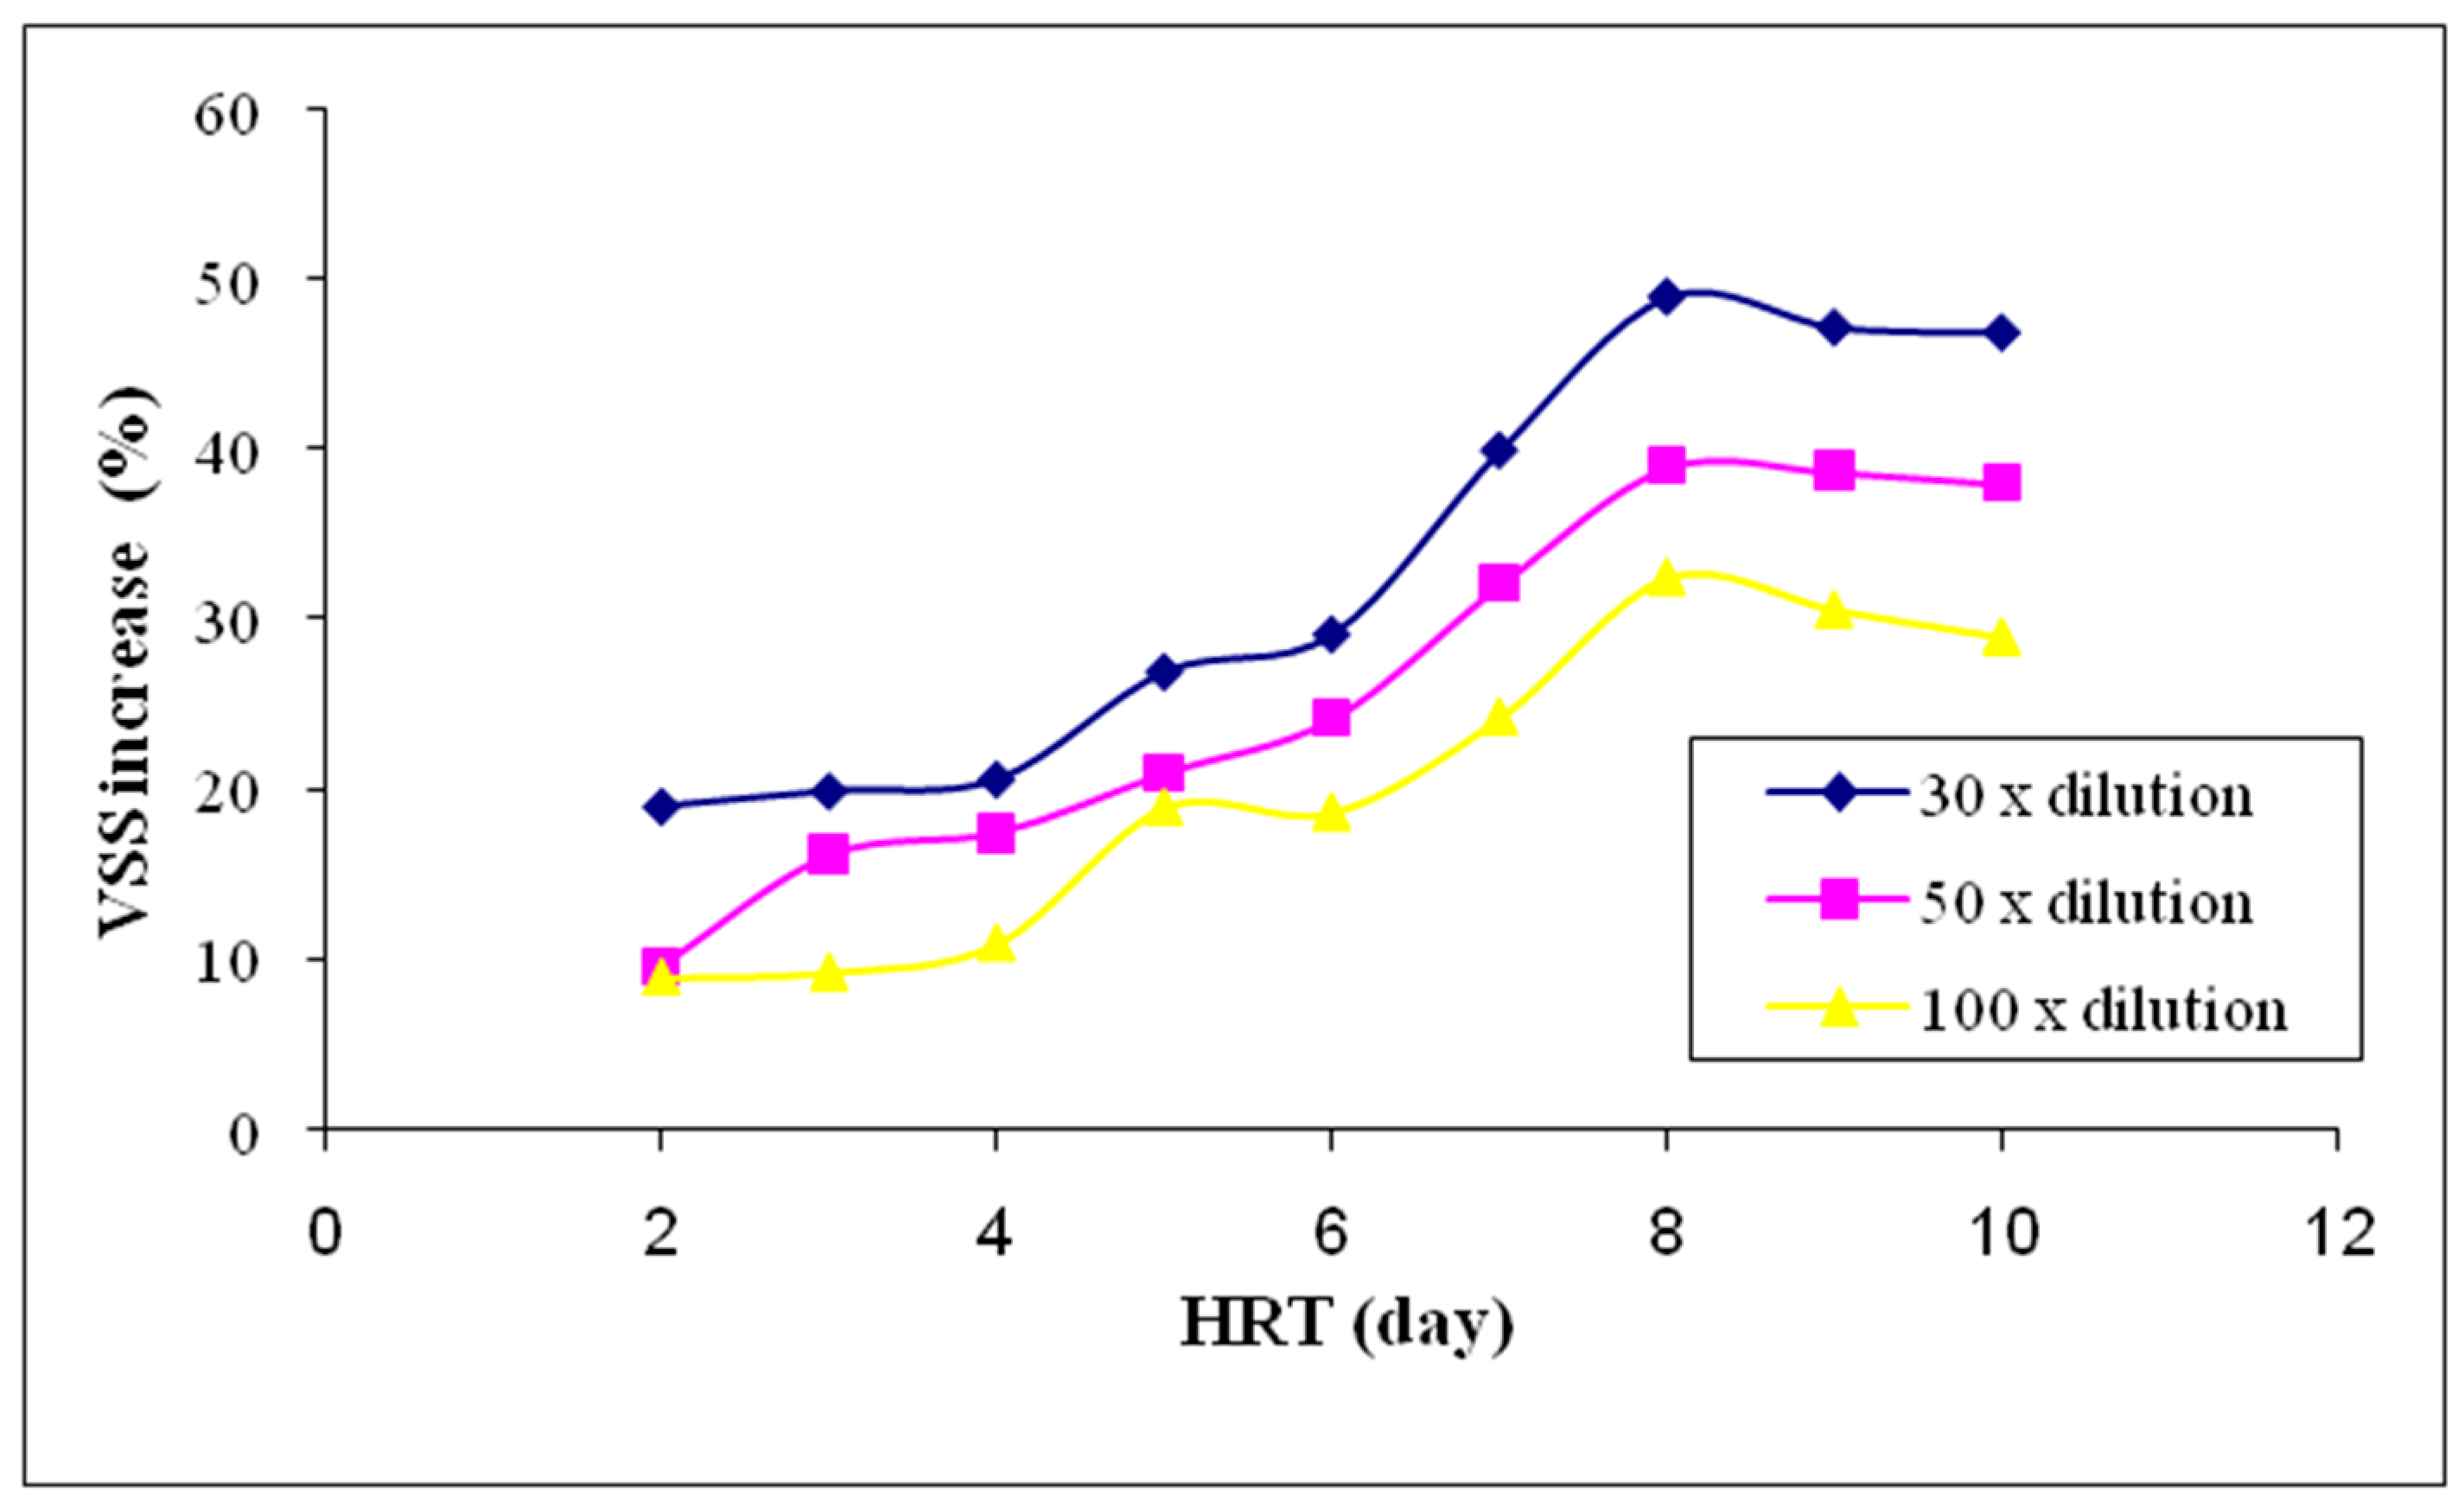
Figure 6.
VSS increase percentage in a continuous treatment system for three different concentrations of diluted fish processing wastewaters with 12 different salt concentrations at the HRTs of 8, 9 and 10 days.
Figure 6.
VSS increase percentage in a continuous treatment system for three different concentrations of diluted fish processing wastewaters with 12 different salt concentrations at the HRTs of 8, 9 and 10 days.

Figure 7.
Five-Day Biochemical Oxygen Demand (BOD5) removal percentage in a continuous treatment system for three different concentrations of diluted fish processing wastewaters with nine different operating HRTs.
Figure 7.
Five-Day Biochemical Oxygen Demand (BOD5) removal percentage in a continuous treatment system for three different concentrations of diluted fish processing wastewaters with nine different operating HRTs.

Figure 8.
BOD5 removal percentage in a continuous treatment system for three different concentrations of diluted fish processing wastewaters with 12 different salt concentrations at the HRTs of 8, 9 and 10 days.
Figure 8.
BOD5 removal percentage in a continuous treatment system for three different concentrations of diluted fish processing wastewaters with 12 different salt concentrations at the HRTs of 8, 9 and 10 days.
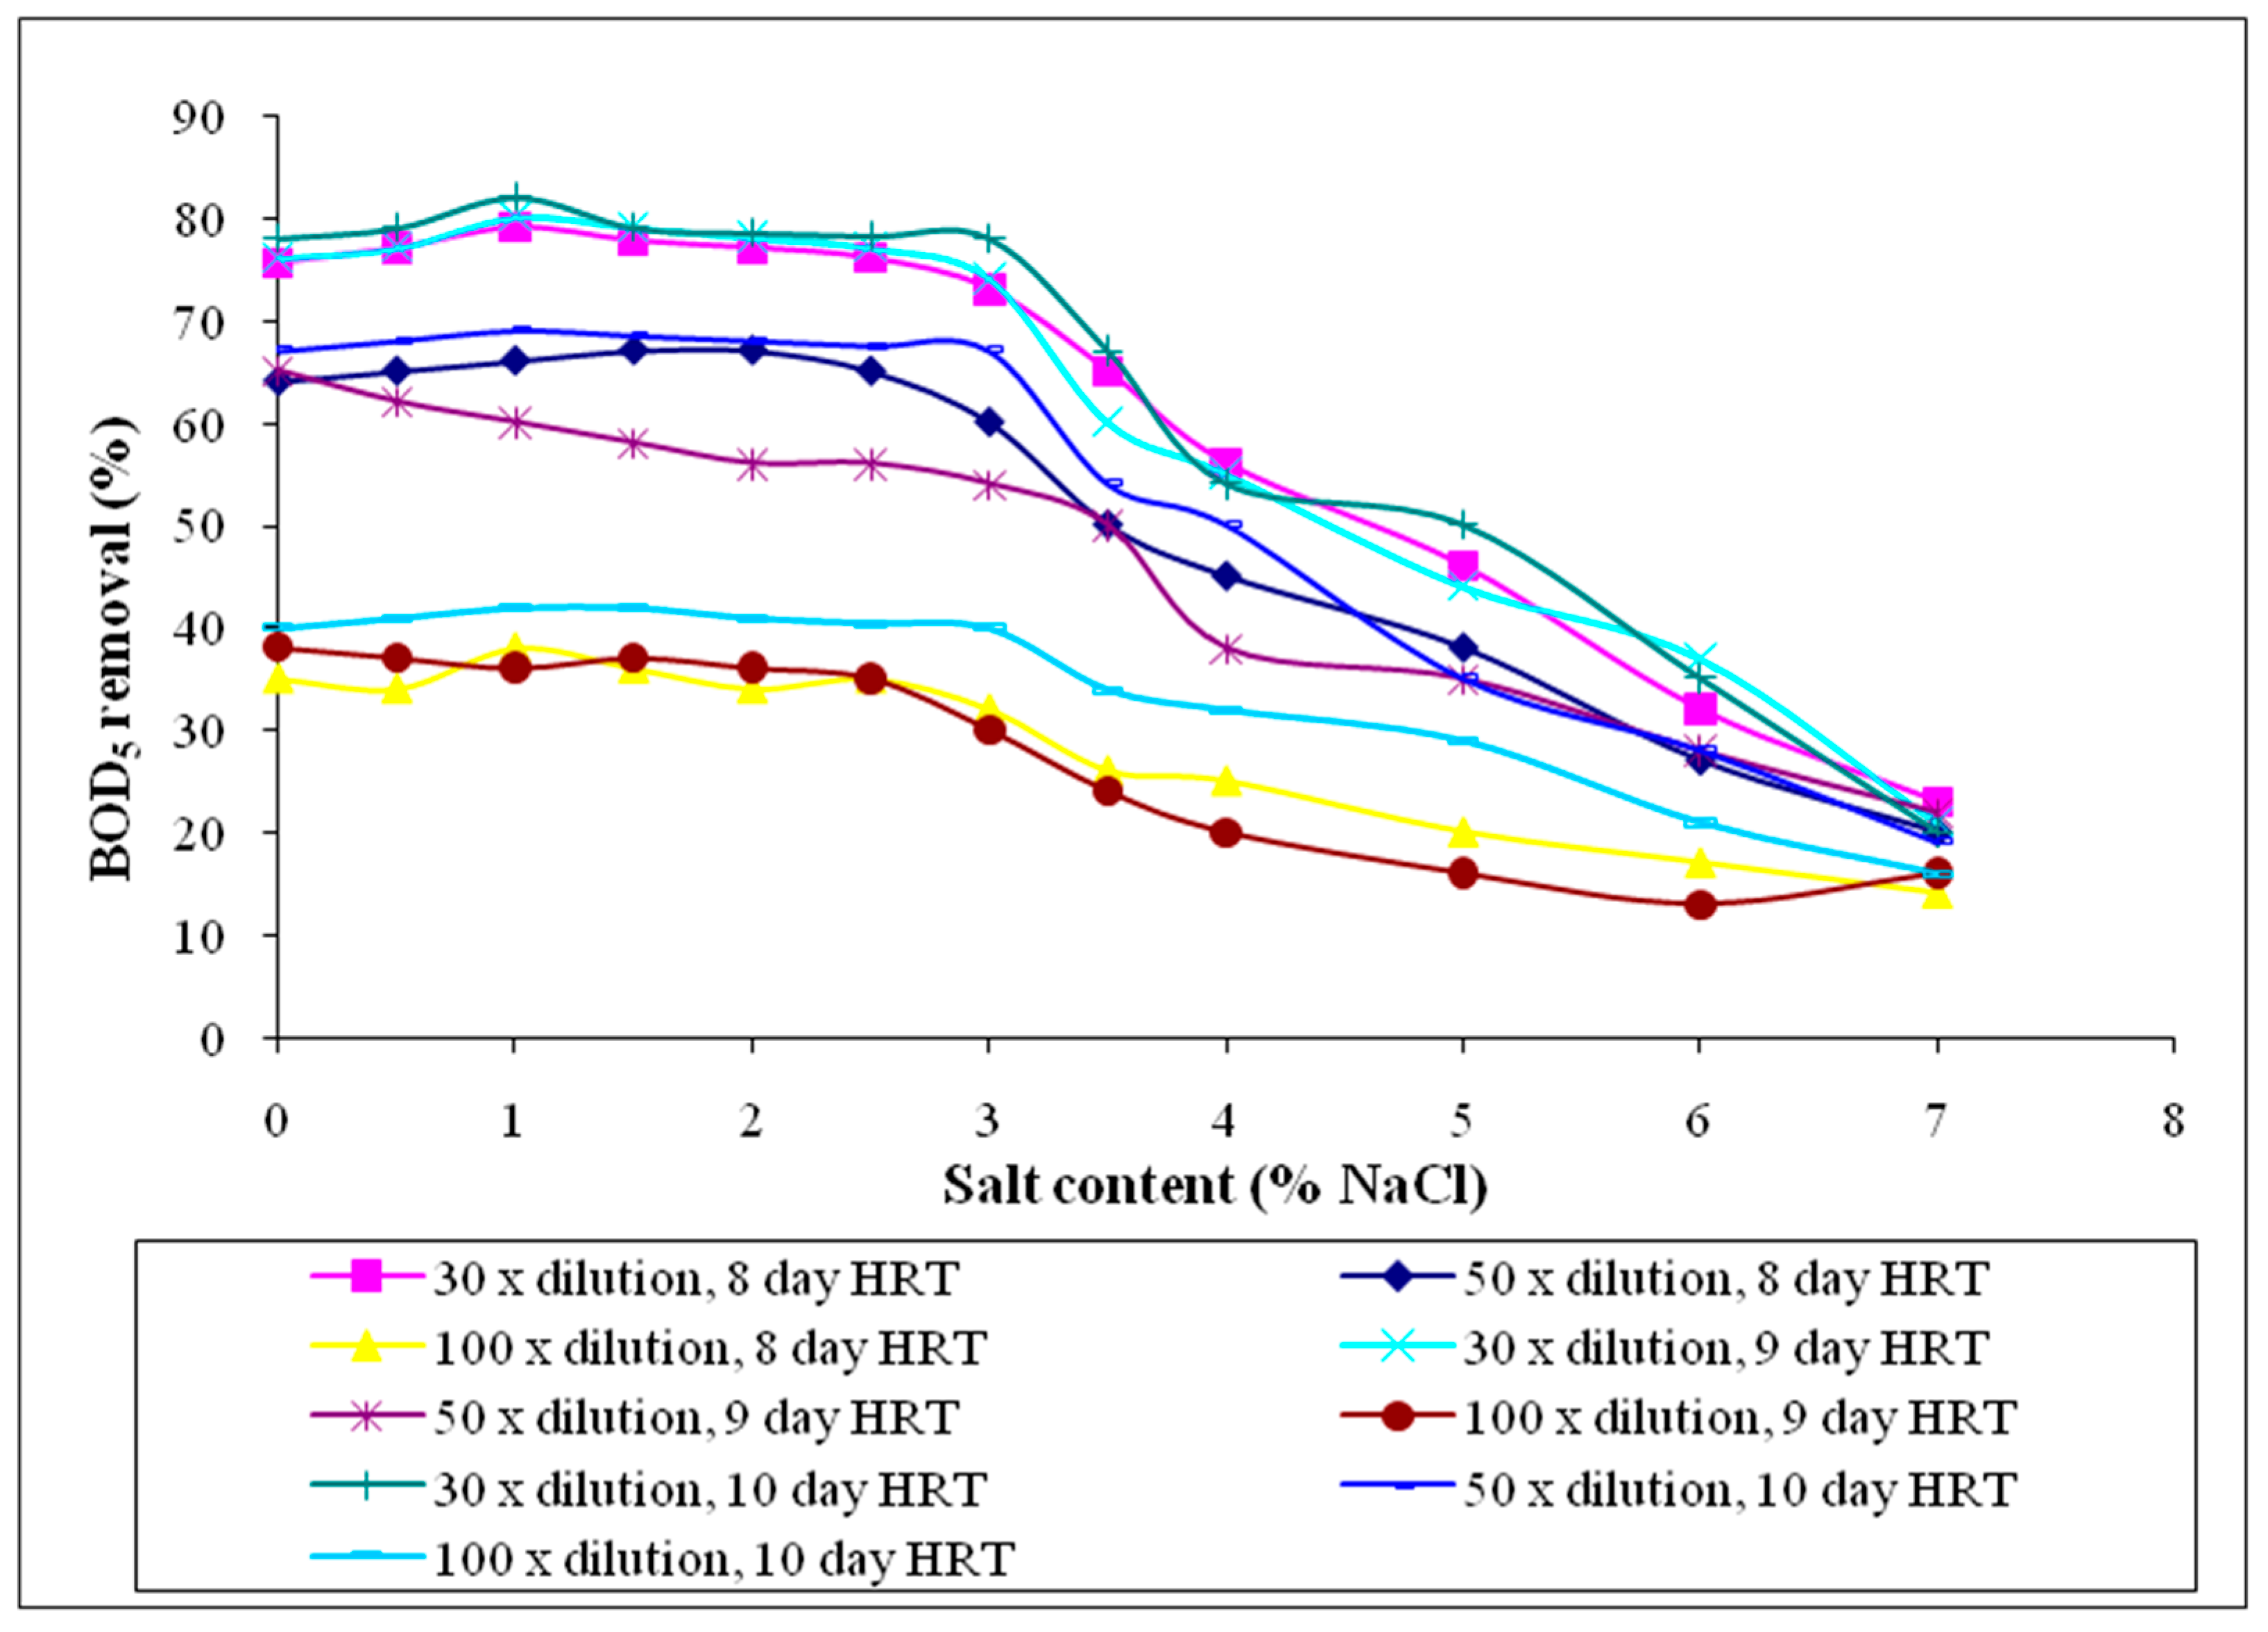
Figure 9.
Chemical Oxygen Demand (COD) removal percentage in continuous flow treatment systems for three different concentrations of diluted fish processing wastewaters with nine different operating HRTs.
Figure 9.
Chemical Oxygen Demand (COD) removal percentage in continuous flow treatment systems for three different concentrations of diluted fish processing wastewaters with nine different operating HRTs.

Figure 10.
COD removal percentage in continuous system for three different concentrations of diluted fish processing wastewaters with 0.0%, 0.5%, 1.0%, 1.5%, 2.0%, 2.5%, 3.0%, 3.5%, 4.0%, 5.0%, 6.0%, 7.0% salt concentrations at the HRTs of 8, 9 and 10 days.
Figure 10.
COD removal percentage in continuous system for three different concentrations of diluted fish processing wastewaters with 0.0%, 0.5%, 1.0%, 1.5%, 2.0%, 2.5%, 3.0%, 3.5%, 4.0%, 5.0%, 6.0%, 7.0% salt concentrations at the HRTs of 8, 9 and 10 days.

Figure 11.
Biomass yield percentage in continuous system treatment for three different concentrations of diluted fish processing wastewaters with nine different operating HRT conditions.
Figure 11.
Biomass yield percentage in continuous system treatment for three different concentrations of diluted fish processing wastewaters with nine different operating HRT conditions.
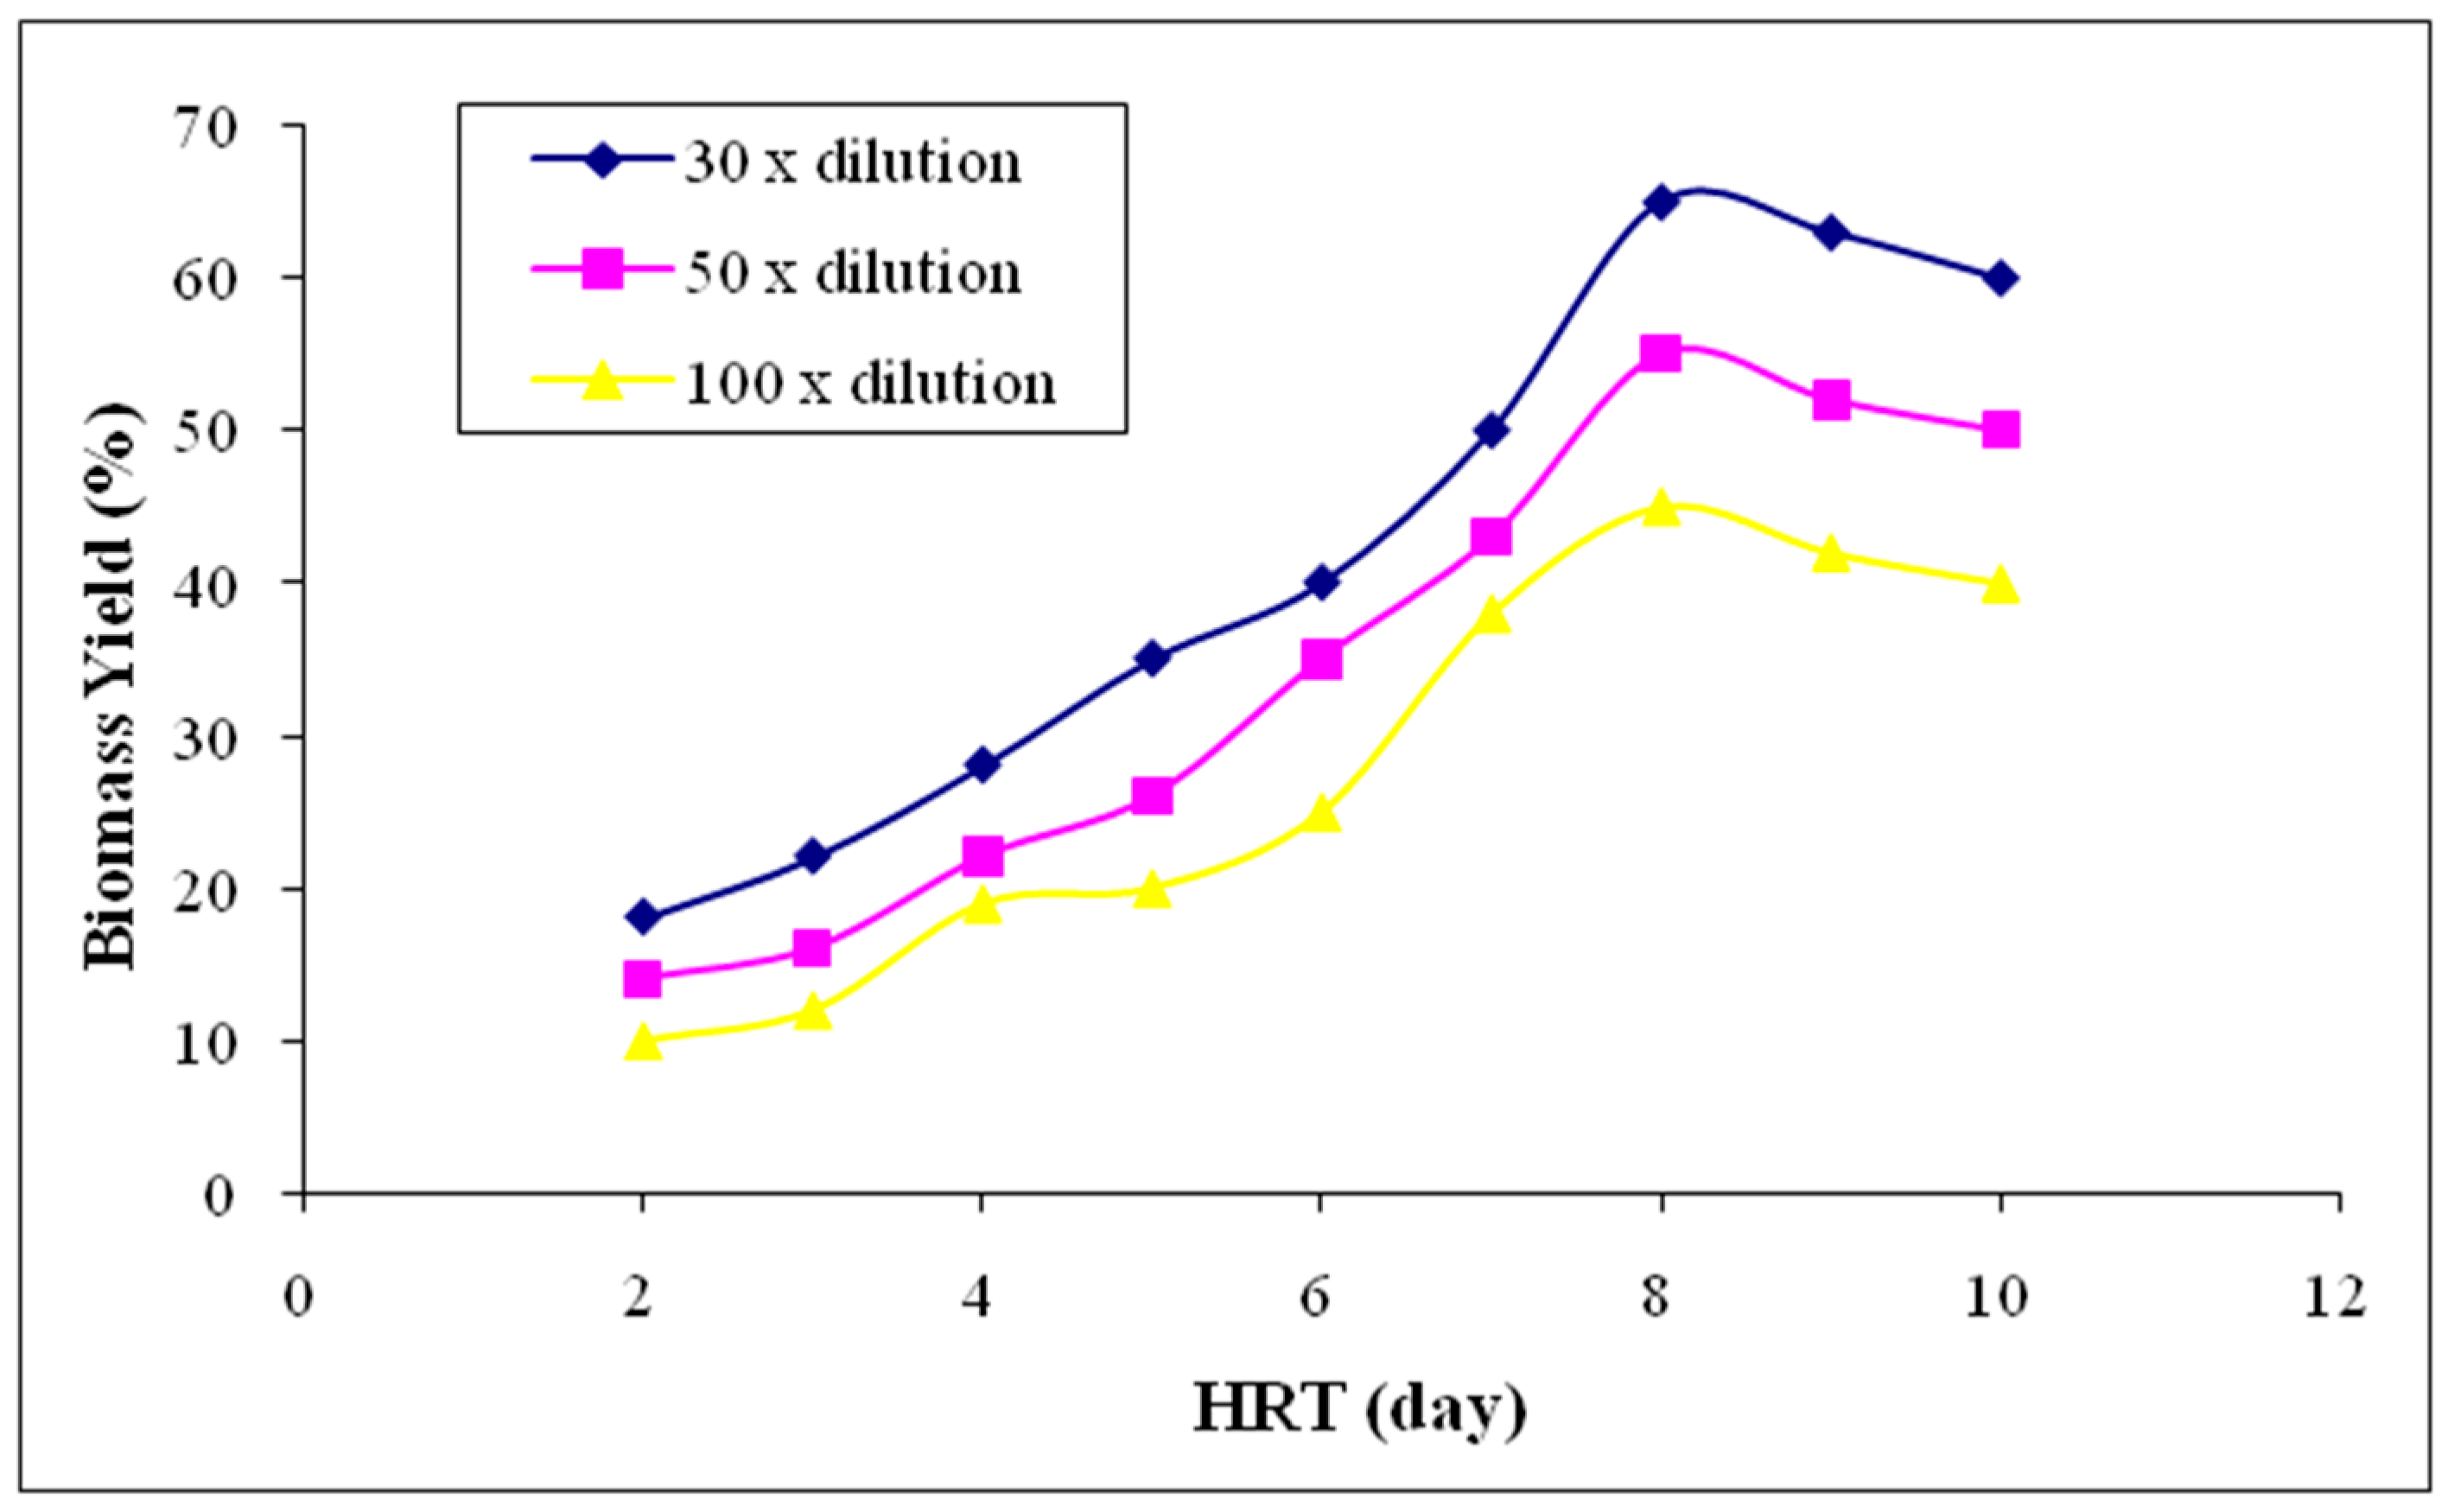
Figure 12.
Biomass yield removal percentage in a continuous treatment system for three different concentrations of diluted fish processing wastewaters with 12 different salt concentrations at the HRTs of 8, 9 and 10 days.
Figure 12.
Biomass yield removal percentage in a continuous treatment system for three different concentrations of diluted fish processing wastewaters with 12 different salt concentrations at the HRTs of 8, 9 and 10 days.

Figure 13.
NH3-N removal percentage in a continuous treatment system for three different concentrations of diluted fish processing wastewaters with nine different operating HRT conditions.
Figure 13.
NH3-N removal percentage in a continuous treatment system for three different concentrations of diluted fish processing wastewaters with nine different operating HRT conditions.

Figure 14.
NH3-N removal percentage in a continuous treatment system for three different concentrations of diluted fish processing wastewaters with 12 different salt concentrations at the HRTs of 8, 9 and 10 days.
Figure 14.
NH3-N removal percentage in a continuous treatment system for three different concentrations of diluted fish processing wastewaters with 12 different salt concentrations at the HRTs of 8, 9 and 10 days.

Figure 15.
NO3−-N removal percentage in continuous treatment system for three different concentrations of diluted fish processing wastewaters with 9 different HRT operating conditions.
Figure 15.
NO3−-N removal percentage in continuous treatment system for three different concentrations of diluted fish processing wastewaters with 9 different HRT operating conditions.

Figure 16.
NO3−-N removal percentage in continuous treatment system for three different concentrations of diluted fish processing wastewaters with 12 different salt concentrations at the HRTs of 8, 9 and 10 days.
Figure 16.
NO3−-N removal percentage in continuous treatment system for three different concentrations of diluted fish processing wastewaters with 12 different salt concentrations at the HRTs of 8, 9 and 10 days.
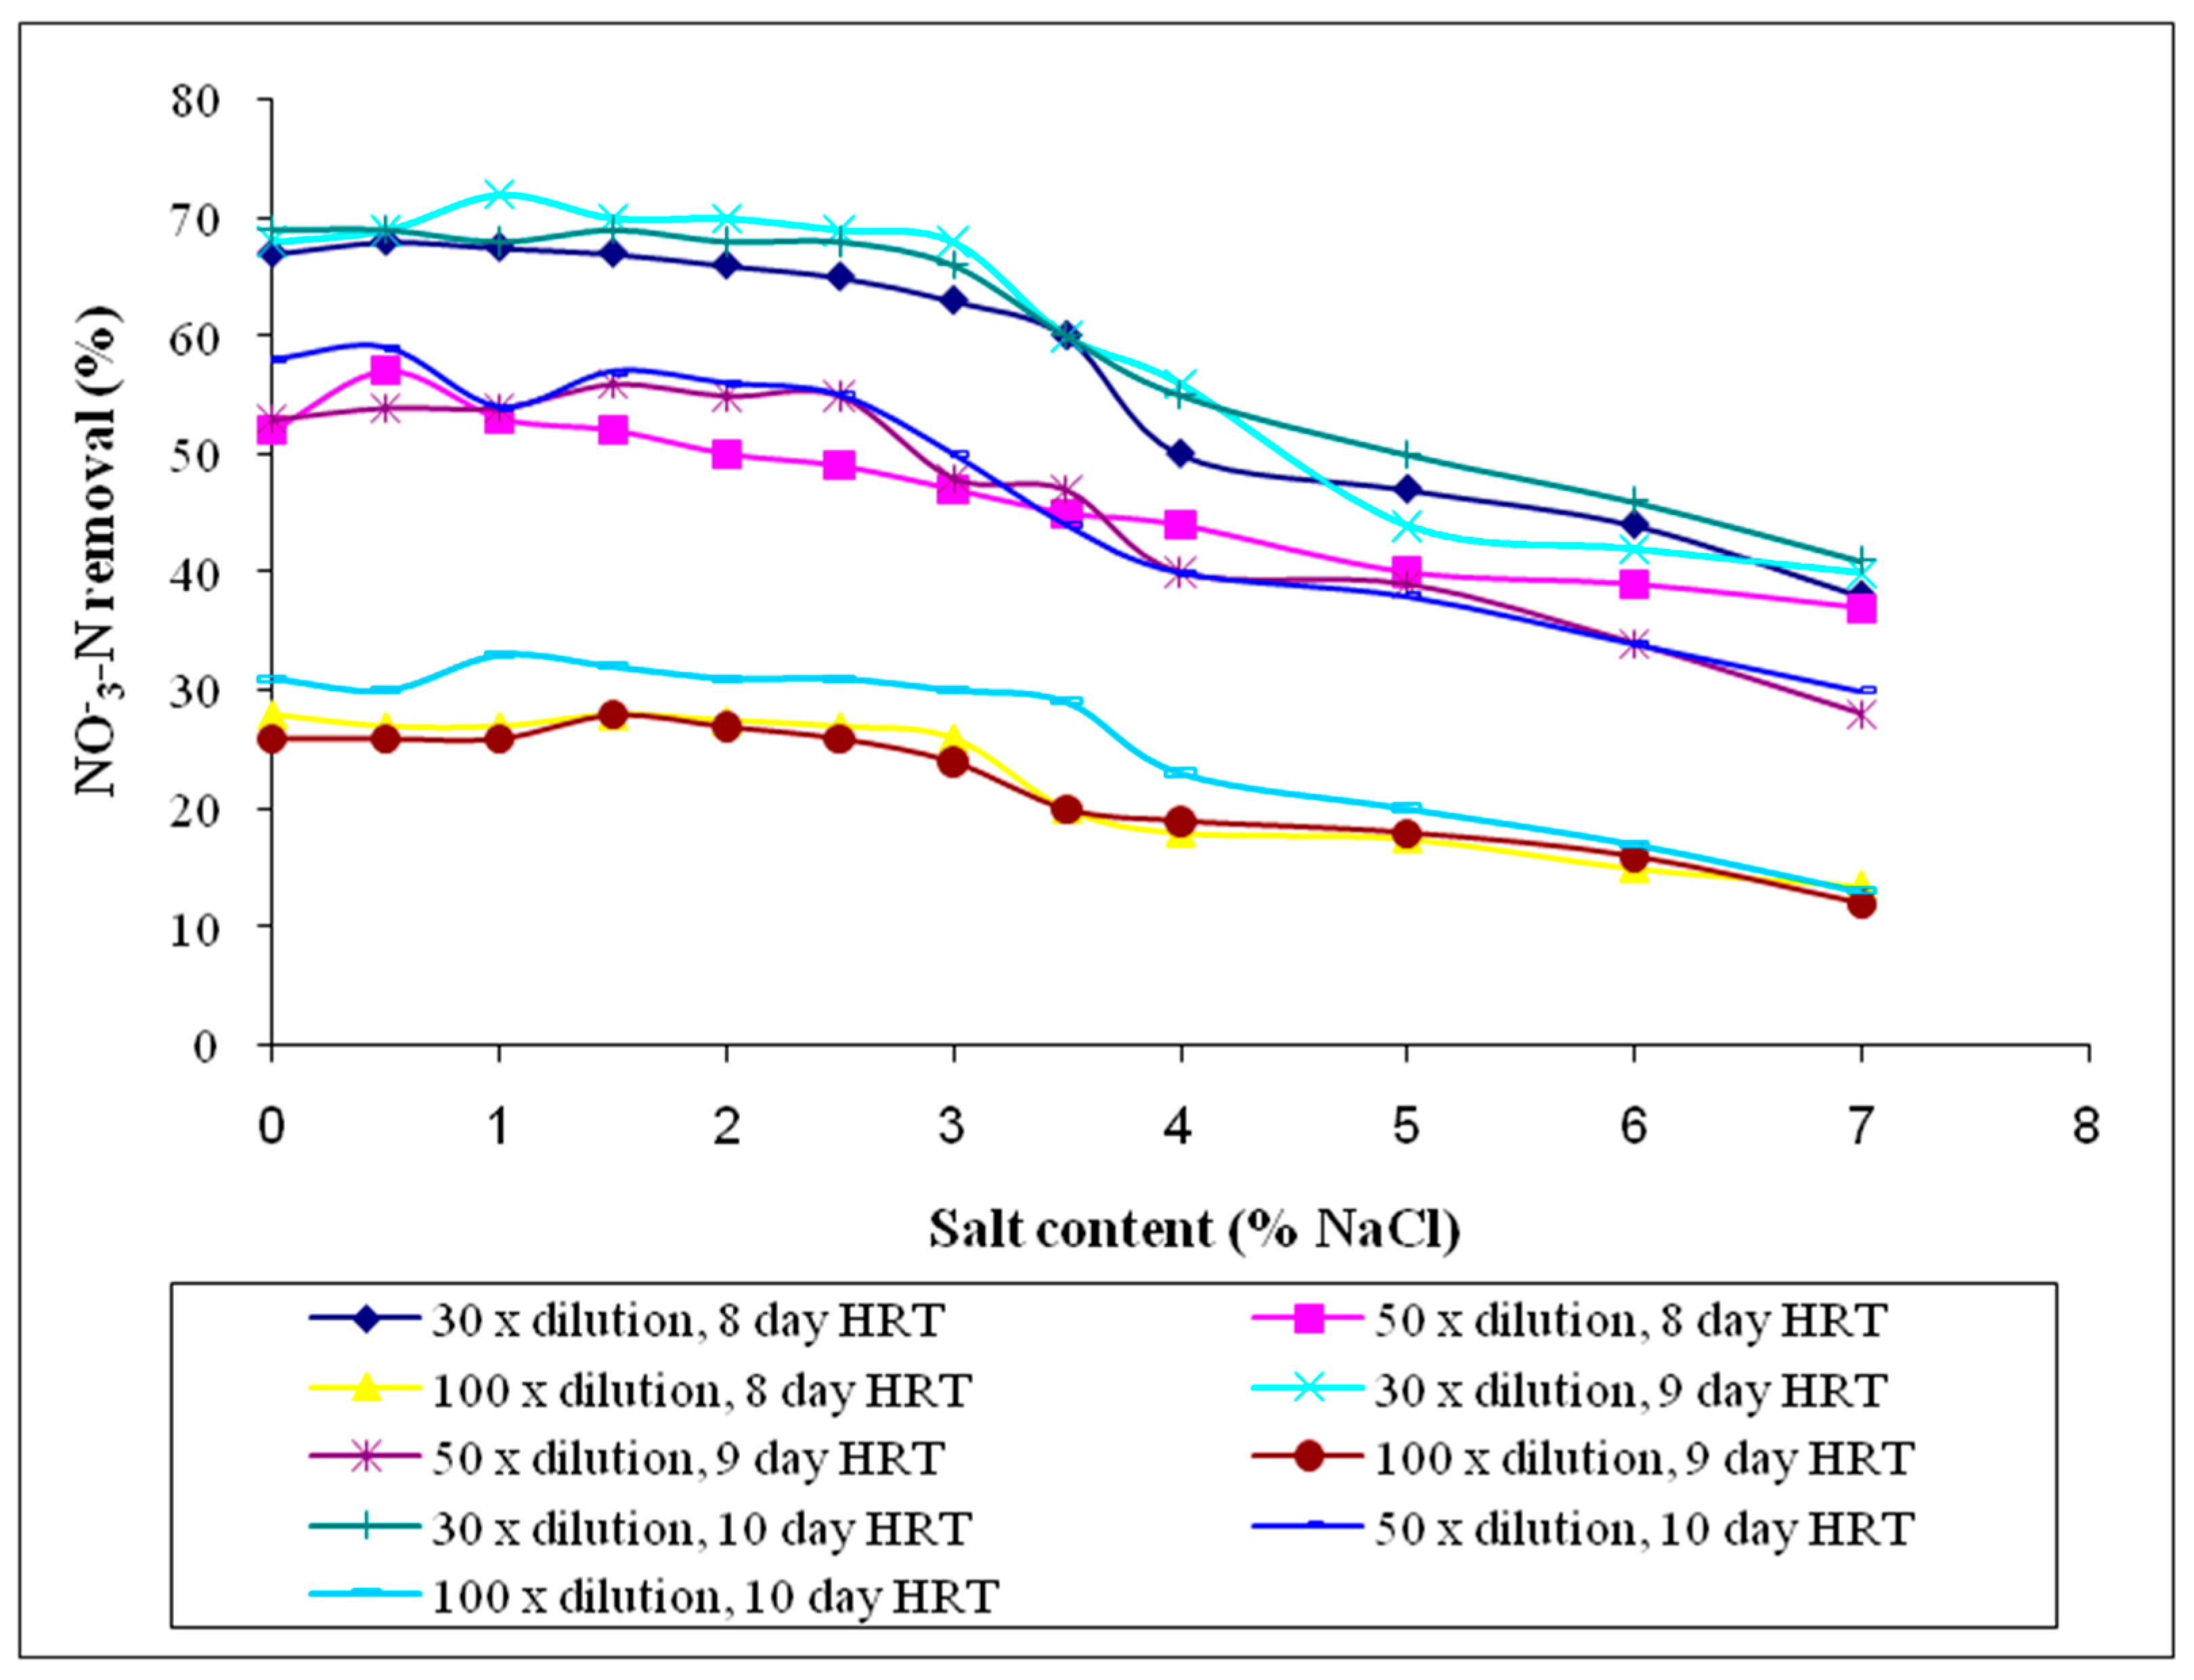
Figure 17.
P removal percentage in continuous treatment system for three different concentrations of diluted fish processing wastewaters at nine different HRT operating conditions.
Figure 17.
P removal percentage in continuous treatment system for three different concentrations of diluted fish processing wastewaters at nine different HRT operating conditions.
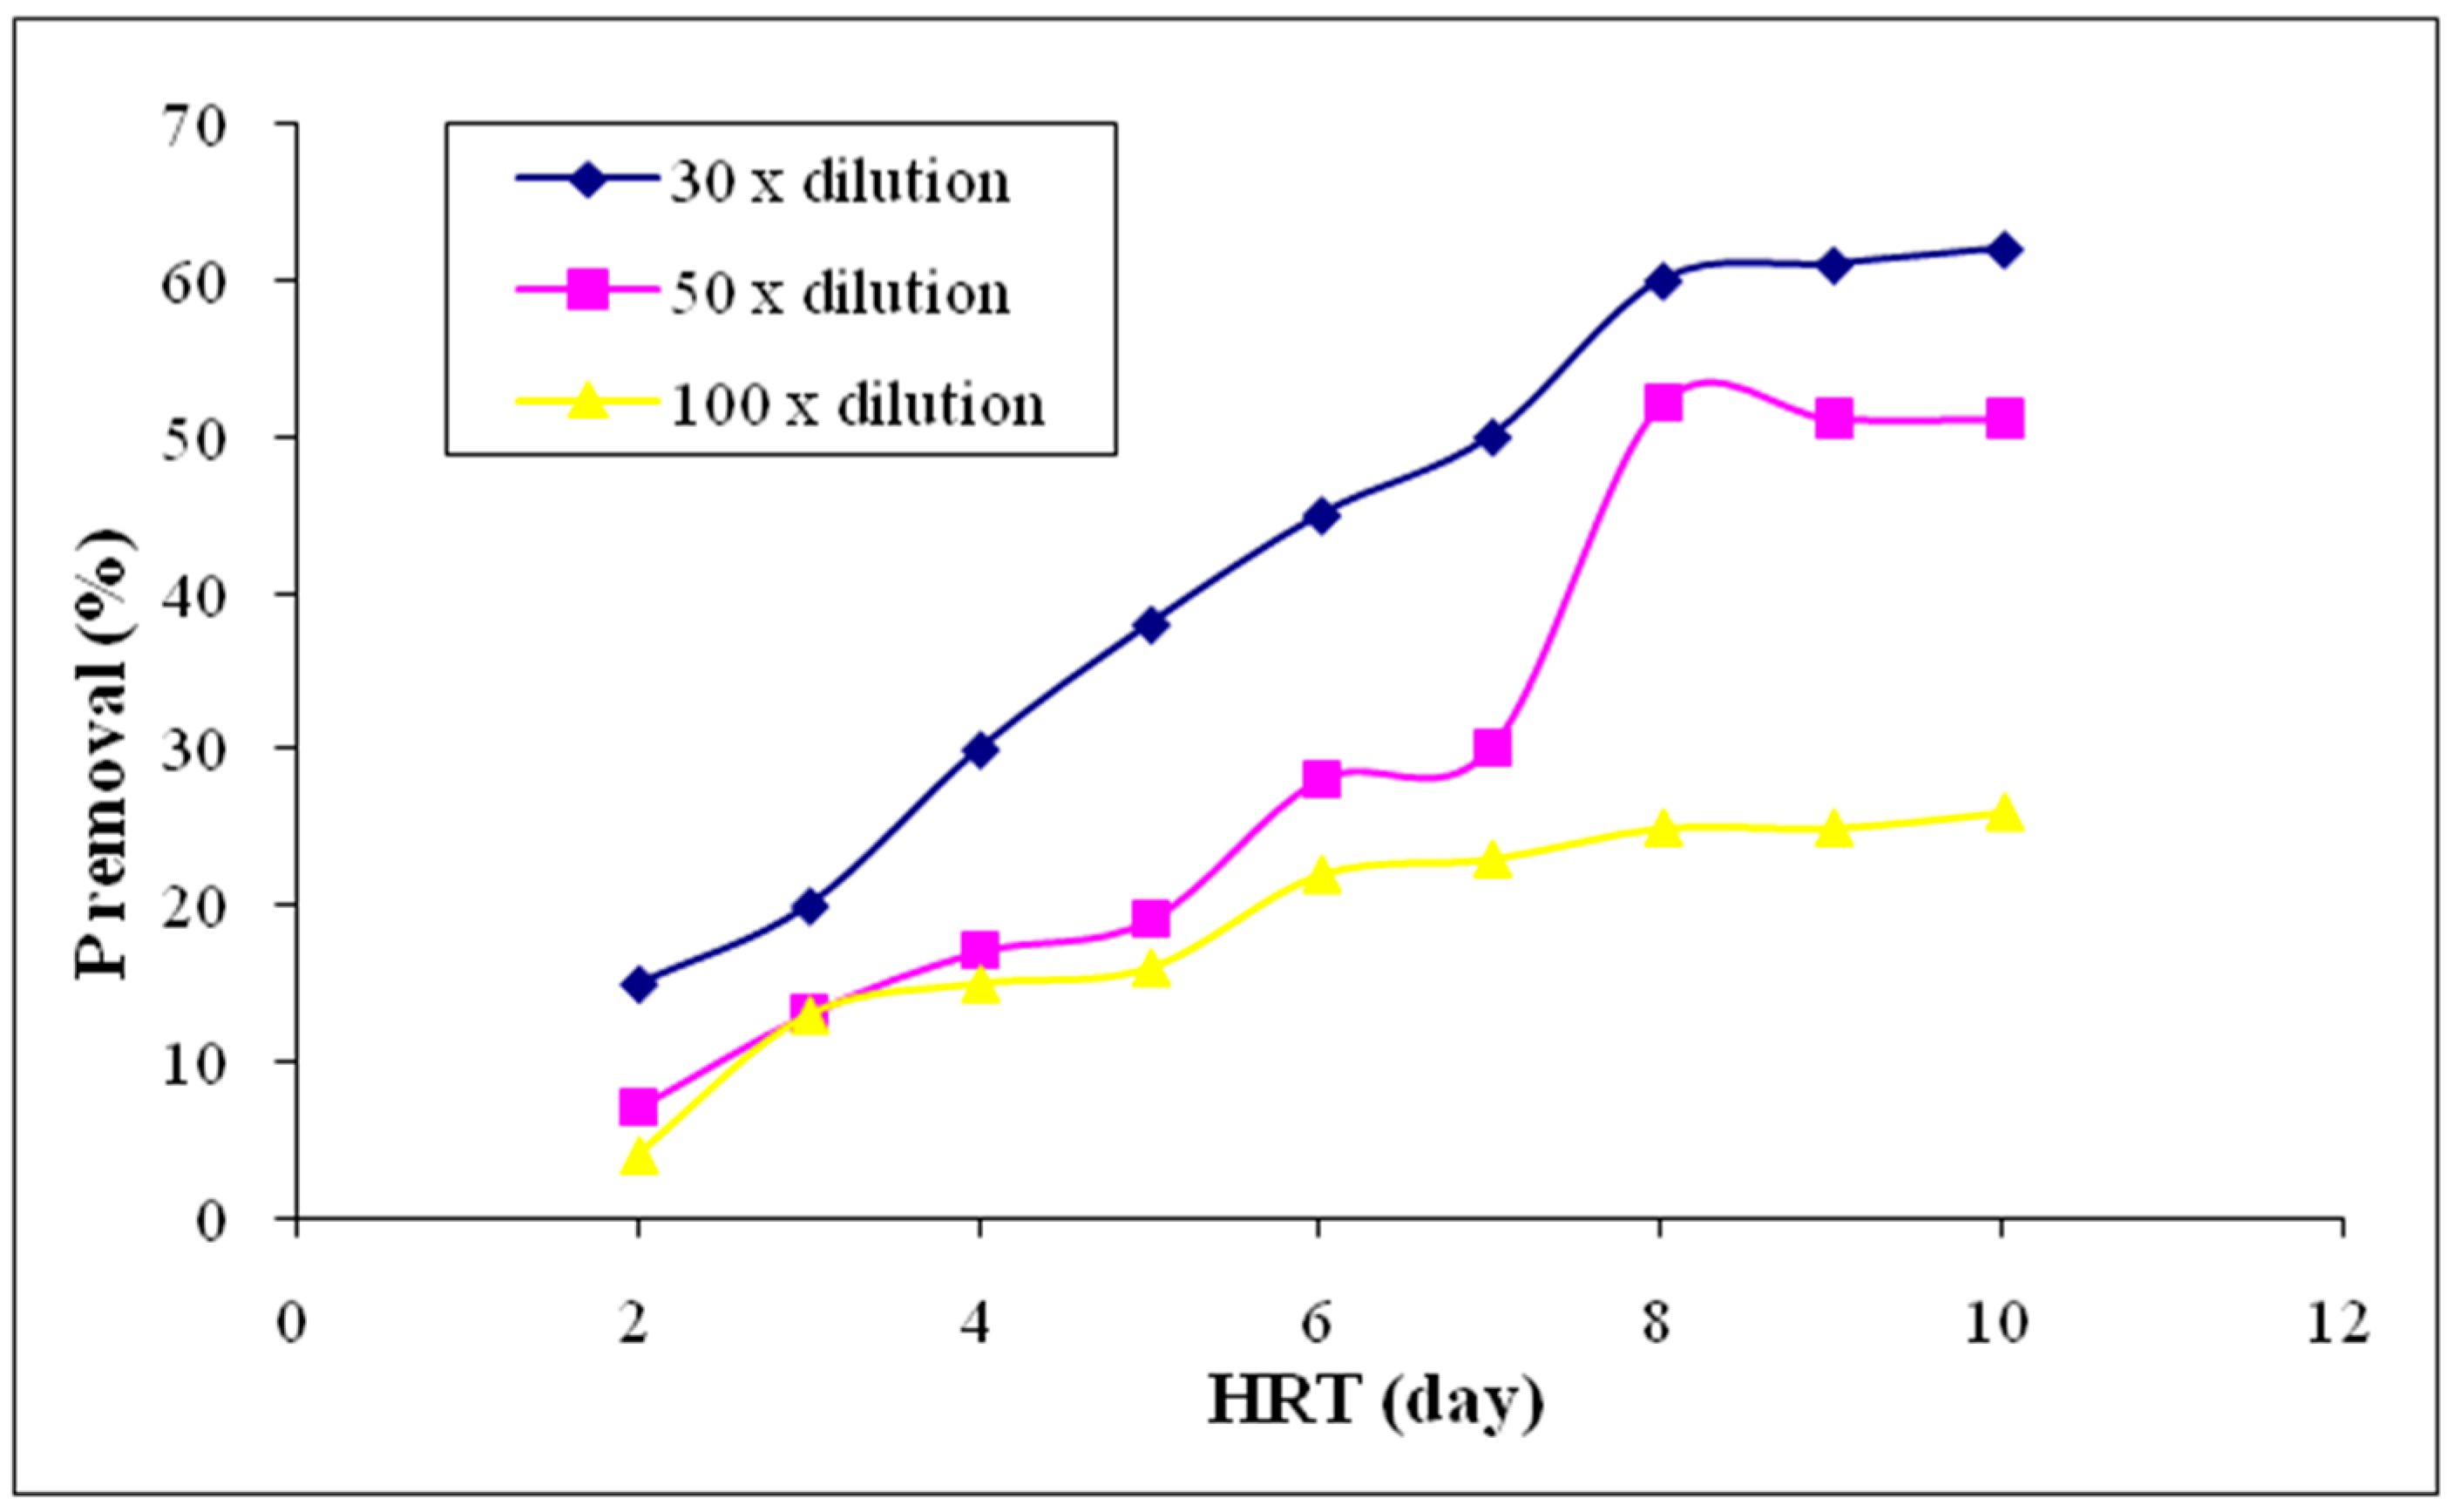
Figure 18.
P removal percentage in continuous treatment system for three different concentrations of diluted fish processing wastewater with 12 different salt concentrations at the HRTs of 8, 9 and 10 days.
Figure 18.
P removal percentage in continuous treatment system for three different concentrations of diluted fish processing wastewater with 12 different salt concentrations at the HRTs of 8, 9 and 10 days.


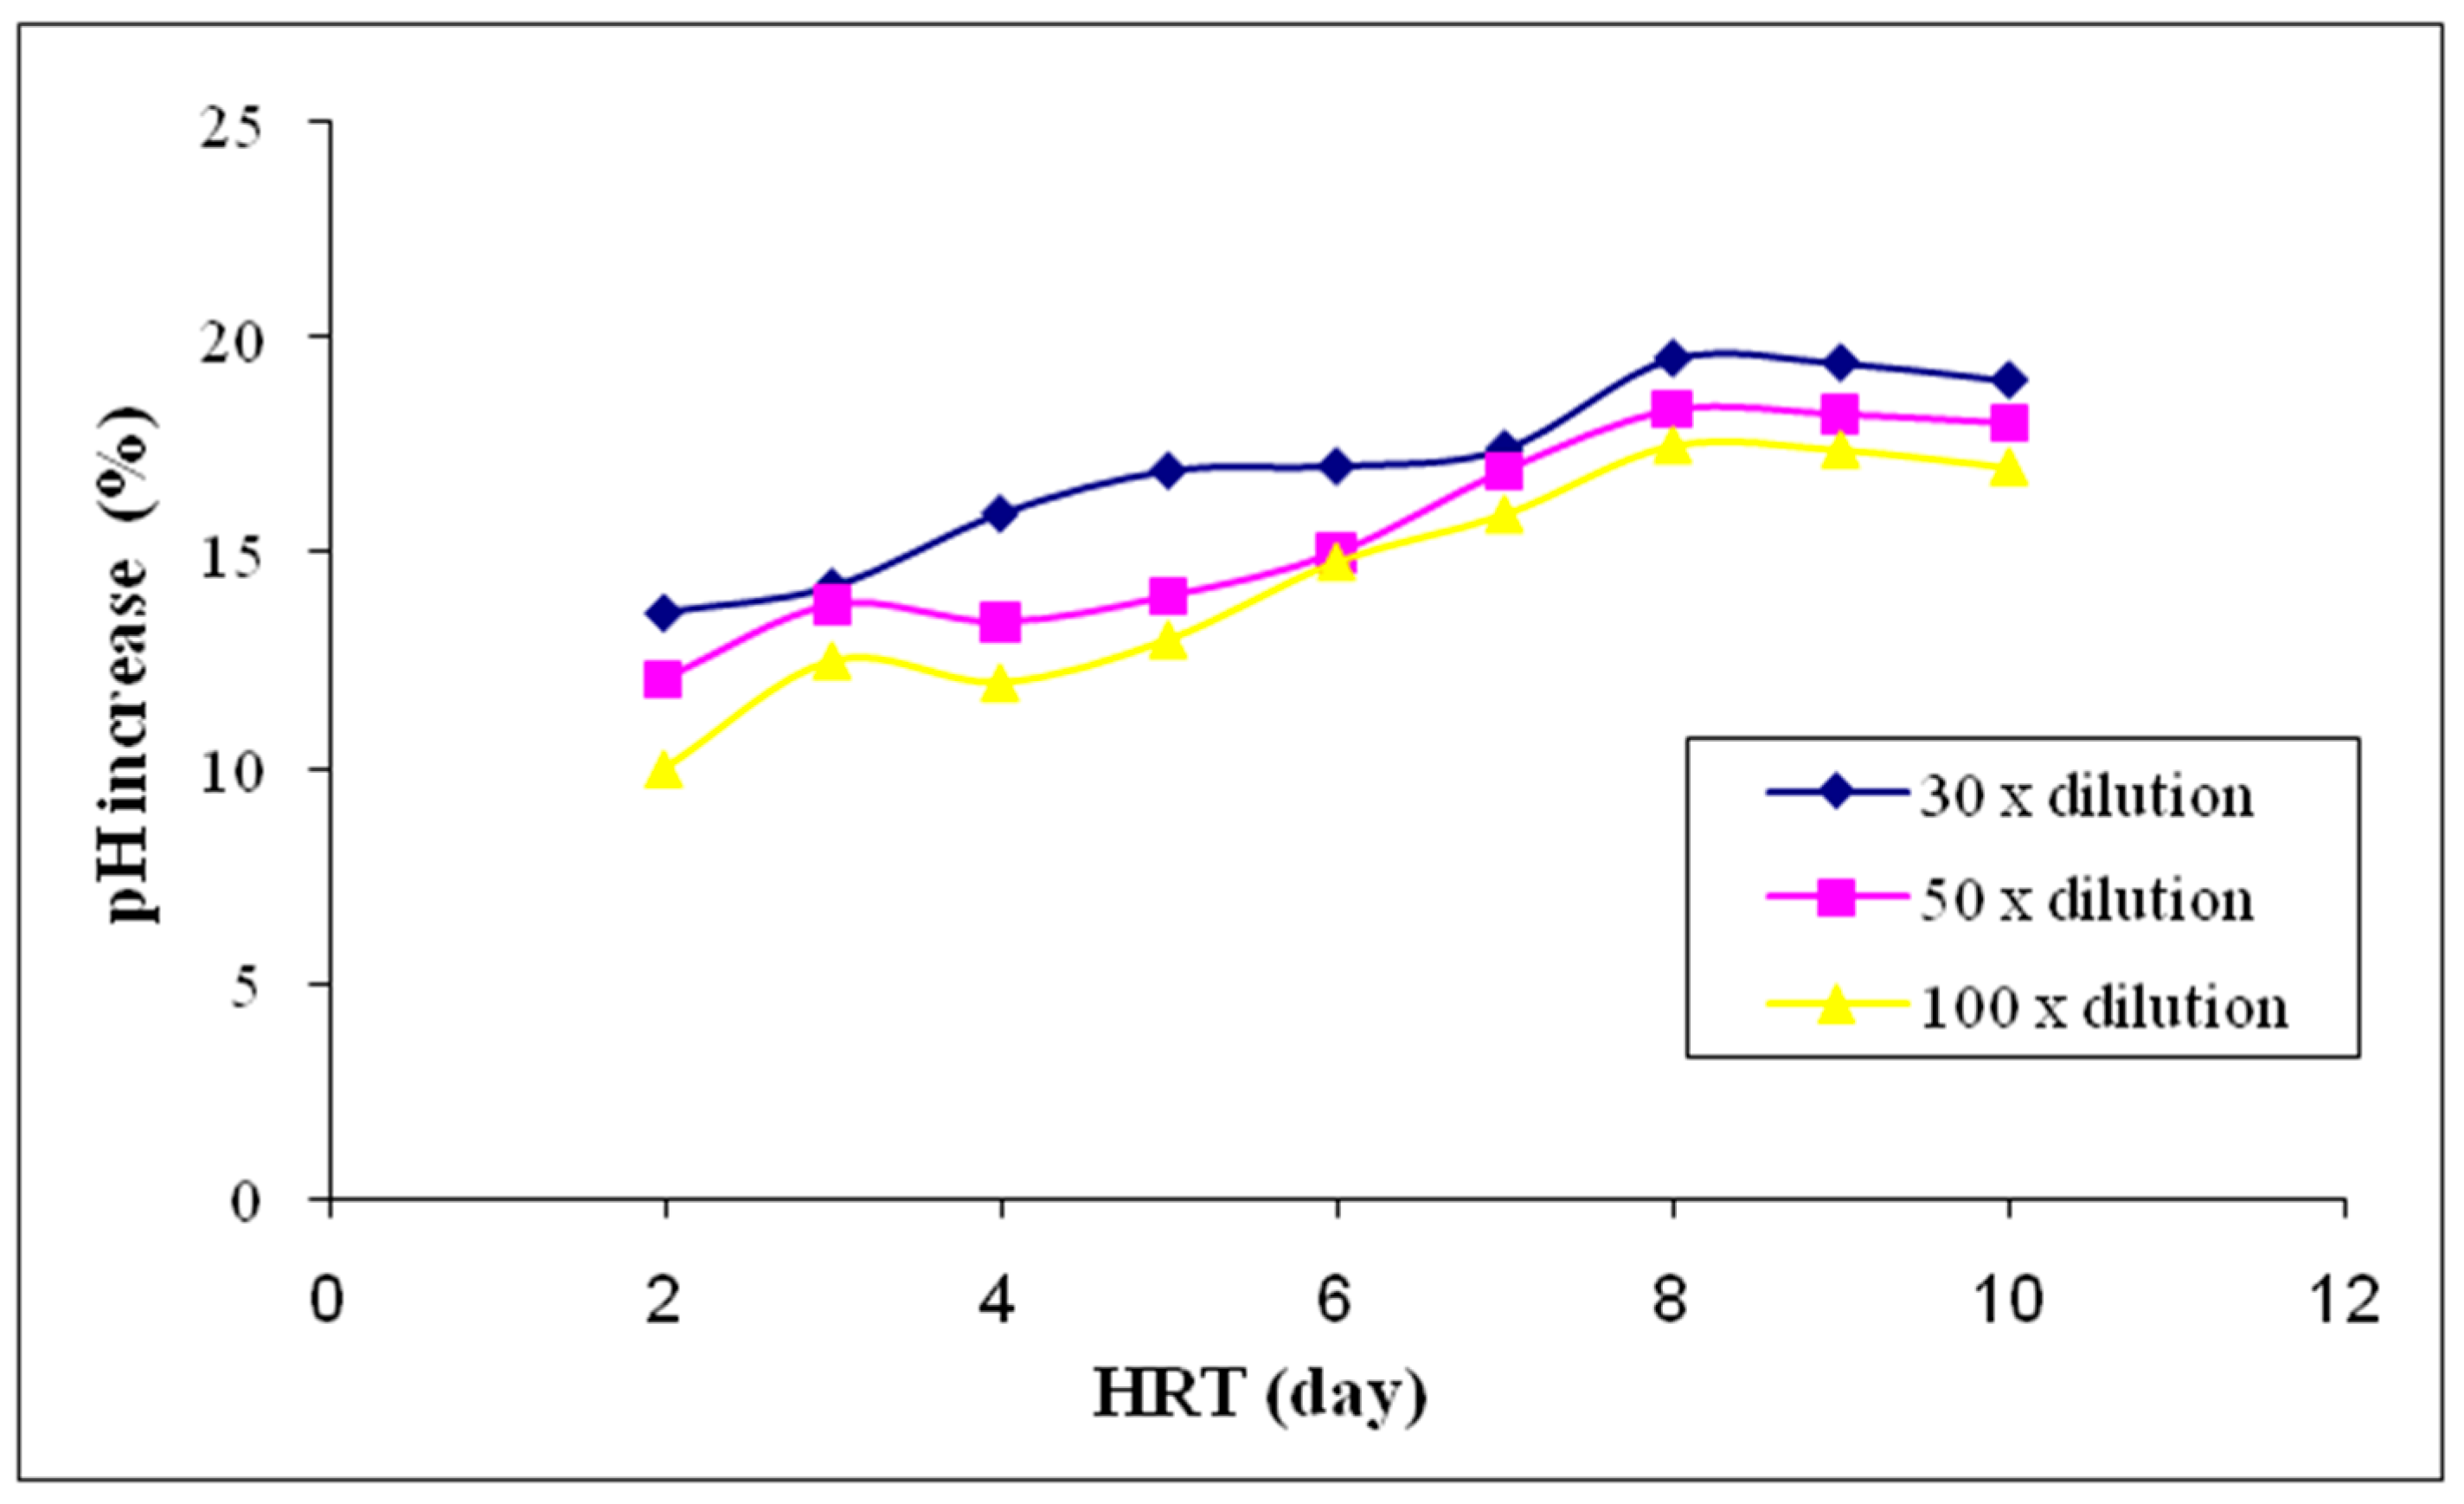
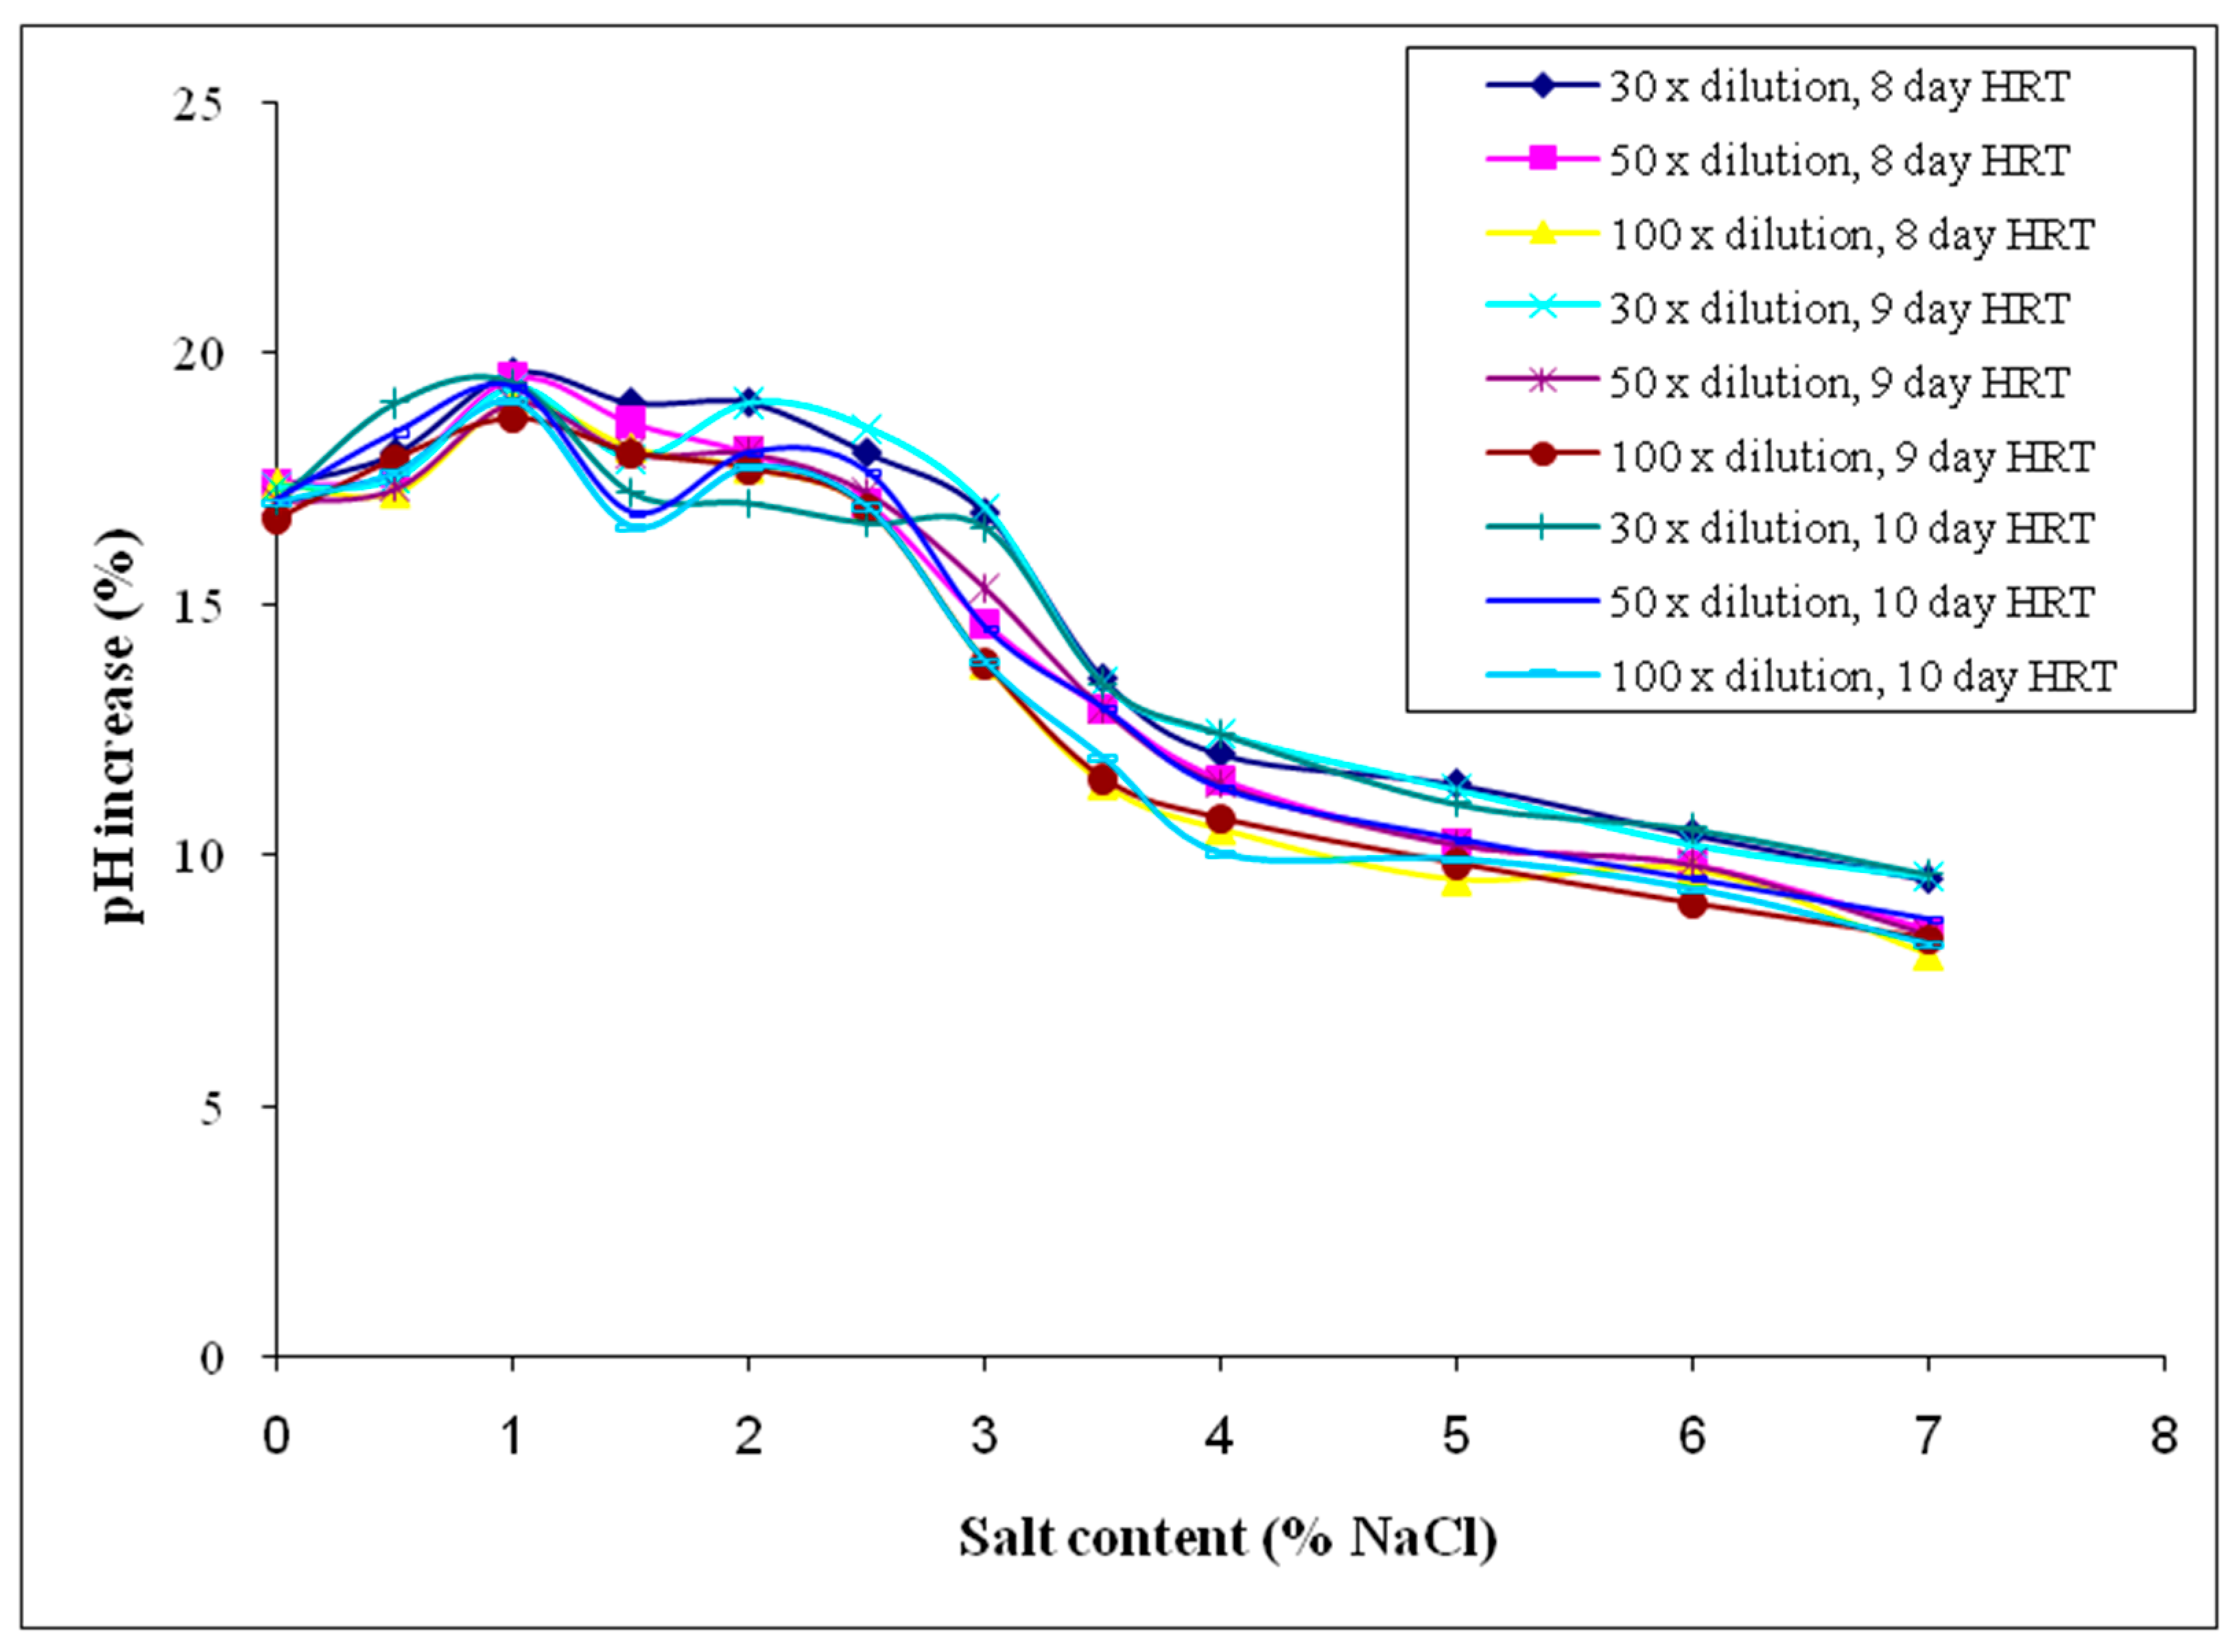
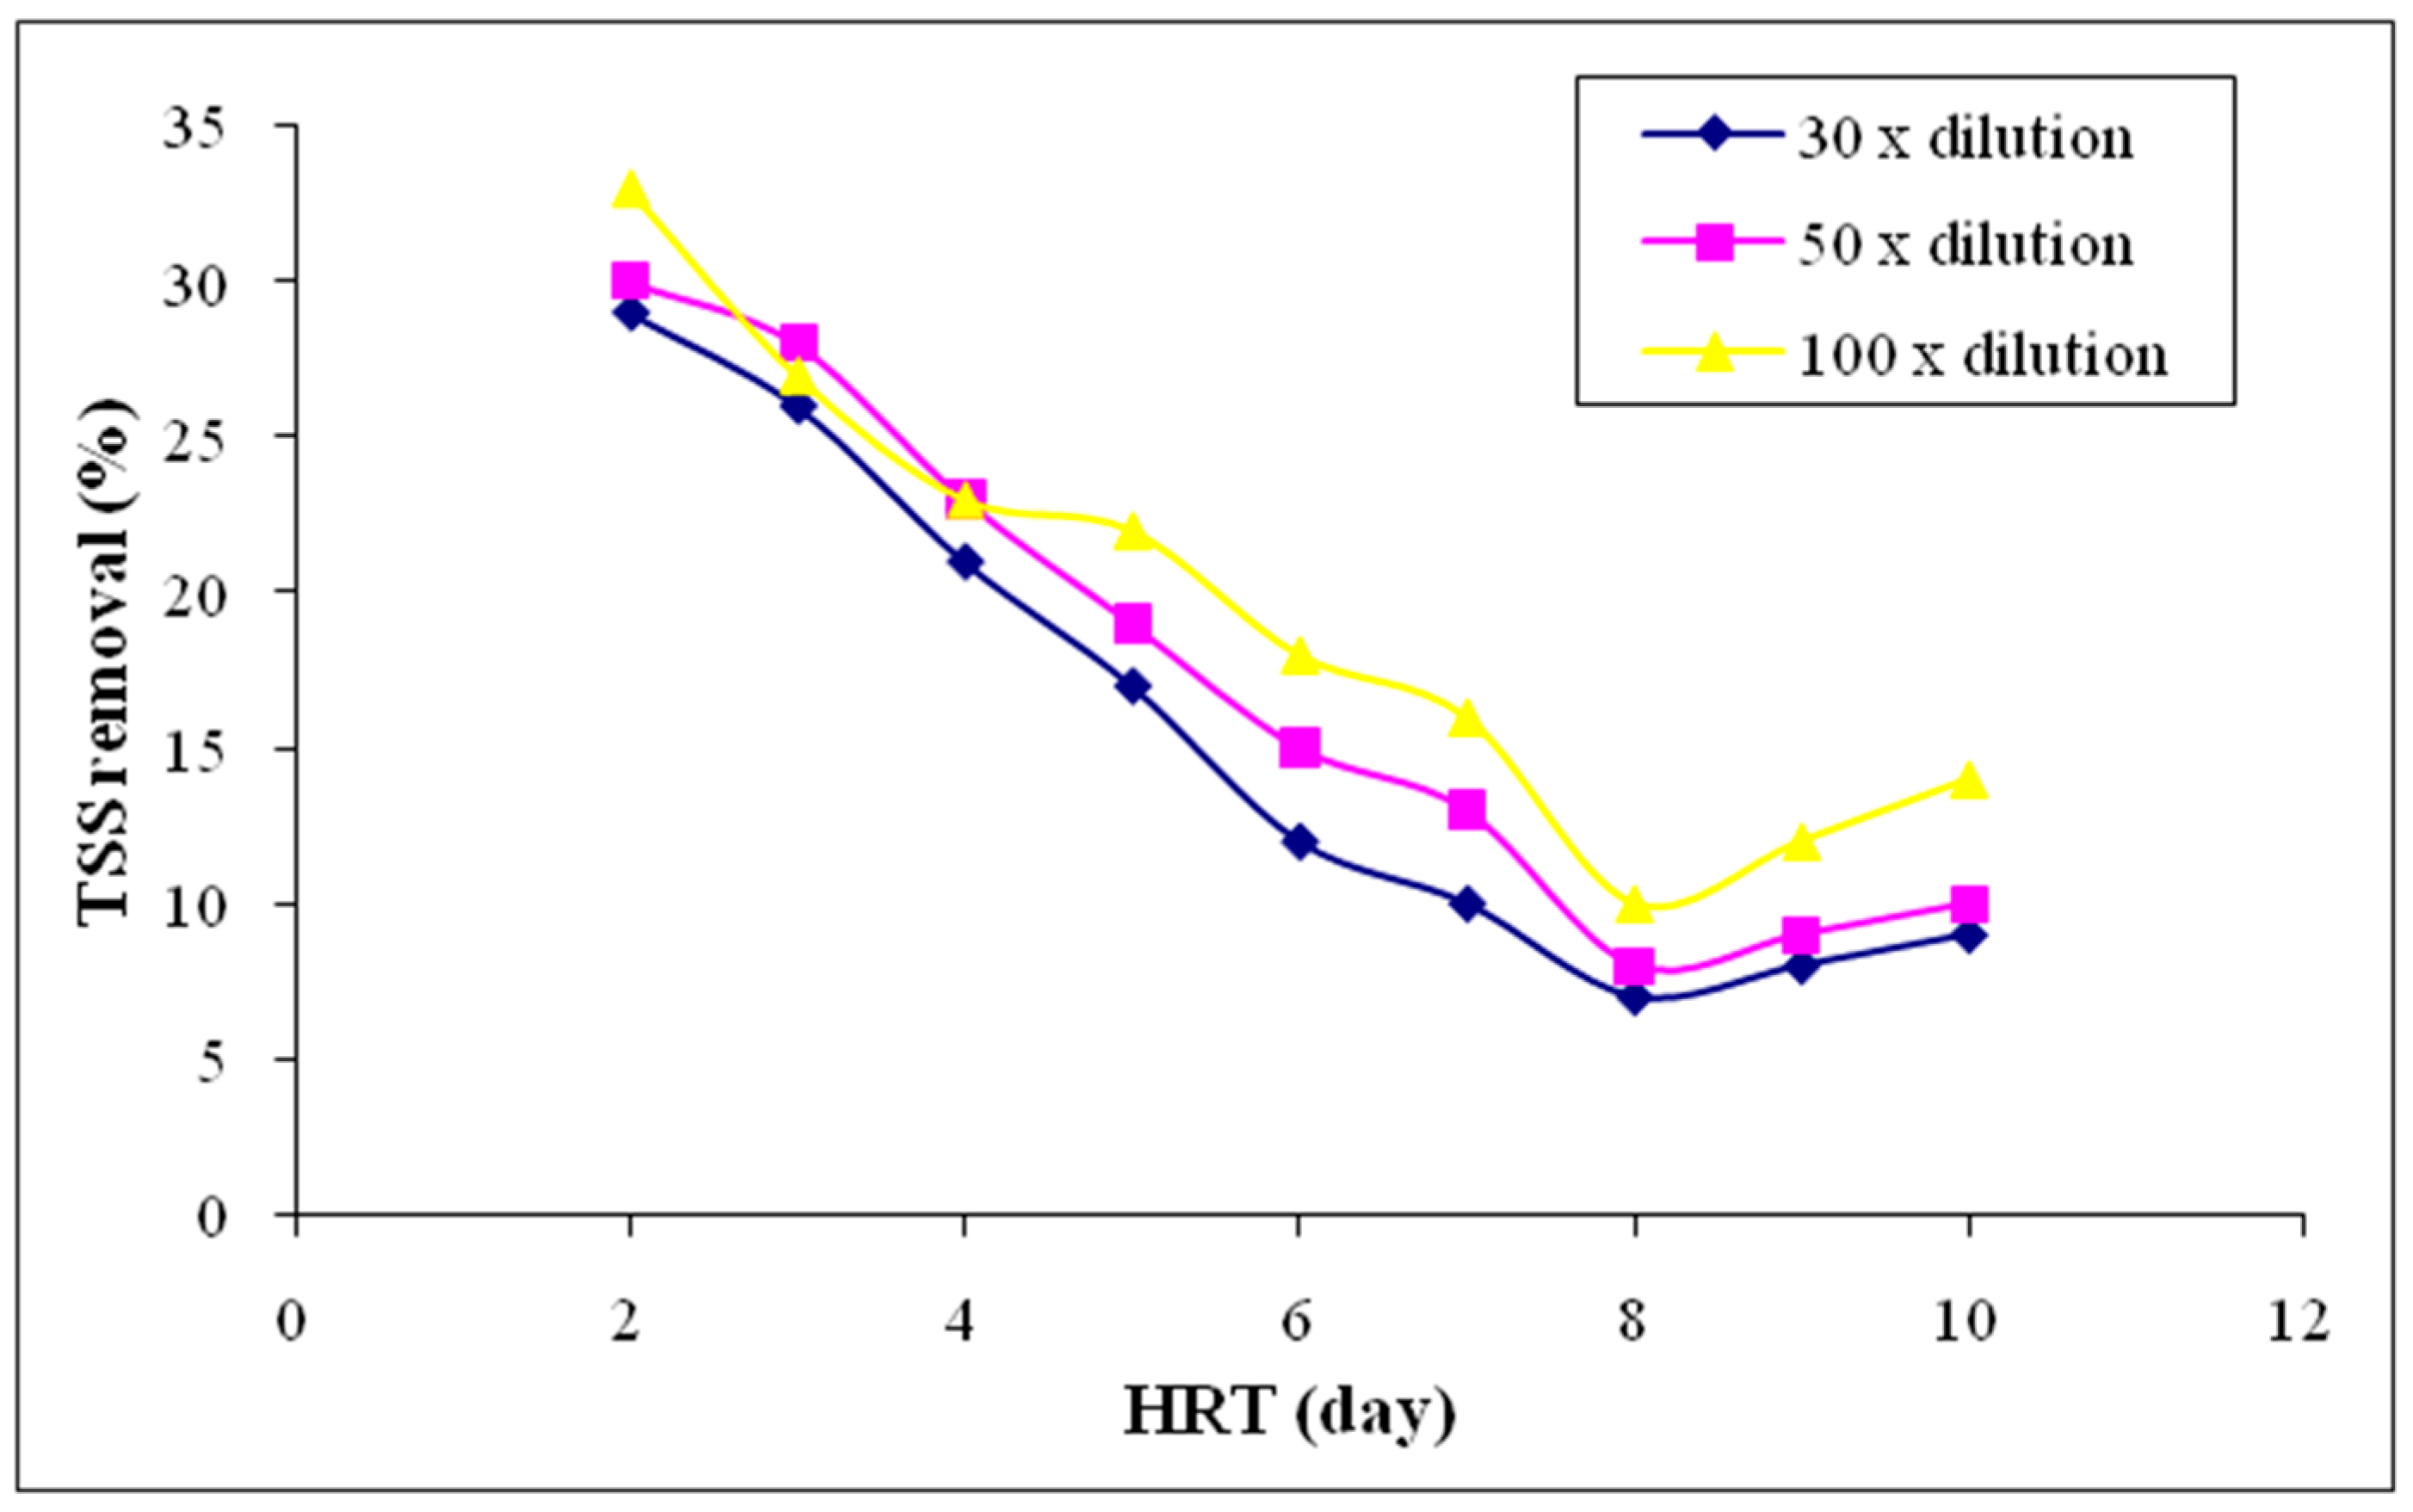
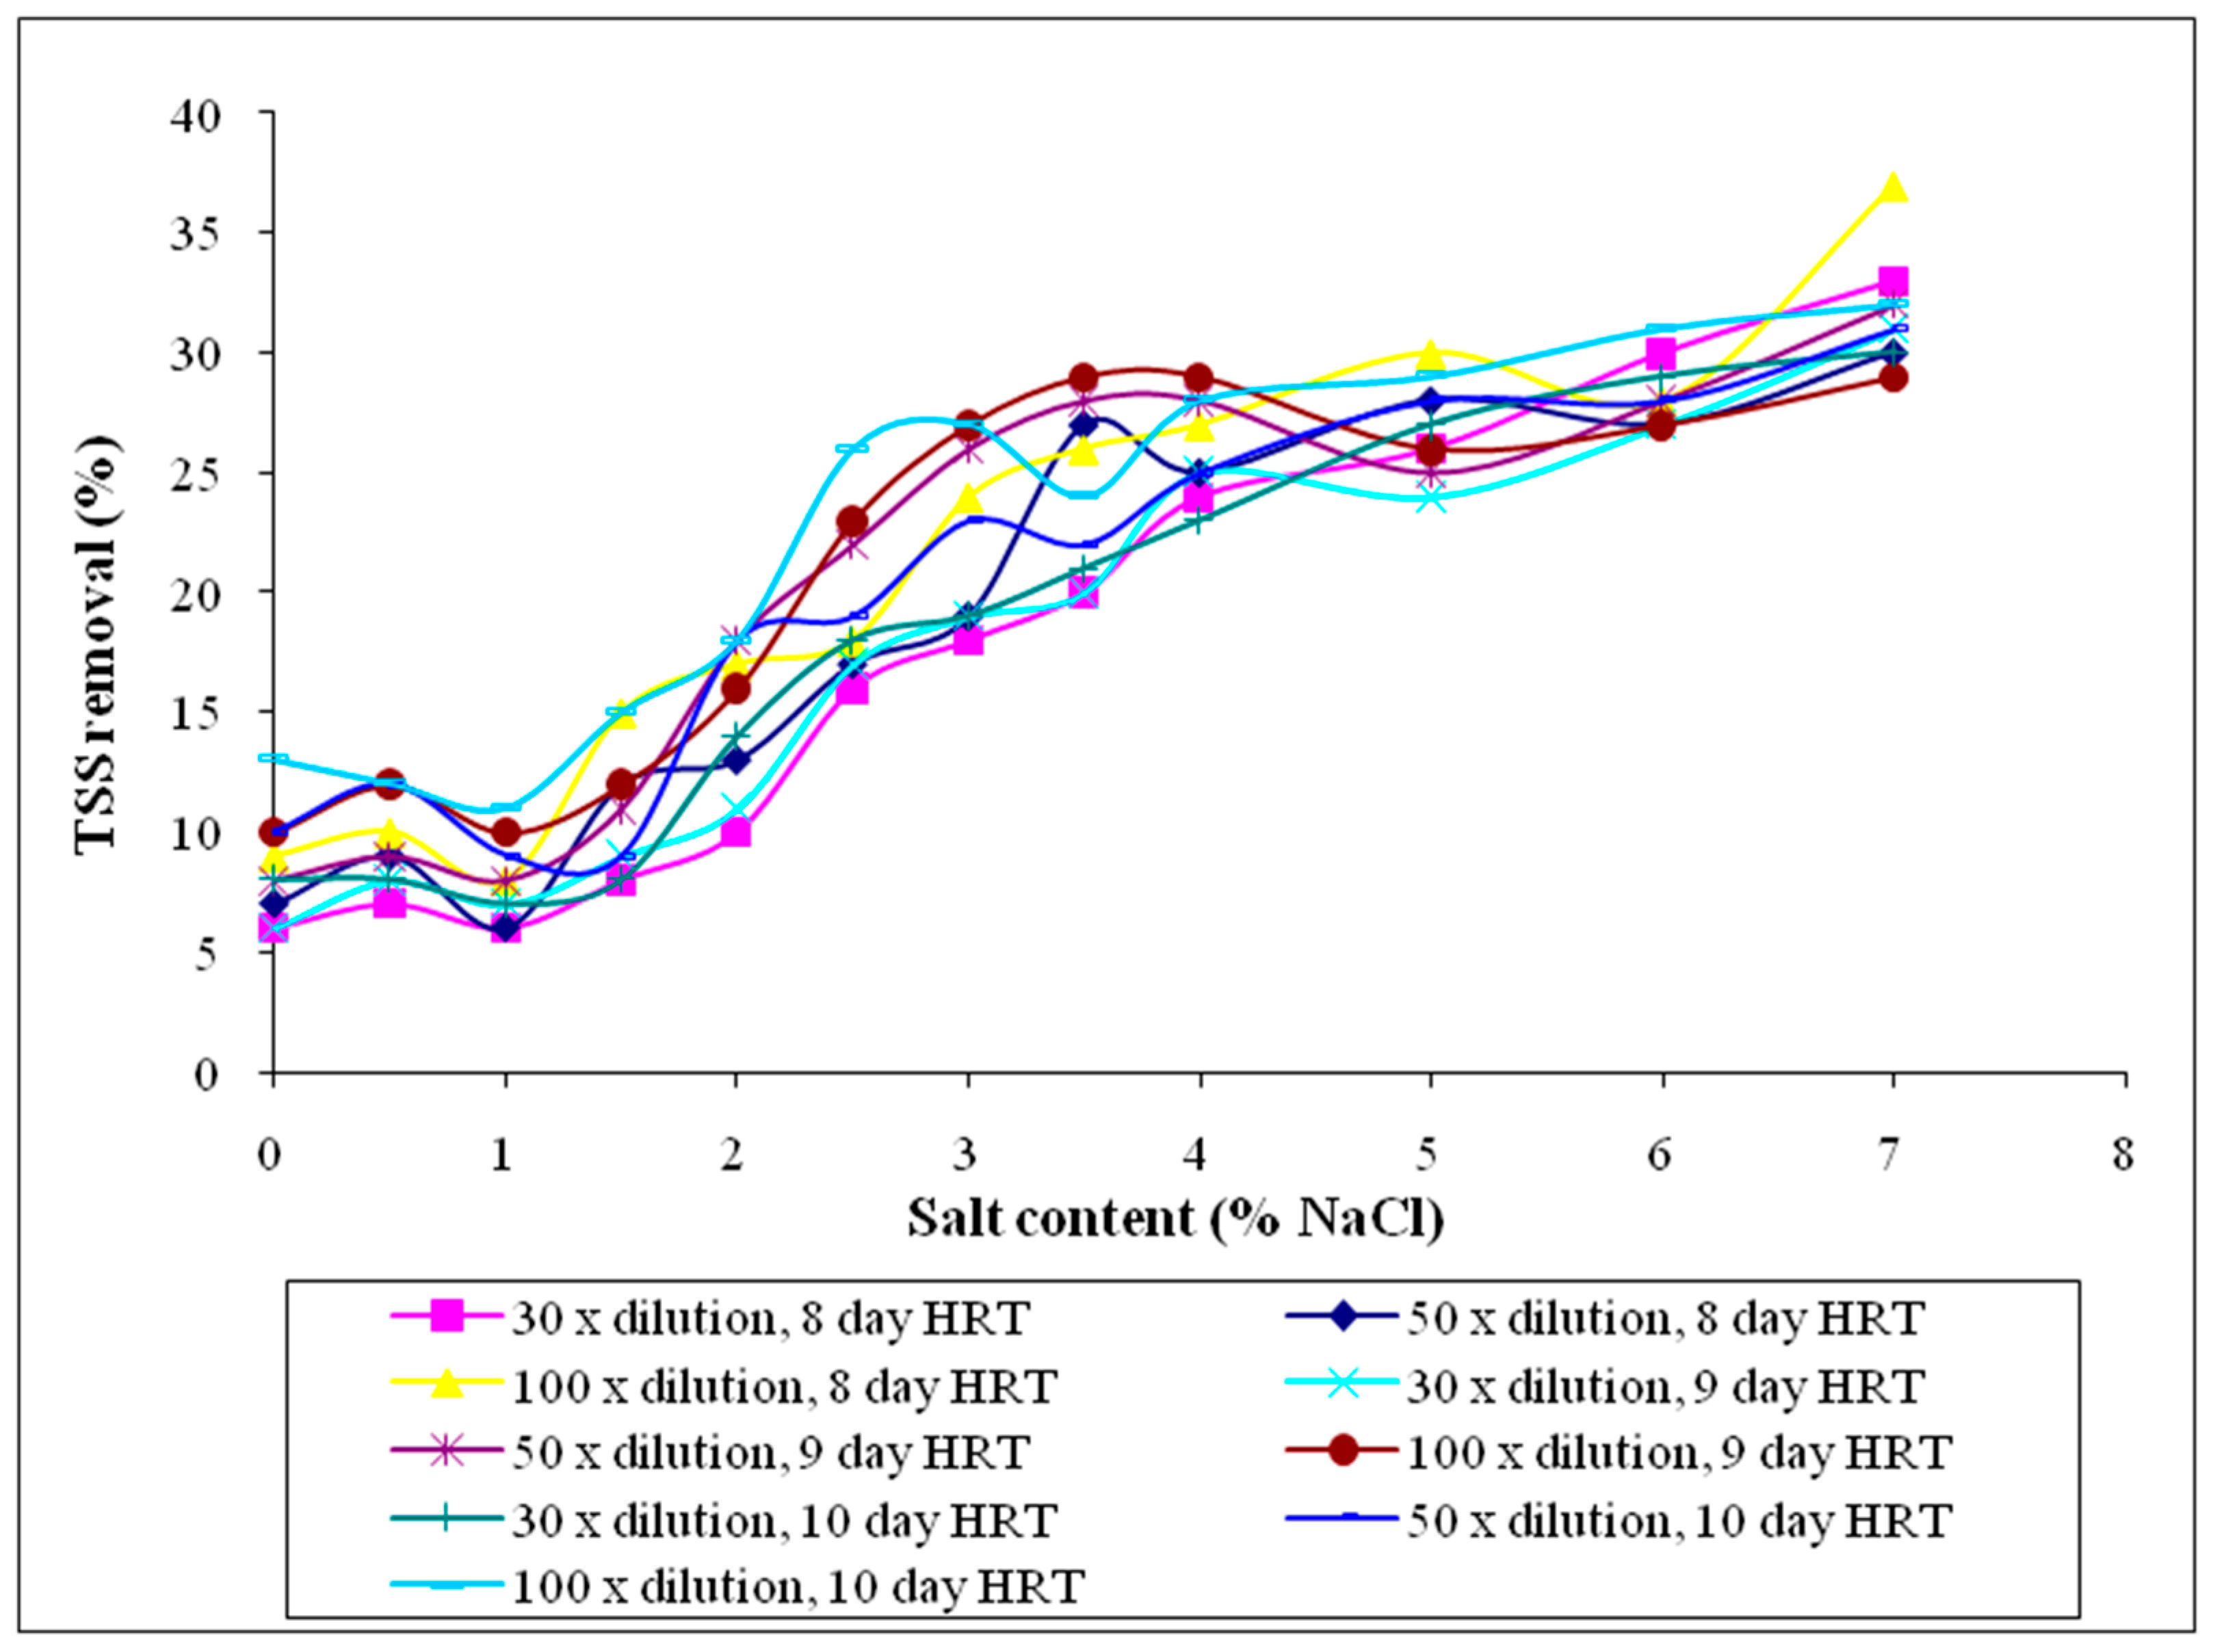
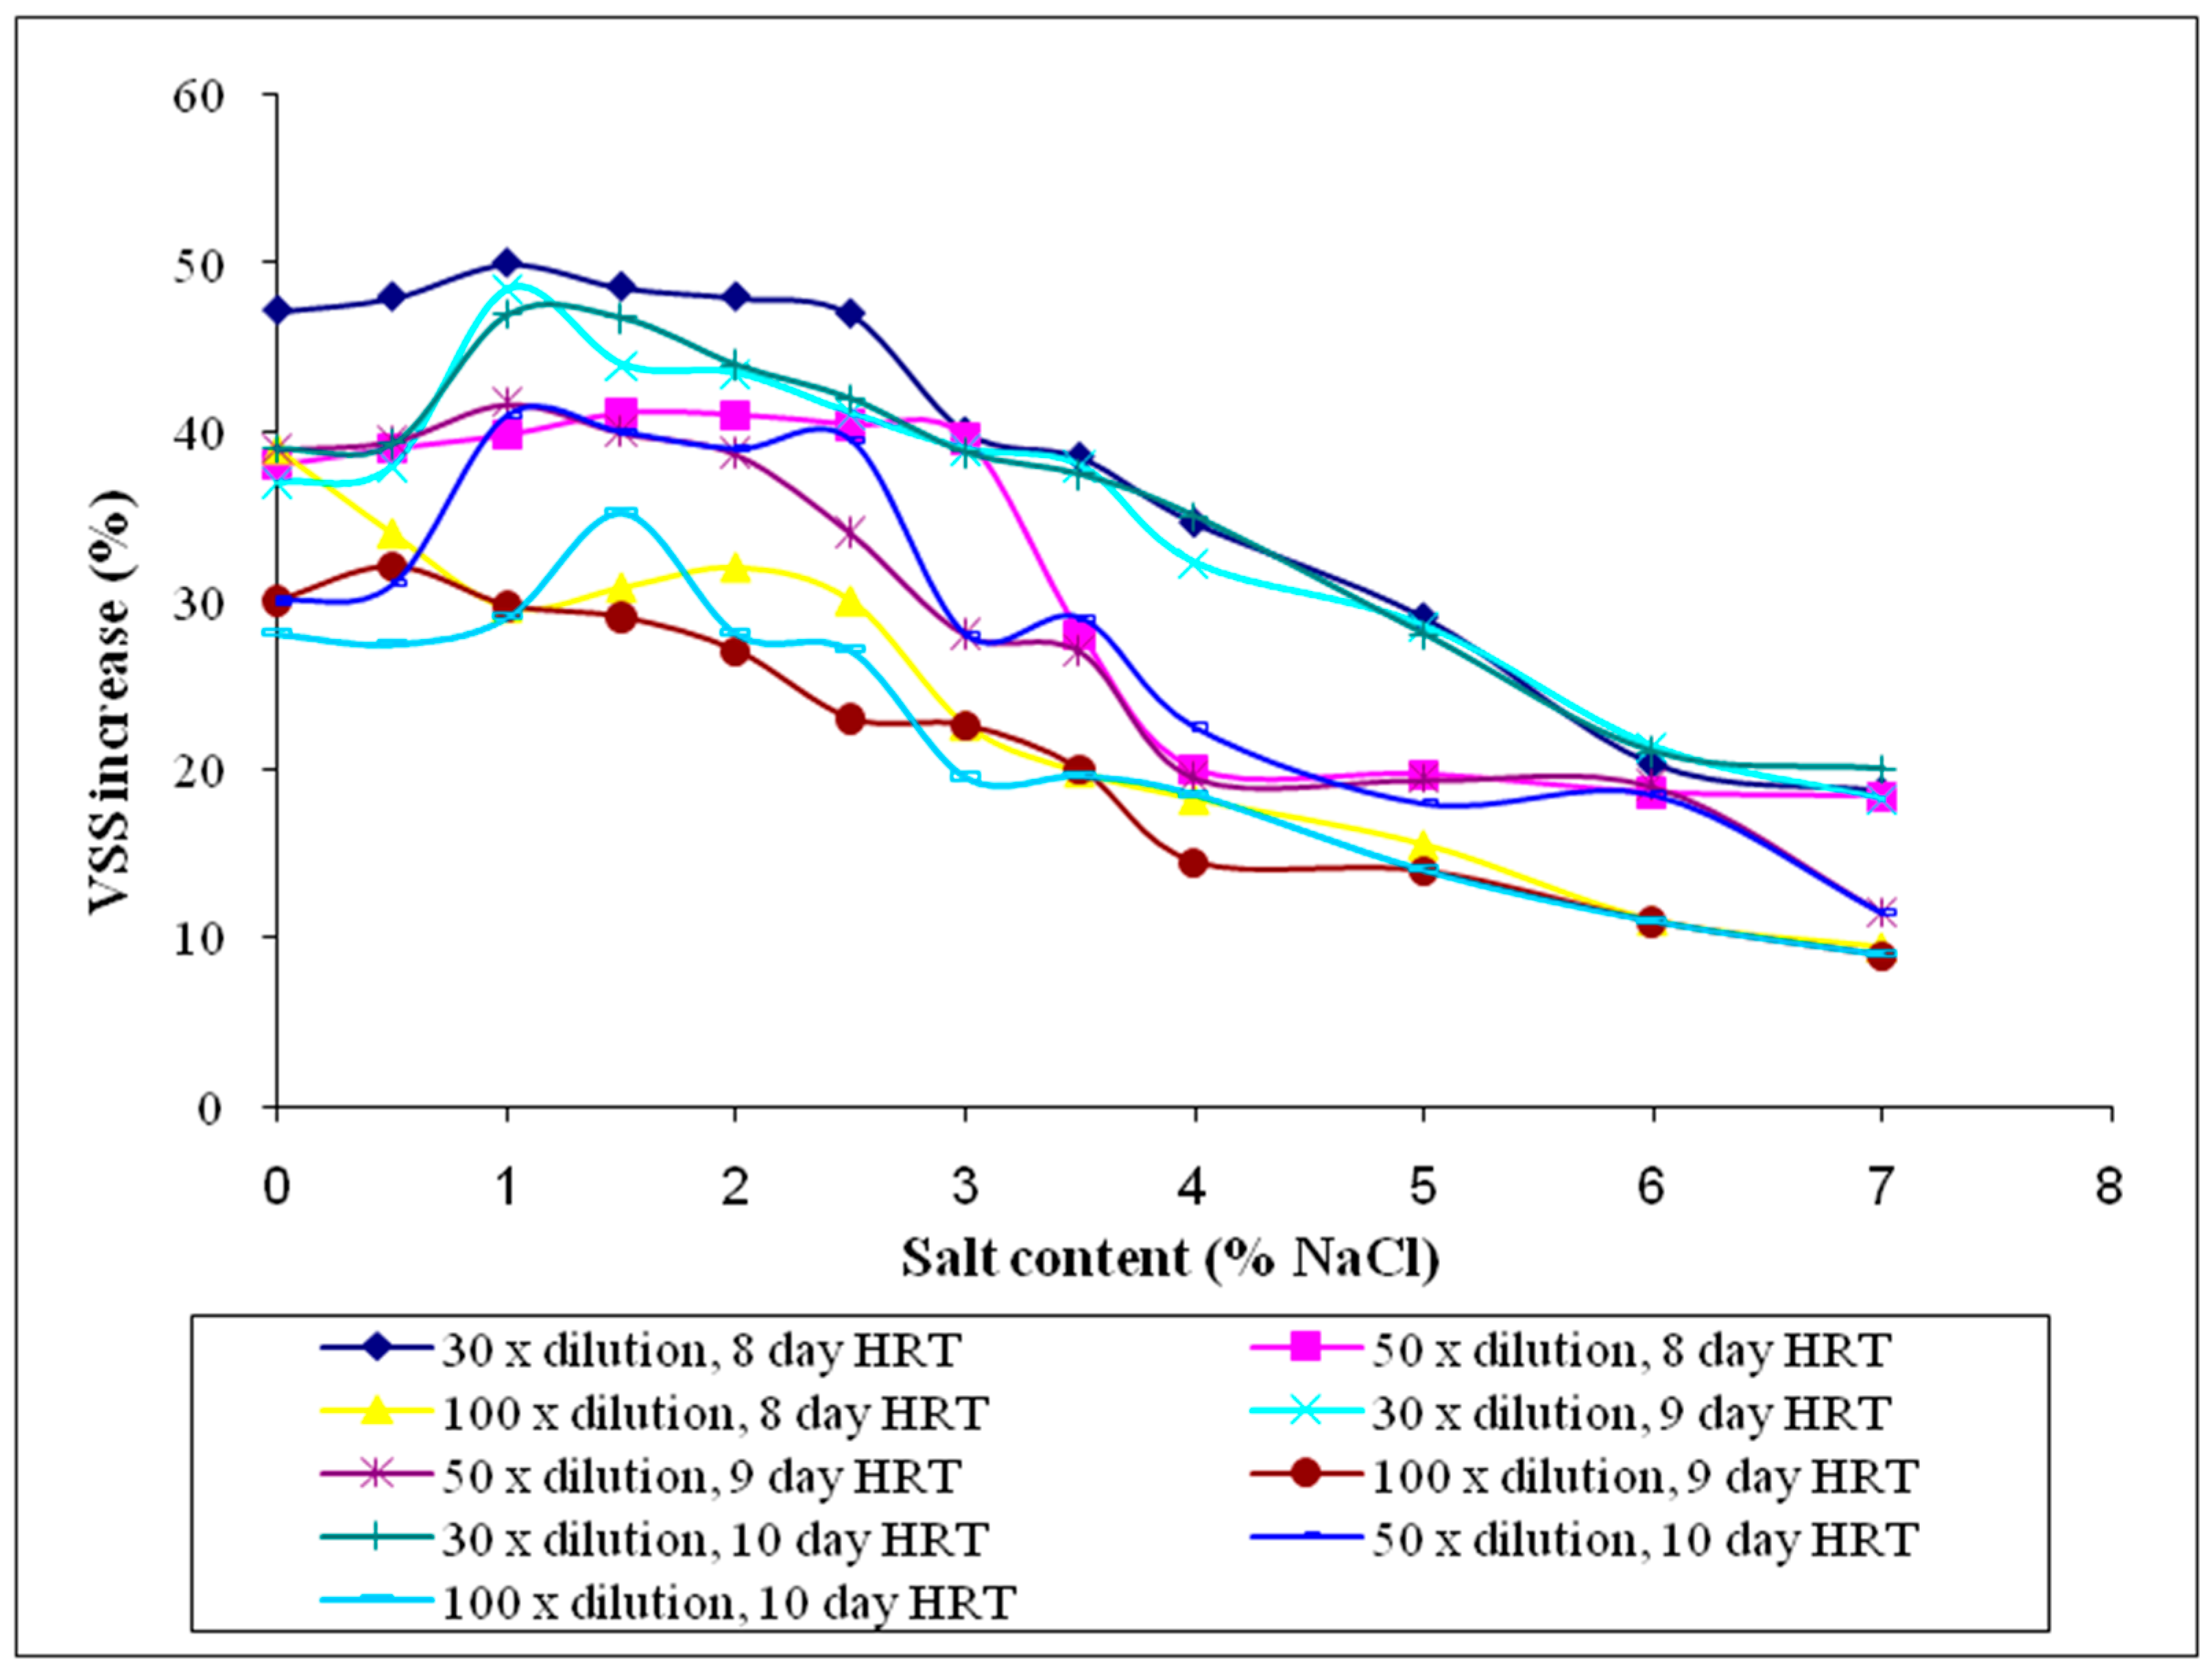
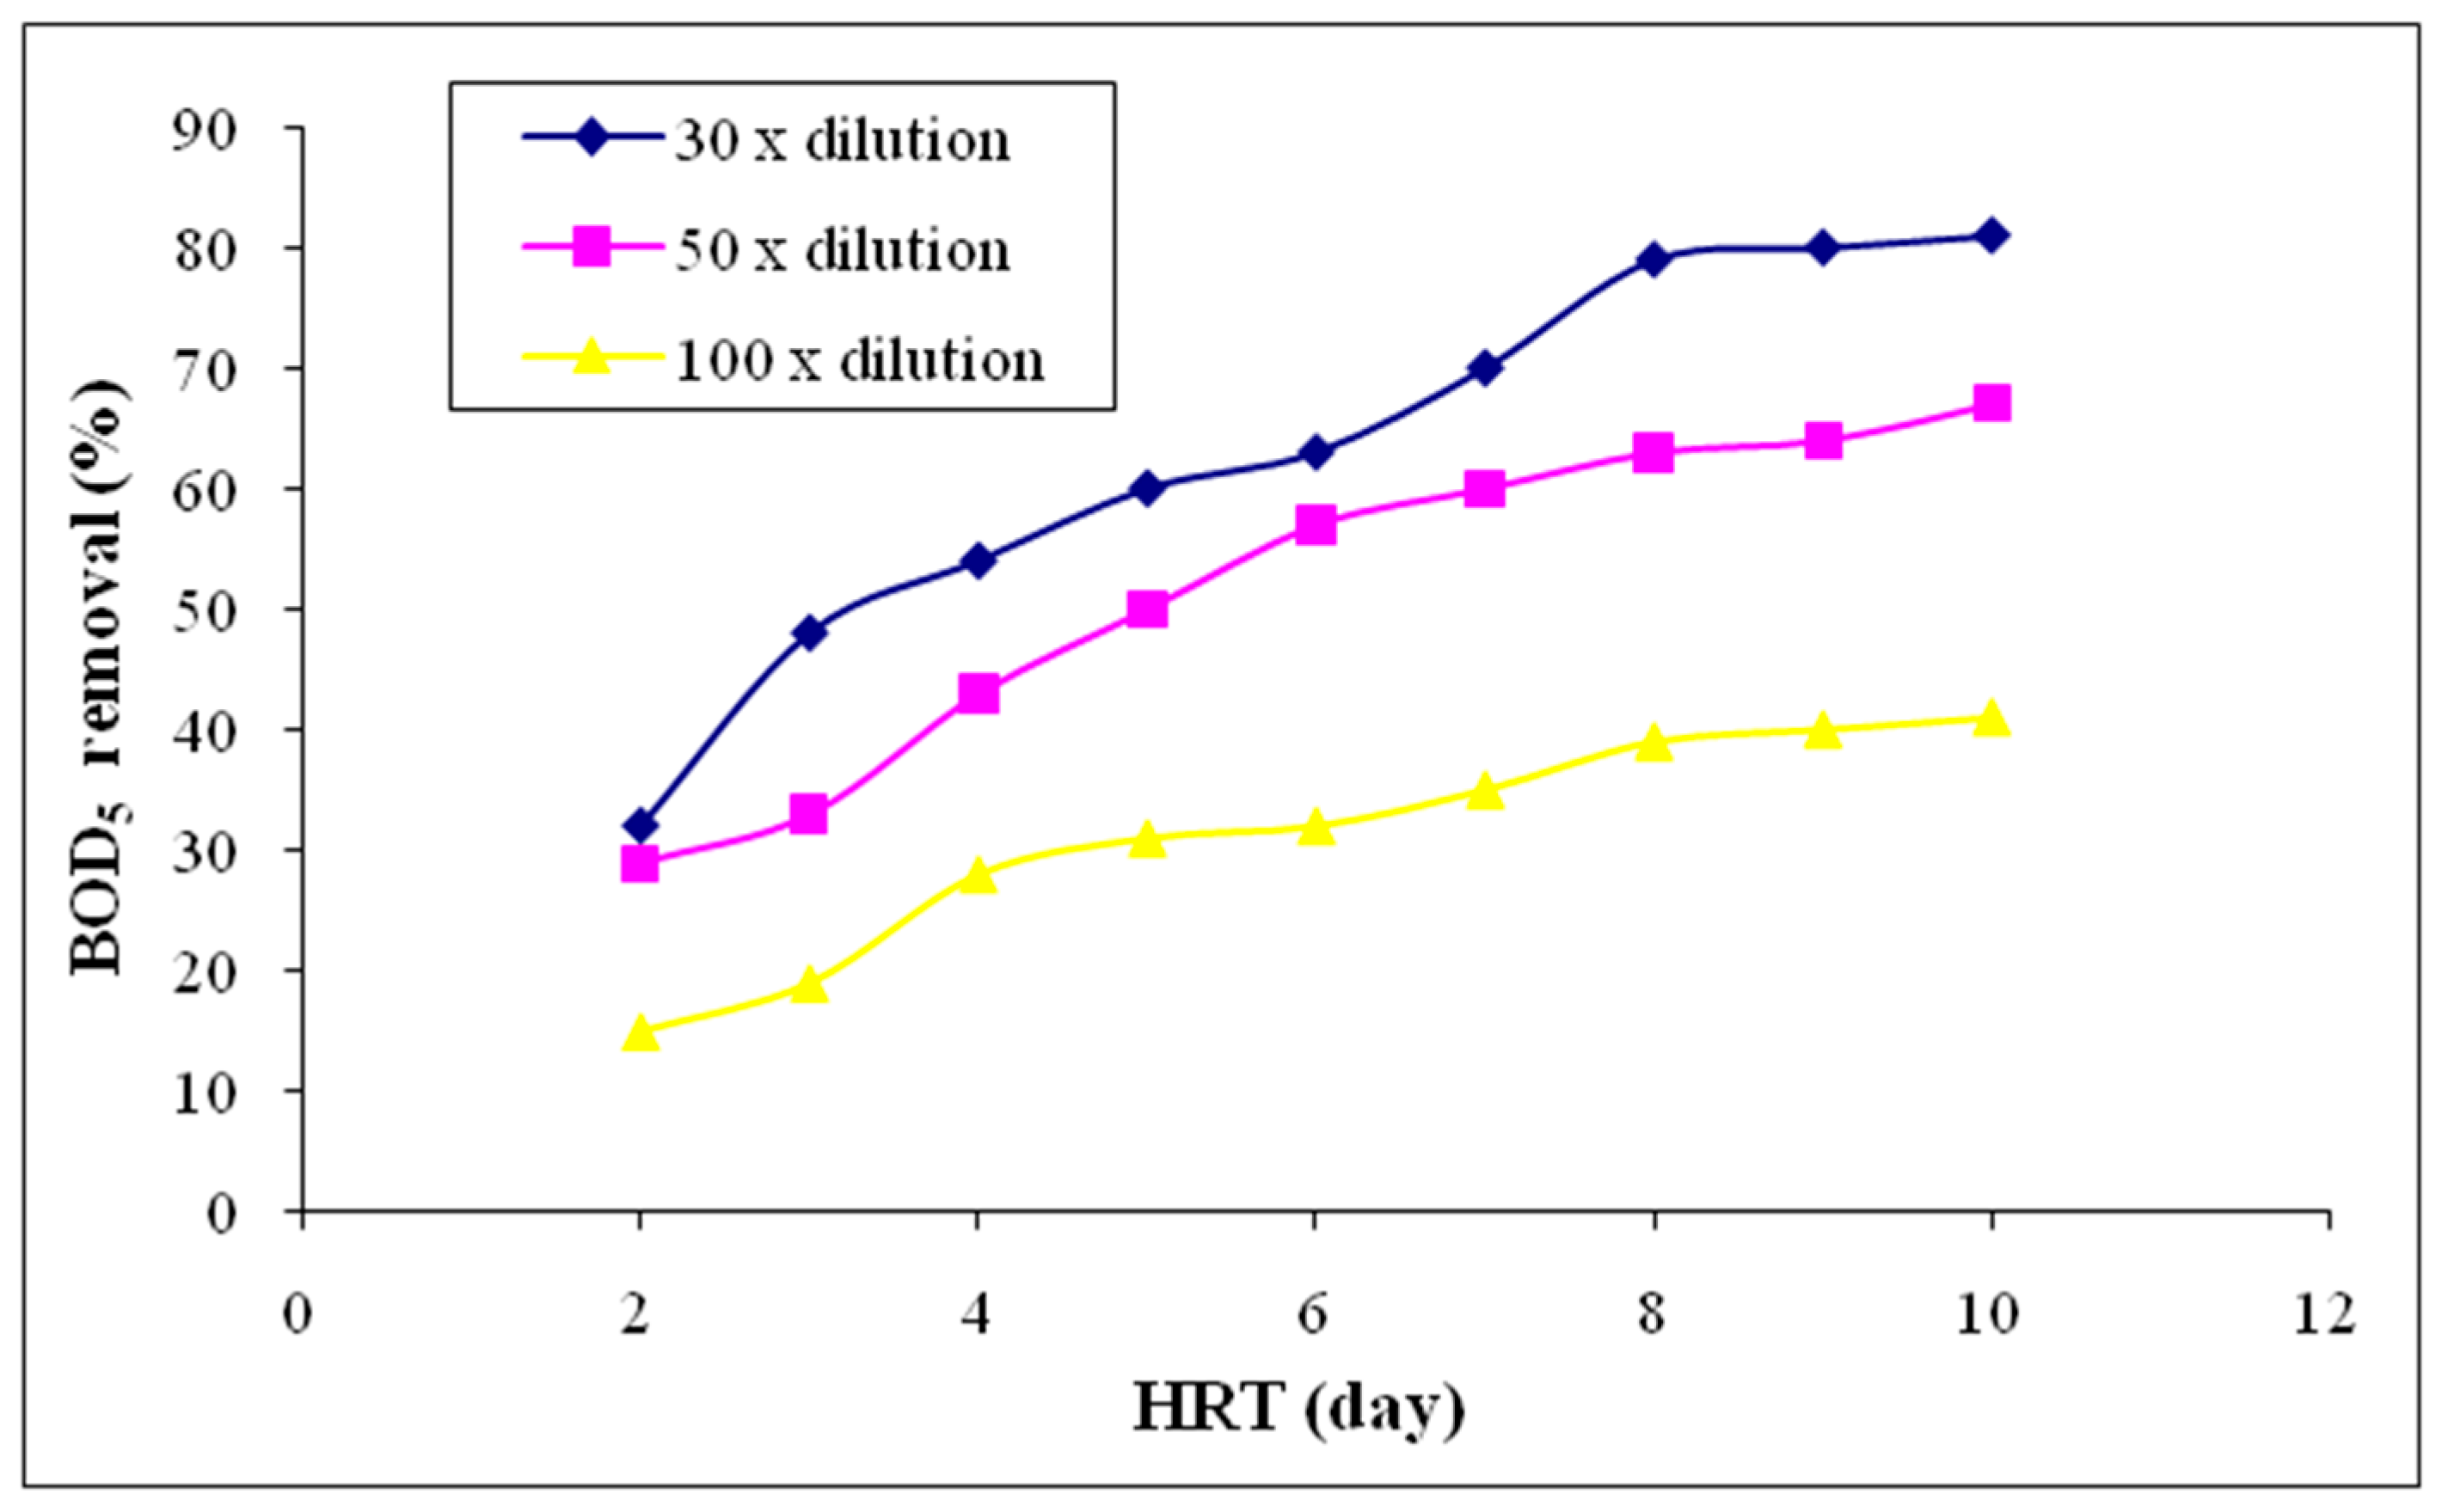
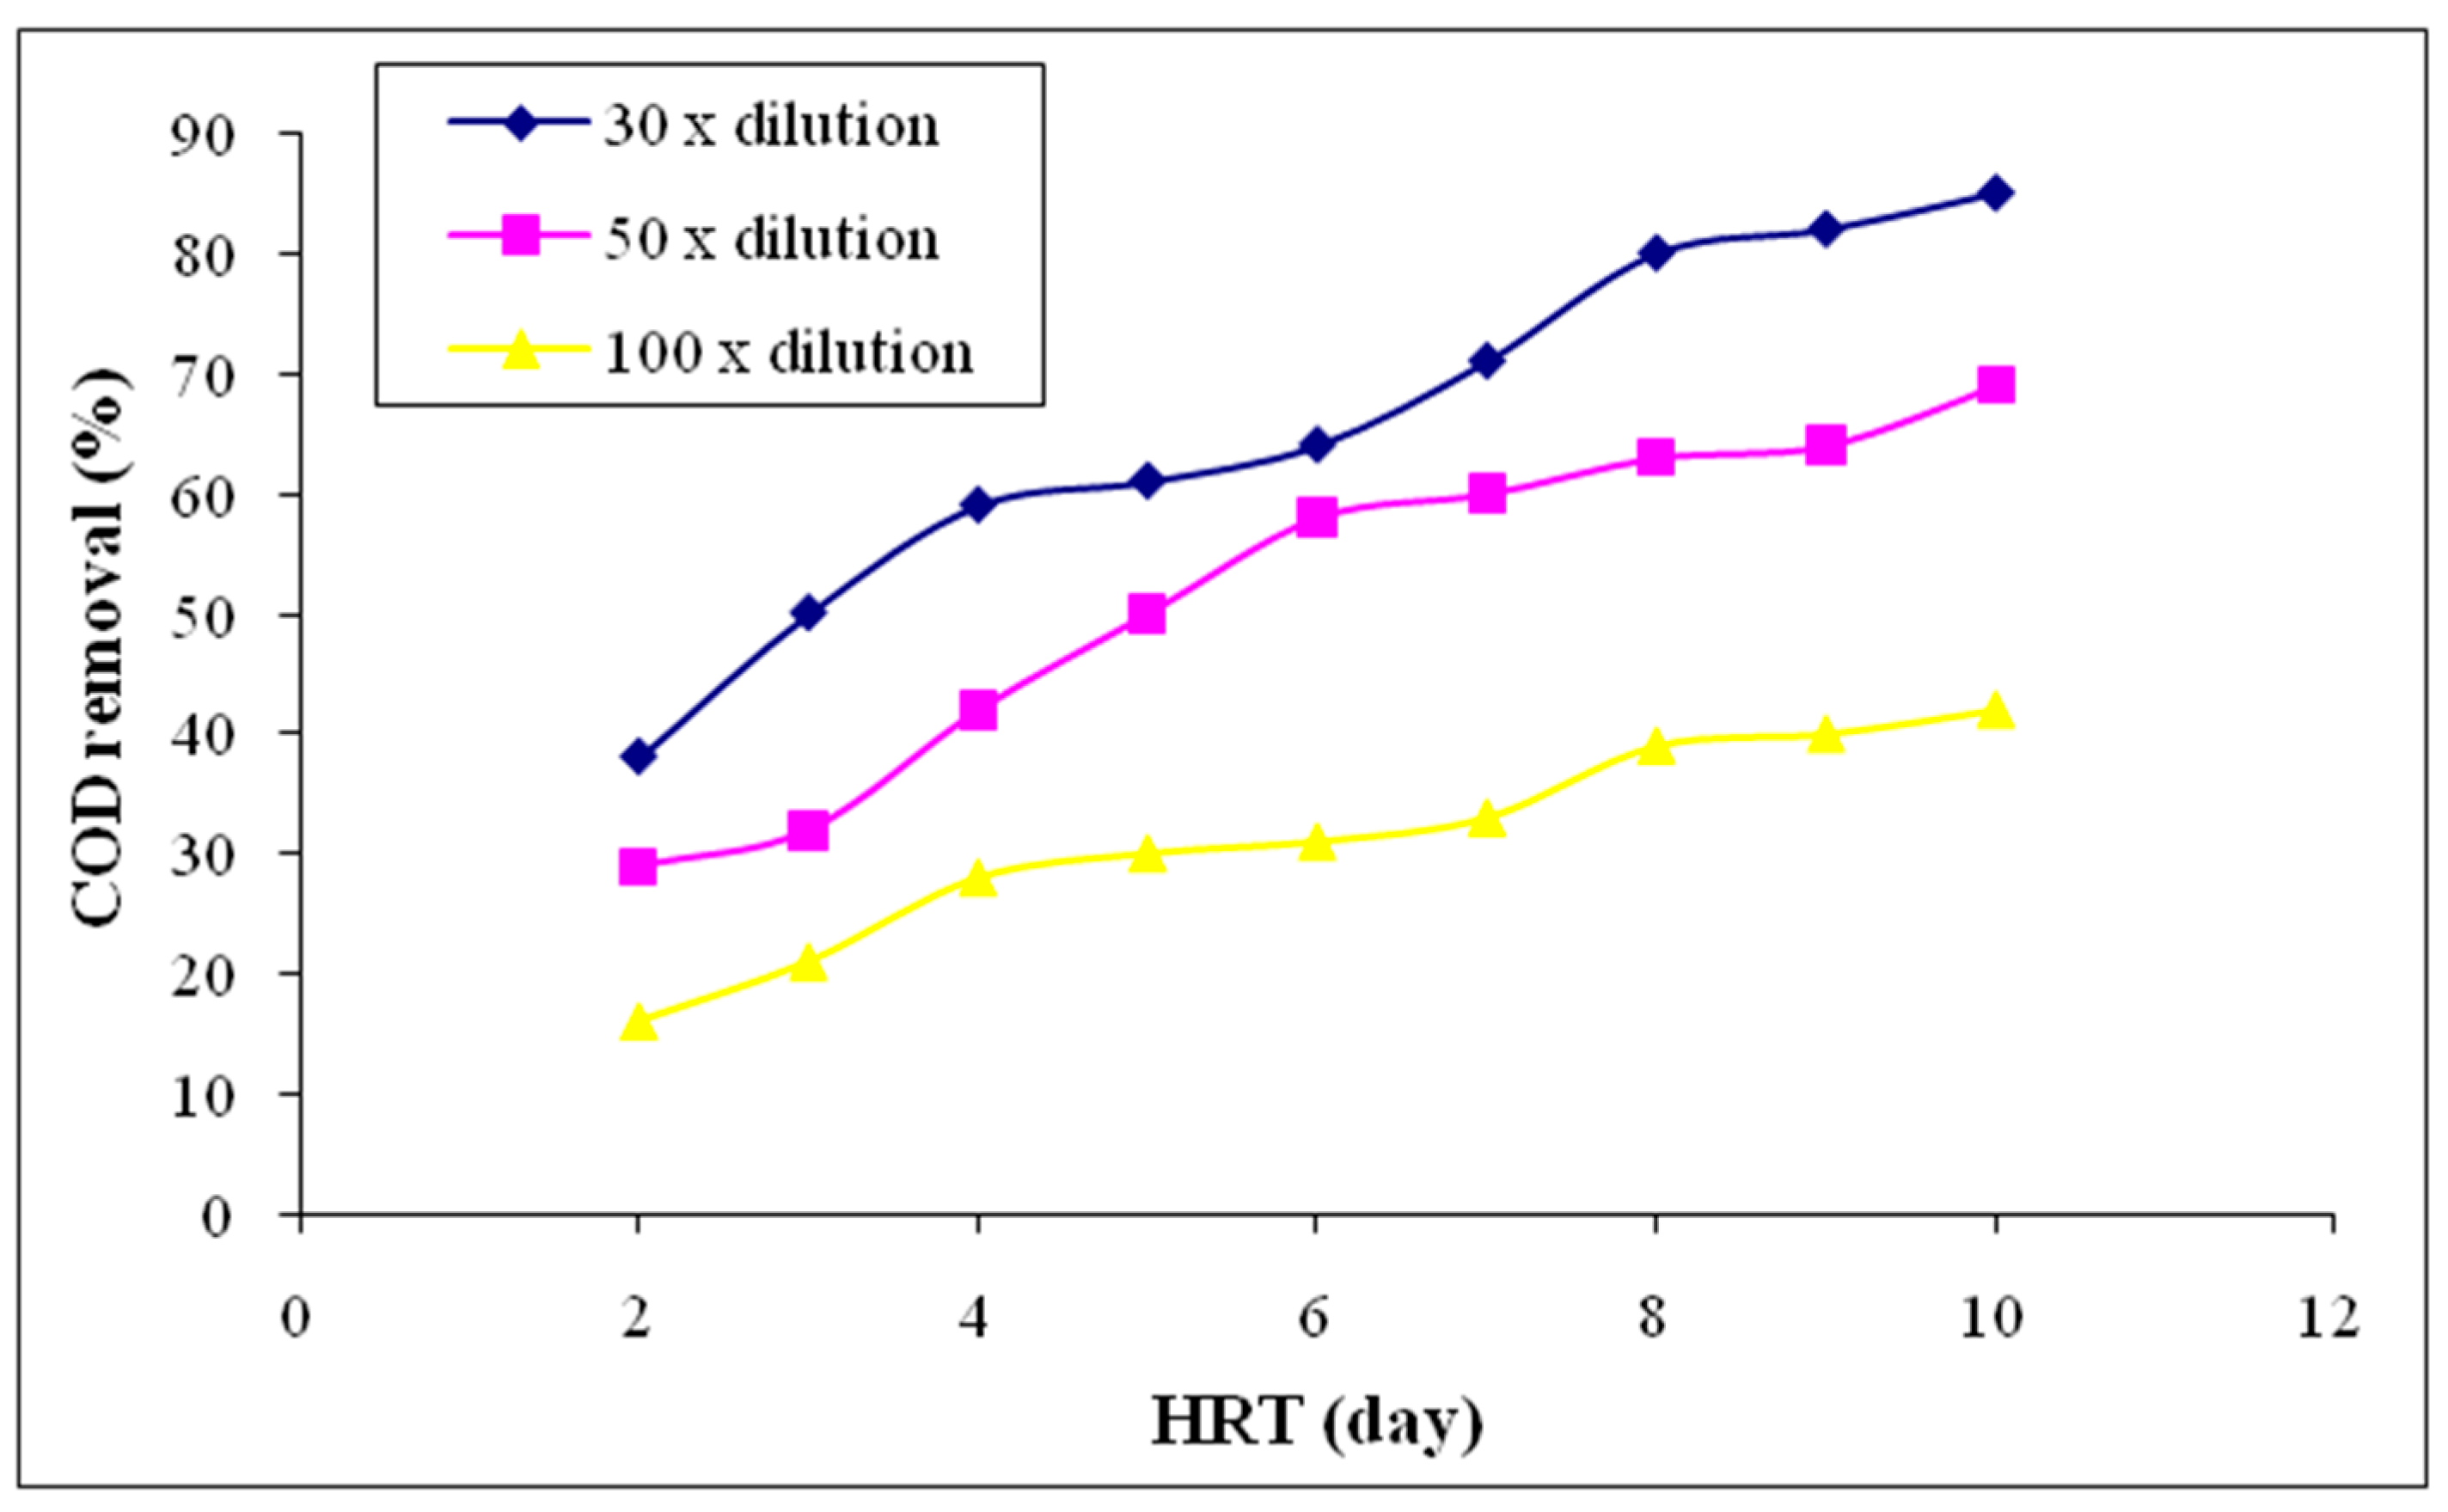
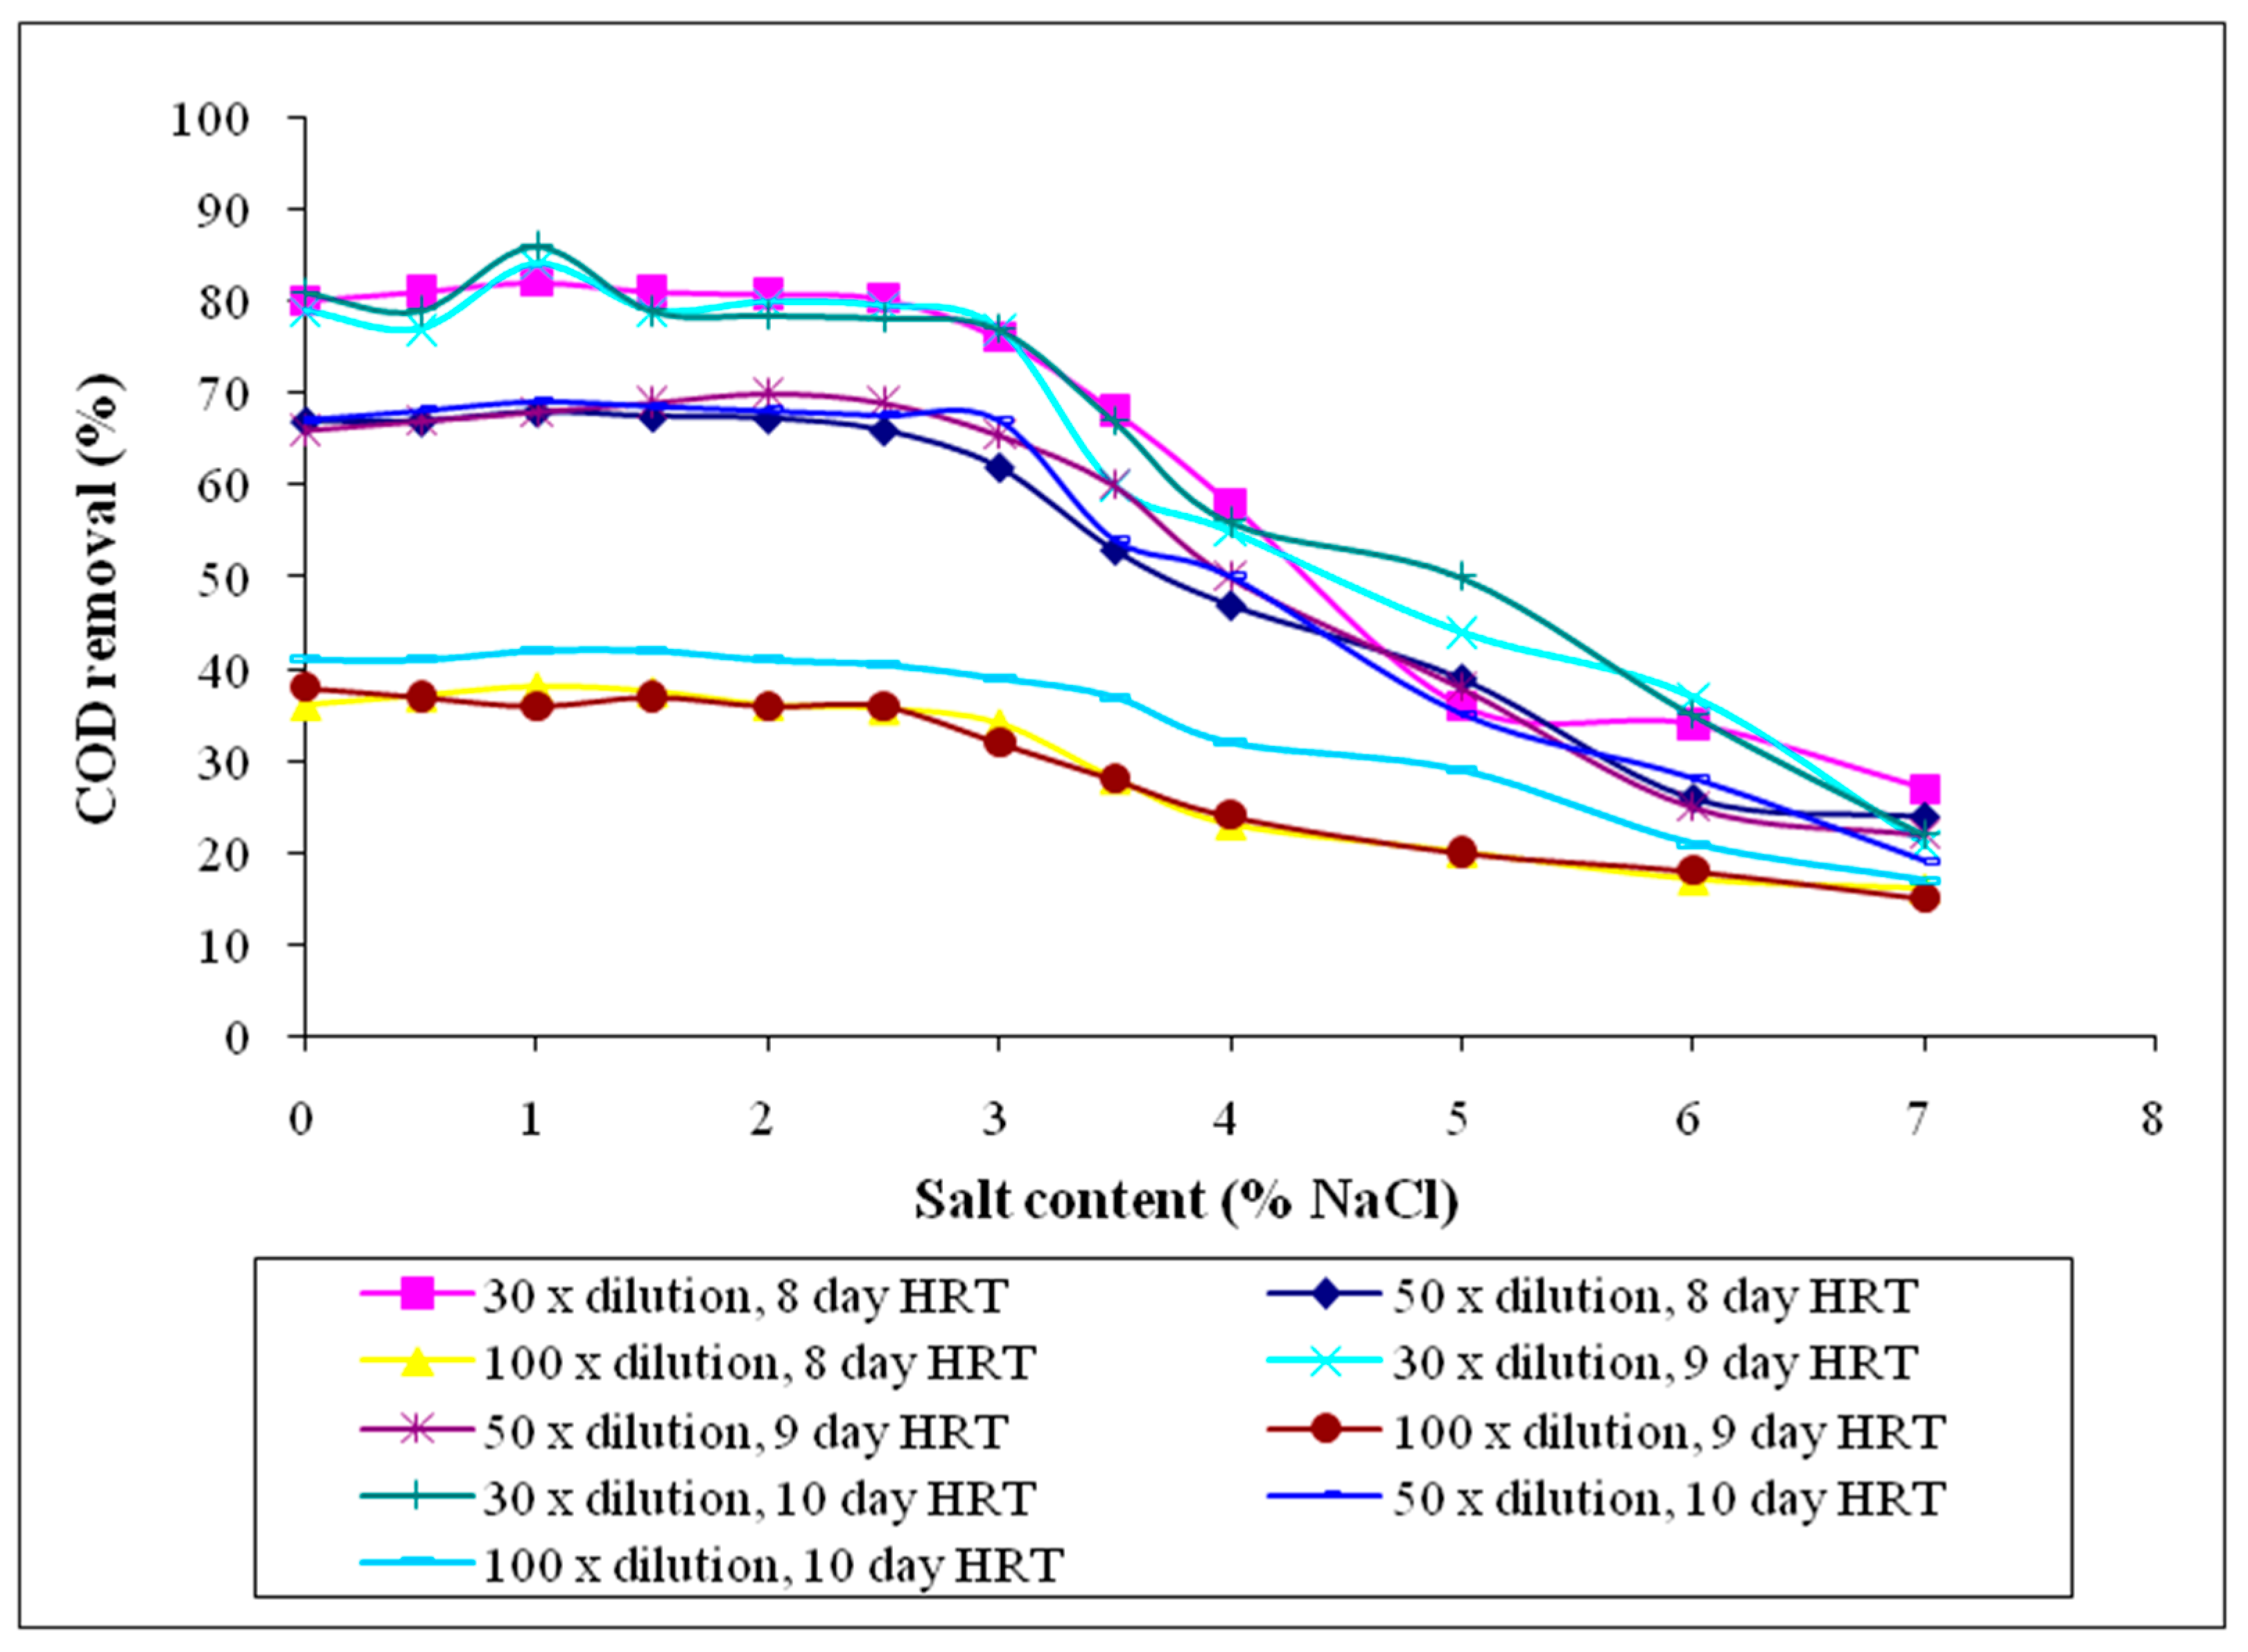
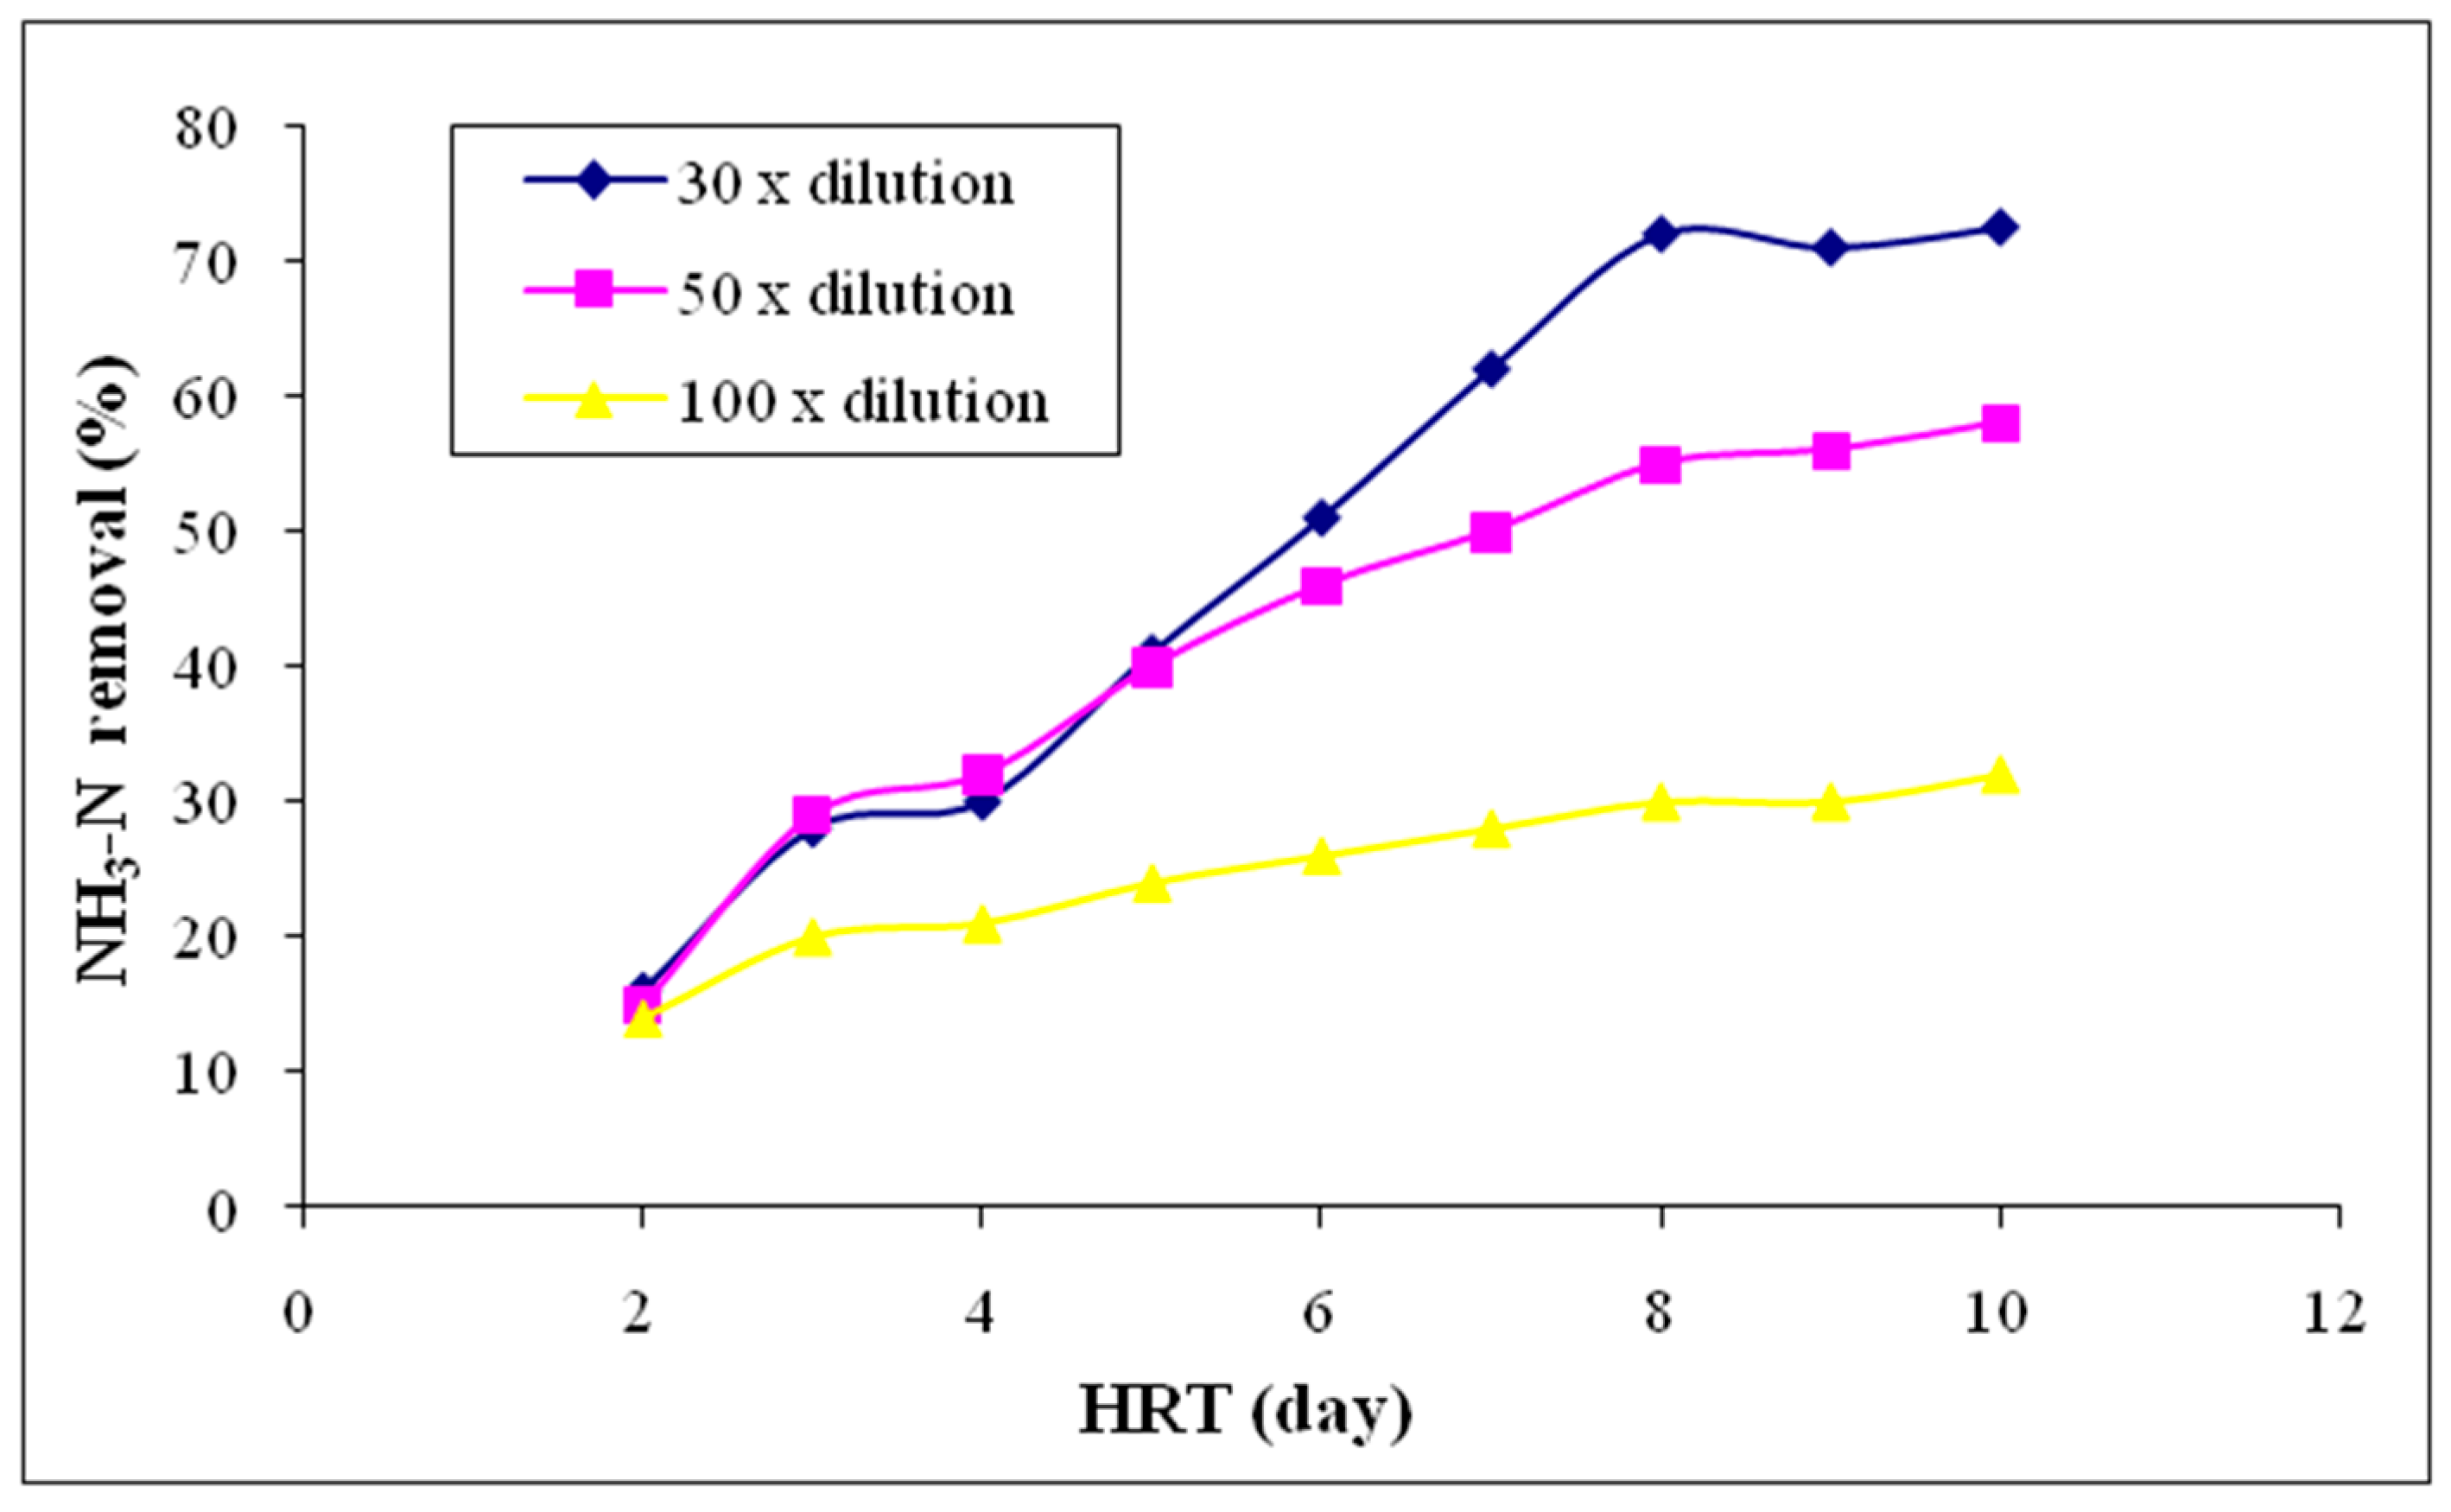
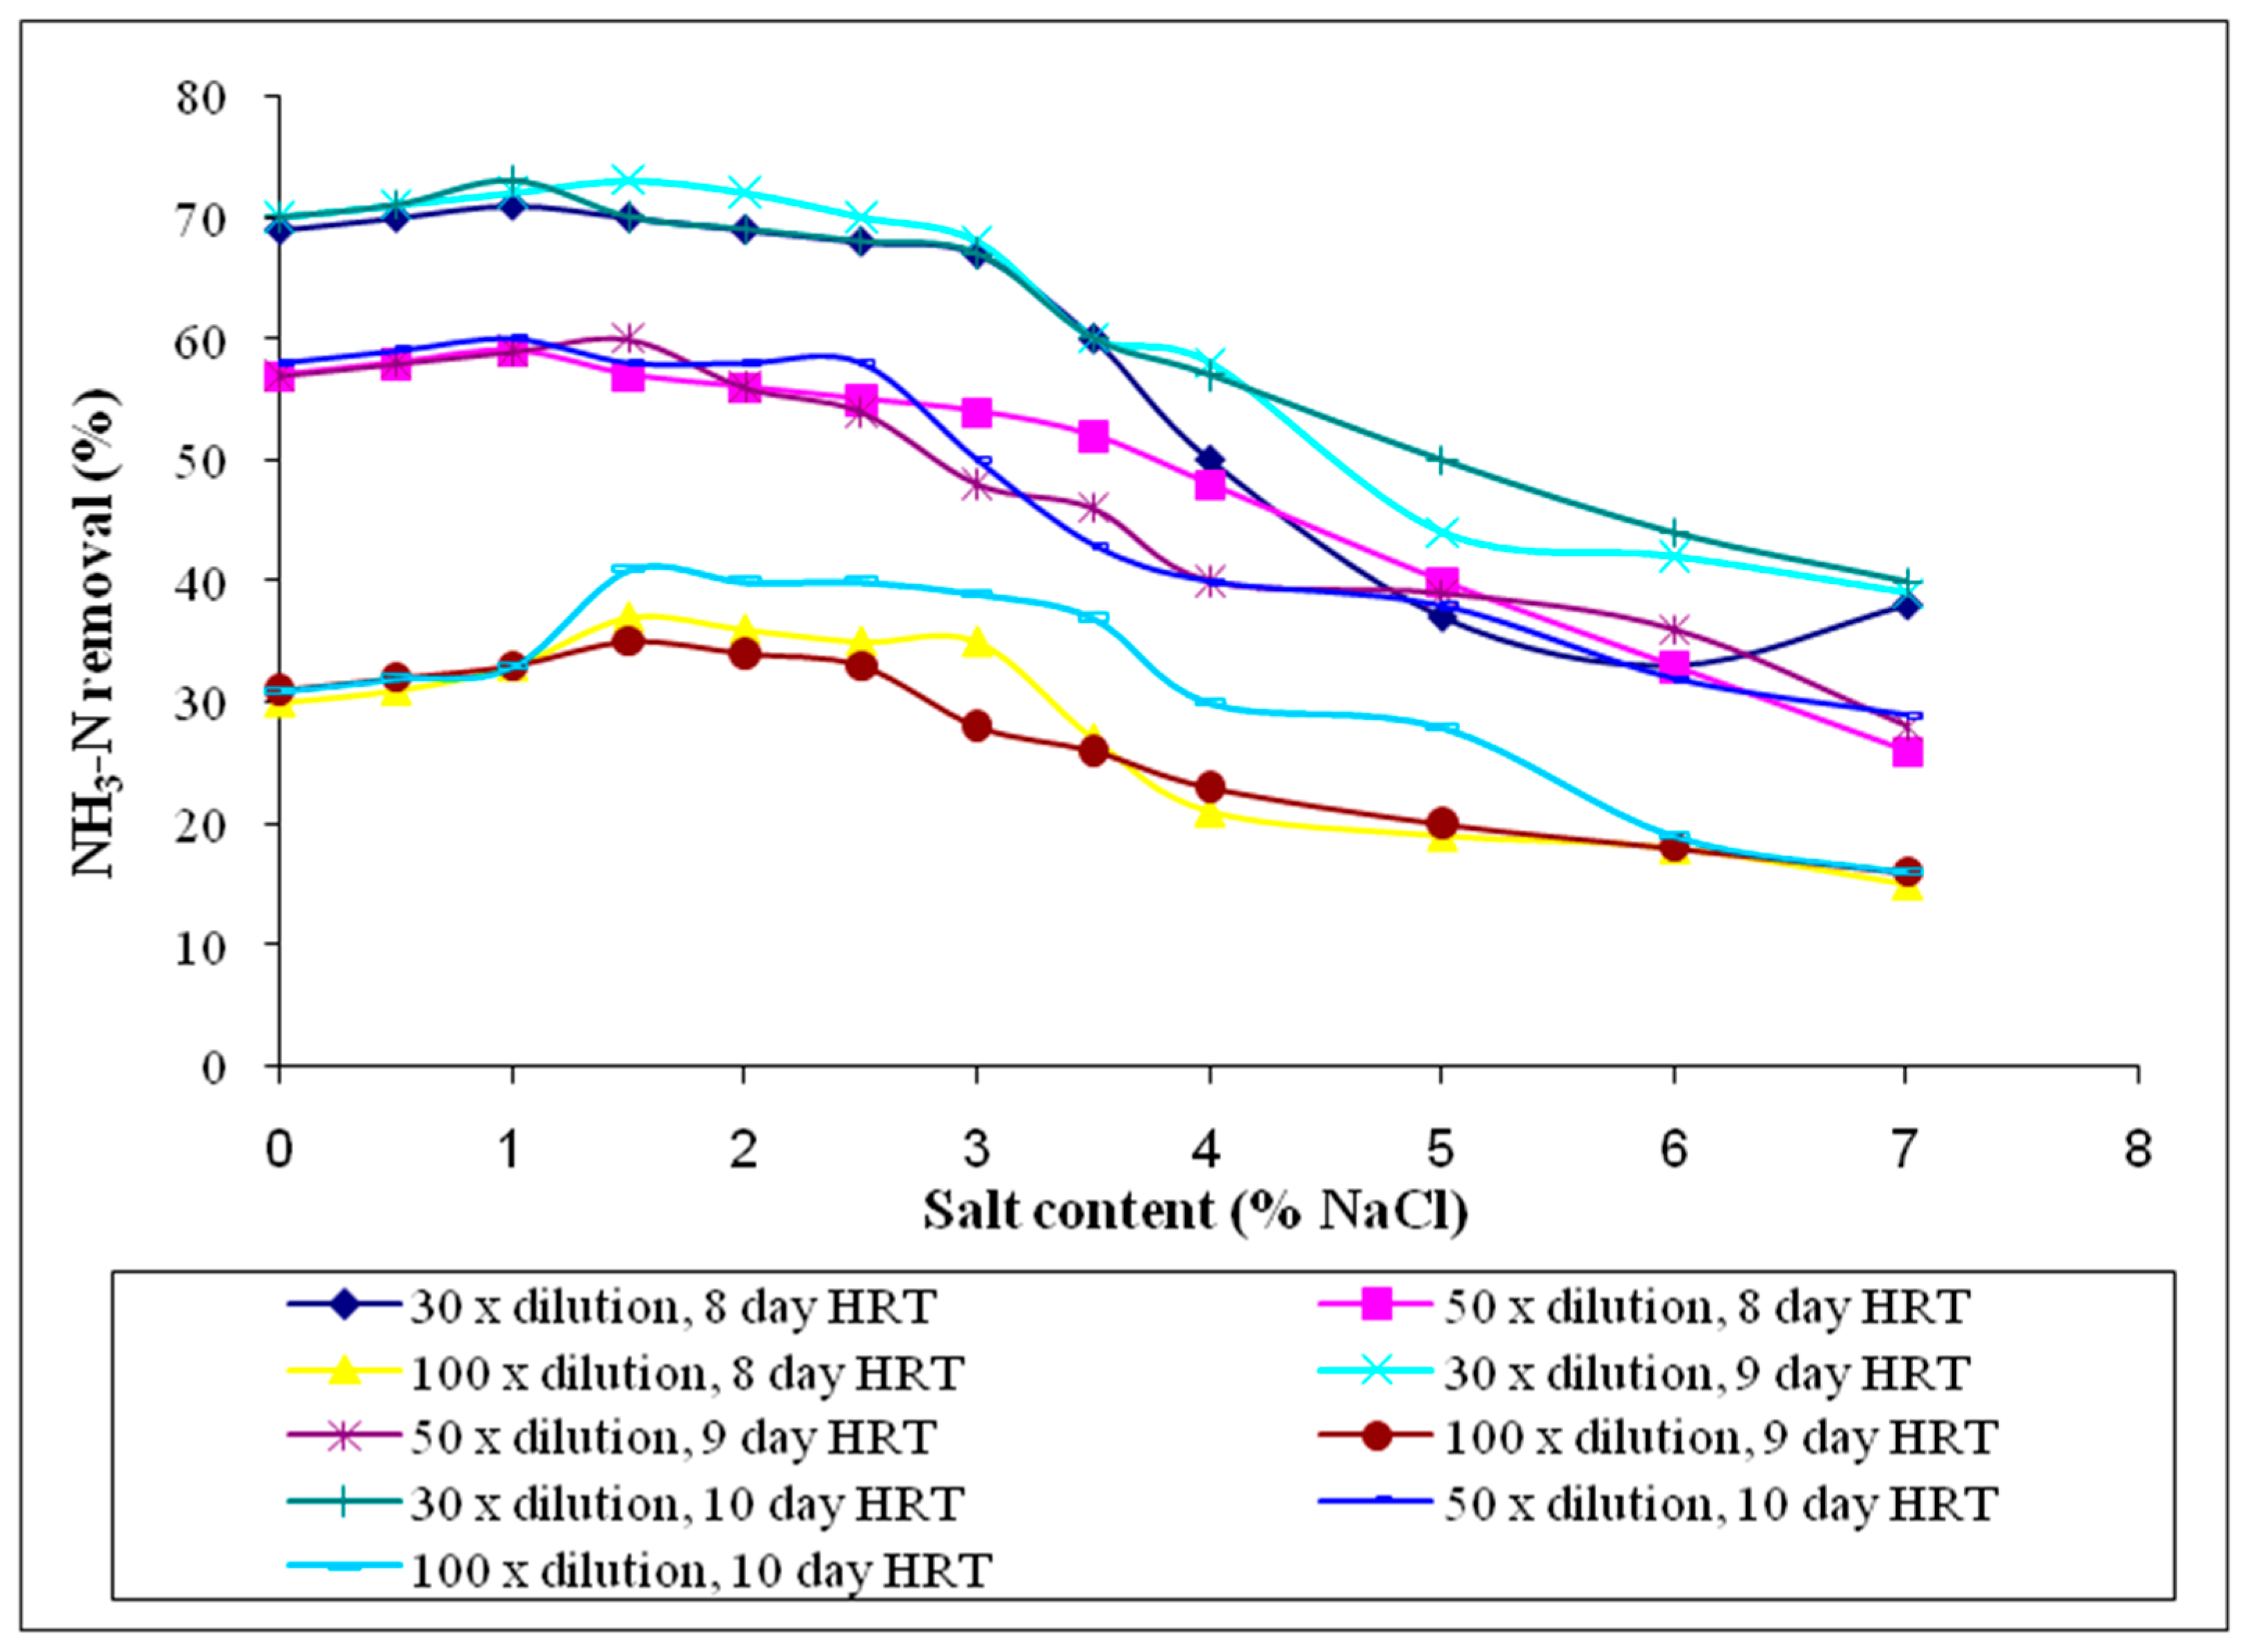
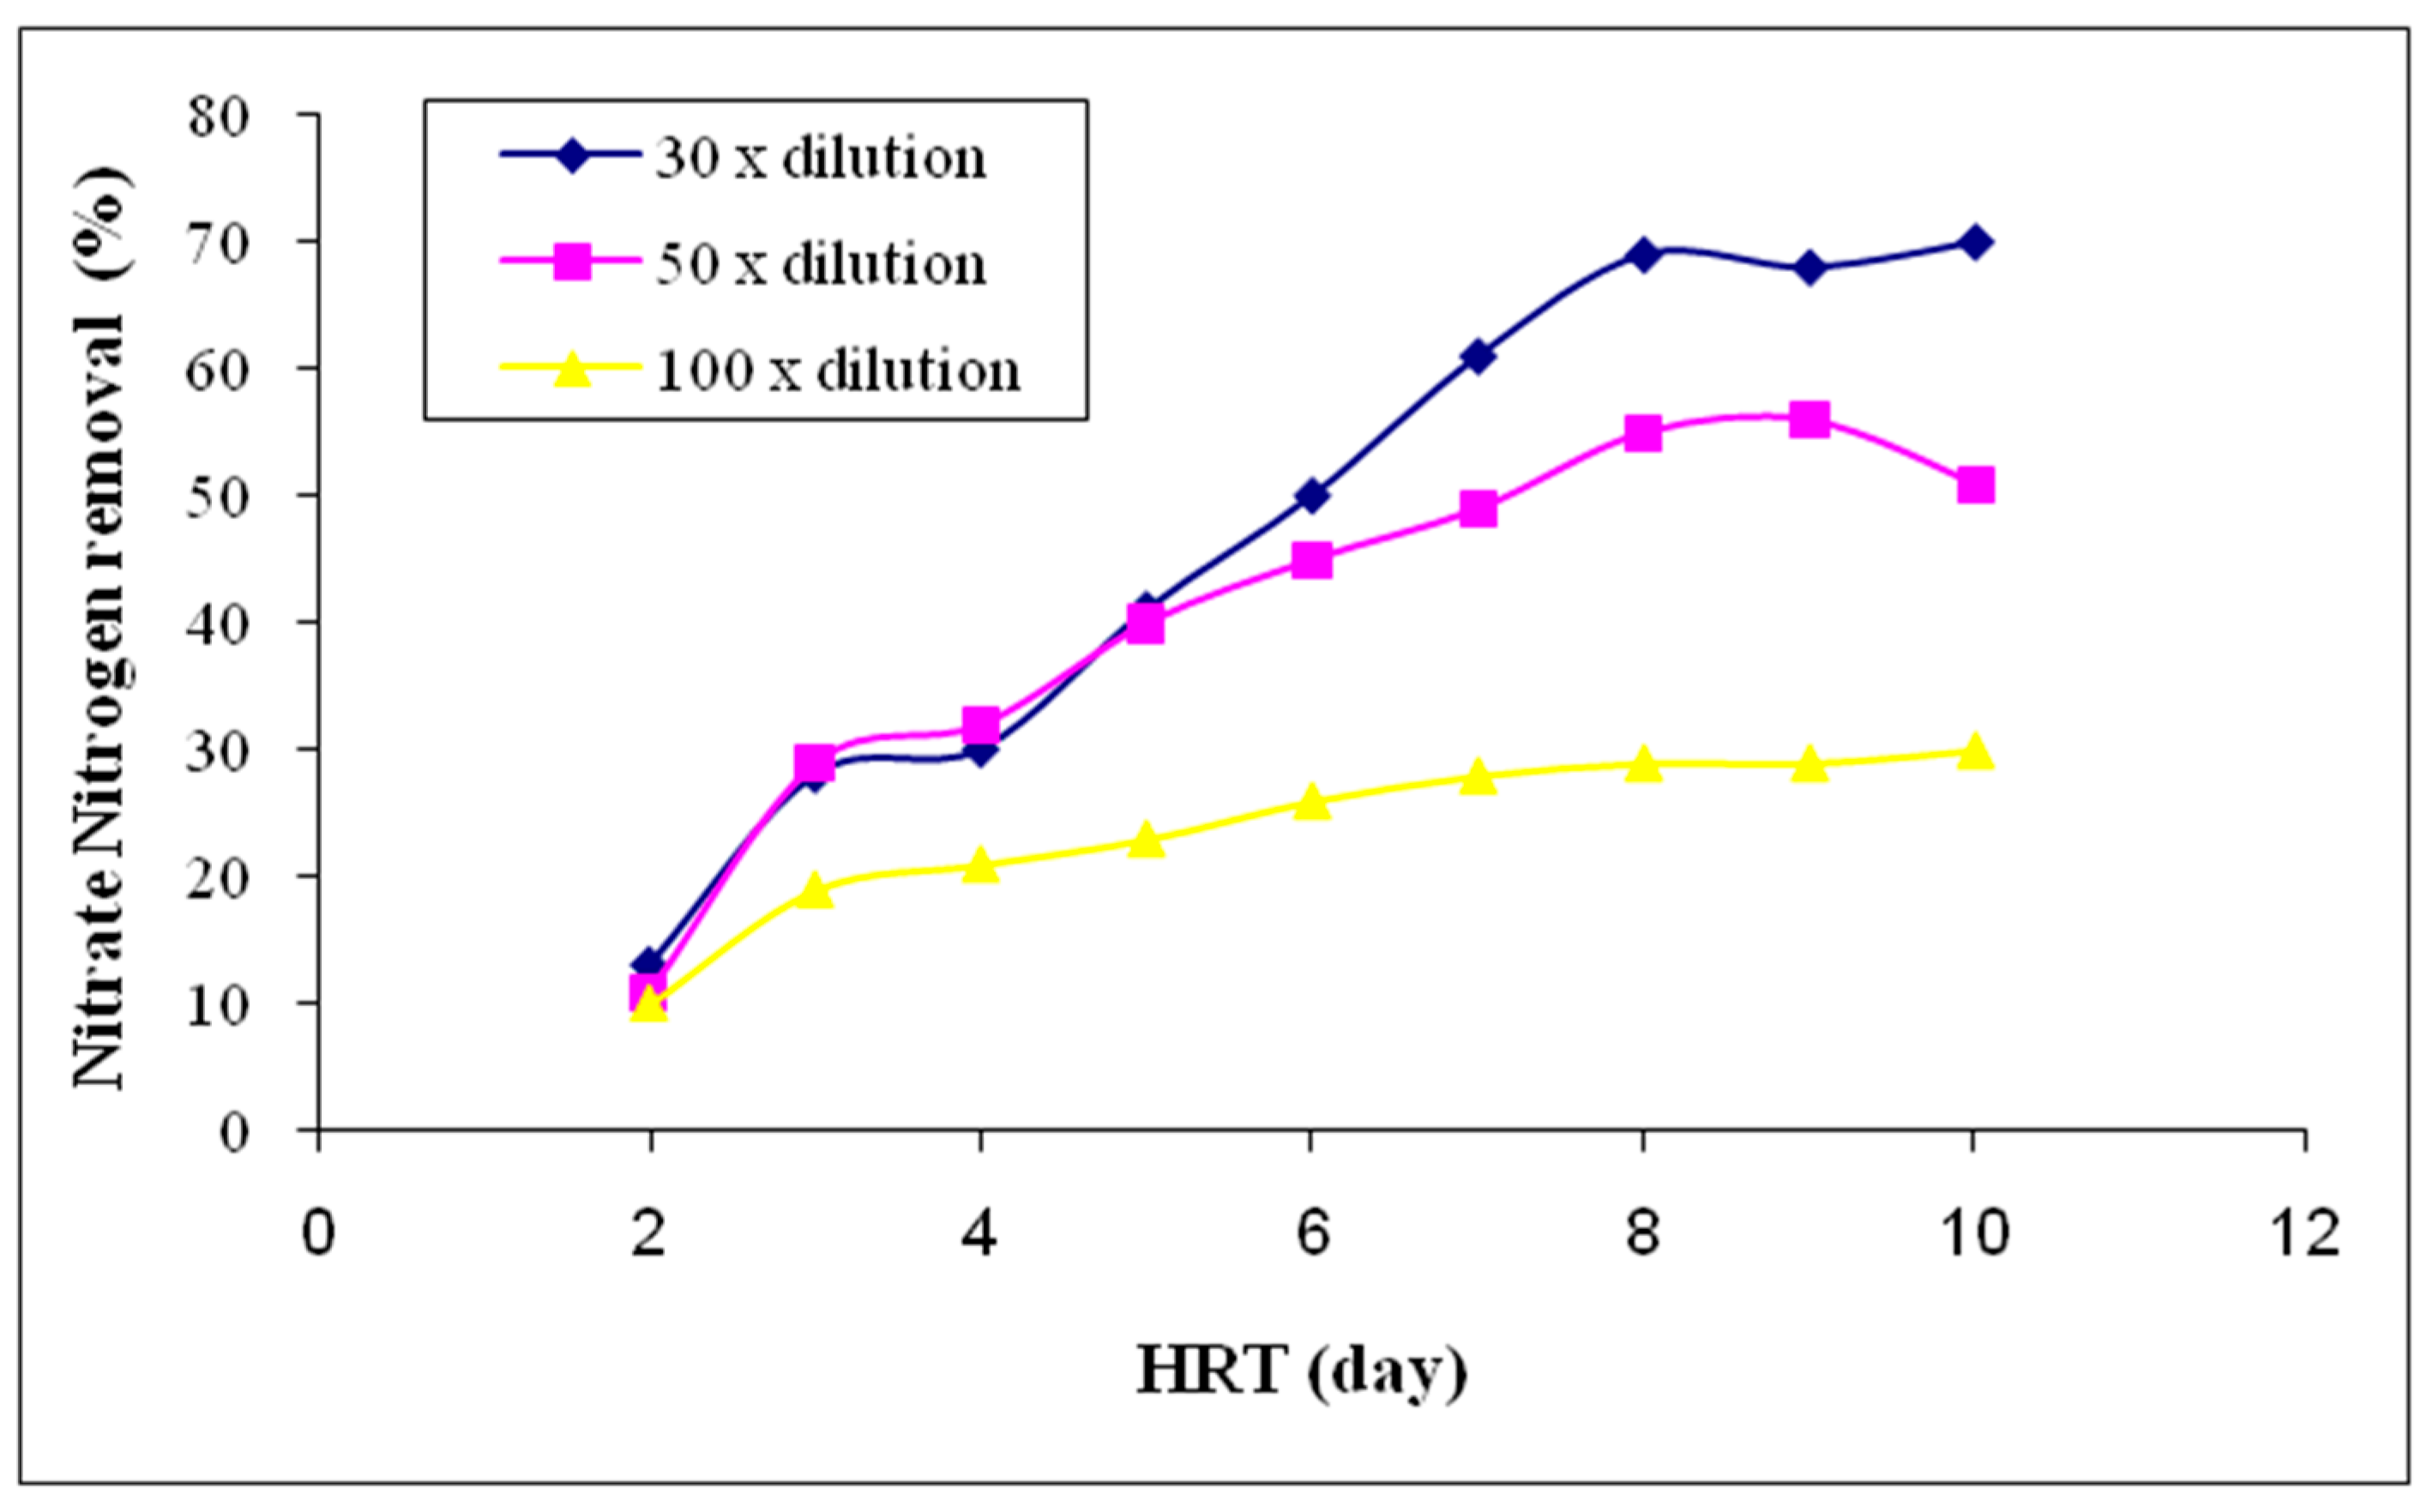
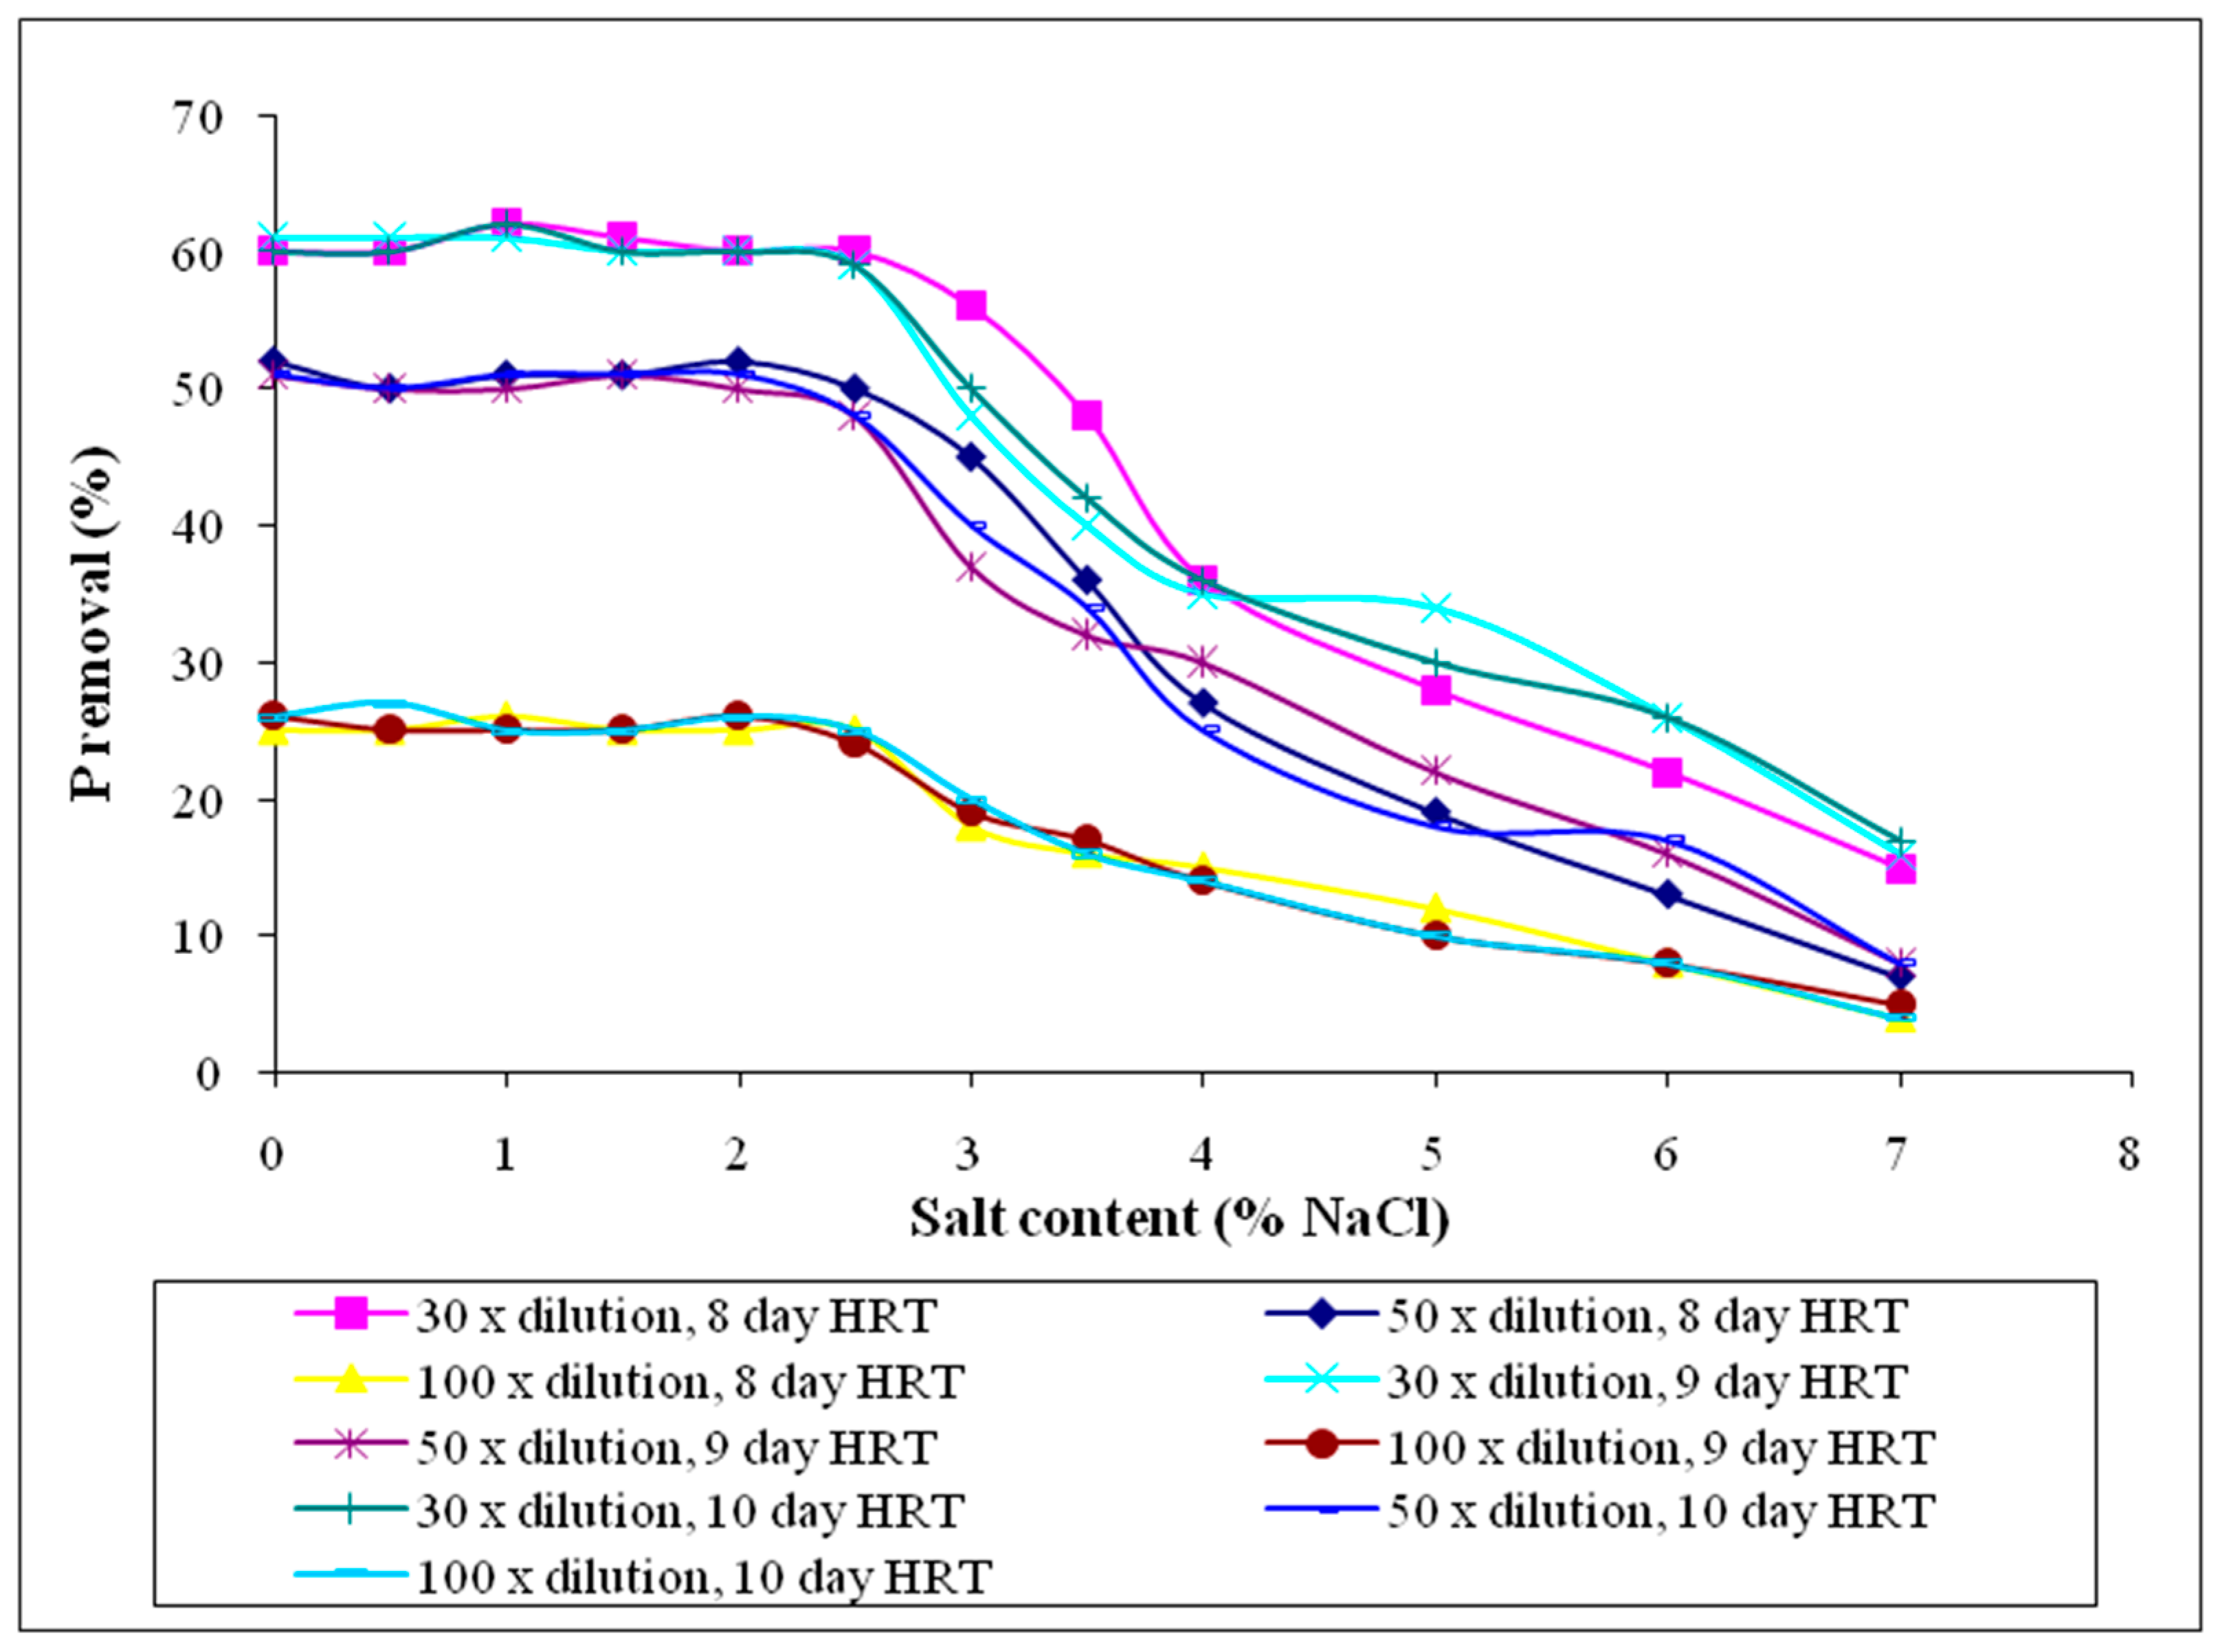
Table 1.
Characteristics of the simulated original 1 and 30-, 50-and 100-fold diluted fish processing wastewater.
Table 1.
Characteristics of the simulated original 1 and 30-, 50-and 100-fold diluted fish processing wastewater.
| Parameter (mg/L) | Fish Processing Wastewater Concentration | |||
|---|---|---|---|---|
| Simulated Original | 30-Fold Dilution | 50-Fold Dilution | 100-Fold Dilution | |
| TSS | 5530 | 184 | 110 | 55 |
| TDS | 2590 | 86 | 52 | 26 |
| TS | 22,350 | 750 | 450 | 225 |
| VSS | 905 | 30 | 18 | 9 |
| pH | 6.65 | 7.36 | 7.38 | 7.40 |
| BOD | 18,419 | 614 | 368 | 184 |
| COD | 30,000 | 1000 | 600 | 300 |
| NH3-N | 504 | 17 | 10 | 5 |
| NO3−-N | 51 | 1.7 | 1.0 | 0.5 |
| P | 95.5 | 3.2 | 1.91 | 0.96 |
1 without dilution.
© 2017 by the author. Licensee MDPI, Basel, Switzerland. This article is an open access article distributed under the terms and conditions of the Creative Commons Attribution (CC BY) license (http://creativecommons.org/licenses/by/4.0/).
Share and Cite
MDPI and ACS Style
Ching, Y.C.; Redzwan, G. Biological Treatment of Fish Processing Saline Wastewater for Reuse as Liquid Fertilizer. Sustainability 2017, 9, 1062. https://doi.org/10.3390/su9071062
AMA Style
Ching YC, Redzwan G. Biological Treatment of Fish Processing Saline Wastewater for Reuse as Liquid Fertilizer. Sustainability. 2017; 9(7):1062. https://doi.org/10.3390/su9071062
Chicago/Turabian StyleChing, Yun Chen, and Ghufran Redzwan. 2017. "Biological Treatment of Fish Processing Saline Wastewater for Reuse as Liquid Fertilizer" Sustainability 9, no. 7: 1062. https://doi.org/10.3390/su9071062
Note that from the first issue of 2016, this journal uses article numbers instead of page numbers. See further details here.