Article

A Multi-Step Approach to Assess the Lifecycle Economic Impact of Seismic Risk on Optimal Energy Retrofit

1
Department of Industrial Engineering, Università degli studi di Napoli Federico II, Piazzale Tecchio 80, 80125 Naples, Italy
2
Department of Structures for Engineering and Architecture, Università degli studi di Napoli Federico II, Via Claudio 21, 80125 Naples, Italy
3
Department of Medicine, Università degli studi del Molise, Via Cesare Gazzani 47, 86100 Campobasso, Italy
*
Author to whom correspondence should be addressed.
Sustainability 2017, 9(6), 989; https://doi.org/10.3390/su9060989
Submission received: 10 May 2017 / Revised: 30 May 2017 / Accepted: 31 May 2017 / Published: 8 June 2017

Abstract

:
Most European buildings built before 1980s were constructed without any design concern for energy efficiency and environmental sustainability. In addition to this issue, over the last decades, the essential need of safer buildings has progressively attracted the interest of scientific community and government institutions. However, the strong interaction between energy and structural aspects in building retrofit design has never been handled via robust and reliable approaches. The present study explores this knowledge gap by introducing a novel multi-step approach that addresses the retrofit of existing buildings by integrating energy, structural and economic aspects. To this end, a multi-stage energy optimization is carried out by implementing a genetic algorithm and a smart research strategy. Thus, the cost-optimal energy retrofit solution is identified and the impact of the expected economic losses due to seismic damage is assessed throughout the building lifecycle. The methodology is applied to a multi-story residential building, considering the effects of two different building locations, namely Milan and Norcia. These latter are characterized by similar climatic conditions but by a different level of seismic risk, which is higher for Norcia. The outcomes show that the estimated seismic economic losses associated with the energy retrofit solutions are strongly affected by the building location. Thus, the selection of the optimal energy retrofit measures should be related to the building structural behavior in order to achieve reliable economic and sustainability benefits.

1. Introduction

A large share of the European building stock does not comply with current structural codes and, at the same time, suffers from physical/environmental degradation or even structural damage induced by hazardous events occurred over building lifetime. In this background, over the last decades, building retrofit has gained increasing interest among national institutions and governments, enabling prospects of upgrading external building envelope and energy systems to achieve energy efficiency goals. National policies have also encouraged the increment of safety levels for occupants of existing building, trying to align with more modern accommodation standards and structural codes. The design framework for retrofit/renovation interventions has been recognized as typically made up of a set of objectives, indicators or performance criteria belonging to the key objectives of sustainable development, which are generally represented in terms of a triple bottom-line strategy [1,2], i.e., through the simultaneous fulfillment of environmental, economic and social goals. However, many of the studies dealing with large-scale retrofit have focused deeply on single aspects, such as mechanical or energy performance of retrofitted/renovated existing structures [3,4], while few works have dealt with the integration of other sustainability objectives. Recent approaches have also encompassed other sustainability criteria, such as economic benefits of refurbishment [5] and social aspects [6] related to the structural and functional performance of a building after earthquake induced damage. Even though energy performance seems to be recognized as the “core” of any sustainable retrofit process, the interaction with other aspects related to a given building system cannot be neglected. Thus far, at the retrofit design stage, the combination of energy, structural and environmental information cannot be effectively used in a general decision-making process, making the single aspect of the structural or energy performance insufficient to provide comparable and valuable retrofit solutions. Indeed, the choice of an energy strategy as well as the selection of a set of raw materials for building components cannot be separated from the effects they generate on the structure itself regarding: (i) overall structural performance; (ii) compliance with national/international construction standards; and (iii) global costs. Therefore, the integration of these three aspects (i.e., energy, environment, and structure) at the design stage is a fundamental prerequisite to reliably incorporate sustainability principles in a decision-making process applied to existing buildings.
This paper introduces a sustainability assessment framework for the retrofit process of existing buildings based on the integration of energy and structural aspects. In particular, the study proposes a novel multi-step approach that aims to identify the structural interactions arising from cost-optimal energy retrofit solutions applied to existing buildings. The overall outcomes of this integration are handled in terms of global lifecycle expected costs, which include investments and operating costs linked to energy uses as well as economic loss quantifications related to the structural performance of the building.
In this frame, the quest for simultaneously achieving structural safety and energy efficiency goals is becoming a sustainability challenge especially in the case of existing buildings, for which several constraints on the intervention itself should be considered and, at the same time, high economic advantages can be envisioned for stakeholders. Motivated by this, the study provides an original investigation concerning the effects of optimal energy retrofit solutions on the economic losses of existing buildings prone to seismic damage. The main novelties of the proposed methodology consist in: (i) implementing cost-optimal energy retrofit solutions within a building economic loss assessment framework; (ii) taking into account the interconnecting links between the multiple energy retrofit measures and the building structure; and (iii) considering the role of the existing building location concerning both energy and structural performances. In this regard, the methodology is applied to an Italian multi-story residential building by considering two different locations, namely Milan and Norcia. These latter are characterized by similar climatic conditions, since both of them belong to the Italian climatic zone E, but by a different level of seismic risk, which is higher for Norcia site.

2. Methodology

A proper retrofit strategy should be evaluated by using suitable economic, environmental, social and structural criteria with the final aim of implementing the most proper (cost-effective and/or sustainable) solution for a given existing building. Hence, a proper methodological framework should support the comparative assessment of a set of retrofit options.
To this scope, a novel multi-step approach is proposed, enabling to quantify the overall economic lifecycle costs associated with the energy and structural performances of a retrofitted building. In particular, the energy performance refers to a set of energy retrofit measures (ERMs) applied to the existing building whereas the structural performance is considered in order to quantify the economic losses due to seismic induced damage. The methodology comprises the following four main steps:
  • Step (1)—Optimization of building energy retrofit: a wide set of possible and compatible combinations of retrofit solutions is considered among a set of ERMs, determining, at the end of this step, the most suitable configuration as the outcome of a cost-optimal analysis.
  • Step (2)—Assessment of seismic economic losses: given that the existing building is prone to seismic risk, future costs associated with the reduction of the building structural capacity are handled in this step. In detail, the seismic induced damages and the related economic investment to restore the damaged components are quantified for the “as built” existing building throughout its lifetime.
  • Step (3)—Integration of energy and structural aspects: the cost-optimal ERMs identified in Step (1) are associated to proper engineering demand parameters and component performances of the existing building. In detail, the operation of the ERMs is linked to the level of seismic induced damage of the non-structural components onto which they are applied (e.g., walls, windows, etc.).
  • Step (4)—Assessment of the influence of energy retrofit on seismic economic losses: the analysis of Step (2) is conducted for the retrofitted building as well, based on the constraints defined in Step (3) and by considering the implementation of the cost-optimal energy retrofit solution identified in Step (1). The difference in global costs (i.e., saving) is, in this way, quantified with respect to the as built configuration. The outcomes can be useful for the selection of proper ERMs, looking at the overall cost-effectiveness of the retrofit itself. On the other hand, they can be used to integrate combined energy and structural retrofit measures, with the final aim of reducing the overall cost (or, more in general, other sustainability parameters) of the intervention.
The steps described above are detailed in the following subsections.

2.1. Step (1)—Optimization of Building Energy Retrofit

The proper design of energy retrofit is a complex issue that requires the consideration of a wide domain of packages of ERMs. Definitely, the best solution is affected by numerous factors, such as the stakeholders’ wills and needs as well as the scenario in which the building is located, especially as concerns climatic conditions. In this study, the building energy retrofit is handled by means of a multi-stage optimization approach that implements a genetic algorithm (Stage 1) and a smart sampling of retrofit scenarios (Stage 2). Notably, Stage 1 aims to find optimal packages of energy retrofit measures (ERMs) by minimizing thermal energy demand and thermal discomfort, while Stage 2 aims to find the final cost-optimal energy retrofit solution.
The procedure is implemented by coupling EnergyPlus [7] and MATLAB® [8]. EnergyPlus is employed as simulation tool to run reliable energy simulations in dynamic conditions, whereas MATLAB® is employed as mathematical tool to implement optimization and sampling algorithms as well as to post-process EnergyPlus outcomes. A similar procedure was performed by the authors to address the energy retrofit of residential [4,9] and hospital buildings [10].
In particular, Stage 1 investigates the implementation of ERMs for the reduction of:
  • TEDsc: thermal energy demand for space conditioning; and
  • DH: annual percentage of discomfort hours, which are assessed according to the procedure described in [4]; a discomfort hour is an occupation hour (there is presence of people) in which the average value of predicted mean vote (PMV) [11] is not included between −0.85 and 0.85.
Thus, a bi-objective optimization problem is solved. The two objective functions are the minimization of TEDsc and DH, respectively. The design variables express the implementation of ERMs that improve the energy performance of the building envelope as well as the variation of heating and cooling set point temperatures. A further constraint is also considered, since the retrofit solutions cannot cause an increase of DH compared to the baseline (DHB). The two mentioned objective functions are chosen because they express the typical dilemma of building owners/occupants between consuming less and increasing comfort. In addition, their reliable assessment requires time-consuming dynamic simulations using proper software, e.g., EnergyPlus. Therefore, in this case, the use of optimization algorithms is highly effective because these perform a smart research, thereby implying a significant reduction of computational times compared to an exhaustive sampling.
Thus, the genetic algorithm (GA) is run by means of the coupling of EnergyPlus and MATLAB®. The GA is a variant of NSGA II [12] and provides the iterative “evolution” of a population of individuals, which represent packages of ERMs, through the processes of crossover, mutation and survival of the best individuals (elite), as detailed in [4,9,10]. The GA parameters are set according to the values used in [10], to which the readers can refer for details. Most notably, the maximum number of generations (i.e., iterations) is set equal to 20 and the population size is set equal to four times the number of design variables. In this regard, discrete variables are considered in order to reduce the explored solution domain as well as to make the approach more realistic [4]. The final outcome of the GA is the Pareto front collecting the non-dominated solutions, which provide optimal packages of ERMs as concerns the minimization of TEDsc and DH.
Then, Stage 2 is performed for optimizing the whole building energy retrofit by considering:
  • the ERMs investigated in Stage 1 that are addressed to the building envelope and to the variation of set point temperatures; and
  • ERMs for improving the energy performance of primary energy systems, including the exploitation of renewable energy sources (RESs).
In particular, a smart sampling of retrofit scenarios is performed in order to conduct a robust cost-optimal analysis. A huge domain of retrofit solutions is explored. In this regard, all possible (and compatible) combinations among the ERMs for energy systems and the non-dominated packages of ERMs for the reduction of TEDsc and DH, provided by the GA, are investigated. In addition, the combinations of ERMs for energy systems are examined in absence of ERMs for the building envelope and for the variation of set point temperatures, since these latter ERMs could be energy-efficient but not cost-effective. For each retrofit scenario, primary energy consumption (PEC) and global cost (GC) are assessed in order to obtain the cost-optimal curve, which represents GC against PEC, and, thus, the cost-optimal retrofit solution (minimum of the cost-optimal curve). GC is calculated according to the guidelines of the Energy Performance of Buildings Directive (EPBD) recast (2010/31/EU) [13,14] over building lifecycle by considering investments and discounted operating costs. More in detail, in order to achieve more meaningful outcomes, the differences in PEC (dPEC = PEC − PECB) and GC (dGC = GC − GCB) compared to the baseline (i.e., as built configuration, denoted with the subscript B) are estimated and represented. Clearly, negative values show energy and cost savings, respectively. The described procedure is entirely carried out in MATLAB® environment, by implementing the method described in [10], without needing further time-consuming EnergyPlus simulations. In particular, a MATLAB® code implements the performance curves of the energy systems in order to calculate PEC and GC starting from the hourly values of thermal energy and electricity demand for artificial lighting and equipment. These hourly values are provided by EnergyPlus in Stage 1. The sampling is defined “smart” because of two main reasons. Firstly, as concerns ERMs for building envelope and the variation of set point temperatures, whose analysis requires EnergyPlus runs, it investigates only the non-dominated solutions obtained through the GA. Secondly, it needs low computational times because PEC and GC are evaluated under MATLAB® environment.
Finally, in order to offer a comprehensive characterization of the cost-optimal solution, other performance indicators are calculated: the investment cost (IC), the discounted payback time (DPB) and difference in CO2-eq emissions compared to the baseline (dEM = EM − EMB).

2.2. Step (2)—Assessment of Seismic Economic Losses

Lifecycle cost (LCC) analysis represents a fundamental engineering tool to assess initial and future costs associated with a facility/building throughout its entire lifetime. As far as structural behavior is concerned, different hazardous events taking place during the service life of a building (such as earthquakes, floods, etc.) can affect the building structural integrity. Consequently, the reduction of the structural capacity due to the hazard induced damage may require a proper economic investment to restore the damaged components.
The economic loss assessment procedure implemented in this work, developed by Vitiello et al. [15], refers to seismic hazard only. It is a simplified methodology based on the well-consolidated approach developed by the Pacific Earthquake Engineering Research (PEER) and carried out according to the performance-based earthquake engineering (PBEE) approach [16,17]. The procedure consists of the following four stages:
  • hazard analysis: the output of this stage is the seismic intensity measure;
  • structural analysis: the outputs of this stage are the engineering demand parameters;
  • damage analysis: the output of this stage is the damage measure; and
  • loss analysis: the output is the decision variable once assessed the performance.
The first stage is the site hazard characterization. The inverse of a return period TR identifies the probability of exceeding the intensity of a given earthquake and involves the quantification of the earthquake intensity measure (IM).
Then, in the second stage, the structural analysis is simplified by the use of a static non-linear analysis instead of a non-linear time-history structural analysis as reported in the PEER methodology. Non-linear static analyses are carried out for the two plan directions of the structure (x and y directions) up to its global mechanism. For each step of the pushover curve, a bi-linearization procedure is performed according to the N2 approach [18]. Accordingly, a peak ground acceleration (PGA) value is derived for each step of the pushover curve as the demand intensity that would induce that particular structural response. The achievement of a failure mechanism identifies the PGA capacity of the structure and corresponds to the hazard intensity that would induce the structural failure. The ratio between the PGA capacity and the PGA demand defines the safety level.
The third stage consists in the damage analysis, through which the engineering demand parameters (EDPs), obtained as outputs from the non-linear static analyses, are implemented into fragility models to estimate the probability that a building component is in, or exceeds, a specific damage state. To this end, the building is divided into various components, encompassing structural and non-structural ones, and for each of these, a set of fragility curves is assigned being representative of a certain intensity of damage. Accordingly, to convert the damage of a building component into a contribution to the building economic losses, it is necessary to compute the cost of each repair/recover or replacement intervention with respect to the damage level that is reached.
The implementation of the described procedure allows the assessment of the seismic economic losses of the entire building as the sum of the repair/recovery costs of each component multiplied by the probability of damage occurrence. These economic losses are used in the fourth stage to establish the total loss. The economic loss calculated through this procedure is an expected annual loss (EAL) and is used to estimate the economic performance of the facility from the structural point of view.
This simplified methodology may be also applied to identify the most cost-effective strengthening strategy and strengthening level (i.e., the strengthening interventions associated with a given safety level) for existing structures during their lifetime. However, this aspect is not handled in this study and will be addressed by the authors in further developments of the methodology.

2.3. Step (3)—Integration of Energy and Structural Aspects

This step aims to model the possible interactions arising from different energy retrofit measures (ERMs) with the building structure itself. A proper strategy consists in first considering the building location from both sides of the retrofit process, i.e., energy and structural. Indeed, the geographic position of the building clearly affects the target of the energy retrofit design from one side; on the other hand, the building structural performance is strongly associated with the level of hazard risk relevant for that place. Within this constraint, technological and physical interactions should be determined for combining structural and energy retrofit strategies. In this study, particular attention is given to possible damages that prevent the proper operation of the ERMs installed on the existing buildings as a consequence of seismic induced damage.
The operational and damage level of ERMs and systems is linked to the structural performance of building components through the association with the corresponding engineering demand parameters (EDPs). In particular, the relations between EDPs and component performances are based on laboratory tests and analytical models. Among building components, non-structural elements can be divided in two categories: drift-sensitive and acceleration-sensitive. The first category includes components with level of damage that is a function of the inter-story drift ratio. The second category includes components with a damage level that is a function of the peak floor acceleration. Windows, mechanical and electrical equipment, HVAC (heating, ventilating and air conditioning) systems, electrical distribution and lighting systems are permanently attached to the building partition, thus can be related to the EDP of the partition walls consisting in the inter-story drift ratio. Furthermore, ERMs can involve the installation of new components (e.g., photovoltaic systems) or the replacement of existing components (e.g., façade elements). In the former case, new fragility models have to be implemented in the seismic economic loss procedure, whereas in the latter, the replacement of the building components affects restoration and replacement costs.

2.4. Step (4)—Assessment of the Influence of Energy Retrofit on Seismic Economic Losses

The seismic economic losses of the building are assessed in correspondence of the cost-optimal energy retrofit solution, identified in Step (1) as detailed in Section 2.1. Thus, the potential global cost saving (GCS) is estimated over the residual building lifetime in the following two scenarios.
  • Scenario 1: Seismic economic losses are not considered in global cost assessment; therefore, the costs derive from the implementation of a merely energy approach.
  • Scenario 2: Seismic economic losses are considered in global cost assessment as an additional annual cost in the form of discounted expected annual losses (EALs), thereby implementing a coupled energy-structural approach.
In Scenario 2, the EAL due to the seismic risk is assumed equal to the highest value arising from the worst seismic load scenario. In addition, EAL is supposed constant over the estimation period and discounted at the first year, as done for the operating costs associated with energy consumptions. For example purposes, Figure 1 proposes a qualitative trend of GCS in function of time for the two described approaches. Clearly, when the seismic economic losses are considered, the potential global cost savings decrease compared with Scenario 1, whereas the discounted payback time increases. Indeed, the implementation of energy retrofit inevitably causes an increment of EAL, since the economic value of the building components increases as well. It is worth noting that this effect depends on the existing building location, since it becomes more significant when the seismic hazard is higher. Definitely, the coupled energy-structural approach allows the estimation of the actual effectiveness of cost-optimal energy retrofit solutions, which could be, in some cases, even not profitable (i.e., payback time higher than lifetime) for locations characterized by high levels of seismic risk and vulnerable existing buildings.

3. Case Study

A reinforced concrete (RC) structure has been chosen as case study for implementing the integrated procedure described above. The building is a typical example of an Italian facility built in the 1970s according to the old building code and without any seismic prevision. In addition, the building envelope presents low thermal resistance, like large part of Italian existing buildings (built before the 1980s), and this implies inadequate energy performance given the high entity of energy demand for space conditioning. In this regard, the vertical external walls are in hollow bricks and have thermal transmittance (i.e., U-value) equal to 1.23 W/m2K. The horizontal envelope is in mixed brick-reinforced concrete and the U-value is equal to 1.05 W/m2K for the roof and to 0.90 W/m2K for the basement floor. Finally, the windows are double-glazed with wooden frames and have U-value equal to 2.67 W/m2K as well as solar heat gain coefficient (SHGC) equal to 0.691.
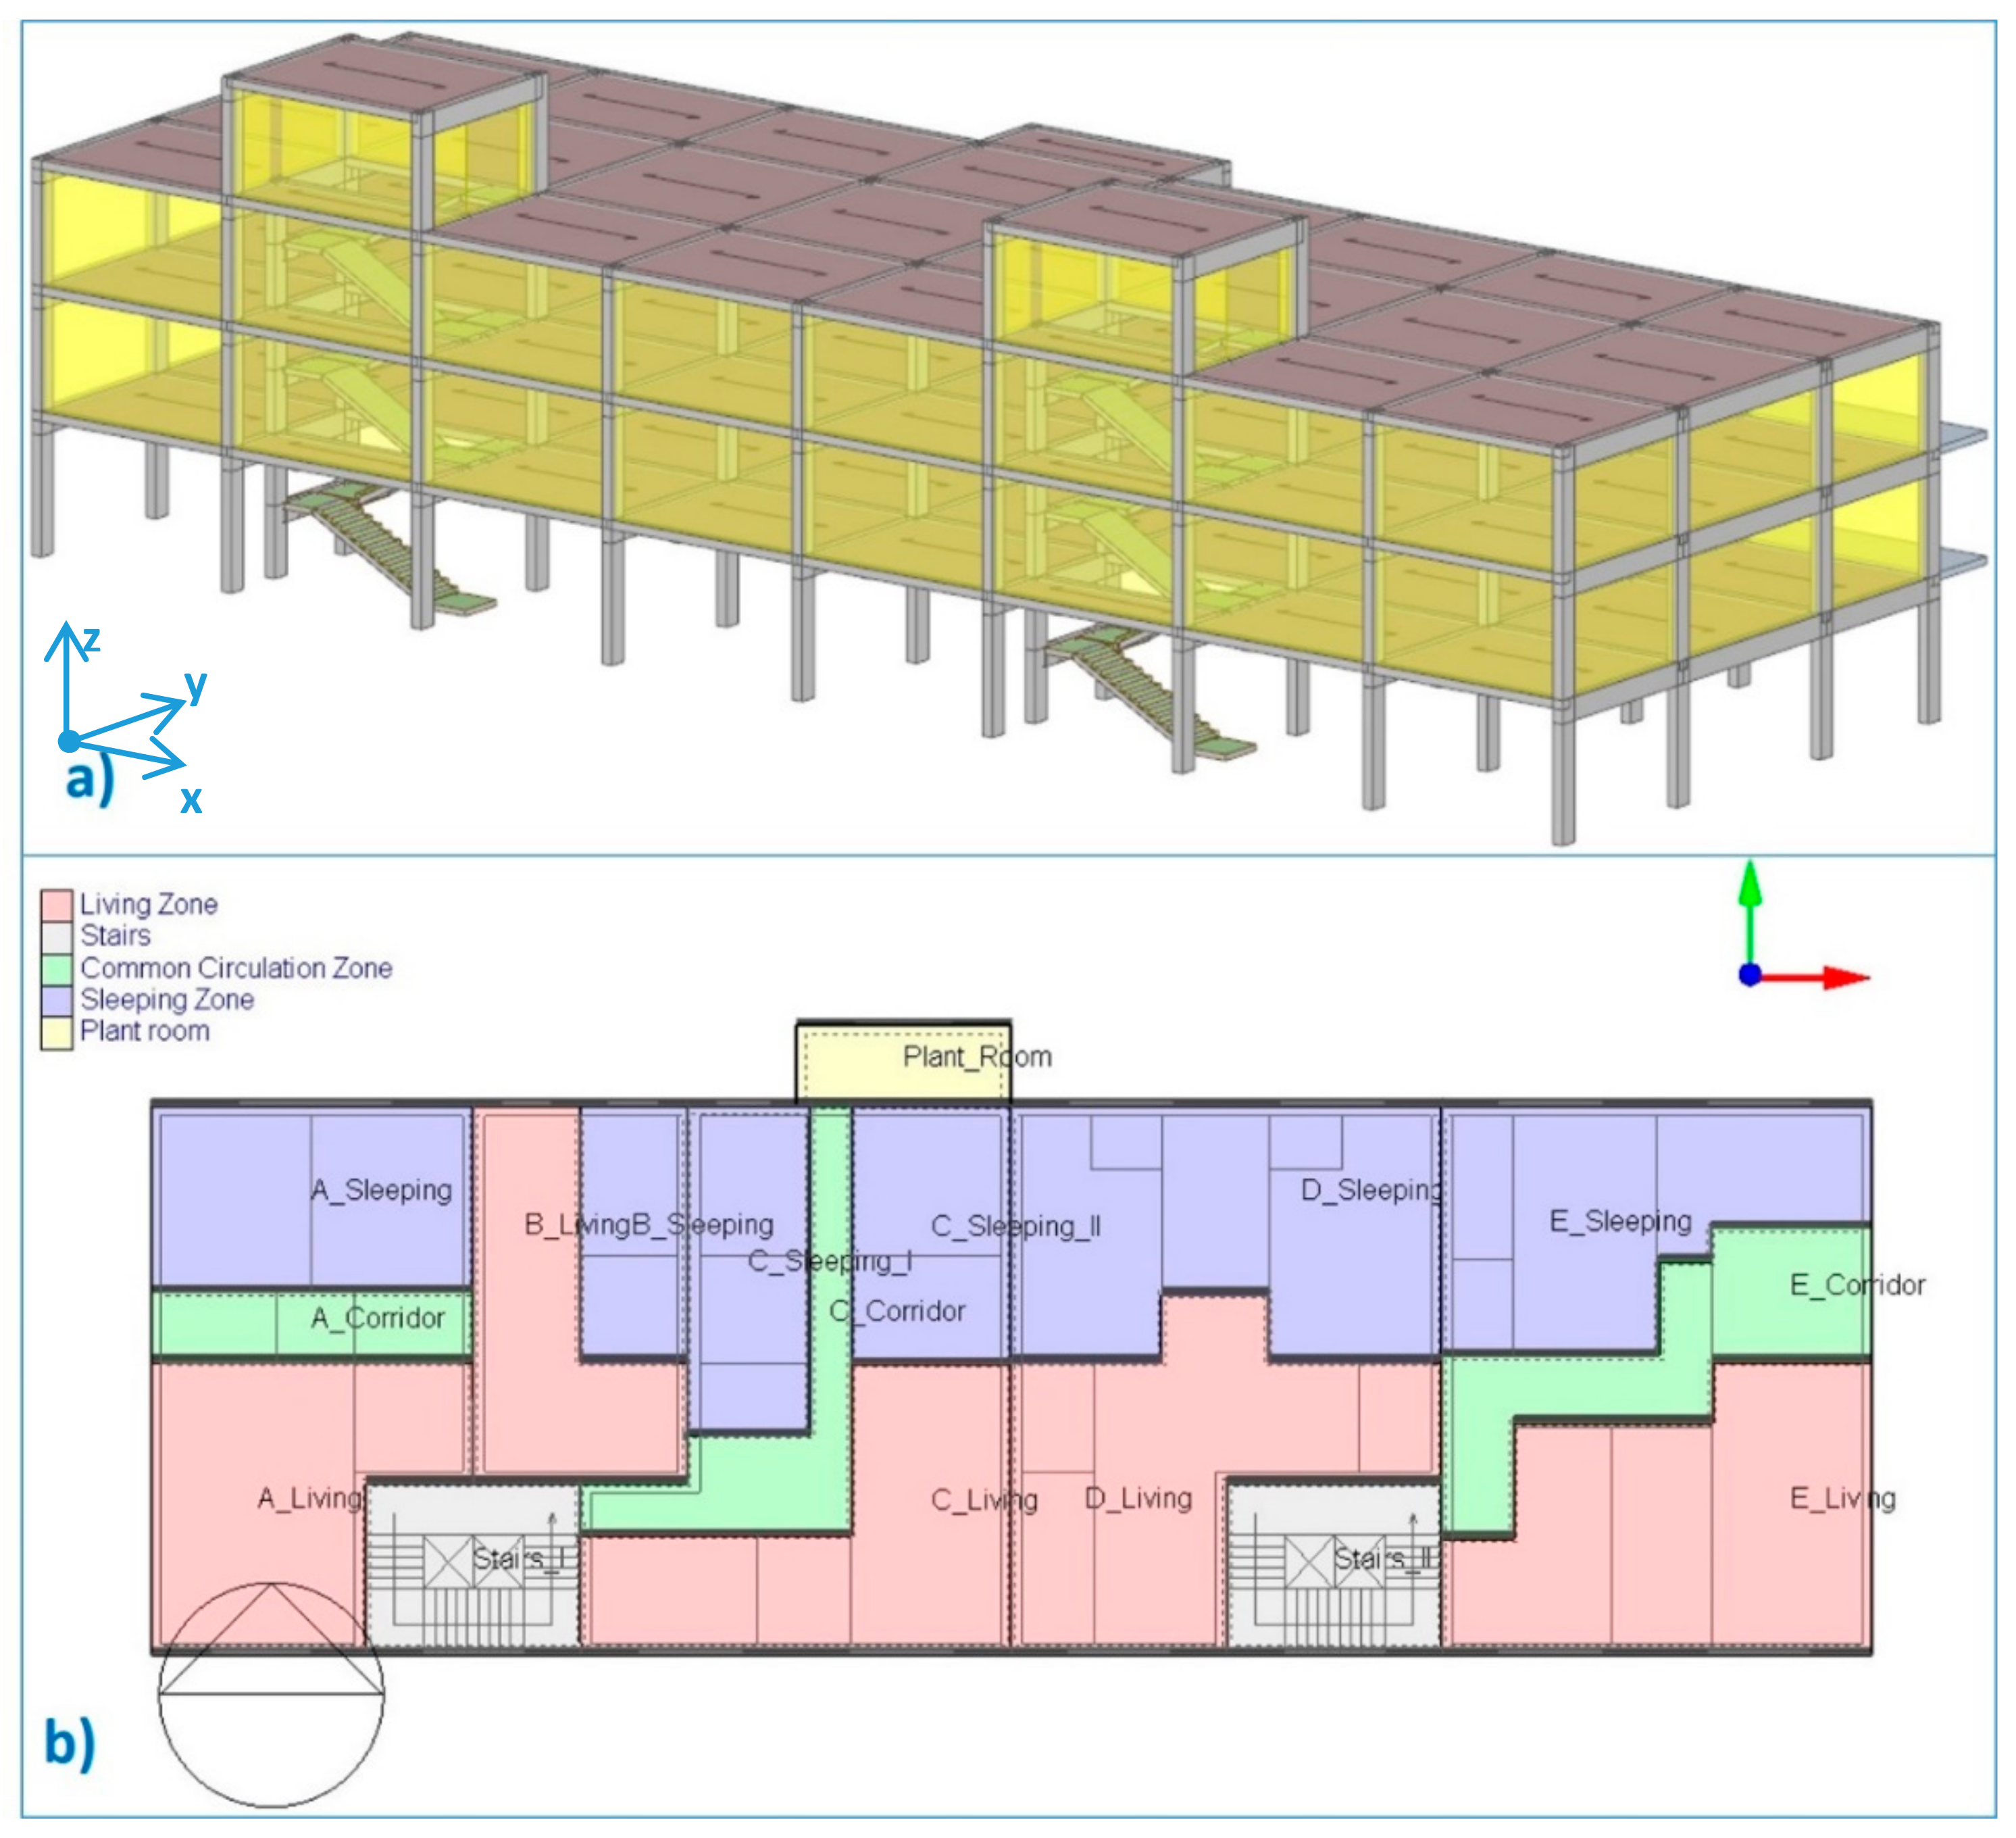
Concerning the building geometry, the floor plan has an approximate rectangular shape and dimensions of 48.1 m × 18.1 m, with a total area of about 870 m2 (see Figure 2). The total height of the building is 10.1 m and it consists of three floors with a story height of 3.2 m, except for the first floor, which is 3.7 m. Each story hosts five typical apartments of different extension. These are denoted with the letters A–E in Figure 2b, which also shows the subdivision into thermal zones, employed in EnergyPlus simulations.
As regards the building structural behavior, the following mechanical properties are assumed for the materials: the concrete compressive strength (fcm) is equal to 15 MPa and the steel tensile strength (fym) is equal to 220 MPa. The overall cast-in situ RC one-way slabs thickness is 24 cm with a deck of about 4 cm, which ensures the rigid diaphragm effect for each floor. The geometrical proprieties of the elements are listed in Table 1.
The building is assumed to be located in two different Italian cities, namely Norcia (Central Italy) and Milan (Northern Italy). These are characterized by similar climatic conditions but by a different level of seismic risk, which is higher for Norcia site. As concerns the climatic scenario, both cities belong to the Italian climatic zone E, which collects all locations with heating degree days (HDDs) in the range 2101–3000. In particular, the value of HDDs is 2404 for Milan and 2608 for Norcia. Definitely, both cities present a heating-dominated climate, so that space heating demand is much higher than space cooling one. On the other hand, with regard to the seismic risk, the PGA (peak ground acceleration) demand value depends on the site hazard, and is 0.049 g (gravitational acceleration) for Milan and 0.255 g for Norcia, considering as seismic demand a severe earthquake with a return period of 475 years, according to the Italian National Building Code [19].

3.1. Investigated Energy Retrofit Measures (ERMs)

For both considered climatic locations, the following ERMs are investigated for the reduction of thermal energy demand and discomfort hours:
  • variation of heating set point temperature (Th), which cannot be higher than 22 °C according to Italian regulations [20];
  • variation of cooling set point temperature (Tc);
  • variation of the infrared emissivity of the external vertical walls (ev) by means of the installation of external plasters;
  • variation of the solar absorptance of the external vertical walls (av) by the installation of external plasters;
  • variation of the infrared emissivity of the roof (er) by the installation of external plasters;
  • variation of the solar absorptance of the roof (ar) by the installation of external plasters;
  • installation of an external layer of thermal insulation (thermal conductivity = 0.026 W/m K, density = 25 kg/m3, specific heat = 1340 J/kg K) on the external vertical walls (the insulation layer’s thickness is denoted as tv);
  • installation of an external layer of thermal insulation (see above properties) on the roof (the insulation layer’s thickness is denoted as tr); and
  • replacement of the windows with energy efficient ones, where the following eight options are considered:
    -
    (w1) double-glazed air-filled windows with wooden frames: Uw = 2.67 W/m2K; SHGC (solar heat gain coefficient) = 0.691; this option characterizes the baseline;
    -
    (w2) double-glazed air-filled windows with low-emissive coatings and PVC frames: Uw = 1.96 W/m2K, SHGC = 0.691;
    -
    (w3) double-glazed air-filled windows with low-emissive, tinted coatings and PVC frames: Uw = 1.76 W/m2K, SHGC = 0.380;
    -
    (w4) double-glazed air-filled windows with low-emissive, selective coatings and PVC frames: Uw = 1.64 W/m2K, SHGC = 0.433;
    -
    (w5) double-glazed argon-filled windows with low-emissive coatings and PVC frames: Uw = 1.71 W/m2K, SHGC = 0.691;
    -
    (w6) double-glazed argon-filled windows with low-emissive, tinted coatings and PVC frames: Uw = 1.49 W/m2K; SHGC = 0.380;
    -
    (w7) double-glazed air-filled windows with low-emissive, selective coatings and PVC frames: Uw = 1.34 W/m2K; SHGC = 0.433; and
    -
    (w8) triple-glazed argon-filled windows with low-emissive coatings and PVC frames: Uw = 1.10 W/m2K; SHGC = 0.579.
Different options are investigated for the described ERMs thereby implying the variables reported in Table 2. These latter represent the design variables, which are nine, of the bi-objective optimization problem solved by running the GA described in Section 2.1. The considered options have been chosen based on building peculiarities, best-practices and outcomes of previous studies [4,9,10]. The investment costs of these ERMs are not characterized now but later, because only the optimal (non-dominated) solutions provided by the GA are subjected to the cost-optimal analysis.
As shown in Table 2, the total number of bits for variables’ encoding is 25, and thus the domain that is explored by the GA is made of 225 = 33554432 solutions. The investigation of each solution needs an EnergyPlus simulation, which takes around 5 minutes by employing a processor Intel® Core™ i7 at 2.00 GHz. Therefore, an exhaustive sampling would require 167,772,105 min, that corresponds to hundreds of years. Definitely, the use of an optimization algorithm, such as the employed GA, is fundamental to explore a so-wide domain in a reasonable computational time by conducting a smart research of the optimal solutions. Indeed, the computational time required by the GA running is reasonable, since it is around 2.5 days.
After the description of the ERMs investigated through the GA (Stage 1), Table 3 shows the considered ERMs for primary energy systems, which are examined in Stage 2 of the proposed methodology by performing a smart sampling. These ERMs address:
  • the improvement of the energy efficiency of the primary heating system;
  • the improvement of the energy efficiency of the primary cooling system;
  • the improvement of the energy efficiency of the primary system for the production of domestic hot water (DHW); and
  • the installation of systems for the exploitation of RESs, namely photovoltaic (PV) panels.
In addition, in this case, different options are considered for the mentioned ERMs. The values of peak thermal power of the heating, cooling and DHW systems are set equal to the baseline’s values. The investment costs are taken from [10,21] and, when not available, from direct quotations of suppliers. Lastly, financial incentives, provided by current Italian law [22] for ERMs, are taken into account.
The possible (compatible) combinations of the considered primary energy systems are 294.

3.2. Simulation Assumptions

It should be noted that the following assumptions are made in the energy analysis:
  • the primary energy conversion factor is set equal to 1.95 for electricity and 1.05 for natural gas, according to current Italian law [23];
  • the energy price is set equal to 0.25 €/kWhel for electricity and 0.90 €/Nm3 for natural gas as done in [21];
  • produced electricity that is sold to the grid (in presence of PV panels) is remunerated at the price of 0.08 €/kWhel, as done in [10];
  • the polluting emissions’ factor is set equal to 0.708 tCO2-eq/MWhel for electricity 0.237 tCO2-eq/MWhp for natural gas [24];
  • the considered calculation period (i.e., lifecycle) for the assessment of GC is 30 years as recommended in [14] for residential buildings, and the assumed discount rate is equal to 3% [14]; and
  • in EnergyPlus simulations, the IWEC (international weather for energy calculations) weather data file related to Milan [25] is used when Milan is considered as location; on the other hand, the IGDG (Italian climatic data collection “Gianni De Giorgio”) weather data file related to Perugia [25] is used for Norcia. In this regard, accredited weather data files are not available for Norcia, but the use of Perugia file provides a good approximation, since these two locations are very close (the distance is around 70 km) and characterized by similar climatic conditions.
On the other hand, as regards the structural analysis, the non-linear building response is simulated by means of the finite element software SAP2000 [26] using lumped plasticity models of beams and columns (i.e., four hinges for each structural member: top and bottom for both directions). The column and beam plastic hinge models are calculated according to the European Code UNI-EN 1998-3:2005 [27]. Non-linear static analyses are performed for the two plan directions of the structure independent from each other (i.e., x-x and y-y directions with an eccentricity of ±5% of the length side). The horizontal load-patterns assumed in the analyses are the first mode force pattern (obtained from the displacement distribution of the modal analysis) and a force pattern proportional to the mass distribution. Accordingly, for each direction and for each force pattern, the analyses with the lowest seismic capacity are chosen. The achievement of the first failure mechanism due to shear stress of a structural member identifies the PGA capacity of the structure and, consequently, the ratio between the capacity and the demand in terms of the PGA has been defined as the safety level. The safety levels computed from the non-linear static analyses, summarized in Table 4, refer to the two plan directions.

4. Results and Discussion

The presentation and discussion of the results is organized in two subsections, which refer to the baseline (i.e., the as built building performance) and to the retrofitted building, respectively.

4.1. Baseline: As-Built Building Performance

As concerns the baseline energy performance, Table 5 shows thermal energy demand for space conditioning (TEDsc), percentage of discomfort hours (DH), primary energy consumption (PEC), global cost (GC) and polluting emissions (EM) for both climatic locations. Milan is characterized by more rigid climatic conditions in both seasons, thereby implying higher values, compared to Norcia, of all performance indicators.
As concerns the baseline structural performance, according to the procedure previously described, the EDPs obtained from the structural analyses are implemented into fragility models to assess the probability of occurrence of a damage state for a specific building component. Converting the damage of a component into an economic loss allows the computation of the total loss of the entire building due to seismic events. The fragility models implemented in this case study are: Pagni and Lowes [28] for beam-column joints; Aslani and Miranda [16] for beams, columns and windows; and Ruiz-Garcia and Negrete [29] for internal and external partitions and systems (i.e., electric, hydraulic and energy system). The economic value of each component and of each ERM is evaluated through the support of the price list of the typography of the Italian civil engineering DEI. Furthermore, it is also necessary to evaluate the reconstruction cost of the building due to a destructive earthquake. For the total collapse, a reconstruction cost of 1200 €/m2 is assumed.
The assessed expected seismic economic losses are reported in the following Table 6.

4.2. Building Retrofit: Energy Optimization and Economic Loss Assessment

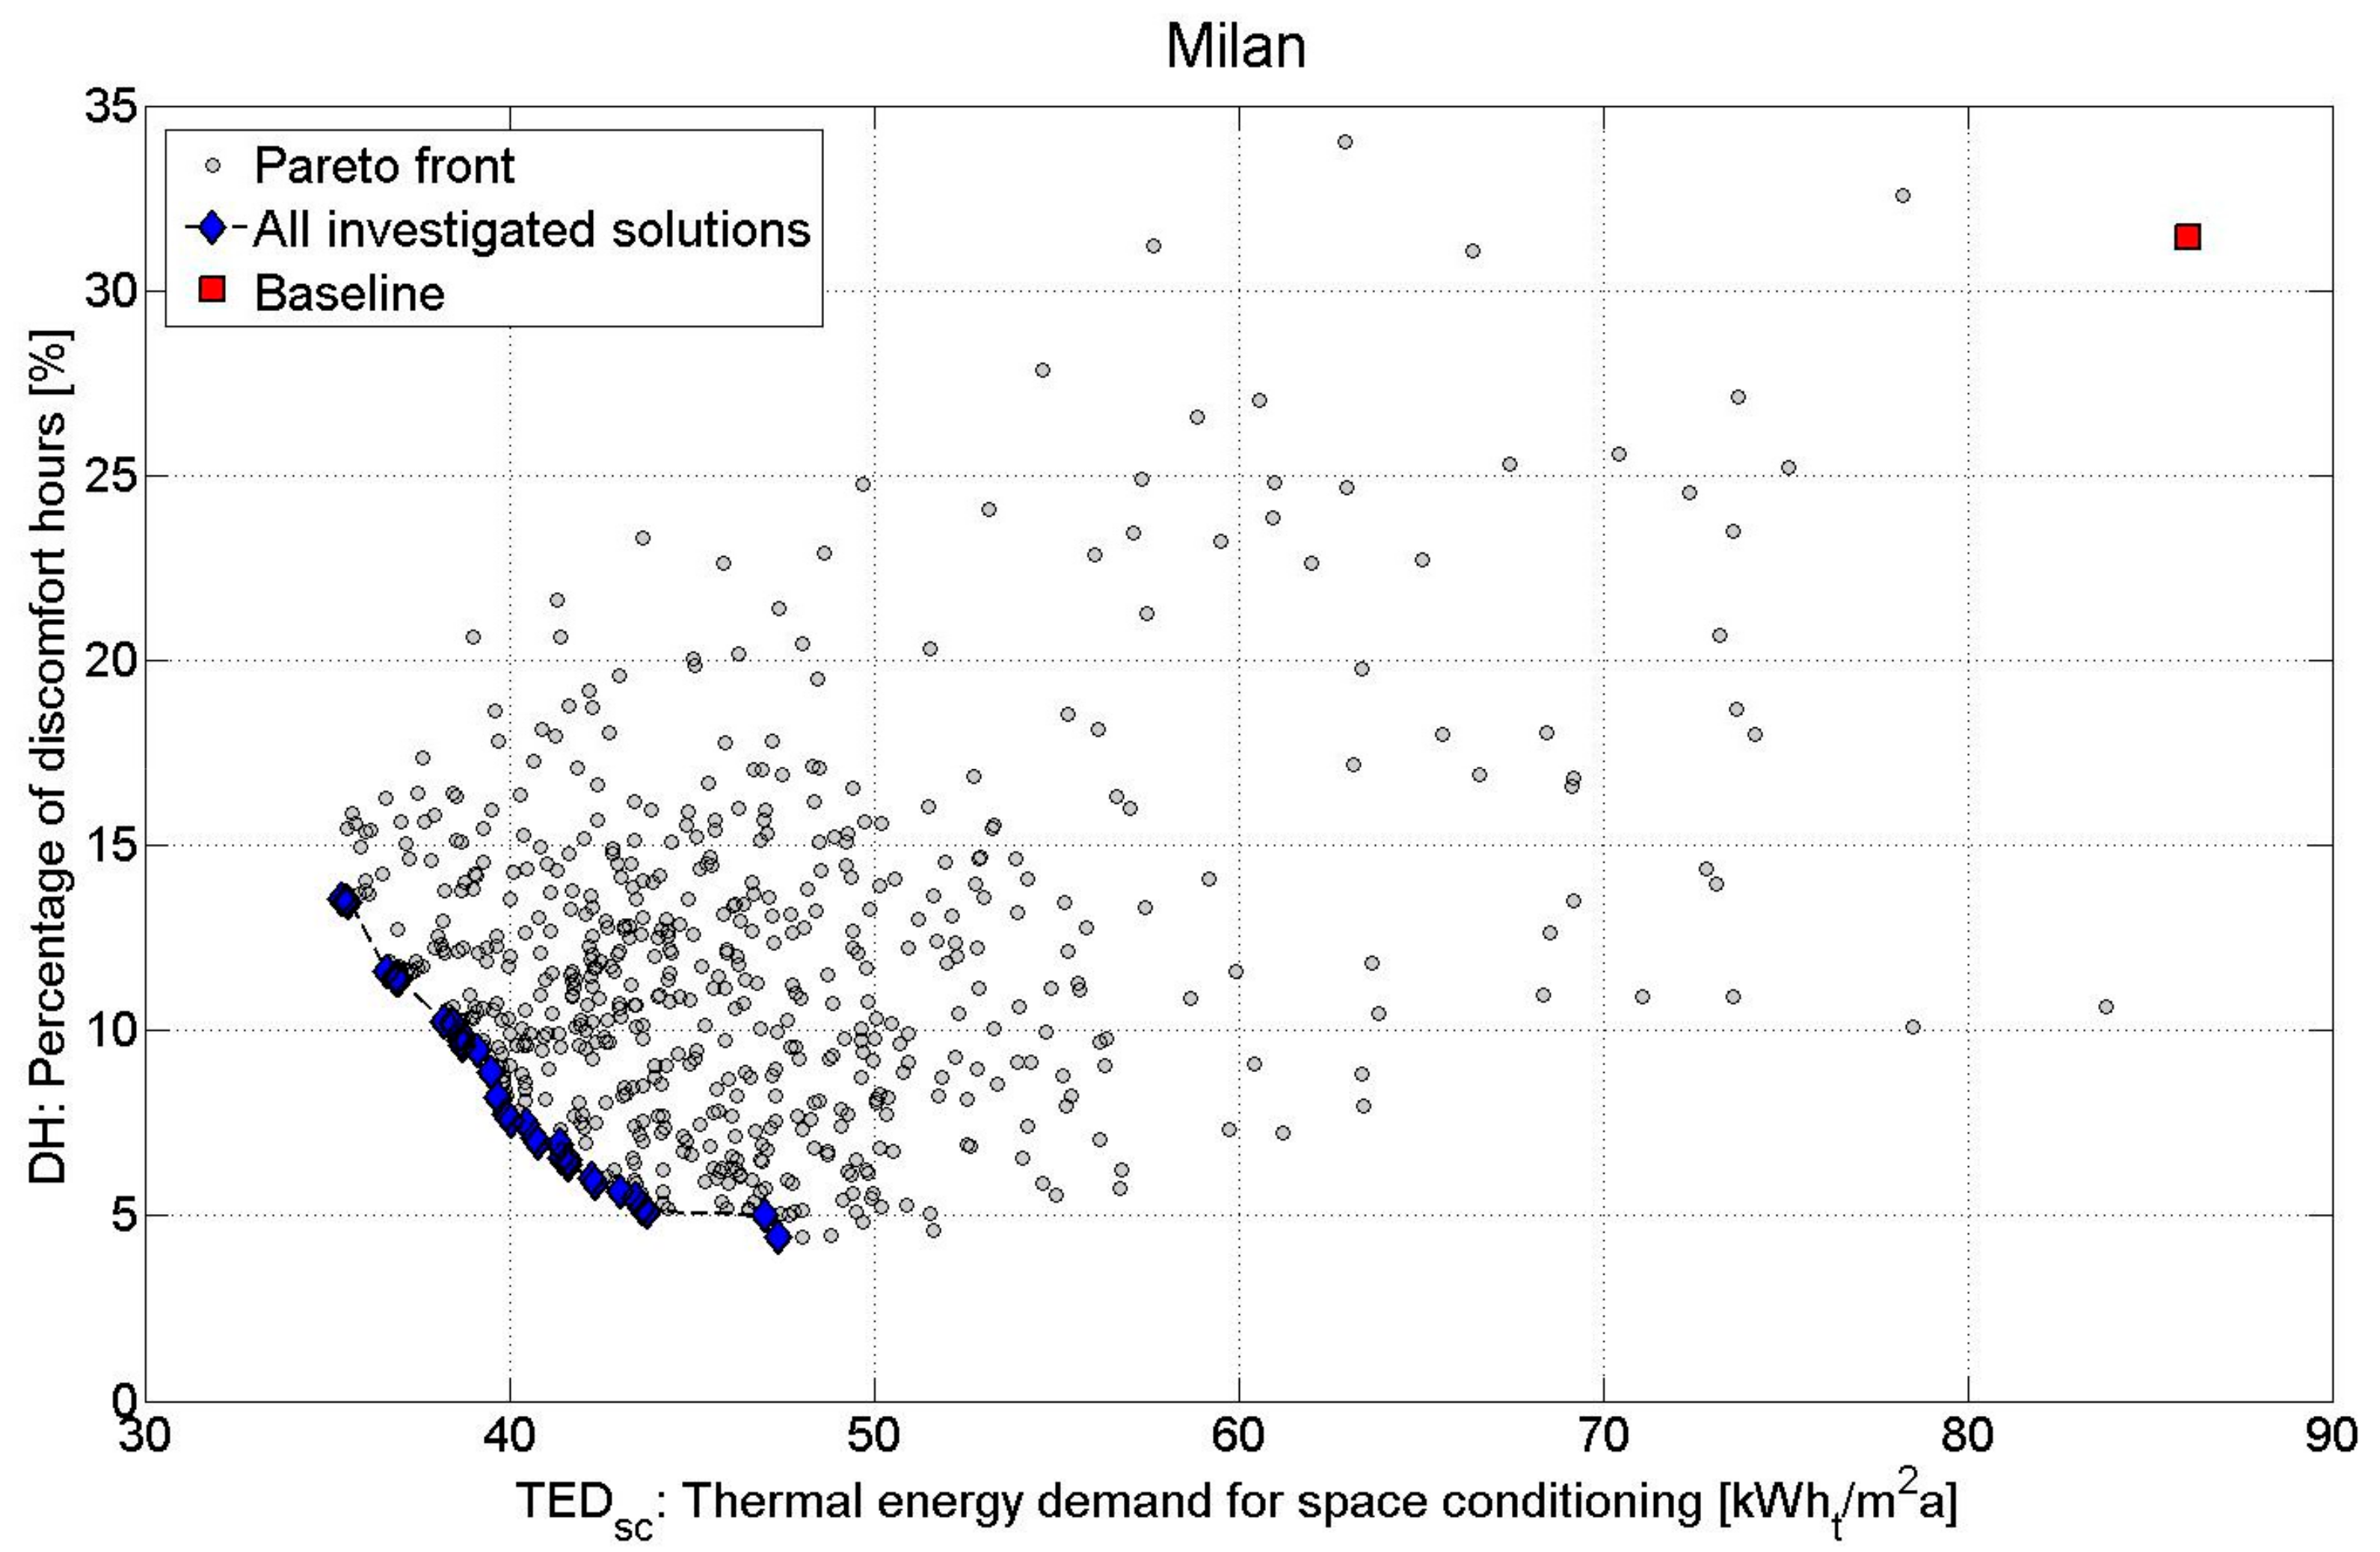
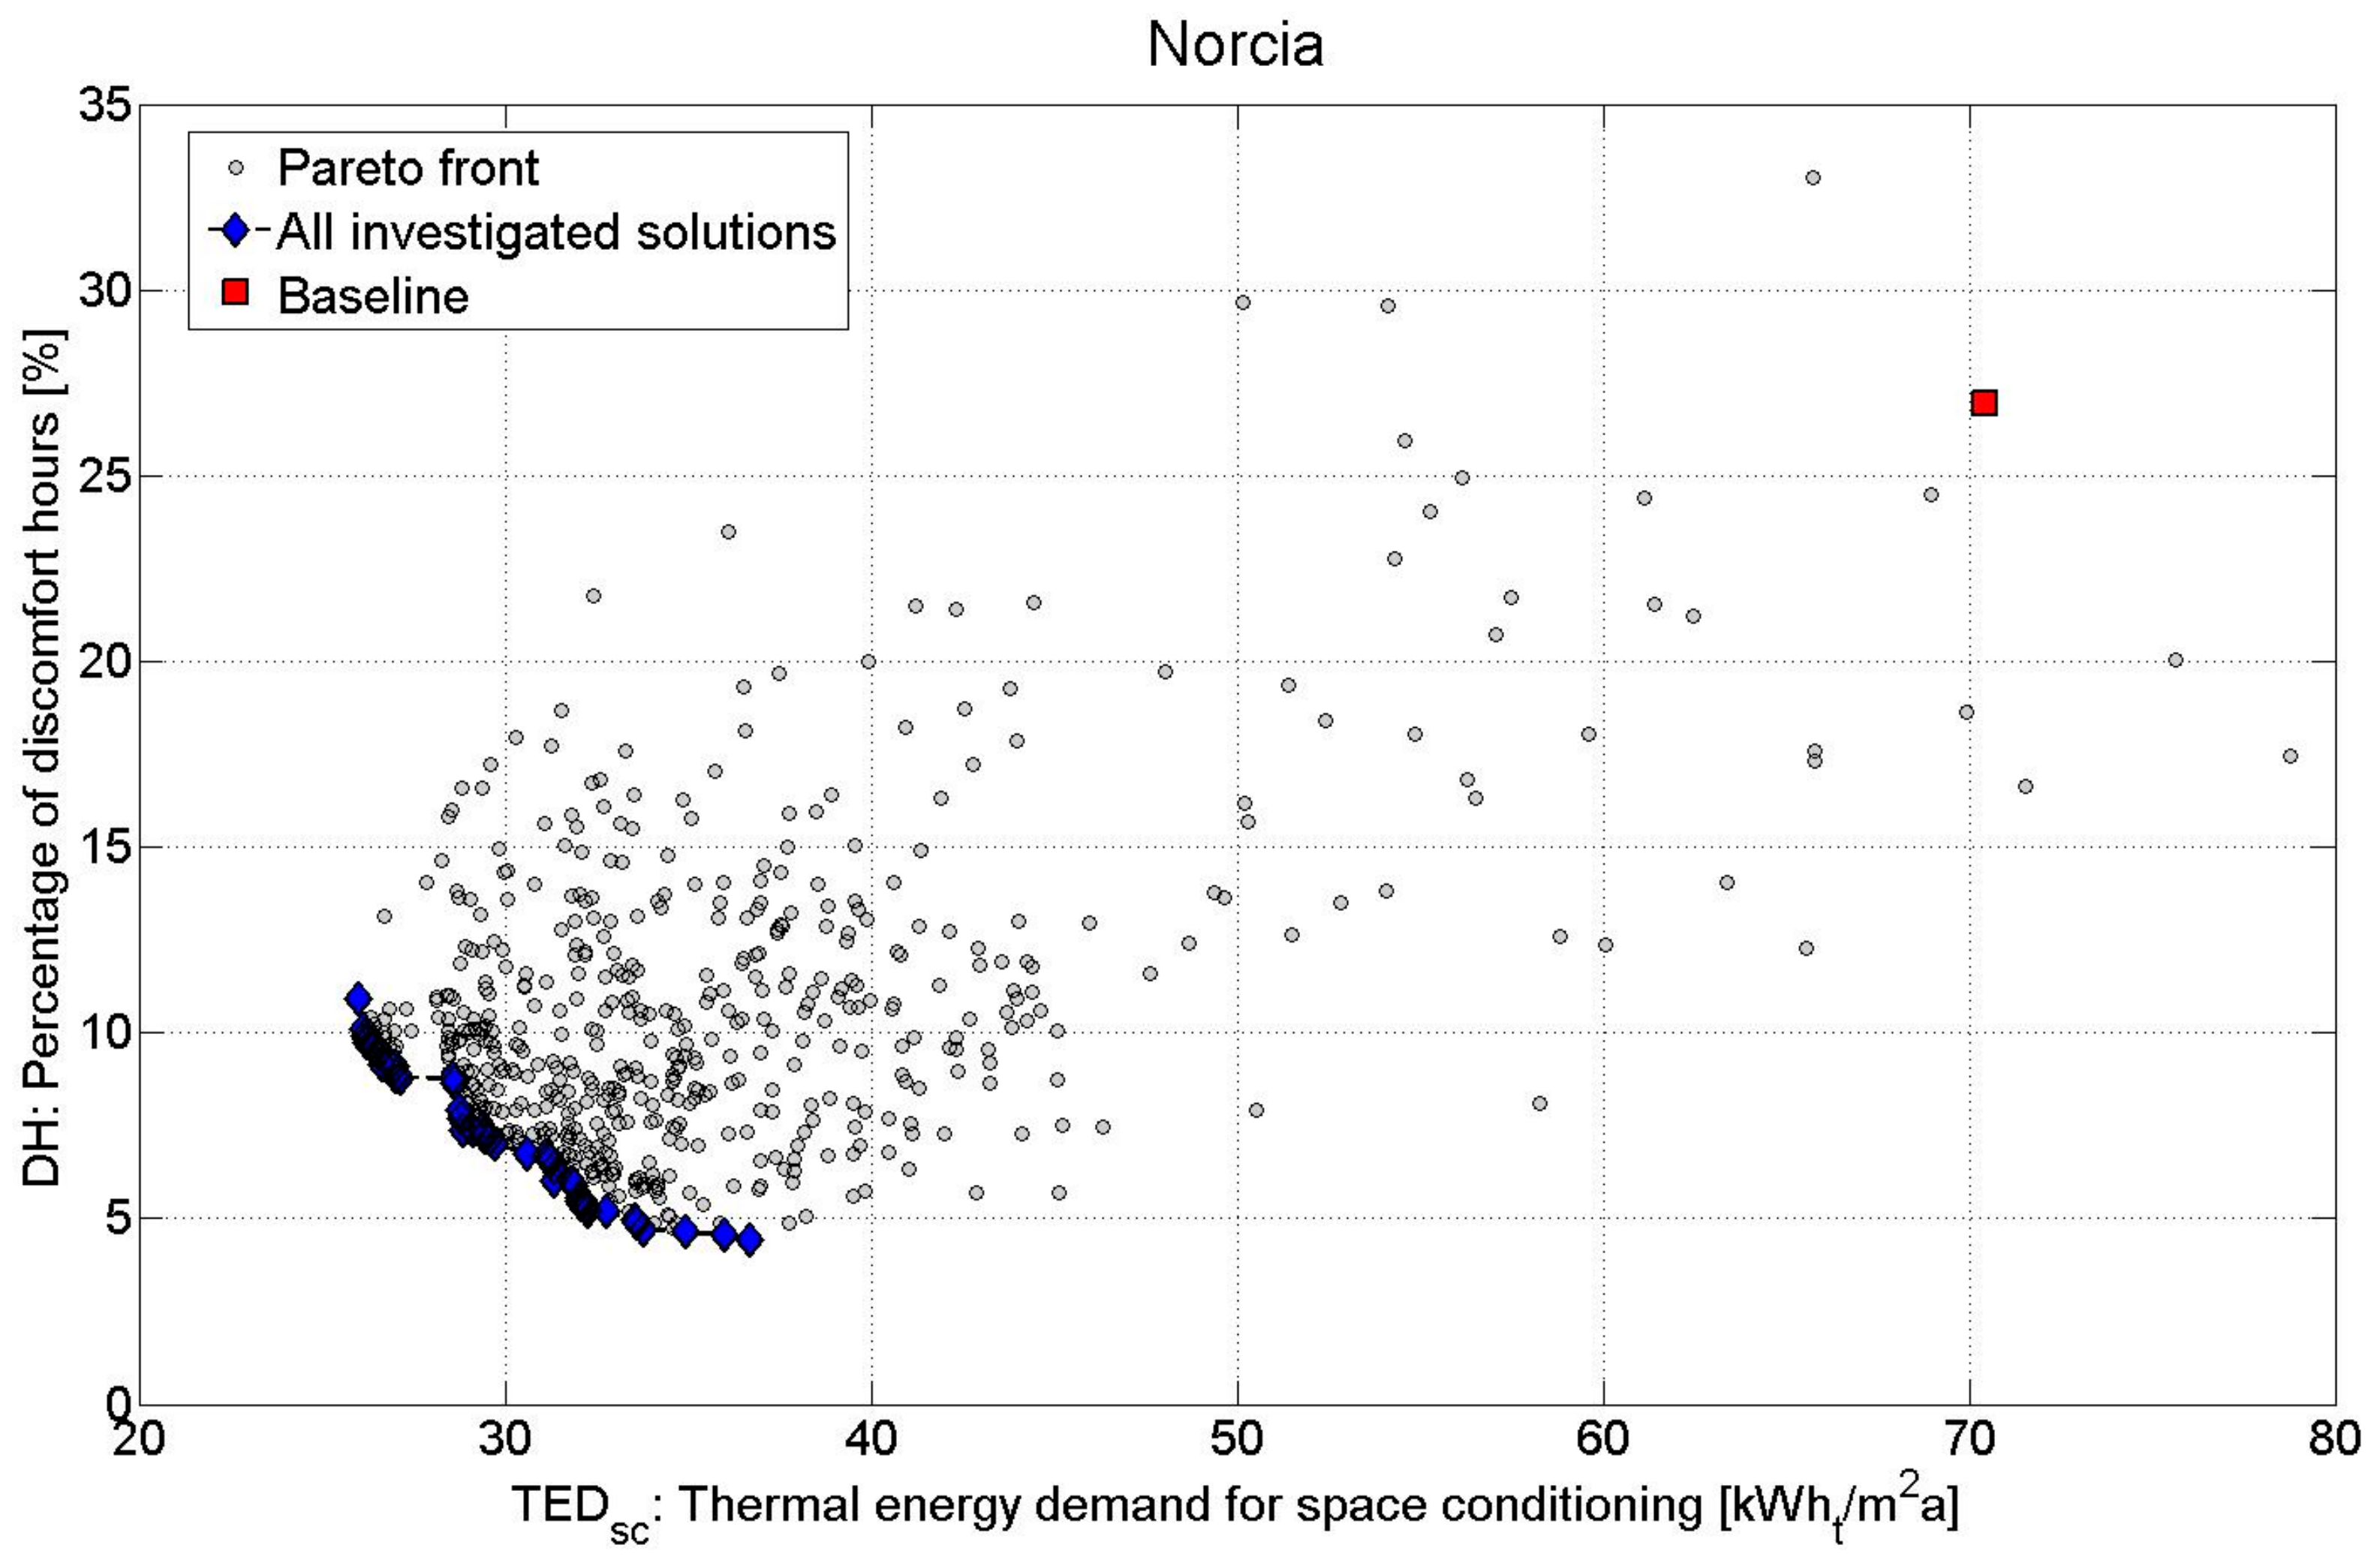
In the first stage of the optimization of building energy retrofit, the genetic algorithm (GA) is implemented in order to find optimal packages of ERMs addressed to the building envelope and to the variation of set point temperatures. The objective functions are the minimization of TEDsc and DH, whereas the design variables have been presented in Table 2. The GA provides the Pareto front, which is depicted in Figure 3 for Milan site and in in Figure 4 for Norcia site. The Pareto front related to Milan collects 35 non-dominated solutions, while the front related to Norcia collects 47 solutions. In both cases, all Pareto solutions provide values of DH lower than the baseline (DHB), and thus they are acceptable. It is noted that all Pareto solutions for both locations include the following ERMs:
  • 14 cm-thick thermal insulation of both external vertical walls and roof; and
  • installation of triple glazed windows.
Therefore, in all cases, the maximum levels of thermal insulation are implemented for both opaque and transparent building envelopes. This occurs because the heating demand is much higher than cooling demand for both locations, and therefore high levels of insulation are extremely effective and do not cause the risk of summer overheating for the considered (i.e., residential) use destination. It should be noticed that higher values of insulation thickness have not been considered because they would imply just a slight decrease of thermal transmittance, and furthermore the installation of too-thick insulation layers is hardly feasible from a practical perspective. The investment costs (IC) of the mentioned optimal ERMs for the envelope have been taken from direct quotations of suppliers. In particular, IC is set equal to 50.8 €/m2 for the 14 cm-thick thermal insulation and to 290 €/m2 for triple-glazed windows.
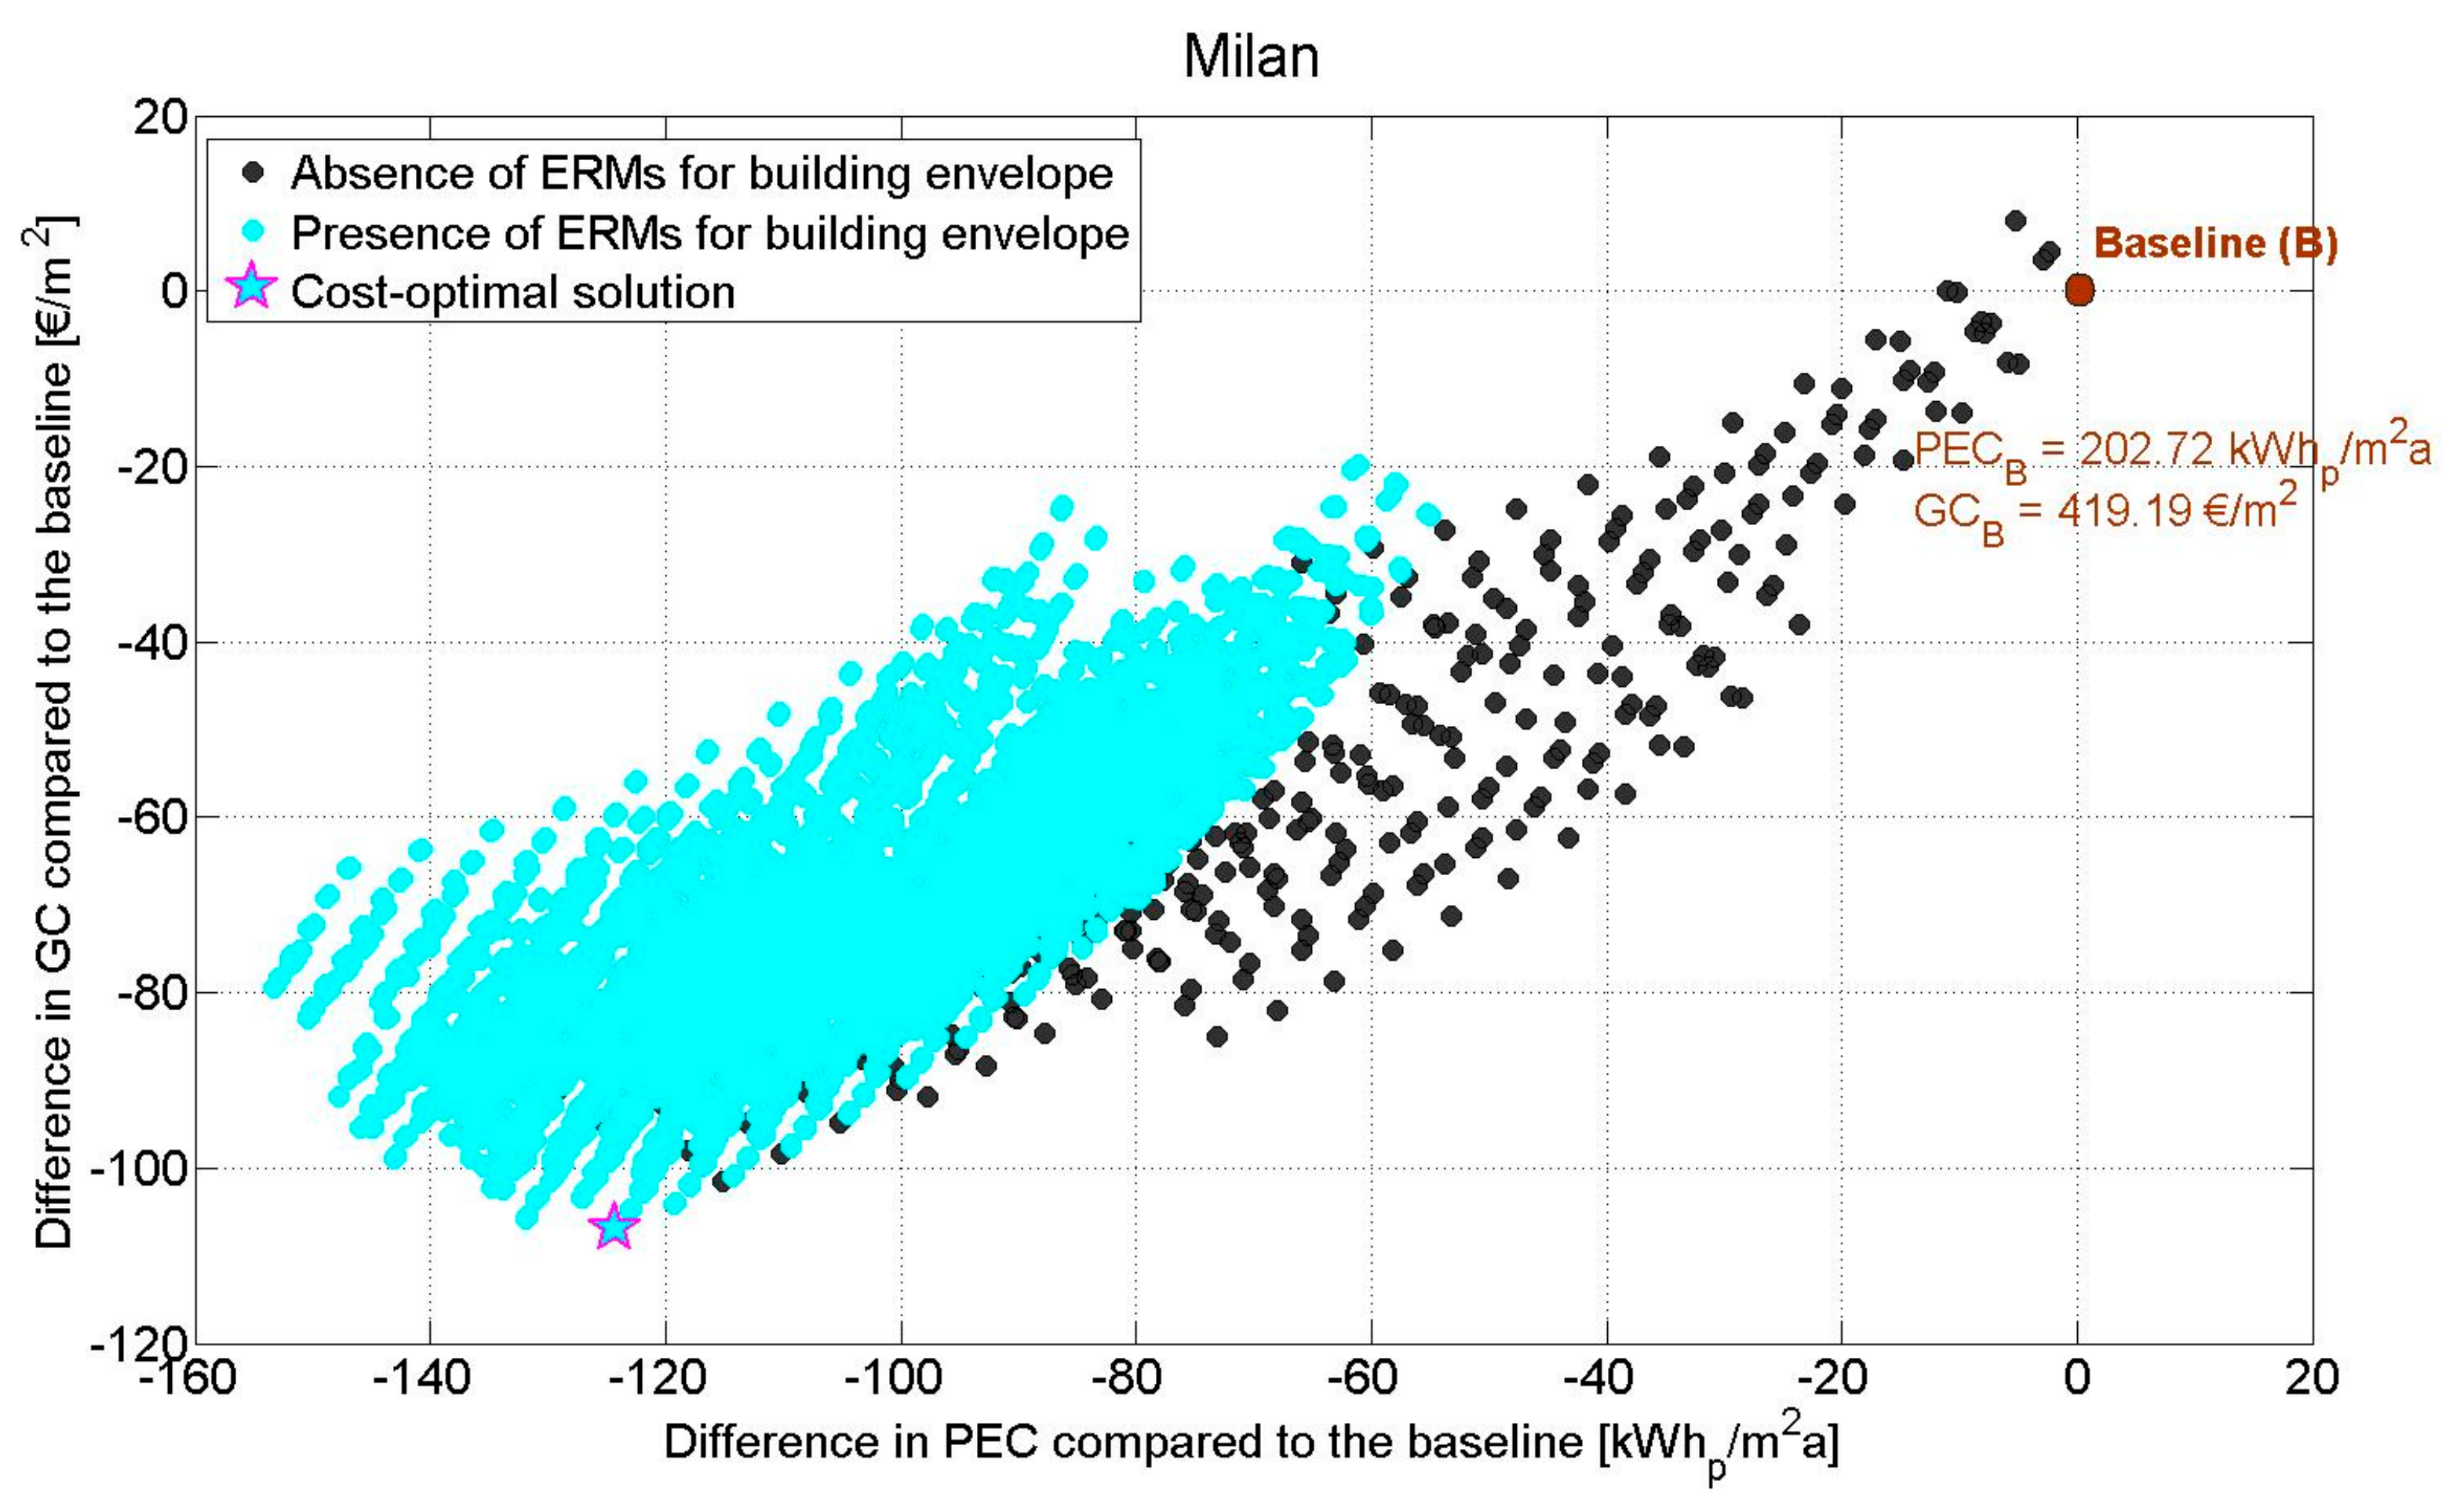
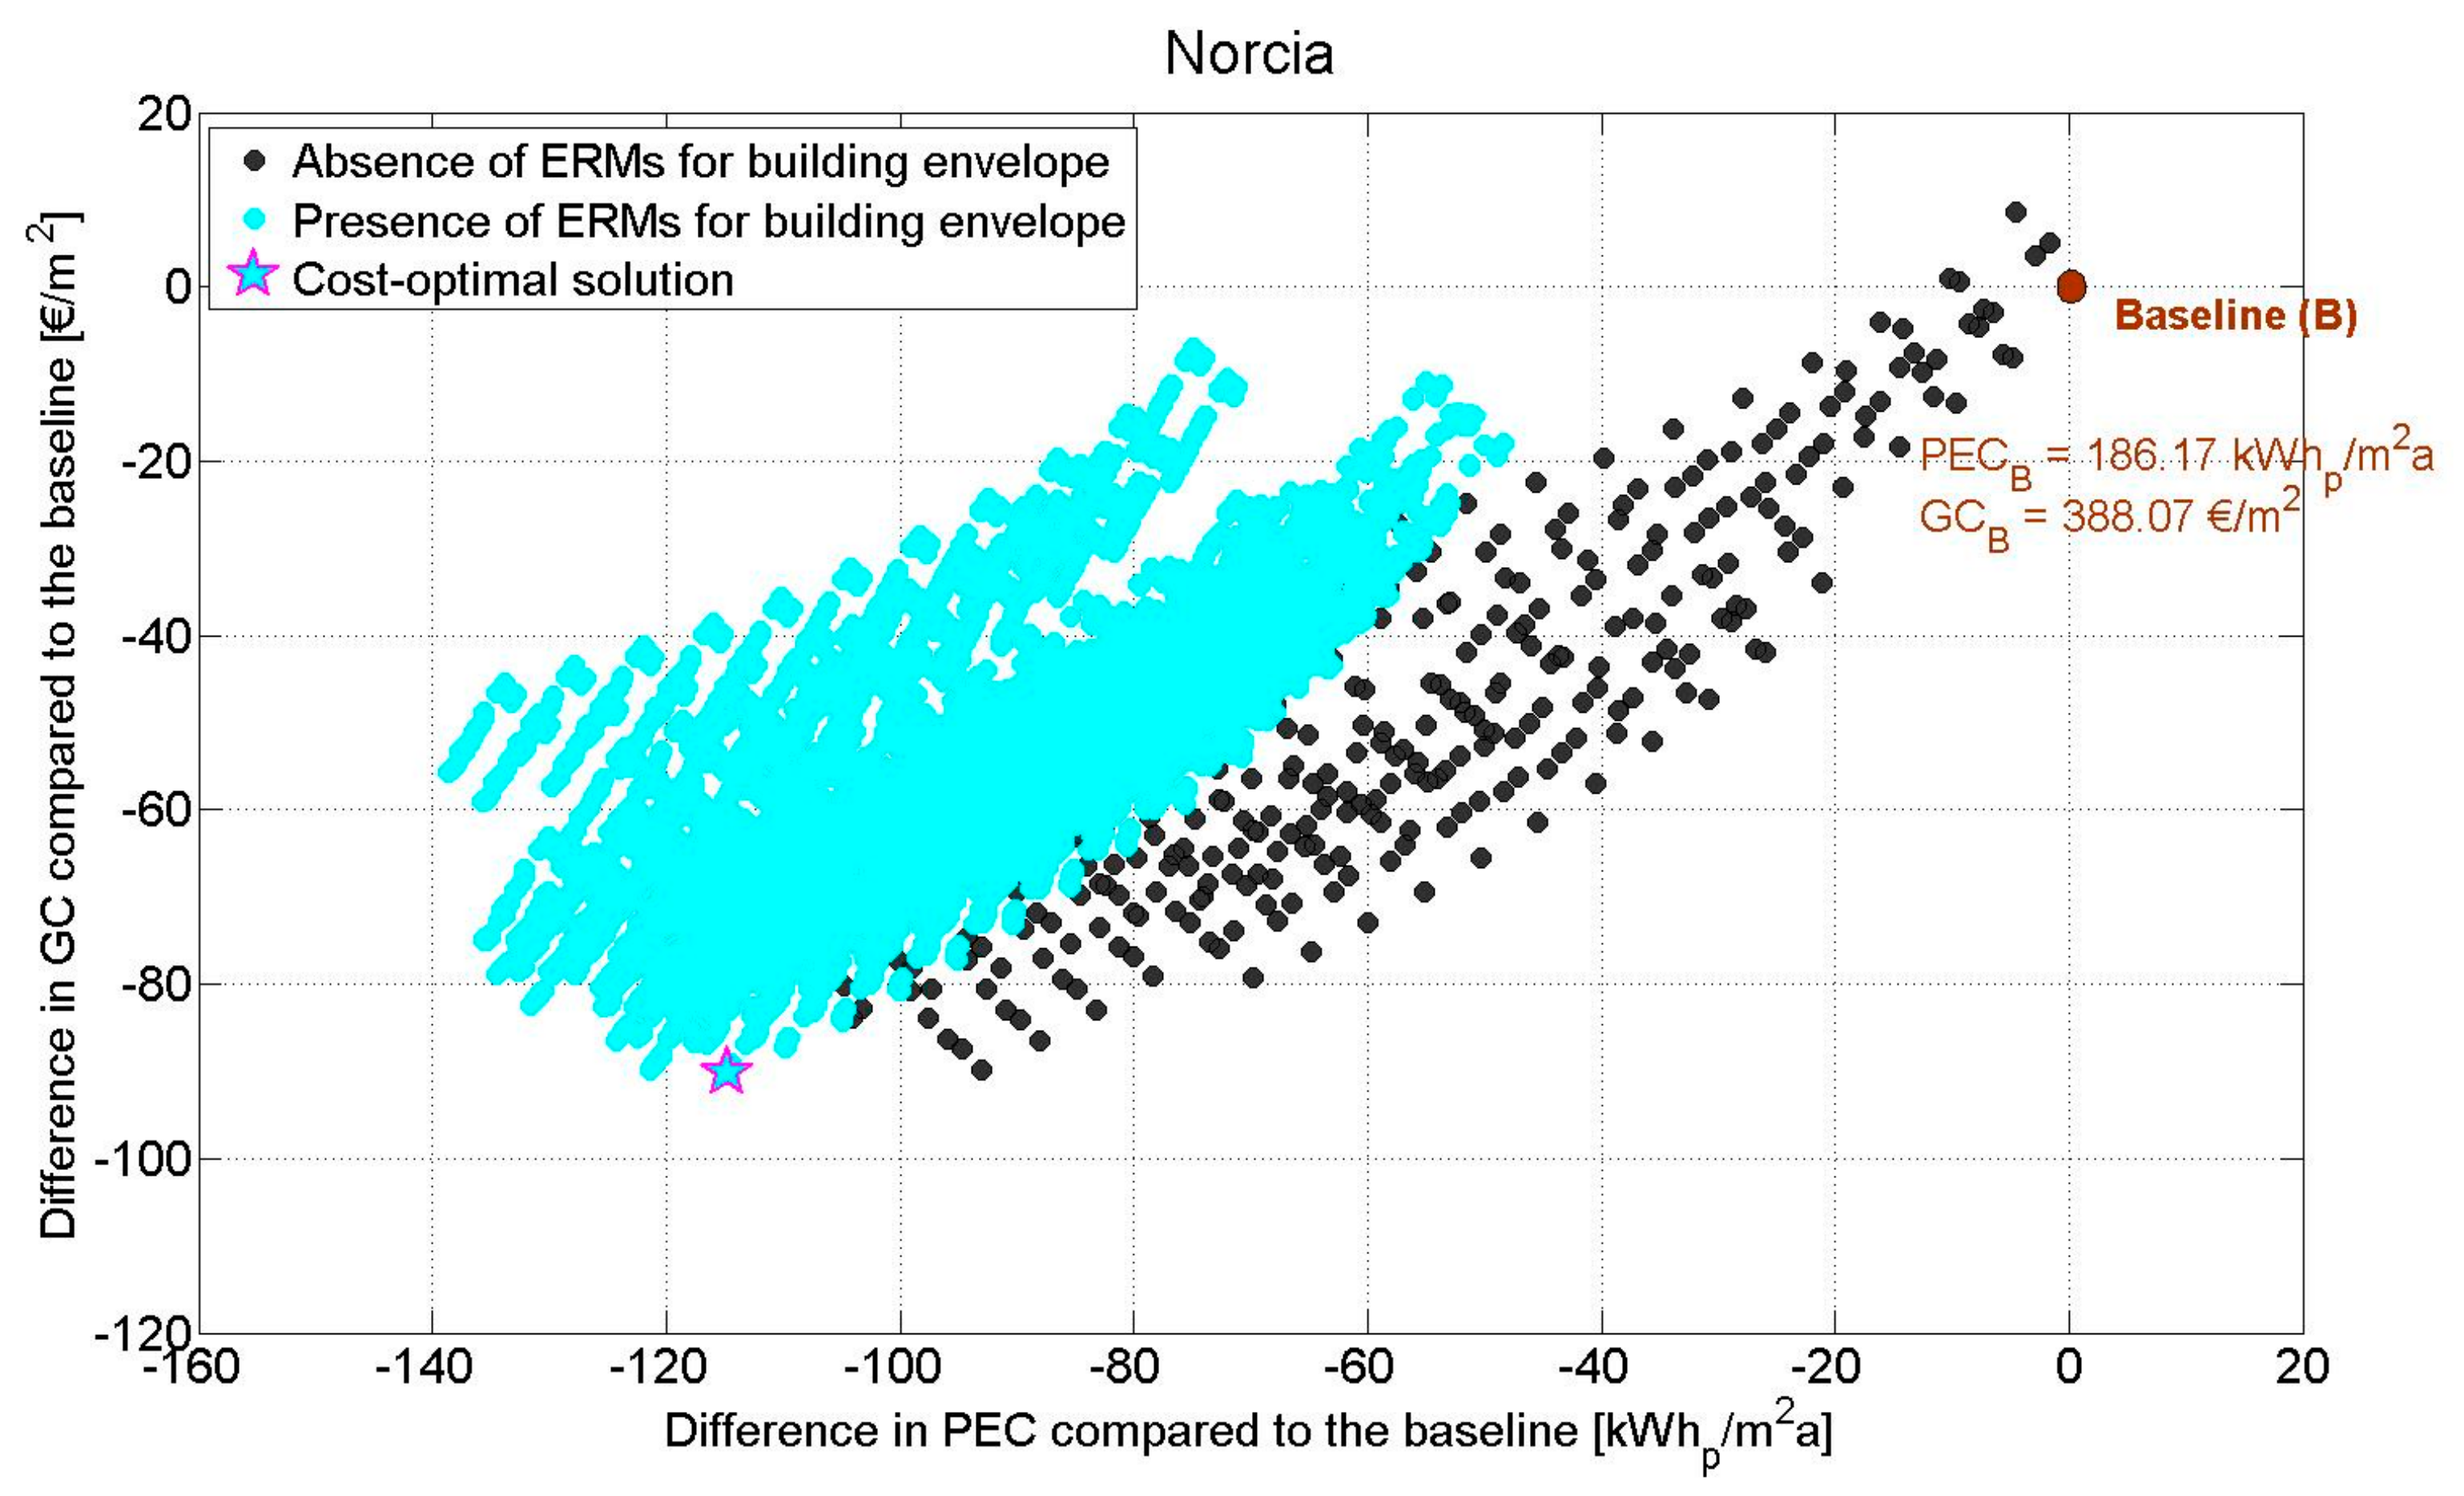
The GA allows finding optimal packages of ERMs for the reduction of TEDsc and DH. Then, the second stage of the methodology is performed in order to consider also the implementation of new efficient primary energy systems (see Table 3). Thus, the smart sampling is carried out under MATLAB® environment. The total number of explored retrofit scenarios is given by the product of (Pareto solutions + 1) and (combinations of energy systems), where 1 is added to the number of Pareto solutions because the ERMs for energy systems are examined also in absence of ERMs for the building envelope and for the variation of set point temperatures. Hence, the total number of explored scenarios is equal to 10,584 for Milan and 14,112 for Norcia. Considering that the investigation of each scenario requires a MATLAB® assessment, which takes around 1 s, the total computational time needed by Stage 2 for both locations is around seven hours. For each scenario, the differences of PEC (denoted as dPEC) and GC (denoted as dGC), compared to the baseline, are evaluated thereby achieving the cost-optimal curves represented in Figure 5 for Milan and Figure 6 for Norcia. The star markers indicate the cost-optimal packages of ERMs, which are characterized in Table 7.
The outcomes about cost-optimality follow energy and economic considerations. As aforementioned, the maximum levels of thermal insulation are implemented for both opaque and building envelopes because the heating load is much higher than the cooling one. The increment of envelope’s thermal resistance allows increasing the heat storage inside the building as well as the values of internal surface mean radiant temperatures. This yields an increase of occupants’ thermal comfort, and thus a decrease of DH compared to the baseline, even if a lower heating set point temperature (19 °C vs. 20 °C of baseline) and a higher cooling set point temperature (27 °C vs. 26 °C of baseline) are set. The value of external plasters’ solar absorptance (a) is higher for external walls compared to the roof in order to increase the absorption of solar radiation in the heating season (when radiation is a gain) and reduce such absorption in the cooling season (when radiation is a load). Indeed, in wintertime solar radiation is less perpendicular, and thus more impacting on the vertical walls, whereas in summertime is more perpendicular, and thus more impacting on the roof. As concerns the energy systems, the condensing boiler is preferred to the air-source electric heat pump, because the low values of external temperature during wintertime for the considered sites cause a significant worsening of heat pumps’ performance. On the other hand, the condensing boiler is more cost-effective than the ground-source heat pump, given the much lower investment cost. No ERMs are implemented for cooling systems because of the low values of space cooling demand. In addition, the existing boiler for DHW production is not replaced because the proposed solution does not imply a substantial increase of energy efficiency and incentives are not available for this solution. Lastly, a full-roof PV system is installed because the overall electricity demand of the building is significant, and thus photovoltaic panels are extremely cost-effective, as also shown in [30].
Finally, Table 7 shows that the cost-optimal energy retrofit solutions imply significant reductions of energy consumption, global cost and polluting emissions with reasonable discounted payback times, slightly higher than ten years. The benefits are higher for Milan site because the baseline is characterized by higher energy consumption, and thus there are larger opportunities of energy and cost savings. It is highlighted that, for both locations, the cost-optimal solutions make the building very close to the standard of nearly zero energy building (nZEB).
In order to assess the seismic economic loss of the retrofitted building, it is important to highlight how energy retrofit solutions have been related to the fragility models and to the damage analysis step of the loss assessment procedure. Table 8 shows schematically the influence of the retrofit energy solutions on the seismic loss assessment.
Once the cost-optimal energy retrofit solutions is estimated, it is possible to assess the seismic economic loss of the retrofitted structure and the influence of the energy retrofit measures of these losses. The results are reported in Table 9.
Furthermore, Table 10 shows the increment of the expected annual losses for both locations in order to assess the influence of the cost-optimal energy retrofit on seismic losses. Results are reported in terms of percentage and cost (in €) increases, and are displayed for each force pattern along with the resulting average values.
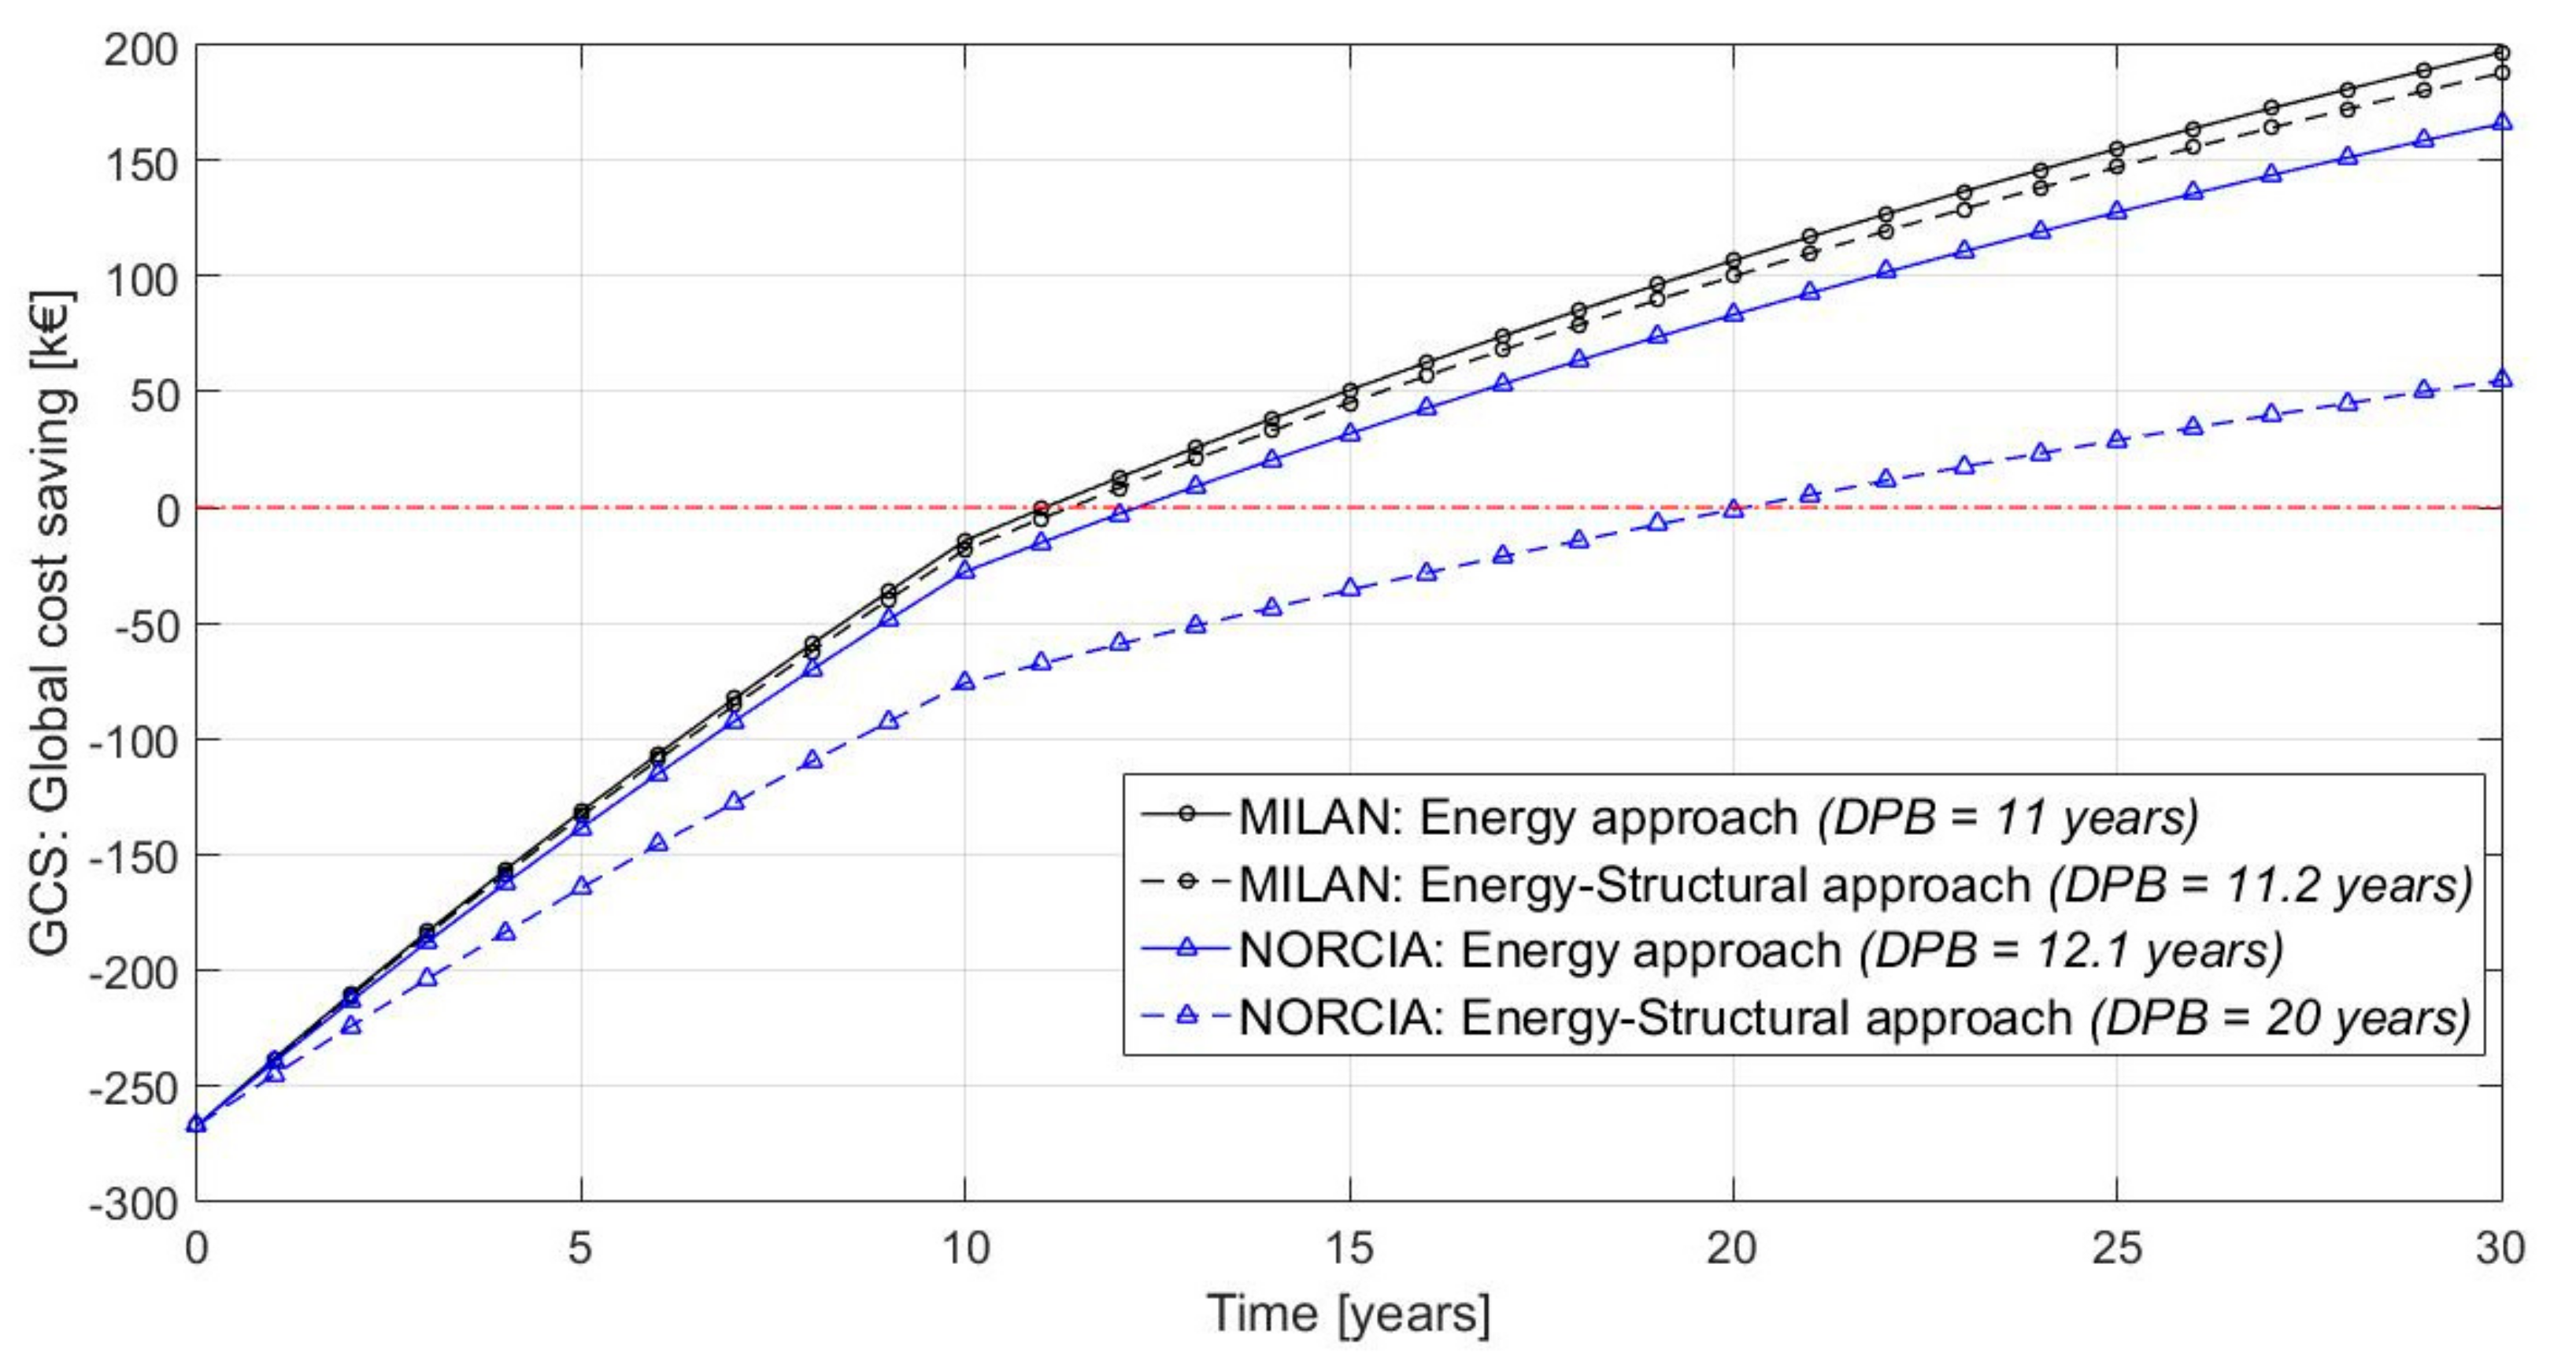
Finally, it is clear that the implementation of the cost-optimal energy retrofit strategies exert different economic impacts depending on the location of the existing building. As is obvious, the energy retrofit requires an initial investment cost (IC), and, globally, during the building residual lifecycle, it turns into an economic benefit due to the reduction of global cost for energy uses (GC); however, at the same time, it causes an increase of expected economic losses (i.e., EALs) linked to the seismic risk. In particular, the proposed energy retrofit causes a maximum increase of EAL, assessed in the worst seismic scenario, equal to 460 €/a for Milan and to 5670 €/a for Norcia. Clearly, this increment is more significant for Norcia because this location is characterized by higher seismic risk. Definitely, as shown in Figure 7, the potential global cost savings (GCS) produced by the retrofit solutions decrease when the coupled energy-structural approach is used considering the seismic economic losses in global cost assessment. On the other hand, the use of a merely energy approach, which does not consider seismic losses, could imply an overestimation of economic benefits over building lifecycle.
Figure 7 allows the assessment of the global effectiveness of the identified robust cost-optimal retrofit strategies; these latter were obtained by using the proposed multi-step approach that integrates energy and structural considerations. From an overall perspective, the retrofit strategies mentioned above are cost-effective for both Milan and Norcia sites because, in both cases, they yield positive values of global cost saving (GCS) with discounted payback times (DPB) between 11 and 20 years. However, if the coupled energy-structural approach is used instead of the merely energy one, the economic benefits decrease, as detailed below:
  • for Milan, the final GCS changes from 197.05 k€ to 188.94 k€, and the DPB from 11 to 11.2 years; and
  • for Norcia, the final GCS changes from 166.12 k€ to 54.98 k€, and the DPB from 12.1 to 20 years.
The outcomes show that, for similar climatic conditions, the level of seismic risk highly affects the effectiveness of the initial investment for energy retrofit, which is much lower for Norcia site. In this regard, the potential GCS may be too meager for prompting building owners/occupants to implement building energy retrofit. In other words, the economic benefit could be not sufficient to overcome the “status quo” bias. Therefore, in this case, building energy retrofit should be combined with seismic retrofit measures in order to reduce the seismic economic losses. This issue will be handled in future studies, which will focus on the integrated optimization of energy and seismic retrofit by means of a lifecycle approach.

5. Conclusions

The present study has proposed an original multi-step approach aiming to reliably design building energy retrofit by also considering expected economic losses due to the seismic risk. This methodology is novel in the context of sustainability evaluation of retrofit interventions on existing buildings since it integrates energy optimization with the analysis of structural performance over building lifecycle. Thus, it takes account of both energy and structural aspects linked to building energy retrofit by means of an economic lifecycle approach. In particular, the following main steps have been implemented in the methodological approach:
  • Step (1): The energy retrofit is optimized by performing a multi-stage procedure, which implements a genetic algorithm and a smart research strategy in order to find a robust cost-optimal solution.
  • Step (2): Seismic economic losses are quantified for the “as-built” existing building throughout its lifetime.
  • Step (3): Energy and structural aspects are integrated by associating the cost-optimal energy measures—identified in Step (1)—to the structural performance of building components.
  • Step (4): The analysis of Step (2) is conducted in presence of the cost-optimal energy retrofit solutions in order to assess the lifecycle economic impact of seismic risk on optimal energy retrofit.
The outcomes of the approach can address the selection of proper energy retrofit measures by considering the overall cost-effectiveness of the retrofit itself. Furthermore, they entail the integration of energy and structural retrofit measures in order to minimize the global cost (or, more in general, to optimize other sustainability parameters) linked to building refurbishment.
The methodology has been applied to an Italian multi-story residential building by considering two different locations, namely Milan and Norcia. The results have demonstrated that, for similar climatic conditions, the level of seismic risk has a strong influence on the effectiveness of the energy retrofit investment. Indeed, the potential economic benefit deriving from energy savings might be not sufficient to overcome the increase of expected seismic economic losses after energy retrofit in the case of vulnerable existing buildings. In particular, if the proposed coupled energy-structural approach is used instead of the merely energy one—i.e., only Step (1)—the economic benefits decrease depending on the location. For Milan site, the global cost saving changes from 197.05 k€ to 188.94 k€, and the DPB from 11 to 11.2 years. For Norcia site, the global cost saving changes from 166.12 k€ to 54.98 k€, and the DPB from 12.1 to 20 years.
Finally, the study has provided stimulating insights about building energy retrofit, which, in a wider sustainability perspective, should be combined with seismic retrofit measures in order to reduce the overall economic losses.

Acknowledgments

This study was presented at the 17th CIRIAF (the Inter-University Research Centre on Pollution and Environment “Mauro Felli”) Congress, which took place in S. Apollinare–Marsciano (Perugia) on 6–7 April 2017, and chosen for the Special Issue on this Journal. Compared to the original version (original title: “Influence of cost-optimal energy retrofit solutions on seismic economic losses of existing buildings”), the study has been enhanced. In this regard, the authors would like to thank the committee and team of the 17th CIRIAF Congress for their support in the publication process. Furthermore, the authors would like to mention and thank the project INTegrated and rEilable appRoAChes for susTainability aSsessment of existing buildings (INTERACTS), in which framework this research has been conducted.

Author Contributions

Gerardo Maria Mauro, Costantino Menna and Domenico Asprone defined the framework for the integrated approach adopted in the study; Gerardo Maria Mauro, Fabrizio Ascione, Nicola Bianco and Giuseppe Peter Vanoli set out the energy retrofit measures as well as the corresponding energy simulations and optimization. Umberto Vitiello, Costantino Menna, Domenico Asprone and Andrea Prota performed the structural analyses and the assessment of economic losses. Notably, the research was carried out by all authors through a synergic collaboration and continuous reciprocal feedbacks.

Conflicts of Interest

The authors declare no conflict of interest.

Nomenclature

Symbols
aabsorptance to solar radiation[-]
covpercentage of roof area covered by PV panels[-]
dEMdifference in EM compared to the baseline[kgCO2-eq/m2 a]
dGCdifference in GC compared to the baseline[€]
dPECdifference in PEC compared to the baseline[Whp/m2 a]
ethermal (infrared) emissivity[-]
tthickness of thermal insulation layer[m]
DHpercentage of discomfort hours[%]
DPBdiscounted payback time[years]
EMpolluting emissions[kgCO2-eq/m2 a]
EALexpected annual loss[€/a]
GCglobal cost[€/m2]
GCSglobal cost saving[€]
ICinvestment cost[€]
PECprimary energy consumption[Whp/m2 a]
PGApeak ground acceleration[m/s2]
SHGCsolar heat gain coefficient[-]
TEDthermal energy demand[Wht/m2 a]
Uthermal transmittance[W/m2 K]
Subscripts
Breferred to the baseline (as built configuration)
elreferred to electrical energy or power
preferred to primary energy or power
rreferred to the roof
screferred to space conditioning
treferred to thermal energy or power
vreferred to the external vertical walls
wreferred to the windows
Acronyms
DHWdomestic hot water
EDPengineering demand parameter
ERMenergy retrofit measure
GAgenetic algorithm
IMintensity measure
PVphotovoltaic
RESrenewable energy source

References

  1. Willard, B. The Sustainability Advantage—Seven Business Case Benefits of a Triple Bottom Line; New Society: British Columbia, BC, Canada, 2002. [Google Scholar]
  2. Menna, C.; Asprone, D.; Jalayer, F.; Prota, A.; Manfredi, G. Assessment of ecological sustainability of a building subjected to potential seismic events during its lifetime. Int. J. Life Cycle Assess. 2013, 18, 504–515. [Google Scholar] [CrossRef]
  3. Asadi, E.; Da Silva, M.G.; Antunes, C.H.; Dias, L. Multi-objective optimization for building retrofit strategies: A model and an application. Energy Build. 2012, 44, 81–87. [Google Scholar] [CrossRef]
  4. Ascione, F.; Bianco, N.; de Stasio, C.; Mauro, G.M.; Vanoli, G.P. A new methodology for cost-optimal analysis by means of the multi-objective optimization of building energy performance. Energy Build. 2015, 88, 78–90. [Google Scholar] [CrossRef]
  5. Kanapeckiene, L.; Kaklauskas, A.; Zavadskas, E.K.; Raslanas, S. Method and system for multi-attribute market value assessment in analysis of construction and retrofit projects. Expert Syst. Appl. 2011, 38, 14196–14207. [Google Scholar] [CrossRef]
  6. Raslanas, S.; Alchimovienė, J.; Banaitienė, N. Residential areas with apartment houses: Analysis of the condition of buildings, planning issues, retrofit strategies and scenarios. Int. J. Strateg. Prop. Manag. 2011, 15, 152–172. [Google Scholar] [CrossRef]
  7. EnergyPlus, the Official Building Simulation Program of the United States Department of Energy. Available online: http://www.eere.energy.gov/buildings (accessed on 14 December 2016).
  8. MATLAB®-MATrixLABoratory (2010)—7.10.0. User’s Guide MathWorks. Available online: http://it.mathworks.com (accessed on 8 December 2016).
  9. Ascione, F.; Bianco, N.; de Masi, R.F.; Mauro, G.M.; Vanoli, G.P. Design of the building envelope: A novel multi-objective approach for the optimization of energy performance and thermal comfort. Sustainability 2015, 7, 10809–10836. [Google Scholar] [CrossRef]
  10. Ascione, F.; Bianco, N.; de Stasio, C.; Mauro, G.M.; Vanoli, G.P. Multi-stage and multi-objective optimization for energy retrofitting a developed hospital reference building: A new approach to assess cost-optimality. Appl. Energy 2016, 174, 37–68. [Google Scholar] [CrossRef]
  11. Fanger, P.O. Thermal Comfort. Analysis and Applications in Environmental Engineering; McGraw-Hill: New York, NY, USA, 1970. [Google Scholar]
  12. Deb, K. Multi-Objective Optimization Using Evolutionary Algorithms; John Wiley & Sons: Chichester, UK, 2001. [Google Scholar]
  13. European Commission and Parliament. Directive 2010/31/EU of the European Parliament and of the Council of 19 May 2010 on the Energy Performance of Buildings (EPBD Recast); European Commission and Parliament: Brussels, Belgium, 2010. [Google Scholar]
  14. European Commission. Commission Delegated Regulation (EU) No 244/2012 of 16 January 2012 Supplementing Directive 2010/31/EU of the European Parliament and of the Council on the Energy Performance of Buildings; European Commission: Brussels, Belgium, 2012. [Google Scholar]
  15. Vitiello, U.; Asprone, D.; Di Ludovico, M.; Prota, A. Life-cycle cost optimization of the seismic retrofit of existing RC structures. Bull. Earthq. Eng. 2016. [Google Scholar] [CrossRef]
  16. Aslani, H.; Miranda, E. Probabilistic Earthquake Loss Estimation and Loss Disaggregation in Buildings; Report No. 157; Department of Civil and Environmental Engineering, Stanford University: Stanford, CA, USA, 2005. [Google Scholar]
  17. Goulet, C.A.; Haselton, C.B.; Mitrani-Reiser, J.; Beck, J.L.; Deierlein, G.G.; Porter, K.A.; Stewart, J.P. Evaluation of the seismic performance of a code-conforming reinforced-concrete frame building—From seismic hazard to collapse safety and economic losses. Earthq. Eng. Struct. Dyn. 2007, 36, 1973–1997. [Google Scholar] [CrossRef]
  18. Fajfar, P. Capacity spectrum method based on inelastic demand spectra. Earthq. Eng. Struct. Dyn. 1999, 28, 979–993. [Google Scholar] [CrossRef]
  19. NTC (2008) NTC, Norme Tecniche per le Costruzioni, D.M 14 Gennaio 2008. Available online: http://www.camera.it (accessed on 8 December 2016).
  20. Decree of the President of the Republic (DPR) 26 agosto 1993. n. 412, Regolamento recante norme per la progettazione, l’installazione, l’esercizio e la manutenzione degli impianti termici degli edifici ai fini del contenimento dei consumi di energia, in attuazione dell’art. 4, comma 4, della L. 9 gennaio 1991. Available online: http://efficienzaenergetica.acs.enea.it (accessed on 5 December 2016). (In Italian).
  21. Mauro, G.M.; Hamdy, M.; Vanoli, G.P.; Bianco, N.; Hensen, J.L.M. A new methodology for investigating the cost-optimality of energy retrofitting a building category. Energy Build. 2015, 107, 456–478. [Google Scholar] [CrossRef]
  22. Italian Government. Law December 28, 2015, n. 208 (“Legge di stabilità 2016”); Italian Government: Rome, Italy, 2015. Available online: http://www.gazzettaufficiale.it (accessed on 6 December 2016). (In Italian)
  23. Italian Government Decree, Decreto interministeriale 26 giugno 2015, Applicazione delle metodologie di calcolo delle prestazioni energetiche e definizione delle prescrizioni e dei requisiti minimi degli edifici. Italian Government: Rome, Italy, 2015. Available online: http://www.sviluppoeconomico.gov.it (accessed on 6 December 2016). (In Italian)
  24. Technical Annex to the SEAP Template Instructions Document: THE EMISSION FACTORS. Available online: https://www.eumayors.eu/index_en.html (accessed on 20 December 2016).
  25. EnergyPlus Weather Data. Available online: https://energyplus.net/weather (accessed on 14 December 2016).
  26. SAP2000, version 16; Computer and Structures: Berkeley, CA, USA.
  27. European Standard. Eurocode 8: Design of Structures for Earthquake Resistance–Part 3: Assessment and Retrofitting of Buildings (Ref. No. EN 1998-3: 2005: E); European Committee for Standardizations (CEN): Brussels, Belgium, 2004. [Google Scholar]
  28. Pagni, C.A.; Lowes, L.N. Fragility functions for older reinforced concrete beam-column joints. Earthq. Spectra 2006, 22, 215–238. [Google Scholar] [CrossRef]
  29. Ruiz-Garcia, J.; Negrete, M. Drift-based fragility assessment of confined masonry walls in seismic zones. Eng. Struct. 2009, 31, 170–181. [Google Scholar] [CrossRef]
  30. Ascione, F.; Bianco, N.; de Masi, R.F.; de Stasio, C.; Mauro, G.M.; Vanoli, G.P. Multi-objective optimization of the renewable energy mix for a building. Appl. Therm. Eng. 2016, in press. [Google Scholar] [CrossRef]
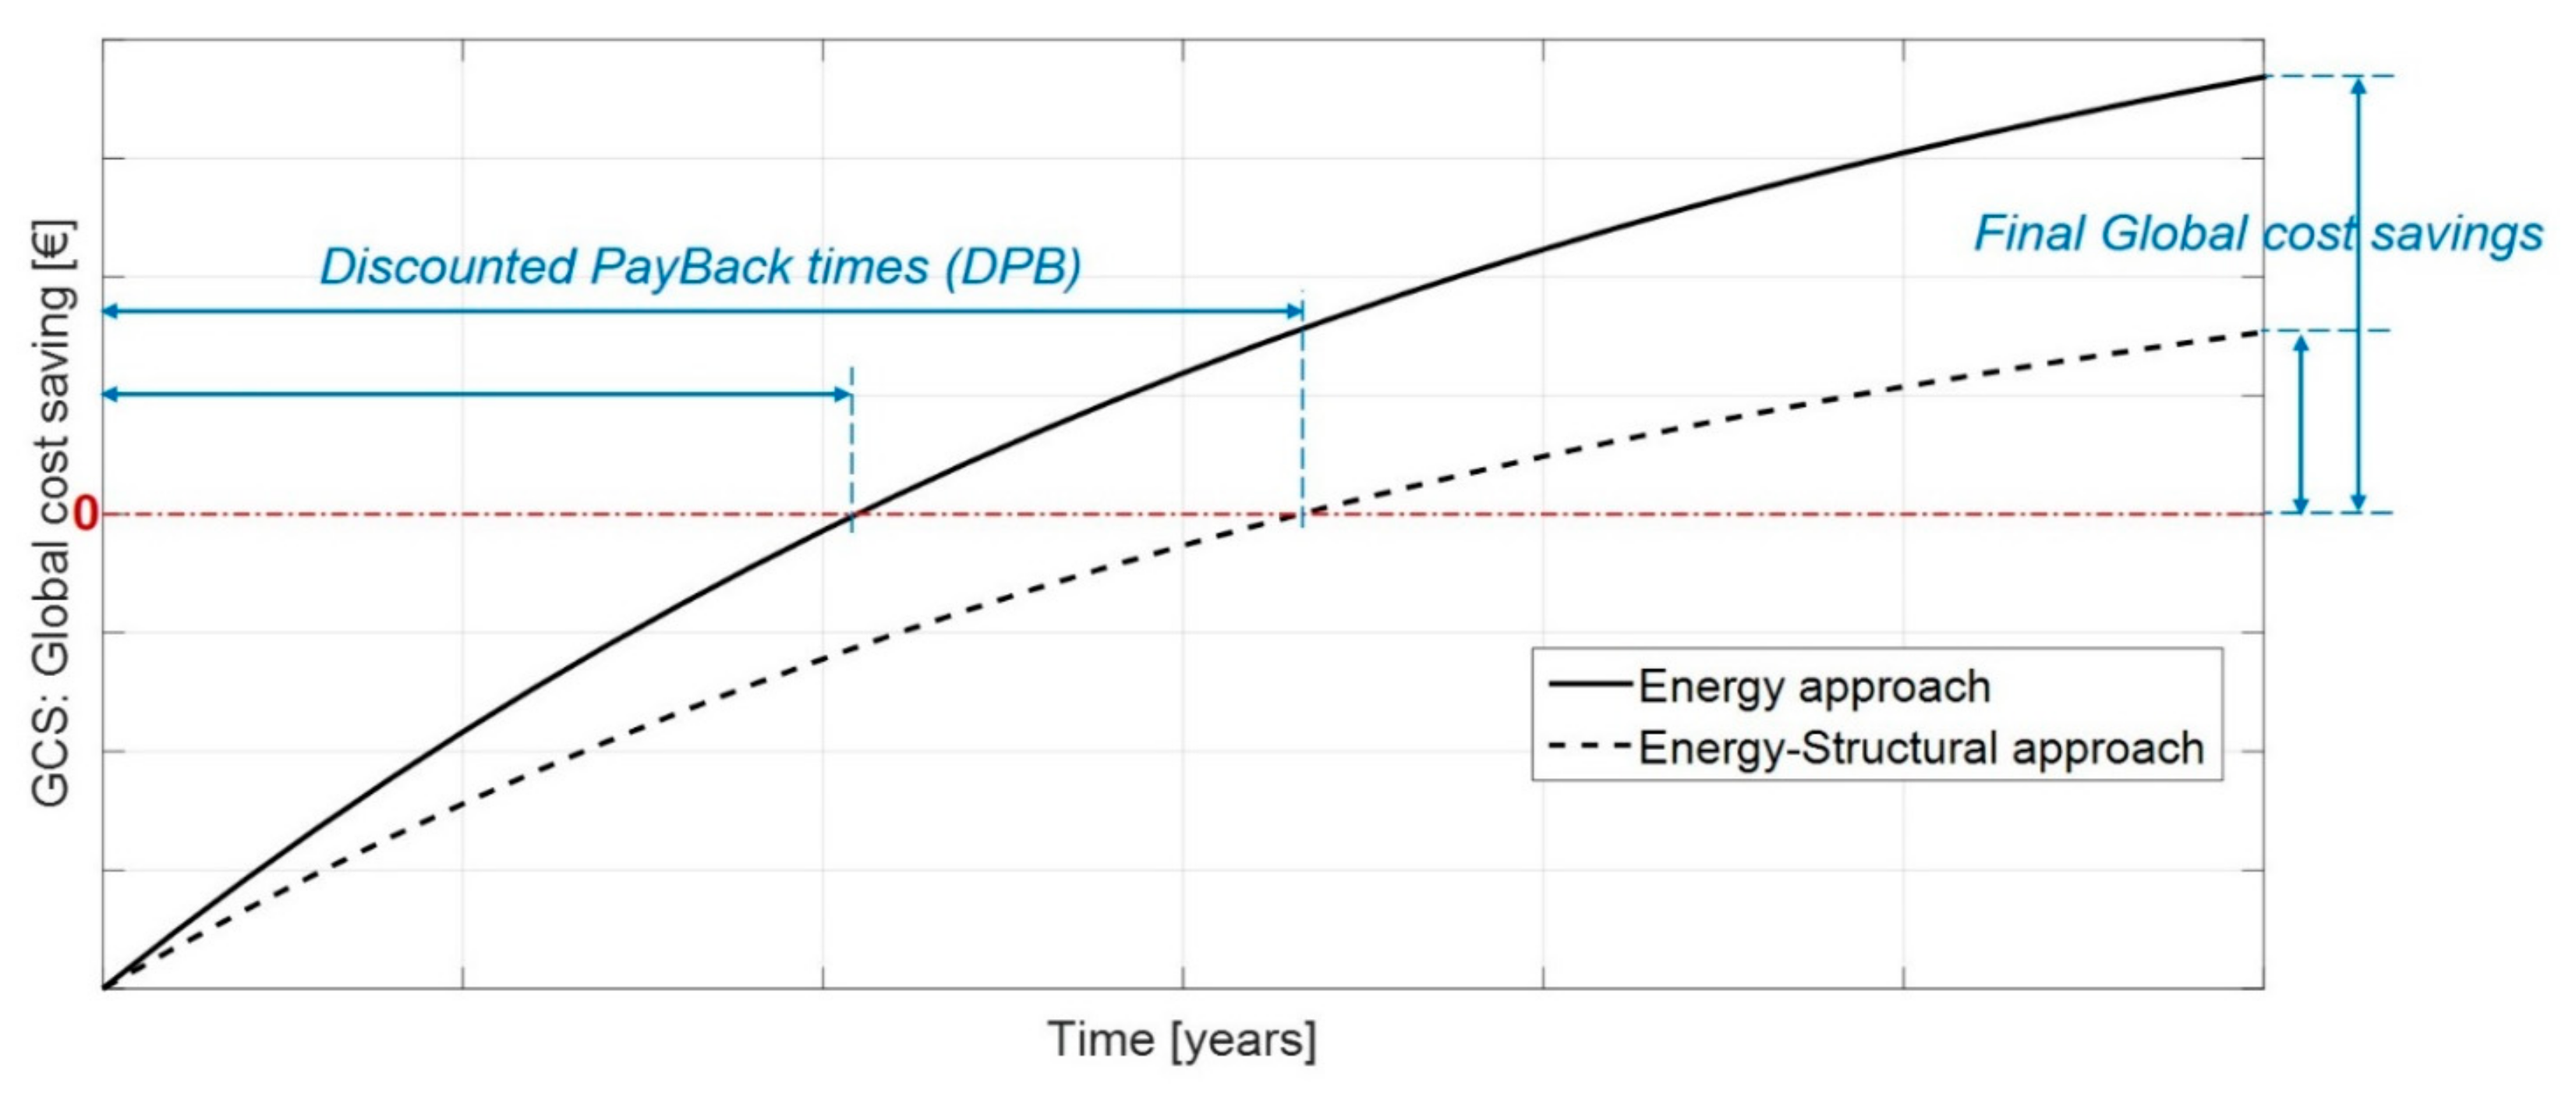
Figure 1. Qualitative trend of the global cost savings vs. time, generated by building energy retrofit.
Sustainability 09 00989 g001
Figure 2. Building geometry: (a) 3D view; and (b) plan view.
Sustainability 09 00989 g002
Figure 3. Optimization of the ERMs for the reduction of TEDsc and DH considering Milan as location.
Sustainability 09 00989 g003
Figure 4. Optimization of the ERMs for the reduction of TEDsc and DH considering Norcia as location.
Sustainability 09 00989 g004
Figure 5. Cost-optimal curve of building energy retrofit considering Milan as location.
Sustainability 09 00989 g005
Figure 6. Cost-optimal curve of building energy retrofit considering Norcia as location.
Sustainability 09 00989 g006
Figure 7. Temporal trend of the global cost saving produced by the cost-optimal energy retrofit solution considering seismic economic losses.
Sustainability 09 00989 g007
Table 1. Longitudinal and transverse reinforcement details.
ColumnsBeams in Y DirectionBeams in X Direction
First story0.50 × 0.30, LR *: 4Ø14,
TR *: Ø8/25 cm
0.60 × 0.30, LR: 4Ø22,
TR: Ø8/25 cm
0.35 × 0.24, LR: 4Ø14,
TR: Ø8/25 cm
Second story0.50 × 0.30, LR: 4Ø14,
TR: Ø8/25 cm
0.60 × 0.30, LR: 4Ø22,
TR: Ø8/25 cm
0.35 × 0.24, LR: 4Ø14,
TR: Ø8/25 cm
Third story0.50 × 0.30, LR: 4Ø14,
TR: Ø8/25 cm
0.60 × 0.30, LR: 4Ø22,
TR: Ø8/25 cm
0.35 × 0.24, LR: 4Ø14,
TR: Ø8/25 cm
* LR: longitudinal reinforcement; TR: transverse reinforcement. Dimensions are in meters.
Table 2. Design variables of the bi-objective optimization problem (solved through the GA) for the minimization of thermal energy demand and discomfort hours.
Design VariableOptionsNumber of OptionsNumber of Bits for Encoding
(1)Th [°C]19, 20 (B *), 21, 2242
(2)Tc [°C]24, 25, 26 (B), 2742
(3)ev0.1, 0.25, 0.4, 0.5, 0.6, 0.7, 0.8, 0.9 (B)83
(4)av0.1, 0.25, 0.4, 0.5, 0.6 (B), 0.7, 0.8, 0.983
(5)er0.1, 0.25, 0.4, 0.5, 0.6, 0.7, 0.8, 0.9 (B)83
(6)ar0.1, 0.25, 0.4, 0.5, 0.6 (B), 0.7, 0.8, 0.983
(7)tv [m]0 (B), 0.04, 0.05, 0.06, 0.08, 0.10, 0.12, 0.1483
(8)tr [m]0 (B), 0.04, 0.05, 0.06, 0.08, 0.10, 0.12, 0.1483
(9)Windows’ typew1 (B), w2, w3, w4, w5, w6, w7, w883
* B: baseline (i.e., as built configuration).
Table 3. Investigated primary energy systems.
Description and Considered OptionsInvestment Cost (IC)Incentives
Heating SystemExisting gas boiler (B *)Natural gas boiler with nominal efficiency (η), assessed considering the LCV (lower calorific value) of gas, equal to 0.85.
Condensing gas boilerCondensing natural gas boiler with nominal η equal to 1.06.13,100 €65% of IC up to 30 k€, accorded in 10
Air-source heat pumpAir-source electric heat pump with nominal COP (coefficient of performance) equal to 3.8.26,000 €65% of IC up to 30 k€, accorded in 10 years
Heating & CoolingGround-source reversible heat pumpReversible ground-source electric heat pump with geothermal vertical probes:
-
Heating operation: nominal COP = 5.1;
-
Cooling operation: nominal EER (energy efficiency ratio) = 6.1.
97,500 €65% of IC up to 30 k€, accorded in 10
Cooling SystemExisting air-cooled chiller (B)Air-cooled electric chiller with nominal EER equal to 2.5.
Efficient air-cooled chillerEnergy-efficient air-cooled electric chiller with nominal EER equal to 3.4.19,250 €
DHW SystemExisting gas boiler (B)Natural gas boiler with nominal η equal to 0.85.
Efficient gas boilerEnergy-efficient natural gas boiler with nominal η equal to 0.95.15,750 €
RESsSolar photovoltaic (PV) panelsSolar PV panels on the roof, south-oriented with tilt angle of 34°. The size is expressed by “cov”: percentage of the available roof area (=600 m2) covered by PV panels. Mutual shading is avoided. Cov can vary between 0% (B) and 100% with a step of 10%. Two typical PV types are considered:poly-crystalline silicon250 € per m2 of panels’ surface50 % of IC up to 96 k€, accorded in 10 years
mono-crystalline silicon430 € per m2 of panels’ surface
* B: baseline (i.e., as built configuration).
Table 4. Safety level of the non-linear analyses.
Force PatternEccentricitySafety Level
MilanNorcia
Mass XX − E −80%15%
Mass YY + E −100%50%
First Mode XX − E +75%20%
First Mode YY + E +100%24%
Table 5. Energy characterization of the baseline.
LocationTEDscDHPECGCEM (CO2-eq)
Milan86.08 kWht/m2a31.43%202.72 kWhp/m2a419.19 €/m2 (722.25 k€)58.66 kg/m2a (108.06 t/a)
Norcia70.43 kWht/m2a26.94%186.17 kWhp/m2a388.07 €/m2 (714.91 k€)54.38 kg/m2a (100.18 t/a)
Table 6. Expected annual losses of the baseline.
Force PatternEccentricityExpected Annual Loss (EAL)
MilanNorcia
Mass XX − E −5.29 k€59.74 k€
Mass YY + E −3.47 k€42.11 k€
First Mode XX − E +5.58 k€60.40 k€
First Mode YY + E +3.47 k€43.38 k€
Table 7. Characterization of the cost-optimal energy retrofit solutions.
LocationTEDscDHdPEC *dGC *ICDPBdEM * (CO2-eq)
Milan35.41 kWht/m2a13.55%−124.26 kWhp/m2a−106.96 €/m2 (−197.05 k€)267.6 k€11 years−36.22 kg/m2a (−66.73 t/a)
Cost-optimal energy retrofit solution
Heating set point temperature (Th) = 19 °C
Cooling set point temperature (Tc) = 27 °C
External plastering and 14 cm-thick thermal insulation of the external vertical walls:
-
ev = 0.10
-
av = 0.60
-
Uv = 0.161 W/m2K
External plastering and 14 cm-thick thermal insulation of the roof:
-
er = 0.40
-
ar = 0.50
-
Ur = 0.158 W/m2K
Installation of triple-glazed windows (w8):
-
Uw = 1.10 W/m2K
-
SHGC = 0.579
Installation of the condensing boiler for space heating
Installation of poly-crystalline PV, cov = 100%
LocationTEDscDHdPEC *dGC *ICDPBdEM * (CO2-eq)
Norcia26.13 kWht/m2a10.10%−114.77 kWhp/m2a−90.17 €/m2 (−166.12 k€)267.6 k€12.1 years−33.83 kg/m2a (−62.32 t/a)
Cost-optimal energy retrofit solution
Heating set point temperature (Th) = 19 °C
Cooling set point temperature (Tc) = 27 °C
External plastering and 14 cm-thick thermal insulation of the external vertical walls:
-
ev = 0.40
-
av = 0.60
-
Uv = 0.161 W/m2K
External plastering and 14 cm-thick thermal insulation of the roof:
-
er = 0.10
-
ar = 0.25
-
Ur = 0.158 W/m2K
Installation of triple-glazed windows (w8):
-
Uw = 1.10 W/m2K
-
SHGC = 0.579
Installation of the condensing boiler for space heating
Installation of poly-crystalline PV, cov = 100%
* Negative values denote a reduction (i.e., a benefit) compared to the baseline.
Table 8. Influence of cost-optimal energy retrofit measures on seismic loss assessment.
Energy Retrofit Measure (ERM)Effects on Seismic Loss Assessment
External plastering and 14 cm-thick thermal insulation of the wallsThis ERM is applied on existing walls, and thus it is implemented in the fragility models of such walls. In particular, it influences the replacement cost of the walls that increases from 97 €/m2 to 145 €/m2.
External plastering and 14 cm-thick thermal insulation of the roofThe damage analysis assumes that each floor is a rigid diaphragm due to the thickness of the slab and cannot be damaged. For this reason, this ERM influences only the reconstruction cost of the whole building.
Installation of triple-glazed windowsThis ERM influences the replacement cost of the component that increases from 200 €/m2 to 290 €/m2.
Installation of the condensing boilerThis ERM influences the replacement cost of the component (i.e., boiler) that increases from 7.8 k€ to 13.1 k€.
Installation of poly-crystalline PVThe damage analysis assumes that each floor is a rigid diaphragm due to the thickness of the slab and cannot be damaged. For this reason, this ERM influences only the reconstruction cost of the whole building.
Table 9. Expected annual losses of the facility after the implementation of cost-optimal energy retrofit strategies.
Force PatternEccentricityExpected Annual Loss (EAL)
MilanNorcia
Mass XX − E −7.69 k€65.36 k€
Mass YY + E −3.70 k€46.10 k€
First Mode XX − E +6.04 k€66.07 k€
First Mode YY + E +3.71 k€47.53 k€
Table 10. Increment of the Expected Annual Losses after the implementation of cost-optimal energy retrofit strategies.
Force PatternEccentricityIncrement of the Expected Annual Loss (EAL)>
MilanNorciaMilanNorcia
[%][%][€][€]
Mass XX − E −8.13%9.41%0.43 k€5.62 k€
Mass YY + E −6.63%9.48%0.23 k€3.99 k€
First Mode XX − E +8.24%9.39%0.46 k€5.67 k€
First Mode YY + E +6.92%9.57%0.24 k€4.15 k€
Average Values7.48%9.46%0.34 k€4.86 k€