
Toward a Romanian NPOs Sustainability Model: Determinants of Sustainability
by
 , ,
, ,
Sebastian-Ion Ceptureanu
1,* ,
,
Eduard-Gabriel Ceptureanu
1,
Mihai Cristian Orzan
2 and
Irinel Marin
1 1
Department of Management, Bucharest University of Economic Studies, Faculty of Management, Piata Romana No. 6, Bucharest 030173, Romania
2
Department of Marketing, Bucharest University of Economic Studies, Faculty of Marketing, Piata Romana No. 6, Bucharest 030173, Romania
*
Author to whom correspondence should be addressed.
Sustainability 2017, 9(6), 966; https://doi.org/10.3390/su9060966
Submission received: 7 February 2017
/
Revised: 23 May 2017
/
Accepted: 1 June 2017
/
Published: 7 June 2017
Abstract
:Non-profit organizations (NPOs) have become increasingly important in the last decade for Romanian society since the state often failed to fulfill some of its social responsibilities. Romania’s economic and financial crisis several years ago hardly hit non-profit sector because it led to a significant drop in public spending at the government level and cuts of financing programs from companies, two main donors for NPOs while simultaneously has amplified society’s problems and gave rise to new target groups requiring support. This led to an acute need to address sustainability at organizational level since existing sustainability models in the literature are hardly adequate for Romanian context. We developed a model based on literature survey and Romanian experts’ interviews, which allow us to identify relevant factors for Romanian non-profit sustainability. Three determinants were considered: Cognitive competence (nine items analyzed), Social awareness (seven items analyzed) and Financial vulnerability (four items analyzed), as well as two types of results: economic and social. The model was tested through an empirical research on 103 Romanian NPOs and on two sub-samples (nongovernment organizations and community based organizations) and found, using univariate and bivariate analysis, that the three considered determinants are correlated and statistically influence Romanian NPOs sustainability.
1. Introduction
Non-profit sector is increasingly transforming into a subject of economic research, from both theoretical [1,2] and pragmatic perspectives [3,4]. It is an expanding field for scholars considering its current extent in many countries and impact on society and economy in terms of people involved, in various ways, in non-profit activities, as employees, volunteers or beneficiaries of NPO initiatives. According to Navarra [5], there is a clear need to set up distinct approaches and use comprehensive definitions when referring this sector, considering its characteristics and evolutions. Hence, our interest in analyzing a key element of non-profit sector, NPOs sustainability, and this paper aims at giving a contribution in this direction.
Given the large number of active non-profit organizations worldwide (1.57 million in United States, several million in European Union, and 65,000 in Romania) [6], growing share of people dedicating their time and energies to volunteering (34% in EU and 13% in Romania) [6] and share of GDP generated by NPOs (reaching 5% in countries such as Netherlands and Sweden, while, in Romania, it is less than 1%) [7], the non-profit sector manages to distinguish itself as a fundamental part of any democratic society. Therefore, it is necessary to study in depth the processes and developments taking place in the third sector, especially to find solutions to major challenges facing non-profit organizations, which, if ignored, can have significant adverse effects on them and on society as a whole.
One of the major challenges of the non-profit sector is ensuring its sustainability and long-term survival [8]. For Romanian NPOs, past years economic and financial crisis has a significant negative impact. On the one hand, the crisis led to a drop in public spending at the government level and a drop of donors’ budgets (especially from private companies), two main contributors for non-profit sector. Many donors reduced or even cut entirely their financial support. Even though Romanian economy managed to recover to some extent in the last couple of years, unfortunately for NPOs they lost access to the same amount of resources as before the crisis. On the other hand, the crisis gave rise to new groups requiring support, raising concerns about balancing resources to cover all these new emerged needs. This led to a large number of NPOs reconsidering their strategy, seeking diversification of activities and prioritization of resources. Unfortunately, many others, less pro-active or more rigid, did not manage to survive and disappeared. This seems to become a common occurrence worldwide, since many NPOs had to forfeit due to lack of resources [9].
Crisis not only amplified problems NPOs had to cope with but also constituted an opportunity for many. It tested their relevance and actual capabilities and many of them had the chance to reorganize and become more efficient. There were many instances when NPOs relying on a sole or small group of donors (e.g., indirect government grants or grants from foundations) were forced to close down their operations when it became impossible for donors to continue and non-profits could not find viable alternatives in a timely manner. However, organizations that have managed to learn their lessons from the crisis and incorporate them into their organizational setting not only survived, but were able to sustainably develop.
Although the effects of the crisis are slowly vanishing, Romanian non-profit organizations have to face an unprecedented competition for resources. For example, there are funding programs available from the European Economic Area (EEA/Norway Grants) who received more than eight times applications than available funds (about 800 projects/applications submitted, of which only 100 could be financed). Similar issues arise in other programs such as Erasmus + program from European Commission, Romania—Switzerland Partnership Scheme, Corporation funded programs (e.g., Tara lui Andrei/Andrew’s country) and others, where competition for gaining a grant is fierce. Not only Romania faces the problem of competition among NPOs, similar situations occur in other countries, but, for Romanian ones, this problem is acute due to scarcity of resources, lack of relevant expertise or poor image of many NPOs, raising concerns among experts about their organizational sustainability.
Facing so many challenges, but also opportunities, many NPOs executives have to be interested in finding out which are the determinants of organizational sustainability for their organizations. This paper addresses this topic, presenting an approach relevant for Romanian context, but also for the literature.
2. Literature Survey
From a theoretical perspective, sustainability in the non-profit sector means that significant society needs will be fulfilled by non-profits, enabling the business and government sectors to pursue their own commitments and obligations toward society without restrictions [10]. While sustainability of for-profit businesses has been a primary focus of researchers over the last few decades, this was not the case for non-profit organizations, despite increased specific vulnerabilities of this sector [10,11]. Hence, a sustainable NPO is an organization that can continue to fulfill its mission and satisfy the key stakeholders’ requirements, regardless of difficulties encountered [10]. As such, sustainability is a continuous process rather than a scope, involving the interaction between various parts of non-profit organizational setting.
Some scholars argue that non-profit sector sustainability should emphasize the role of civil society in ensuring equity and well-being [12]. In this case, sustainability has become a goal of both public and private organizations worldwide and the general intent is “to create and maintain conditions, under which humans and nature can exist in productive harmony, that permit fulfilling the social, economic and environmental requirements of present and future generations” [12]. Social sustainability includes a wide array of components, such as productivity; harmony; satisfying social, economic and environmental requirements; and intergenerational equity. The current challenge is to develop the means to support practical implementation of sustainability policies across multiple scales pertinent to organizational missions and operations [13]. The foundation of this challenge is the need to embrace a unifying approach that connects scientific information and societal values.
Since our paper focuses on organizational sustainability, we first seek answers in for-profit literature. The sustainability of for-profit organizations has been a constant focus for many scholars over the last few decades. Weerawardena [10] argue that many of the theories emerging during this period such as resource based view or resource advantage theory emphasize competitive advantage. However, the non-profit literature does not reflect a similar emphasis, despite increased vulnerability and threats facing non-profits [11]. Important differences between NPOs and business organizations make it difficult to use sustainability theories specific to business literature for non-profits. NPOs differ substantially from their for-profit counterparts in many ways. In terms of focus, while for-profits largely emphasis clients’ satisfaction and retention, this is less likely for non-profit organizations. While focus on clients can provide enhanced service delivery for non-profits, a clear link between clients and revenue generation is missing in non-profits while donors assume a central focus because of the critical role they play in providing a revenue flow [10]. Simultaneously, for-profits seek to provide increased shareholder wealth through delivery of superior value to customers while NPOs must strive for financial resources in order to deliver social value to its clients. Another important difference is in terms of resources, especially financing. Compared to business sector, NPOs face significant volatility, doubled by diversity, across all their revenue sources, making multiple stakeholder management a reality in their case while simultaneously the main management focus is a fine tuning between money and mission [14,15]. However, non-profits have a more diverse set of tools at their disposal to ensure a flow of resources to support their activities [16], acquiring funds not only by earned income but also by governmental support and private donations. Thus, while, in the case of for-profits, their main revenue source is their turnover, for NPOs, the range of possibilities includes commercially generated revenues [17]; fundraising [18,19]; relationship marketing [20]; identity-based donations [21,22]; sector and cross sector strategic alliances [23]; increased volunteerism [24,25]; and in-kind donations [26].
There are different perspectives on sustainability and what it actually means for NPOs. Any analysis of NPOs sustainability has to acknowledge this heterogeneity. We consider several approaches.
- (a)
- One approach of organizational sustainability focuses on financial viability or long-term economic growth of non-profits. Among all perspectives, this is the most common in literature and an important factor in considering Financial vulnerability as a dimension of our model. Greenlee and Trussel (2001) [27], Keating, Fisher, Gordon and Greenlee (2005) [28] and Silva and Burger (2015) [29] consider it in their works. Indicators such as liquidity, solvency or margin should be carefully considered by non-profit managers, and non-profit financial management textbooks recommend multiple measures for each construct [30]. Some scholars [31] emphasize liquidity such as current ratio, quick ratio, working ratio and capital ratio, others add days of cash on hand, for instance [32,33]. Finally, others focus on cash, indicators such as the cash ratio, the cash reserve ratio, and the asset ratio [34]. The reason for numerous and varied measures is that non-profit activity is multidimensional and cannot be captured by single measures. McLaughlin (2009) [32] emphasize the need for multiple measures while Zietlow et al. (2007) [34] provide rationale for multiple liquidity measures, arguing that each ratio gives a slightly different perspective on the non-profit financial situation.
- (b)
- A second perspective considers NPOs sustainability as referring to a program or “intervention” sustainability, with an emphasis on maintaining the quality of a particular service or program after a targeted intervention has been terminated. More common for health or community programs, they consider a program as sustainable when its relevant activities and resources continue according to its primary objectives [35]. Crisp and Swerissen (2002) [36] consider that program sustainability depends on the continuation of its implementation strategy, in terms of the concerned organization and program effects. Others have reported that a program becomes sustainable after institutionalization in relevant organizations and empowerment of its recipients [37,38]. Most programs are evaluated based on parameters such as feasibility, strategic planning, process, and outcomes. Thus, sustainability is not part of the evaluation [39]. According to Shediac-Rizkallah and Bone (1998) [40] there are three components for sustainability that include: (1) continued benefits to those who received the services when the program started and to new participants when the supporting funds are discontinued; (2) continued implementation of a program activities following the termination of the program financial support; and (3) community empowerment by continuing the activities of a finished program. This was considered in our model in terms of results (item “Continuous activity”), but we have to consider that, due to heterogeneity of the sample, many NPOs do not employ one long-term program such as continuously providing a service or a product.
- (c)
- A third approach emphasizes organizational sustainability, focusing on developing new methodologies to identify and assess those organizational characteristics critical for NPOs sustainability, based on an assessment of core attributes such as leadership capabilities and management competencies, organizational capacity to provide specific services, or ability to anticipate and cope with change. Sustainable NPOs are capable of effectively address external changes by adapting their mission, access new sources of income, and improving internal processes to meet the new challenges. Ashoka Foundation approach [41] suggests that the ability of an NPO to manage change and remain sustainable depends on: (1) a positive public profile, strong network and reputation to be able to attract resources; (2) a suitable and appropriate organizational system and processes to be able to retain a positive relationship with relevant donors; and (3) willingness to learn and evolve. In support of this approach, other specialists argue that NPOs need to invest in building relationships, risk management and basic good financial practice [42]. Along with the first one, this approach lays foundations for our model of organizational sustainability for Romanian non-profits.
These approaches provide a useful insight about what are the main determinants of NPOs sustainability. This is reflected in the methodology used in the Civil Society Organization (CSO) Sustainability Index [43], which relies on a range of indicators to assess the strength and viability of civil society in different countries. The index is based on seven dimensions: (1) legal environment; (2) organizational capacity; (3) financial viability; (4) advocacy capacity; (5) service provision; (6) infrastructure; and (7) public image and reputation. The difficulty of trying to collate and measure this mix of criteria highlights the complexity and methodological challenges of both preparing and applying such all-embracing measures of sustainability.
Another approach by Nuka (2010) [44] considers the following factors: (1) financial resources; (2) legal and policy framework; (3) organizational viability (the capacity to maintain the organizational strength while fulfilling its mission and vision); (4) program effectiveness and accountability (having an effective program means being able to continuously provide quality services to target groups meet the demands of the target groups, increase credibility through showing accountability to the society they serve and ensure that program objectives are met); (5) human capacity; (6) networking; and (7) long term impact on society (the process of empowering target groups and engaging them in organizational processes by institutionalizing changes in behavior, developing community capacities, creating a sense of ownership and social capital). Unfortunately, these approaches seem fit for NPOs sector sustainability as a whole rather than specific organizations assessment. Others, such as Okorley and Nkrumah [45], emphasize five main areas of sustainability: leadership, funding, program development, program management and quality of material resources.
An extensive approach belongs to Schaffer et al. [46]. They link NPOs success to five core factors, namely strategy, culture, operations, people and business model, comprising 32 specific indicators. Together, these factors provide a comprehensive portrait of a non-profit, and the full set serves as the structure of each organizational assessment.
In parallel with various approaches to operational factors of sustainability, social mission of NPOs gained a strategic focus. Various scholars argue that there is a broader agreement that the ultimate objective of non-profits is to increase social value [47,48,49,50]. There has been a disagreement, however, over the importance and place of these social goals [47], with some scholars strongly advocating that social mission has to be explicit and central [48]. The proponents of this view suggest that any wealth generated by NPO is just a means to the social end [47] while earned income activities have no place in social entrepreneurship. In contrast, other scholars argue that social entrepreneurship is about finding new and better ways to create and sustain social value [49]. This approach locates the social entrepreneurship in the non-profit sector [48], putting non-profits and social enterprises on a common ground. Accordingly, a growing number of researchers support the use of earned income strategies to achieve organizational sustainability by mixing non-profit with for-profit organization features [50]. Mair and Marti argue that social entrepreneurship can take place on a for-profit basis, arguing that “the choice of set-up is typically determined by the nature of the social needs addressed, the amount of resources needed, the scope for raising capital, and the ability to capture economic value” [51].
Other researchers argue that profitability is consistent with social entrepreneurship and there been instances where profitable business ventures deliver social value [47]. In a less traditional approach, they research on the increased implementation of market approaches and business principles to guide non-profits [52]. While some argue that this trend towards marketization may pose risks for non-profits because they lose focus of their social mission [47], there is a wide movement inside the third sector toward the “marketization” or “commercialization” of non-profits activities and the “professionalization” of their human resources [53]. Means employed by NPOs include adopting an entrepreneurial posture [54,55]; adopting innovative practices [56]; and market orientation [55,57], while simultaneously redefining, sometimes fundamentally, the purpose and mission [58]. Researchers argue that if defined too narrowly, the organization risks failing the test of economic viability, so it will better to redefine the purpose, perhaps stating its mission in broader terms [59]. However, empirical studies about increased concludes that it lead to improved service delivery, but made no associated assessment of the impact on social mission [60]. Finally, a rather eclectic study argues that sustainability efforts should focus on three main areas: people, profit, and planet [61].
3. Romanian Non-Profit Sector and Sustainability
Non-profit organizations in Romania have been affected by the crisis and operate in an environment considered hostile by many non-profit executives, in terms of economic and fiscal requirements [62]. NGO Leaders Barometer conducted by the Civil Society Development Foundation (CSDF) have drawn a few conclusions relevant to the sector [63]:
- (a)
- Approximately 60% of NPOs consider available financial resources insufficient while only 9% of organizations consider them sufficient to properly operate. The situation is dramatic compared to 2010 when only 48% of NPOs considered resources as insufficient.
- (b)
- Nearly 40% of organizations have annual budgets of less than 10,000 euros, and 75% of NPOs have annual income below 100,000 euro, which make their operations rather small and focused.
- (c)
- Non-profit sector is highly concentrated around a few major organizations so that 4% of NPOs accumulate 80% of the revenues of the whole sector. This level of concentration, even though it allows some very effective initiatives, is less favorable on the long term, making non-profit sector prone to political influence or economic pressure.
- (d)
- The main sources of revenue for NPOs are public funds (30%), European Union programs, membership fees, individual donations, sponsorships and international grants (each 11%), individual donations (9%), and economic activities (5%). Thus, the government and its agencies continue to be the most significant actor in terms of financing, hinting to a moderate level of development of non-profit sector on this matter.
- (e)
- More than 60% of non-profits have employees, while the remaining 37% operate exclusively with volunteers. This proportion has remained relatively constant over time. Unfortunately, around 67% of employees earn below monthly average salary in Romania, which raise serious concerns in terms of staff continuity.
In terms of non-profit sector sustainability, situation is considered stable in the last years [64], as is shown in Figure 1.
In the last 10 years, tax incentives for donors and donations improved, NPOs diversified the services they offer, and many informal civic groups consolidated. Romanian NPOs, especially NGOs, develop effective advocacy and lobbying initiatives, but cooperation between non-profit and governmental sectors was limited by the government’s lack of transparency. Government support for NPO social services decreased [64].
In terms of number of non-profits, the National Non-Governmental Organization Register included 96,612 officially registered NPOs as of the end of 2015, an increase of 6097 since December 2014. However, this is not the whole picture as it is possible that organizations registered in 2015 might not be represented until 2016, as Romanian courts are not subject to a deadline for updating the registry. Most registered NPOs are associations (76,130) and foundations (18,449).
Regarding organization sustainability, significant optimism was recorded, despite the major difficulties encountered by many NPOs. Hence, almost 70% of NPOs are very confident and confident that they will manage to survive, while 32% have moderate doubts. Optimism regarding organizational survival is a positive sign, in conjunction with the clear intention of the sector to grow, find alternative financing and achieve a new status [6].
The most facile approach to ensure sustainability is to focus on financial issues. In fact, most of the scarce data on Romanian non-profit sector focus on financial resources. However, it is our belief that understanding sustainability in Romanian non-profit sector is more than a financial issue. It encompass developing activities to meet priority community needs, enhancing NPOs individually and the sector as a whole advocacy capacity; enhancing understanding of the role of non-profits as both service providers and advocates for change; focusing on developing NPOs that are active in their communities and that work co-operatively; and encouraging the development of structures such as community groups, advocacy alliances, networks and self-help groups.
4. Organizational Determinants of Sustainability for Romanian NPOs
4.1. Setting up the Research
In our approach, we used interviews, transversal study and sample survey. This allowed us to measure various characteristics of the sample and correlation with non-profit sustainability.
The measurement tool used was descriptive survey, using a self-administered questionnaire. In the development of questionnaire, all methodological steps required by literature [65] were considered.
Two types of NPOs were analyzed: NGOs (non-government organizations) and CBOs (community based organizations). The rationale for that was they are the most common in Romanian non-profit sector, on the one hand, and there are significant differences in scope and organizational characteristics, on the other hand, allowing us to validate or not our findings. In Table 1 we described the sample.
Non-profit size was operationalized by calculating the average income of 2013–2015 and average number of employees (excluding volunteers), during the same period. Based on these variables, we determined a derived variable, with values micro, small and medium depending on the number of employees and income. We applied the criterion of number of employees (≤5 for small, 5–20 for medium and >20 for large NPOs) and then the criterion of income (≤10,000 euro for micro, 10,000–100,000 euro for medium and >100,000 euro for large NPOs).
4.2. The Model
In terms of theoretical background, we used a mix of several frameworks addressing non-profits sustainability. NPO sustainability was considered in terms of three determinants, Cognitive competence, Social awareness and Financial vulnerability, and two results, Economic Results and Social Results.
For choosing Cognitive competence, we rely on the existing literature linking organizational capability (capacity) and sustainability. As a construct, it is encompassed in frameworks including: (a) Ashoka Foundation [41] arguing that the ability of a non-profit to be sustainable depends on a suitable and appropriate organizational system and processes to be able to retain a positive relationship with relevant donors and willingness to learn and evolve; (b) CSO Sustainability Index [43], where organizational capacity is considered one of the determinants of sustainability; and (c) Nuka framework [44], which considers, among other factors, organizational viability and human capacity. Decisions concerning effective use of employees and volunteers, managerial and marketing strategies, and diversification or specialization for its services can significantly impact the success or failure of a non-profit. Simultaneously, due to market orientation (marketization), literature on organizational capability suggests that the unique nature of non-profits determines they act similarly to businesses, but with a deeper emphasis on their social mission. Cordes et al. (2000) [66] argue that NPOs may attempt to be sustainable using either internal or external focus, albeit they can follow both approaches simultaneously. Internal focus involves management initiatives designed to produce greater organizational efficiency, effectiveness, and flexibility [67]. This approach might include internal management changes that allow non-profits to continue their current activities, but in a more efficient and effective way. Hence, NPOs can adapt their operational activities to enhance organizational capacity.
In terms of Social awareness, many NPOs emphasize the relational, external aspects of their activity. As a construct, we rely on: (a) Ashoka Foundation approach [41] arguing that the ability of an NPO to remain sustainable depends on a positive public profile, strong network and reputation to be able to attract resources; (b) CSO Sustainability Index [43], for items such as public image and reputation; and (c) Nuka framework [44] which considers, among other factors, networking and long term impact on society. The foundation for this determinant is the paradigm that civil society is multidimensional in form and multipurpose in function [68]. Non-profit organizations play a critical role in civil society by building and maintaining important social relationships [69]. They provide means enabling people to interact and work toward common goals. Returning to the perspective of Cordes et al. (2000) [66], this determinant corresponds to the external focus. In terms of external approaches, non-profit organizations often work jointly on common concerns, sharing ideas, responsibilities, and resources. They collaborate with government agencies and businesses to further social interests. The social networks formed through these interactions help non-profits to access resources (e.g., projects), to improve fundraising or attract new donors. Although much of the literature on civil society tends to emphasize local interactions, Minkoff (1997) [68] cautions that broad interactions (national or international) should not be overlooked. In the Romanian case, many NPOs interact in various ways with foreign or national umbrella organizations, which allow the latter to play a critical role in a changing environment through their extensive use of networks and affiliations. These networks provide “an infrastructure for collective action and act as visible proponents of group claims to help shape public discourse and debate” [68].
In terms of Financial vulnerability, the non-profit sector in general suffers from high volatility and uncertainty of its income flows which turn them to be susceptible to financial problems and consider financially vulnerable. There is virtually no sustainability framework to disregard financial management as critical in achieving sustainability. This fact is of importance since it may constrain organizations in achieving sustainability. This situation is worsened by the inadequate buffering of NGOs against financial difficulties due to difficult access to credit, their inability to raise capital and to engage in profit-making activities. Thus, an understanding of the relationship between the organizational characteristics of NGOs and their financial vulnerability can effectively mitigate the impact of financial vulnerability on effective program delivery. In our approach we rely on: (a) Ashoka Foundation approach [41], where financial resources are considered through ability to attract resources and to retain a positive relationship with relevant donors; (b) CSO Sustainability Index [43], where financial viability is a critical domain; (c) Nuka approach [44], where financial resources are the first and foremost mentioned; and (d) Okorley and Nkrumah model [45], in which two of the five main areas of sustainability refer to funding and quality of material resources.
To validate determinants and items corresponding to each determinant, we performed a layered explorative study. First, the authors determined a list of items for each of the determinants (Cognitive competence, Social awareness, and Financial vulnerability) based on literature survey. This list was subject to three focus groups with executives of non-profit organizations at Center for Non-profit Organizations Management, a support center established by an Erasmus international project. Focus groups’ participants were not those included in the sample for the actual analysis performed to determine the most appropriate variables, considering both a review of the literature and expert opinions. We decided to provide for each determinant a list of items since otherwise there was a high probability that the range of items considered would be too great due to heterogeneity of the sample for the quantitative analysis. However, there was no restriction for focus groups’ participants to propose new items, which eventually was the case. Still, NPOs results list was not subject to discussion in focus groups.
4.2.1. Building Cognitive Competence Construct
Cognitive competence, in our approach, emphasizes the NPO organizational capability. Based on the Eikenberry and Kluver [52] approach of NPOs marketization and the findings from Indexul Sustenabilitatii Organizatiilor Societatii Civile [64], we linked organizational capability with NPO expertise. Expertise is connected to know-how, what knowledge non-profits acquire and use, which we call Cognitive competence.
Our preliminary documentation makes it possible to determine some interesting facts about Romanian NPO sector. In terms of legal environment expertise, Romanian NPOs experienced both positive and negative developments in the last years. For instance, the process of registering a non-profit still requires significant time and the fulfillment of complex and often rigid procedures. Approval of non-profit designation can take up to 20 days and the registration process can take up to 45 days, while a local judge has to be involved in the process. This, coupled with the fact that registering a NPO in Romania is more expensive than registering a company, requires significant legal expertise.
A new Law on Social Economy came into effect in August 2015, allowing NPOs to become social enterprises and enabling them to do more in terms of job creation for vulnerable groups, for instance. NPOs can operate freely according to the law, but there were some isolated instances of harassment [64]. A new Fiscal Code increases the amount that companies can deduct for their donations up to 20% of the owed income tax or up to 0.5% of the annual turnover, making donation an interesting choice for them. Simultaneously, NPOs remain exempt from income taxation on fee-generated income up to $20,000 in a fiscal year or up to 10% of total tax-exempt income, while revenue from grants and sponsorship is not subject to income tax.
Individual donors can choose to direct up to 2% of their income tax towards a non-profit, while, since 2014, NPOs performing economic activities are able to register as small and medium sized enterprises (SMEs), which provides them with the right to access particular types of economic consultancy and information services, as well as dedicated public funds.
In terms of organizational capacity (management, marketing, economic and financial expertise), the situation did not change significantly in the last years. Although Romanian NPOs typically involve many people in their activities, most of them find it difficult to develop long-term relations and NPO membership remains limited. While no research has been done on this topic in Romania, this could be because few non-profits see the importance of developing and maintaining long term contractual arrangements due to their organizational vulnerabilities or that people lack sufficient trust in NPOs.
Informal civic groups are becoming prominent actors within Romanian civil society. A study conducted in 2015 [64] identified at least 500 distinct informal civic groups implementing social change. Most of them were established by institutionalized NPOs and support organizations but now act independently. They mostly focus on issues related to local infrastructure, as well as social, educational, and environmental problems. Less frequently, they act as local watchdogs.
Most NPOs have mission and commonly engage in strategic planning. However, they seem to abandon their strategic plans to pursue funding if opportunity arises [64]. The internal management of NPOs remains largely staff driven, while involvement of governing boards is usually minimal. In smaller non-profits, it is common for boards and operational teams to overlap. Because 2007–2013 European Structural Funds, a significant funding source for many larger NPOs in the last five years, ended in 2015, while most of the operational programs for the 2014–2020 framework had not become available, many NPOs executives are uncertain about the continuity of their staff.
Concerning staff, up to 96% of Romanian NPOs have at least one volunteer according to a recent study [6]. A relative balance exists between non-profits having between 1–25 volunteers (48%) and those working with a larger number of volunteers (48%) [6]. On the other hand, more than half of the NPOs have no employees at all while those employing more than 10 people are a minority (9%) [6]. The fact that only 28% of NPOs employ 3–10 people and 39% employ 1–10 indicates both a lack of financial resources to allow development and long term problems concerning staff continuity. Instead, in conjunction with the previous question, NPOs choose to rely mainly on volunteers, with additional weakness induced, such as less responsibility. Part-time employees are a rarity in NPOs, with only 33% using this system. Even so, Romanian NPOs do not employ more than five part-time employees, with very few exceptions [6].
Cognitive competence is influenced by the range of goods and services provided by non-profits. Romanian NPOs offered a diverse range of goods and services, which requires a more comprehensive set of organizational expertise. Some NPOs are very active in IT&C, sometimes working closely with the government. For instance, one non-profit developed a software tool that compares the costs of basic municipal services while another one made similar software reporting potentially illegal deforestation. Other NPOs, mainly think tanks, monitor and issue reports and policy proposals related to the energy market or electoral processes. Social service NPOs established social enterprises in a variety of domains, sometimes very heterogeneous, such as computer recycling, catering services and restaurants, bakeries or social farming. Other NPOs offer or facilitates legal advice for vulnerable groups such as single mothers or Roma and on basic human rights matters. Diversification helped Romanian NPOs to increase their relevance, while it also makes them highly dependent on grants and donors, making their sustainability questionable.
The initial list of variables included, before focus groups meetings, included those listed in Table 2.
After focus group meetings, the items in Table 3 were considered.
4.2.2. Building Social Awareness Construct
This determinant of Romanian NPOs sustainability is related to the external dimension of any non-profit, the way it is perceived in the community, by its stakeholders and beneficiaries. Compared to the first determinant, many Romanian non-profits managed to significantly improve social awareness in the last years. For instance, in terms of advocacy, Romanian NPOs intensified their campaigns and became more visible on a wide array of issues such as discrimination, domestic violence or youth support. However, in many cases, government simply ignore them and as a consequence in the last five years significant legislation was passed with limited or no consultation. According to the Freedom of Information Act, public authorities must make available all normative acts at least thirty days prior to their ratification and a public debate must be organized if a NPO requests it. NPOs’ cooperation with government and legislative bodies, however, continues to be hindered by public authorities’ disregard for these regulations. For example, postal voting, a hot topic in the last elections, was passed with minimal consultation while public appeals for transparency in selection of National Council for Combatting Discrimination member were ignored. The local Helsinki Committee raised concerns about the high number of specific legislation documents adopted by avoiding deliberations of regular parliamentary procedures [64]. Successful stories about NPOs lobbying and advocacy include local Stop TTIP coalition which managed to raise thousands of signatures demanding a halt the Transatlantic Trade and Investment Partnership (TTIP) negotiations or Save the Children Romania campaign to increase the monthly children state allowance [69]. Other NPOs advocated to remove religion as a compulsory discipline in public schools and to improve the law to protect domestic violence victims [64].
In terms of public image, mass media showed more interest in civil society related topics in the last years, although their covering of NPOs events was rather marginal. While traditional mass media involve NPO representatives in various talk shows, online media gave more coverage in terms of reporting their actions and allowing NPOs to publish content. Civic initiative groups are also becoming more visible with their increasing success in initiating community actions and defending local interests. According to a survey conducted by INSCOP Research in 2015, 30.2% of Romanians trust NPOs, compared to 28.6% in 2014 [69]. NPOs are increasingly paying more attention to their public image and thus have invested further in developing public relations, building communication capabilities, and relationships with mass media. They promoted their activities by organizing public events, such as the Civil Society Gala, NGO Fest, or National Volunteering Gala [64].
However, sometimes their public image is affected by poor transparency of their own. Although not a legal requirement, NPOs generally do not make public their yearly activity reports or affiliation of their board members. Although various attempts have been made to draft a code of ethics for the NPO sector over the years, these efforts lacked support among most NPOs. Table 4 and Table 5 display both the initial and final set of variables for Social awareness.
4.2.3. Building Financial Vulnerability Construct
In terms of Financial viability, as government support for NPOs continues to dwindle, NPOs increasingly rely on and try to attract private funding. Following budget cuts in previous years, private companies increased their corporate social responsibility budgets. Some corporate donors have chosen to sponsor NPOs in order to pilot and develop grant making programs while individual donations also increased. Over €2.5 million was raised through SMS donations on donatie.ro, an online fundraising platform for NPOs. According to the 2015 World Giving Index, 24% of respondents in Romania reported donating to charities in 2014, a favorable trend comparatively with previous years [64]. Generally, NPOs operating in the social, education, and health fields manage to attract both individual and corporate donations more easily than human rights, democracy, or citizen participation NPOs.
In terms of financial behavior, only a minority of NPOs continue to develop innovative private fundraising instruments to cultivate pools of individual financial supporters. On of the few examples is PACT Foundation or the Resource Center for Public Participation, which organizes donor circles to stimulate community philanthropy for various causes. Other non-profits use annual fundraising events, such as galas or charity balls, to improve relationships with donors. Crowdfunding platforms also gather support for NPO projects, with mixed results. A recent study on financial management in Romanian NPOs [64] showed that, although nearly 90% of Romanian SMEs are aware of fiscal incentives provided by Sponsorship Law, only 52% of those surveyed actually direct funds to NPOs.
Lack of transparency raises some concerns for some donor. Some NPOs—mainly larger organizations—make public annual activity reports that include financial statements and independent organizational audit reports. However, NPOs usually only conduct independent financial audits when required to by donors, and typically on a project basis rather than at the organizational level. Similarly, only larger organizations have solid financial management systems in place.
A peculiarity of funding the non-profit sector in Romania is the tax regime that encourages support of NPOs. First, NPOs are exempted from income tax and profit for a large range of revenue and commercial activity for the up to 15,000 euros annually. Secondly, every Romanian has the possibility to direct 2% from their income tax to a non-profit entity without additional cost. This feature allows non-profits to operate with greater flexibility and independence, and provide an incentive for civic involvement. According to the report “Romania 2010: The nongovernmental sector” developed by Romanian Civil Society Development Foundation [87], about 12–15% of population direct 2% of their tax toward NPOs, increasing from year to year. During 2004–2008 period, under this program 57,480,987 euro were made available, and in subsequent years the amounts have increased considerably. However, this program is criticized for bureaucracy related to submission forms and reports [87].
Regarding availability of financial resources, there seems to be a high discrepancy between the financing needs and availability of financial resources [6]. A recent study show that half of non-profits have increased problems in covering their financial needs while only 13% were satisfied on this matter. A majority of NPOs in Romania are not satisfied with financial resources currently available and funding opportunities.
This led to small budgets of Romanian NPOs. For 2016, non-profit organizations in Romania mainly operate with small budgets, nearly half having managed under 10,000 euros annually, 37% of organizations manage budgets of €10,000–€250,000 per year while only 13% had budgets exceeding 250,000 euros [6].
Lack of financial resource is a real problem for Romanian NPOs, a very important weakness of the entire sector, hence a potential source for fierce competition between NPOs. 71% of Romanian NPOs accessed grants from the main funding programs available to them, the most accessed of all being Youth in Action (21%) and LLP (11%) managed by ANPCDEFP Romania, and SEE Grants (17%) managed by Romanian Civil Society Development Foundation [6]. Only 11% have accessed the structural and cohesion funds offered by the European Union, indicating a low degree of relevance and trust among beneficiaries, plus lack of financial capability to cover the co-financing and the amounts paid in advance. However, 29% of respondents did not access any funding program in the last three years, a situation caused either by the ineligibility of the beneficiary, lack of information or lack of administrative and financial capability [6]. Table 6 and Table 7 display both the initial and final set of variables for Financial vulnerability.
In terms of NPO results, we decided on a two-dimensional approach, including economic and social results, according to social entrepreneurship approach. For instance, in the case of economic results the items considered were the same as EMES approach results, but adapted from social enterprises to all non-profits.
The achievement of mission objectives is difficult to measure [91] because NPO goals are often abstract and vague [92]. NPOs typically use short-term output measures, which do not necessarily reflect mission accomplishment [93]. However, as Lecy et al. (2011) [94] have shown, rigorous impact assessment is rare in NPOs due to a lack of good impact indicators. In addition to mission completion, good financial performance has become more relevant to NPOs during the past decades [95,96]. Furthermore, commercialization of the non-profit sector has increased [97,98]. From this perspective, organizational survival becomes the prerequisite for mission accomplishment, and researchers have even suggested that survival is the ultimate criterion on which NPO success should be evaluated [99]. This is the reason why we employed results items more common for social enterprises or linked with financial performance of the non-profit. Table 8 display the initial set of variables for Sustainability (NPO results).
Data analysis was performed using the SPSS statistical software. We used univariate and bivariate analysis methods and tested the validity and consistency of the model using statistical hypothesis testing and research.
4.3. Preliminary Analysis
Before the uni- and bivariate statistical analysis, we conducted data exploration, but, due to small sample, the relatively low number of cases makes possible a lack of a normal distribution. Because the sample included in this research is over 50, we used nonparametric Kolmogorov–Smirnov test for normality of distribution analysis. Parametric analysis results revealed a normal distribution for the three determinants of sustainability, which led to the choice of parametric statistical tests for statistical hypothesis testing. Level of significance for the three determinants of sustainability, with values higher than 0.05, indicates a normal distribution spread. Data distribution normality was analyzed through Skewness and Kurtosis coefficients. Testing distribution normality or variables was performed for each item, as well as group of items after their computation. The results are in Table 9.
4.4. Reliability Testing
The validity and consistency of the model was tested using Cronbach alpha coefficient and item-to-total correlation. The coefficient quantifies internal consistency of items that make up a pattern, or scale factor. When Cronbach’s coefficient (α) is close to 1, data show increased confidence. The correlation item-to-total, closely linked to Cronbach α coefficient, measures the degree to which an item correlates with the sum of the other items included in the model.
We choose to calculate alpha coefficient for each determinant of sustainability. To perform this analysis, we used Cronbach α if item is deleted. A value closer to 1 for α coefficient show a higher reliability. Although there are different opinions regarding which is the minimum acceptable level for coefficient, a common view is that over 0.70 of the scale indicates an acceptable reliability [100].
Following the analysis, for Cognitive competence α coefficient was 0.846, which provides a good reliability. For Social awareness determinant, reliability analysis revealed a level of α coefficient of 0.904 which provides very good reliability scale, while, for Financial vulnerability, reliability α Cronbach’s level was 0.906, again a very good level of reliability.
5. Data Interpretation and Results
5.1. Univariate Analysis
5.1.1. Determinant 1: Cognitive Competence
Cognitive competence was defined in this research as consisting of nine items. All items were measured on a Likert scale with five-level scores ranging 1–5. See Table 10.
Following statistical analysis, Cognitive competence reveals the highest average value items for management expertise, financial expertise, project management expertise and marketing expertise.
5.1.2. Determinant 2: Social Awareness
Social awareness was defined in this research as consisting of seven items, defined based on interviews with experts. Social awareness consists of items representing the NPO capacity to project a proper image for the public, which allows it to access various forms of financing. Cognitive competence means mostly a proactive approach, while Social awareness is more about a passive approach, but consolidated in time. Items were measured on a five-point Likert scale ranging 1–5. See Table 11.
Following statistical analysis, Social awareness reveals the highest average value items for public image, project management experience and address social needs.
5.1.3. Determinant 3: Financial Vulnerability
Financial vulnerability has been defined in this research as being made of four items. The items included were measured on a five-point Likert scale, with scores of 1–5. See Table 12.
Following statistical analysis, Financial vulnerability reveals the highest average value items for previous year result, revenue diversification, financial planning and reporting requirements.
5.1.4. Sub-Samples Analysis (NGOs vs. CBOs)
Univariate analysis was also used to compare sub-samples included in the survey in order to identify possible significant differences in the opinions expressed by NGOs and CBOs about the sustainability determinants. Since the data collected were normally distributed, we used the t test for comparing independent samples and Levene test to detect similarity between sub-samples variations. In this analysis, we used as a reference in the first stage the values of Levene test to identify whether variations in the two subsamples are equal. For this, the value of Sig. (significance) P in case of Levene test must take values above 0.05 to support the null hypothesis that dispersions are equal. To emphasize that there are differences between subsamples, materiality P (Sig. (2-tailed)) for t test environments indicator should also be higher than 0.05. For this analysis, the null hypothesis is that there is no significant differences between mean scores of subsamples.
As can be seen in Table 13, the Levene test is above the 0.05, which leads us to affirm that the null hypothesis is confirmed and the two sub-samples showed no significant differences between their dispersions. The t test for Cognitive competence value is −0.385, greater than 0.05, which leads us to accept the null hypothesis that there is no significant difference between dispersion of sub-samples NGOs (M = 47.40, SD = 6.18) and CBOs (M = 47.87, SD = 6.33). In the case of Social awareness, Levene test results revealed a significance level above 0.05, confirming the null hypothesis that there is no significant difference between dispersions of the two subsamples. t test was at a significance P level of 0.414, more than the value of 0.05. Thus, we can say that, for Social awareness, the null hypothesis is confirmed: the means of the two sub-samples are not significantly different. See Table 13 and Table 14.
In the case of Financial vulnerability, Levene test results, with F = 4.747, revealed a significance p = 0.032, a level lower than 0.05, which leads to rejection of the null hypothesis that there is no significant difference between the two sub-samples. Hence, for t-test, we followed “Equal variances not assumed” instance. See Table 15.
Still, the value of t test was −1.523, with a significance level greater than 0.05, confirming the null hypothesis that there are no significant differences between the two sub-samples. The conclusion of univariate analysis is that there are no statically significant differences between the two sub-samples, so there are no significant differences between NGOs and CBOs in terms of sustainability determinants.
5.2. Bivariate Analysis
5.2.1. Sustainability Determinants and NPOs Results
For testing hypotheses related to dimensions of sustainability, we used one-dimensional t test (independent sample t test) for the entire sample. To test hypothesis H1 (Sustainability is determined by three factors: Cognitive competence, Social awareness and Financial vulnerability), we separately tested each determinant. Testing the determinants seeks to determine to what extent different mean scores for each of sustainability determinants affects the nine items shaping sustainability (continuous activity, high degree of autonomy, economic risks, number of employees, explicit scope—community dedication, budget and financial transparency, decision making and NPO equity, stakeholder involvement, and number of volunteers).
The results of univariate analysis of mean scores for determinant Cognitive competence , shown in Table 16, revealed that for nearly all sustainability criteria (both economic and social) no significant differences between non-profits that achieved results and those who consider that they have not reached their targets. The only exception is for criterion of “number of employees” where the significance level of p = 0.007 leads to rejection of the null hypothesis. Given the lack of significant differences between the two sub-samples, we have reviewed the descriptive analysis of Cognitive competence, choosing the items according to the average score obtained per sample, between four and five, a degree equivalent to “Significant” and “Very significant” influence on sustainability. In this instance, we can say that the hypothesis H1 (Cognitive competence is a determinant of NPO sustainability) is validated for the following constructs (in descending order): management expertise, financial expertise, project management expertise, marketing expertise, and economic expertise.
The second hypothesis included in the analysis related to Social awareness. Similar to Cognitive competence, we determined that the null hypothesis—there are no significant differences between average scores of NPOs that achieve or not results—are confirmed for almost all criteria. The only exception is the criterion of “number of employees” where the null hypothesis is not confirmed, given the level of p = 0.024, less than the critical value of 0.05. The results are shown in Table 17.
For this determinant of NPO sustainability, we used the analysis of average scores for each item of Social awareness. The second hypothesis (H2. Social awareness is a determinant of NPO sustainability) is confirmed for the following structure (in descending order of mean scores): public image, project management experience, address social needs, risk acceptance, initiative, entrepreneurial attitude and attitude toward change. All items listed contain values mean scores between four and five, thus affecting in a very significant or significant extent sustainability.
Financial vulnerability was the last determinant analyzed. Similar to the previous two hypotheses, for H3 (Financial vulnerability is a determinant of NPO sustainability), the situation is no different, the only null hypothesis related to criterion number of employees, where a p level of 0.007 was registered. See Table 18.
Using descriptive analysis of the average values, we can state that hypothesis H3 (Financial vulnerability is a determinant of NPO sustainability profile) is confirmed for the following items (in descending order): previous year result, revenue diversification, financial planning and reporting requirements. The items included in this assumption had averages between four and five, corresponding to an influential large and very large.
5.2.2. Testing Validity Using Pearson Correlation Coefficient
Literature has not yet explored NPO sustainability, so we considered it useful to explore the correlation between variables through Pearson coefficient.
Choosing Pearson coefficient rather than a non-parametric test (Spearman) may seem awkward to some, but we decided that, due to the nature of variables (continuous), it would prove our model better. Since there are not many studies available, in our approach, we assume that the three chosen determinants of sustainability (Cognitive competence, Social awareness, Financial vulnerability) are interdependent.
Looking on correlations between each determinant items, shown in Table 19, reveals that, within them, relationships are positive; there is no negative relationship between each determinant items. In the case of Cognitive competence, all correlations are positive, even though there are few strong links between items, while, for the other two determinants, Social awareness and Financial vulnerability, a large number of strong positive relationship with a coefficient r greater than 0.5 are found among all items.
6. Implications and Conclusions
Although most of the initial list of variables was assembled by reviewing existing literature on NPOs sustainability and success factors, their distribution and placement in the final analysis was determined by Romanian NPOs executives’ opinions and insights. This led us to include factors unique to Romania’s situation giving the model uniqueness, for instance Project management experience, since many local NPOs rely on projects to survive. Sometimes, relationships with specific donors are approached in a project management fashion. We investigated several sustainability models and approaches and found that there is limited applicability as a whole to Romanian NPOs. In fact, even though we used four frameworks as pillars for our own, none were entirely operationalized and served more as a beacon. Furthermore, specific items for each determinant were determined separately, first by the authors through literature review and experience, then those selected has to be validated by focus groups and, finally, a quantitative analysis provide final results in terms of suitability
There are, obviously, some common variables, but the mix of factors and most of the approaches reviewed emphasize financial factors, which is normal considering that many non-profits strive for survival. We expressed these factors in terms of vulnerabilities since many non-profits lack precisely this type of resources. However, we put on par other two dimensions, Social awareness and Cognitive competence reflecting internal and external focus of Romanian NPOs.
Empirical results reveal strong links between its components and, since sustainability determinants validation was based on four hypotheses which were all fully or partially validated, we consider it a viable approach which may explain how Romanian NPOs can become sustainable.
Hypothesis 1.
Cognitive competence is a determinant of NPO sustainability—partially validated.
From the initial selection of variables, two were rejected by focus groups participants: Quality management and HR Management expertise. Among the reasons mentioned were lack of significance of HR procedures since most NPOs rely on volunteers or short-term employment, while in terms of quality management many NPOs do not employ any form of formal procedures in this respect. For Cognitive competence, five out of nine items of the model that represent the research sample included the highest values: Management expertise, Financial expertise, Project management expertise, Marketing expertise and Economic expertise. A surprising fact is that Legal expertise and Fiscal expertise seem less important for NPOs executives. Considering the changes in specific regulations, the fact that many non-profits accessed European funded projects where legal expertise is critical, the fast changing fiscal rules (three major changes in the last couple of years), Romanian non-profits executives seems to rather ignore or underestimate them. Similarly, many respondents did not consider involvement of their organizations on networks or umbrella organizations (society expertise variable) as critical for sustainability.
Hypothesis 2.
Social awareness is a determinant of NPO sustainability—fully validated.
Social awareness included seven items of the theoretical model: Public image, Project management experience, Address social needs, Risk acceptance, Initiative, Entrepreneurial attitude and Attitude toward change. An interesting fact is the fact that Project management experience placed so high in the ranking, a confirmation of importance of projects role in organizational capabilities of Romanian non-profits. While Public image has to do more with organizational image in the eyes of stakeholders and public, project management experience involved how professional was non-profit organization in managing and involvement in a project. Since this is a prerequisite to other projects, many executives ranked that high. All initial variables selected by authors were accepted by focus group members and were validated by quantitative analysis.
Hypothesis 3.
Financial vulnerability is a determinant of NPO sustainability—fully validated.
Even though we followed a rather traditional approach for this dimension, we registered the most important rejection rate of initial variables by focus groups. Hence, almost half of them, (Stability of revenue, Accounting ratios and Net asset change) were not further considered for our quantitative analysis. We tried to understand reasons behind this occurrence, but there seems to be no one main reason, with financial literacy and rejection of traditional financial management by Romanian NPOs executives.
Financial vulnerability was validated for all the items included in the theoretical model. Thus, Revenue diversification, Financial planning, Reporting Requirements and Previous year result recorded values between four and five.
Hypothesis 4.
NPO sustainability is determined by the 3 determinants considered—fully validated. This hypothesis was validated for all variables: Cognitive competence, Social awareness and Financial vulnerability.
As for managerial implications, managers of Romanian NPOs could benefit from the above findings in their efforts of strengthening their organizations. Their efforts should be directed to build organizational capacity by emphasizing expertise in terms of management, marketing and project management, and invest resources in non-profit image, since it is equally important, according to our results, to more traditional factors such as financial situation. Of course, financial situation was approached in terms of vulnerability, since we embrace a social perspective of NPOs, with a main focus on social mission fulfillment.
Our approach of Romanian NPOs sustainability can be improved, especially since it resulted from an empirical study. We also assume some research limitations, among which we have to mention: (1) Potential misleading title of some variables or even determinants. For instance, society expertise relates to NPO integration in networks or umbrella organizations, while Cognitive competence for some may mean knowledge access rather than organizational capability, which really is. (2) The sample was small. (3) Initial validation of variables was made by practitioners, executives of NPOs, who did not participate further on the actual empirical study. (4) There was a lack of additional studies on Romanian non-profits, which may further validate our results.
Author Contributions
Ceptureanu Sebastian and Ceptureanu Eduard designed the study. Orzan Mihai and Marin Irinel conducted the literature review. Ceptureanu Sebastian and Ceptureanu Eduard developed the questionnaire, analyzed the data and interpreted the results. Ceptureanu Sebastian, Ceptureanu Eduard, Orzan Mihai and Marin Irinel collected the data. Ceptureanu Sebastian, Ceptureanu Eduard and Orzan Mihai interpreted the results. All authors wrote the paper and revised the manuscript for intellectual content. All authors have read and approved the final manuscript.
Conflicts of Interest
The authors declare no conflict of interest.
References
- Fruttero, A.; Varun, G. The Strategic Choices of NGOs: Location Decisions in Rural Bangladesh. J. Dev. Stud. 2005, 41, 759–787. [Google Scholar] [CrossRef]
- Aldashev, G.; Verdier, T. Goodwill bazaar: NGO competition and giving to development. J. Dev. Econ. 2010, 91, 48–63. [Google Scholar] [CrossRef]
- Werker, E.; Faisal, Z.A. What Do Nongovernmental Organizations Do? J. Econ. Perspect. 2008, 22, 73–92. [Google Scholar] [CrossRef]
- Atkinson, A.; Backus, P.; Micklewright, M.; Pharoah, C.; Schnepf, S. Charitable giving for overseas development: UK trends over a quarter century. J. R. Stat. Soc. A 2012, 175, 167–190. [Google Scholar] [CrossRef]
- Navarra, C. Economics of Development NGOs: A Survey of Existing Datasets. 2013. Available online: http://www.unamur.be/eco/economie/recherche/wpseries/wp/1305.pdf (accessed on 10 December 2016).
- Sassu, V.R. Financing of Non-Profit Sector in Romania. Master’s Thesis, Bucharest University of Economic Studies, Bucharest, Romania, 2014. [Google Scholar]
- European Commission-DG EAC. Volunteering in the European Union; Final Report; GHK: London, UK, 2010. [Google Scholar]
- Valentinov, V.; Vaceková, G. Sustainability of Rural Nonprofit Organizations: Czech Republic and Beyond. Sustainability 2015, 7, 9890–9906. [Google Scholar] [CrossRef]
- McLean, C.; Brouwer, C. The Effects of the Economy on the Non-profit Sector: October 2008–February 2009; GuideStar: Williamsburg, VA, USA, 2009. [Google Scholar]
- Weerawardena, J.; McDonald, R.E.; Sullivan Mort, G. Sustainability of non-profit organizations: An empirical investigation. J. World Bus. 2010, 45, 346–356. [Google Scholar] [CrossRef]
- Mort, G.; Weerawardena, J. Social entrepreneurship: Advancing research and maintaining relevance. In The Routledge Companion to Non-Profit Marketing; Sargeant, A., Wymer, W., Eds.; Routledge: London, UK, 2008; pp. 28–48. [Google Scholar]
- Senge, P.M.; Lichtenstein, B.B.; Kaeufer, K.; Bradbury, H.; Carroll, J.S. Collaborating for systemic change. MIT Sloan Manag. Rev. 2007, 48, 44–53. [Google Scholar]
- National Research Council. Sustainability and the USEPA; National Academic Press: Washington, DC, USA, 2011. [Google Scholar]
- Chetkovich, C.; Frumkin, P. Balancing margin and mission: Non-profit competition in charitable versus fee-based programs. Adm. Soc. 2003, 35, 564–596. [Google Scholar] [CrossRef]
- McDonald, R.E. An investigation of innovation in non-profit organizations: The role of organizational mission. Non-Profit Volunt. Sect. Q. 2007, 36, 256–281. [Google Scholar] [CrossRef]
- Valentinov, V. The economics of non-profit organization: In search of an integrative theory. J. Econ. Issues 2008, 17, 745–761. [Google Scholar] [CrossRef]
- Wijkstrom, F. The Swedish non-profit sector in international comparison. Ann. Pub. Coop. Econ. 1997, 68, 625–663. [Google Scholar] [CrossRef]
- Dart, R. Being ‘business-like’ in a non-profit organization: A grounded and inductive typology. Non-Profit Volunt. Sect. Q. 2004, 33, 290–310. [Google Scholar] [CrossRef]
- Goerke, J. Taking the quantum leap: Non-profits are now in business. An Australian perspective. Intern. J. Non-Profit Volunt. Sect. Mark. 2003, 8, 317–327. [Google Scholar] [CrossRef]
- Money, K.; Money, A.; Downing, S.; Hillenbrand, C. Relationship marketing and the not-for-profit sector: An extension and application of the commitment trust theory. In The Routledge Companion to Non-Profit Marketing; Sargeant, A., Wymer, W., Eds.; Routledge: London, UK, 2008; pp. 28–48. [Google Scholar]
- Arnett, D.B.; German, S.D.; Hunt, S.D. The identity salience model of relationship marketing success: The case of non-profit marketing. J. Mark. 2003, 67, 89–105. [Google Scholar] [CrossRef]
- Lee, L.; Piliavin, J.A.; Call, V.R.A. Giving time, money, and blood: Similarities and differences. Soc. Psychol. Q. 1999, 62, 276–290. [Google Scholar] [CrossRef]
- Berger, I.E.; Cunningham, P.H.; Drumwright, M.E. Social alliances: Company/non-profit collaboration. Calif. Manag. Rev. 2004, 47, 58–90. [Google Scholar] [CrossRef]
- Weisbrod, B.A. The non-profit mission and its financing. J. Policy Anal. Manag. 1998, 17, 165–174. [Google Scholar] [CrossRef]
- Handy, F.; Srinivasan, N. Improving quality while reducing costs? An economic evaluation of the net benefits of hospital volunteers. Non-Profit Volunt. Sect. 2004, 33, 28–54. [Google Scholar] [CrossRef]
- Snavely, K.; Tracy, M.B. Collaboration among rural non-profit organizations. Non-Profit Manag. Leadersh. 2000, 11, 145–165. [Google Scholar] [CrossRef]
- Greenlee, J.S.; Trussel, J.M. Predicting the financial vulnerability of charitable organizations. Non-Profit Manag. Leadersh. 2000, 11, 199–210. [Google Scholar] [CrossRef]
- Keating, E.K.; Fisher, M.; Gordon, T.P.; Greenlee, J.S. Assessing Financial Vulnerability in the Non-Profit Sector; John F. Kennedy, School of Government: Cambridge, MA, USA, 2005. [Google Scholar]
- Silva, B.; Burger, R. Financial Vulnerability: An Empirical Study of Ugandan NGOs. CIRIEC 15, Working Paper. 2015. Available online: http://hec-cloud01.segi.ulg.ac.be/repec/wp15-15.pdf (accessed on 8 January 2017).
- Prentice, C.R. Why So Many Measures of Non-profit Financial Performance? Analyzing and Improving the Use of Financial Measures in Non-profit Research. Non-Profit Volunt. Sect. Q. 2016, 45, 715–740. [Google Scholar] [CrossRef]
- Weikart, L.; Chen, G.; Sermier, E. Budgeting & Financial Management for Non-Profit Organizations: Using Money to Drive Mission Success; CQ Press: Los Angeles, CA, USA, 2013. [Google Scholar]
- McLaughlin, T. Streetsmart: Financial Basics for Non-Profit Managers; John Wiley: Hoboken, NJ, USA, 2009. [Google Scholar]
- Coe, C. Non-Profit Financial Management: A Practical Guide; John Wiley: Hoboken, NJ, USA, 2011. [Google Scholar]
- Zietlow, J.; Hankin, J.; Seidner, A. Financial Management for Non-Profit Organizations: Policies and Practices; John Wiley: Hoboken, NJ, USA, 2007. [Google Scholar]
- Scheirer, M.A. Is Sustainability Possible? A Review and Commentary on Empirical Studies of Program Sustainability. Am. J. Eval. 2005, 26, 320–347. [Google Scholar] [CrossRef]
- Crisp, B.; Swerissen, H. Program, agency and effect sustainability in health promotion. Health Promot. J. Aust. 2002, 13, 40–43. [Google Scholar]
- Glasgow, R.E.; Vogt, T.M.; Boles, S.M. Evaluating the public health impact of health promotion interventions: the RE-AIM framework. Am. J. Health Promot. 1999, 89, 1322–1327. [Google Scholar] [CrossRef]
- Steckler, A.; Goodman, R.M. How to institutionalize health promotion programs. Am. J. Health Promot. 1989, 3, 34–43. [Google Scholar] [CrossRef] [PubMed]
- Harvey, G.; Hurworth, R. Exploring program sustainability: Identifying factors in two educational initiatives in Victoria. Eval. J. Australas. 2006, 6, 36–44. [Google Scholar]
- Shediac-Rizkallah, M.C.; Bone, L.R. Planning for the sustainability of community-based health programs: conceptual frameworks and future directions for research, practice and policy. Health Educ. Res. 1998, 13, 87–108. [Google Scholar] [CrossRef] [PubMed]
- Hailey, J. Models of INGO Sustainability: Balancing Restricted and Unrestricted Funding, Briefing Paper 41. 2014. Available online: https://www.bond.org.uk/sites/default/files/resource-documents/ngo-sustainability-hailey-intrac-briefing-paper-41-2014.pdf (accessed on 2 March 2017).
- Pathfinder International. Fundamentals of NGO Financial Sustainability; Abt Associates Inc.: Cambridge, MA, USA, 1994. [Google Scholar]
- CSO Sustainability Index. Available online: https://www.usaid.gov/what-we-do/democracy-human-rights-and-governance/cso-sustainability-index-methodology (accessed on 16 December 2016).
- Nuka, D. Sustainability of NGOs in Kosova: Challenges of the Third Sector and the Ways Forward. Master’s Thesis, Rochester Institute of Technology, New York, NY, USA, 2010. [Google Scholar]
- Okorley, E.L.; Nkrumah, E.E. Organizational factors influencing sustainability of local non-governmental organizations. Lessons from a Ghanaian context. Intern. J. Soc. Econ. 2012, 39, 330–341. [Google Scholar] [CrossRef]
- Schaffer, S. Success Factors for Non-Profit Organizations. A New Approach to the Development of Thriving Mission-Driven Enterprises; Public Interest Management Group: Seattle, WA, USA, 2015. [Google Scholar]
- Peredo, A.M.; McLean, M. Social entrepreneurship: A critical review of the concept. J. World Bus. 2006, 41, 56–65. [Google Scholar] [CrossRef]
- Dees, G. The Meaning of Social Entrepreneurship. 1998. Available online: http://community-wealth.org/sites/clone.community-wealth.org/files/downloads/paper-dees.pdf (accessed on 3 March 2017).
- Anderson, B.B.; Dees, J.G. Developing viable earned income strategies. In Strategic Tools for Social Entrepreneurs: Enhancing the Performance of Your Enterprising Non-Profit; Dees, J.G., Emerson, J., Economy, P., Eds.; John Wiley & Sons, Inc.: New York, NY, USA, 2002; pp. 191–233. [Google Scholar]
- Dees, G.; Emerson, J.; Economy, P. (Eds.) Strategic Tools for Social Entrepreneurs: Enhancing the Performance of Your Enterprising Non-Profit; John Wiley & Sons, Inc.: New York, NY, USA, 2002. [Google Scholar]
- Mair, J.; Marti, I. Social entrepreneurship research: A source of explanation, prediction and delight. J. World Bus. 2006, 41, 36–44. [Google Scholar] [CrossRef]
- Eikenberry, A.M.; Kluver, J.D. The marketization of the non-profit sector: Civil society at risk. Public Adm. Rev. 2004, 64, 132–140. [Google Scholar] [CrossRef]
- Bassi, A.; Vincenti, G. Toward a New Metrics for the Evaluation of the Social Added Value of Social Enterprises. CIRIEC España 2015, 83, 9–42. [Google Scholar]
- Sharir, M.; Lerner, M. Gauging success ventures initiated by individual social entrepreneurs. J. World Bus. 2006, 41, 6–20. [Google Scholar] [CrossRef]
- Nicholls, A. Social Entrepreneurship: New Models of Sustainable Social Change; Oxford University Press: Oxford, UK, 2006; pp. 1–36. [Google Scholar]
- Sokolowski, S.W. Innovation, professional interests, and nonprofit organizations: The case of health care in Poland. Nonprofit Management & Leadership 1998, 8, 363. [Google Scholar]
- Macedo, I.M.; Pinho, J.C. The relationship between resource dependence and market orientation: The specific case of non-profit organizations. Eur. J. Mark. 2006, 40, 533–553. [Google Scholar] [CrossRef]
- Forehand, A. Mission and organizational performance in the healthcare industry. J. Healthc. Manag. 2000, 45, 267–277. [Google Scholar] [PubMed]
- Durst, S.L.; Newell, C. The who, why, and how of reinvention in non-profit organizations. Non-Profit Manag. Leadersh. 2001, 11, 443–457. [Google Scholar] [CrossRef]
- Zolkiewski, J. Marketization and the delivery of UK health services: Three case studies. J. Bus. Res. 2004, 57, 1012–1020. [Google Scholar] [CrossRef]
- Hadzi-Miceva, K. Legal and Institutional Mechanisms for NGO-Government Cooperation in Croatia, Estonia and Hungary 2007. Available online: http://heakodanik.ee/sites/default/files/files/213_Legal%20and%20Institutional%20Mechanisms%20for%20Cooperation.pdf (accessed on 9 March 2017).
- Ceptureanu, S.; Ceptureanu, E.; Sassu, V.R. Financing of Romanian Non-Governmental Organizations. Manag. Econ. Rev. 2017, in press. [Google Scholar]
- Civil Society Development Foundation. NGO Leaders Barometer, (Romanian). 2012. Available online: http://www.fdsc.ro/library/files/barometru_2012.pdf (accessed on 11 November 2016).
- FDSC Indexul Sustenabilitatii Organizatiilor Societatii Civile. 2015. Available online: http://www.fdsc.ro/library/files/indexusaidromania_2015+.pdf (accessed on 10 December 2016).
- Blaikie, N.W.H. Designing Social Research; Polity Press: Cambridge, UK, 2000. [Google Scholar]
- Cordes, J.; Henig, J.; Twombly, E. Nonprofit Human Service Providers in an Era of Privatization: Organizational Adaptation to Changing Environments in Three Policy Areas. In Nonprofits in Urban America; Hula, R.C., Jackson-Elmoore, C., Eds.; Quorum Books: Westport, CT, USA, 2000. [Google Scholar]
- De Vita, C.J.; Fleming, C.; Twombly, E. Building Nonprofit Capacity. A Framework for Addressing the Problem. In Building Capacity in Nonprofit Organizations; De Vita, C.J., Fleming, C., Eds.; The Urban Institute: Washington, DC, USA, April 2001; p. 5. [Google Scholar]
- Minkoff, D. Producing Social Capital: National Social Movements and Civil Society. Am. Behav. Sci. 1997, 40, 605–618. [Google Scholar] [CrossRef]
- Boris, E.T. The Nonprofit Sector in the 1990s. In Philanthropy and the Nonprofit Sector; Clotfelter, C.T., Ehrlich, T., Eds.; Indiana University Press: Bloomington, IN, USA, 1999. [Google Scholar]
- Hilton, M.; McKay, J.; Crowson, N.; Mouhot, J.-F. The Politics of Expertise. How NGOs Shaped Modern Britain; Oxford University Press: Oxford, UK, 2013. [Google Scholar]
- Helmig, B.; Jegers, M.; Lapsley, I. Challenges in Managing Non-profit Organizations: A Research Overview. Voluntas: Intern. J. Volunt. Non-Profit Organ. 2004, 15, 101–116. [Google Scholar] [CrossRef]
- Rentschler, R.; Radbourne, J.; Carr, R.; Rickard, J. Relationship marketing, audience retention and performing arts organisation viability. Intern. J. Non-Profit Volunt. Sector Mark. 2002, 7, 118–130. [Google Scholar] [CrossRef]
- Iwu, C.G.; Kapondoro, L.; Twum-Darko, M.; Tengeh, R. Determinants of Sustainability and Organizational Effectiveness in Non-Profit Organizations. Sustainability 2015, 7, 9560–9573. [Google Scholar] [CrossRef]
- Kilby, P. Accountability for Empowerment: Dilemmas Facing Non-Governmental Organizations. World Dev. 2006, 34, 951–963. [Google Scholar] [CrossRef]
- Moore, D. Laws and other mechanisms for promoting NGO financial sustainability. Intern. J. Not-For-Profit Law 2005, 7. Available online: www.icnl.org/knowledge/pubs/FinancialSustainability.pdf (accessed on 20 July 2010).
- Hadzi-Miceva, K. A Supportive Financing Framework for Social Economy Organizations 2005 European Center for Not-for-Profit Law. Available online: http://ecnl.org/dindocuments/50_ECNL%20paper%20OECD%20August%2005.pdf (accessed on 9 March 2017).
- Broekhuis, M.; Vos, J.F.J. Improving Organizational Sustainability Using a Quality Perspective; University of Groningen, Research Institute SOM: Groningen, The Netherlands, 2003; Available online: http://som.eldoc.ub.rug.nl/FILES/reports/themeA/2003/03A43/03A43.pdf (accessed on 7 March 2017).
- Funtowicz, S.; Ravetz, J. Uncertainty, complexity and post-normal science. Environ. Toxicol. Chem. 1994, 13, 1881–1885. [Google Scholar] [CrossRef]
- Ridder, H.-G.; McCandless, A. Influences on the architecture of human resource management in non-profit organizations: An analytical framework. Non-Profit Volunt. Sect. Q. 2010, 39, 124–141. [Google Scholar] [CrossRef]
- Prahalad, C.K. The Fortune at the Bottom of the Pyramid: Eradicating Poverty through Profits; Wharton School Publishing: Upper Saddle River, NJ, USA, 2004. [Google Scholar]
- Gray, B.; Stites, J.P. Sustainability through Partnerships. Capitalizing on Collaboration, Network for Business Sustainability. 2013. Available online: http://nbs.net/wp-content/uploads/NBS-Systematic-Review-Partnerships.pdf (accessed on 9 January 2017).
- Thompson, J.L.; Alvy, G.; Lees, A. Social entrepreneurship—A new look at the people and the potential. Manag. Decision 2000, 38, 328–338. [Google Scholar] [CrossRef]
- Austin, J.; Stevenson, H.; Wei-Skillern, J. Social and Commercial Entrepreneurship: Same, Different or Both? Entrep. Theory Pract. 2006, 30, 1–22. [Google Scholar] [CrossRef]
- Alvord, S.; Brown, L.; Letts, C. Social entrepreneurship & societal transformation: An exploratory study. J. Appl. Behav. Sci. 2004, 40, 260–282. [Google Scholar]
- Turner, D.; Martin, S. Social entrepreneurship and social inclusion: Building local capacity or delivering national priorities. Intern. J. Public Adm. 2005, 28, 797–806. [Google Scholar] [CrossRef]
- Parsons, E.; Broadbridge, A. Managing Change in Non-profit Organizations: Insights from the UK Charity Retail Sector. Voluntas Intern. J. Volunt. Non-Profit Organ. 2004, 15, 227–242. [Google Scholar] [CrossRef]
- Romanian Civil Society Development Foundation. Romania 2010: The Nongovernmental Sector. 2010. Available online: http://www.fdsc.ro/library/Brosura%20_engleza_final.pdf (accessed on 23 November 2016).
- Murtaza, N. Putting the Lasts First: The Case for Community-Focused and Peer-Managed NGO Accountability Mechanisms. Voluntas 2012, 23, 109–125. [Google Scholar] [CrossRef]
- Edwards, M. Foreword. In NGO Accountability: Politics, Principles and Innovations; Jordan, L., van Tuijl, P., Eds.; Earthscan: London, UK, 2006. [Google Scholar]
- Hodge, M.M.; Piccolo, R.F. Funding source, board involvement techniques, and financial vulnerability in non-profit organizations: A test of resource dependence. Non-Profit Manag. Leadersh. 2005, 16, 171–190. [Google Scholar] [CrossRef]
- Kanter, R.M.; Summers, D.V. Public sector management: Theories critique & practice. In Doing Well While Doing Good: Dilemmas of Performance Measurement in Nonprofit Organizations and the Need for a Multiple-Constituency Approach; McKecitt, D., Lawton, A., Eds.; Sage: London, UK, 1994. [Google Scholar]
- Weisbrod, B.A. To profit or not to profit: The commercial transformation of the nonprofit sector. In Modeling the Nonprofit Organization as a Multiproduct Firm: A Framework for Choice; Weisbrod, B.A., Arrow, K.J., Eds.; Cambridge University Press: Cambridge, UK, 1998. [Google Scholar]
- Sawhill, J.C.; Williamson, D. Mission impossible? Measuring success in non-profit organizations. Non-Profit Manag. Leadersh. 2001, 11, 371–386. [Google Scholar] [CrossRef]
- Lecy, J.D.; Schmitz, H.P.; Swedlund, H. Non-governmental and not-for-profit organizational effectiveness: A modern synthesis. Voluntas Intern. J. Volunt. Nonprofit Organ. 2011, 23, 434–457. [Google Scholar] [CrossRef]
- Hager, M.A. Financial vulnerability among arts organizations: A test of the Tuckman-Chang measures. Nonprofit Volunt. Sect. Q. 2001, 30, 376–392. [Google Scholar] [CrossRef]
- Helmig, B.; Spraul, K.; Tremp, K. Replication studies in non-profit research: A generalization and extension of findings regarding the media publicity of non-profit organizations. Non-Profit Volunt. Sect. Q. 2011, 41, 360–385. [Google Scholar] [CrossRef]
- Amendola, A.; Garofalo, M.R.; Nese, A. Is the third sector an emerging economic institution? Social preferences versus poverty traps. Non-Profit Volunt. Sect. 2011, 40, 850–872. [Google Scholar] [CrossRef]
- Tuckman, H.P. To profit or not to profit: The commercial transformation of the nonprofit sector. In Competition, Commercialization, and Organizational Structures; Weisbrod, B.A., Arrow, K.J., Eds.; Cambridge University Press: Cambridge, UK, 1998; pp. 25–42. [Google Scholar]
- Duckles, B.M.; Hager, M.A.; Galaskiewicz, J. Best papers from the Davis conference on qualitative research. In How Nonprofits Close: Using Narratives to Study Organizational Processes; Elsbach, K.D., Ed.; Information Age Publishing: Greenwich, UK, 2005; pp. 169–203. [Google Scholar]
- George, D.; Mallery, P. SPSS for Windows Step by Step: A Simple Guide and Reference 11.0 Update, 4th ed.; Allyn & Bacon: Boston, MA, USA, 2003. [Google Scholar]
Figure 1.
Evolution of Romanian non-profit sector for 1996–2016 (Source: FDSC Indexul Sustenabilitatii Organizatiilor Societatii Civile, 2015 [64]).
Figure 1.
Evolution of Romanian non-profit sector for 1996–2016 (Source: FDSC Indexul Sustenabilitatii Organizatiilor Societatii Civile, 2015 [64]).


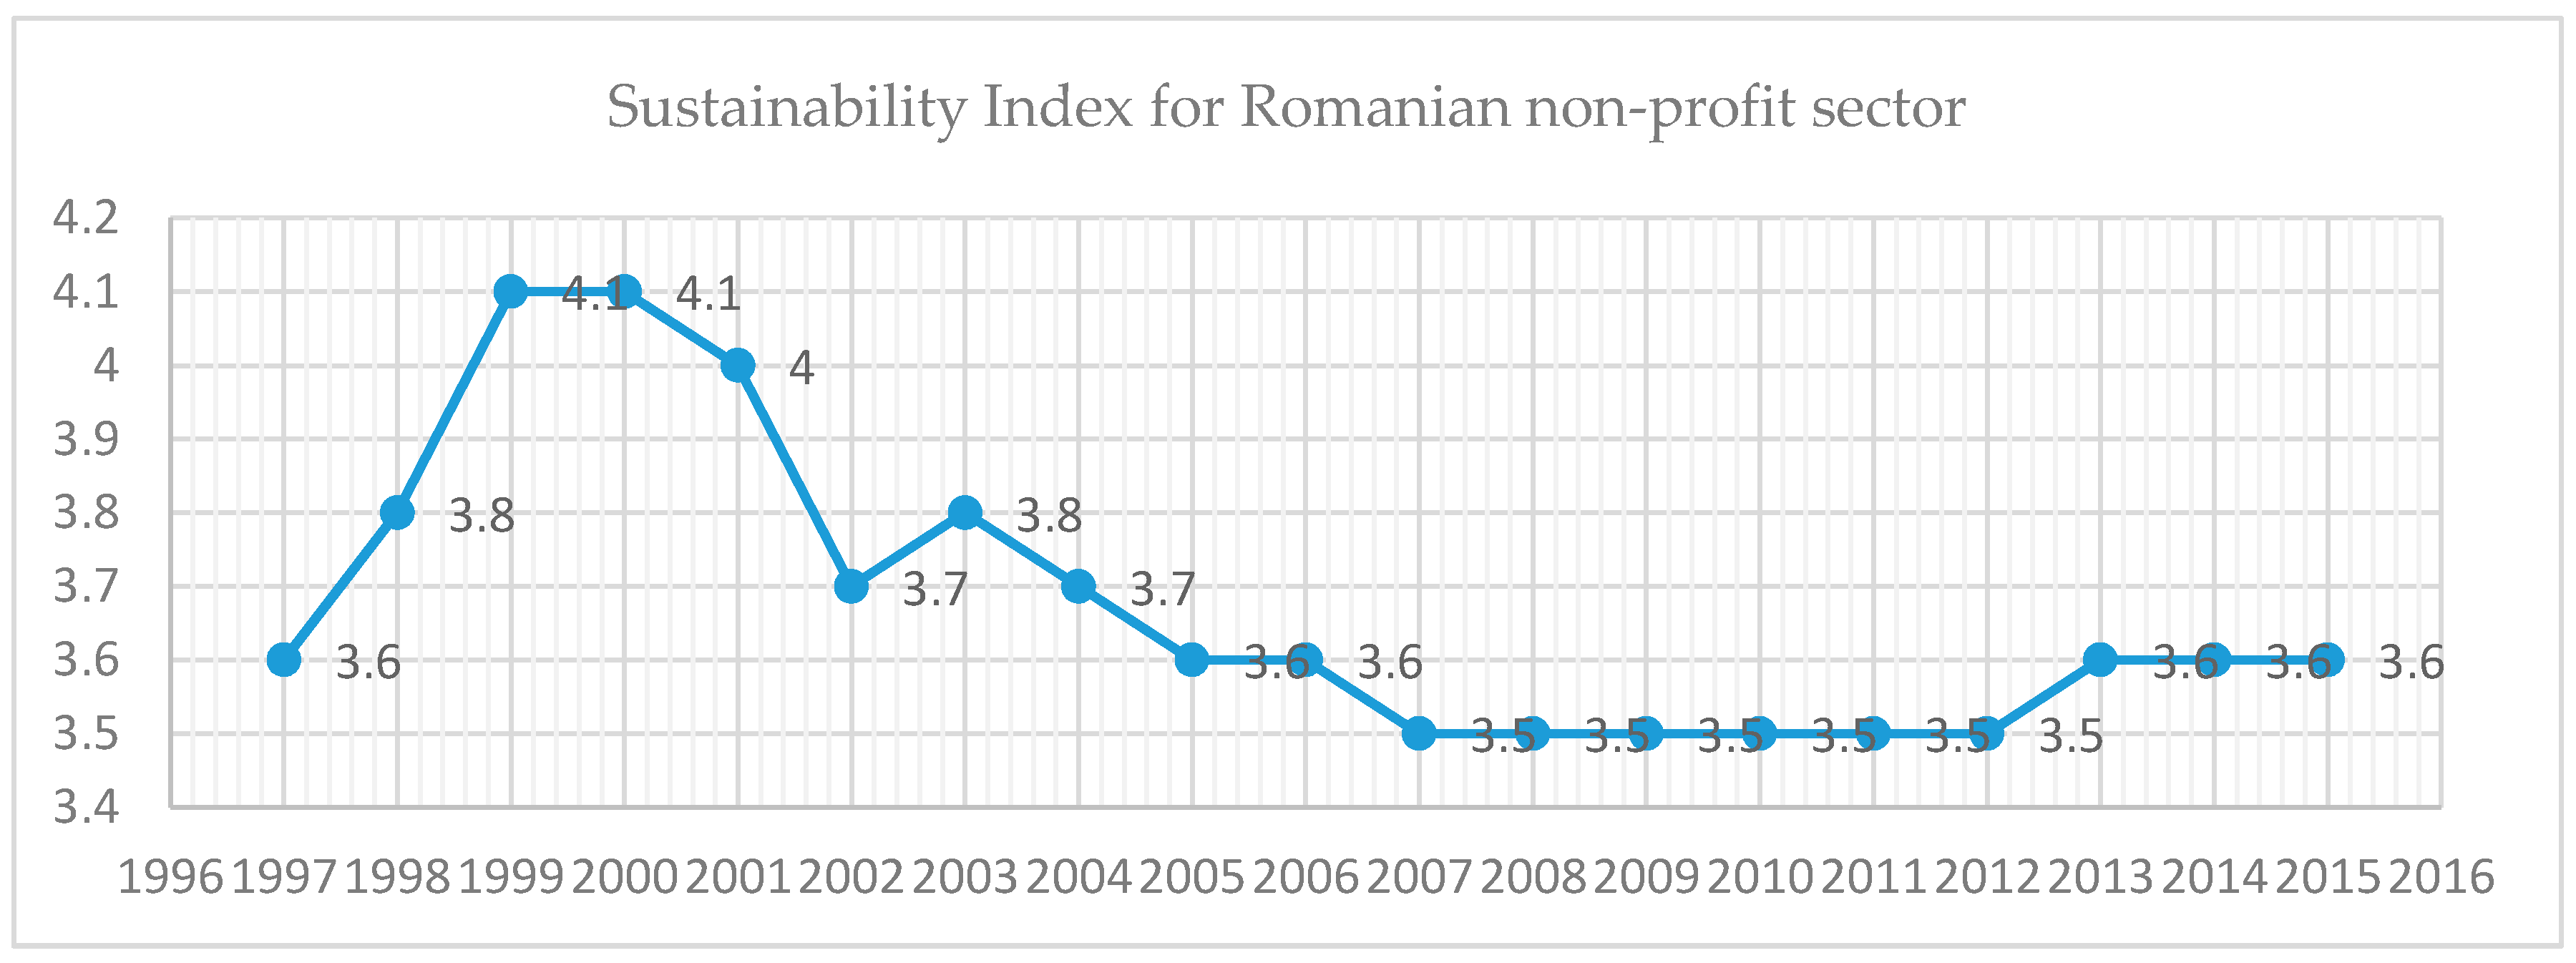
Table 1.
Sample structure.
| Criteria | Description | N | % |
|---|---|---|---|
| NPO type | NGO | 55 | 53.39% |
| CBO | 48 | 46.61% | |
| NPO age | Less than 5 years old | NGOs | 76.4% |
| CBOs | 37.5% | ||
| 5–10 years old | NGOs | 18.2% | |
| CBOs | 33.33% | ||
| More than 5 years old | NGOs | 5.5% | |
| CBOs | 29.17% | ||
| NPO size | Small | NGOs | 78.19% |
| CBOs | 89.59% | ||
| Medium | NGOs | 16.36% | |
| CBOs | 10.41% | ||
| Large | NGOs | 5.45% | |
| CBOs | 0.00% | ||
| NPO main activity | NGOs | Human rights and democracy | 7.27% |
| Justice and anti-corruption | 3.64% | ||
| Education | 23.64% | ||
| Youth empowerment | 14.55% | ||
| Professional associations | 27.27% | ||
| Health | 14.55% | ||
| Environment protection | 7.27% | ||
| Other | 1.81% | ||
| CBOs | Community services | 43.75% | |
| Support for disadvantaged groups (e.g., Roma) | 25.00% | ||
| Rural development | 12.50% | ||
| Poor communities development | 8.33% | ||
| Urban development | 8.33% | ||
| Other | 2.08% | ||
| Area of operations | NGOs | Urban | 83.63% |
| Rural | 16.37% | ||
| CBOs | Urban | 25.00% | |
| Rural | 75.00% |
Table 2.
Cognitive competence: initial set of variables.
| Determinant | Items Considered | References |
|---|---|---|
| Cognitive competence | Society expertise | [70] |
| Marketing expertise | [21,52,60,71,72] | |
| Management expertise | [45,71,73,74] | |
| Project management expertise | [6,62] | |
| Entrepreneurial expertise | [54,55] | |
| Economic expertise | [52,60,71] | |
| Financial expertise | [52,60,71] | |
| Legal expertise | [61,75,76] | |
| Fiscal expertise | [52,60,71] | |
| Quality management expertise | [77] | |
| Human resources expertise | [74,78,79] |
Table 3.
Cognitive competence: final set of variables.
| Determinant | Items | Item Code | Description | Measurement |
|---|---|---|---|---|
| Cognitive competence | Society expertise | CC_1 | NPO know how in terms of network and specific infrastructure integration | Likert scale, from 1 to 5 |
| Marketing expertise | CC_2 | NPO know how in terms of setting up and develop lobby campaigns, construct a positive public image | Likert scale, from 1 to 5 | |
| Management expertise | CC_3 | NPO know how in terms of organizational administration | Likert scale, from 1 to 5 | |
| Project management expertise | CC_4 | NPO know how in terms of managing a project | Likert scale, from 1 to 5 | |
| Entrepreneurial expertise | CC_5 | NPO know how in terms of promoting specific innovations (services and operations) | Likert scale, from 1 to 5 | |
| Economic expertise | CC_6 | NPO know how in terms of handling organizational assets | Likert scale, from 1 to 5 | |
| Financial expertise | CC_7 | NPO know how in terms of financial reporting to various stakeholders (state, donors, etc.) | Likert scale, from 1 to 5 | |
| Legal expertise | CC_8 | NPO know how in terms of legislation, rules and procedures | Likert scale, from 1 to 5 | |
| Fiscal expertise | CC_9 | NPO know how in terms of fiscal regulations | Likert scale, from 1 to 5 | |
| Quality management expertise | Rejected | |||
| Human resources expertise | Rejected |
Table 4.
Social awareness: initial set of variables.
| Determinant | Items Considered | References |
|---|---|---|
| Social awareness of NPO | Address social needs | [40,80,81] |
| Public image | [43,71] | |
| Project management experience | Unique variable, determined by focus groups | |
| Risk acceptance | [47,51,55,82,83,84,85] | |
| Initiative | [54,55] | |
| Attitude toward change | [84,86] | |
| Entrepreneurial attitude | [73,83,85] |
Table 5.
Social awareness: final set of variables.
| Determinant | Items | Item Code | Description | Measurement |
|---|---|---|---|---|
| Social awareness of NPO | Address social needs | SA_1 | NPO fulfillment of its mission | Likert scale, from 1 to 5 |
| Public image | SA_2 | NPO public image for stakeholders | Likert scale, from 1 to 5 | |
| Project management experience | SA_3 | NPO image for others in terms of successfully running/supporting a project | Likert scale, from 1 to 5 | |
| Risk acceptance | SA_4 | NPO availability to accept risks | Likert scale, from 1 to 5 | |
| Initiative | SA_5 | NPO availability to start new endeavors, involve in new activities | Likert scale, from 1 to 5 | |
| Attitude toward change | SA_6 | NPO availability to implement new processes | Likert scale, from 1 to 5 | |
| Entrepreneurial attitude | SA_7 | NPO availability to target new beneficiaries, shift to developing needs of their clients | Likert scale, from 1 to 5 |
Table 6.
Financial vulnerability: initial set of variables.
| Determinant | Items Considered | References |
|---|---|---|
| Financial vulnerability | Reporting Requirements | [30,31,32,33,34,88,89] |
| Revenue diversification | [28,29,30,90] | |
| Financial planning | [28,29,30,43,44] | |
| Previous year result | [29,30,43,44] | |
| Stability of revenue | [29,30,43,44] | |
| Accounting ratios | [29,30,43,44] | |
| Net asset change | [28,29,30] |
Table 7.
Financial vulnerability: final set of variables.
| Determinant | Items | Item Code | Description | Measurement |
|---|---|---|---|---|
| Financial vulnerability | Reporting Requirements | FV_1 | NPO must comply to specific donor rules, allowing less options to reallocate expenditures | Likert scale, from 1 to 5 |
| Revenue diversification | FV_2 | NPO number of revenue sources | Likert scale, from 1 to 5 | |
| Financial planning | FV_3 | NPO has any form of financial planning | Likert scale, from 1 to 5 | |
| Previous year result | FV_4 | Financial result of previous year | Likert scale, from 1 to 5 | |
| Stability of revenue | Rejected | |||
| Accounting ratios | Rejected | |||
| Net asset change | Rejected |
Table 8.
Sustainability (NPO results): initial values.
| Result | Dimension | Items | Item Code | References |
|---|---|---|---|---|
| Sustainability (NPO results) | Economic results | Continuous activity | ER_1 | [92,93] |
| High degree of autonomy | ER_2 | [92,93] | ||
| Significant economic risks | ER_3 | [92,93] | ||
| Small number of employees | ER_4 | [92,93] | ||
| Social results | Explicit scope, community dedication | SR_1 | [94,95] | |
| Budget and financial transparency | SR_2 | [96,97,98] | ||
| Decision making is not based on NPO equity | SR_3 | [94,99] | ||
| Stakeholder involvement in financial decisions | SR_4 | [100] | ||
| High number of volunteers | SR_5 | [73] |
Table 9.
One-sample Kolmogorov–Smirnov test.
| Total Cognitive Competence | Total Social Awareness | Total Financial Vulnerability | ||
|---|---|---|---|---|
| N | 103 | 103 | 103 | |
| Normal Parameters | Mean | 47.6214 | 50.7961 | 47.6796 |
| Std. Deviation | 6.22789 | 6.06074 | 5.53636 | |
| Most Extreme Differences | Absolute | 0.073 | 0.084 | 0.093 |
| Positive | 0.073 | 0.064 | 0.093 | |
| Negative | −0.056 | −0.084 | −0.089 | |
| Kolmogorov–Smirnov Z | 0.737 | 0.848 | 0.944 | |
| Asymp. Sig. (2-tailed) | 0.649 | 0.468 | 0.335 | |
Table 10.
Cognitive competence—mean values per item.
| Items | Mean Value |
|---|---|
| Society expertise | 3.913 |
| Marketing expertise | 4.019 |
| Management expertise | 4.184 |
| Project management expertise | 4.117 |
| Entrepreneurial expertise | 3.757 |
| Economic expertise | 4.002 |
| Financial expertise | 4.146 |
| Legal expertise | 3.942 |
| Fiscal expertise | 3.854 |
Table 11.
Social awareness—mean values per item.
| Items | Mean Value |
|---|---|
| Address social needs | 4.175 |
| Public image | 4.301 |
| Project management experience | 4.252 |
| Risk acceptance | 4.155 |
| Initiative | 4.146 |
| Attitude toward change | 4.019 |
| Entrepreneurial attitude | 4.078 |
Table 12.
Financial vulnerability—mean values per item.
| Items | Mean Value |
|---|---|
| Reporting Requirements | 4.019 |
| Revenue diversification | 4.175 |
| Financial planning | 4.155 |
| Previous year result | 4.252 |
Table 13.
Mean value comparison for Cognitive competence.
| Cognitive Competence | ||||||||
|---|---|---|---|---|---|---|---|---|
| Sample | N | Mean | Standard Deviation | Levene Test | t Test | |||
| F | p | t | Df | p | ||||
| NGOs | 55 | 47.4000 | 6.18720 | 0.238 | 0.627 | −0.385 | 101 | 0.701 |
| CBOs | 48 | 47.8750 | 6.33002 | |||||
Table 14.
Mean value comparison for Social awareness.
| Social Awareness | ||||||||
|---|---|---|---|---|---|---|---|---|
| Sample | N | Mean | Standard Deviation | Levene Test | t Test | |||
| F | p | t | Df | p | ||||
| NGOs | 55 | 46.20 | 5.99 | 0.643 | 0.425 | −0.821 | 101 | 0.414 |
| CBOs | 48 | 47.10 | 5.05 | |||||
Table 15.
Mean value comparison for Financial vulnerability.
| Financial Vulnerability | ||||||||
|---|---|---|---|---|---|---|---|---|
| Sample | N | Mean | Standard Deviation | Levene Test | t Test | |||
| F | p | t | Df | p | ||||
| NGOs | 55 | 46.92 | 6.35 | 4.747 | 0.032 | −1.523 | 95.619 | 0.131 |
| CBOs | 48 | 48.54 | 4.32 | |||||
Table 16.
Cognitive competence is affecting NPO sustainability.
| Cognitive Competence | |||||||||
|---|---|---|---|---|---|---|---|---|---|
| Results (Sustainability) | Fulfilled | N | Mean | Standard Deviation | Levene Test | t Test | |||
| F | p | T | Df | p | |||||
| Continuous activity | yes | 90 | 48.0000 | 6.28177 | 0.265 | 0.608 | 1.637 | 101 | 0.105 |
| no | 13 | 45.0000 | 5.33854 | ||||||
| High degree of autonomy | yes | 76 | 47.6974 | 6.15363 | 0.019 | 0.891 | 0.207 | 101 | 0.837 |
| no | 27 | 47.4074 | 6.54722 | ||||||
| Significant economic risks | yes | 64 | 47.3906 | 6.18913 | 0.003 | 0.954 | −0.480 | 101 | 0.632 |
| no | 39 | 48.0000 | 6.35361 | ||||||
| Small number of employees | yes | 80 | 46.7500 | 5.88175 | 0.668 | 0.416 | −2.731 | 101 | 0.007 |
| no | 23 | 50.6522 | 6.57550 | ||||||
| Explicit scope, community dedication | yes | 75 | 47.8133 | 6.29821 | 0.286 | 0.594 | 0.510 | 101 | 0.611 |
| no | 28 | 47.1071 | 6.11821 | ||||||
| Budget and financial transparency | yes | 38 | 47.8158 | 6.90810 | 1.436 | 0.234 | 0.241 | 101 | 0.810 |
| no | 65 | 47.5077 | 5.84734 | ||||||
| Decision making is not based on NPO equity | yes | 53 | 48.6792 | 5.96068 | 0.058 | 0.811 | 1.794 | 101 | 0.076 |
| no | 50 | 46.5000 | 6.36717 | ||||||
| Stakeholder involvement in financial decisions | yes | 67 | 48.1642 | 6.21239 | 0.153 | 0.697 | 1.209 | 101 | 0.229 |
| no | 36 | 46.6111 | 6.21647 | ||||||
| High number of volunteers | yes | 54 | 47.6111 | 6.72202 | 1.040 | 0.310 | −0.017 | 101 | 0.986 |
| no | 49 | 47.6327 | 5.70341 | ||||||
Table 17.
Social awareness is affecting NPO sustainability.
| SOCIAL AWARENESS | |||||||||
|---|---|---|---|---|---|---|---|---|---|
| Results (Sustainability) | Fulfilled | N | Mean | Standard Deviation | Levene Test | t Test | |||
| F | p | T | Df | p | |||||
| Continuous activity | yes | 90 | 51.1222 | 5.96399 | 0.104 | 0.747 | 1.444 | 101 | 0.152 |
| no | 13 | 48.5385 | 6.48865 | ||||||
| High degree of autonomy | yes | 76 | 50.8026 | 5.91500 | 1.063 | 0.305 | 0.018 | 101 | 0.986 |
| no | 27 | 50.7778 | 6.57111 | ||||||
| Significant economic risks | yes | 64 | 50.5156 | 6.05004 | 0.000 | 0.997 | −0.600 | 101 | 0.550 |
| no | 39 | 51.2564 | 6.12896 | ||||||
| Small number of employees | yes | 80 | 50.0750 | 5.87157 | 0.022 | 0.881 | −2.299 | 101 | 0.024 |
| no | 23 | 53.3043 | 6.16762 | ||||||
| Explicit scope, community dedication | yes | 75 | 51.5067 | 5.75484 | 0.629 | 0.430 | 1.975 | 101 | 0.051 |
| no | 28 | 48.8929 | 6.54522 | ||||||
| Budget and financial transparency | yes | 38 | 51.1842 | 6.06655 | 0.470 | 0.495 | 0.495 | 101 | 0.622 |
| no | 65 | 50.5692 | 6.09295 | ||||||
| Decision making is not based on NPO equity | yes | 53 | 51.5849 | 6.00459 | 0.040 | 0.843 | 1.366 | 101 | 0.175 |
| no | 50 | 49.9600 | 6.06751 | ||||||
| Stakeholder involvement in financial decisions | yes | 67 | 51.4925 | 5.38340 | 3.472 | 0.065 | 1.603 | 101 | 0.112 |
| no | 36 | 49.5000 | 7.05286 | ||||||
| High number of volunteers | yes | 54 | 51.5741 | 5.59178 | 1.474 | 0.227 | 1.373 | 101 | 0.173 |
| no | 49 | 49.9388 | 6.48848 | ||||||
Table 18.
Financial vulnerability is affecting NPO sustainability.
| FINANCIAL VULNERABILITY | |||||||||
|---|---|---|---|---|---|---|---|---|---|
| Results (Sustainability) | Fulfilled | N | Mean | Standard Deviation | Levene Test | t Test | |||
| F | p | T | Df | p | |||||
| Continuous activity | yes | 90 | 47.8889 | 5.61187 | 0.658 | 0.419 | 1.010 | 101 | 0.315 |
| no | 13 | 46.2308 | 4.93548 | ||||||
| High degree of autonomy | yes | 76 | 47.4474 | 5.76054 | 0.960 | 0.330 | −0.713 | 101 | 0.478 |
| no | 27 | 48.3333 | 4.89112 | ||||||
| Significant economic risks | yes | 64 | 46.8750 | 5.91340 | 2.561 | 0.113 | −1.914 | 101 | 0.058 |
| no | 39 | 49.0000 | 4.62829 | ||||||
| Small number of employees | yes | 80 | 46.9000 | 5.37363 | 0.114 | 0.737 | −2.750 | 101 | 0.007 |
| no | 23 | 50.3913 | 5.34057 | ||||||
| Explicit scope, community dedication | yes | 75 | 48.0133 | 5.20523 | 1.343 | 0.249 | 1.001 | 101 | 0.319 |
| no | 28 | 46.7857 | 6.35585 | ||||||
| Budget and financial transparency | yes | 38 | 47.7895 | 5.03586 | 0.500 | 0.481 | 0.153 | 101 | 0.879 |
| no | 65 | 47.6154 | 5.84619 | ||||||
| Decision making is not based on NPO equity | yes | 53 | 48.0566 | 5.67184 | 0.406 | 0.525 | 0.710 | 101 | 0.479 |
| no | 50 | 47.2800 | 5.41743 | ||||||
| Stakeholder involvement in financial decisions | yes | 67 | 48.2985 | 5.10500 | 0.743 | 0.391 | 1.559 | 101 | 0.122 |
| no | 36 | 46.5278 | 6.17130 | ||||||
| High number of volunteers | yes | 54 | 48.2222 | 5.22933 | 0.227 | 0.635 | 1.045 | 101 | 0.299 |
| no | 49 | 47.0816 | 5.85177 | ||||||
Table 19.
Summary of correlations between the three determinants of sustainability.
| Correlations | ||||
|---|---|---|---|---|
| Total Cognitive Competence | Total Social Awareness | Total Financial Vulnerability | ||
| Total Cognitive competence | Pearson Correlation | 1 | ||
| Sig. (2-tailed) | ||||
| Total Social awareness | Pearson Correlation | 0.582 ** | 1 | |
| Sig. (2-tailed) | 0.000 | |||
| Total Financial vulnerability | Pearson Correlation | 0.547 ** | 0.665 ** | 1 |
| Sig. (2-tailed) | 0.000 | 0.000 | ||
Note: ** Correlation is significant at the 0.01 level (2-tailed).
© 2017 by the authors. Licensee MDPI, Basel, Switzerland. This article is an open access article distributed under the terms and conditions of the Creative Commons Attribution (CC BY) license (http://creativecommons.org/licenses/by/4.0/).
Share and Cite
MDPI and ACS Style
Ceptureanu, S.-I.; Ceptureanu, E.-G.; Orzan, M.C.; Marin, I. Toward a Romanian NPOs Sustainability Model: Determinants of Sustainability. Sustainability 2017, 9, 966. https://doi.org/10.3390/su9060966
AMA Style
Ceptureanu S-I, Ceptureanu E-G, Orzan MC, Marin I. Toward a Romanian NPOs Sustainability Model: Determinants of Sustainability. Sustainability. 2017; 9(6):966. https://doi.org/10.3390/su9060966
Chicago/Turabian StyleCeptureanu, Sebastian-Ion, Eduard-Gabriel Ceptureanu, Mihai Cristian Orzan, and Irinel Marin. 2017. "Toward a Romanian NPOs Sustainability Model: Determinants of Sustainability" Sustainability 9, no. 6: 966. https://doi.org/10.3390/su9060966
Note that from the first issue of 2016, this journal uses article numbers instead of page numbers. See further details here.