Article

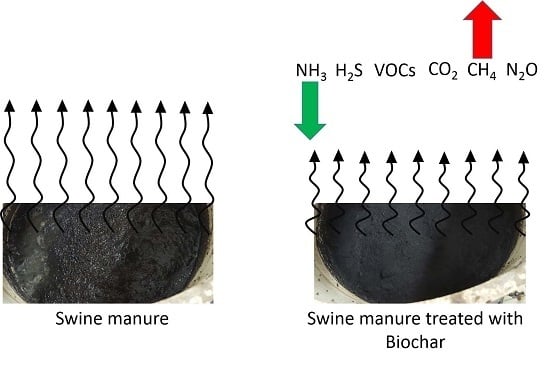
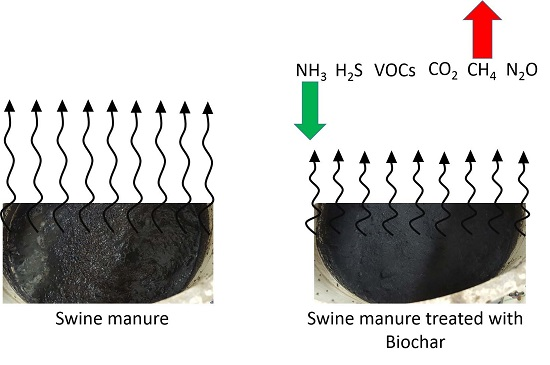
Pilot-Scale Testing of Non-Activated Biochar for Swine Manure Treatment and Mitigation of Ammonia, Hydrogen Sulfide, Odorous Volatile Organic Compounds (VOCs), and Greenhouse Gas Emissions

1
Department of Agricultural and Biosystems Engineering, Iowa State University, Ames, IA 50011, USA
2
Faculty of Biology and Animal Science, Department of Environment Hygiene and Animal Welfare, Wroclaw University of Environmental and Life Science, 50-375 Wroclaw, Poland
*
Author to whom correspondence should be addressed.
Sustainability 2017, 9(6), 929; https://doi.org/10.3390/su9060929
Submission received: 21 March 2017 / Revised: 28 May 2017 / Accepted: 28 May 2017 / Published: 2 June 2017
(This article belongs to the Section Sustainable Agriculture)

Abstract

:
Managing the environmental impacts associated with livestock production is a challenge for farmers, public and regulatory agencies. Sustainable solutions that take into account technical and socioeconomic factors are needed. For example, the comprehensive control of odors, ammonia (NH3), hydrogen sulfide (H2S), and greenhouse gas (GHG) emissions from swine production is a critical need. Stored manure is a major source of gaseous emissions. Mitigation technologies based on bio-based products such as biochar are of interest due to the potential benefits of nutrient cycling. The objective of this study was to test non-activated (non-functionalized) biochar for the mitigation of gaseous emissions from stored manure. Specifically, this included testing the effects of: (1) time; and (2) dosage of biochar application to the swine manure surface on gaseous emissions from deep-pit storage. The biochar surface application was tested with three treatments (1.14, 2.28 and 4.57 kg·m−2 manure) over a month. Significant reductions in emissions were observed for NH3 (12.7–22.6% reduction as compared to the control). Concomitantly, significant increases in CH4 emissions (22.1–24.5%) were measured. Changes to emissions of other target gases (including CO2, N2O, H2S, dimethyl disulfide/methanethiol, dimethyl trisulfide, n-butyric-, valeric-, and isovaleric acids, p-cresol, indole, and skatole) were not statistically significant. Biochar treatment could be a promising and comparably-priced option for reducing NH3 emissions from stored swine manure.

Graphical Abstract

1. Introduction

Problematic by-products of pork production are emissions of odor, volatile organic compounds (VOCs), ammonia (NH3), hydrogen sulfide (H2S) and greenhouse gases (GHGs) (CH4, N2O, and CO2) from stored manure to the atmosphere. Manure accounts for 14% of the total GHG emissions from agriculture in the United States and equated to 1.3% of the total GHG emissions produced in the United States’ economic sectors in 2014 [1]. Local and regional air quality and potential contribution to climate change [2,3] due to these emissions results in the need for mitigation technologies that target multiple emissions and are cost-efficient for farmers to put into practice.
Twenty types of technologies to mitigate gaseous emissions from livestock housing, manure storage and handling have been reviewed and added to the Iowa State University Extension and Outreach Air Management Practices Assessment Tool [2]. Manure additives are one of the mitigation technologies that are appealing to producers due to the relative ease of adding the treatment to the manure compared to other technologies that require modifying existing livestock production infrastructure and/or purchasing expensive equipment. Manure additives, in general, are also well researched in comparison to other mitigation technologies, particularly at the farm scale. As much as ~63% of manure additives was evaluated and tested in the field (farm scale). This is compared to the mean of ~25% of all mitigation technologies that made it past the laboratory and pilot scales to be eventually tested in the field [3].
Manure additives added to a complex matrix such as manure may have many effects on emissions. Additives that reduce NH3 emissions may also increase GHG emissions [3]. Most research has focused on a limited number of gases, mainly the target emissions that the treatment was designed to reduce, without monitoring other emissions that may be adversely affected due to the treatment [3]. Because of these limitations, it is difficult to evaluate mitigation technologies without comprehensive treatment data and an understanding of impact beyond those single or few target gases [3].
Biochar is the remaining solid fraction of charred biomass resulting from pyrolysis or gasification [4]. The Midwest (U.S.) has a large potential for production of second-generation of biofuels from corn stover or other forms of biomass. Thus, there is also a great need to improve the sustainability of this new industry by developing value-added and mass utilization plans for biochar. Biochar has a long history of being used as a soil amendment. Only recently has biochar been employed in wastewater and manure composting to absorb various compounds (Table 1) and it has been shown to adsorb NH3 [5,6]. In these recent studies, biochar’s ability to mitigate emissions from livestock has focused solely on the land application and composting of manures and on few target gases. To our knowledge, there are no published studies reporting on biochar as an emissions mitigation technology applied directly to the surface of stored manure in the context of deep pit or lagoon storage that is a common practice for swine production in the United States.
This study aimed to address this need by investigating the feasibility of topical biochar application to swine manure for reducing gaseous emissions from stored pig manure. Comprehensive evaluation of odorous VOCs (sulfur-containing VOCs, volatile fatty acids, phenolics and indolics), NH3, H2S and greenhouse gas (CH4, N2O, and CO2) emissions was completed at a pilot-scale system simulating a deep pit storage system. Storage of manure under slatted floors is typical in the Midwestern U.S. swine production systems. The objective of this study was to test non-activated (non-functionalized) biochar for mitigation of gaseous emissions from stored swine manure. Specifically, this included testing the effects of: (1) time; and (2) dosage of biochar application to the swine manure surface on gaseous emissions from deep-pit storage. The key questions to answer were:
  • Can biochar float on top of swine manure for at least 1-month period?
  • Can a thin layer of biochar be effective at mitigating gaseous emissions?
  • Can biochar mitigate emissions of any key gases of concern (odorous VOCs such as sulfur-containing VOCs, volatile fatty acids, phenolics, and indolics), or NH3, H2S and greenhouse gases (CH4, N2O, and CO2)?
  • Can non-activated, non-functionalized biochar be an economically-feasible option for controlling gaseous emissions from stored manure?

2. Materials and Methods

2.1. Experimental Design

The pilot study was designed to simulate manure conditions in a deep pit swine manure storage system. ‘Deep pit’ storage is typical in the Midwestern U.S. region where swine manure is held under slatted barn floors for 6 to 12 months before land application. A slatted floor separates the animal space from the ventilated storage below. Biochar was obtained from 495 to 505 °C pyrolysis of 3-mm (1/8”) pine; ash content: 1–25 wt %; carbon content: 60–75 wt %; mean particle diameter: 175 microns; pH: 7.28 ± 0.07.
The experimental design was a completely randomized design (CRD) for three trials. Trial 1 consisted of one biochar dosage of 2.28 kg·m−2 (n = 2) applied to (crusted and uncrusted) manure and a control (n = 1), with a total of six experimental units (Table 2). The manure types were: (1) from deep pit swine barn with a crust on manure surface; and (2) from outside storage lagoon with no crust. Development of crust can affect gaseous emissions by creating a semipermeable layer over the manure that impedes the mass transfer of volatiles from the manure to the vented headspace.
Trial 2 consisted of a 4.56 kg·m−2 surface-applied biochar dosage treatment (n = 3) and control (n = 3). Only manure type (1) from above was evaluated in Trial 2. Manure was added twice during Trial 2 for improved simulation of barn conditions (Table 2). Trial 3 consisted of two surface-applied biochar dosage treatments, 1.14 and 2.28 kg·m−2 (n = 3), and a control (n = 3). A fresh batch of manure (3) from a deep pit swine barn with a crust was evaluated for Trial 3. Manure was added four times during Trial 3 (Table 2).

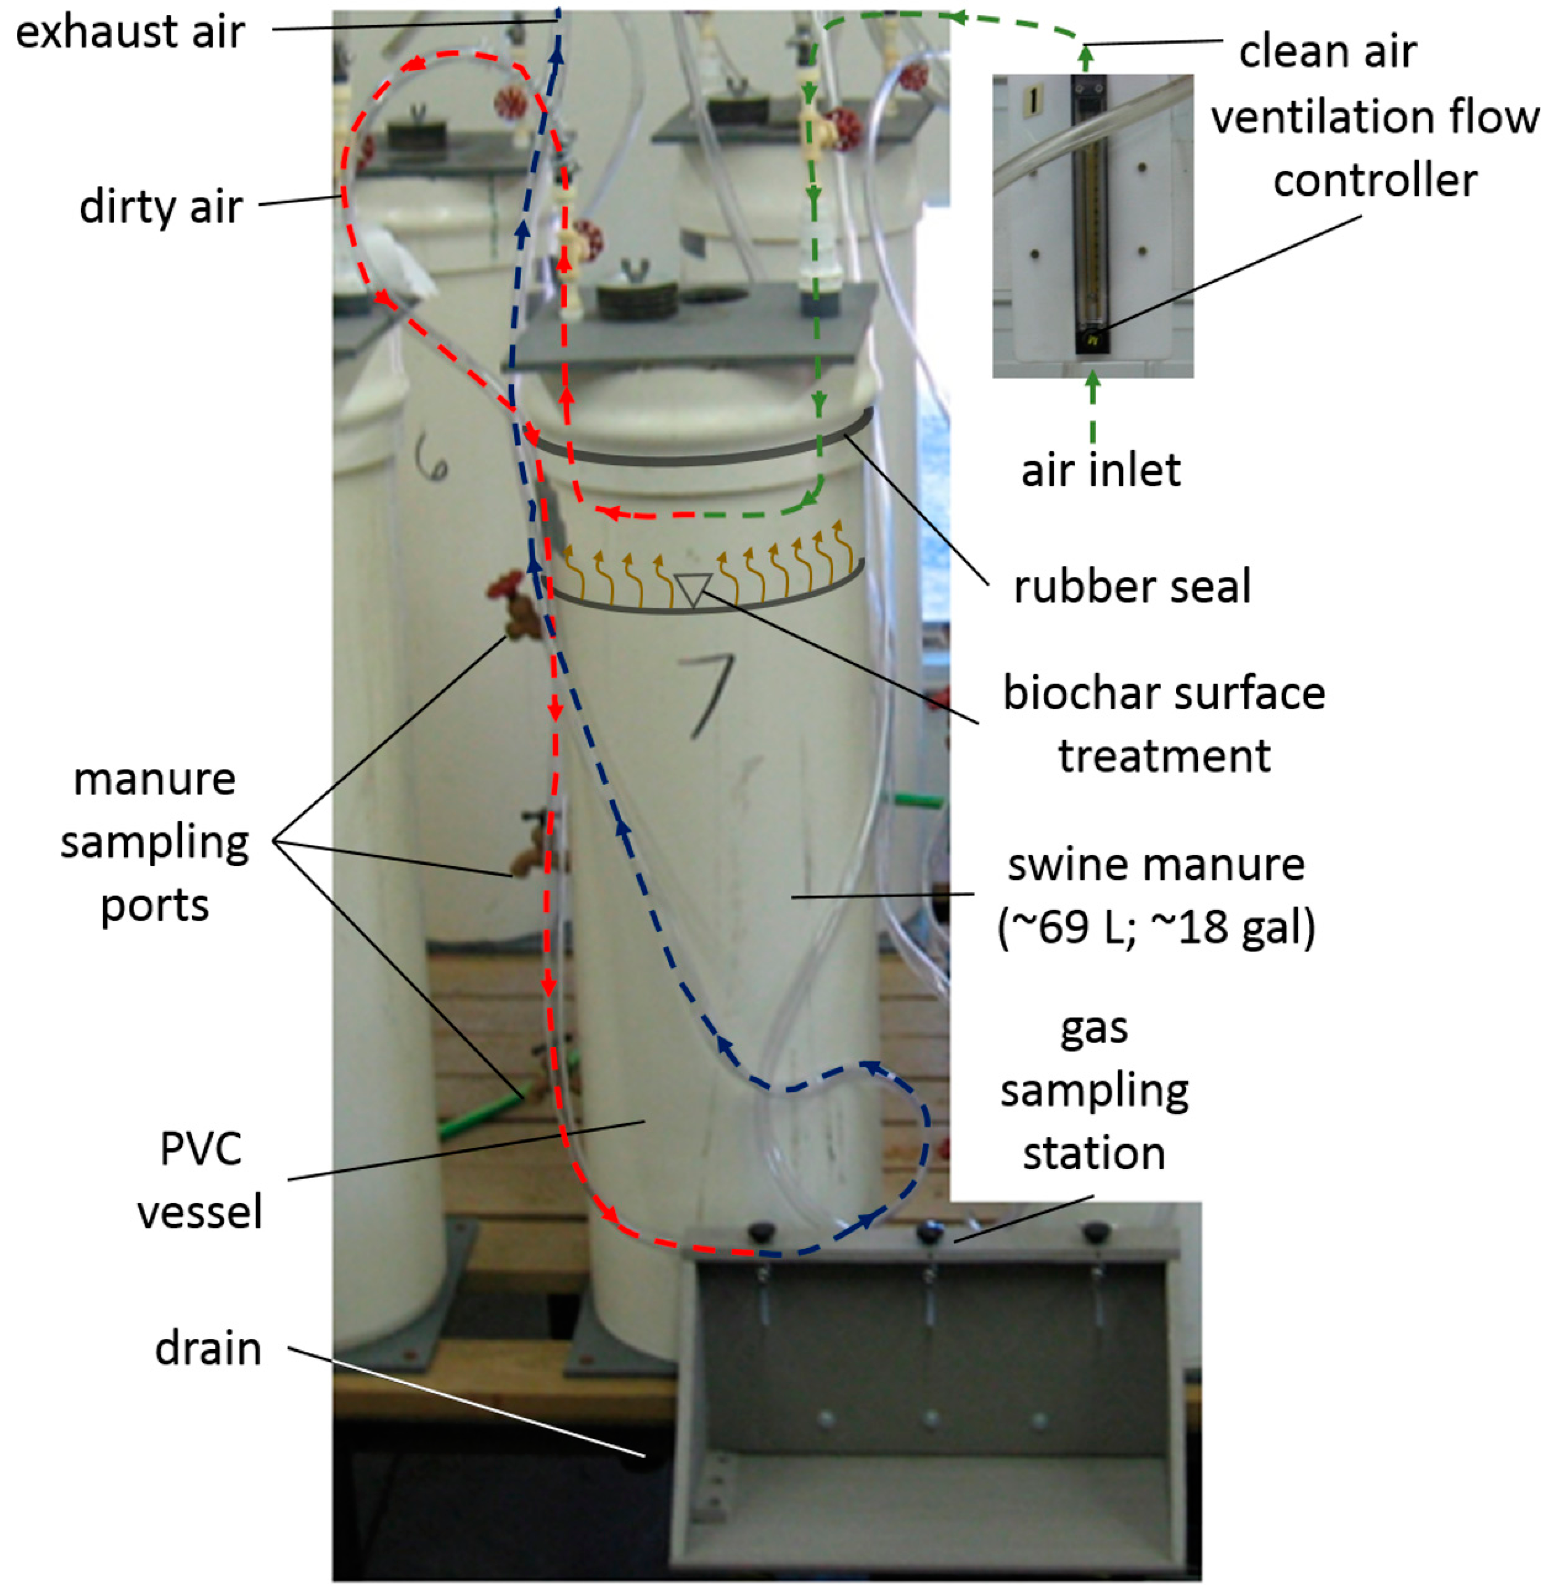
2.2. Manure Storage Simulators

Observations of biochar layer on top of swine manure were completed in pilot-scale simulators. Deep pit swine manure from an Iowa State University swine finisher operation was pumped into six 1.22-m (4 ft) tall, 0.38-m (15 in) diameter sealed manure storage simulators previously described by Maurer et al. [22] (Figure 1). Each simulator initially received 118 L (31.2 gal) for Trial 1 and 68.8 L (18.2 gal) for Trial 2 and Trial 3 of swine manure, Trial 2 had 3.8 L (1 gal) of weekly manure additions one week before and one week after biochar addition, resulting in a final volume of 76.4 L (20.2 gal). Trial 3 received four weekly 3.8 L (1 gal) manure additions resulting in final manure volumes of 84.0 L (22.2 gal). Manure additions were done by adding manure directly to the top of the manure to simulate farm conditions, where manure would drop down through the floor slats of the barn into the manure storage pit surface. The ventilation in each simulator was controlled via valves with rotameters to achieve a ventilation rate of 7.5 headspace exchanges per hour. The rate was adjusted when fresh manure was added to keep a constant exchange rate. Air exchange rates were consistent with recommended values for less than half-full manure pit storage (assuming cool season, minimum ventilation, growing (34 to 68 kg) pigs, in swine barn with the fully slatted floor) [23]. Storage temperature was kept between 10 and 16 °C (average = 12.5 ± 1.3 °C) to simulate the temperature of deep pit storage [24].
Measurements of gaseous emissions were estimated as a product of measured concentrations and the ventilation airflow rate. Baseline gas emissions measurements were taken for ~two weeks before biochar addition to evaluate emissions from each of the six manure storage simulators to make sure that there was no significant difference in emissions due to the system. The total duration of the pilot experiment was a month for all trials. Manure samples were collected at the end of each trial to determine effects on manure quality and the potential for nutrient retention. Percent relative humidity in manure headspace was monitored via an 850071 Environmental Quality meter (Sper Scientific, Scottsdale, AZ, USA) each day that gas emission samples were collected.

2.3. Gas Concentration Measurements

Details of gas measurements and calibrations are presented elsewhere [22]. In short, gas samples were collected via syringe and vials and were analyzed for GHG concentrations using gas chromatography equipped with FID and ECD detectors, and a CO2-to-CH4 catalytic convertor. VOCs were collected in sorbent tubes filled with Tenax TA. Air samples were collected using a portable sampling pump. Chemical analyses of swine odorants were completed using the thermal desorption-multidimensional gas chromatography-mass spectrometer/olfactometry (TD-MDGC–MS/O) system using procedures previously described [25]. Challenges to proper sulfur-VOC speciation and quantification associated with sorbent tubes and thermal desorption (Andersen et al. [26]) were addressed by Cai et al. [27]. Thus, because it is not possible to determine the extent of methane thiol (MT) conversion, combined DMDS/MT, and DMTS/MT emissions are reported for dimethyl disulfide and dimethyl trisulfide, respectively. Ammonia and H2S concentrations were measured via a portable gas analyzer with NH3 and low-range H2S XS sensors.

2.4. Swine Manure Analysis

Swine manure analysis was completed using standard methods. Total Kjeldahl nitrogen (TKN) was quantified by digestion followed by steam distillation and titrimetric analysis [28]. Ammonia (NH3) was quantified by steam distillation followed by titrimetric analysis [29]. Dissolved reactive phosphorus (P) was quantified by the ascorbic acid method [29]. Total P was determined by sulfuric acid–nitric acid digestion followed by the ascorbic acid method, [29] while pH was determined using the electrode method [29]. Total solids/moisture content and volatile solids were determined by oven drying method [29]. Percent C, H, N, and S were acquired with a combustion analyzer (Perkin Elmer Inc., Waltham, MA) with a cysteine calibration standard.

2.5. Estimation of Time and Dose Effect on Gaseous Emissions

Measured gas concentrations were used for calculation of flux (E), i.e., emissions based on time and emitting surface area of manure (mass·time−1·emitting area−1). Gas concentrations were measured at field conditions and were converted to standard conditions (1 atm, 25 °C, dry air). Overall mean % reduction for each target gas was calculated using Equation (1).
% R = E C o n E T r e a t E C o n × 100
where: %R is the percent of reduction. ECon is the average flux estimate of the desired time interval of the control. ETreat is the average flux estimate of the desired time interval of the treatment.
Estimates of gas emissions for Trial 1 were adjusted to account for the differences observed during the baseline measurements conducted during the first two weeks before biochar treatment. This was completed by adding the average difference between the emissions before biochar application to the post-application emissions (Equation (2)).
E a d j = ( E t b E c b ) + E c a
where Eadj is the adjusted flux estimate, Etb is the flux estimate for the treated manure before biochar surface application, Ecb is the flux estimate for the control manure before biochar surface application, and Eca is the flux estimate for the control manure after biochar surface application.

2.6. Statistical Analysis

The First-Order Autoregression Model, in the JMP System (version Pro 12, SAS Institute, Inc., Cary, NC, USA) was used to analyze the data and determine the p values. A significance level of 0.05 was used as the cut-off for statistical significance. The data from the two manure types in Trial 1 were combined for the statistical analysis.

3. Results and Discussion

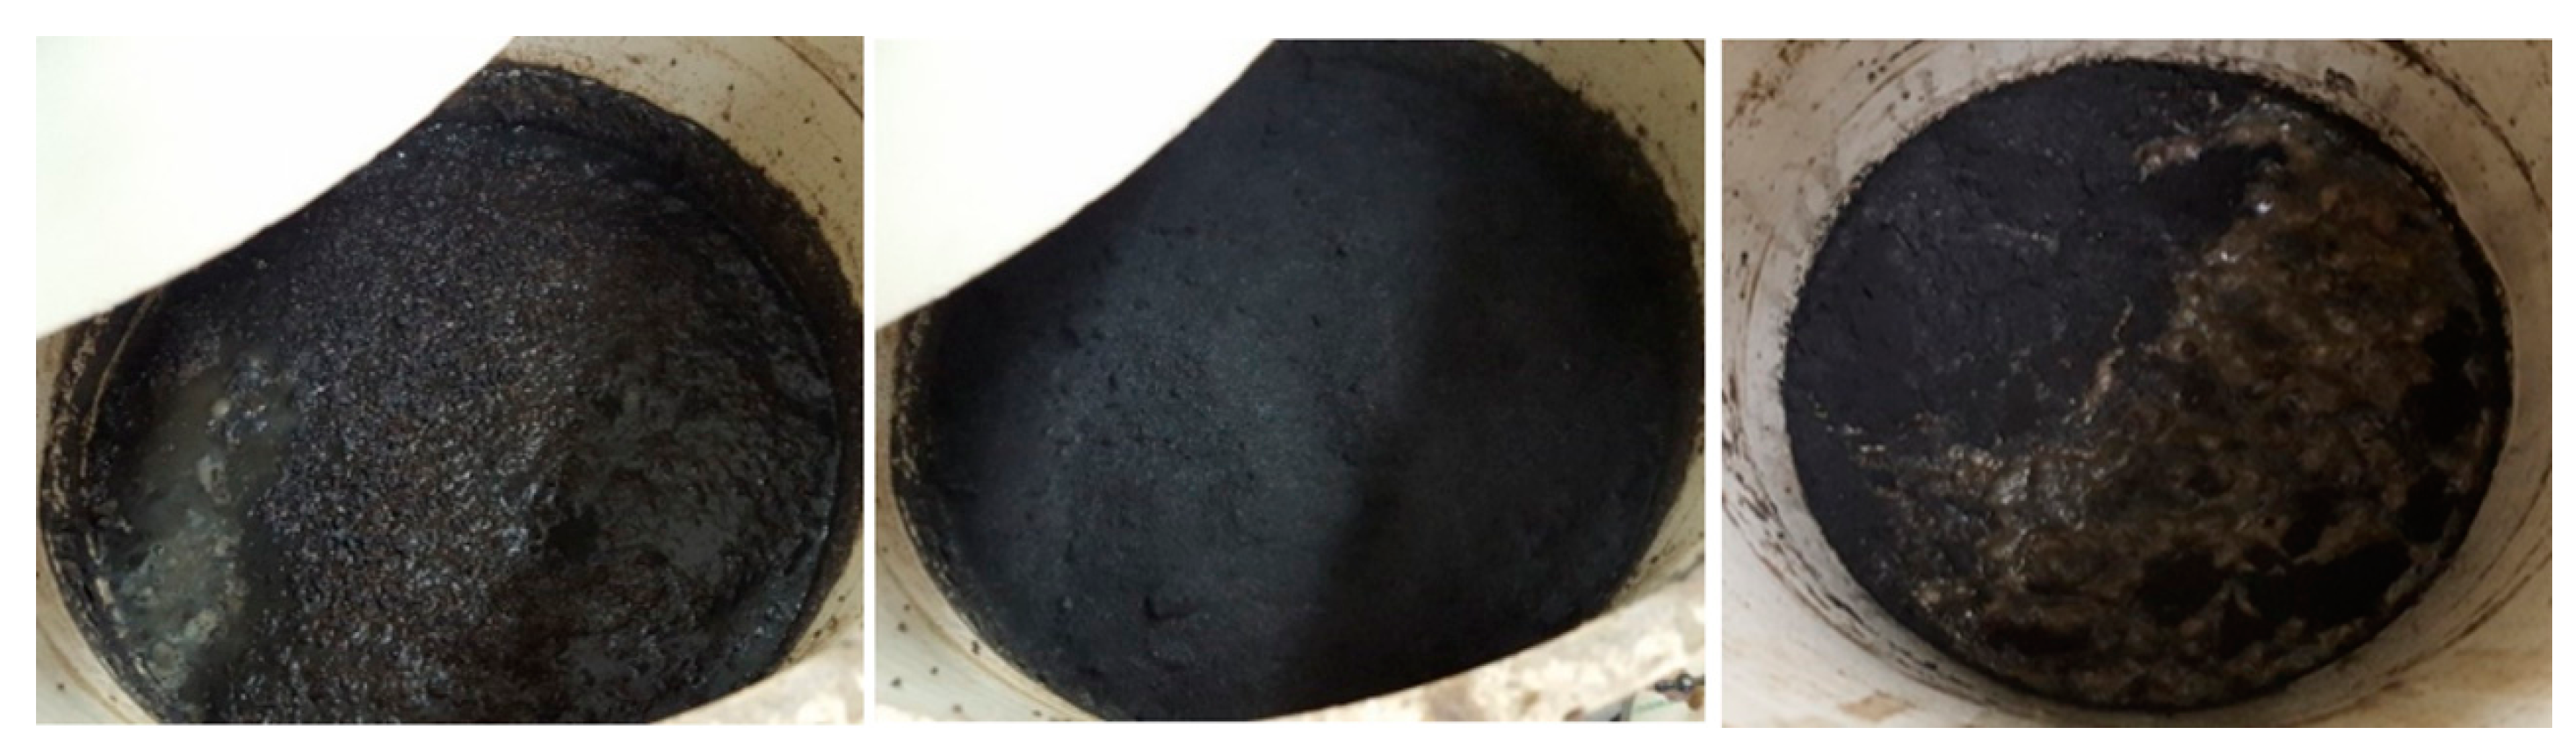
3.1. Visual Observations of the Biochar Surface Layer Over Time

Biochar floated on top of swine manure for at least one month. The biochar surface coverage of the swine manure in the simulators for the three biochar doses of 1.14, 2.28 and 4.57 kg·m−2 resulted in complete coverage of the manure at thicknesses of 0.375, 0.75 and 1.5 cm, respectively (dose 2.28 kg·m−2 is shown in Figure 2). After the month-long trials, it was observed that most of the biochar was still floating on the surface of the manure and appeared dry. Where manure addition was added in Trial 2 (largest dose) biochar had been incorporated into the manure (Figure 2). These visual observations of the topical biochar layer are important for two reasons: (1) they provide a better understanding of mechanisms responsible for the mitigation effect (e.g., chemical absorption of biochar, biofilm/biofilter layer interface between manure and air, or the combination of both); and (2) they affect the long-term implications for the manure management (e.g., settling of solids into the bottom of manure pit and potential issues with stirring and pumping out manure). No detrimental effects were observed in relation to concerns about (1) and (2).

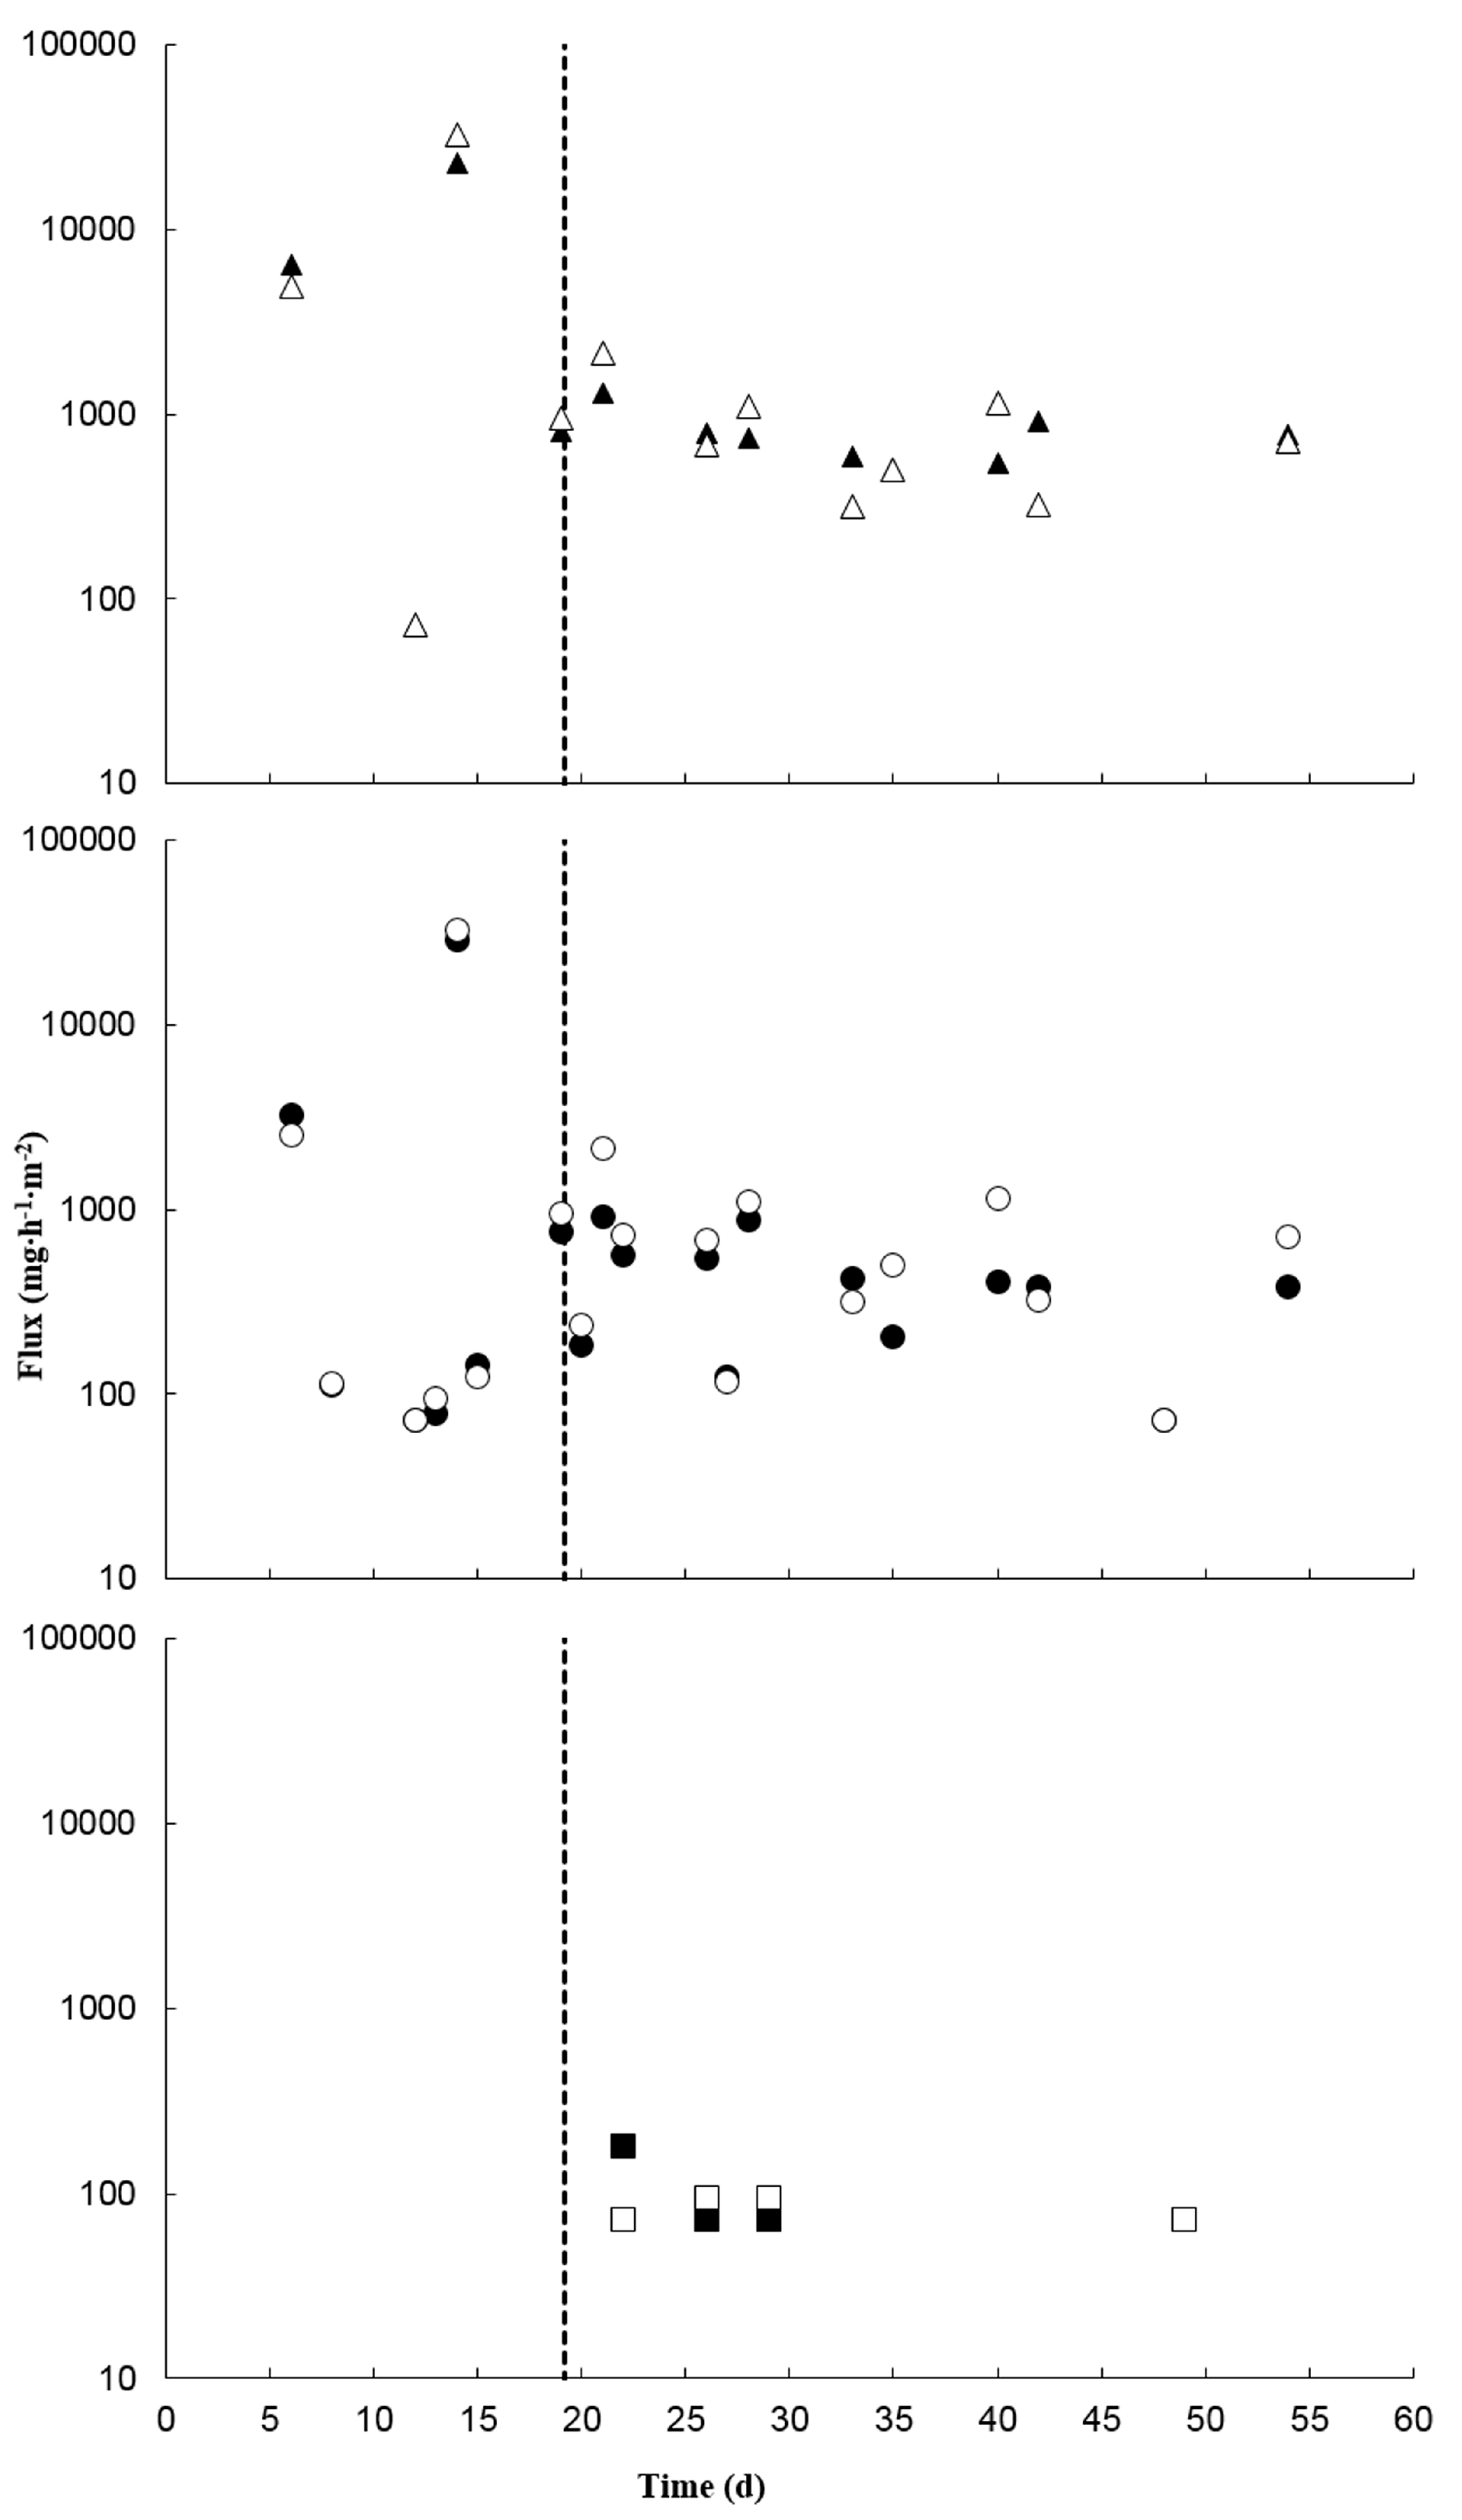
3.2. Treatment Effects on Ammonia and Hydrogen Sulfide

The two types of manure, crusted and uncrusted, used in Trial 1 resulted in no statistical differences in measured gases. Therefore, the results for crusted and uncrusted manures were averaged and treated as additional repetitions for statistical analysis and comparisons with other trials. Trial 1 with a biochar application loading of 2.28 kg·m−2 showed no significant NH3 reduction over the trial. Trial 2 with a biochar application loading of 4.56 kg·m−2 showed significant NH3 reduction over the first 6 days, the first 9 days and over the total month post biochar application, of 22.6% (p = 0.0014), 15.2% (p = 0.0147) and 12.7% (p = 0.0257), respectively. Trial 3 with a biochar application loading of 2.28 kg·m−2 showed no significant NH3 reduction (Figure 3) post biochar application. Trial 3 at the lowest biochar application loading of 1.14 kg·m−2 showed no significant NH3 reduction. The average of Trial 1 and Trial 3 at a biochar application loading of 2.28 kg·m−2 showed no significant NH3 reduction over the month post biochar application due to high variability between trials.
The pH of the manure (pH = 7.97) was not affected by the biochar (pH = 7.28), so the NH3-NH4+ equilibrium in the manure slurry was not altered in a way to reduce NH3 emissions. Ro et al. [6] performed ammonia adsorption capacity experiments on various biochar samples, one of which was produced from wood shavings at a similar temperature (500 °C) to the biochar used in this study and was determined to have an ammonia adsorption capacity of 0.84 mg [NH3-N]·g biochar−1. This reported ammonia adsorption capacity equates to the capacity of the biochar to adsorb only the amount of NH3 emitted in ~one day under the conditions studied for a biochar dose of 4.56·kg·m−2, i.e., much shorter than observed to be effective in this research. This suggests that the biochar’s major mode of mitigating NH3 is likely due to creating a semi-porous crust layer over the surface of the manure affecting mass transfer to the headspace. Additional experiments aiming at confirming the actual mechanism of the mitigation effects including microbial flora capable of utilizing ammonia are warranted.
The biochar treatment in all of the trials did not have a significant effect on the emissions of H2S. Reduction of H2S was observed during Trial 3 at a biochar dose of 2.28 kg·m−2 over 9 days and the total trial period, of 30% and 12%, respectively, but this was not significant. Reduction of H2S was also observed during Trial 3 at a biochar dose of 1.14 kg·m−2 over 9 days (30%), but this was not significant. Sethupathi et al. [30] determined adsorption capacities for H2S on various biochars such as Japanese oak biochar produced at ~500 °C (the closest biochar to this study). Sethupathi et al. [30] reported adsorptions of 5.69 mg H2S·g biochar−1 when H2S was tested alone and 0.613 mg H2S·g biochar−1 when H2S was tested in a gas mixture with CO2 and CH4. The reported biochar adsorption capacity for H2S when mixed with CO2 and CH4 equates to ~311 days, at a biochar dose of 4.56 kg·m−2, of H2S emissions observed in this study. The reason for the insignificant effect of the biochar observed in this study is not known and still warrants investigation considering large theoretical adsorption capacity reported in the literature. Likely causes of apparent no effect can be due to the inconsistent nature of H2S emissions from swine manure and the complex mixture of emissions from swine manure interfering with H2S adsorption on the biochar.

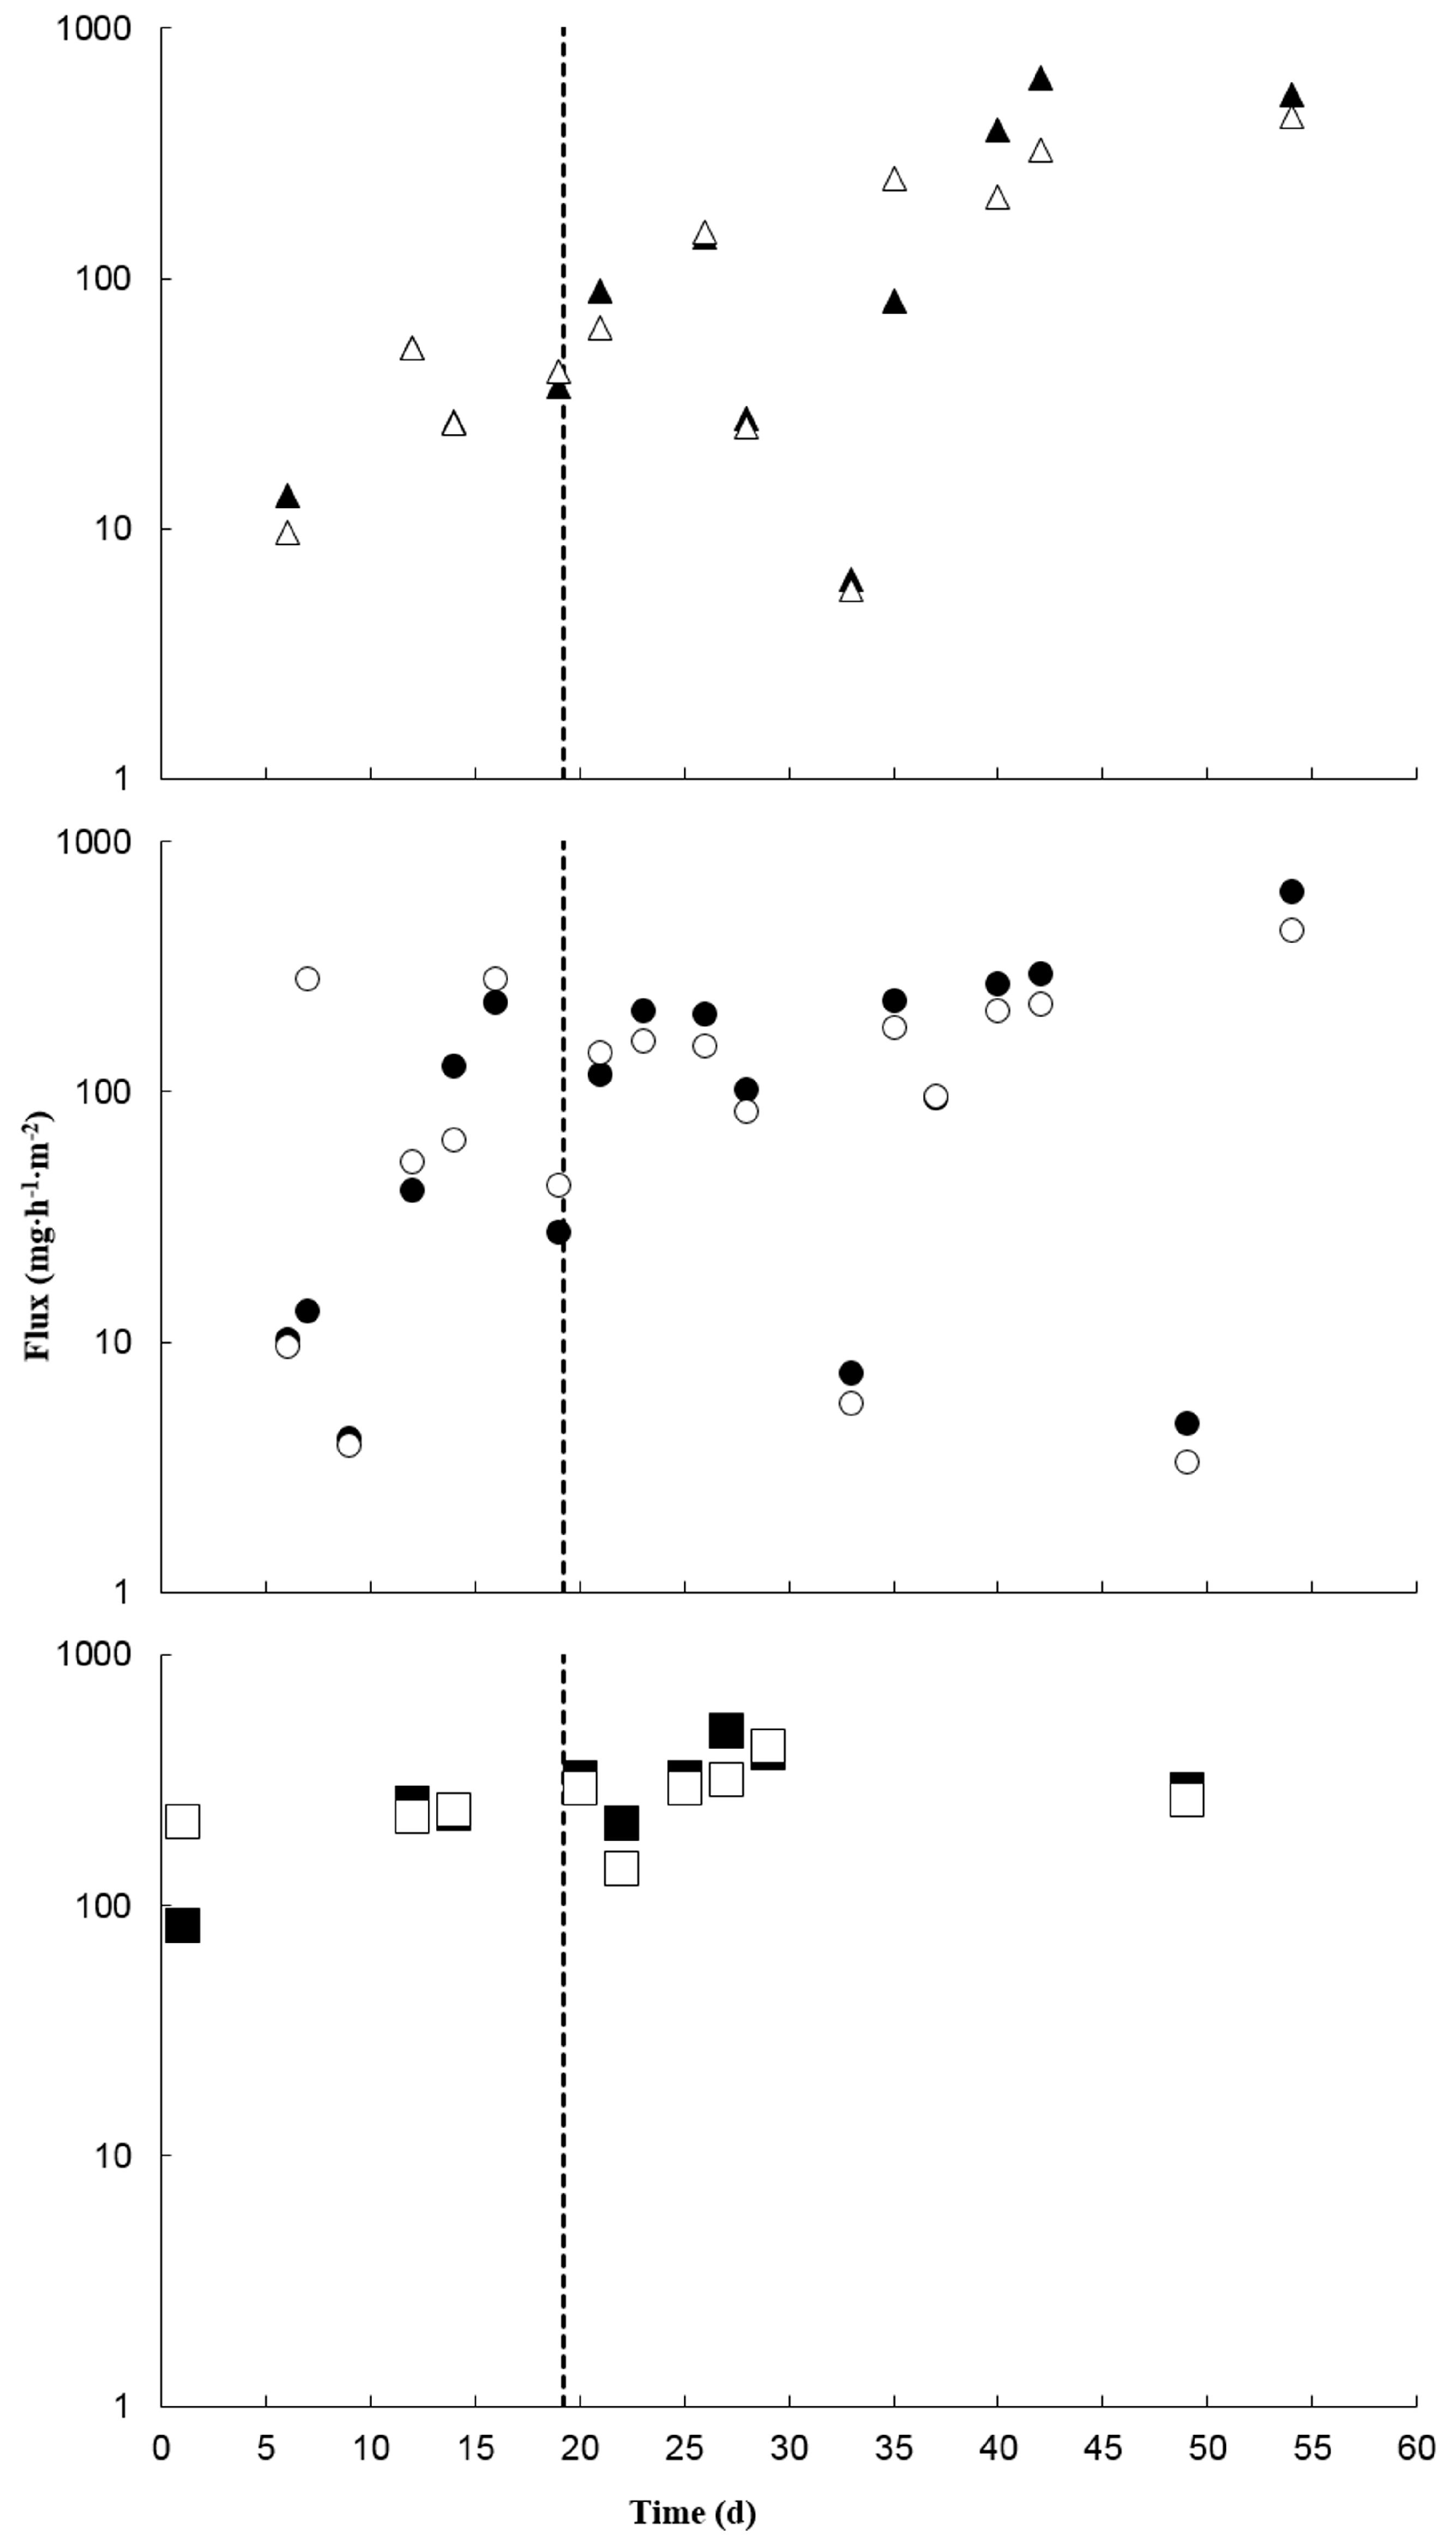
3.3. Treatment Effects on Volatile Organic Compounds

Trials 2, 3 at a biochar application loading of, 4.56 kg·m−2 and 1.14 kg·m−2, respectively, showed no significant indole reduction. However, Trial 1 at a biochar application loading of 2.28 kg·m−2 showed significant indole reduction of 11.6% (p = 0.0462) and 8.7% (p = 0.0462) after 9 days and the total month, respectively. Trial 3 with fresh, crusted manure and frequent manure additions at a biochar application loading of 2.28 kg·m−2 also showed significant indole reduction of 26.9% over the total month (p = 0.0292) (Figure 4). The average of Trial 1 (aged crusted and uncrusted manures) and Trial 3 (fresh manure) at a biochar application loading of 2.28 kg·m−2 showed no significant indole reduction over the month post biochar application due to high variability between trials. There was no significant reduction for any of the other VOCs that were monitored; DMDS, DMTS, n-butyric acid, valeric acid, isovaleric acid, p-cresol, or skatole, over the three 30-day post biochar application trials.
Reported DMDS emission reduction from soil resulting from surface applied biochar (mixed hardwood chips produced at ~500 °C) was 53% of maximum DMDS concentration in the air [31]. Reductions of DMDS were observed in this study, especially early in the study, but were not significant likely due to high variability over a longer exposure time, 30 d compared to the reported 1 d in [31]. Pinecone biochar produced at 600 °C was reported to have a 74% removal efficiency of DMTS (4 µg·L−1) in aqueous solution after 4 h and reached equilibrium within 6 h [32]. Under average conditions observed in this study, the biochar tested in [32] would reach adsorption capacity in ~20 min for a 4.56 kg·m−2 dose, i.e., not practical for stored manure. Reductions of DMTS, similar to DMDS, were observed in this study but were not significant likely due to longer treatment time where the biochar’s adsorption capacity was reached very quickly.
Several reports were found on p-cresol adsorption on biochars [33,34,35] with adsorption capacities for p-cresol ranging from 0.33, 6.97 and 7.63 mg·g−1 for bamboo, pinewood, and swine manure biochars, respectively. The two higher reported adsorption capacities equated to 3–4 h until the biochars reached their capacity under the conditions observed in this study at a biochar dosage of 4.56 kg·m−2, i.e., not practical for stored manure. Literature reports could not be found with regards to biochar adsorption information of organic acids, skatole, and indole.

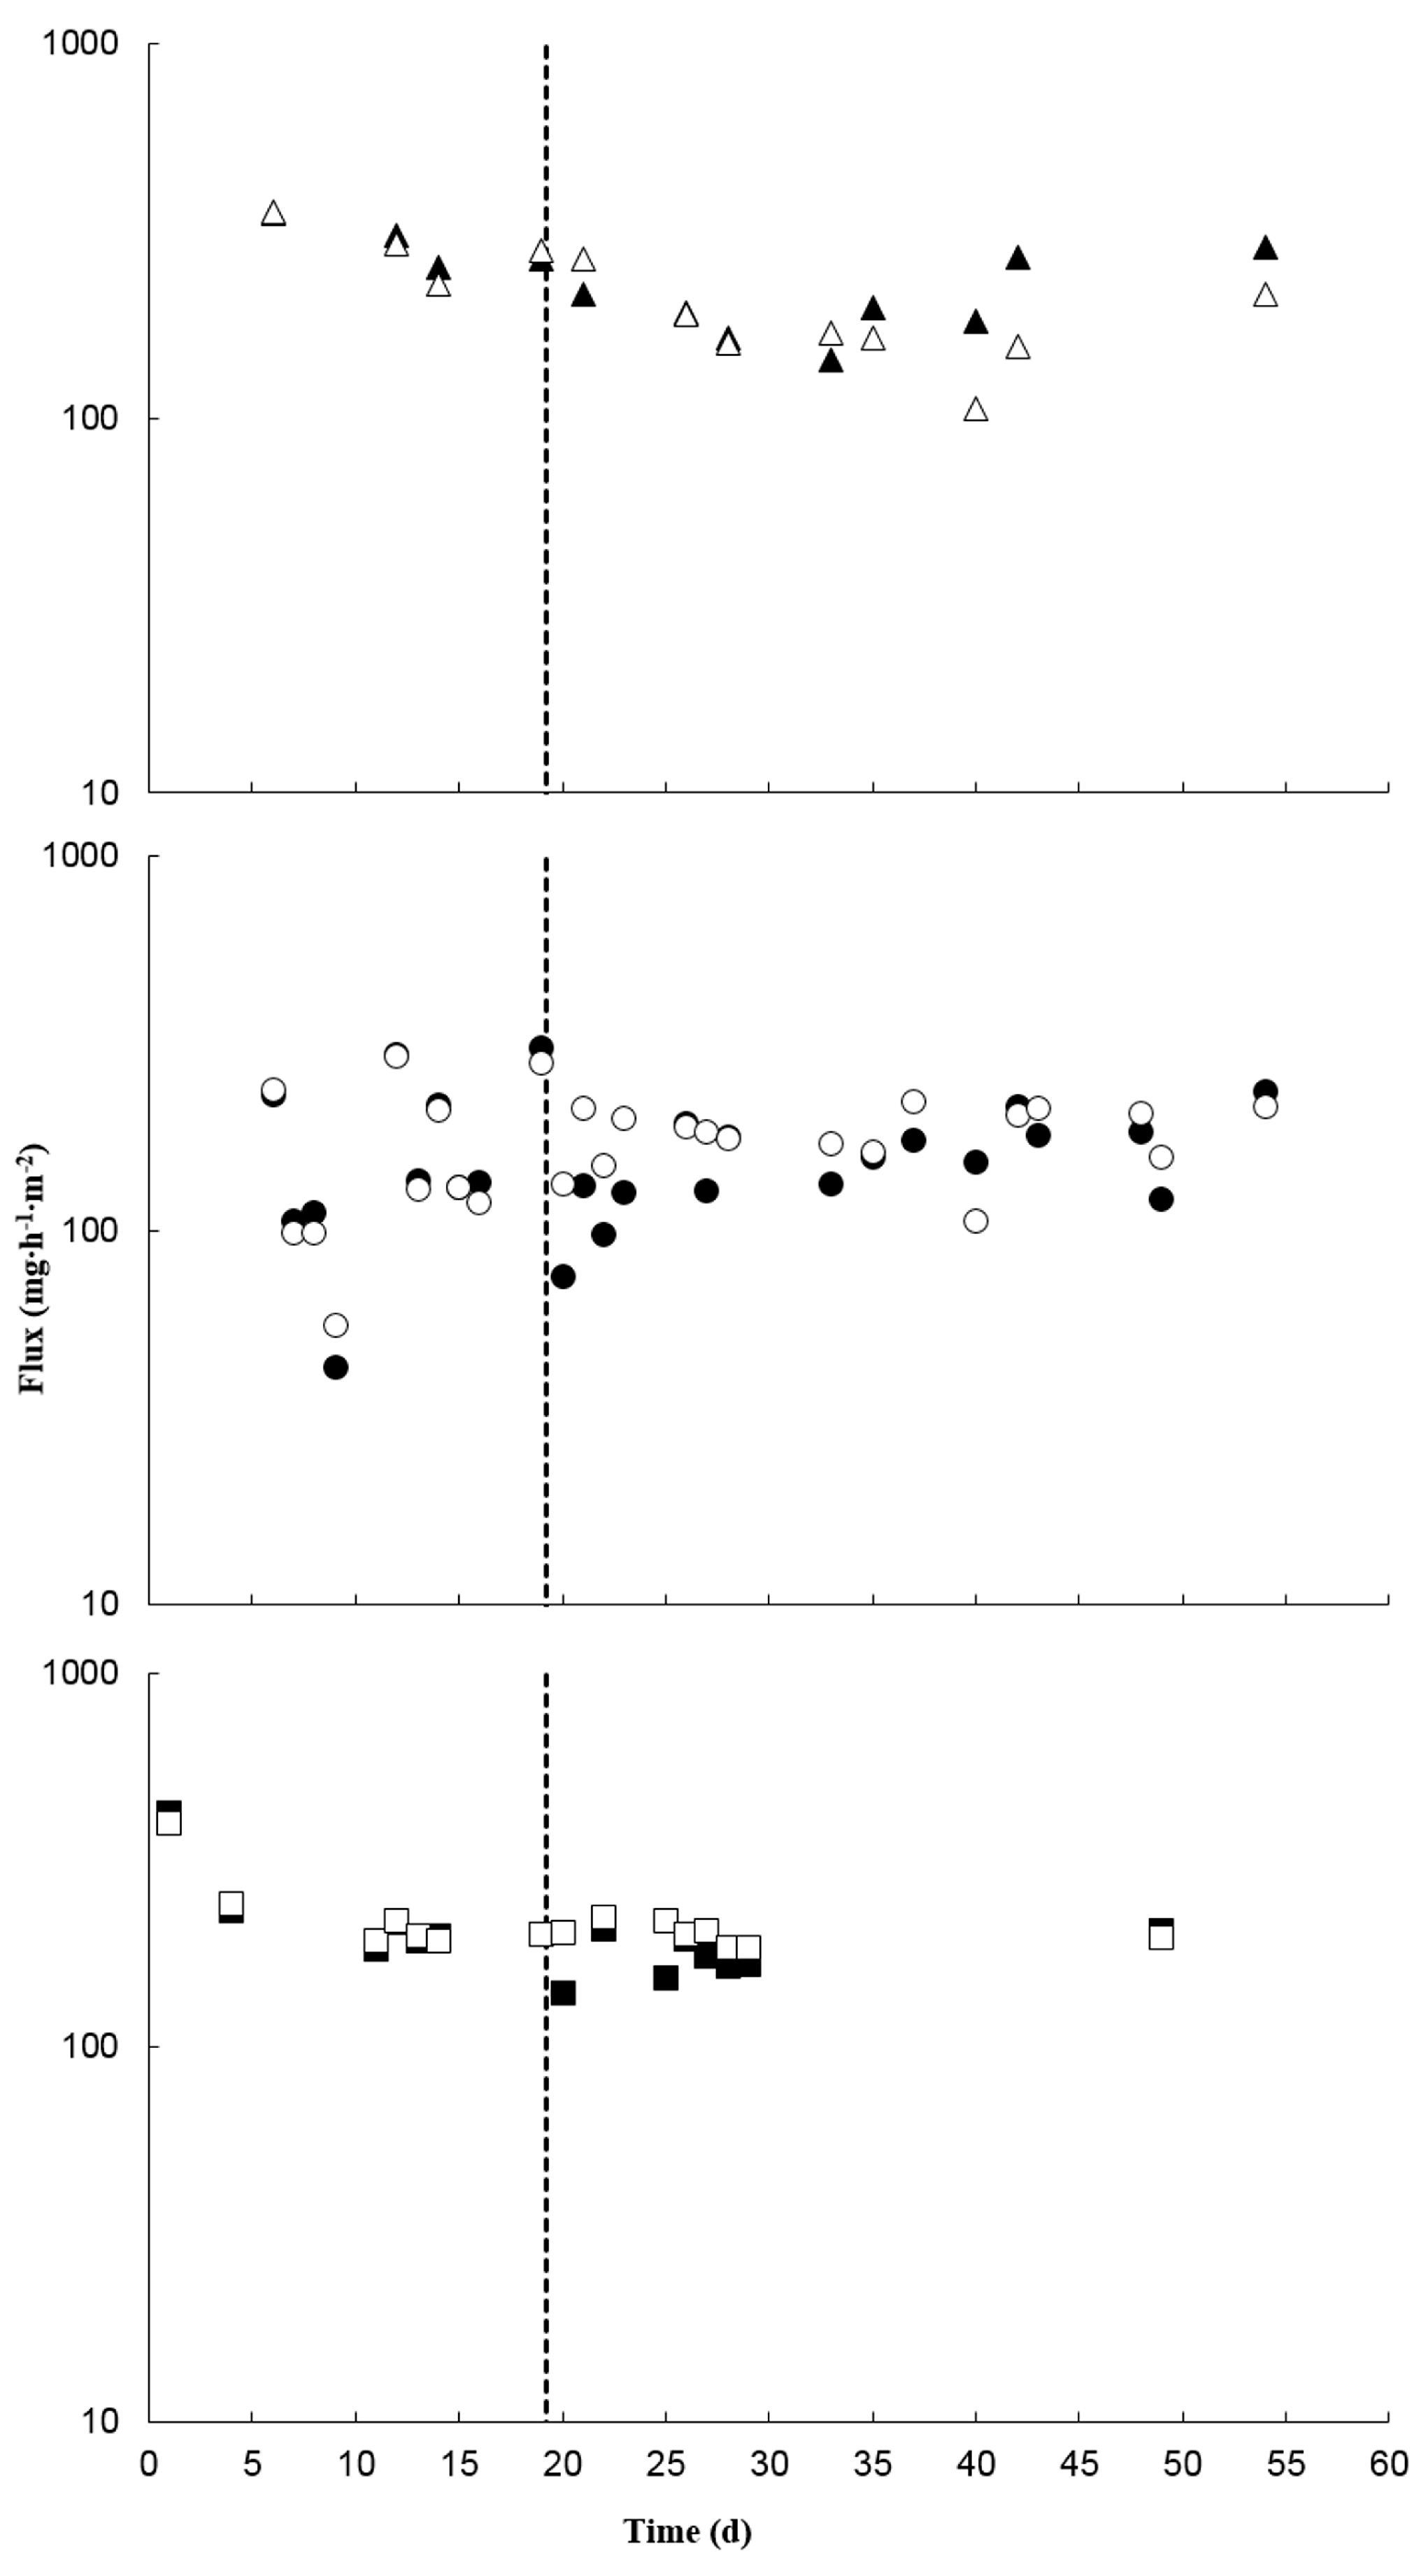
3.4. Treatment Effects on Greenhouse Gases

Trial 2 at a biochar application loading of 4.56 kg·m−2 showed a significant CH4 increase after 10 days and the total month post biochar application, of 24.5% (p = 0.0322) and 22.0% (p = 0.022), respectively (Figure 5). The increase of CH4 emissions is likely due to the addition of nutrients and labile carbon in the biochar stimulating CH4-producing microbes in the manure [36]. There was no significant increase of CH4 over the other trials. Carbon dioxide and N2O emissions resulted in no significant difference over any of the trials. The lack of reduction in emissions of CH4 is in agreement with Sethupathi et al. [30], where it was reported that tested biochar capacities to adsorb CH4 were little to none. Sethupathi et al. [30] also reported the CO2 adsorption capacity for the same biochar discussed earlier in regards to H2S adsorption, with a low capacity when tested as a mix of gases. This low CO2 adsorption capacity in the presence of other gases equates to <1 h before the biochar’s capacity is reached under conditions observed in this study at all biochar doses. Biochar’s effect on N2O emissions varies greatly in the literature from reducing emissions, increasing emissions, or having no effect [37].

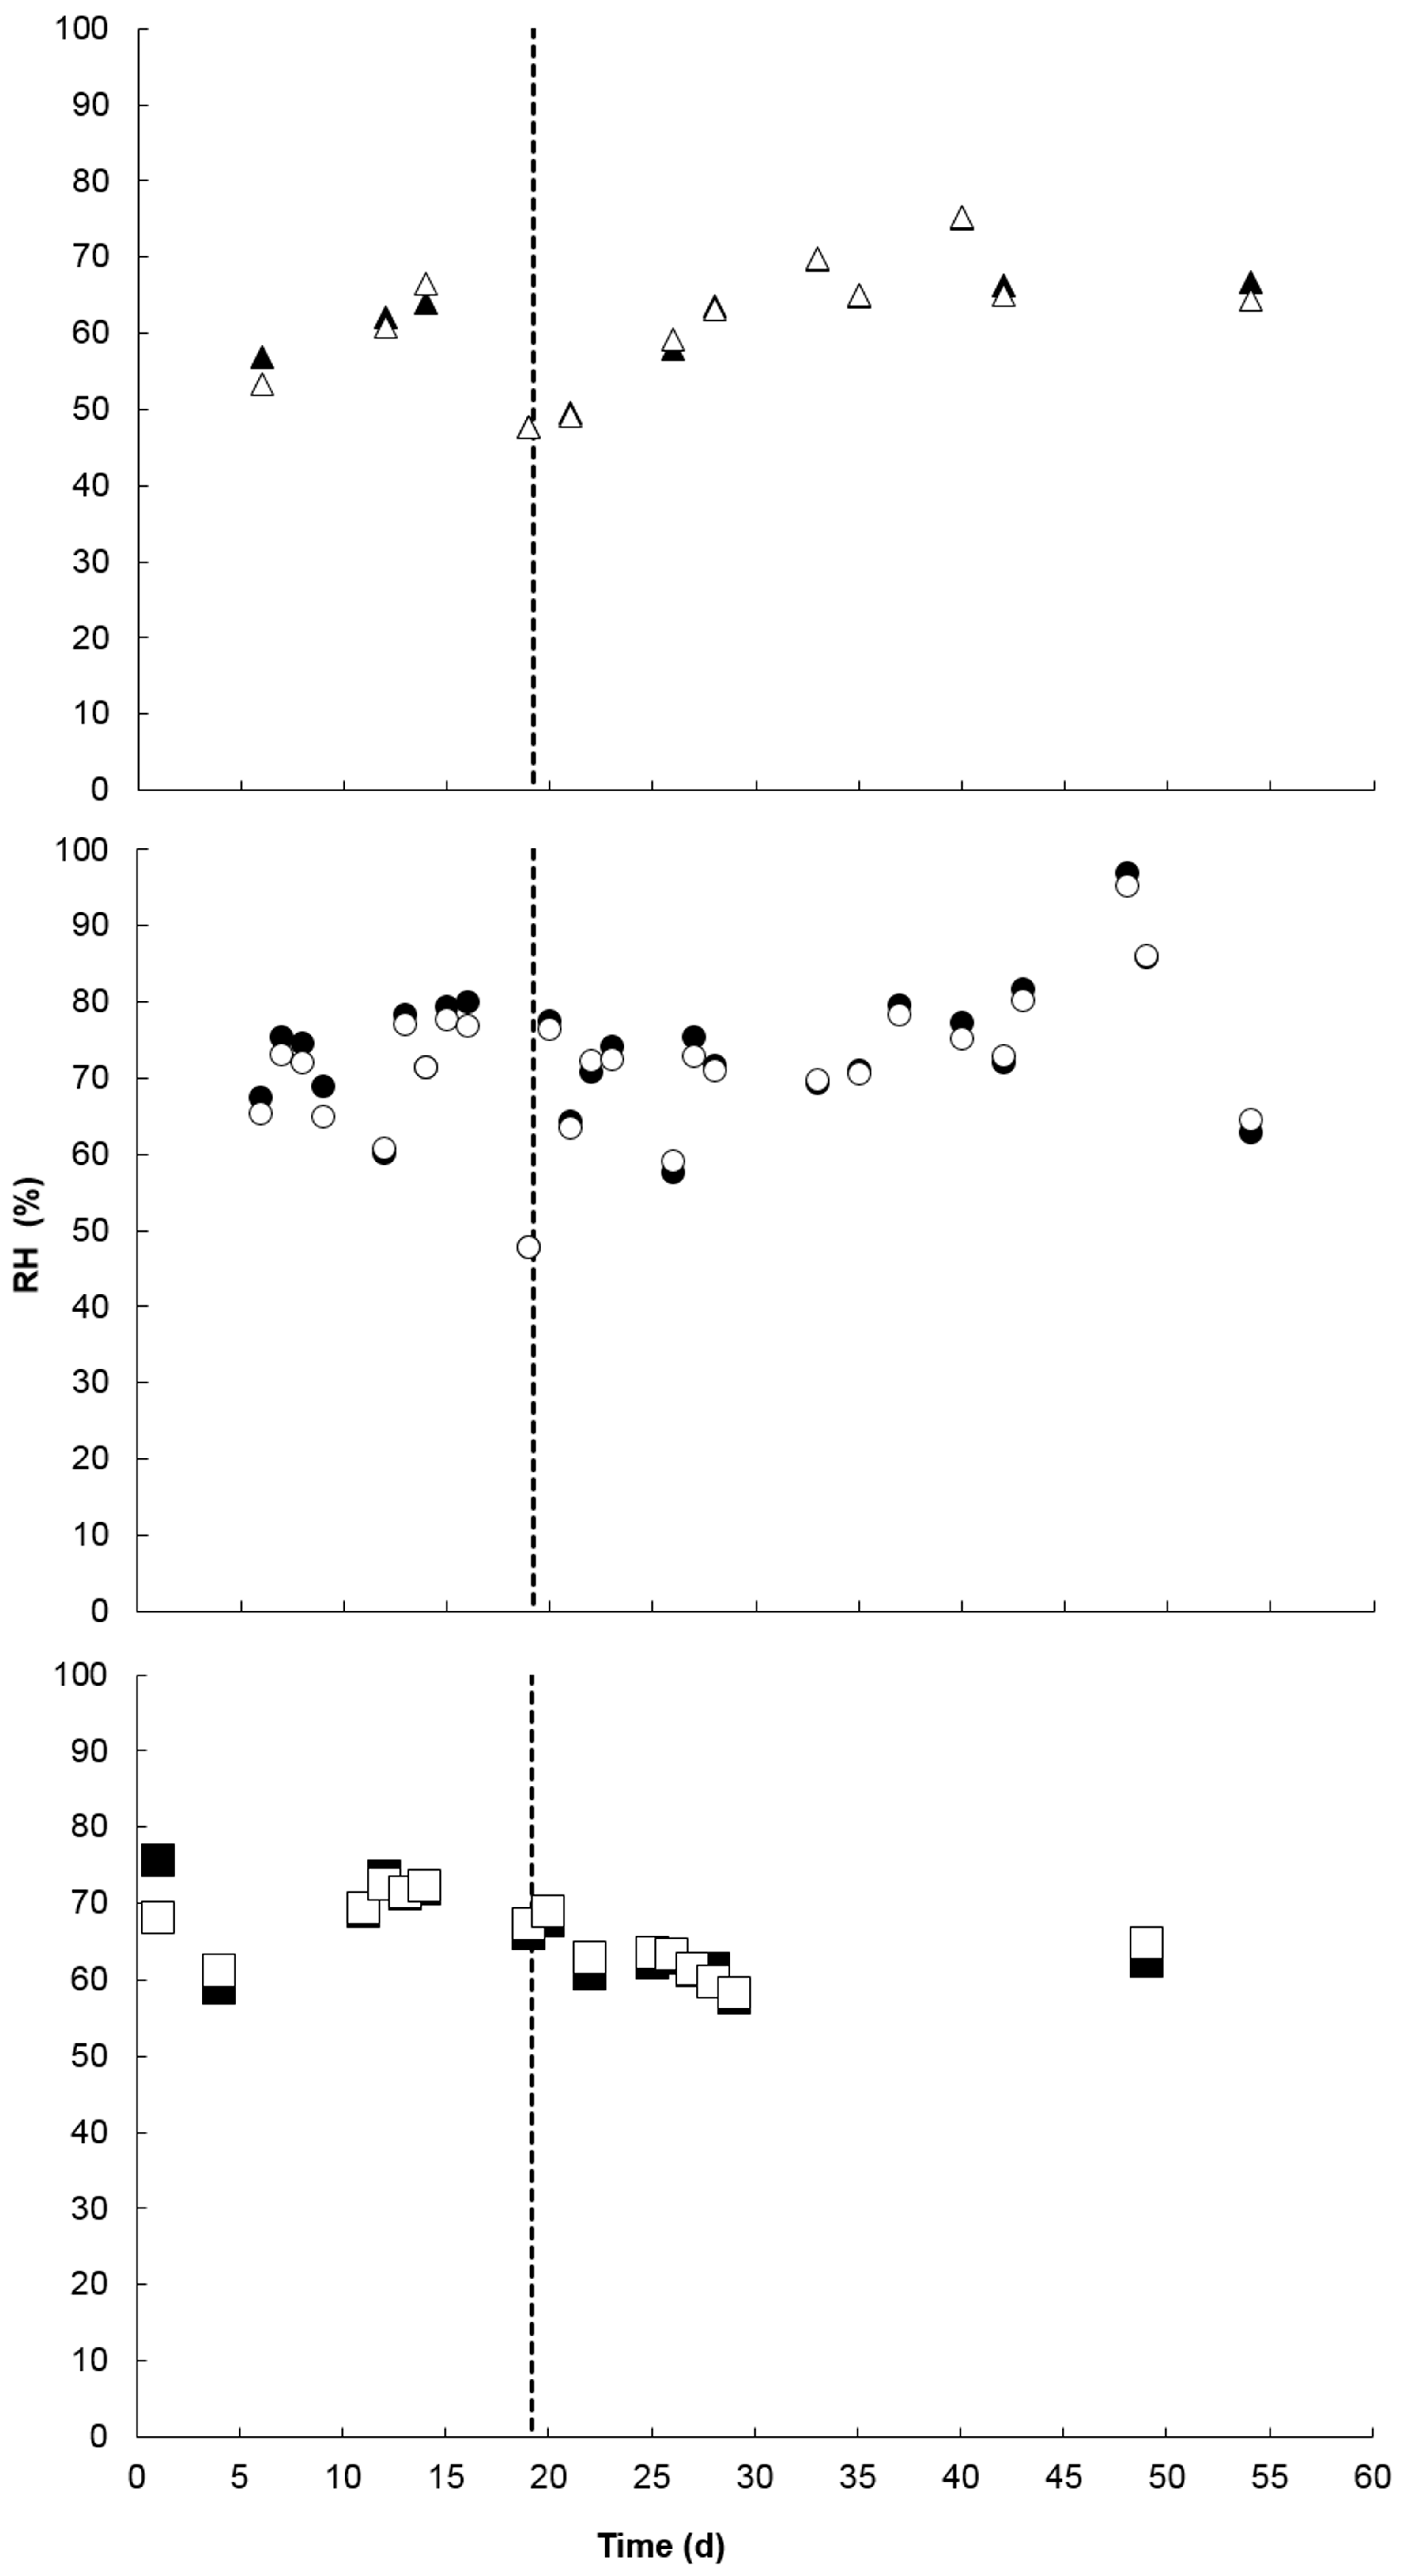
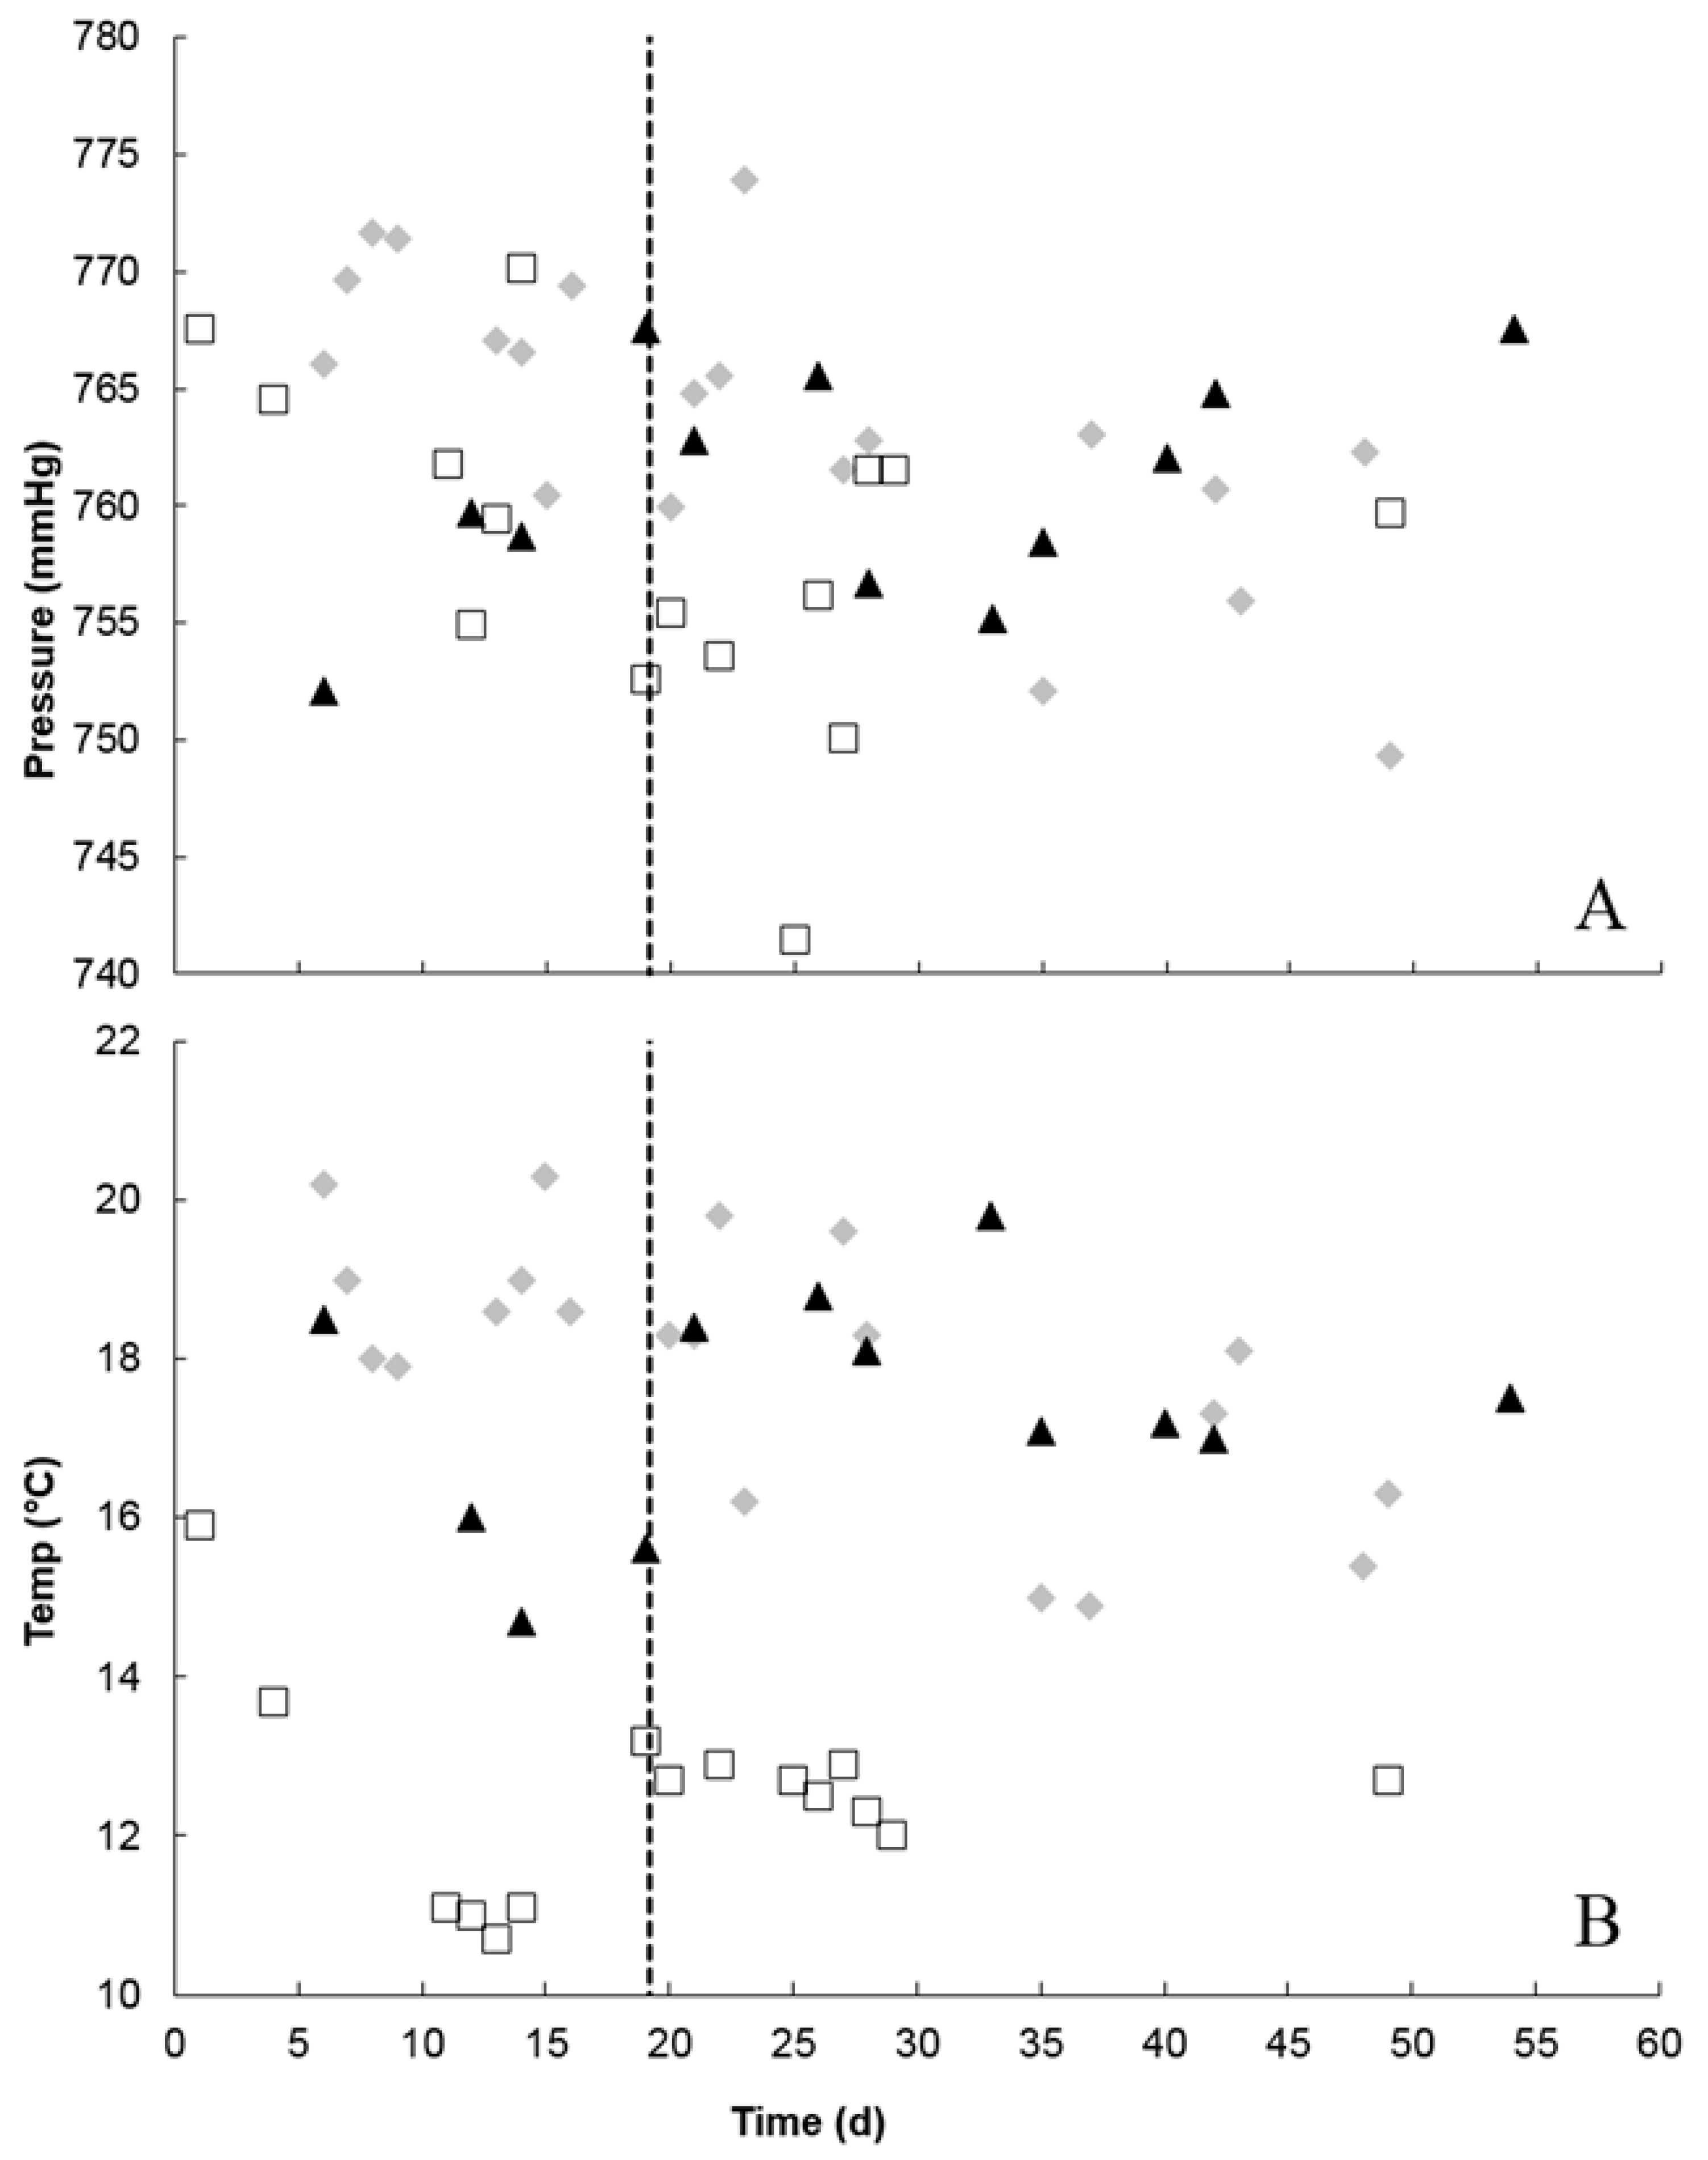
3.5. Treatment Effects on Environmental and Physicochemical Parameters

The atmospheric pressure (Figure 6A) showed a drop and a rise in pressure at about 1 week after biochar addition for Trial 2 and Trial 1, respectively. Trial 2 showed the lowest storage temperatures (Figure 6B) and the highest temperatures were observed for Trial 1. Biochar treatment at any dosage did not have a significant effect on the relative humidity of the outlet air (Figure 7).

3.6. Manure Analysis

A summary of swine manure and its physicochemical properties is summarized in Table 3. Manure properties were consistent with those of typical to the Midwestern U.S. swine industry and storage systems. Manure properties were not significantly affected by the biochar treatment. The manure from the outdoor lagoon had lower values for many of the manure properties as expected due to dilution caused by rain water entering the open outdoor lagoon.

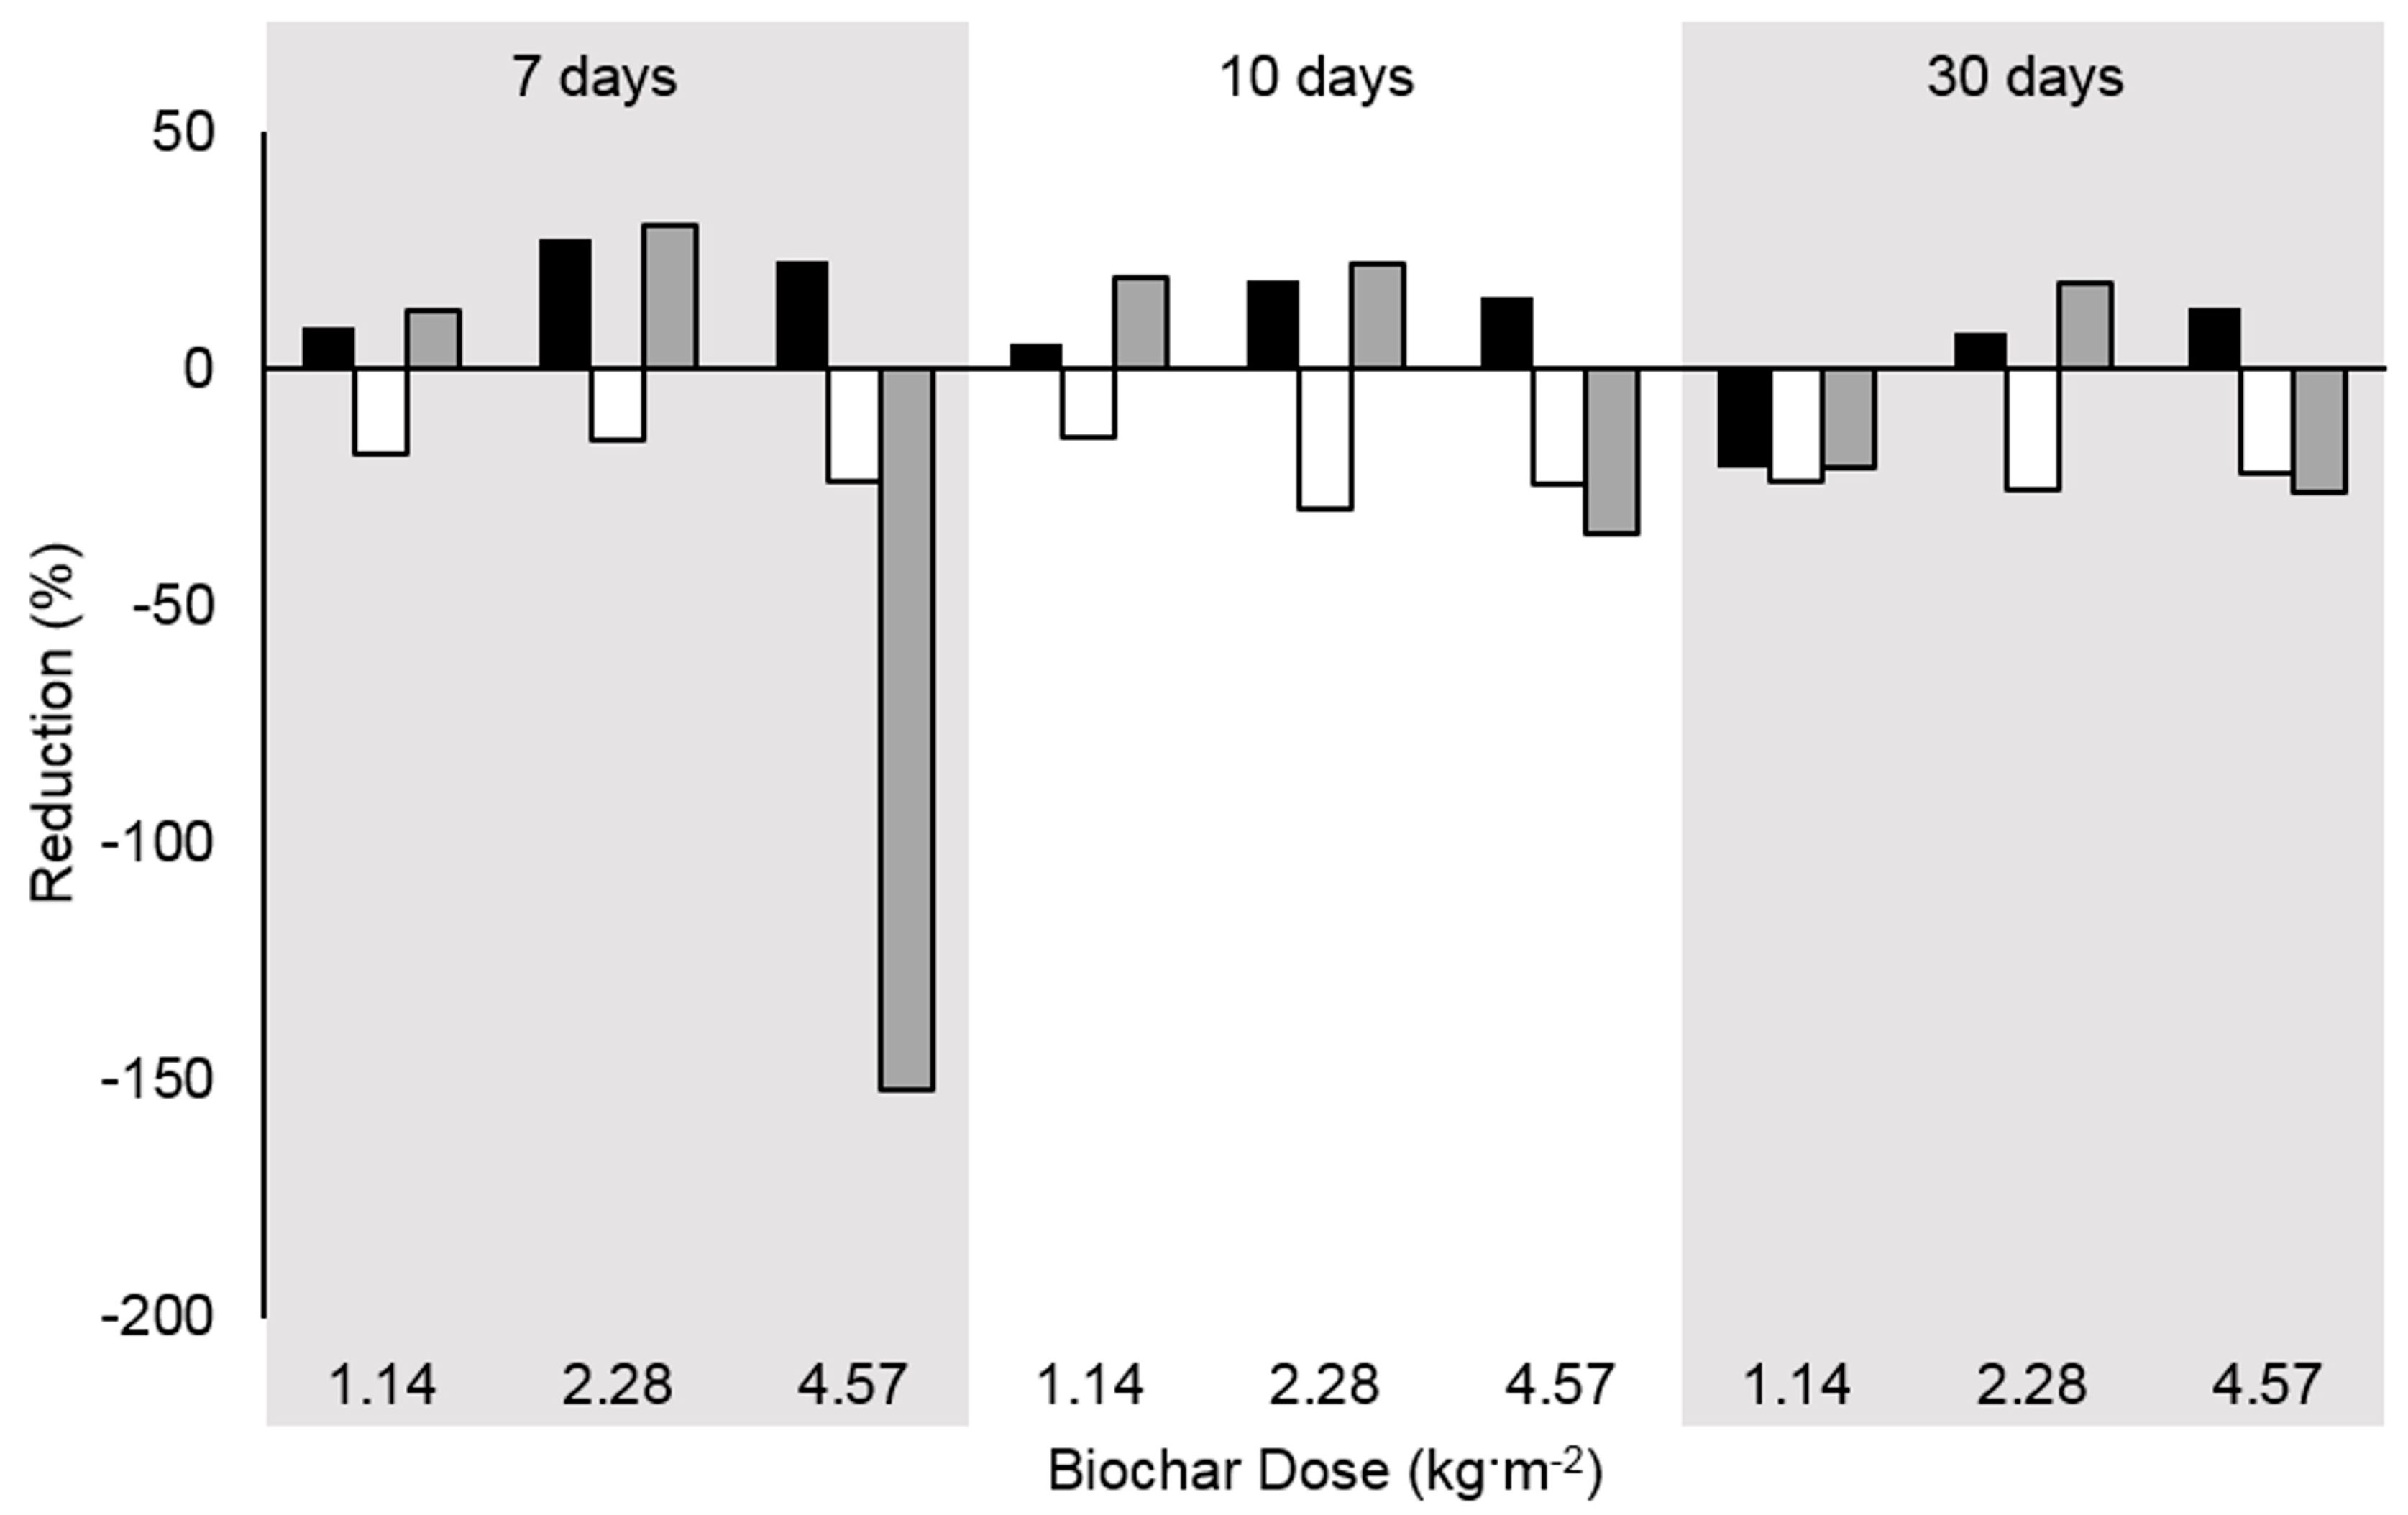
3.7. Effects of Biochar Dose and Time

Doubling the biochar dose improved the longevity of significant reduction of NH3 emissions but also resulted in a significant increase in CH4 emissions. The effect of increasing the dose was detrimental to reducing emissions of all other gases except for p-cresol and skatole (not significantly, though) for all overall time periods. Significantly affected compounds are shown in Figure 8. The biochar dosage must, therefore, be optimized to balance between reducing NH3 and indole and not overly increasing CH4. The biochar dosage of 2.28 kg·m−2 found the balance between effectiveness of reducing NH3 for each of the individual 2.28 kg·m−2 trials, the average of the two 2.28 kg·m−2 trials due to trial variability was not significant. Indole was only significant during Trial 3, while not significantly increasing CH4 emissions.

3.8. Economics of Biochar Treatment

It was determined that a non-activated, non-functionalized biochar can be an economically-feasible option for controlling gaseous emissions from stored manure. The resulting treatment costs ranged from 0.15 to 8.57 USD·marketed pig−1 for the 2.28 kg·m−2 biochar application rate with the low- and high-market values of biochar, respectively (Table 4). These costs are based on 90 to 5060 USD·metric ton−1 [38] for biochar with an application to a typical Midwestern U.S. 2500-head swine barn. The following assumptions were made: 1858 m2 of manure surface to cover, marketing 6900 pigs·year−1·barn−1, and 2.76 grow-out cycles·year−1 using an industry standard stocking density of 0.74. Biochar treatment is assumed to be applied at the beginning of each grow-out cycle. The wide range of biochar pricing is based on the low-end (bulk) pricing and high-end (marketed as ‘soil amendment’) estimate. These costs do not include labor required to apply the treatments, which could vary greatly depending on the method of application. Cost estimates for mitigation additives are relatively few and often limited to one or few target gases reported. The biochar treatment cost of 0.15 to 8.57 USD·marketed pig−1 price estimates is within the range of 0.01 to 18.18 USD·marketed pig−1 price estimates reported in the literature, with an average additive cost of 4.28 ± 5.80 USD·marketed pig−1 for manure additive treatment for targeting one or more of the following: odor, VOCs, NH3, and H2S [39,40,41,42].

4. Conclusions

Comprehensive control of odors, hydrogen sulfide (H2S), ammonia (NH3), and greenhouse gas (GHG) emissions associated with swine production is a critical need. A pilot-scale experiment was conducted to evaluate the surface application of biochar as a manure additive to mitigate emissions of NH3, H2S, dimethyl disulfide/methanethiol (DMDS/MT), dimethyl trisulfide, n-butyric acid, valeric acid, isovaleric acid, p-cresol, indole, skatole, and GHGs. The biochar was tested with three treatments (1.14, 2.28 and 4.56 kg·m−2 manure) over a month. Biochar floated on top of swine manure for at least a 1-month period. It was determined that a thin layer of biochar can be effective at mitigating gaseous emissions for selected types of gases. Based on the preliminary three trials, significant reductions in emissions were observed for NH3 (13 to 23%) with concomitant significant increases in CH4 (22–25%). The remaining emissions (including N2O) were not statistically different. It was determined that non-activated, non-functionalized biochar can be an economically feasible option for controlling gaseous emissions from stored manure. The resulting treatment costs ranged from 0.15 to 8.57 USD·marketed pig−1 for the 2.28 kg·m−2 biochar application rate at the low- and high-market values of biochar, respectively. Biochar treatment could be a promising option for reducing gaseous NH3 emissions in swine operations.

Acknowledgments

Special thanks to: (1) The Kosciuszko Foundation for funding Kajetan Kalus with the research scholarship “Research on Mitigation of Livestock Odour” (February–April 2016) and contributions to the project; and to (2) the Fulbright Foundation for funding Jacek Koziel with the “Enhancing STEM Collaborations with the Wroclaw University of Environmental and Life Sciences” project (September 2015–June 2016). The authors would like to express appreciation for samples of biochar provided in-kind by Avello, Inc.

Author Contributions

J.A.K., D.L.M. and S.O. conceived and designed the experiments; D.L.M., K.K. and D.S.A. performed the experiments; D.L.M. and D.S.A. analyzed the data; J.A.K. and D.S.A. contributed reagents/materials/analysis tools; D.L.M. and J.A.K. wrote the paper.

Conflicts of Interest

The authors declare no conflict of interest. The founding sponsors had no role in the design of the study; in the collection, analyses, or interpretation of data; in the writing of the manuscript, and in the decision to publish the results.

References

  1. The United States Environmental Protection Agency. Sources of Greenhouse Gas Emissions. 2014. Available online: https://www.epa.gov/ghgemissions/sources-greenhouse-gas-emissions (accessed on 28 May 2017).
  2. Iowa State University Extension and Outreach. Air Management Practices Assessment Tool Website. 2016. Available online: http://www.agronext.iastate.edu/ampat/homepage.html (accessed on 28 May 2017).
  3. Maurer, D.L.; Koziel, J.A.; Harmon, J.D.; Hoff, S.J.; Rieck-Hinz, A.M.; Andersen, D.S. Summary of performance data for technologies to control gaseous, odor, and particulate emissions from livestock operations: Air management practices assessment tool (AMPAT). Data Brief 2016, 7, 1413–1429. [Google Scholar] [CrossRef] [PubMed]
  4. Mohan, D.; Sarswat, A.; Ok, Y.S.; Pittman, C.U., Jr. Organic and inorganic contaminants removal from water with biochar, a renewable, low cost and sustainable absorbent—A critical review. Bioresour. Technol. 2014, 160, 191–202. [Google Scholar] [CrossRef] [PubMed]
  5. Gai, X.; Wang, H.; Liu, J.; Zhai, L.; Liu, S.; Ren, T.; Liu, H. Effects of feedstock and pyrolysis temperature on biochar adsorption of ammonium and nitrate. PLoS ONE 2014, 9, e113888. [Google Scholar] [CrossRef] [PubMed]
  6. Ro, K.; Lima, I.M.; Reddy, G.B.; Jackson, M.A.; Gao, B. Removing gaseous NH3 using biochar as an adsorbent. Agriculture 2015, 5, 991–1002. [Google Scholar] [CrossRef]
  7. Jindo, K.; Suto, K.; Matsumoto, K.; Garcia, C.; Sonoki, T.; Sanchez-Monedero, M.A. Chemical and biochemical characterisation of biochar-blended composts prepared from poultry manure. Bioresour. Technol. 2012, 110, 396–404. [Google Scholar] [CrossRef] [PubMed]
  8. Czekala, W.; Malinska, K.; Caceres, R.; Janczak, D.; Dach, J.; Lewicki, A. Co-composting of poultry manure mixtures amended with biochar—The effect of biochar on temperature and C-CO2 emissions. Bioresour. Technol. 2016, 200, 921–927. [Google Scholar] [CrossRef] [PubMed]
  9. Zhang, J.; Chen, G.; Sun, H.; Zhou, S.; Zou, G. Straw biochar hastens organic matter degradation and produces nutrient-rich compost. Bioresour. Technol. 2016, 200, 876–883. [Google Scholar] [CrossRef] [PubMed]
  10. Steiner, C.; Das, K.C.; Melear, N.; Lakly, D. Reducing nitrogen loss during poultry litter composting using biochar. J. Environ. Qual. 2010, 39, 1236–1246. [Google Scholar] [CrossRef] [PubMed]
  11. Jia, X.; Yuan, W.; Ju, X. Short report: Effects of biochar addition on manure composting and associated N2O emissions. J. Sustain. Bioenergy Syst. 2015, 5, 56–61. [Google Scholar] [CrossRef]
  12. Dias, B.O.; Silva, C.A.; Higashikawa, F.S.; Roig, A.; Sanchez-Monedero, M.A. Use of biochar as bulking agent for the composting of poultry manure: Effect on organic matter degradation and humification. Bioresour. Technol. 2010, 101, 1239–1246. [Google Scholar] [CrossRef] [PubMed]
  13. Jindo, K.; Sanchez-Monedero, M.A.; Hernandez, T.; Garcia, C.; Furukawa, T.; Matsumoto, K.; Sonoki, T.; Bastida, F. Biochar influences the microbial community structure during manure composting with agricultural wastes. Sci. Total Environ. 2012, 416, 476–481. [Google Scholar] [CrossRef] [PubMed]
  14. Mandal, S.; Thangarajan, R.; Bolan, N.S.; Sarkar, B.; Khan, N.; Ok, Y.S.; Naidu, R. Biochar-induced concomitant decrease in ammonia volatilization and increase in nitrogen use efficiency by wheat. Chemosphere 2016, 142, 120–127. [Google Scholar] [CrossRef] [PubMed]
  15. Komnitsas, K.A.; Zaharaki, D. Morphology of modified biochar and its potential for phenol removal from aqueous solutions. Front. Environ. Sci. 2016, 4, 1–11. [Google Scholar] [CrossRef]
  16. Rogovska, N.; Laird, D.; Cruse, R.; Fleming, P.; Parkin, T.; Meek, D. Impact of biochar on manure carbon stabilization and greenhouse gas emissions. Soil Biol. Biochem. 2011, 75, 871–879. [Google Scholar] [CrossRef]
  17. Troy, S.M.; Lawlor, P.G.; O’Flynn, C.J.; Healy, M.G. Impact of biochar addition to soil on greenhouse gas emissions following pig manure application. Soil Biol. Biochem. 2013, 60, 173–181. [Google Scholar] [CrossRef]
  18. Wang, C.; Lu, H.; Dong, D.; Deng, H.; Strong, P.J.; Wang, H.; Wu, W. Insight into the effects of biochar on manure composting: Evidence supporting the relationship between N2O emissions and denitrifying community. Environ. Sci. Technol. 2013, 47, 7341–7349. [Google Scholar] [CrossRef] [PubMed]
  19. Chowdhury, M.A.; de Neergaard, A.; Jensen, L.S. Potential of aeration flow rate and bio-char addition to reduce greenhouse gas and ammonia emissions during manure composting. Chemosphere 2014, 97, 16–25. [Google Scholar] [CrossRef] [PubMed]
  20. Chen, J.; Kim, H.; Yoo, G. Effects of biochar addition on CO2 and N2O emissions following fertilizer application to a cultivated grassland soil. PLoS ONE 2015, 10, e0126841. [Google Scholar] [CrossRef] [PubMed]
  21. Brennan, R.B.; Healy, M.G.; Fenton, O.; Lanigan, G.J. The effect of chemical amendments used for phosphorus abatement on greenhouse gas and ammonia emissions from dairy cattle slurry: Synergies and pollution swapping. PLoS ONE 2015, 10, e0111965. [Google Scholar] [CrossRef] [PubMed]
  22. Maurer, D.L.; Koziel, J.A.; Bruning, K.; Parker, D.B. Pilot-scale testing of renewable biocatalyst for swine manure treatment and mitigation of odorous VOCs, ammonia and hydrogen sulfide emissions. Atmos. Environ. 2017, 150, 313–321. [Google Scholar] [CrossRef]
  23. MidWest Plan Service (MWPS). Structures and Environment Handbook, MWPS-1, 11th ed.; Iowa State University: Ames, IA, USA, 1983; ISBN 0-89373-057-2. [Google Scholar]
  24. Da Silva Batista, A.P.; Van Weelden, M.; Andersen, D.S. Impact of temperature and mixing on methane production rates of swine manures obtained from deep pit storages. ASABE Paper 131619616. In Proceedings of the ASABE Annual International Meeting, Kansas City, MO, USA, 21–24 July 2013. [Google Scholar]
  25. Zhang, S.; Cai, L.; Koziel, J.A.; Hoff, S.J.; Schmidt, D.R.; Clanton, C.J.; Jacobson, L.D.; Parker, D.B.; Heber, A.J. Field air sampling and simultaneous chemical and sensory analysis of livestock odorants with sorbent tubes and GC-MS/olfactometry. Sens. Actuators B 2010, 146, 427–432. [Google Scholar] [CrossRef]
  26. Andersen, K.B.; Hansen, M.J.; Feilberg, A. Minimisation of artefact formation of dimethyl disulphide during sampling and analysis of methanethiol in air using solid sorbent materials. J. Chromatogr. A 2012, 1245, 24–31. [Google Scholar] [CrossRef] [PubMed]
  27. Cai, L.; Koziel, J.A.; Zhang, S.; Heber, A.J.; Cortus, E.L.; Parker, D.B.; Hoff, S.J.; Sun, G.; Heathcote, K.Y.; Jacobson, L.D.; et al. Odor and odorous chemical emissions from animal buildings: Part 3—Chemical emissions. Trans. ASABE 2015, 58, 1349–1359. [Google Scholar] [CrossRef]
  28. Association of Official Analytical Chemists. Official Methods of Analysis, 17th ed.; Association of Official Analytical Chemists International: Rockville, MD, USA, 2000. [Google Scholar]
  29. American Public Health Association. Standard Methods for the Examination of Water and Wastewater, 20th ed.; American Public Health Association: Washington, DC, USA, 1998. [Google Scholar]
  30. Sethupathi, S.; Zhang, M.; Rajapaksha, A.U.; Lee, S.R.; Nor, N.M.; Mohamed, A.R.; Al-Wabel, M.; Lee, S.S.; Ok, Y.S. Biochars as potential adsorbers of CH4, CO2 and H2S. Sustainability 2017, 9, 121. [Google Scholar] [CrossRef]
  31. Wang, Q.; Fang, W.; Yan, D.; Han, D.; Li, Y.; Ouyang, C.; Guo, M.; Cao, A. The effects of biochar amendment on dimethyl disulfide emission and efficiency against soil-borne pests. Water Air Soil Pollut. 2016, 227, 98. [Google Scholar] [CrossRef]
  32. Shang, J.; He, W.; Fan, C. Adsorption of dimethyl trisulfide from aqueous solution on a low-cost adsorbent: Thermally activated pinecone. Chin. J. Oceanol. Limnol. 2015, 33, 169–175. [Google Scholar] [CrossRef]
  33. Das, L.; Kolar, P.; Classen, J.J.; Osborne, J.A. Adsorbents from pine wood via K2CO3-assisted low temperature carbonization for adsorption of p-cresol. Ind. Crops Prod. 2013, 45, 215–222. [Google Scholar] [CrossRef]
  34. Fitzgerald, S.; Kolar, P.; Classen, J.; Boyette, M.; Das, L. Swine manure char as an adsorbent for mitigation of p-cresol. Environ. Prog. Sustain. Energy 2015, 34, 125–131. [Google Scholar] [CrossRef]
  35. Yang, K.; Yang, J.; Jiang, Y.; Wu, W.; Lin, D. Correlations and adsorption mechanisms of aromatic compounds on a high heat temperature treated bamboo biochar. Environ. Pollut. 2016, 210, 57–64. [Google Scholar] [CrossRef] [PubMed]
  36. Yu, L.; Tang, J.; Zhang, R.; Wu, Q.; Gong, M. Effects of biochar application on soil methane emission at different soil moisture levels. Biol. Fertil. Soils 2013, 49, 119–128. [Google Scholar] [CrossRef]
  37. Clough, T.J.; Condron, L.M.; Kammann, C.; Muller, C. A review of biochar and soil nitrogen dynamics. Agronomy 2013, 3, 275–293. [Google Scholar] [CrossRef]
  38. Jirka, S.; Tomlinson, T. 2013 State of the Biochar Industry: A Survey of Commercial Activity in the Biochar Field. A Report by the International Biochar Initiative. 2014. Available online: http://www.biochar-international.org/sites/default/files/State_of_the_Biochar_Industry_2013.pdf (accessed on 28 May 2017).
  39. Balsari, P.; Dinuccio, E.; Gioelli, F. A low cost solution for ammonia emission abatement from slurry storage. Int. Congr. Ser. 2006, 1293, 323–326. [Google Scholar] [CrossRef]
  40. Heber, A.J.; Ni, J.Q.; Lim, T.T.; Diehl, C.A.; Sutton, A.L.; Duggirala, R.K.; Haymore, B.L.; Kelly, D.T.; Adamchuk, V.I. Effect of a manure additive on ammonia emission from swine finishing buildings. Trans. ASAE 2000, 43, 1895–1902. [Google Scholar] [CrossRef]
  41. Heber, A.J.; Ni, J.; Sutton, A.L.; Patterson, J.A.; Fakhoury, K.; Kelly, D.; Shao, P. Laboratory Testing of Commercial Manure Additives for Swine Odor Control; Final Report; USDA-ARS-National Swine Research and Information Center: Ames, IA, USA, 2001. [Google Scholar]
  42. Moreno, L.; Predicala, B.; Nemati, M. Laboratory, semi-pilot and room scale study of nitrite and molybdate mediated control of H2S emission from swine manure. Bioresour. Technol. 2010, 101, 2141–2151. [Google Scholar] [CrossRef] [PubMed]
  43. US Inflation Calculator. 2015. Available online: http://www.usinflationcalculator.com/ (accessed on 28 May 2017).
Figure 1. Pilot-scale manure storage simulator with capacity of ~100 L. Green: incoming clean air, Red: polluted (dirty) air before sampling, Blue: exhaust air (polluted air after sampling), PVC: polyvinyl chloride.
Sustainability 09 00929 g001
Figure 2. Biochar 2.28 kg·m−2 surface application to swine manure. Swine manure before biochar application (Left), after biochar application (Middle), and one month after biochar application (Right).
Sustainability 09 00929 g002
Figure 3. Biochar treatment of manure effect on NH3 emissions. ∆: Control 1.14 kg·m−2, ○: Control 2.28 kg·m−2, □: Control 4.56 kg·m−2, ▲: Treated 1.14 kg·m−2, ●: Treated 2.28 kg·m−2, ■: Treated 4.56 kg·m−2 biochar doses, -----: biochar application, NH3: ammonia.
Sustainability 09 00929 g003
Figure 4. Biochar treatment of manure effect on indole emissions. ∆: Control 1.14 kg·m−2, ○: Control 2.28 kg·m−2, □: Control 4.56 kg·m−2, ▲: Treated 1.14 kg·m−2, ●: Treated 2.28 kg·m−2, ■: Treated 4.56 kg·m−2 biochar doses, -----: biochar application.
Sustainability 09 00929 g004
Figure 5. Biochar treatment of manure effect on methane emissions. ∆: Control 1.14 kg·m−2, ○: Control 2.28 kg·m−2, □: Control 4.56 kg·m−2, ▲: Treated 1.14 kg·m−2, ●: Treated 2.28 kg·m−2, ■: Treated 4.56 kg·m−2 biochar doses, -----: biochar application.
Sustainability 09 00929 g005
Figure 6. Pressure (A) and temperature (B). : Trial 1, □: Trial 2, ▲: Trial 3, -----: biochar application.
Sustainability 09 00929 g006
Figure 7. Relative humidity. ∆: Control 1.14 kg·m−2, ○: Control 2.28 kg·m−2, □: Control 4.56 kg·m−2, ▲: Treated 1.14 kg·m−2, ●: Treated 2.28 kg·m−2, ■: Treated 4.56 kg·m−2 biochar doses, -----: biochar application.
Sustainability 09 00929 g007
Figure 8. Effect of dose and time of biochar treatment for compounds that were significantly affected during the trials. Black: ammonia, White: methane, Gray: indole.
Sustainability 09 00929 g008
Table 1. Review of manure-related research on uses of biochar as compost or solid amendment and its effects on gaseous emissions.
ReferenceScale and Duration (d)Treated SourceGaseous Emissions Reduction (%)
NH3H2SCH4CO2N2OPhenol
Jindo, 2012 [7]field, 150poultry manure compostingNANANANANANA
Czekala, 2015 [8]laboratory, 45poultry manure compostingNANANA−7NANA
Zhang, 2015 [9]laboratory, 105swine manure compostingNANANANANANA
Steiner, 2010 [10]pilot, 42poultry litter composting47–5558–71NANSNANA
Jia, 2015 [11]reviewmanure compostingreducedNANANAreducedNA
Dias, 2010 [12]field, 210poultry manure compostingNANANANANANA
Jindo, 2012 [13]field, 85cattle or poultry manure compostingNANANANANANA
Mandal, 2016 [14]laboratory, 30poultry manure in soil41–77NANANANANA
Komnitsas, 2016 [15]laboratory, 1wastewaterNANANANANA10-51
Rogovska, 2011 [16]laboratory, 500swine manure in soilNANANA33–78NSNA
Troy, 2013 [17]laboratory, 28swine manure in soilNANANS−45-NS−79–68NA
Wang, 2013 [18]pilot, 82swine manure compostingNANANANA26NA
Chowdhury, 2014 [19]laboratory, 31poultry manure composting35–43NANSNSNSNA
Chen, 2015 [20]field, 548compost and urea in soilNANANANS−49-NSNA
Brennan, 2015 [21]laboratory, 15cattle slurry in soil77NANS8463NA
Note: NA = Not available, NS = Not significant.
Table 2. Experimental trial conditions.
Biochar Dose (kg·m2)Manure TypeManure Additions During TrialTrial Length (d)Replications
Trial 12.28crustedno30n = 2 treated; n = 1 control
Trial 12.28uncrustedno30n = 2 treated; n = 1 control
Trial 24.56crustedyes 2x30n = 3
Trial 31.14fresh and crustedyes 4x35n = 3
Trial 32.28fresh and crustedyes 4x35n = 3
Note: Crusted manure is from deep pit swine barn with a crust on manure surface, uncrusted manure is from outside storage lagoon with no crust. Trial length does not include time before treatment application.
Table 3. Swine manure properties.
Manure Type TSVSVolatility *CODpHNH4-NTKNPO4-PTP
(%)(%)(%)(mg·L−1)(mg·L−1)(mg·L−1)(mg·L−1)(mg·L−1)
(1) Deep PitControl8.76.473.640,4007.9830010,400173400
Treatment8.56.374.137,0008850010,600187360
(2) Outdoor LagoonControl4.43.579.526,8008.276008450241294
Treatment4.63.780.426,0008.276008650259326
(3) Deep PitControl7.95.974.737,0007.877009700150353
Treatment7.75.77437,8007.879009900130387
Note: TS = total solids. VS = volatile solids. * volatility = VS/TS × 100%. COD = chemical oxygen demand, TP = total phosphorus. TKN = total Kjeldahl nitrogen.
Table 4. Manure additive cost comparison.
ReferenceAdditiveAdditive Cost (USD)
Marketed Pig−1m−2·Year−1Pig Space−1·Year−1
This Study1.14 kg·m−2 Biochar0.08–4.290.29–15.920.21–11.84
This Study2.28 kg·m−2 Biochar0.15–8.570.57–31.840.42–23.67
This Study4.56 kg·m−2 Biochar0.30–17.141.14–63.680.84–47.34
Maurer et al. [22]2.28 kg·m−2 SBP/CaO21.45 a2.962.19 b
Maurer et al. [22]4.57 kg·m−2 SBP/CaO22.90 a5.934.39 b
Maurer et al. [22]22.8 kg·m−2 SBP/CaO214.53 a29.6221.95 b
Maurer et al. [22]45.7 kg·m−2 SBP/CaO229.06 a59.3343.90 b
Heber et al. [40]Alliance0.692.55 b1.89
Moreno et al. [42]Sodium Molybdate0.45 c1.98 b1.46 d
Balsari et al. [39]Leca Balls0.01 e0.06 f0.05 b
Heber et al. [41] gAgriKlenz Plus0.572.141.59
Heber et al. [41] gAlken Clear-Flo18.1867.5150.18
Heber et al. [41] gAWL-800.411.521.13
Heber et al. [41] gBiocharge Dry0.943.482.59
Heber et al. [41] gBMT14.8755.2441.05
Heber et al. [41] gEM Waste Treatment8.2730.7222.84
Heber et al. [41] gGT-2000OC BC-2000AF12.1545.1233.53
Heber et al. [41] gInhibodor1.786.614.91
Heber et al. [41] gKrystal Air1.114.133.07
Heber et al. [41] gManure Management Plus2.9510.948.13
Heber et al. [41] gPeroxy Odor Control0.160.590.44
Heber et al. [41] gSMOC7.9629.5621.97
Heber et al. [41] gZymPlex0.823.052.27
Notes: a The stocking density of 1.35 m2·pig−1 (14.6 ft2·pig−1) was lower than industry standards, i.e., 0.74 m2·pig−1 (8 ft2·pig−1), b calculated based on 0.74 m2 (8 ft2)·pig space−1, c calculated based on the average exchange rate (0.8704 USD = 1 CAD) in 2009 (year of publication), d calculated based on 3.25 swine finishing cycles·year−1 (from publication), e calculated based on 2.76 swine finishing cycles·year−1, f calculated based on the average exchange rate (1.26 USD = 1 EUR) in 2006 (year of publication), g concentrations were taken from the manure not the headspace for all but NH3 (ammonia) and H2S (hydrogen sulfide) and costs were based on supplier recommended application rates and frequencies and on a modern 2500 head finisher building with a half-full 2.44 m (8 ft) pit and a stocking density of 0.74 m2. All previously published results on cost have been adjusted for inflation using the U.S. Inflation Calculator [43]. SBP: soybean peroxidase, CaO2: calcium dioxide.

