
Simulating Block-Level Urban Expansion for National Wide Cities

1
School of Architecture and Hang Lung Center for Real Estate, Tsinghua University, Beijing 100084, China
2
Beijing Key Laboratory of Megaregions Sustainable Development Modelling and School of Urban Economics and Public Affairs, Capital University of Economics and Business, Beijing 100070, China
*
Author to whom correspondence should be addressed.
Sustainability 2017, 9(6), 879; https://doi.org/10.3390/su9060879
Submission received: 13 December 2016
/
Revised: 4 May 2017
/
Accepted: 17 May 2017
/
Published: 23 May 2017
(This article belongs to the Section Sustainable Urban and Rural Development)
Abstract
:Large-scale models are generally associated with large spatial modelling units, for example, counties or super grids (several to dozens of km2). Few applied urban models can achieve a large spatial coverage with irregular spatial units due to data availability and computation load. The framework of automatic identification and characterization of blocks developed by Liu and Long (2016) makes such an ideal model possible by establishing the existing urban blocks using road networks and points of interest for very large areas (e.g., a country or a continent). In this study, we develop a mega-vector-blocks cellular automata model (MVB-CA) to simulate urban expansion at the block level for 654 Chinese cities. The existing urban blocks in 2012 were used for initiating the MVB-CA and are generated using multi-levelled road networks and ubiquitous points of interest. We then simulate block-based urban expansion of all the cities from 2012 to 2017. The national spatial development strategies of China are discussed extensively by academia and policy makers, while the baseline scenario and other simulated urban expansion scenarios have been tested and compared horizontally. As one of the first block-based urban expansion models at a national scale, its academic contributions, practical applications, and potential biases are also discussed in this paper. The developed MVB-CA using general approaches is also applicable for other counties.
1. Introduction
This study develops a vector cellular automata model for simulating urban expansion at the block level for all Chinese cities. Most urban expansion models strike a balance between large spatial coverage and local details. Our model makes some progress in simulating a large spatial extent (the whole China) with irregular spatial units at the block level. (Parcels in China correspond to “blocks” in Western countries such as the USA. Since Chinese cities (especially new built parts) are featured with large parcels, the parcel size in our study is larger than the studies in Western countries [1,2].)
Since the establishment of the Reform and Opening up Policy, China’s rapid urbanization has been exerting a far-reaching influence on the evolution of human society throughout the world [3,4]. The total urban population in China has increased from 172 million to 712 million from 1978 to 2012. The number of the reported cities at all levels reached 656 in 2012, and this number has tripled since 1978 [5]. Meanwhile, China is also experiencing an unprecedented active stage of urban expansion. By the end of 2012, urban land area in China had reached 45,361 km2, an increase of 608.6% compared to 1983. Consequently, such an extraordinarily expansion of these cities has put a great pressure on natural resources and ecological environments [6]. Under such a social-economic background, Chinese urban expansion has attracted extensive attention internationally and locally. These efforts have aimed at identifying urban spatial morphology and growth boundaries [7,8], monitoring temporal-spatial process and pattern [9,10,11,12], detecting driving forces and mechanisms [13,14], simulating temporal-spatial process [15], analyzing future scenarios [15], and assessing ecological and environmental impacts [16]. In total, many efforts have been made in China’s urban expansion research spanning different spatial scales, but a few long-term limitations still exist. A great number of studies focused on describing the temporal-spatial patterns, especially at national and regional scales, while temporal-spatial simulation and analysis of future scenarios received much less attention. Moreover, several studies explored simulation methods and analysed the impending scenarios generally based on a micro-level or a mid-level scale but failed to meet the needs of urban dynamic spatial modelling at large scales.
In this paper, a mega-vector-blocks cellular automata model (MVB-CA) using open data and existing CA model strategies is developed for simulating urban expansion at the block level for all 654 Chinese cities. It enables future upgrading to address inter-city connection and interaction. We will not discuss more on the computation load which is not heavy as we previously expect. We highlight its empirical application in Chinese city system, while other studies in China focus on one city or one region.
This paper is structured as follows. The next Section presents a literature. Section 3 describes the datasets used in this paper. The methods and MVB-CA models are introduced in Section 4. We compare the generated blocks and their attributes with existing data sources. Section 5 summarizes the major findings and results. Finally, Section 6 and Section 7 draw a discussion and present some concluding remarks, respectively.
2. Literature Review
A better understanding of urban expansion prediction is essential for effective policy-making. Several robust approaches have been developed for simulating urban expansion dynamically, including cellular automata (CA), agent-based modelling (ABM), CLUE or CLUE-S (Conversion of Land Use and its Effects), artificial neural networks (ANN), and system dynamics (SD). The CA method, sometimes applied in conjunction with the other approaches, has become a well-established tool for modelling urban expansion because of its ability to simulate dynamic spatial processes from a bottom-up perspective [17]. It has been applied to several studies of Chinese city regions such as Beijing [18], Northern China [19], Guangzhou and the Pearl River Delta [20,21], and the Beijing-Tianjin-Tangshan metropolitan area [15]. In the CA models mentioned above, geographic space was typically represented as a grid of regular cells (ranging from 50 m to 1 km in Chinese cases) and the neighbourhood was defined as an assembly of adjacent cells. Recent studies have demonstrated that such raster-based CA models are sensitive to the modifiable units used in the models, while we admit some vector-based CA models are not able to completely avoid such issue. For instance, Chen and Mynett (2003) investigated the effects of cell size and neighbourhood configuration in a prey-predator CA model and observed that they affected both the resulting spatial patterns and the system stability [22]. Jantz and Goetz (2005) examined the results of the SLEUTH model in response to different cell sizes and indicated that the cell size at which the land use data was represented could influence the quantification of land use patterns and descriptive power of the model [23]. Therefore, although the grid-based CA model has proven to be an efficient method to simulate dynamic spatial processes, it is necessary to improve the traditional raster-based method via novel techniques.
Some researchers have begun to use vector or irregular cells in CA models rather than the traditional cells to avoid the drawbacks mentioned above. Recently, the studies of vector-based CA have gained significant attention from academia. O’Sullivan (2001) combined CA and graph theory to generate sets of neighbourhood-scale irregular cells [24]. Irregular cells have also been employed to represent real world entities. For instance, Torrens and Benenson (2005) proposed the geographic automata system (GAS) combining characteristics of both CA and multi-agent models with the aim at incorporating irregular vector objects as automata to represent real-world entities such as roads, buildings, and parks [25]. Stevens and Dragićević [1] developed iCity, in which an urban area was partitioned based on cadastral information into discrete land use units that were represented as a collection of polygons. We also notice Jjumba and Dragićević [26] as its continuing study, which introduce agent-based simulation into the existing iCity. Shen and Kawakami [27] developed a geo-simulation model using a vector-based CA to visualize land use patterns in urban partitions. Pinto and Antunes [28] developed an irregular CA based on census blocks to determine the land use demand under the considerations of the dynamics of population and employment densities over time. In the entity-based CA model presented by Menard [29] and Moreno et al. [30], the shape and size of each object could also change and a dynamic neighbourhood could be semantically implemented. In short, irregular polygons like lots, parcels and blocks provide a good representation of the real world, while raster cells do not directly corresponding to actual geographical entities (irregular polygons such as Voronoi polygons fail to correspond to spatial entities in the real world).
Existing large-scale urban expansion models rarely use vector polygons, especially for the small-scale blocks used as cells in CA. Simulating urban expansion for a large urban extent with irregular spatial units is promising for the following reasons. (1) Blocks, as clear behavioural units, would be more appealing to local decision makers and citizens since each block has a boundary connected with local images and knowledge. (2) Land use regulations could be distributed to blocks directly, and each city would have access to the simulation results. This would benefit those cities with no financial or intelligent stock supervising or being aware of future developments through our model, since not every city has its capacity to develop its own urban expansion model. (3) Block-level simulation results could be compared at the city level so that some intra-city phenomena could be observed. (4) Such a model enables integrating spatial interaction analysis (flows and networks) in the future. We also note that the aforementioned points 3 and 4 also apply to raster CA based large-scale urban expansion models as well.
However, block-level urban expansion models for a large area have rarely been studied due to the parcel/block data availability and computation limitations. Data limitation is a great concern in China compared to other developed countries. For example, the best available block map for China’s capital Beijing, one of the most technologically advanced and rapidly developing cities in the erstwhile Third World, dates back to 2010 [31]. This map cannot provide an accurate reflection given the city’s rapid expansion. In addition, collecting block data for medium and small sized cities in China is constrained by poorly developed digital infrastructures. In addition to the limitations of infrastructure, tedious bureaucratic procedures hamper the access to block maps for Chinese urban planners. For instance, our interviews with 57 planning professionals reveal that the access to existing block maps held by local planning bureaus/institutes is highly controlled, as block maps are tagged as confidential within the current Chinese planning institutions. In summary, block data for the developing world is oftentimes out-dated and limited in geographical scopes. To a certain degree, this condition has obstructed the progress of block-level urban expansion modelling for large areas in China. Overcoming such “data desert” scenarios seems to be the first priority for block-level urban simulation in developing countries.
3. Data
3.1. Administrative Boundaries of Chinese Cities
A total of 654 cities in China are analysed in this study (Figure 1) (Sansha in Hainan and Beitun in Xinjiang appearing in MOHURD [32] were not included due to spatial data availability, while Taiwan was not included in all analysis and results in this paper). Five administrative levels are included: municipalities directly under the Central Government (four cities), sub-provincial cities (15 cities), other provincial capital cities (17 cities), prefecture-level cities (250 cities), and county-level cities (368 cities) (Ministry of Housing and Urban Development, MOHURD, 2013; see Ma, 2005 for more details regarding the Chinese administrative system). As a city proper in China contains both rural and urban land uses, our analytical scope is narrowed to legally define urban land within the city proper.
3.2. Urban Land Area in 2007 and 2012
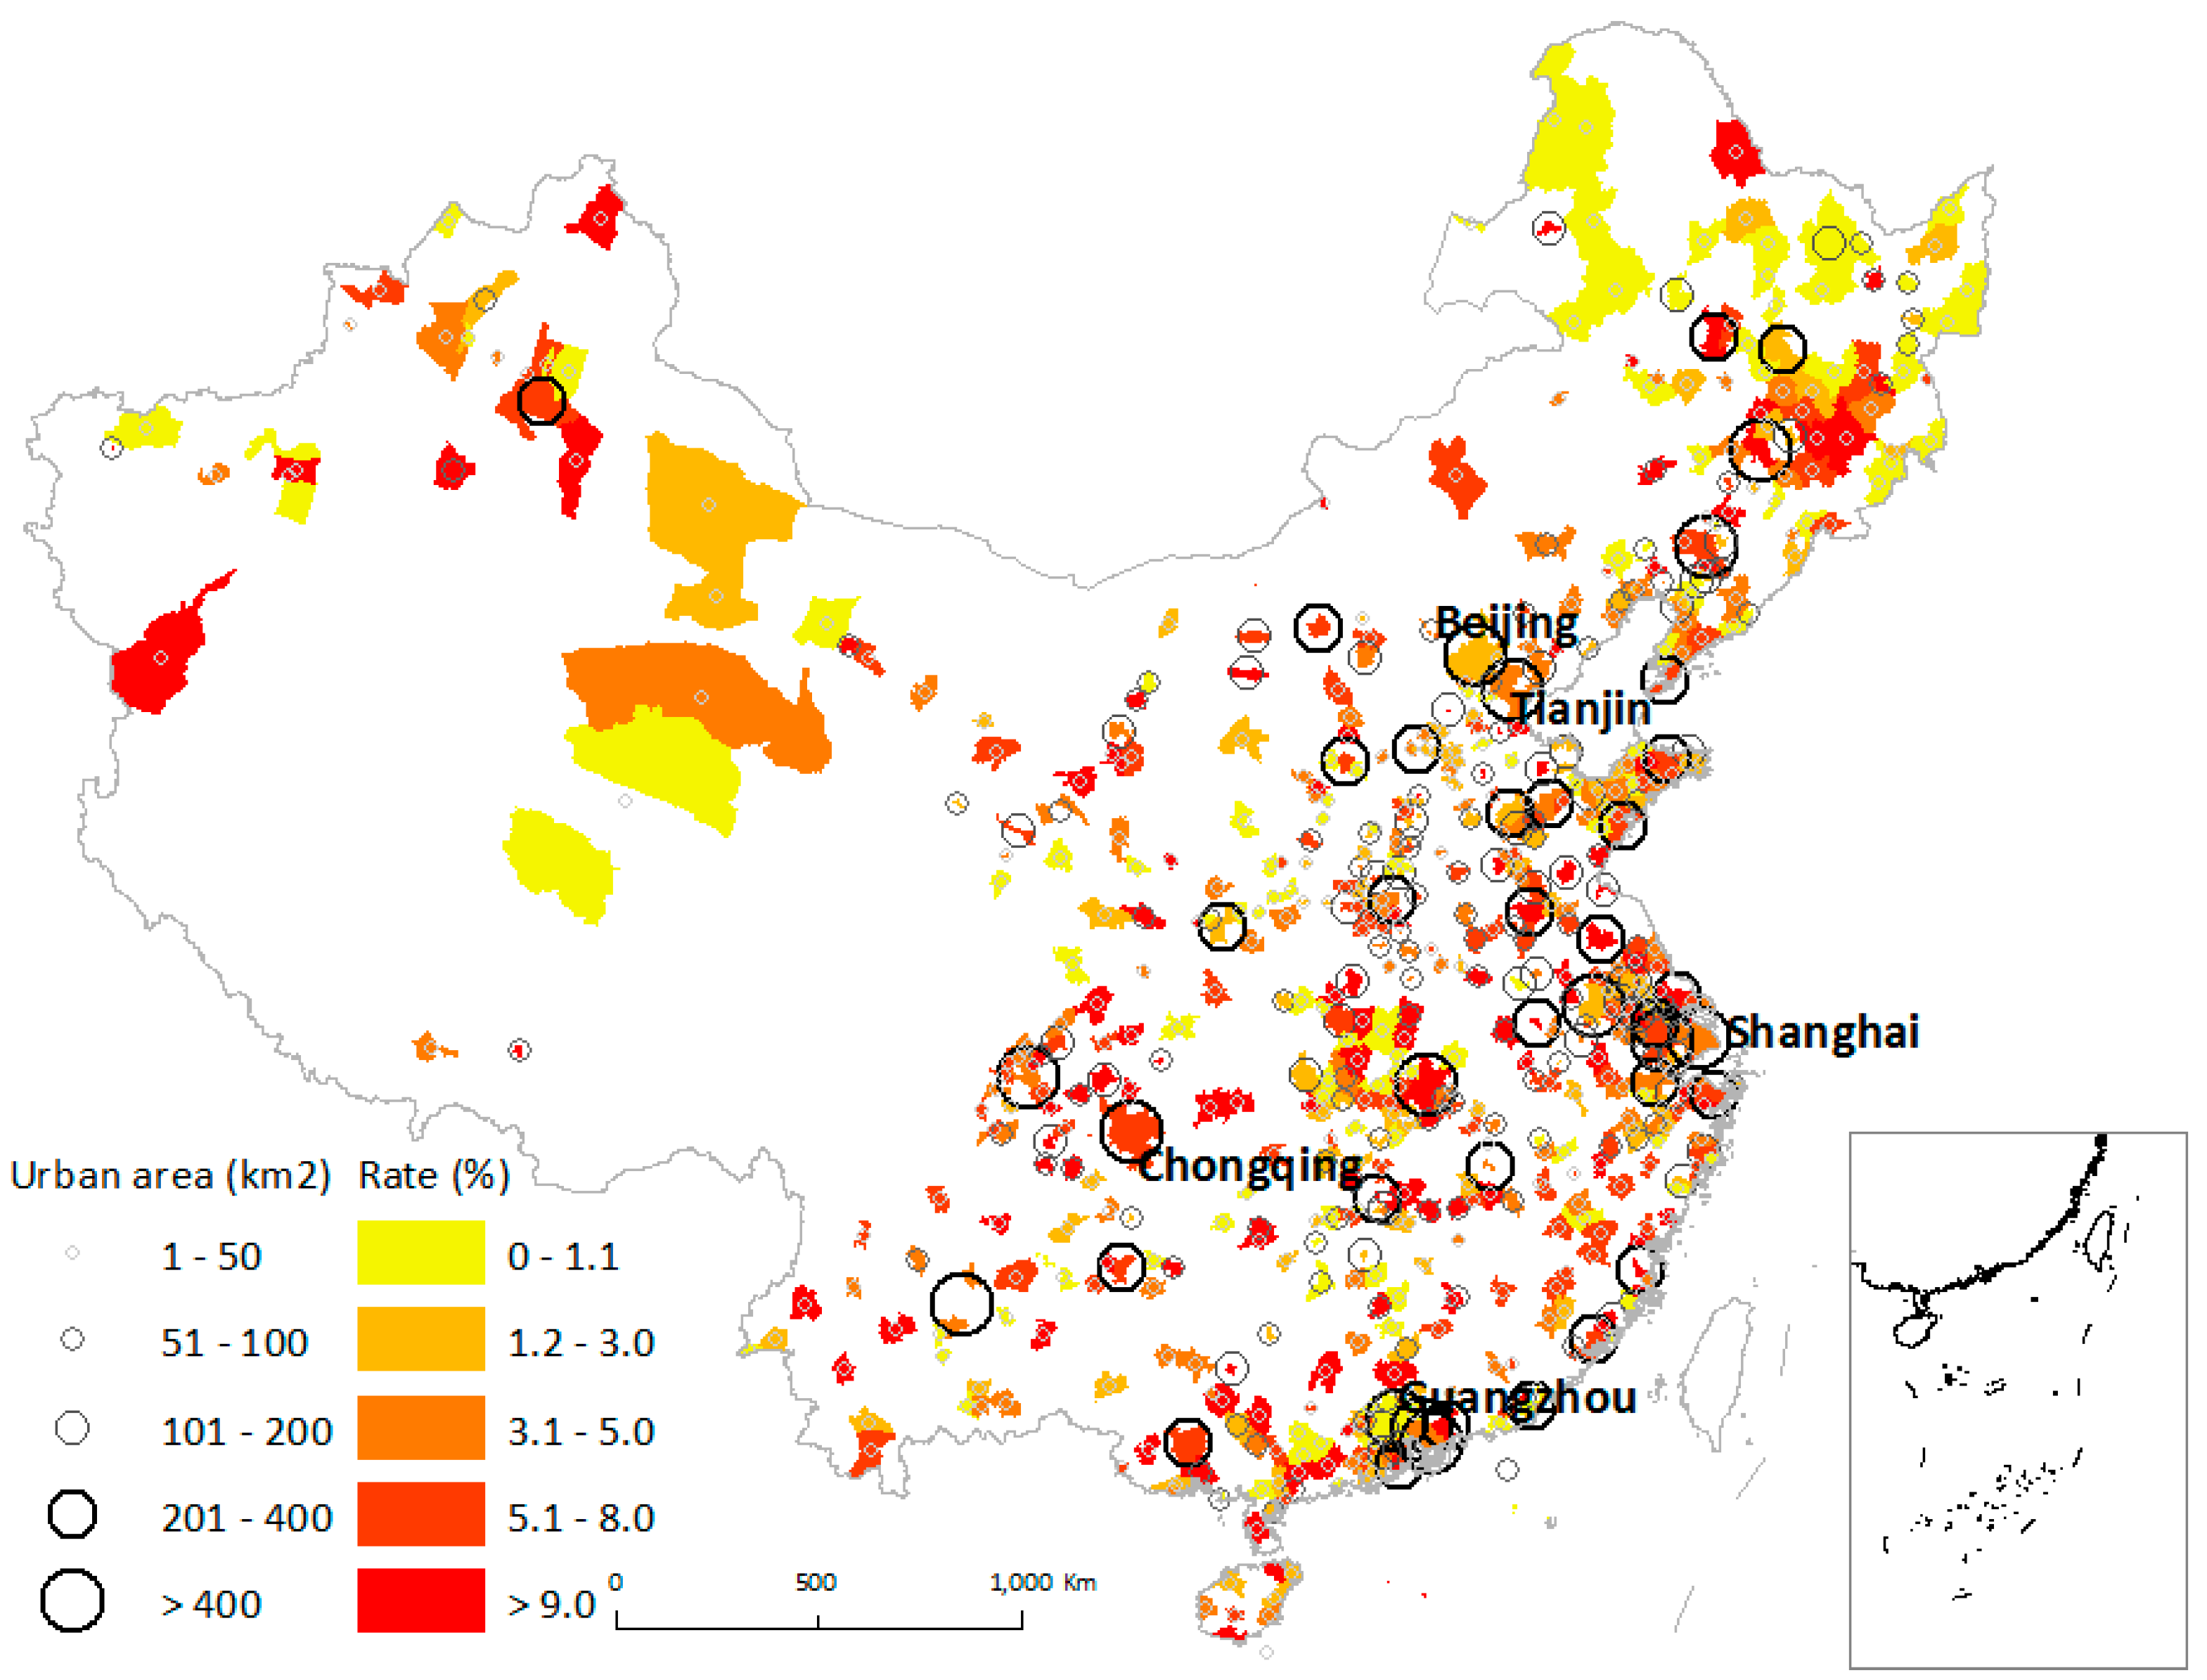
In addition to the administrative boundaries, the urban expansion rate for all cities in China needs to be calibrated using the urban land area information. Thus, information on the total urban land areas of individual cities from 2007 to 2012 was collected from MOHURD [32]. As a result of Chinese urbanization, adjustment of administrative divisions occurs frequently every year. These changes frequently alter the number of cities. For consistency, some city boundaries were merged and revised according to the 2012 administrative districts and city inventories to ensure that each city is comparable in the time dimension. According to the statistics, total urban land area of the 654 cites in China reached 36,352 and 45,361 km2 in 2007 and 2012, respectively. The average growth rate of the 654 cities for that time period was 4.5%. Furthermore, the growth rate of every single city from 2007 to 2012 was estimated for the business-as-usual urban expansion scenario. Figure 2 presents the aforementioned information for all Chinese cities.
3.3. The Ordnance Survey Roads and Points of Interest (POIs) in 2011
Two datasets are used for generating the urban blocks of all Chinese cities. The first one is the 2011 ordnance survey map of China with detailed road networks obtained from a local road navigation firm based in Beijing. Almost all detailed road networks in various levels including streets and regional roads were included in this dataset according to the comparisons with Google Maps and Baidu Map (a main online map service provider and popular online search engine in China, http://map.baidu.com). Total road length was 2,623,867 km for 6,026,326 segments (we would use the term “road” for all types of paved transportation network elements, such as streets and highways).
A total of 5,281,382 POIs were gathered and geo-coded by business cataloguing websites. The initial 20 POI types are aggregated into eight general assemblies: commercial sites account for most POIs, followed by business establishments, transportation facilities, government buildings, and so on. POIs labelled as “other” are used in estimating land use density but were removed in the land use mix analysis as this type of POI with mixed information is not well organized and classified according to our review. The data quality is secured through manually checking randomly selected POIs. Moreover, this empirical framework is extensible in the sense that POI counts can be replaced by other human activity measurements, ranging from the more conventional land use cover derived from remote sensing images to ubiquitously available online check-in service data (e.g., Foursquare) in the background of web 2.0.
3.4. Other Data
The distance to city centres for all blocks is considered in the proposed MVB-CA model. The administrative centre, generally also the city centre, of each city has been manually prepared as a point layer in GIS software. In addition, two layers representing natural limitation for construction are selected as the exclusive development area in the MVB-CA model: steep areas with a slope over 25 degrees and the water space. The steep area is calculated from a DEM of China with a spatial resolution of 90 m, and the hydrological area is extracted from the national fundamental geographic information system (NFGIS, 1:4,000,000) of China.
4. The MVB-CA Model
Few applied urban models can achieve a large spatial coverage with block-level spatial units due to the data availability and computation load. In this study, we develop a mega-vector-blocks cellular automata model (MVB-CA) to simulate urban expansion at the block level for 654 Chinese cities. The following sections describe the detailed methodologies of MVB-CA, the first block-level urban expansion model at a national scale.
4.1. The Model Framework
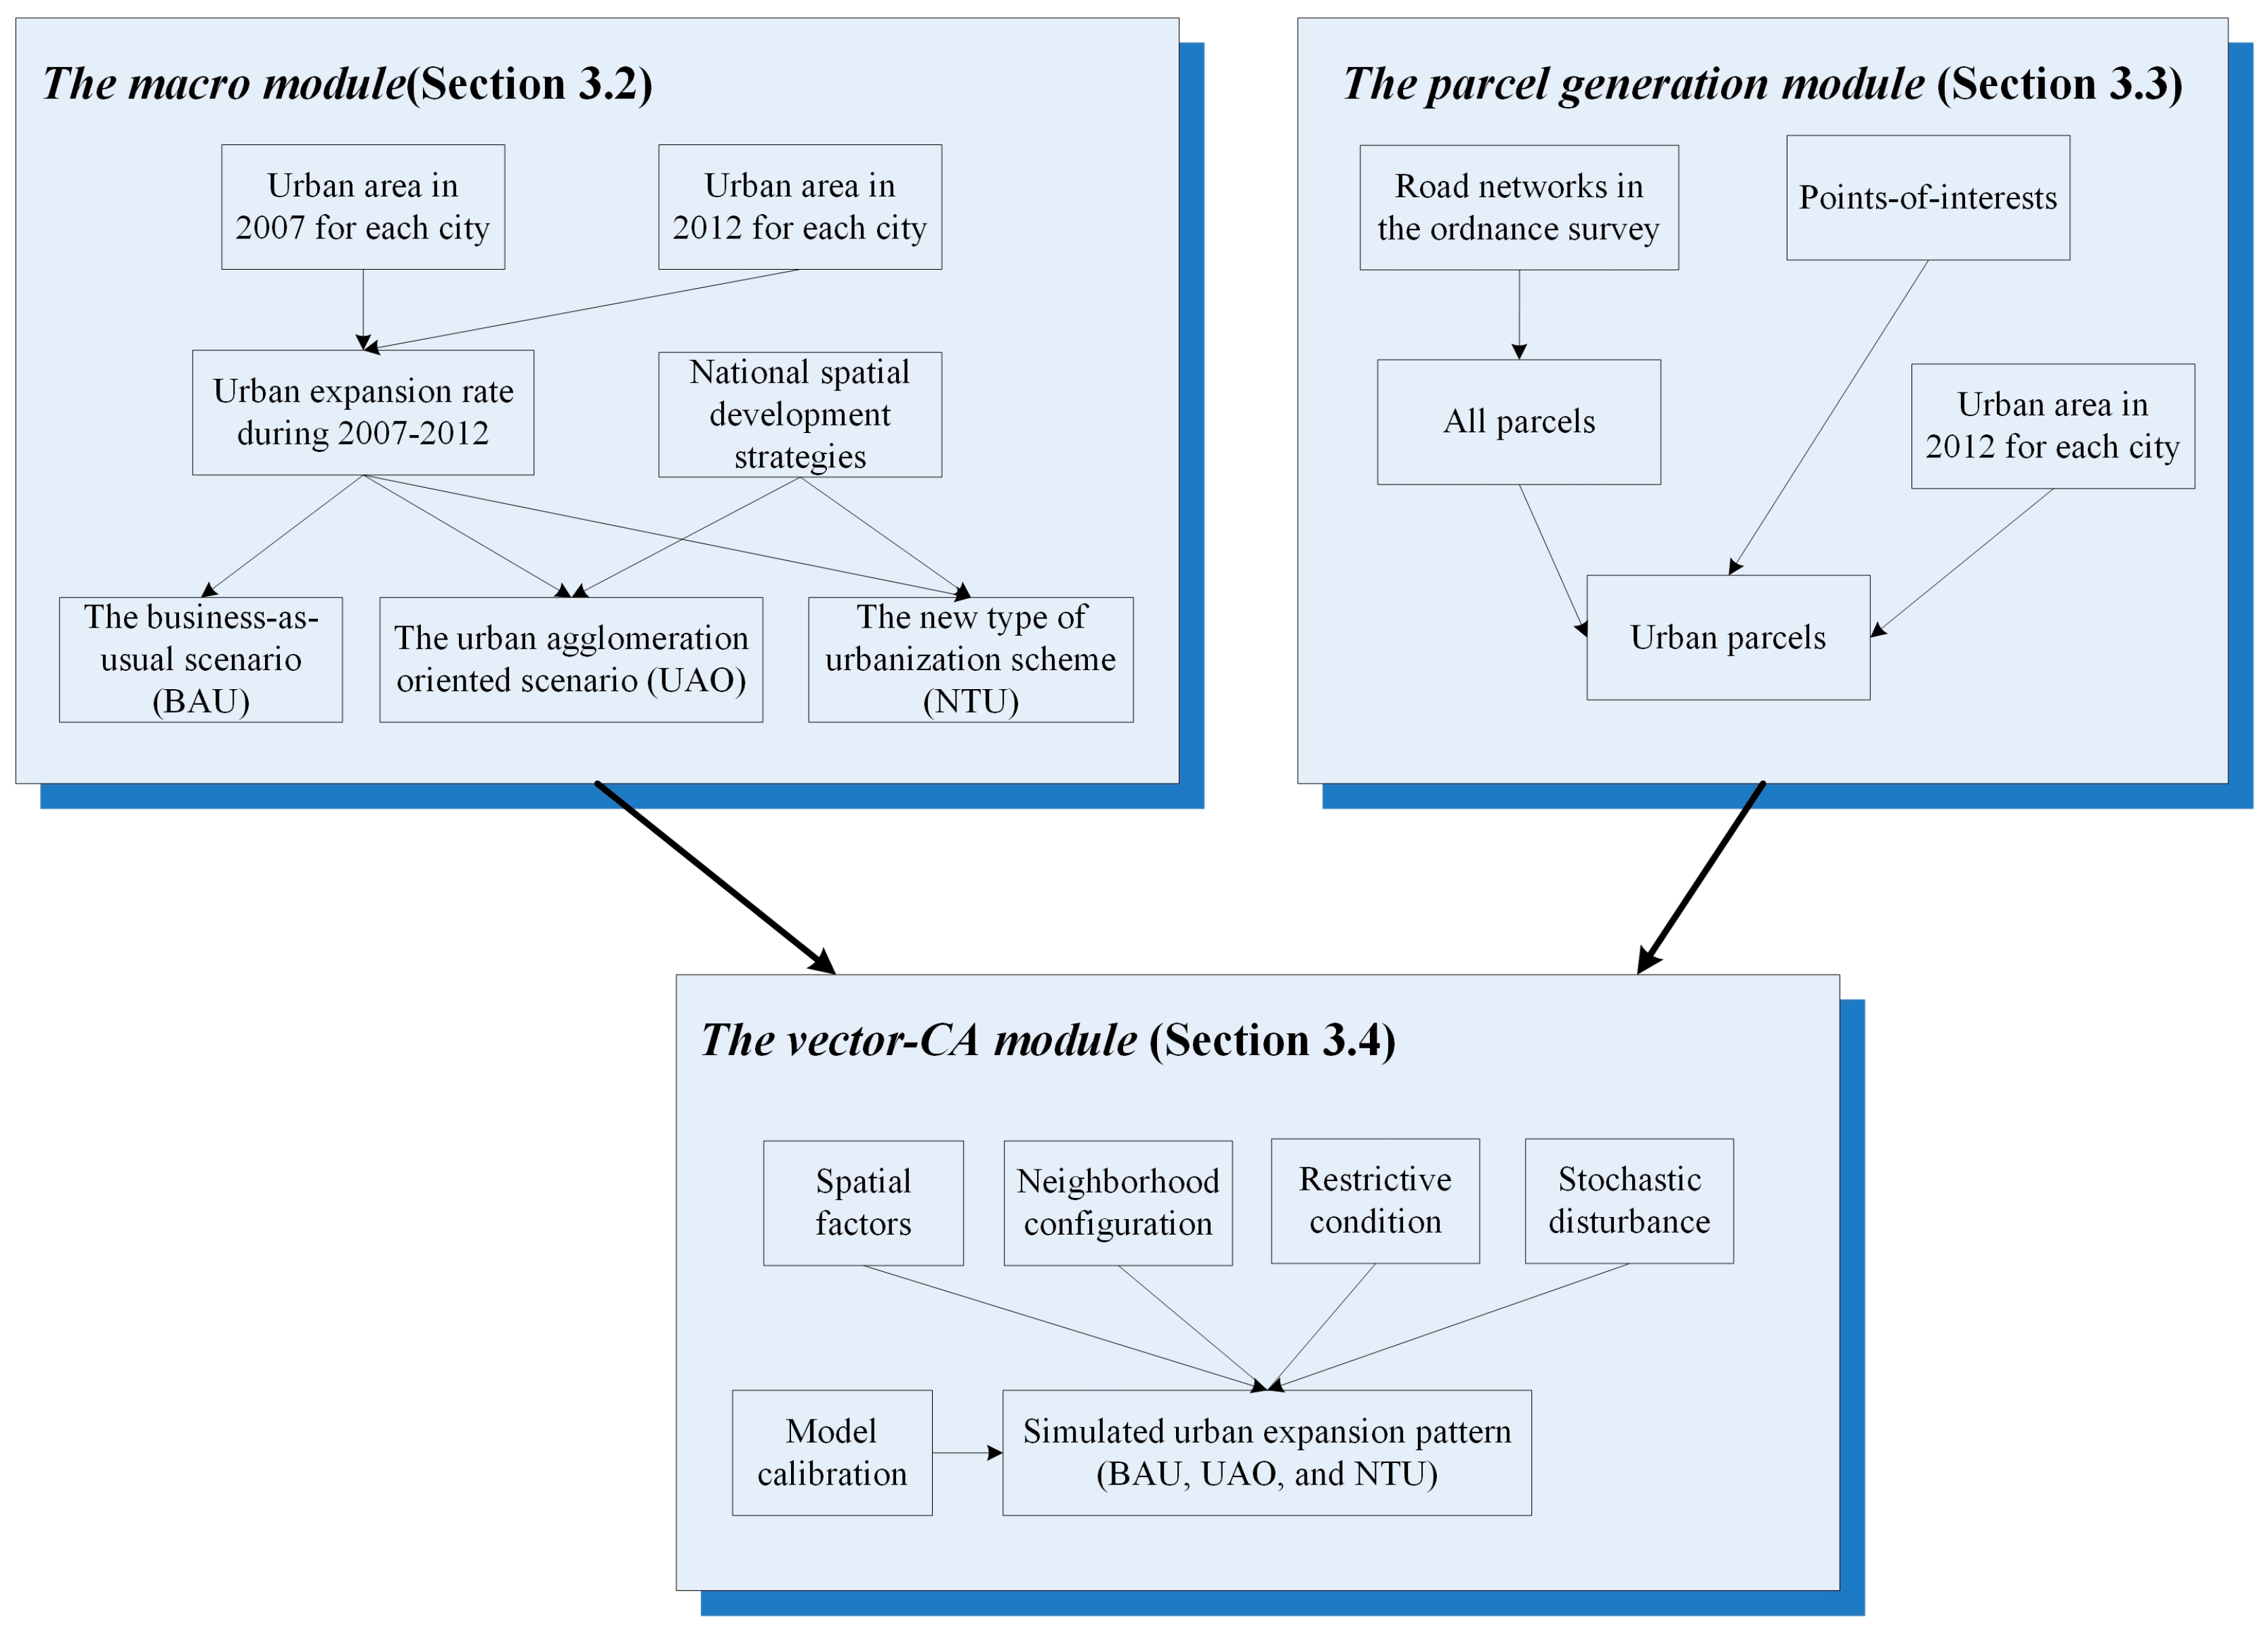
There are three modules in MVB-CA: the macro module, the block generation module, and the vector CA module (see Figure 3 for the flow chart). In the macro module, the urban expansion rate is set for each city according to observed urban land expansion from 2007 to 2012 as the baseline scenario. The other two scenarios were set in accordance with well-known spatial development strategies which are described in detail in Section 3.2. In the block generation module, the model was fed a 2012 base map based on blocks that were generated using the AICP framework (automatic identification and characterization of blocks) developed by Liu and Long [33] (see Section 3.3). In the vector CA module, calibrated parameters extracted from Beijing data and scenario settings by the macro module are fed to simulate future urban expansion from 2012 to 2017 (see Section 3.4).
4.2. The Macro Module
Precisely predicting future urban expansion rates for Chinese cities is not easy or straightforward. Alternatively, a scenario analysis approach is adopted for simulating future urban expansion for all Chinese cities in our model. Relevant large-scale studies of China show that policy regulations (especially the macro-regulation and regional development policies) and socioeconomic development (economy and population growth) are the leading driving forces of urban expansion [11]. According to Deng et al. [14], China’s urban land expands at a rate of 3% when the economy grows by 10%.
In this paper, three scenarios are proposed for the future development. The first one is the business-as-usual scenario (BAU), a baseline scenario indicating that future urban expansion would replicate historical patterns. Urban land areas for each city in the designated year are estimated depending on the urban land expansion rate calculated using urban land areas in 2007 and 2012.
The second scenario is the Urban Agglomeration Oriented Scheme (UAO), as indicated in the 11th Five-Year Plan and the 12th Five-Year Plan of National Economic and Social Development in China. In the next five to ten years, urban agglomerations in China will be developed as the main body of urbanization [34]. Considering the regional variance in China, the central government has agreed to support more than 30 regional planning or development policies in urban agglomerations involving 23 provinces, autonomous regions, and municipalities. These policies are aimed at effectively promoting the urban agglomeration towards healthy and sustainable development in China. Based on the above background and related studies on urban agglomerations in China [35], 23 Urban Agglomerations (UAs) are considered in the second scenario. The boundary of each urban agglomeration is a combination of administrative boundaries of cities in the urban agglomeration. These 23 urban agglomerations account for 21.3% of the total land resources, 55.7% of the total population, 64.2% of the total non-agriculture population, and 79.7% of the gross domestic product (GDP) in China (Figure 4). According to the economic growth performance and urban expansion rates for 2007–2012, 355 cities in UAs are assigned a comparatively higher urban expansion rate of 5.0% with the other cities given a relatively lower urban expansion rate of 4.0% for five future years.
The last scenario is the new type of urbanization scheme (NTU). The NTU is a large-scale future development roadmap that was announced by the central government at the end of 2013 [36]. It symbolizes the shift in focus from land-centred urban development to people-oriented urbanization. One of its key aspects is to foster the coordinated development between large, middle, and small cities as well as small towns. In other words, small cities and towns shall be given priority in urbanization and urban development, while the big cities and especially the megacities will be controlled step by step. (The China Central Urbanization Working Conference was held during 12–14 December 2013 in Beijing. This conference put forward the urbanization path of different kinds of cities in China: fully liberalize the settlement restraints on small cities and towns; orderly open the settlement limit on the medium-sized city, set reasonable settlement conditions in big cities, and strictly control the scale of large urban populations.) In this paper, we set the urban expansion rate of each city according to its existing urban area. Based on the city size classification from the Chinese City Construction Statistics Yearbook, four types of cities are identified for five future years as follows: super cities with urban land area over 400 km2 in 2012 are set with an urban expansion rate of 3.0%; mega-cities with urban land area between 200 and 400 km2 in 2012 are set with an urban expansion rate of 4.0%; big cities with urban land area between 100 and 200 km2 in 2012 are set with an urban expansion rate of 5.0%; and medium-size and small cities with urban land area below 100 km2 in 2012 are set with an urban expansion rate of 6.0%.
4.3. The Block Generation Module
For preparing the base map for block-level simulation of future urban expansion, we use our established AICP framework for generating blocks and selecting all urban blocks from all blocks generated [33]. This technique was applied using roads in OpenStreetMap (OSM) to partition regional space and inferring urban blocks using well-classified POIs provided by online map providers. The full process is automatic and could be easily adapted to annually update existing block maps with upgrades in OSM and POIs.
In this paper, we replace the OSM roads used in Liu and Long [33] with the detailed road network of the ordnance survey to generate blocks in all cities in China. Before generating blocks, the road layers are processed according to their hierarchy respectively before being merged as a single layer. More specifically, all segments are connected with a 20 m tolerance, whereas street segments shorter than 200 m are trimmed to avoid cul-de-sacs. This thresholds selection is reliant on the basic judgment of collected spatial datasets. Moreover, the width of all roads is also defined relying on their hierarchy. Finally, all blocks are presented when the roads are removed from the study areas, and POIs are used for calculating density of each generated block. Then the vector cellular automata models are applied to each city to select urban blocks from all generated blocks, according to each city’s total urban area which was obtained from MOHURD [32]. The derived urban blocks in 2012 are the basis spatial entities for the MVB-CA simulations.
4.4. The Vector CA Module
According to the extracted urban expansion pattern from 1992 to 2008 in China estimated by Liu et al. [4] using DMSP/OLS nighttime light data, most of urban land expansion was distributed on the periphery of existing urban land. This indicates that the distance to the city center and spatial adjacency should significantly influence the future urban expansion. Therefore, spatial criteria are taken into consideration in the vector-based constrained cellular automata (CA) for simulating urban expansion (each city has its own constrained CA model for allocating urban blocks) [37]. Traditional CA consists of five components: (1) space represented as a regular grid composed of a collection of homogeneous cells; (2) a set of possible cell states; and the (3) transition rules which determines the evolution of the state of each cell; based on (4) statuses of its neighbouring cells; and (5) some external constraints at each time step [38,39]. In the proposed CA model, each block is regarded as a cell in CA, and the cell status is 0 (no expansion) or 1 (expanded from rural to urban). At the very beginning, the status of all cells are set according to the 2012 blocks. Based on Feng et al. [40], the conceptual model of the proposed constrained CA is represented as , where and are the states of a cell/building/lot/parcel/block at time t and t + 1, respectively; f is the transition function; is the neighbourhood evaluation function; Con are the constraints on urban expansion; and N is the total number of cells. Every discrete time in CA is a year.
The overview process for the CA module is as follows. First, the initial status of each spatial unit (block in this paper) is set according to existing land use data in the study area. Second, the spatial units in the study area are evaluated from various dimensions like accessibility and surrounding development status. The weight of each dimension can be identified using observed urban development or set by domain experts. Third, the status transition probability of each spatial unit can then be evaluated, and the spatial units with highest probability are urbanized in the iteration. Last, the module runs for times of iterations until the total development amount meets the pre-settings.
Specifically, the probability of cell ij changing its state from non-urban to urban at time t can be represented as , where is the local probability that a cell converts from the non-urban to the urban; is the state conversion probability of the cell within its neighbourhood; is the restrictive condition for urban development; and denotes the stochastic disturbance of any unknown errors [40].
The local probability can be determined through a set of factors using a logistic regression method [41]:
where is a constant, is the spatial variable, is the estimated parameter/weight of , and m is the amount of spatial variables.
In this paper, we select four spatial factors: (1) the natural logarithm of a block size (SIZE_LN); (2) the compactness of a block (COMPACT), calculated using Perimeter×Perimeter/Area; (3) the air distance to city centres in km (CENTER); and (4) the POIs density calculated based on POIs (DENSITY). The density is standardized to a range from 0 to 1 using the following equation: standardized density = log(raw)/log(max), where sraw and max correspond to density of individual blocks and the nation-wide maximum density value, respectively.
Apart from other raster-based constrained CA models, our model contains only two external spatial factors which are considered to be the most important factors driving a block’s spatial expansion. The air distance to road networks is another variable often used in urban expansion models. However, this information is already contained in the block itself, since blocks are mostly delineated from road networks. The factors considered in the vector CA module are similar to Seto et al. [42], which uses slope, distance to roads, population density, and land cover as the primary drivers of land change for global land use simulation.
The state conversion potential of the cell within the neighbourhood can be defined as:
where represents the number of urban cells amongst the neighbourhood of cell i, and n is the count of cells in the neighbourhood of cell i. Five hundred meters is adopted to identify the neighbouring relation between cells. In this study, we buffer each cell (block) by a distance of 500 m, and all cells intersecting with or completely falling in a cell’s buffer zone are regarded as the cell’s neighbourhood. Two layers, the steep area and various water bodies, are included as the restrictive condition. Urban expansion is forbidden in these areas. The constraints are expressed as with a value of 0 or 1, where 1 indicates that there is no restriction on the block’s development from rural to urban, while 0 indicates that the block is forbidden from being developed as urban.
The stochastic disturbance
in the model represents any possible change of local policies and accidental errors. It is calculated using:
where is a random number ranging from 0 to 1, and , ranging from 0 to 10, controls the effect of the stochastic factor.
By comparing the global probability with a predefined threshold value in the range of [0, 1], the model is then used to decide whether a non-urban cell can be converted to urban state at time t + 1:
It should be noted that block subdivision is not taken into account at this stage, considering the vector CA module is expected to be applied for urban expansion simulation for a short temporal span (five years in this paper). Block subdivision is expected to be included in the vector CA module in the future.
4.5. Model Computation Load
The computation time has been a bottleneck for vector CA models. In this paper, the key computation load is attributable to neighbourhood calculations. Blocks were stored in ESRI file Geodatabase as a polygon feature class, and we created an attribute for blocks for storing the IDs of a block’s neighbouring block(s). It took a standalone computer (IBM T430s with an Intel Core i7 CUP and an 8 GB RAM) approximately three days for all 851,054 blocks in 654 cities. This process was facilitated by ArcGIS using Python. This process is automatic and only needs to be calculated a single time, rather than for each iteration. Once it has been calculated, we do not need to alter it during all the simulation processes, thus the computation load problem is somewhat mitigated. We also recognize that separating the neighbourhood calculation by city significantly decreases the computation time consumed (from 12 days for all blocks simultaneously loaded into memory to three days).
After the neighbourhood preparation, we ran the simulation iteration by iteration for each city. Each block’s state (urban or not) in the initial stage is stored as an attribute of the table. We also reserved two attributes for storing the state of a block in the previous and current iterations. Since the state of blocks was keeping changing in each iteration (new expanded blocks generated in each iteration), we calculated the transition probability for each block in each iteration via reading the attributes of a block like its neighbouring block’s IDs and the block’s state in the previous iteration. In total, for all cities, it takes approximately 20 h to simulate urban expansion for each scenario, which is acceptable for a national scale urban expansion model at the block level.
4.6. Model Examination
The model examination can be conducted separately for each module. As a rule-based module, the macro module does not need to be validated. The baseline scenario is set based on the historical urban expansion data. Furthermore, the block generation module has already been validated in Liu and Long [33]. Hence, only the validation of the vector CA module needs to be discussed in this section. First, we compare the baseline scenario results in Beijing with the output of the BUDEM model [8,18], which is a cell-based (500 m in square) urban expansion simulation model for Beijing. There are more spatial factors (market-oriented and institutional types) in the constrained CA based BUDEM, which has been successfully applied in various planning practices in Beijing. BUDEM is calibrated using the same observed urban expansion to guarantee its comparability with the MVB-CA model in the city of Beijing. We admit the limitation on validating the vector CA module with a Beijing model and this process can be regarded as “inter-model comparison”. Second, in addition to the formal validation, the simulated urban expansion can also be examined by online browsers in the form of released block maps at CartoDB (an online WebGIS), in a manner of Wiki-map [43]. Browsers with local knowledge could engage, point out obvious simulation results, and comment on the simulation results. The comments enable the authors to upgrade the developed MVB-CA model.
5. Results
5.1. The Blocks of All Chinese Cities in 2012
The generated urban blocks in 2012 are shown in Figure 5. There are 761,152 urban blocks in total for all 654 Chinese cities with a total land area of 45,361 km2 (the average urban block size is 6.1 hectares).
5.2. Model Calibration for the Vector CA Module
Due to the unavailability of historical data, we cannot calibrate the vector CA module for the whole country. Instead, we limit our model calibration within the city of Beijing (12,183 km2, Yanqing and Miyun in the 16,410-km2-Beijing Metropolitan Area not included), where both the block maps in 2007 and 2012 are obtained, in which urban land is available. Since the block geometries changed significantly from 2007 to 2012, only the intersected blocks are regarded as the samples (N = 26,877 including 5119 expanded blocks). The urban expansion is identified (expanded as 1, non-expanded as 0) and factor values are attached to all “intersected” blocks accordingly. Logistic regression is used for identifying parameters for spatial factors. The explanatory power of logistic regression was 81.9%. The logistic regression results shown in Table 1 were applied in the MVB-CA model for all city regions (we admit the heterogeneity of weights in various city regions. We do not have existing blocks in other cities in writing this paper). The MVB-CA model was used in the city of Beijing at the same time. An overall precision of 83.2% indicated the applicability of our CA model in replicating historical urban expansion in a city region.
5.3. Simulation Results of the Vector CA Module
We use the calibrated parameters in Table 1 for simulating the three urban expansion scenarios, each of which replicates the historical urban expansion trend. The simulation of urban expansion patterns of China is shown in Figure 6 (limited to the BAU scenario). The BAU scenario presents a path-dependent urban expansion relying on stable economic growth and land-use policies. Total urban land areas estimated by BAU are 62,835 km2 in 2017, an increase of 38.5% compared to 45,361 km2 of urban land in 2012. The overall spatial pattern of urban land in 2017 is similar to 2012. Some typical urban agglomerations in the east developed into metropolitan interlocking regions (See Figure 7). The simulated pattern in the UAO scenario indicates an urban agglomeration oriented scheme, and urban lands of those cities in UAs will expand significantly no matter where they are located. Total urban land area of the UAO is 58,394 km2 in 2017, an increase of 28.7% compared to urban land in 2012. This is 4441 km2 less than the BAU scenario. The NTU scenario considered the new type of urbanization scheme that was proposed by the central government of China in late 2013. In this scenario, mega-cities are strictly controlled for their urban land expansion that encroaches farmlands in the next five years. It is worth noting that medium and small-sized cities demonstrate a more rapid expansion than big ones. The total urban land area of the NTU is 58,930 km2 in 2017, an increase of 29.7% compared to urban land in 2012 and a decrease of 3905 km2 in comparison with BAU. Among all the three scenarios, the BAU scenario has the largest urban expansion rate (38.5%) and may denote the upper limit of total urban land in China. In contrast, spatial development strategies considered by the UAO and NTU scenarios have significant effects on curbing urban sprawl of Chinese cities by balancing both the sustainable supply of urban lands and demands of rapid urbanization.
The differences among spatial patterns in the three scenarios are originated from the total areas of cities. For instance of the county-level city Jiangyin, the total urban area expanded in the UAO scenario is the largest, followed by the scenarios NTU and BAU. Therefore, urban expansion simulation results of Jiangyin in the BAU scenario are contained by those in the NTU scenario, which are then contained by those in the UAO scenario. In the future study, we would propose more scenarios considering the configuration of spatial factor weights as well, to reflect various spatial patterns of each city.
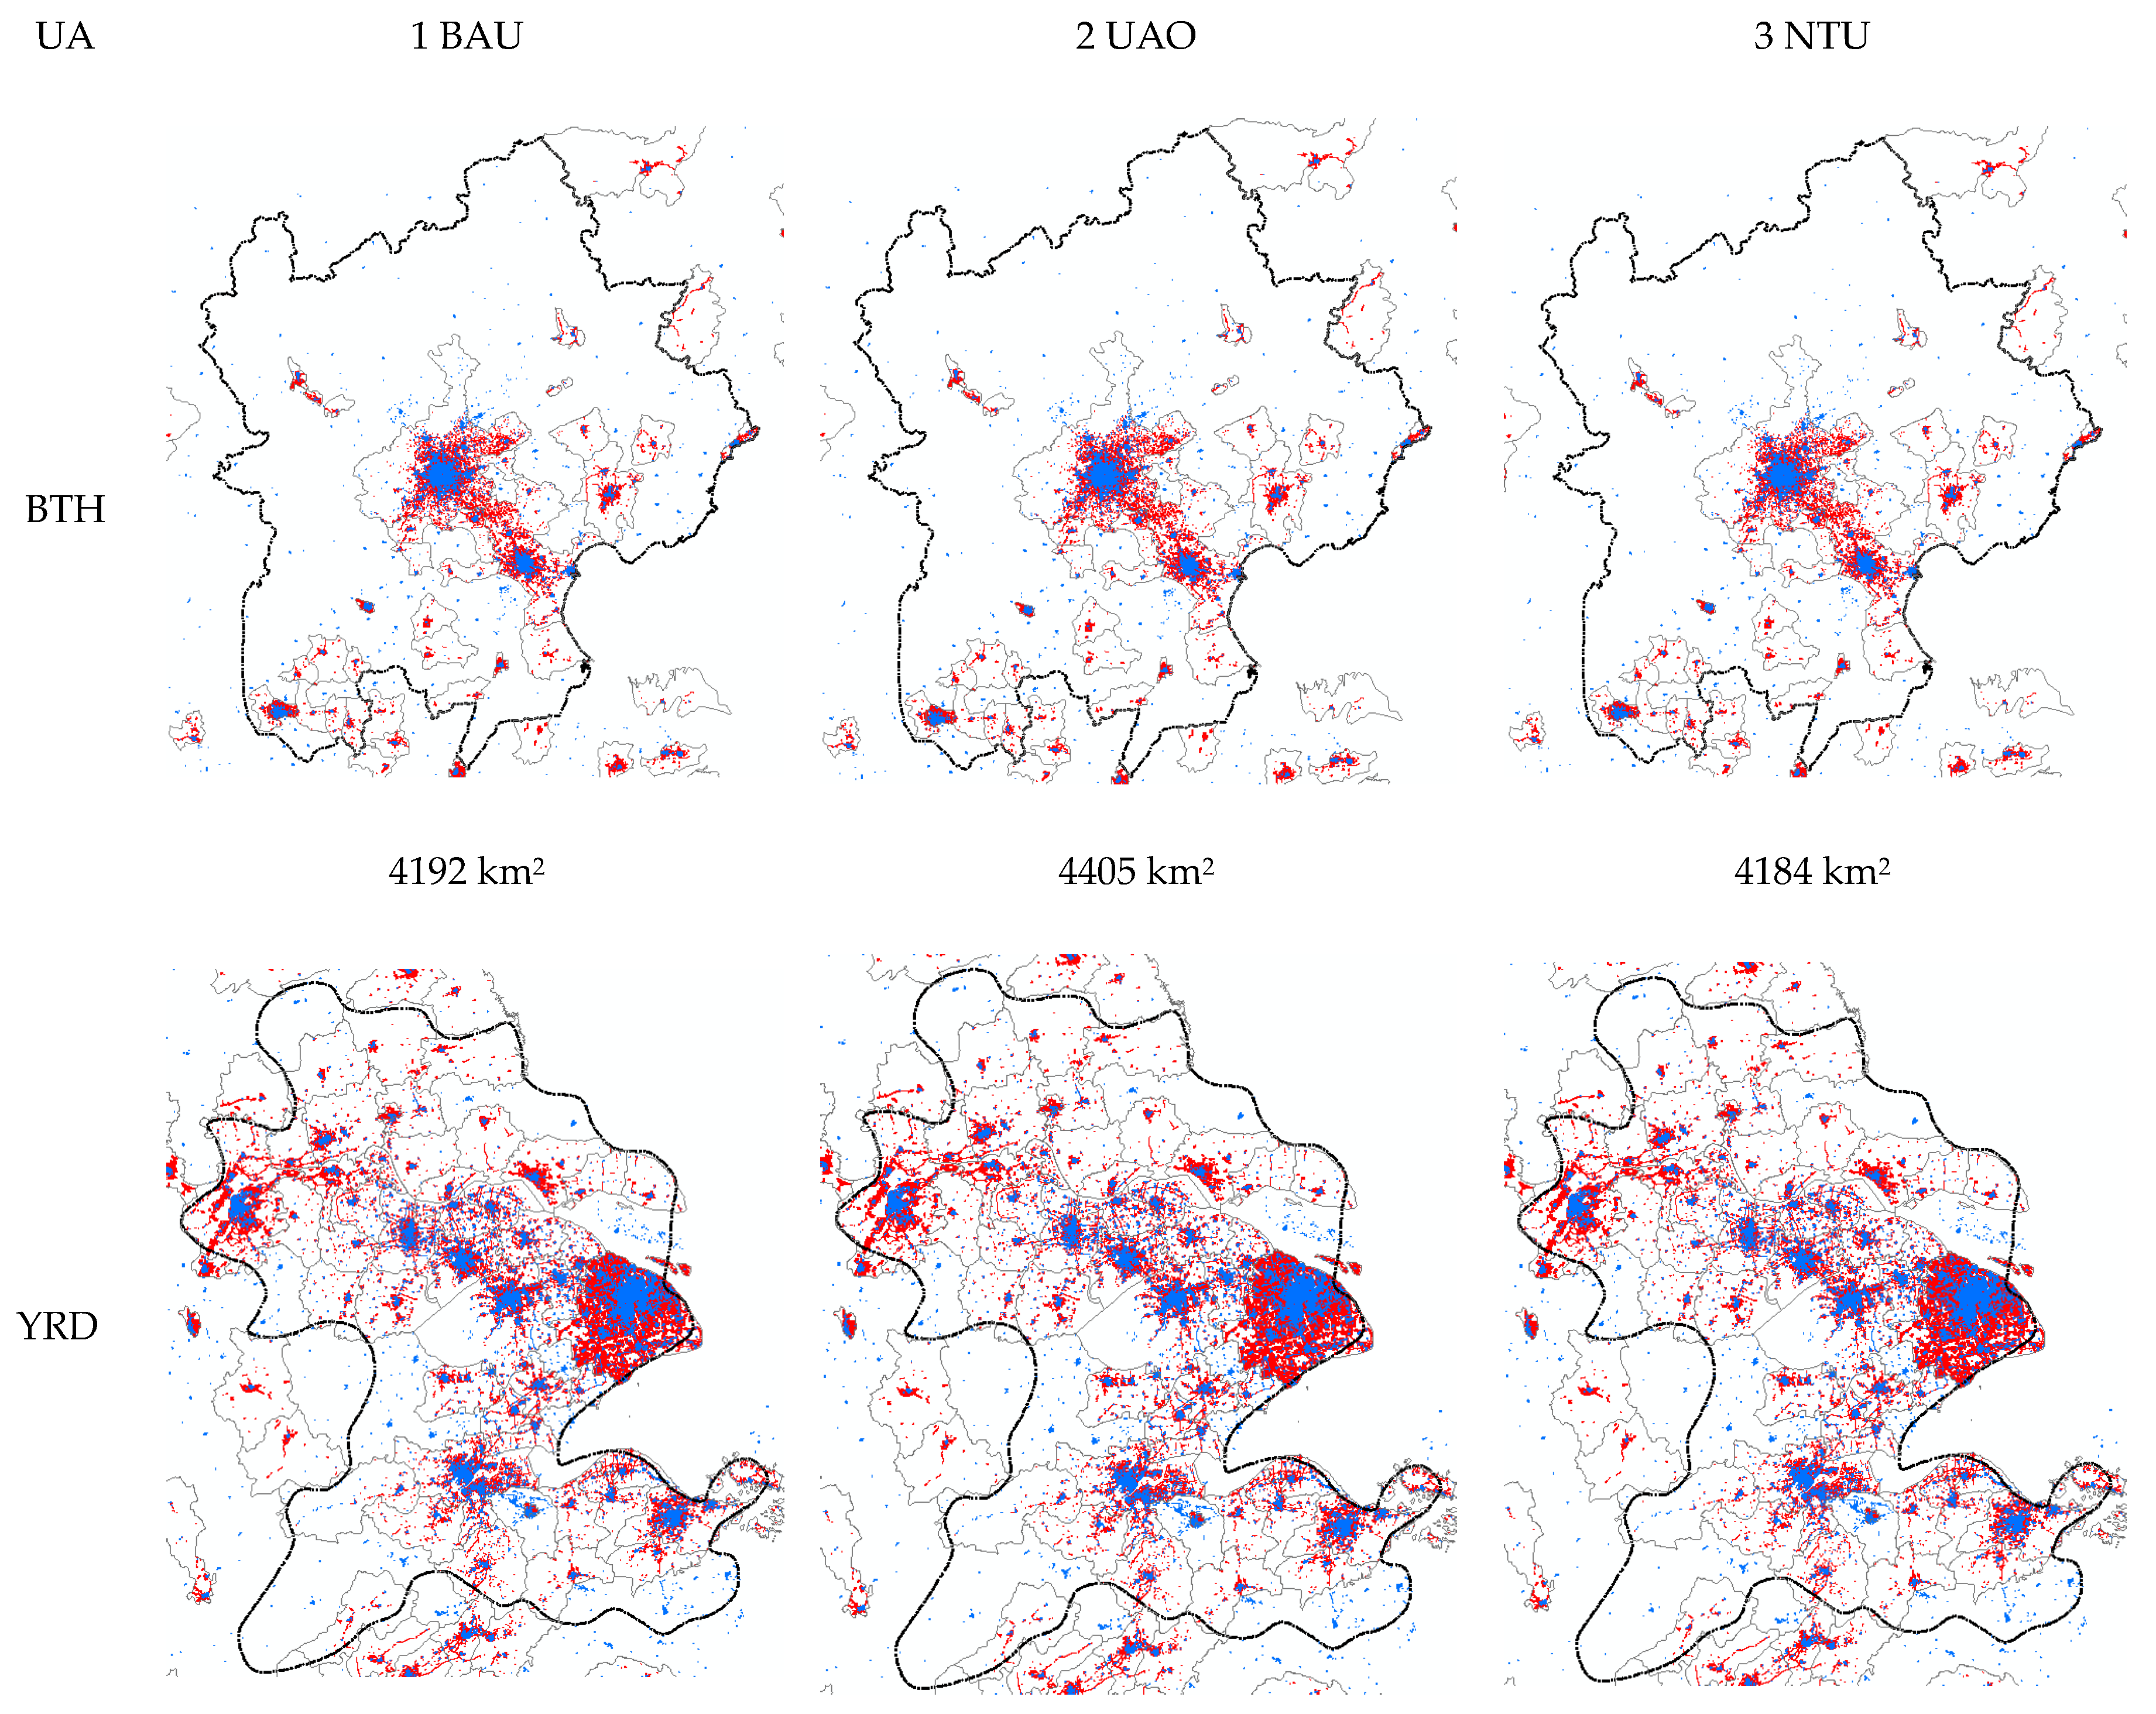
To illustrate more details of simulation results for each scenario, urban land expansion patterns and total urban land areas of the three most important urban agglomerations: Beijing-Tianjin-Hebei (BTH), the Yangtze River Delta (YRD), and the Pearl River Delta (PRD) are listed in Figure 7. Without being exhaustive, several key features can be explored. First, the total quantity of urban land in the UAO scenario is the largest. By 2017, the three urban agglomerations of BTH, YRD, and PRD are projected to reach, respectively, 4405 km2, 9144 km2, and 4834 km2 of urban land area. Second, the three urban agglomerations in the BAU scenario do not have the largest total quantity of urban lands among the three scenarios, mainly because the urban expansion ratio is relatively lower in urban agglomerations before 2012, especially compared with the less developed regions that are experiencing a tremendous urbanization process. Third, the simulation results of NTU in the three urban agglomerations indicate a more sustainable pattern have the least total quantity of urban lands.
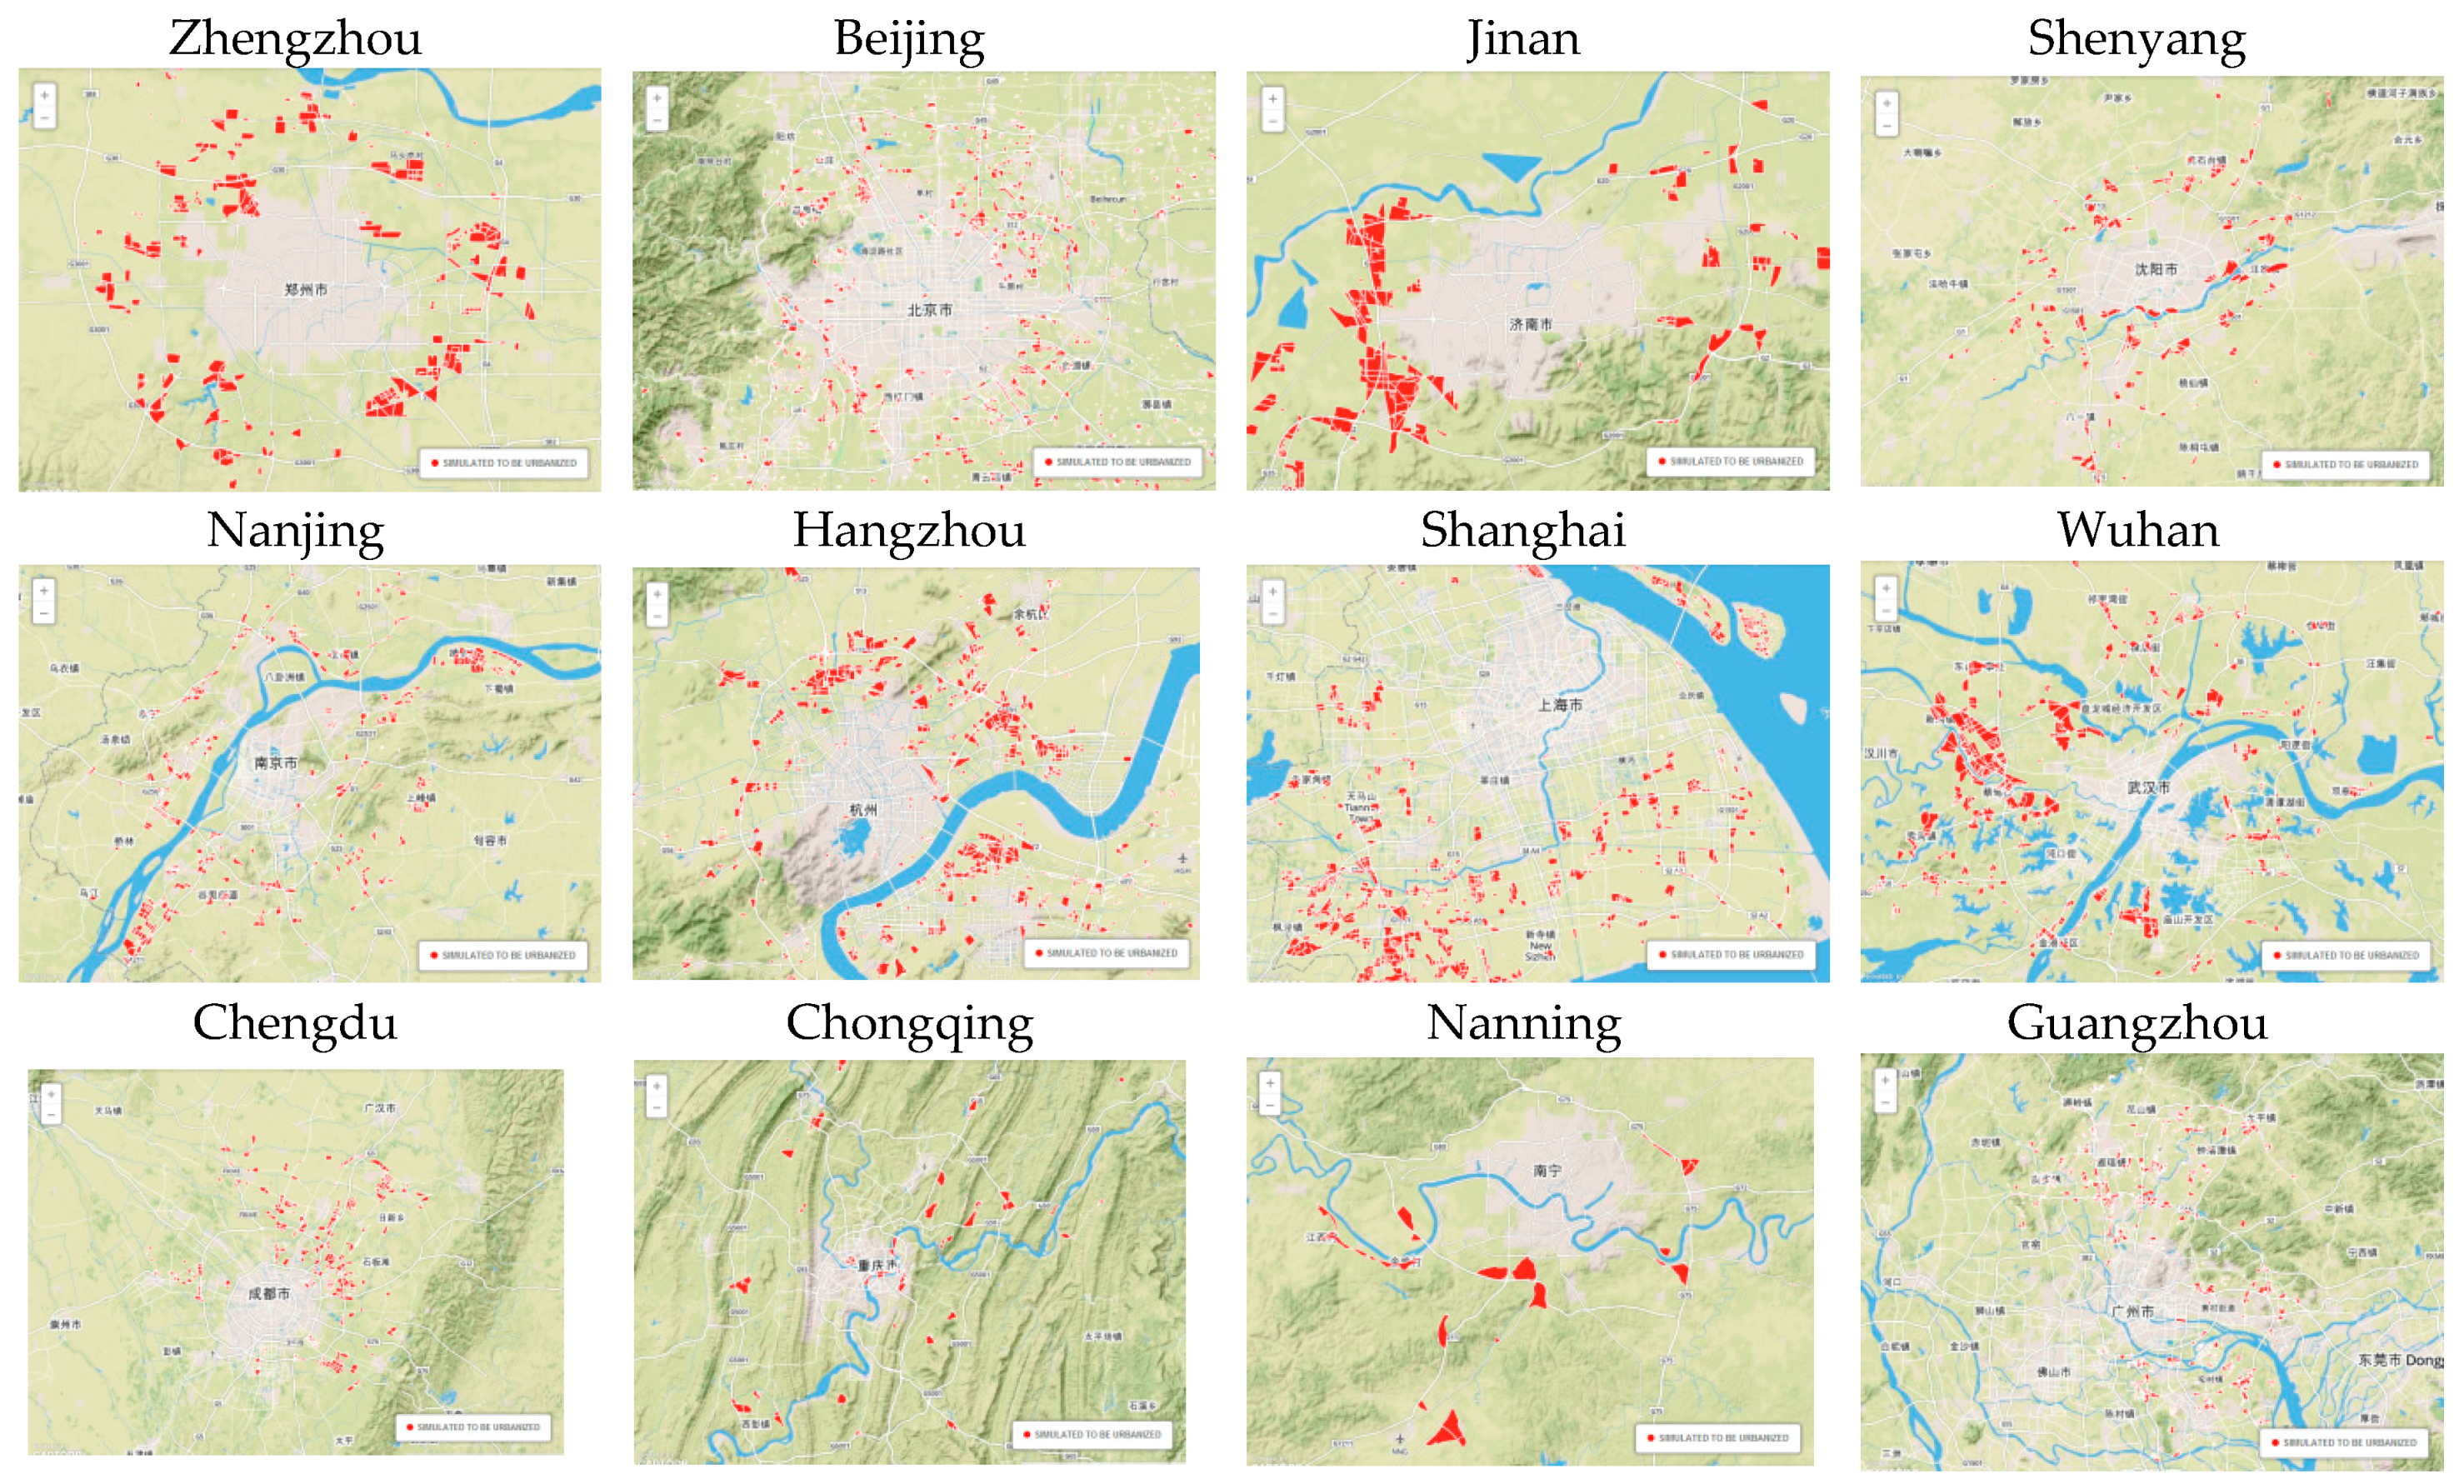
We have released the simulation results of the three scenarios online (www.beijingcitylab.com). Figure 8 shows urban expansion maps in the BAU scenario, captured from the future online visualization, for several typical cities.
6. Discussion
6.1. The Model Evaluation from Online Feedback
In the first stage, the BAU scenario (limited to the city of Beijing, 12,183 km2, the same as the model calibration of MVB-CA in Section 4.2) is compared with the results of BUDEM. BUDEM was calibrated using the same urban blocks in 2007 and 2012 (also used in calibrating MVB-CA), in which blocks were converted into the 500 m cells. The seven spatial factors remain the same as those in Long et al. (2012). The overall precision in the logistic regression for parameter calibration of BUDEM is 96.1%, and calibrated parameters are shown in Table 2. The distance to the city centre (Tiananmen Square) is included in both models (CENTER in MVB-CA and l_tam in BUDEM). Clearly, the significance of the distance has illustrated that its influence on historical urban expansion in both models are both positive. That is to say, a place closer to the city centre tends to have a higher probability to be developed. (Note we use the air distance for CENTER in MVB-CA and the influence potential in BUDEM, which means their signs are opposite.)
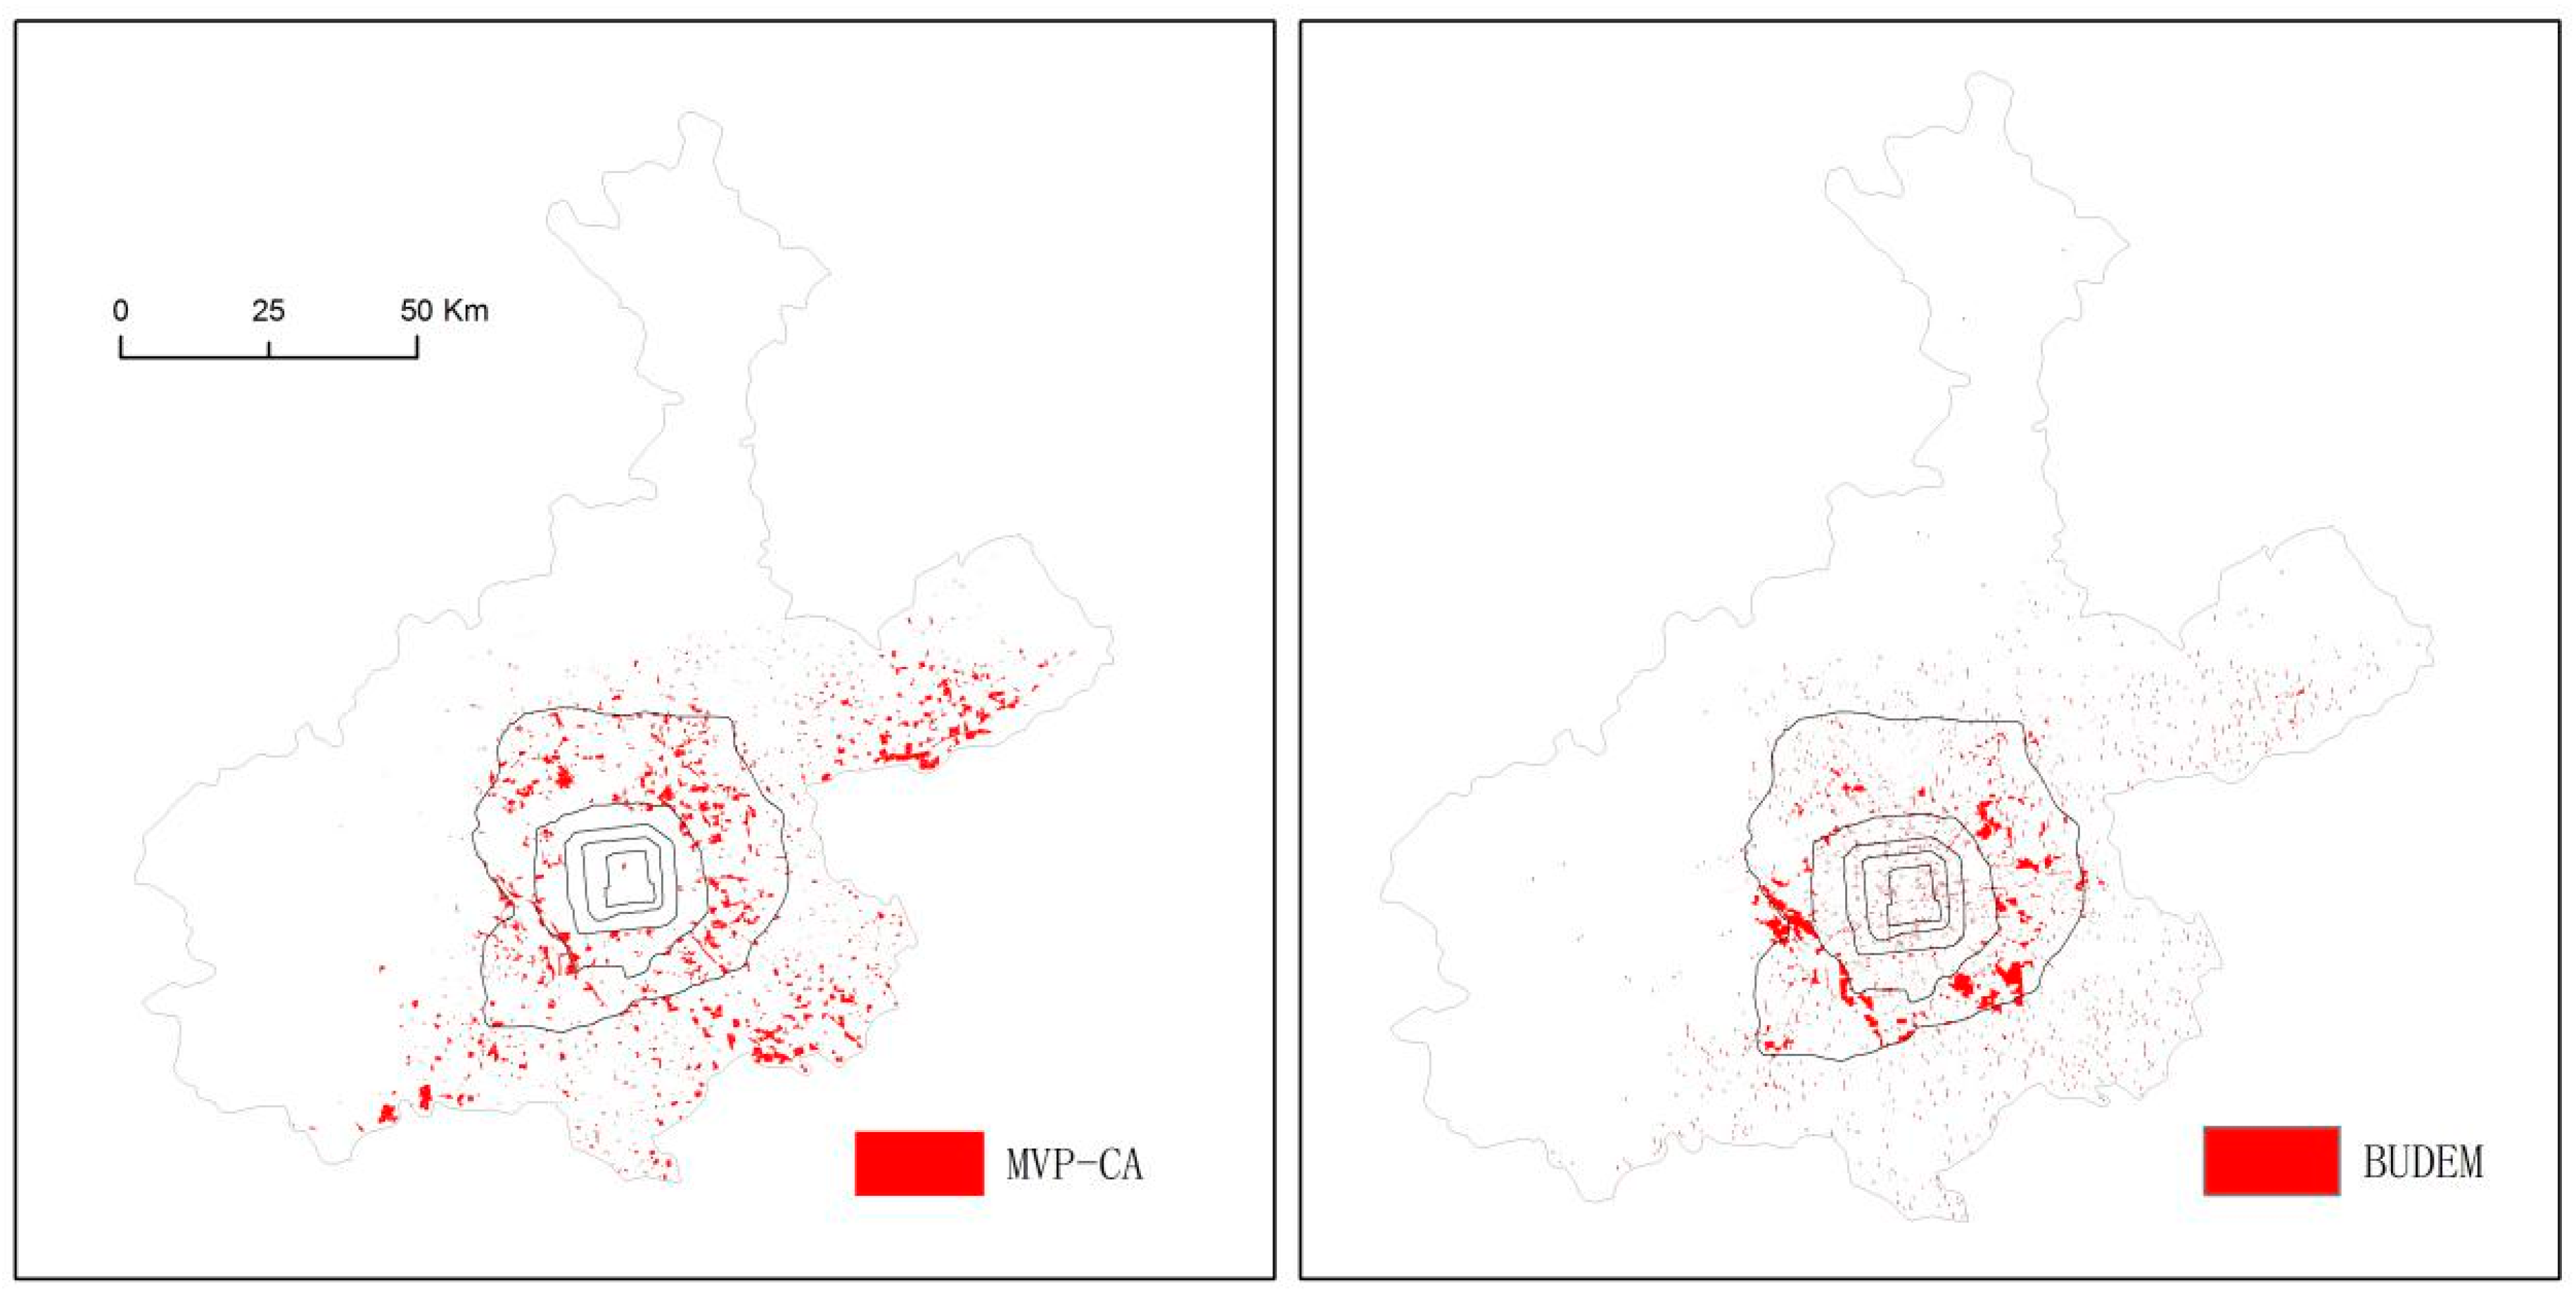
In the following step, calibrated parameters of BUDEM were applied together with total urban area in 2017 and urban pattern in 2012 (converted into 500 m cells) for simulating urban expansion in Beijing. According to the settings in the BAU scenario of MVB-CA, the total urban expansion area of Beijing was 174 km2, from 1445 to 1619, and the annual expansion rate from 2007 to 2012 for Beijing was 2.3%. Figure 9 shows the comparison results of the BAU scenario (expanded blocks) between MVB-CA and BUDEM (expanded cells) in the city of Beijing. Expanded areas in both models exhibited similar patterns according to our visual judgment. After a detailed examination of the two expanded patterns, we determined that the overlaid area shared by both patterns was 119 km2 (68.4% of the total expansion) as shown in Figure 9. The overall precision in terms of the intersected results is acceptable considering the differences between the two models. In addition to the overall precision estimation, we further compared two patterns from the view of spatial distribution. We divided the whole city of Beijing into six zones according to five ring roads shown in Figure 9, and the expansion areas in each zone were calculated. The correlation coefficient for expansion areas simulated by MVB-CA and those by BUDEM in six zones was 0.74. We also observed the average patch size simulated by BUDEM was 23% larger than that by MVB-CA. We also found that the simulated pattern was not realistic when MVB-CA is adopted to predict for a longer time. A big picture can be gained from the various dimensions of comparison between the vector CA based MVB-CA and raster CA based BUDEM.
For the online examination, our simulated-to-be-expanded blocks in the BAU scenario were released online for user’s comments via posting a message on Sina Weibo, which is known as “the Chinese Twitter”. The unique-ID was associated with each visualized block, thus enabling a browser to identify a comment associated with the block. Generally, the simulated urban expansion by the block-based MVB-CA was attractive to the browsers since its geometry corresponded to readers’ knowledge and local sense about the built environment as compared with a cell in square with no geographic meaning (e.g., as revealed by Figure 7 and Figure 8). In a period of three weeks after the results were released, over 83 reposts and 76 comments were received. Most of the comments were positive remarks on our study and pointed out such efforts are needed by developers, planners, and decision makers. Two comments mentioned several simulated-to-expanded blocks were not plausible to develop due to the strict local policies on development. Four people commented that the regions highlighted by local governments by means of spatial plans or development policies should be taken into account in the model. The simulated urban expansion would be further enhanced with more comments received from participators with local experience and knowledge of the physical environments.
6.2. Potential Biases and Next Steps
Besides the merits of this study, there are several limitations to be improved. First, the block generation process would be enhanced via incorporation with other existing land cover datasets. We are planning to include the global land cover data FROM-GLC-agg by Yu et al. [44] as well as the urban land area inferred from DMSP/OLS by Yang et al. [45] for assisting in urban block generation. Second, there are some large blocks developed in the simulation results, especially in small cities, which are not very realistic. Techniques for block subdivision would be an alternative solution for generating practical urban blocks in China [46,47,48,49]. Third, the model should be calibrated using national datasets, rather than being limited to Beijing to improve the precision of simulation. We admit that it is not ideal to use the rules extracted from the historical urban expansion of Beijing to simulate urban expansion for all other Chinese cities. We are proposing a new simulation schema aimed at stimulating urban expansion at the block/block level for a large number of cities, and it would be extremely difficult to gather historical datasets for all Chinese cities at the block level. We hope this will be alleviated with increases in the accumulated spatial datasets for China resulting from the big/open data era. In addition, this study explores a novel framework for simulating block-level urban expansion for a large geographical area, and we hope this framework will attract interest from other scholars. The simulation results rely on both the calibrated rules and the tuned parameters in the various proposed urban expansion scenarios, thus the model can be regarded as a policy-testing lab.
With the aforementioned potential biases in mind, future studies will focus on the following two aspects. First, a spatial equilibrium module considering the provincial level input-output analysis would replace the current “macro module” in the near future. The integration of an equilibrium mechanism with the dynamic CA model enables linking the inter-provincial and even inter-city simulation at the macro level and urban expansion simulation at the local block level. Second, as suggested by the online comments, local development policies and spatial plans of various cities could be added as a factor in the vector CA module.
6.3. Potential Applications
Applications of the established national-scale urban expansion simulation model for the whole of China, together with three simulated scenarios, include but are not limited to the following aspects. First, national spatial development strategies, reflected in the form of variation in each city’s urban expansion rate, could be visualized at the block level using the MVB-CA. This would enable linking macro-scale policies to local developments. Although we only simulate three scenarios reflecting macro-scale strategies in this paper, other spatial policies in local cities could be evaluated via adjusting the parameters of spatial factors in the MVB-CA. Second, block-level simulation results can directly evoke places of interest for local stakeholders in future developments. This is not easily achieved by the simulation results from other spatial expansion models with large simulation units. We have shared the results online to help promote this application, while the feedback can be absorbed in model adjustments. Third, the simulation results make it possible to conduct urban expansion impact analysis, e.g., ecological and social impacts. With the release of the simulated urban expansion scenarios, we expect that it will attract researchers to apply the simulated patterns to addressing impacts in various avenues.
7. Concluding Remarks
In this paper, a mega-vector-blocks cellular automata (MVB-CA) was developed and used to simulate the urban expansion of 654 Chinese cities. Three modules, the macro module, the block generation module, and the vector CA module, were included in the MVB-CA. The macro module was responsible for setting the urban expansion rate for the next five years in each city, taking into account both historical urban expansion rates and national spatial development strategies. The block generation module was used for identifying existing urban blocks in 2012 using the framework of AICP [33]. The vector CA module was applied to simulating urban expansion from 2012 to 2017, and it was calibrated using the urban expansion data in Beijing. Three urban expansion scenarios, baseline (BAU), urban agglomeration (UAO), and new urbanization development (NTO), were simulated for 2012–2017 via the MVB-CA. We examined the simulation results in two ways, comparing the baseline scenario of Beijing with a raster CA model (BUDEM) we had previously developed and validating the results in a wiki-like manner.
As the first large-scale urban expansion model with block-level resolution for the whole area of China, our contributions mainly lie in two folds. First, we develop a vector cellular automata model for the whole country using open data and existing CA model strategies while enabling future upgrading to address inter-city connection and interaction. The model enables linking national spatial development strategies with urban expansion via simulating macro-scale policies at a block-level. The other contribution is the model’s empirical application in the Chinese city system, while other studies in China only focus on one city or one region. The block-based nature of the MVB-CA enables its potential application in urban planning practice, which regards a block as the planning/design unit. It is more necessary in the background that most Chinese cities (especially middle or small sized cities) do not have their urban expansion models. The simulation results have been shared online (www.beijingcitylab.com) as an important data infrastructure for both practitioners and researchers.
Acknowledgments
The authors would like to acknowledge the funding of the National Natural Science Foundation of China (41671161, 51408039, and 41401178); the Chinese Ministry of Education Project of Humanities and Social Sciences (No. 14YJC790132), and Key Research Project of Beijing Municipal Commission of Education (No. SZ201510038021).
Author Contributions
Ying Long and Kang Wu had the original idea and designed the research. Kang Wu were responsible for the data collection. Ying Long performed the model calculation and validation. Kang Wu did the analyses. The two authors drafted the manuscript and approved the final version.
Conflicts of Interest
The authors declare no conflict of interest.
References
- Stevens, D.; Dragićević, S. A GIS-based irregular cellular automata model of land-use change. Environ. Plan. B 2007, 34, 708–724. [Google Scholar] [CrossRef]
- Porta, J.; Parapar, J.; Doallo, R.; Rivera, F.F.; Santé, I.; Crecente, R. High performance genetic algorithm for land use planning. Comput. Environ. Urban Syst. 2013, 37, 45–58. [Google Scholar] [CrossRef]
- Montgomery, M.R. The urban transformation of the developing world. Science 2008, 319, 761–764. [Google Scholar] [CrossRef] [PubMed]
- Liu, Z.; He, C.; Zhang, Q.; Huang, Q.; Yang, Y. Extracting the dynamics of urban expansion in China using DMSP-OLS nighttime light data from 1992 to 2008. Landsc. Urban Plan. 2012, 106, 62–72. [Google Scholar] [CrossRef]
- Guan, W.; Wu, K.; Carnes, F. Modelling spatiotemporal pattern of agriculture feasible land in China. T. GIS 2016, 20, 426–447. [Google Scholar] [CrossRef]
- Liu, J.; Diamond, J. China’s environment in a globalizing world. Nature 2005, 435, 1179–1186. [Google Scholar] [CrossRef] [PubMed]
- Wu, K.; Long, Y.; Mao, Q.; Liu, X. Mushrooming Jiedaos, growing cities: An alternative perspective on urbanizing China. Environ. Plan. A 2015, 47, 1–2. [Google Scholar] [CrossRef]
- Long, Y.; Shen, Z.; Mao, Q. Retrieving spatial policy parameters from an alternative plan using constrained cellular automata and regionalized sensitivity analysis. Environ. Plan. B 2012, 39, 586–604. [Google Scholar] [CrossRef]
- Seto, K.C.; Woodcock, C.E.; Song, X.; Huang, X.; Lu, J.; Kaufmann, R.K. Monitoring land-use change in the Pearl River Delta using Landsat TM. Int. J. Remote Sens. 2002, 23, 1985–2004. [Google Scholar] [CrossRef]
- Tian, G.J.; Liu, J.Y.; Xie, Y.C.; Yang, Z.F.; Zhuang, D.F.; Niu, Z. Analysis of spatio-temporal dynamic pattern and driving forces of urban land in China in 1990s using TM images and GIS. Cities 2005, 22, 400–410. [Google Scholar] [CrossRef]
- Liu, J.Y.; Zhang, Z.X.; Xu, X.; Kuang, W.; Zhou, W.C.; Zhang, S.W.; Li, R.D.; Yan, C.Z.; Yu, D.S.; Wu, S.X.; et al. Spatial patterns and driving forces of land use change in China during the early 21st century. J. Geogr. Sci. 2010, 20, 483–494. [Google Scholar] [CrossRef]
- Kuang, W.H. Spatio-temporal Patterns of Intra-urban Land Use Change in Beijing, China Between 1984 and 2008. Chin. Geogr. Sci. 2012, 22, 210–220. [Google Scholar] [CrossRef]
- Seto, K.C.; Kaufmann, R.K. Modeling the driver of urban land use change in the Pearl River Delta, China: Integrating remote sensing with socioeconomic data. Land Econ. 2003, 79, 106–121. [Google Scholar] [CrossRef]
- Deng, X.Z.; Huang, J.K.; Rozelle, S.; Uchida, E. Economic growth and the expansion of urban land in China. Urban Stud. 2010, 47, 813–843. [Google Scholar] [CrossRef]
- Kuang, W.H. Simulating dynamic urban expansion at regional scale in Beijing-Tianjin-Tangshan Metropolitan Area. J. Geogr. Sci. 2011, 21, 317–330. [Google Scholar] [CrossRef]
- Gong, J.Z.; Liu, Y.S.; Xia, B.; Zhao, G. Urban ecological security assessment and forecasting based on a cellular automata model: A case study of Guangzhou, China. Ecol. Model. 2009, 220, 3612–3620. [Google Scholar] [CrossRef]
- Santé, I.; García, A.M.; Miranda, D.; Crecente, R. Cellular automata models for the simulation of real-world urban processes: A review and analysis. Landsc. Urban Plan. 2010, 96, 108–122. [Google Scholar] [CrossRef]
- Long, Y.; Mao, Q.; Dang, A. Beijing urban development model: Urban growth analysis and simulation. Tsinghua Sci. Technol. 2009, 14, 782–794. [Google Scholar] [CrossRef]
- He, C.Y.; Shi, P.J.; Li, J.G.; Chen, J.; Pan, Y.Z.; Li, J.; Zhuo, L.; Toshiaki, I. Restoring urbanization process in China in the 1990s by using non-radiance calibrated DMSP/OLS nighttime light imagery and statistical data. Chin. Sci. Bull. 2006, 51, 1614–1620. [Google Scholar] [CrossRef]
- Li, X.; Liu, X.P. Embedding sustainable development strategies in agent-based models for use as a planning tool. Int. J. Geogr. Inf. Sci. 2008, 22, 21–45. [Google Scholar] [CrossRef]
- Liu, X.; Li, X.; Liu, L.; He, J.; Ai, B. A bottom-up approach to discover transition rules of cellular automata using ant intelligence. Int. J. Geogr. Inf. Sci. 2008, 22, 1247–1269. [Google Scholar] [CrossRef]
- Chen, Q.; Mynett, A.E. Effects of cell size and configuration in cellular automata based prey—Predator modeling. Simul. Model. Pract. Theory 2003, 11, 609–625. [Google Scholar] [CrossRef]
- Jantz, C.A.; Goetz, S.J. Analysis of scale dependencies in an urban land-use-change model. Int. J. Geogr. Inf. Sci. 2005, 19, 217–241. [Google Scholar] [CrossRef]
- O’Sullivan, D. Graph-cellular automata: A generalised discrete urban and regional model. Environ. Plan. B Plan. Des. 2001, 28, 687–705. [Google Scholar] [CrossRef]
- Torrens, P.M.; Benenson, I. Geographic automata systems. Environ. Plan. B Plan. Des. 2005, 19, 385–412. [Google Scholar] [CrossRef]
- Jjumba, A.; Dragićević, S. High resolution urban land-use change modeling: Agent iCity approach. Appl. Spat. Anal. Policy 2012, 5, 291–315. [Google Scholar] [CrossRef]
- Shen, Z.J.; Kawakami, M. Geo-simulation model using geographic automata for simulating land use patterns in urban partitions. Environ. Plan. B Plan. Des. 2009, 36, 802–823. [Google Scholar] [CrossRef]
- Pinto, N.N.; Antunes, A.P. A cellular automata model based on irregular cells: Application to small urban areas. Environ. Plan. B Plan. Des. 2010, 37, 1095–1114. [Google Scholar] [CrossRef]
- Menard, A. VecGCA: A vector-based geographic cellular automata model allowing geometric transformations of objects. Environ. Plan. B Plan. Des. 2008, 35, 647–665. [Google Scholar]
- Moreno, N.; Wang, F.; Marceau, D.J. Implementation of a dynamic neighborhood in a land-use vector based geographic cellular automata model. Comput. Environ. Urban Syst. 2009, 33, 44–54. [Google Scholar] [CrossRef]
- Beijing Institute of City Planning. 2010 Existing Land use Map of Beijing; Internal Working Report; Beijing Institute of City Planning: Beijing, China, 2010. [Google Scholar]
- Ministry of Housing and Urban-rural Development of the People’s Republic of China (MOHURD). 2013 Chinese City Construction Statistics Yearbook 2012; China Planning Press: Beijing, China, 2012. [Google Scholar]
- Liu, X.; Long, Y. Automated identification and characterization of parcels with OpenStreetMap and points of interest. Environ. Plan. B 2016, 43, 341–360. [Google Scholar] [CrossRef]
- Wu, K.; Fang, C.L.; Huang, H.; Wang, J. Comprehensive Delimitation and Ring Identification on Urban Spatial Radiation of Regional Central Cities: Case Study of Zhengzhou. J. Urban Plan. Dev. 2013, 139, 258–273. [Google Scholar] [CrossRef]
- Fang, C.L.; Guan, X.L.; Lu, S.S.; Zhou, M.; Deng, Y. Input-output efficiency of urban agglomerations in China: An application of data envelopment analysis (DEA). Urban Stud. 2013, 50, 2766–2790. [Google Scholar] [CrossRef]
- Wu, F.L. People-Oriented Urbanization. China Daily. 24 January 2017. Available online: http://usa.chinadaily.com.cn/opinion/2013-02/26/content_16255760.htm (accessed on 25 December 2013).
- Zhang, Y.P.; Long, Y. Urban Growth Simulation Using V-BUDEM: A Vector-Based Beijing Urban Development Model. In Proceedings of the Conference of Spatial Planning and Sustainable Development, Beijing, China, 30 August–1 September 2013. [Google Scholar]
- Batty, M.; Xie, Y.; Sun, Z. Modeling urban dynamics through GIS-based cellular automata. Comput. Environ. Urban Syst. 1999, 23, 205–233. [Google Scholar] [CrossRef]
- White, R.; Engelen, G. High resolution integrated modeling of the spatial dynamics of urban and regional systems. Comput. Environ. Urban Syst. 2000, 24, 383–400. [Google Scholar] [CrossRef]
- Feng, Y.; Liu, Y.; Tong, X.; Liu, M.; Deng, S. Modeling dynamic urban growth using cellular automata and particle swarm optimization rules. Landsc. Urban Plan. 2011, 102, 188–196. [Google Scholar] [CrossRef]
- Wu, F. Calibration of stochastic cellular automata: The application to rural-urban land conversions. Int. J. Geogr. Inf. Sci. 2002, 16, 795–818. [Google Scholar] [CrossRef]
- Seto, K.C.; Güneralp, B.; Hutyra, L.R. Global forecasts of urban expansion to 2030 and direct impacts on biodiversity and carbon pools. Proc. Natl. Acad. Sci. USA 2012, 109, 16083–16088. [Google Scholar] [CrossRef] [PubMed]
- Fritz, S.; McCallum, I.; Schill, C.; Perger, C.; See, L.; Schepaschenko, D.; Velde, M.; Kraxner, F.; Obersteiner, M. Geo-Wiki: An online platform for improving global land cover. Environ. Model. Softw. 2012, 31, 110–123. [Google Scholar]
- Yu, L.; Wang, J.; Clinton, N.; Xin, Q.; Zhong, L.; Chen, Y.; Gong, P. FROM-GC: 30 m global cropland extent derived through multisource data integration. Int. J. Digit. Earth 2013, 6, 521–533. [Google Scholar] [CrossRef]
- Yang, Y.; He, C.; Zhang, Q.; Han, L.; Du, S. Timely and accurate national-scale mapping of urban land in China using Defense Meteorological Satellite Program’s Operational Linescan System nighttime stable light data. J. Appl. Remote Sens. 2013, 7, 073535. [Google Scholar] [CrossRef]
- Aliaga, D.G.; Vanegas, C.A.; Beneš, B. Interactive example-based urban layout synthesis. ACM Trans. Gr. (TOG) Proc. ACM 2008, 27, 160. [Google Scholar] [CrossRef]
- Wickramasuriya, R.; Chisholm, L.A.; Puotinen, M.; Klepeis, P. An automated land subdivision tool for urban and regional planning: Concepts, implementation and testing. Environ. Model. Softw. 2011, 26, 1675–1684. [Google Scholar] [CrossRef]
- Wickramasuriya, R.; Chisholm, L.A.; Puotinen, M.; Gill, N.; Klepeis, P. A method to dynamically subdivide parcels in land use change models. Int. J. Geogr. Inf. Sci. 2013, 27, 1–17. [Google Scholar] [CrossRef]
- Dahal, K.R.; Chow, T.E. A GIS toolset for automated partitioning of urban lands. Environ. Model. Softw. 2014, 55, 222–234. [Google Scholar] [CrossRef]
Figure 1.
Administrative boundaries of Chinese cities.
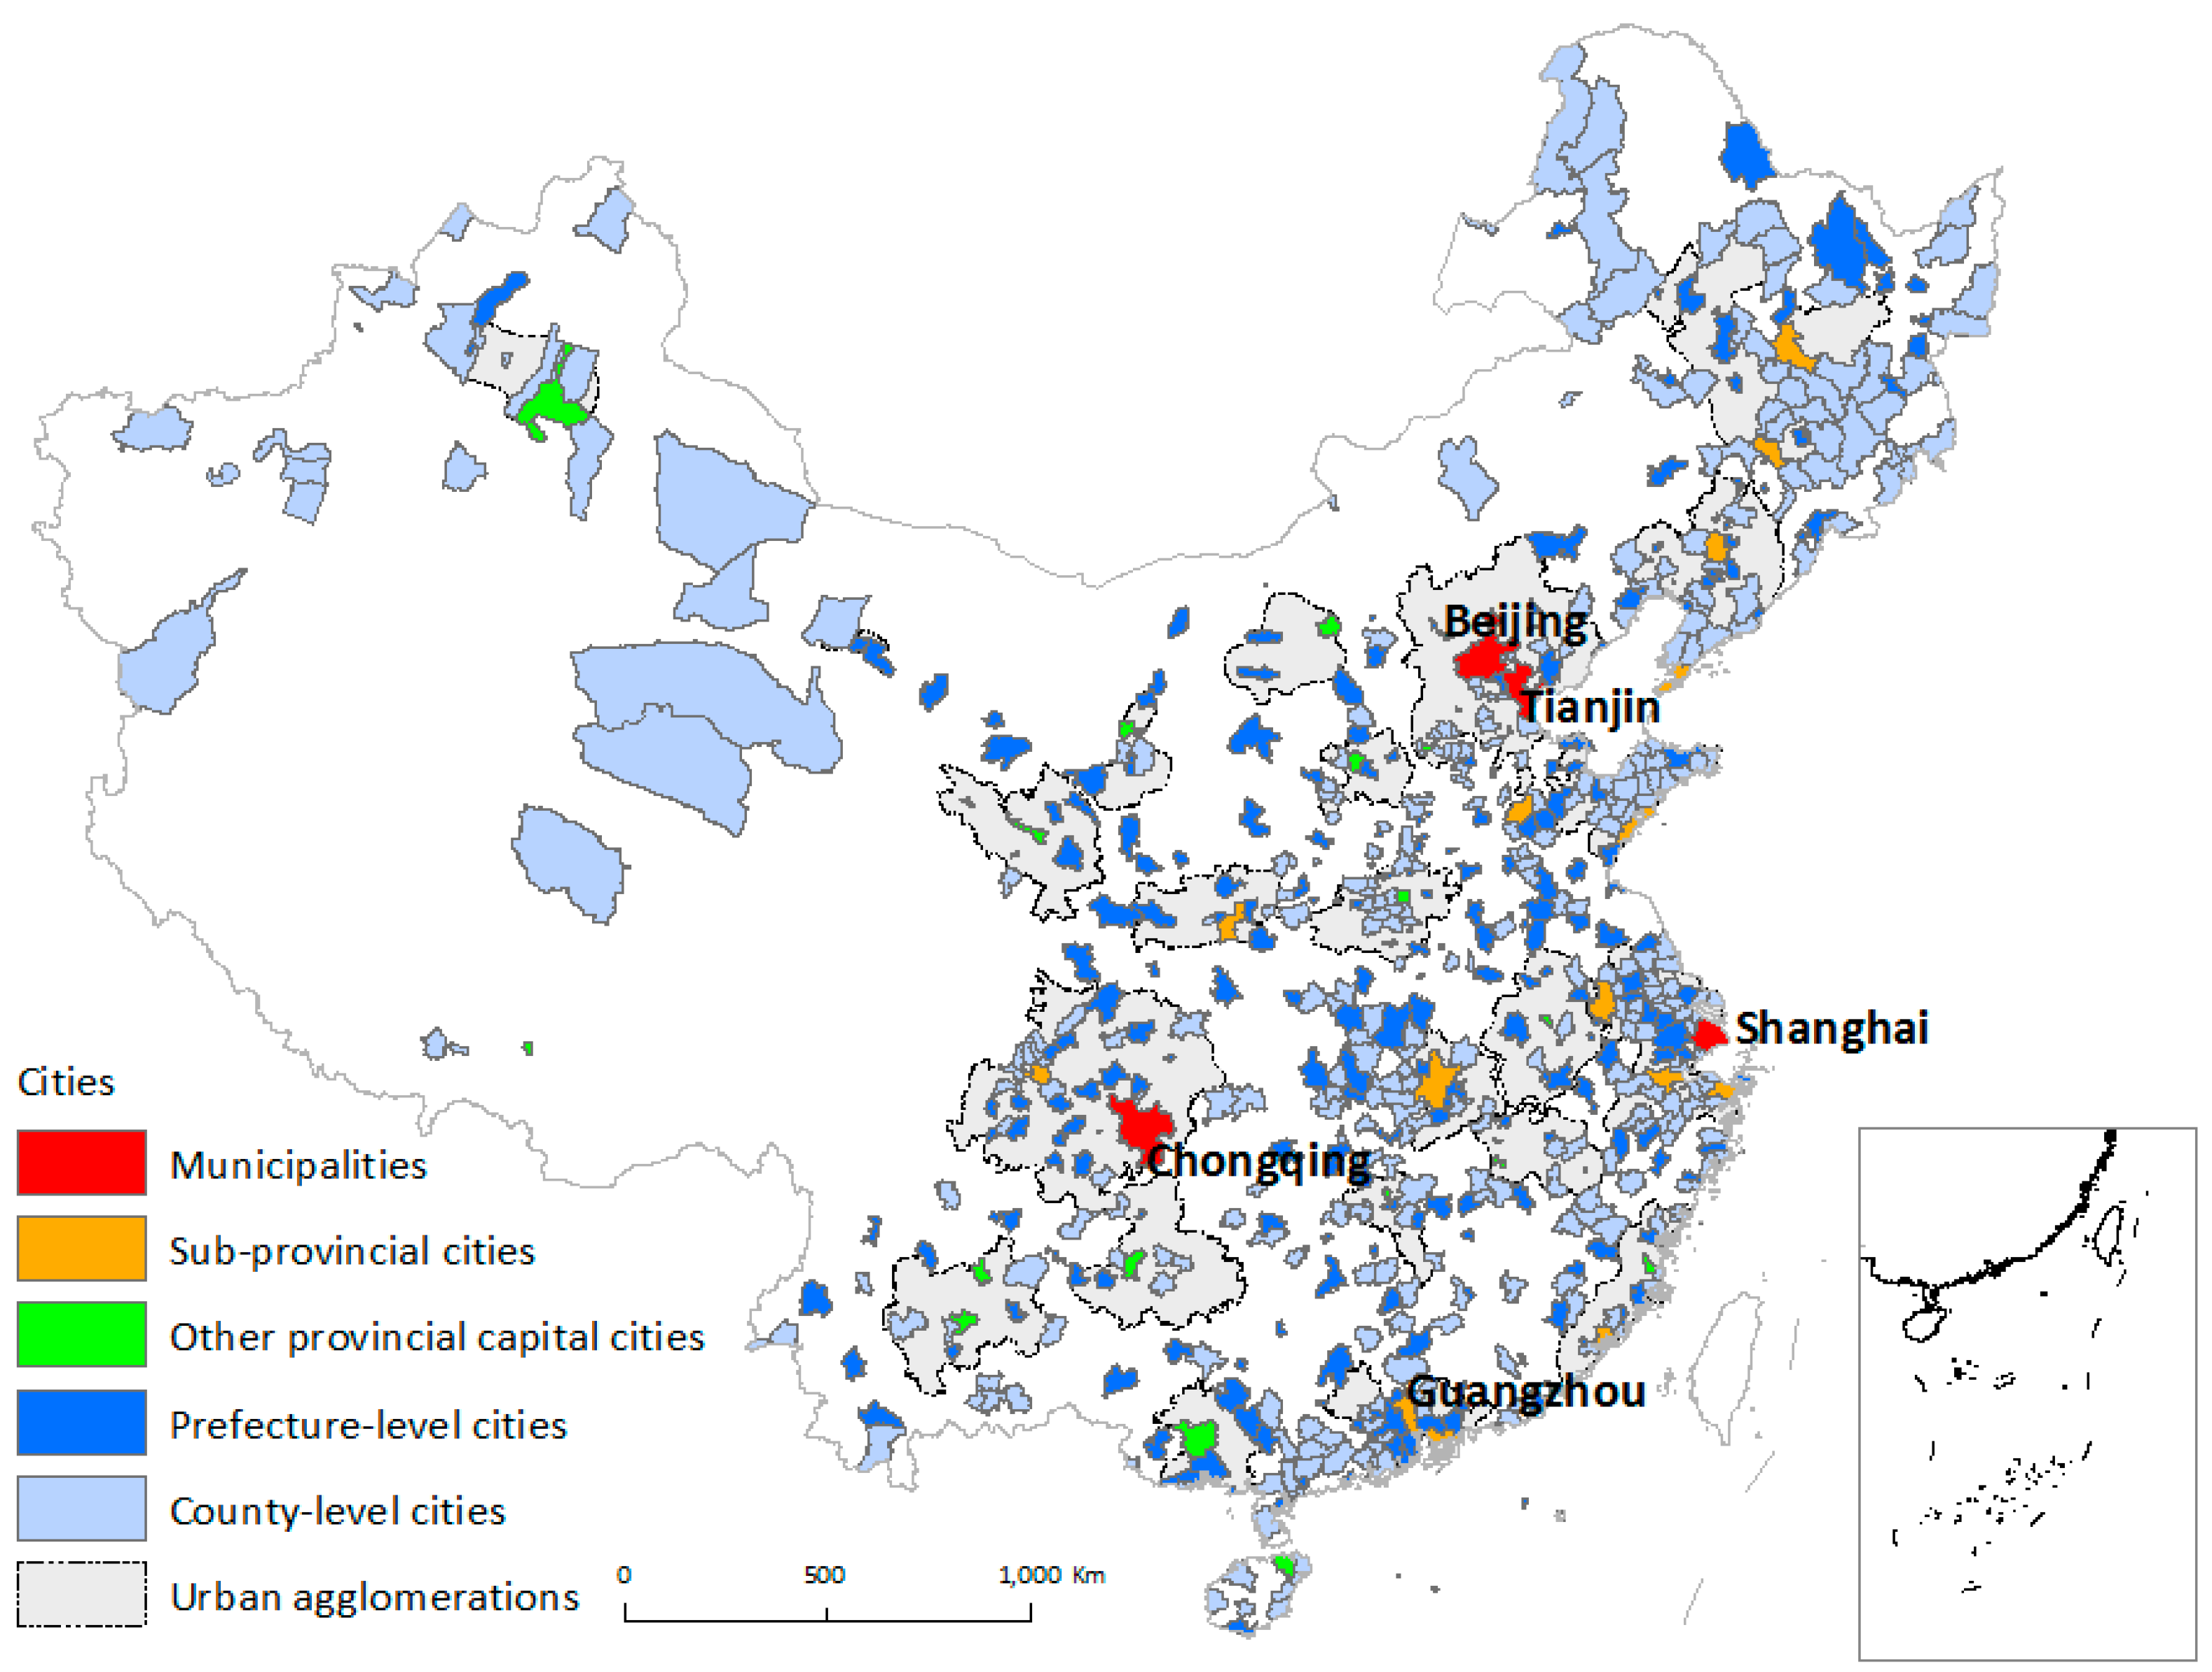
Figure 2.
Urban land area in 2012 and the urban expansion rate during 2007–2012 for all Chinese cities.
Figure 2.
Urban land area in 2012 and the urban expansion rate during 2007–2012 for all Chinese cities.

Figure 3.
The structure and flow diagram of MVB-CA.

Figure 4.
The urban agglomerations in China.
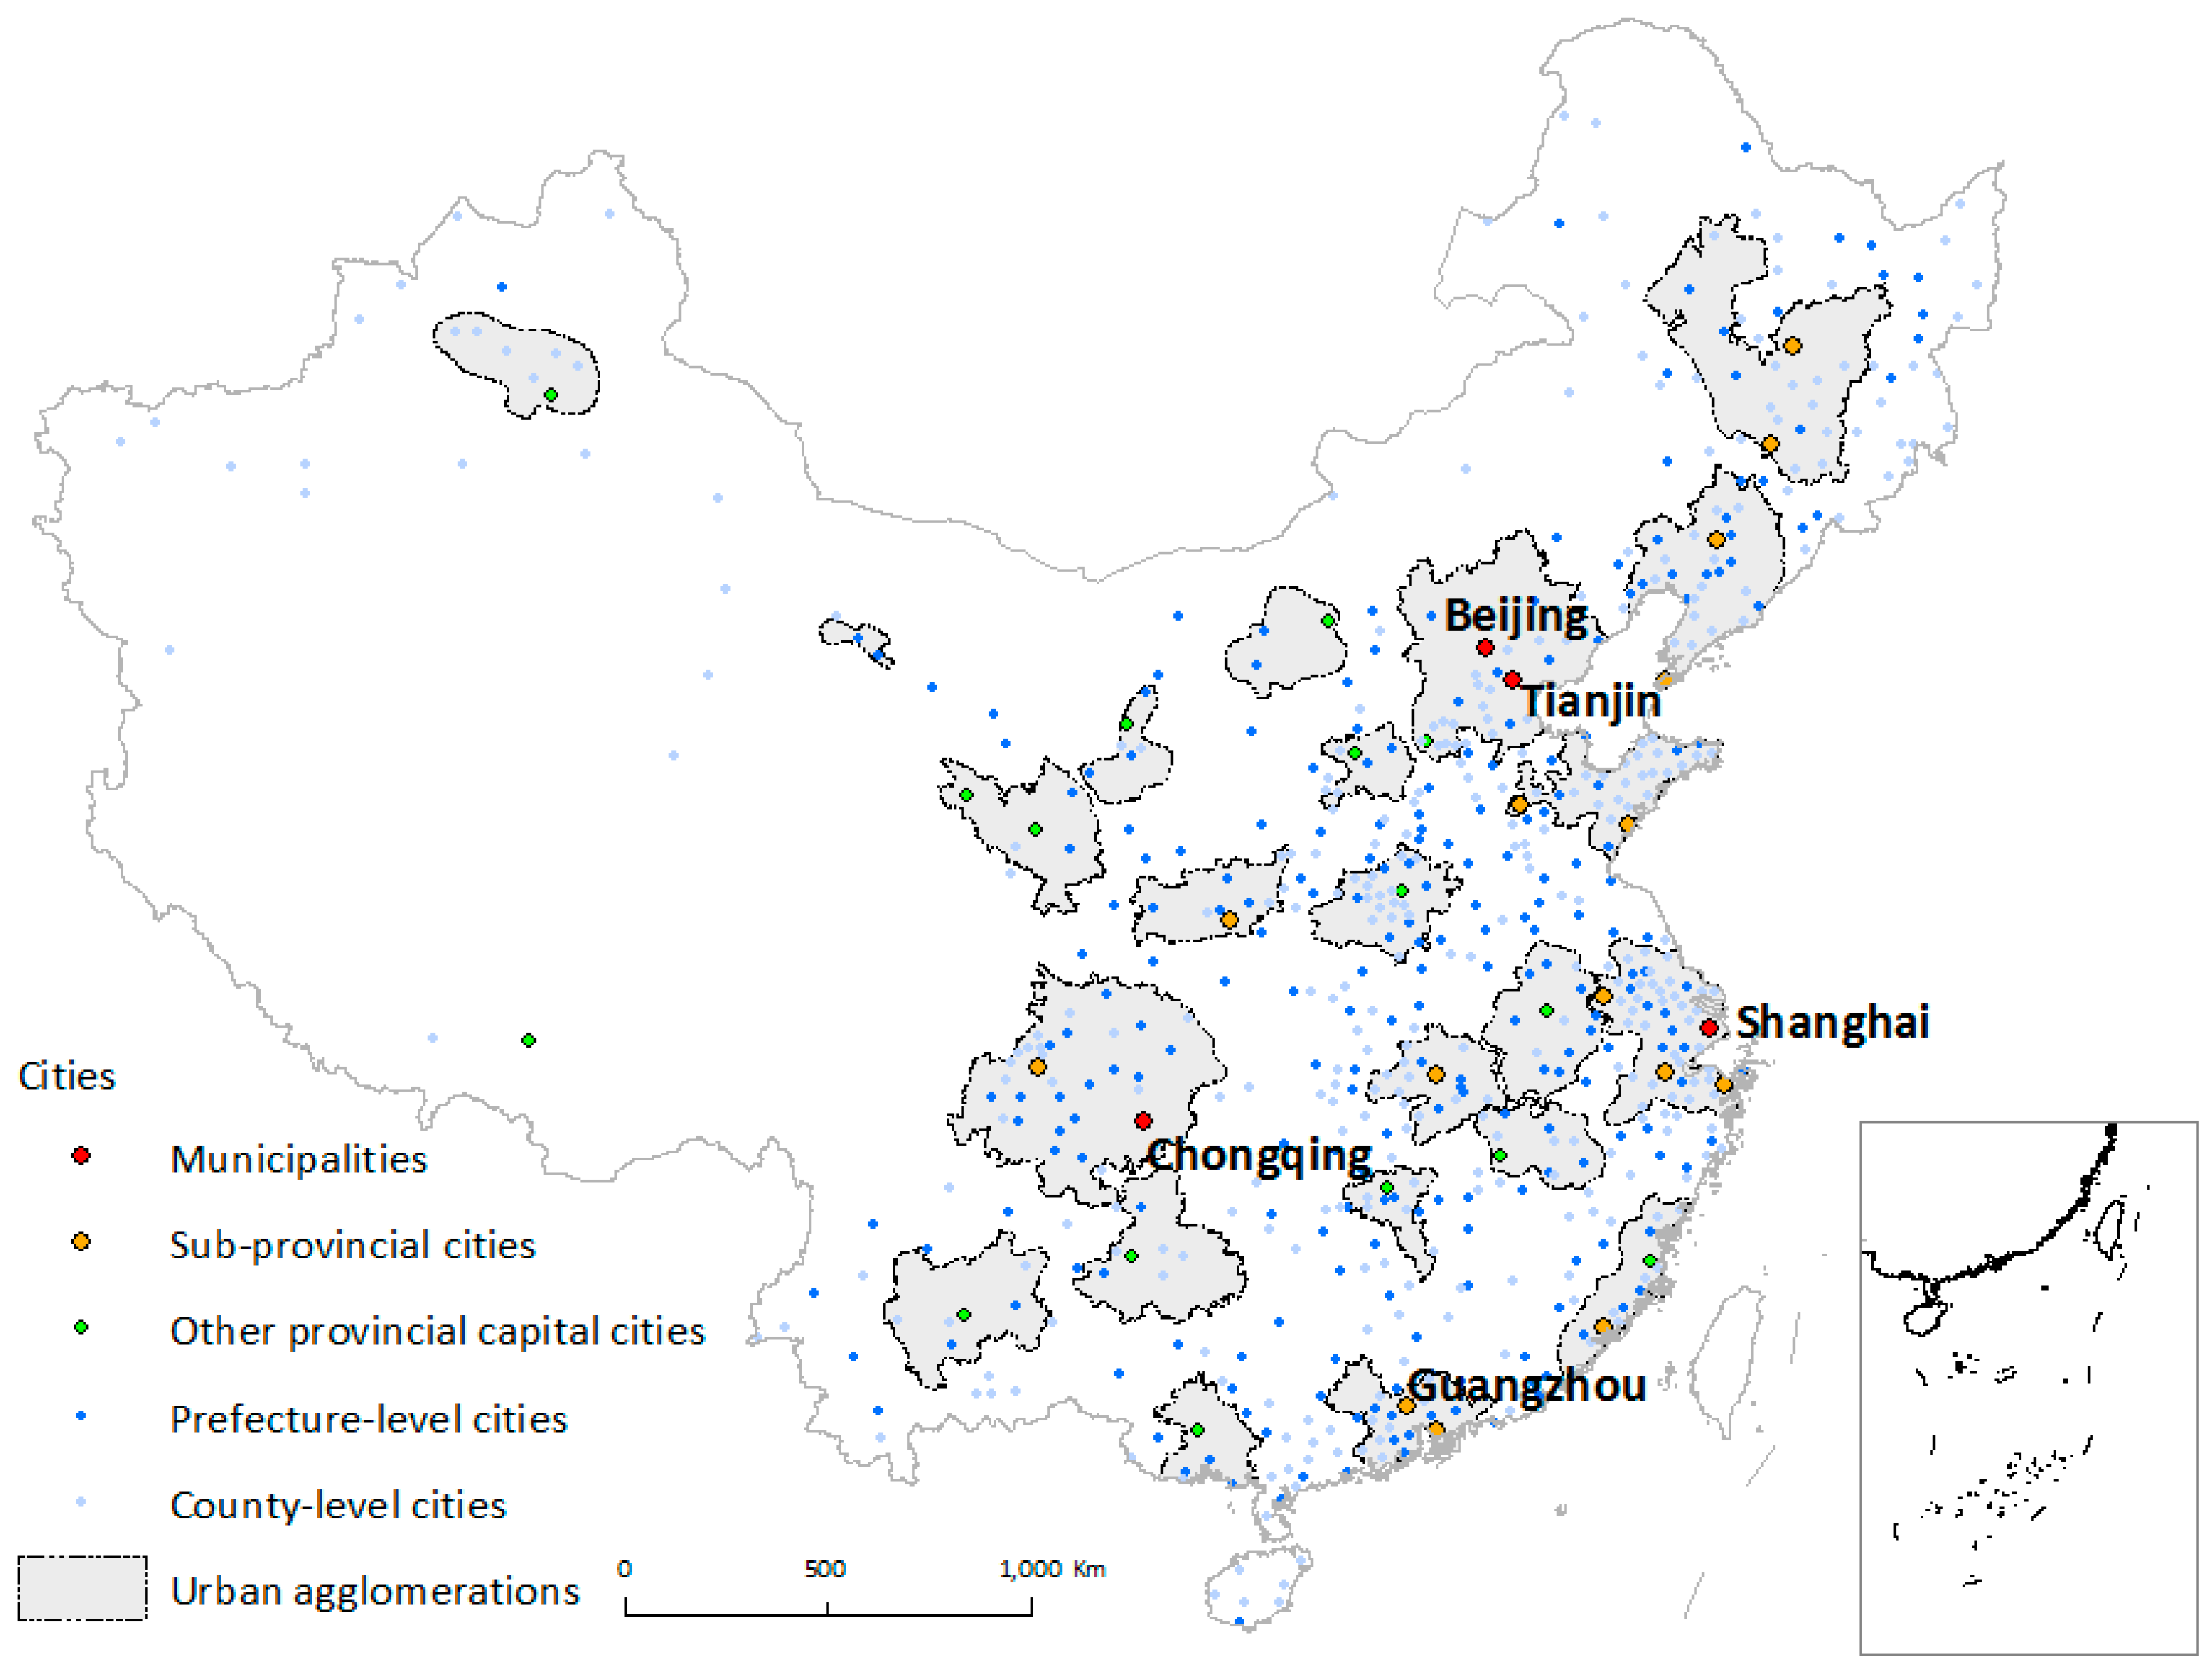
Figure 5.
Urban land areas of all Chinese cities.
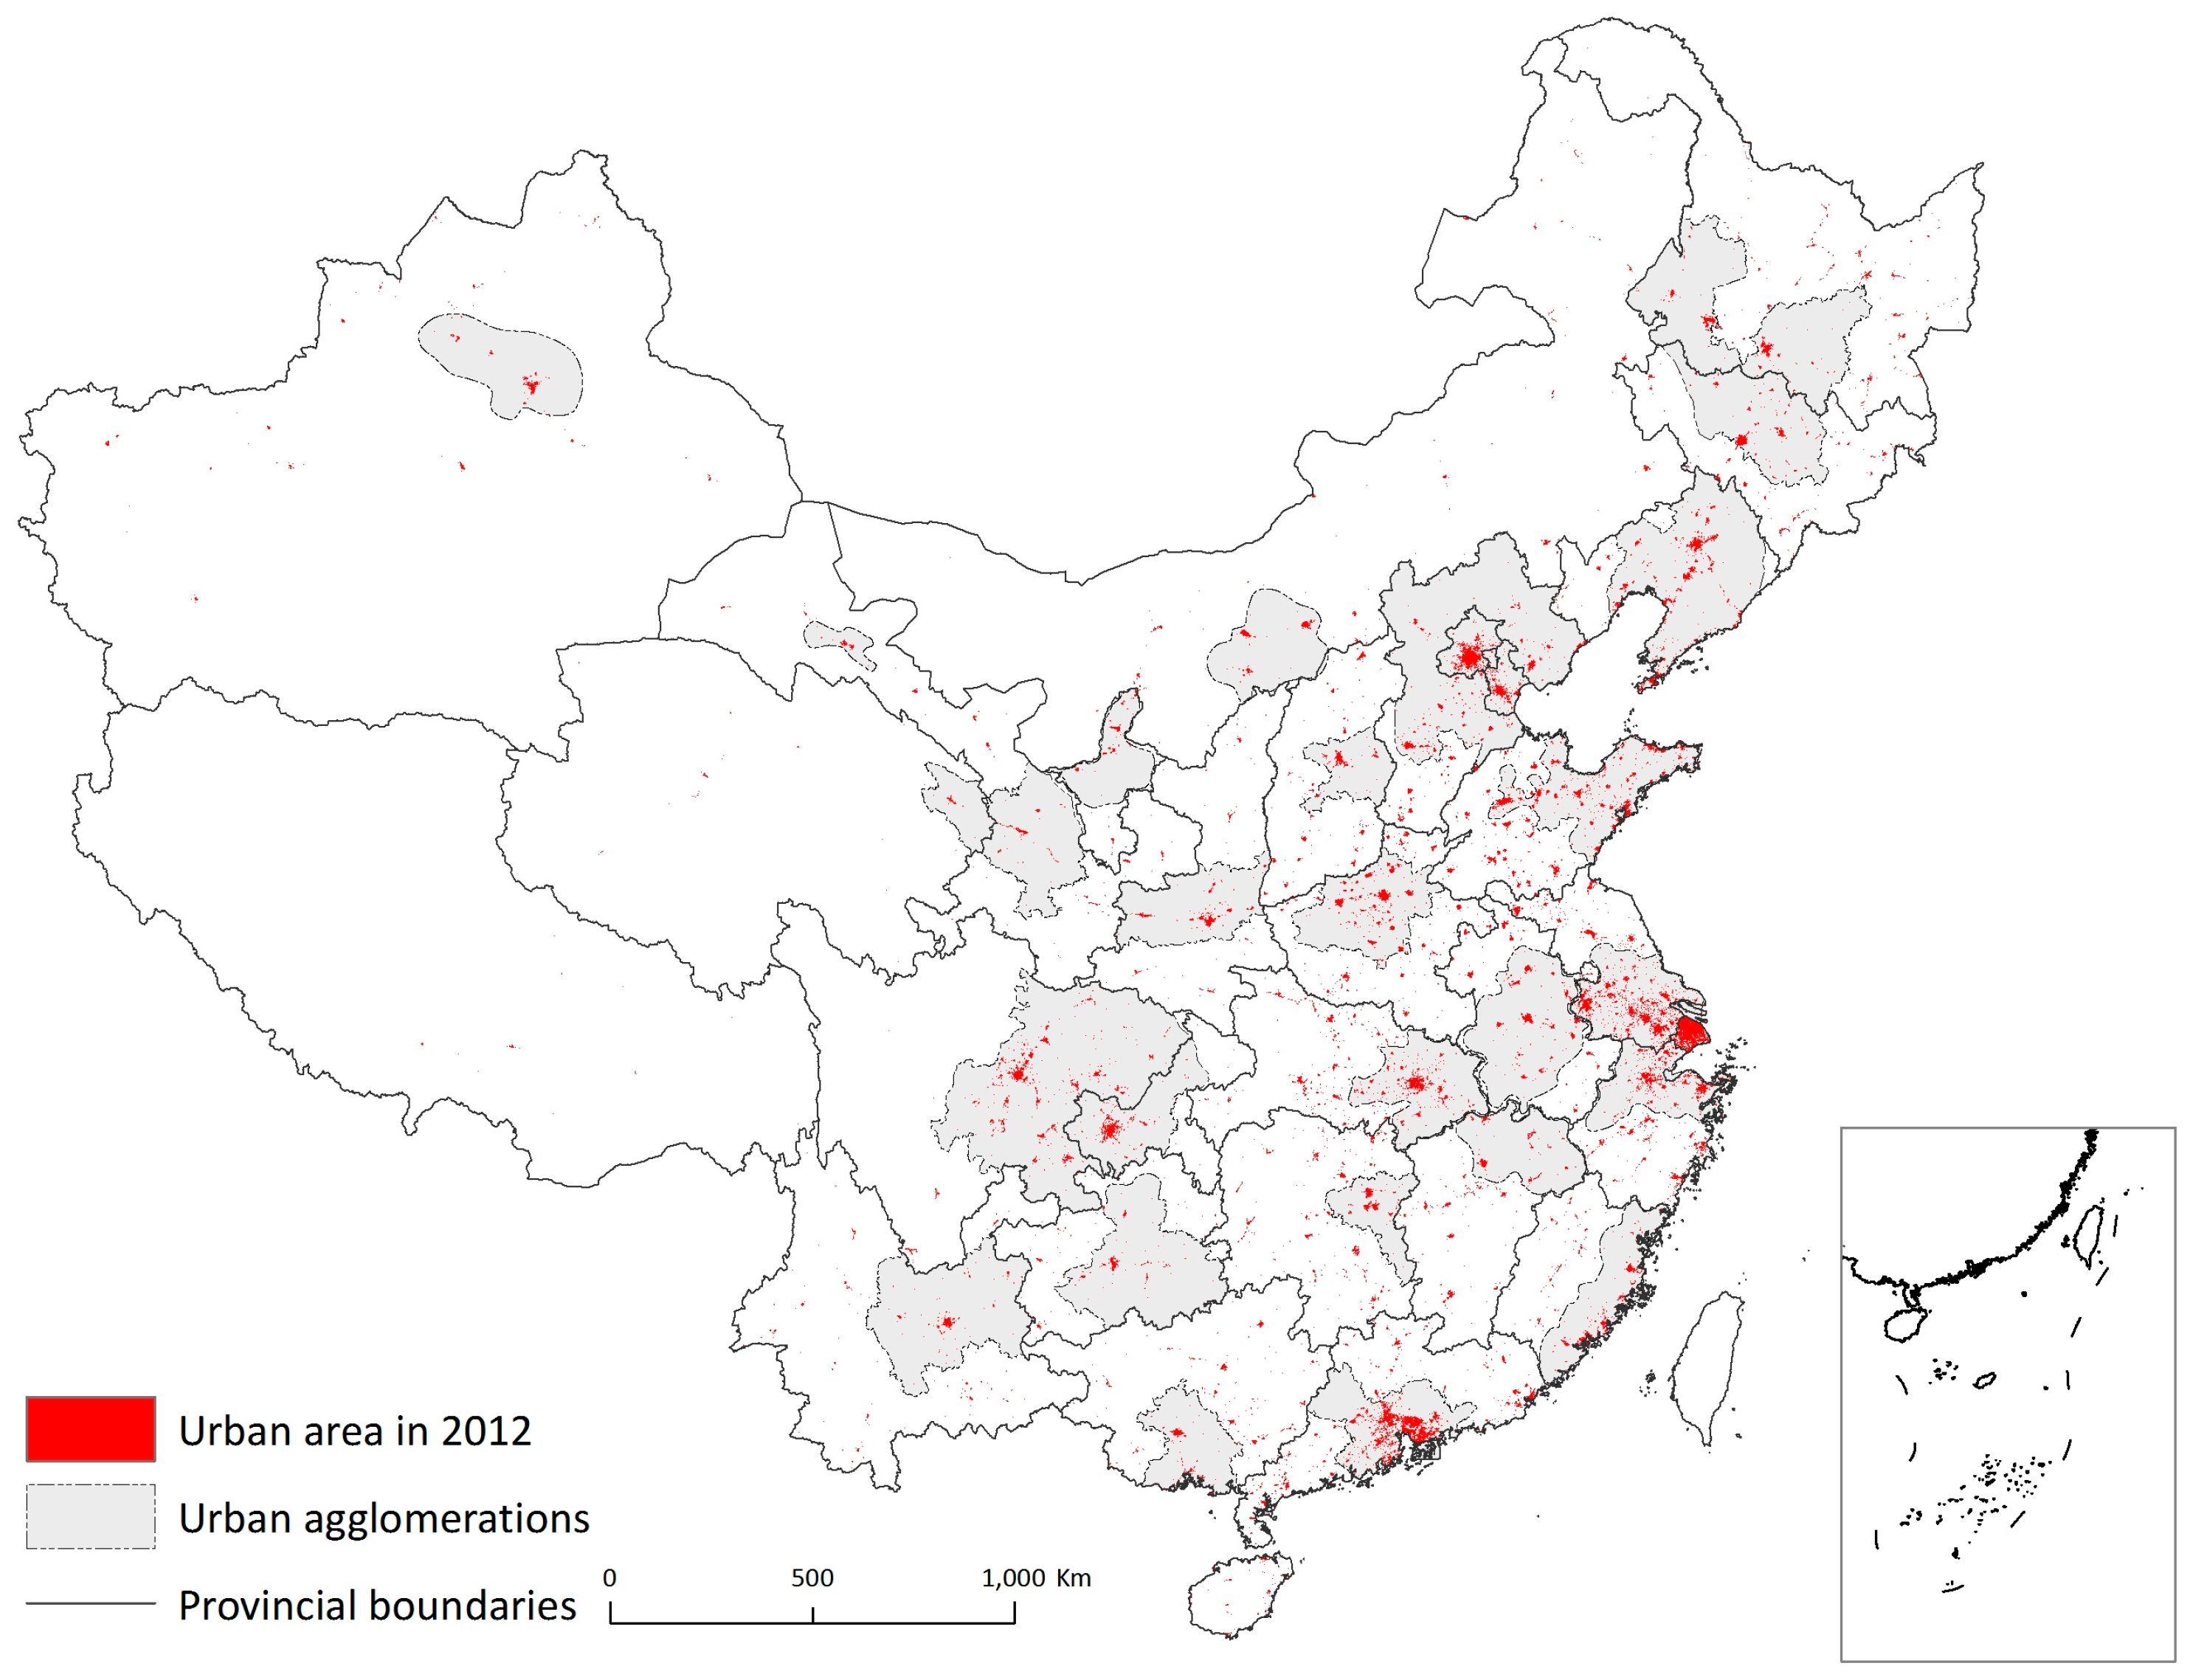
Figure 6.
Urban expansion patterns of the whole area of China for the BAU scenario. (We only list one scenario in this figure, as it is difficult to reveal the differences between the three proposed scenarios for the whole China with a small map. For more vivid difference between scenarios of the whole China, please refer to Table 2 and online visualization.)
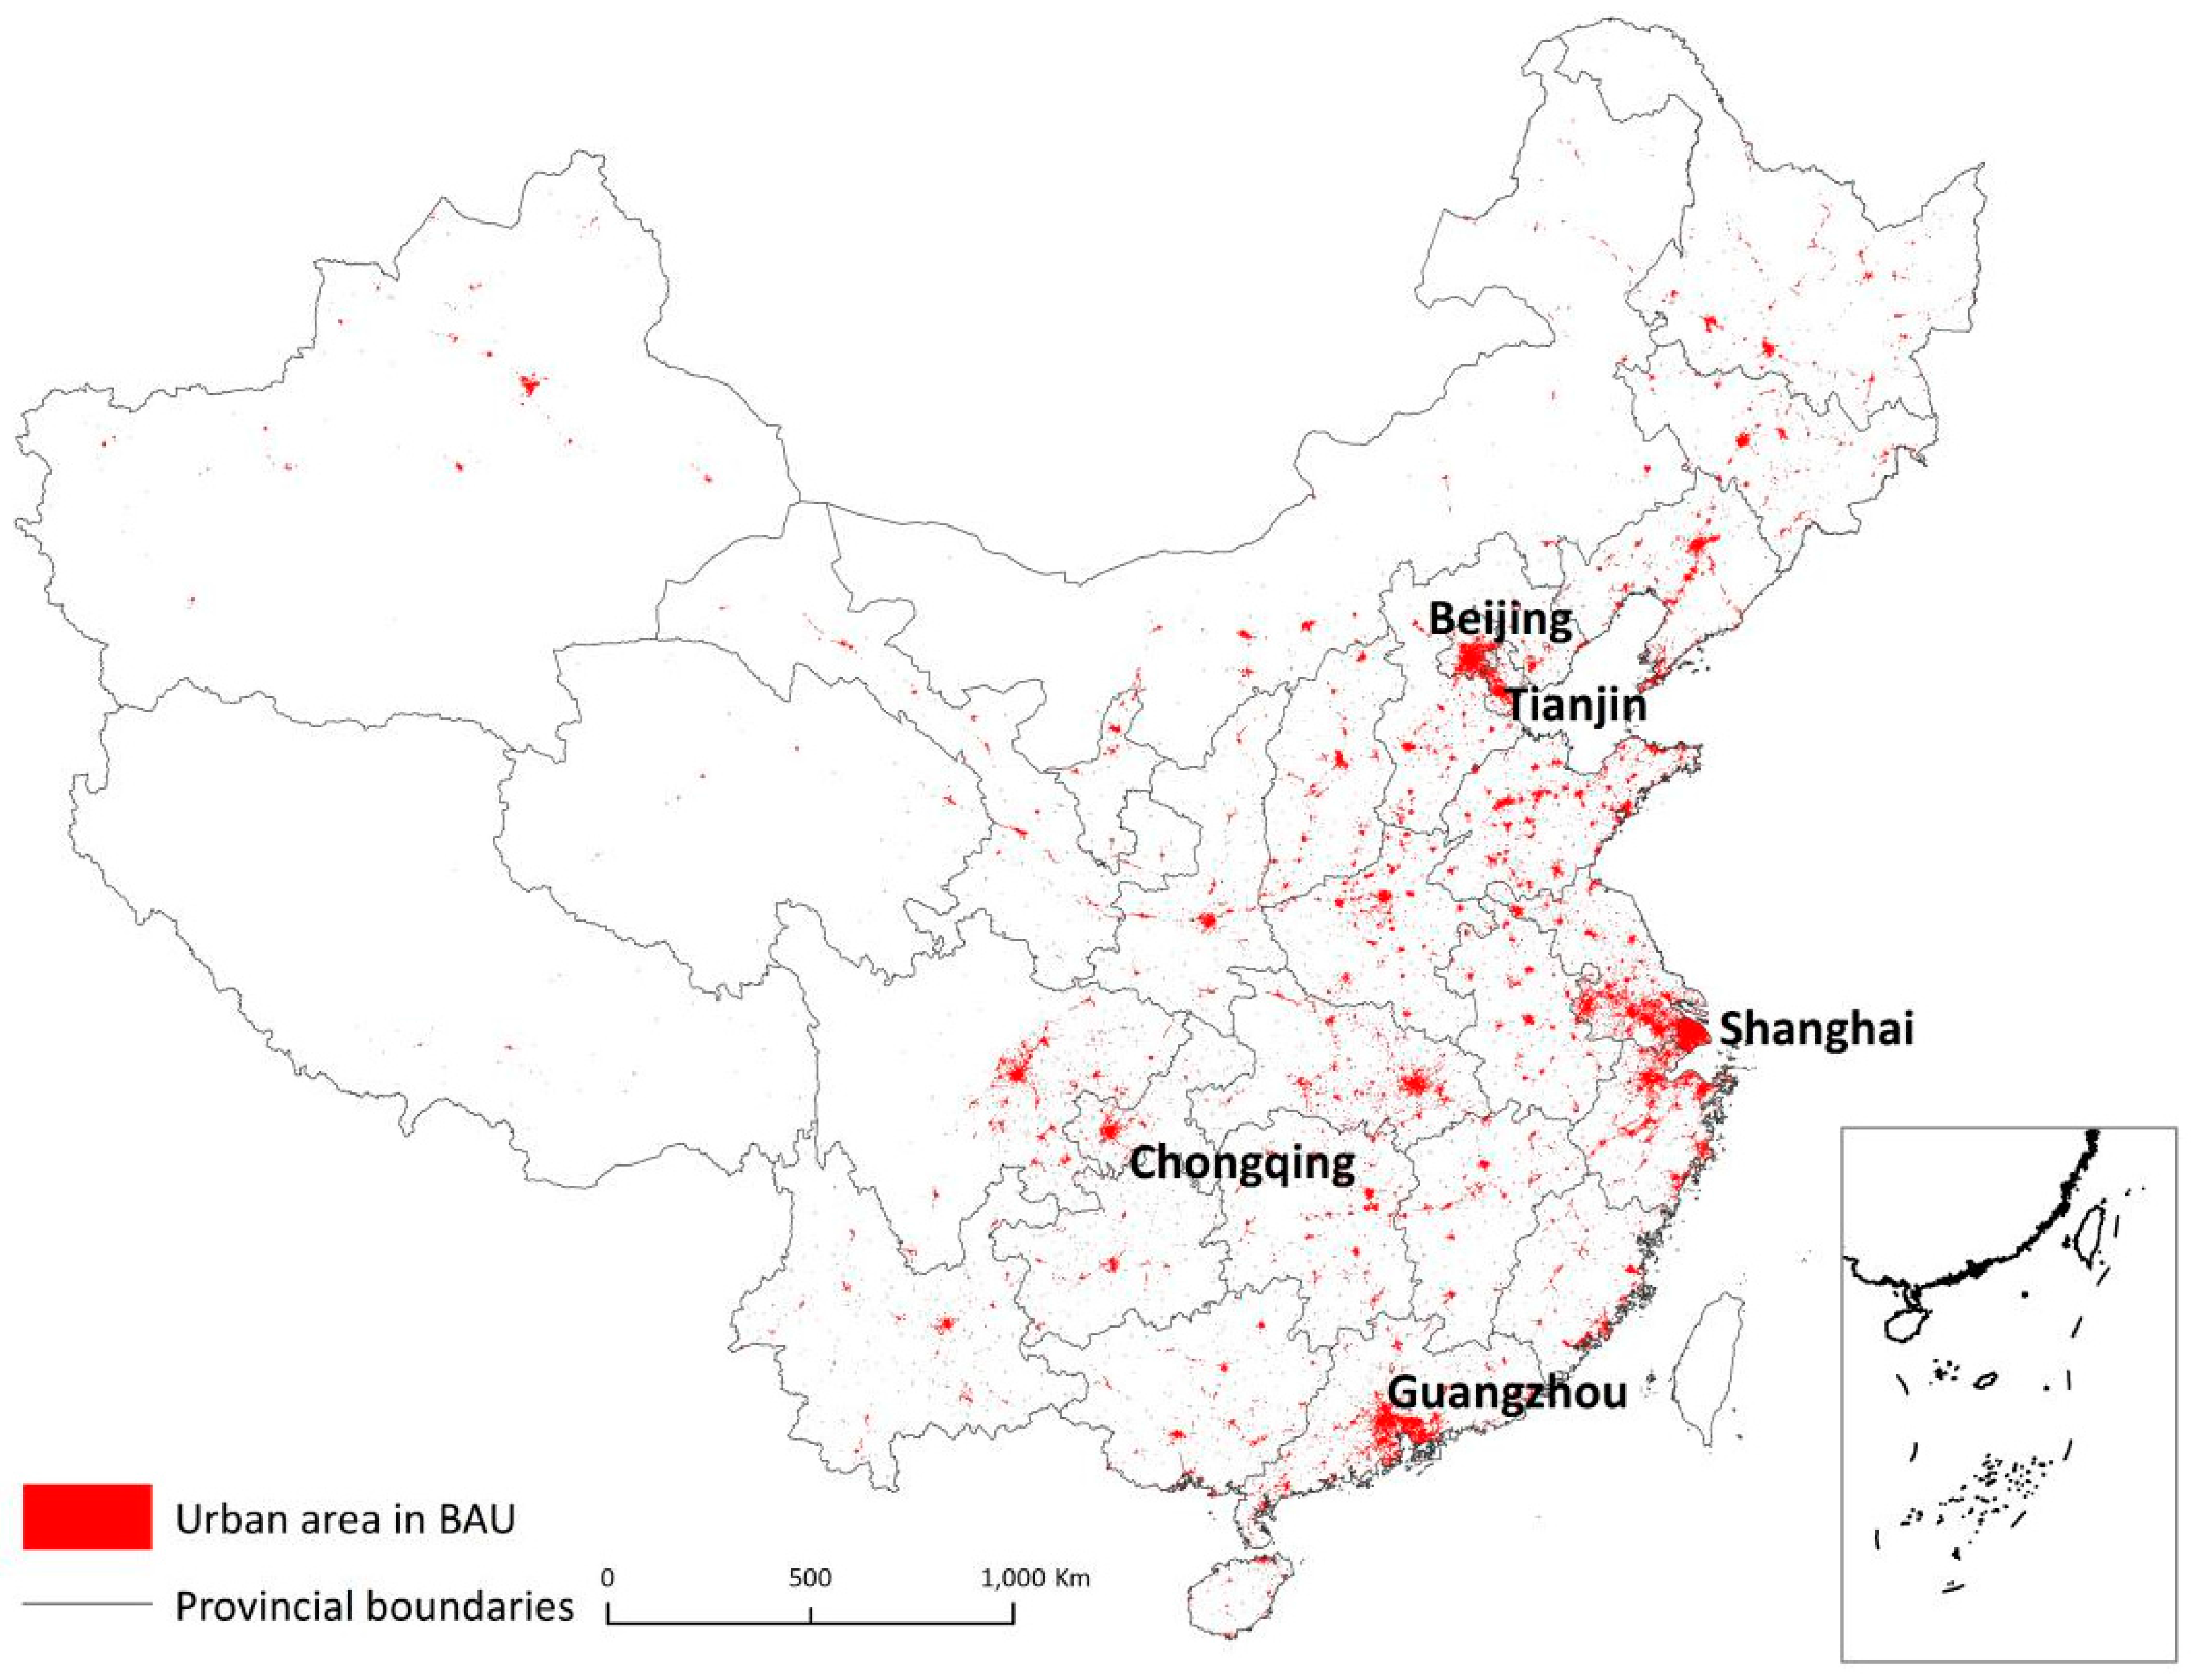
Figure 7.
Urban expansion patterns in typical urban agglomerations. Note that red denotes simulated urban expansion during 2012–2017 and blue denotes existing urban land in 2012. BAU, UAO and NUT indicates the business-as-usual, urban agglomeration oriented Scheme, and new type of urbanization scenario, respectively.


Figure 8.
The simulated results in the BAU scenario for typical cities. Note that red denotes simulated urban expansion during 2012–2017. The base map is the OpenStreetMap.
Figure 8.
The simulated results in the BAU scenario for typical cities. Note that red denotes simulated urban expansion during 2012–2017. The base map is the OpenStreetMap.

Figure 9.
Simulated urban expansion by MVB-CA and BUDEM in the city of Beijing.


Table 1.
Logistic regression results for the Beijing blocks.
| Factor | Coefficient | S.E. | Wald | Sig. |
|---|---|---|---|---|
| SIZE_LN | −0.197 | 0.007 | 693.572 | 0.000 |
| COMPACT | 1.933 | 0.962 | 4.033 | 0.045 |
| CENTER | −0.101 | 0.002 | 1891.809 | 0.000 |
| DENSITY | 2.230 | 0.110 | 407.554 | 0.000 |
| Constant | 2.224 | 0.082 | 739.440 | 0.000 |
Note: all variables are significant at the 0.05 level, and the overall accuracy of the regression is 81.9%.
Table 2.
Logistic regression results for the Beijing blocks.
| Factor | Coefficient | S.E. | Wald | Sig. |
|---|---|---|---|---|
| l_tam | 10.402 | 0.378 | 756.566 | 0.000 |
| l_city | 2.684 | 0.175 | 234.110 | 0.000 |
| l_town | −2.016 | 0.220 | 83.652 | 0.000 |
| l_road | 7.826 | 0.836 | 87.592 | 0.000 |
| g_conf | 0.535 | 0.089 | 35.774 | 0.000 |
| Constant | −11.832 | 0.801 | 218.329 | 0.000 |
Notes: l_tam = the attractive potential of Tiananmen Square, l_city = the attractive potential of the closest new city centre, l_town = the attractive potential of the closest town centre, l_road = the attractiveness of the closest main roads, and g_conf = whether or not a cell is forbidden for urban development. The other two factors in BUDEM, the attractive potential to the closest river (l_river) and whether or not a cell is farmland, are not significant in the regression.
© 2017 by the authors. Licensee MDPI, Basel, Switzerland. This article is an open access article distributed under the terms and conditions of the Creative Commons Attribution (CC BY) license (http://creativecommons.org/licenses/by/4.0/).
Share and Cite
MDPI and ACS Style
Long, Y.; Wu, K. Simulating Block-Level Urban Expansion for National Wide Cities. Sustainability 2017, 9, 879. https://doi.org/10.3390/su9060879
AMA Style
Long Y, Wu K. Simulating Block-Level Urban Expansion for National Wide Cities. Sustainability. 2017; 9(6):879. https://doi.org/10.3390/su9060879
Chicago/Turabian StyleLong, Ying, and Kang Wu. 2017. "Simulating Block-Level Urban Expansion for National Wide Cities" Sustainability 9, no. 6: 879. https://doi.org/10.3390/su9060879
Note that from the first issue of 2016, this journal uses article numbers instead of page numbers. See further details here.