
Study of the Simulated Expansion Boundary of Construction Land in Shanghai Based on a SLEUTH Model


1
College of Surveying and Geo-Informatics, Tongji University, Shanghai 200092, China
2
College of Environmental Science and Engineering, Suzhou University of Science and Technology, Suzhou 215011, China
*
Author to whom correspondence should be addressed.
Sustainability 2017, 9(6), 876; https://doi.org/10.3390/su9060876
Submission received: 14 March 2017
/
Revised: 18 May 2017
/
Accepted: 18 May 2017
/
Published: 23 May 2017
Abstract
:The SLEUTH model is one of the recent methodological advances, but its data sources are mainly interpreted from remote sensing images. It doesn’t cover the whole urban area and exhibits technical errors. Moreover, the relationships between land use and land cover change (LUCC) and sustainability have seldom been discussed. Aimed at addressing these shortcomings, we focus on a wider range and use different data sources to simulate and predict the boundary of urban construction land expansion, and analyze the relationship between the expansion style of urban land and the change of ecological service value. Based on Shanghai land use map data, which covers the whole city scope and eliminates the error in data processing, we use a SLEUTH model to simulate the urban growth mode in Shanghai in 2020 under two scenarios, i.e., the natural growth mode and ecological priority mode, which are different from the previous scenario modes such as unprotected, light protected, moderately protected, and heavily protected modes. The results are as follows: (1) The development of urban land in Shanghai is most reasonable under the ecological priority mode as its ecological service value is higher than that of the natural growth mode; (2) Construction land expansion in Shanghai is very slow under the ecological priority mode, wherein construction land growth mainly occurs in the northwest, southwest, and southeast of Shanghai, and the northwest part of Chongming Island; (3) The surrounding area of the central city is given priority over edge growth, where the growth range is small. The outer suburbs are given priority for widespread growth, which is synchronous with the slow growth of roads.
1. Introduction
Over the past 20 years, land use and land cover change (LUCC) has become one of the core research concepts in global environmental change research. Associated research topics are focused on remote sensing monitoring methods and simulation models, spatio-temporal characteristics and evolution laws, impacting factors and driving mechanisms, change effect assessment, and landscape structure optimization [1,2,3,4,5,6,7,8,9,10,11,12,13,14,15,16,17]. The simulation models employed for urban expansion and land use change include the Markov, CA (Cellular Automata)-Markov, ANN (Artificial Neural Network)-Markov, LTM (Land Transformation Model), ABM (agent-based model), CLUE-S, and SLEUTH models [18,19]. Markov models are suitable for short-term forecasting, but are unsuitable for long-term prediction. The accuracy of forecasting is easily affected by objective factors, and the transfer probability matrix is difficult to adjust. A CA model is a lattice dynamical model with time, space, and state as discrete, spatially interacting, and time-dependent variables. This model has a strong capability to simulate the spatio-temporal evolution of complex space systems [14,20,21,22]. Agent-based modeling, a relatively new computational modeling paradigm, is the modeling of phenomena as dynamical systems of interacting agents [23,24,25,26]. The CLUE-S and LTM models first need to predict urban expansion demands and then calculate the possibility of urban spatial expansion (i.e., as a probability) through a comprehensive analysis of the impacting factors to achieve the spatial distribution of urban expansion [8,13]. A SLEUTH model does not need to predict urban expansion demands and can be directly simulated and predicted by the historical trajectory of urban expansion. Because the different simulation models have advantages and disadvantages, coupling and integrating two or more models has become one of the main development trends [4,27,28]. In the LUCC models research field, another noteworthy trend is that some scholars have begun to pay close attention to the relationships between LUCC and sustainability, e.g., the impacts of LUCC on global food security and biodiversity [29,30], the cycling of carbon and water [31], soil fertility and natural values [32], landscape value [33,34], water management [35], the relationship between land cover and vulnerability to climate change [36], and so on. As Foley et al. have pointed out, land use is becoming a force of global importance as an increasing population and consumption, in addition to urban area expansion, are leading to tremendous demands on agriculture and natural resources. Agricultural ecosystems are concurrently degrading land, water, biodiversity, and climate on a global scale. To meet the world’s future food security and sustainability needs, we must seek reasonable strategies and solutions [29,30].
The SLEUTH model is one of the recent methodological advances, having obtained satisfactory simulations of spatial urban expansion over time, both in developed countries and in developing countries, and has been widely used. Cities whose urban expansions have been modelled via the application of a SLEUTH model at a variety of regions and scales include Lisbon and Porto [37], the Baltimore-Washington metropolitan area [38], Shenyang [39], Guangzhou [40], Dongguan [41], Beijing [42], Shanghai [43,44], Hangzhou [45], Wuxi [46], Quanzhou [47], the Jimei district of Xiamen city [4], and Kunshan [48]. Despite the similarities of the methods, the spatial extent, data base, and the simulated scenarios of the studies were variable.
Research on urban land expansion has become a hot topic in recent years. Specifically when considering Shanghai, scholars have emphasized the measurement and monitoring of spatio-temporal processes and patterns of urban land expansion [5,14,49,50,51,52], expansion styles and driving mechanisms including economic growth and structural adjustment, population growth and distribution, the improvement of people’s living standard, foreign direct investment (FDI), state policy (e.g., quota restrictions, intensity assessment, and management), government competition, land market reform, urban planning systems, land financing, urban administrative hierarchy, large-scale international events [6,53,54,55,56,57,58,59,60], scenario simulations and the prediction of urban land expansion [6,9,43,44,61], the effects and consequences of urban land expansion including environmental change, landscape diversity, and transportation change [62,63,64,65,66], and the relationships among urban land expansion and the intensification of land use [67], cultivated land protection [68], regional socio-economic-ecological systems [69]. Another focus of study is the spatial regulation of urban land expansion, including the control methods, effects and strategies such as the delimitation of urban growth boundaries [13], regulation rules [70], and sustainable land use policy [9]. For example, the study by Zhu et al. [43], which used high-resolution land use data from 1989 to 2005, simulated the urban growth pattern of a rectangular 2722 km2 area in Shanghai (accounting for 42.9% of the total area of Shanghai) under the four types of land resources protection scenarios, i.e., unprotected, mildly protected, moderately protected, and highly protected. Unfortunately, their research scope did not include the entire Shanghai urban area and excluded several new suburban towns. In another study by Li et al. [6], they only analyzed the urban land expansion of eastern Shanghai and its spatial dynamics, which covered 3031 km2, accounting for 47.8% of the total area of the Shanghai municipality. In addition, the rural residential land that was brought into the scope of protection may not be completely reasonable. Cui et al. [44] employed four land use data sets obtained from Landsat TM/ETM remote sensing image interpretations in 1990, 1995, 2000, and 2005 to simulate the urban spatial expansion of Shanghai using the CLUE-S, LTM and SLEUTH models, and concluded that the simulation results from the SLEUTH model display the highest precision. Therefore, this paper uses the SLEUTH model to simulate and forecast the boundaries of the construction land (Construction land means land for development, including developed land in urban and rural areas (e.g., built-up area) and undeveloped land that has future plans for development in China.) expansion in Shanghai in 2020 under two scenarios, i.e., natural growth and ecological priority patterns, and provides a reference for a new round of general land use planning revisions in Shanghai.
Compared with the previous studies, our work is innovative in three aspects. First, it includes a wider research scope. The regional scope includes the entire city of Shanghai in this study, but only the central urban area and inner suburb area [43] or the eastern Shanghai [6] in previous studies. Second, it uses different data sources and a higher accuracy or lower rate of error. The previous data sources are mainly interpreted from remote sensing images, which results in relatively higher technical error. In the study of Zhu et al. [43], the time resolution is five years, the spatial resolution is 2.5 m, and the Lee Sallee value is 0.48. In this study, the time resolution is one year, the spatial resolution is 10 m, and the average Lee Sallee value is about 0.63, so the accuracy is higher. Moreover, the error in the area estimation from land use maps is about 0.00328%, which is far less than that when using remote sensing images. Third, it includes new research content. For example, we discuss the relationship between LUCC and ecological service values.
2. Materials and Methods
2.1. Research Method
The SLEUTH model is a kind of simulation model in which a CA model is adopted to simulate the urban development and its impact on the surrounding land use. Its main advantage is that it uses a computer to automatically judge the degree of the match between the simulation results and the actual situation, and looks for a combination scheme of minimum error, so as to produce the best parameter combination. It was designed based on the idea that traffic, terrain, and the constraint conditions of urbanization can be used to calculate the development possibility of each cell unit, using cellular automata as the seed points of urbanization, which, through their diffusion, drive the development of the whole region. The closer the cell unit is to the seed point of the cellular automata, the more likely it is to be urbanized.
The SLEUTH model consists of two closely coupled sub-models, i.e., the Urban Growth Model (UGM) and the Land Cover Deltatron Model (LCDM). The UGM sub-model can be performed separately, and the LCDM sub-model is capable of further considering the interaction between urban land and other land use types based on the UGM sub-model. The input data for the SLEUTH model include the Slope layer, Land use layer, Excluded layer, Urban layer, Transportation layer, and Hillshade layer. The model’s behavior is dominated by the following five coefficients: the breed coefficient, spread coefficient, slope coefficient, dispersion coefficient, and road-gravity coefficient. These coefficients can produce the following four growth types: spontaneous growth, new spreading centers growth, edge growth, and road-influenced growth.
Within the simulation process, the model calibration process is the most important, wherein the parameter system for the characteristics of regional land use cover change can be generally obtained through coarse, fine, and final corrections. Then, different land use cover change scenario conditions can be formed by modifying the expansion layer, transportation layer, etc. A SLEUTH model structure is shown in Figure 1. The SLEUTH model has a strong universal applicability, which has an important application value for urban growth and land use change simulation and prediction.
2.2. Data Sources
The land area of Shanghai (30°40′ N–31°53′ N, 120°51′ E–122°12′ E) is 6340.5 km2. The majority of the city consists of flat plains except for a few hills in the Southwest, with an average elevation of about 4 m. Shanghai’s permanent population hit 24.15 million people at the end of 2015 and is one of the most urbanized cities in China. In this study, the fundamental data are mainly Shanghai’s present land-use maps from 2009, 2011, 2012, and 2013 (provided by Shanghai Municipal Planning and Land & Resources Administration). Through mapping and processing with ArcGIS software, maps were digitized and the vector data were converted into raster data, whose spatial resolution was 10 m × 10 m. Thus, the land use database was formed. It’s important to note that the raw data sets used span the four consecutive years from 2009–2013, with a one-year temporal resolution. Such a choice was made for the following reasons:
- 1)
- The construction land area of Shanghai increased dramatically during 1990–2008. After 2008, the urbanization of Shanghai has reached a high level and the expansion of construction land has started to slow down;
- 2)
- In recent years, land use planning and urban planning in Shanghai set the goal of strictly controlling the total scale of construction land explicitly, so the expansion mode of construction land in the future will be closer to recent years;
- 3)
- In this study, the forecast of the expansion boundaries of construction land in Shanghai is considered under two scenario modes, and is constrained by economic development and the natural environment, rather than just simply relying on historical data to produce the simulations.
The input data of the SLEUTH model includes land use, the slope, DEM, traffic roads and water area, wetland, the natural conservation area, etc. In this paper, six-layer data sets in a GIF format, which is required for executing the model, are established through raster data spatial analysis, format conversion, and other functions of the ArcGIS software. The format standard for all types of data is as follows: gray-scale GIF images, wherein all images are derived from maps of the same scale, with the same resolution, in accordance with a given nomenclature.
- (1)
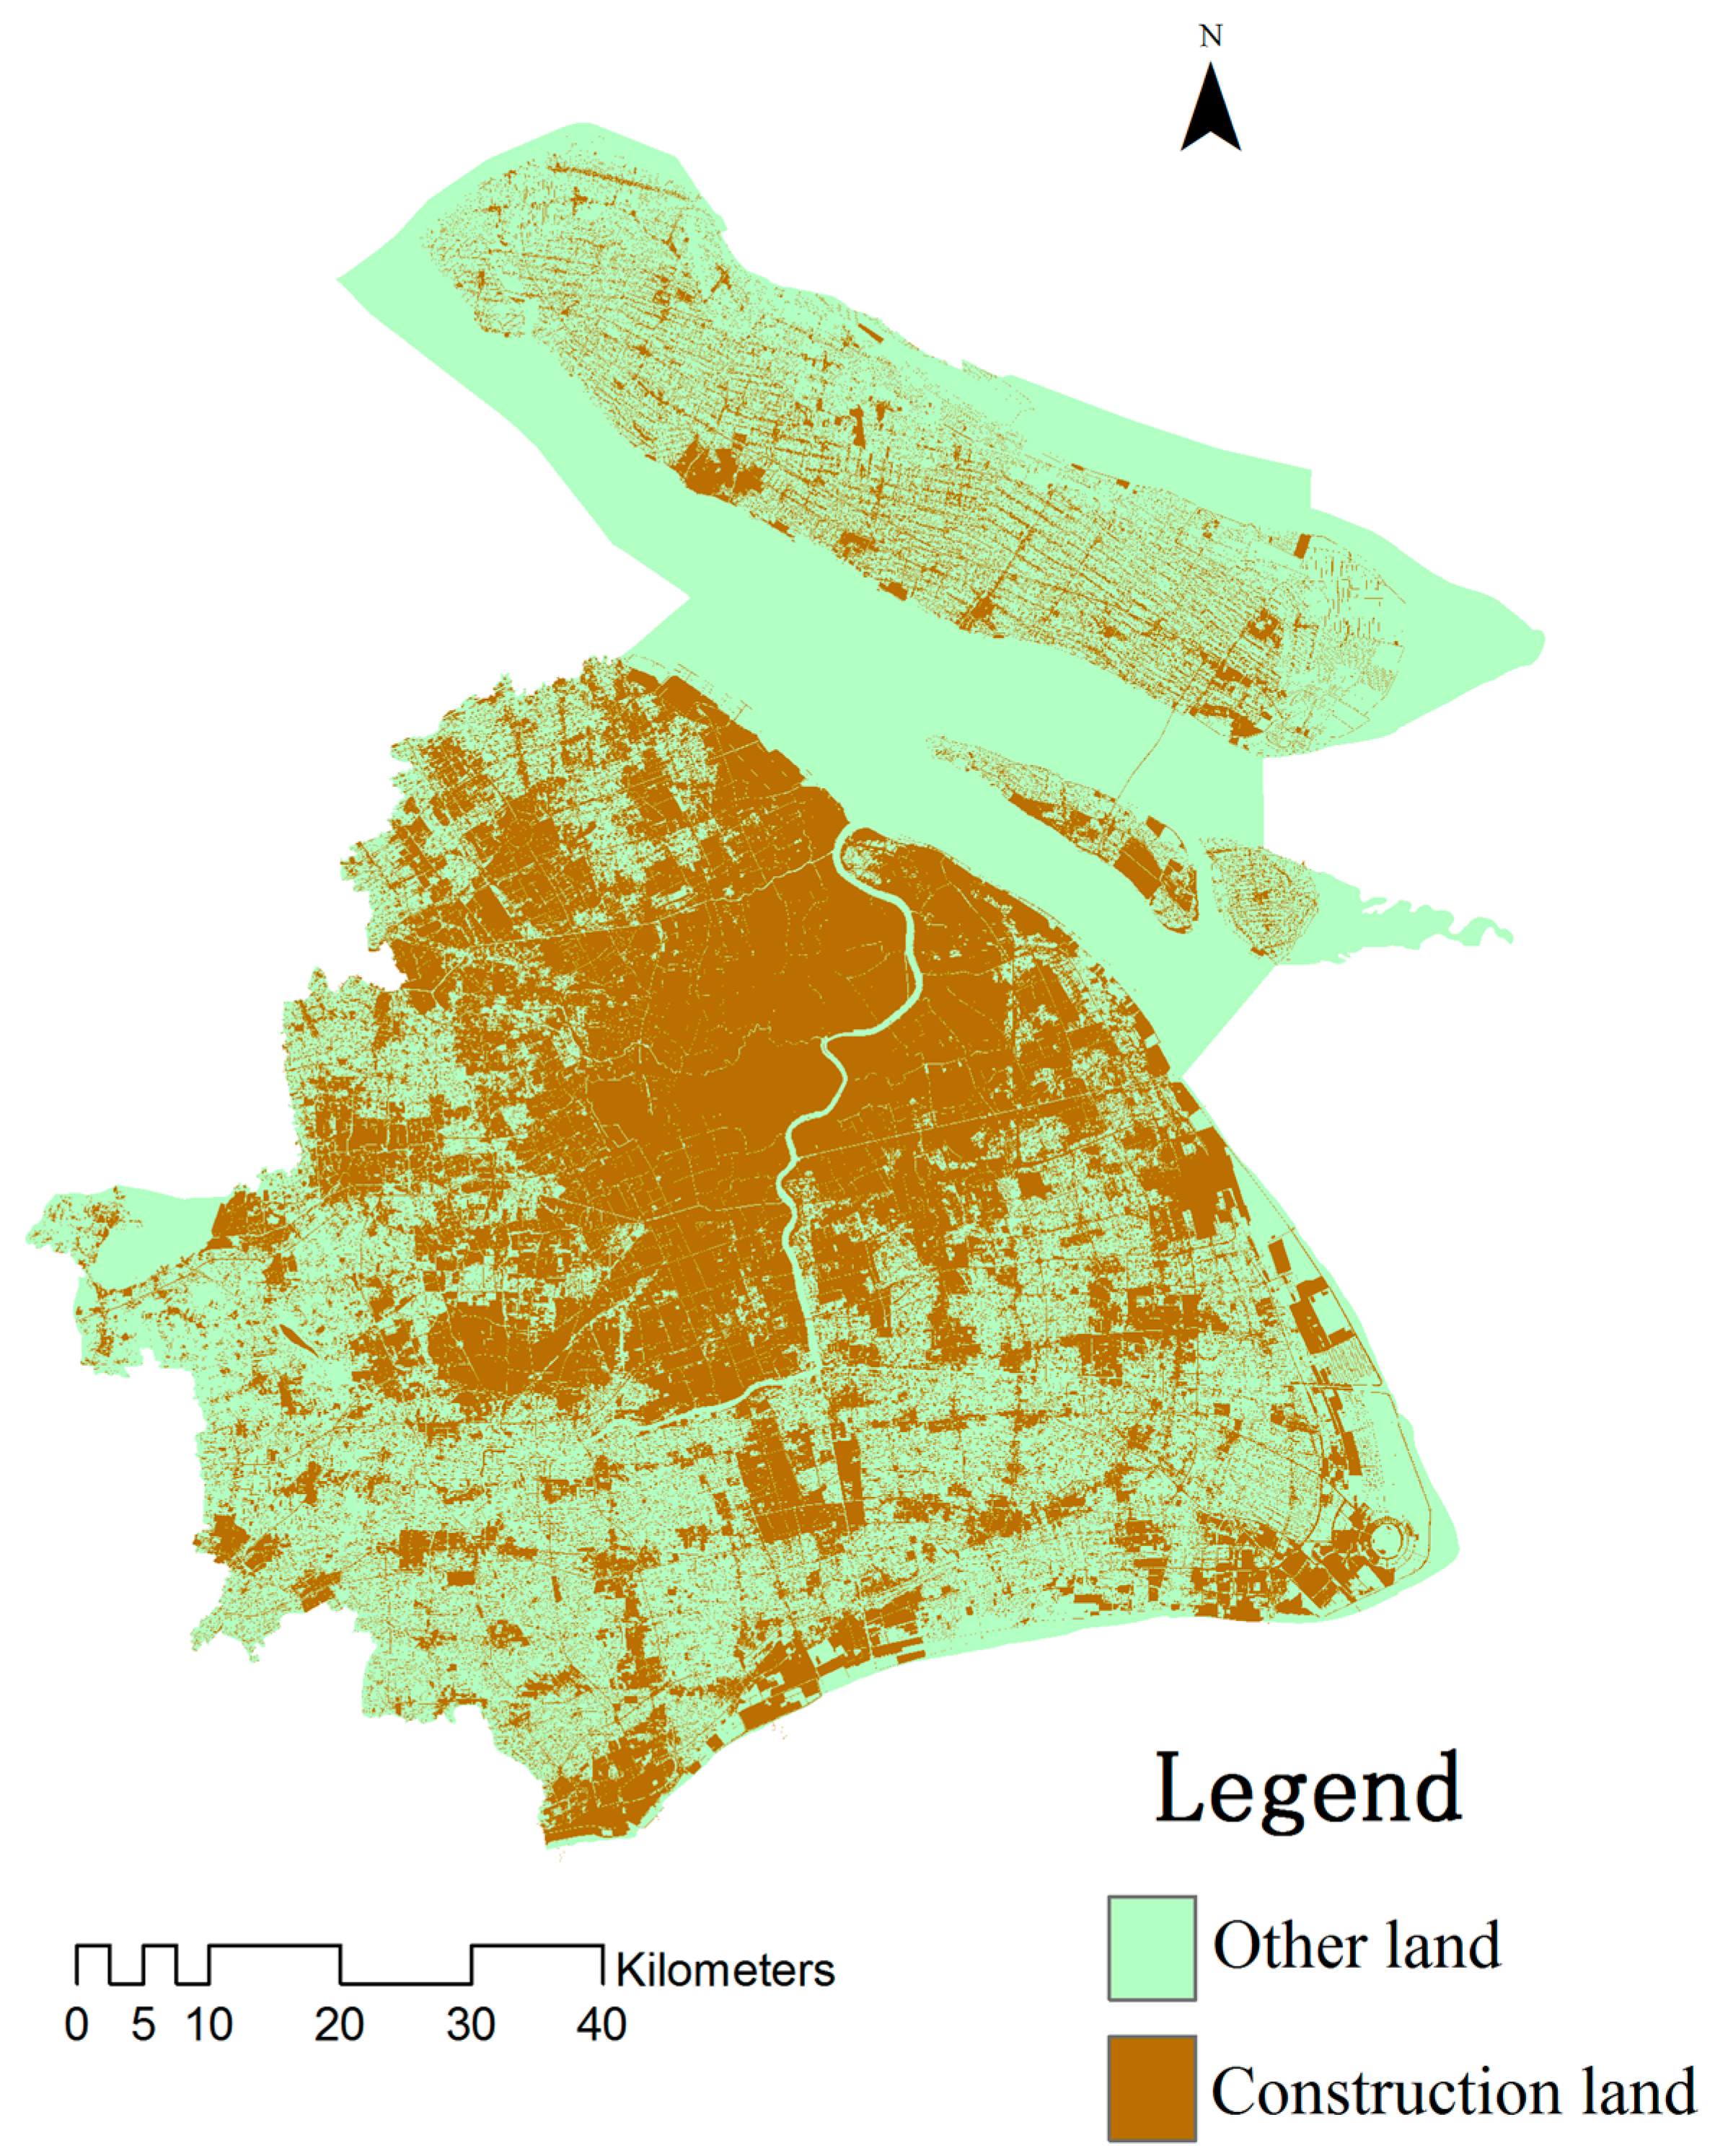
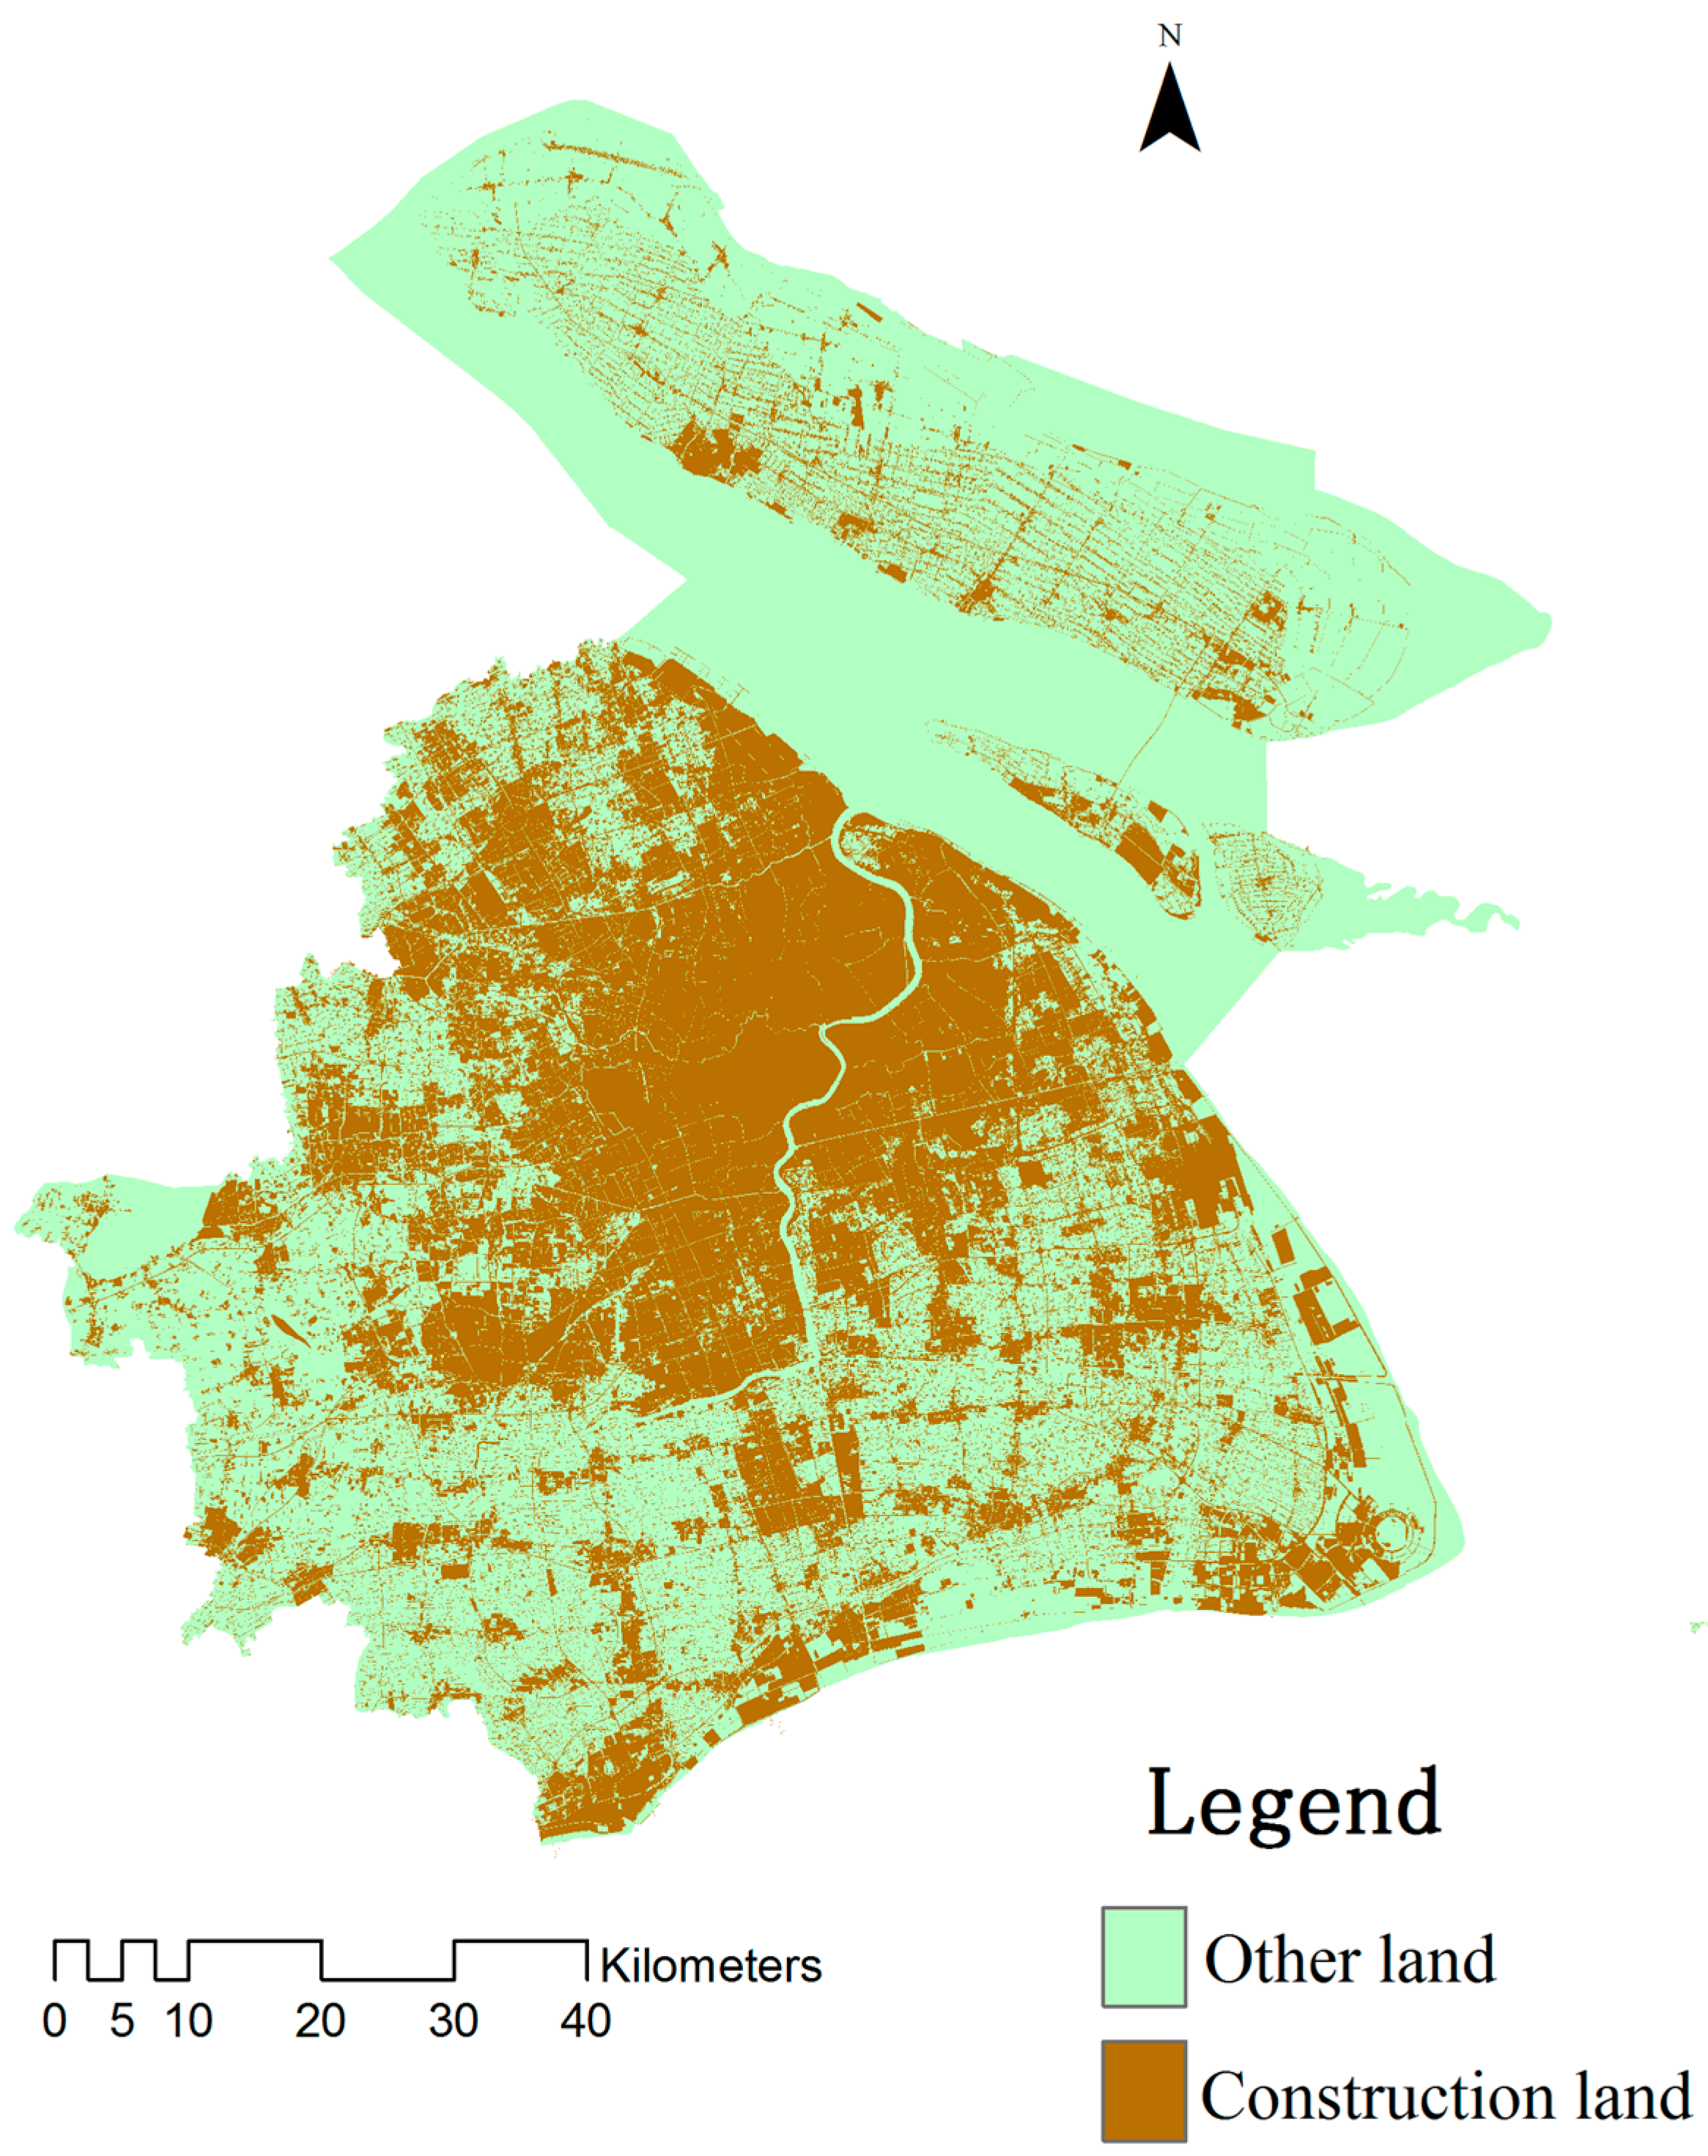
- The land use layer is generated using the land use database, and their land use types are adjusted and classified to fit the model land use types. The gray-scale values corresponding to specific land use types are shown in Table 1. To facilitate the display, land use types are still identified by color (Figure 2).
- (2)
- The urban layer, which is the layer demonstrating the existence and expansion of construction land, is generated using the land use database. Non-construction land is defined as a zero gray-scale value, while construction land is defined as a 255 gray-scale value.
- (3)
- The excluded layer is generated using the land use database. According to the requirements of urban development, restrictions on the expansion of construction land can be achieved by setting different excluded probabilities. For example, if waters are set to 100% exclusion, they can be reclassified in ArcGIS (Esri, CA, USA) and their gray-scale value can be set to 100 (i.e., if the gray-scale value is greater than or equal to 100, 100% is excluded; if the value is set between 0 and 100, the excluded probability is 0% to 100%).
- (4)
- The transportation layer is also generated by the land use database. The different road types may be given different relative weights and a greater gray-scale value corresponds to a greater weight. Non-road data are assigned a value of zero. Here, the gray-scale value of traffic land is set to 100, and the gray-scale value of non-traffic land is set to 0.
- (5)
- The slope layer is generated from the DEM data. Because Shanghai is flat, the slope values are close to 0; therefore, the slope values of the entire layer are assigned a value of 0.
- (6)
- The mountain shadow layer (i.e., hillshade layer) is only used as the background layer of the model image output and is not included in the model computation.
2.3. Scenario Modes Setting
The SLEUTH model predicts different scenarios through two mechanisms, as follows: First, the model may modify the optimal parameters generated in the calibration process according to the future expected changes in the environmental conditions. Second, the model may adjust the excluded layer such that the construction land expansion will be subjected to varying degrees of restrictions, following which the model can simulate the development of different future scenarios. By defining different excluded layers, road traffic and initial urban areas, two models of future development scenarios were constructed to predict different urban expansion scenarios in 2020.
- (1)
- Natural growth mode (Mode I): This scenario sets water (rivers, lakes, reservoirs, ponds, etc.) and wetlands as the excluded layers (100% probability is not urbanized), and other factors do not restrict urban development and construction.
- (2)
- Ecological priority mode (Mode II): This scenario considers ecological environment protection, wherein water regions and wetlands are set to 100% and are excluded from urban expansion; the cultivated lands are set to 80% and are excluded from urban expansion; park land, forests, and grassland are set to 60% and are excluded from urban expansion.
3. Results and Discussion
3.1. Results
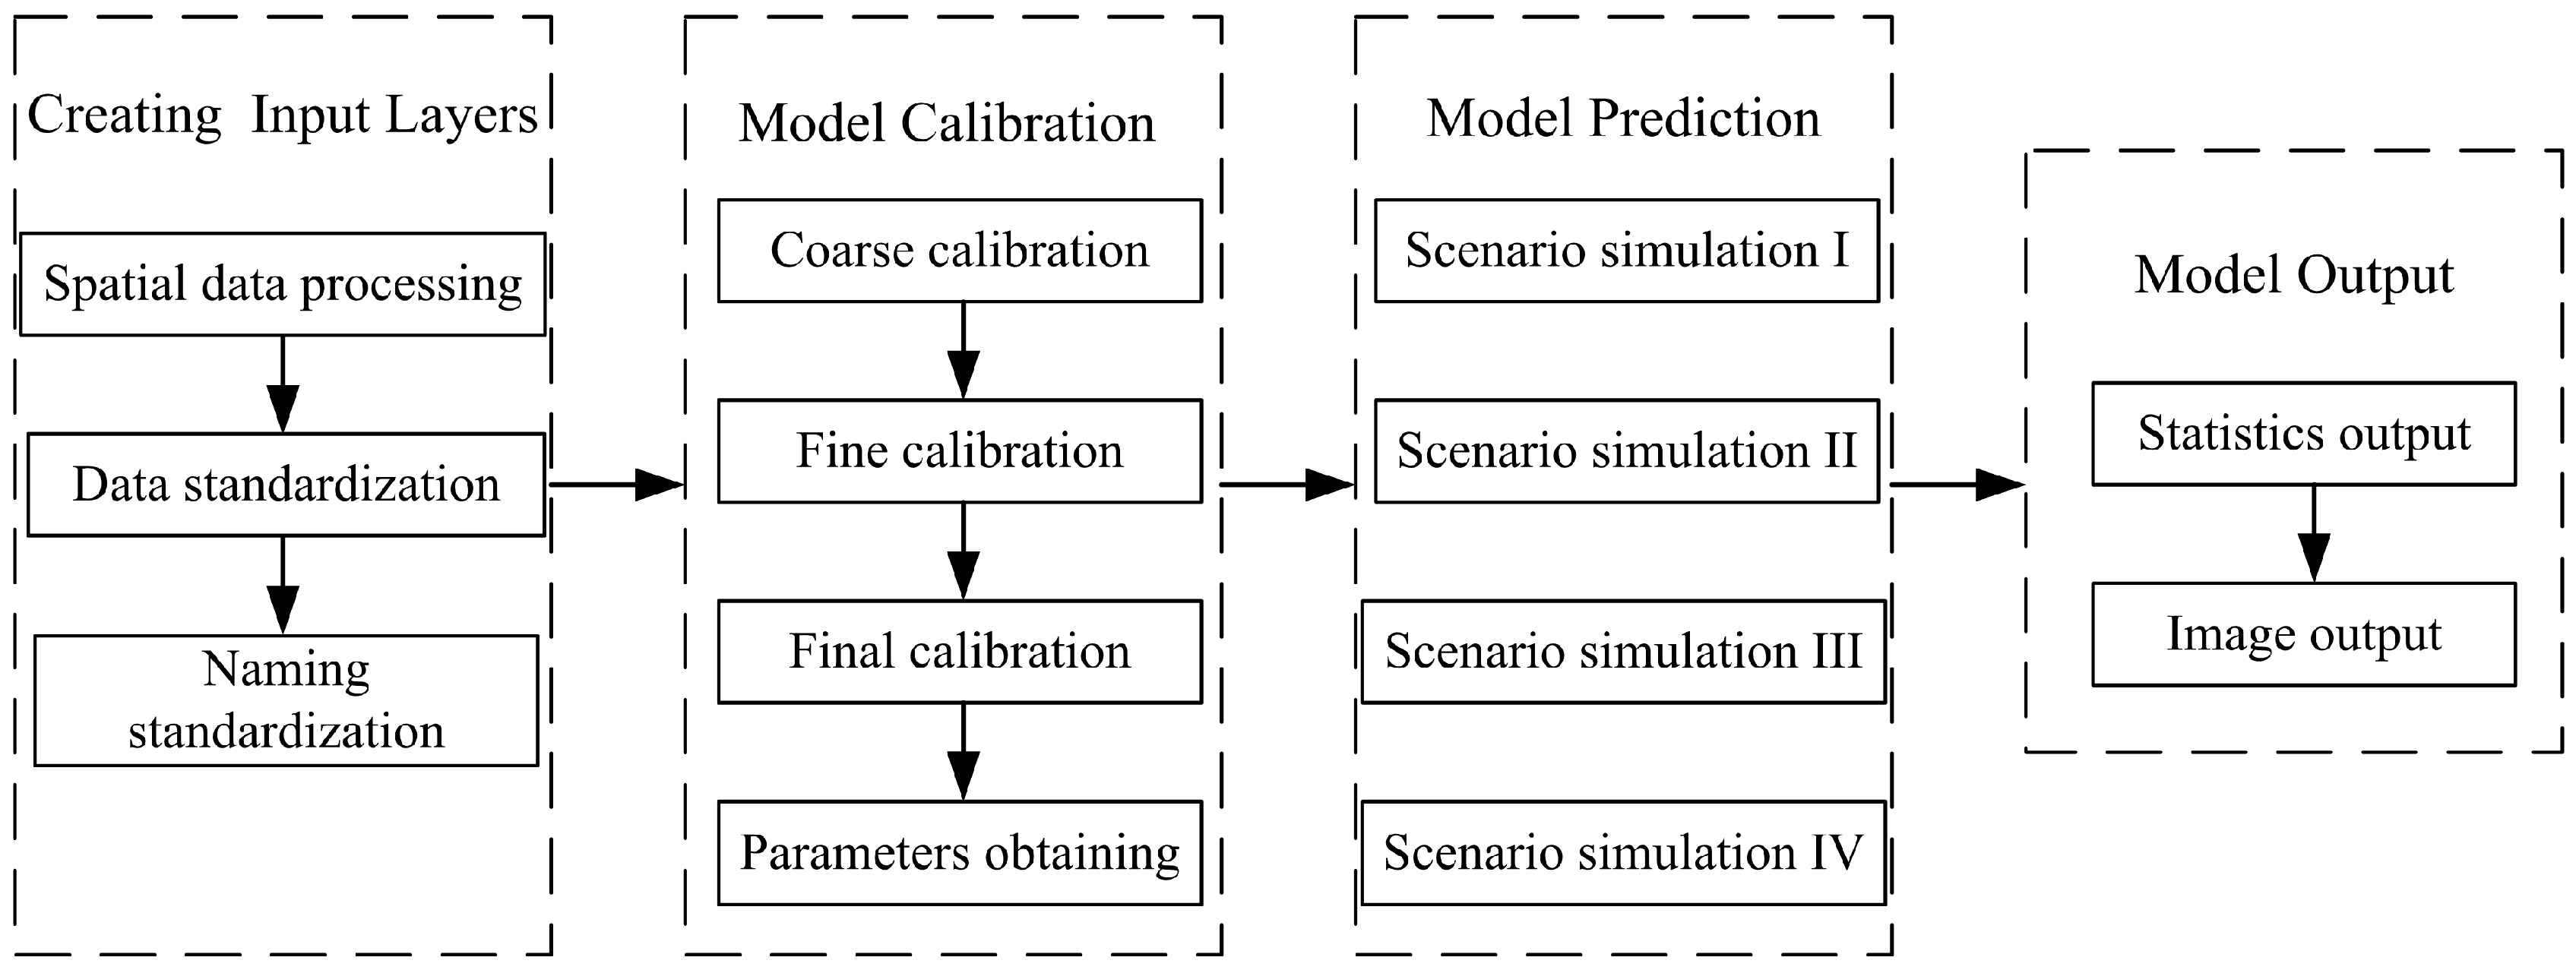
The SLEUTH model located within the SLEUTH3.0beta_p01_linux.tar package requires a virtual Unix environment to debug and compile under Windows, which can be performed by installing the Cygwin software on a Windows system. The implementation of the entire SLEUTH model is shown in Figure 3.
Employing the aforementioned data processing procedure, this paper utilizes the construction land layer in 2009 as the initial layer for the model calibration, while the construction land layers in 2011, 2012, and 2013 are used as the calibration layers to calculate the model’s calibration parameters.
Model calibration proceeded in three phases. At first, the range of the model’s parameters (dispersion coefficient, breed coefficient, spread coefficient, slope coefficient, road-gravity coefficient) were set at 0~100. Then, in every phase, Monte Carlo iterations were done and narrowed the range of the model’s parameters. The training results were compared to the real data and the Lee-Sallee index was used to evaluate how well they matched, and thus, to determine the range of parameters. The last calibration phase obtained the value of the parameters. After calibration, the model adjusted the value of the parameters obtained above by self-modification to make the simulation closer to reality. The calculating data of the three calibration phases are shown in Table 2.
Following the input of the layer data and model calibration, the forecasting sub-module of the SLEUTH model was used to predict the growth of construction land in Shanghai in 2020 under the two different development scenarios (Figure 4 and Figure 5).
- (1)
- Natural growth mode (Mode I)
- (2)
- Ecological priority mode (Mode II)
The simulation results of the various types of land use in Shanghai obtained from the SLEUTH model are shown in Table 3.
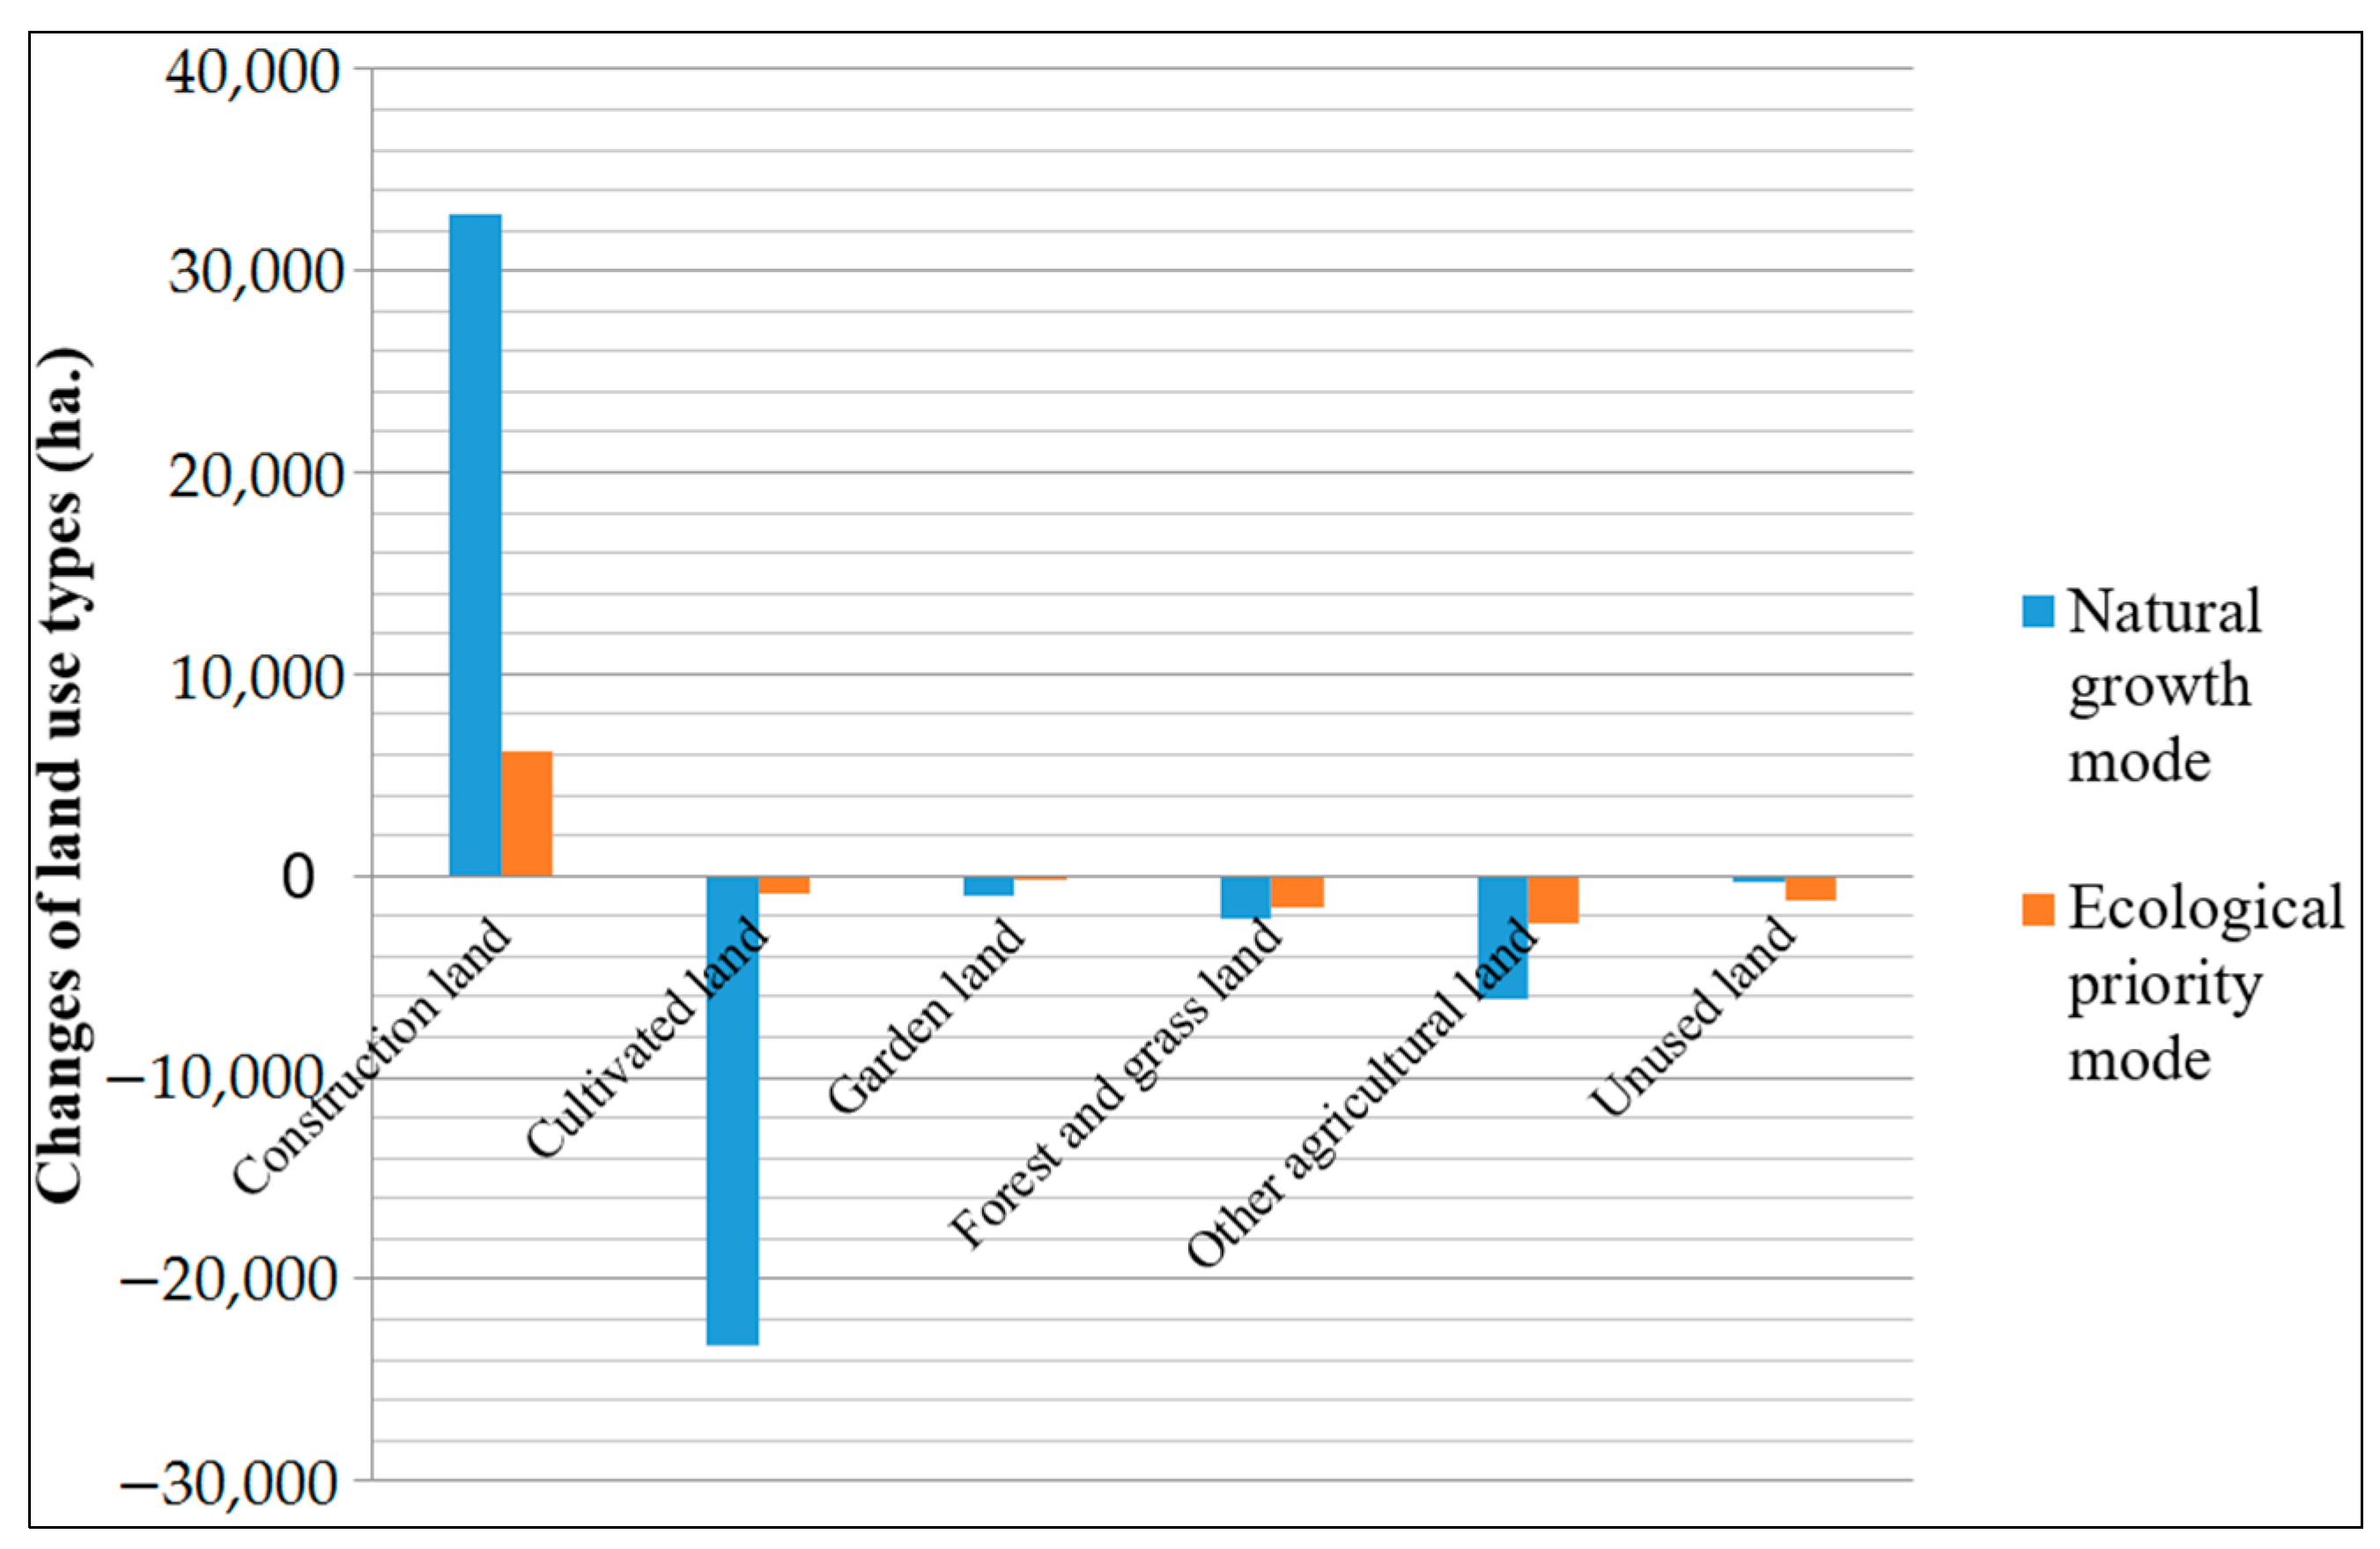
It can be observed from Figure 6 that the construction land area under the natural growth mode increases greatly, primarily at the expense of the reducing arable land. In the ecological priority mode, however, the construction land expands less, and the cultivated land benefits from improved protection.
In terms of the total construction land scale, under the natural growth mode, the construction land has the faster expansion rate, with the construction land increasing by 11.1%. Moreover, the total land for construction under this scenario in 2020 will exceed the planned “ceiling” (3226 km2) and, thus, does not meet the real needs of the future maximum scale of Shanghai’s construction land. Meanwhile, it is observed that the expansion of construction land in the ecological priority mode is significantly slower. Thus, the total scale of construction land will not exceed the planned “ceiling” due to the construction land growth rate of only 2.1% by 2020. Thus, construction land growth under the ecological priority mode is more reasonable based on the objective of restricting and guiding the growth of construction land.
From the perspective of the consumption of ecological land, under the natural growth mode, the average annual consumption of cultivated land is 16.3 km2. It is thus apparent that the expansion of construction land in this mode is at the expense of cultivated land. Moreover, in this scenario, the amount of cultivated land in 2020 is far below the target of its planned control (the cultivated land stock of Shanghai in 2020 is 2493 km2). Under the ecological priority mode, however, the cultivated land in Shanghai will exceed 2300 km2 in 2020, which is close to the planning control target issued by the Ministry of Land and Resources of PRC. Moreover, under the ecological priority mode, the protection of green land is stronger. Green land plays an important role in improving the urban climate and promoting the value of the landscape. Therefore, it is more reasonable to use the ecological priority mode for land use prediction.
3.2. Discussion
The accuracy of the SLEUTH model to predict urban land growth depends on urban development in the past and parameter calibration, and parameter calibration is based on the land use change of the urban historical period [21,38]. The previous data sources of LUCC are mainly interpreted from remote sensing images using technical means. They don’t cover the whole city and exhibit technical error. In the study of Zhu et al. [43], for instance, the study area only covered 2722 km2, accounting for 42.9% of Shanghai; based on the historical data derived from 1989 to 2005. Due to the effect of the economic development stage, Shanghai witnessed the fastest economic development and urban expansion during that period. Therefore, the future scenarios’ simulation values of the urban area must be on the high side. Additionally, its spatial resolution is 2.5 m, but the Lee Sallee value is 0.48. This article is based on Shanghai land use map data, which covers the whole city scope and eliminates the error in the remote sensing image interpretation. In our study, the spatial resolution is 10 m and the average Lee Sallee value is about 0.63, so the accuracy is higher. Of course, there is no doubt that there is still a certain degree of error in the classification of the urban areas of our input images. According to our calculation, in 2012, the deformation ratio of the Shanghai land use map with the actual ellipsoidal area was 1.0000328, i.e., the error is about 0.00328%, which is far less than that of the interpretation made from remote sensing images.
Based on historical data, by changing the parameters or setting up an Excluded layer, the SLEUTH model can better predict the future urban growth and land use change. However, the SLEUTH model can’t simulate the effect of social and economic factors on urban land use [1]. To make up for this shortage, applying the SLEUTH model to simulate the future urban growth often introduces different scenarios modes, so as to provide a decision-making basis for urban development [38,45]. The two scenario modes put forward in this paper are different from the previous scenario modes, which are usually unprotected, light protected, moderate protected, and heavily protected modes [43,44]. Moreover, the rural residential land has not been brought into the scope of protection (Excluded layer) in the present study, which is another difference when compared with previous scenario modes. As the future rural population will reduce year by year, rural residential land should be reduced correspondingly.
Urbanization will profoundly change the structure, function, and form of the ecological landscape and land use of a region. Land use cover change has a significant effect on the ecosystem service value. However, except for the previously mentioned relationship between LUCC, and natural value and landscape value, there is little research on the relationship between LUCC and ecological service value. The ecological service value is a core index which can be measured to evaluate the sustainable development of a region, and is also critical to evaluate the ecological effect of LUCC. Based on the simulation results of the various types of land use in Shanghai obtained from the SLEUTH model and the Costanza’s method [71], in addition to other relevant researches [72,73,74,75,76,77,78,79,80], this paper examined the effects of LUCC on the ecological service value in Shanghai under two scenario modes.
The formula provided by Costanza et al. was used to calculate the ecological service value, as follows:
where , are the ecological service value of the ith type of land and the total ecological service value, respectively; is the area of the ith type of land; and is the value coefficient, which represents the service value per unit of area of the ith type of land. In this paper, the value coefficients adopt the research results of Xie et al. [79] and Jiang et al. [80].
In terms of the total value of ecological services, the ecological service value of the land resources of Shanghai was 11.812 billion yuan RMB in 2013. According to the simulation result, it can be predicted that the ecological service value of land resources in 2020 will be 11.502 and 11.738 billion yuan RMB under the natural growth mode and ecological priority mode, respectively. The total value of ecological services in the future land use of Shanghai under the two scenario modes demonstrates a decreasing trend at rates of 2.6% and 0.6%, respectively, because the construction land area will increase, while the scale of ecological land will be correspondingly reduced. Generally, the latter mode is better than the former one.
4. Conclusions and Suggestions
Based on the SLEUTH model, a land use cover change dynamic model of Shanghai is built, and two development scenario modes are constructed to forecast the construction land expansion boundary in Shanghai. The specific impacting effects on construction land expansion and the ecological service value of two scenario modes are analysed. The results show that Shanghai’s land use scale under the ecological priority mode was the most reasonable, and its total value of ecological services was higher than that of the natural growth scenario modes, which is beneficial to the protection and sustainable utilization of the land resources of Shanghai. Superficially, the increase of the scale of construction land will lead to the decrease of the scale of ecological land. But, in fact, the relationship between the two is not simply an increase or decrease. In the recent Shanghai City Master Plan (2015–2040) and The Thirteenth Five-year Plan of Shanghai National Economic and Social Development, the goal presented was that the strictly control of the total scale of construction land is to strengthen. The total scale of the construction land of Shanghai was 3124 km2 in 2014, will be no more than 3226 km2 by 2020, and will then further reduce to 3185 km2. Meanwhile, the gross scale of ecological land will increase from 3600 km2 in 2014 to 4364 km2 by 2040.
The main purpose of Shanghai to control the total amount of construction land is to reverse the traditional development mode, which demonstrates an over-reliance on investment drive and land scale expansion, to promote the conservation and intensive utilization of land resources through the replacement of the inefficient industrial land and urban renewal, and to optimize land use structure and industrial structure by means of scientific and technological innovation, so as to enhance land use efficiency, industrial competitiveness, and urban competitiveness. In other words, controlling the scale of construction land will not affect the sustainable development of Shanghai’s economy and society, achieving an urban development goal that does not have to increase the scale of construction land. In recent years, Shanghai has created the successful experience of land saving and intensive use, whose characteristic is “Five Quantity Controlling Strategies” (i.e., locking gross, diminishing increment, optimizing stock, beneficiating flow, improving quality), and made significant progress.
The distribution and growth of construction land in Shanghai is very slow in the ecological priority mode. Construction land growth mainly occurs towards the northwest of Shanghai (Jiading and Qingpu Districts), and the southwest (parts of Minhang), the southeast (Fengxian and parts of Pudong), and northwest of Chongming Island. The peripheral area of the central city is characterized by marginal growth, and the extension range is very small, while the central urban area and the inner suburban area experience continuous development, and the outer suburban area experiences widely distributed growth and is accompanied by a slow road growth.
Urban development, farmland protection, and ecological environment protection must be considered in the planning of urban land use in Shanghai, and the interplay between protection and development should be harmonized. If the current land development trend or economic priority development strategy is followed, the construction land will experience a rapid expansion at the severe expense of wetlands, green land, and arable land.
An ecologically liveable city is a city where the economy, society, culture, and ecological environment are harmoniously developed, and the living environment is comfortable, is able to meet the people’s material and spiritual needs, and is suitable for human work, life, and residence. Future development in Shanghai should focus on the protection of arable land, woodland, and water and other natural resources, and concentrate on optimizing the spatial pattern of urban land use and improving land use efficiency, so as to realize the goal of “production, living, and ecology” integrated development.
Acknowledgments
We are very grateful to the referees and the editors for their helpful suggestions. This paper is funded by the one of major research projects for Shanghai General Land Use Planning Revision (2015(D)-002(F)-11).
Author Contributions
All of the authors contributed to the work in the paper. Shi Yishao and Wu Jie designed the research and wrote the paper. Wu Jie participated in the graphics. Shi Shouzheng provided advice and suggestions and improved the language.
Conflicts of Interest
The authors declare no conflicts of interest.
References
- Clarke, K.C.; Hoppen, S.; Gaydos, L. A self-modifying Cellular Automaton Model of historical urbanization in the San Francisco Bay area. Environ. Plan. B 1997, 24, 247–261. [Google Scholar] [CrossRef]
- Solecki, W.D. Downscaling climate change scenarios in an urban land use change model. J. Environ. Manag. 2004, 72, 105–115. [Google Scholar] [CrossRef] [PubMed]
- Batisani, N.; Yarnal, B. Urban expansion in Centre County, Pennsylvania: Spatial dynamics and landscape transformations. Appl. Geogr. 2009, 29, 235–249. [Google Scholar] [CrossRef]
- Hua, L.; Tang, L.; Cui, S.; Yin, K. Simulating urban growth using the Sleuth Model in a coastal peri-urban district in China. Sustainability 2014, 6, 3899–3914. [Google Scholar] [CrossRef]
- Lu, S.; Guan, X.; He, C.; Zhang, J. Spatio-temporal patterns and policy implications of urban land expansion in metropolitan areas: A case study of Wuhan urban agglomeration, central China. Sustainability 2014, 6, 4723–4748. [Google Scholar] [CrossRef]
- Li, H.; Wei, Y.; Huang, Z. Urban land expansion and spatial dynamics in globalizing Shanghai. Sustainability 2014, 6, 8856–8875. [Google Scholar] [CrossRef]
- Alexander, P.; Rounsevella, M.D.A.; Dislich, C.; Dodson, J.R.; Engström, K.; Moran, D. Drivers for global agricultural land use change: The nexus of diet, population, yield and bioenergy. Glob. Environ. Chang. 2015, 35, 138–147. [Google Scholar] [CrossRef]
- Han, H.; Yang, C.; Song, J. Scenario simulation and the prediction of land use and land cover change in Beijing, China. Sustainability 2015, 7, 4260–4279. [Google Scholar] [CrossRef]
- Gao, J.; Wei, Y.; Chen, W.; Yenneti, K. Urban land expansion and structural change in the Yangtze River Delta, China. Sustainability 2015, 7, 10281–10307. [Google Scholar] [CrossRef]
- Bryan, B.A.; Nolan, M.; McKellar, L.; Connor, J.D.; Newth, D.; Harwood, T.; King, D.; Navarro, J.; Cai, Y.; Gao, L.; et al. Land-use and sustainability under intersecting global change and domestic policy scenarios: Trajectories for Australia to 2050. Glob. Environ. Chang. 2016, 38, 130–152. [Google Scholar] [CrossRef]
- Eitelberg, D.A.; Vlieta, J.; Doelmanb, J.C.; Stehfest, E.; Verburg, P.H. Demand for biodiversity protection and carbon storage as drivers of global land change scenarios. Glob. Environ. Chang. 2016, 40, 101–111. [Google Scholar] [CrossRef]
- Lavy, B.L.; Julian, J.P.; Jawarneh, R.N. The impact of past and future urban expansion on soil resources in central Arkansas, 1994–2030. Pap. Appl. Geogr. 2016, 2, 25–39. [Google Scholar] [CrossRef]
- Zhou, R.; Zhang, H.; Ye, X.; Wang, X.; Su, H. The delimitation of urban growth boundaries using the CLUE-S land-use change model: Study on Xinzhuang Town, Changshu City, China. Sustainability 2016, 8, 1182. [Google Scholar] [CrossRef]
- Liu, Y.; Hu, Y.; Long, S.; Liu, L.; Liu, X. Analysis of the effectiveness of urban land-use-change models based on the measurement of spatio-temporal, dynamic urban growth: A cellular automata case study. Sustainability 2017, 9, 796. [Google Scholar] [CrossRef]
- Liu, J.Y.; Deng, X.Z. Progress of the research methodologies on the temporal and spatial process of LUCC. Chin. Sci. Bull. 2009, 54, 3251–3258. (In Chinese) [Google Scholar] [CrossRef]
- Lu, N.C.; Huang, X.J.; Zuo, T.H.; Xiao, S.S.; Zhao, X.F.; Zhang, X.Y. Land use scenarios simulation based on CLUE-S and Markov composite model-A case study of Taihu Lake Rim in Jiangsu Province. Sci. Geogr. Sin. 2009, 29, 577–581. (In Chinese) [Google Scholar]
- Ren, Z.Y.; Li, J.; Zhou, Z.X.; Li, D.Y. Evaluation and Impacting Factors Analysis of the Effect of Land Use Change in southern Loess Plateau; Science Press: Beijing, China, 2013. (In Chinese) [Google Scholar]
- Xu, X.L.; Pang, Z.G.; Yu, X.F. Method and Application in Temporal and Spatial Information Analysis of Land Use Cover Change; Science and Technology Literature Press: Beijing, China, 2014. (In Chinese) [Google Scholar]
- Cai, Y.M.; Liu, Y.S.; Yu, Z.R.; Verburg, P.H. Progress in spatial simulation of land use change-CLUE-S model and its application. Prog. Geogr. 2004, 23, 63–71. (In Chinese) [Google Scholar]
- Couclelis, H. From cellular automata to urban models: New principles for model development and implementation. Environ. Plan. B 1997, 24, 165–174. [Google Scholar] [CrossRef]
- Clarke, K.C.; Gaydos, L.J. Loose-coupling a cellular automaton model and GIS: Long-term urban growth prediction for San Francisco and Washington/Baltimore. Int. J. Geogr. Inf. Sci. 1998, 12, 699–714. [Google Scholar] [CrossRef] [PubMed]
- Leao, S.; Bishop, I.; Evans, D. Simulating urban growth in a developing nation’s region using a cellular automata-based model. J. Urban Plan. Dev. 2004, 130, 145–158. [Google Scholar] [CrossRef]
- Castiglione, F. Agent based modeling. Scholarpedia 2006, 1, 1562. [Google Scholar] [CrossRef]
- Evans, T.P.; Kelley, H. Multi-scale analyses of a household level agent-based model of land cover change. J. Environ. Manag. 2004, 72, 57–72. [Google Scholar] [CrossRef] [PubMed]
- Parker, D.C.; Manson, S.M.; Janssen, M.A.; Hoffmann, M.J.; Deadman, P. Multi-agent systems for the simulation of land-use and land cover change: A review. Ann. Assoc. Am. Geogr. 2003, 93, 314–337. [Google Scholar] [CrossRef]
- Brown, D.G.; Page, S.; Riolo, R.; Zellner, M.; Rand, W. Path dependence and the validation of agent-based spatial models of land use. Int. J. Geogr. Inf. Sci. 2005, 19, 153–174. [Google Scholar] [CrossRef]
- Yeh, A.G.O.; Li, X. Simulation of development alternatives using neural networks, cellular automata, and GIS for urban planning. Photogramm. Eng. Remote Sens. 2003, 69, 1043–1052. [Google Scholar] [CrossRef]
- Xiang, W.N.; Clarke, K.C. The use of scenarios in land-use planning. Environ. Plan. B Plan. Des. 2003, 30, 885–909. [Google Scholar] [CrossRef]
- Foley, J.A.; DeFries, R.; Asner, G.P.; Barford, C.; Bonan, G.; Carpenter, S.R.; Chapin, F.S.; Coe, M.T.; Daily, G.C.; Gibbs, H.K.; et al. Global consequences of land use. Science 2005, 309, 570–574. [Google Scholar] [CrossRef] [PubMed]
- Foley, J.A.; Ramankutty, N.; Brauman, K.A.; Cassidy, E.S.; Gerber, G.S.; Johnston, M.; Mueller, N.D.; Connell, C.; Ray, D.K.; West, P.C.; et al. Solutions for a cultivated planet. Nature 2011, 478, 337–342. [Google Scholar] [CrossRef] [PubMed]
- Ramankutty, N.; Foley, J.A. Estimating historical changes in global land cover: Croplands from 1700 to 1992. Glob. Biogeochem. Cycles 1999, 13, 997–1027. [Google Scholar] [CrossRef]
- Amato, F.; Maimone, B.A.; Martellozzo, F.; Nolè, G.; Murgante, B. The effects of urban policies on the development of-urban areas. Sustainability 2016, 8, 297. [Google Scholar] [CrossRef]
- Amato, F.; Pontrandolfi, P.; Murgante, B. Supporting planning activities with the assessment and the prediction of urban sprawl using spatio-temporal analysis. Ecol. Inform. 2015, 30, 365–378. [Google Scholar] [CrossRef]
- Schroth, G.; da Fonseca, G.A.B.; Harvey, C.A.; Gaston, C.; Vasconcelos, H.L.; Izac, A.-M.N. Agroforestry and Biodiversity Conservation in Tropical Landscapes; Island Press: Washington, DC, USA, 2004. [Google Scholar]
- Becu, N.; Perez, P.; Walker, A.; Barreteau, O.; Le Page, C. Agent-based simulation of a small catchment water management in northern Thailand: Description of the CATCHSCAPE model. Ecol. Model. 2003, 170, 319–331. [Google Scholar] [CrossRef]
- Congedo, L.; Munafò, M.; Macchi, S. Investigating the Relationship between Land Cover and Vulnerability to Climate Change in Dar es Salaam. Working Paper, 4 April 2013; Sapienza University: Rome, Italy; Available online: http://www.planning4adaptation.eu (accessed on 4 April 2013).
- Silva, E.A.; Clarke, K.C. Calibration of the SLEUTH urban growth model for Lisbon and Porto, Portugal. Comput. Environ. Urban Syst. 2002, 26, 525–552. [Google Scholar] [CrossRef]
- Jantz, C.A.; Goetz, S.J.; Shelley, M.K. Using the SLEUTH urban growth model to simulate the impacts of future policy scenarios on urban land use in the Baltimore-Washington metropolitan area. Environ. Plan. B 2004, 31, 251–271. [Google Scholar] [CrossRef]
- Wu, X.Q.; Hu, Y.M.; He, H.S.; Bu, R.C.; Onsted, J.; Xi, F.M. Performance evaluation of the SLEUTH Model in the Shenyang Metropolitan Area of Northeastern China. Environ. Model. Assess. 2009, 14, 221–230. [Google Scholar] [CrossRef]
- Li, M.J.; Qian, L.X.; Wu, Z.F.; Cui, H.S.; Hou, X.Y. The SLEUTH model simulation of high density urban sprawl in Haizhu district of Guangzhou city. Act. Geogr. Sin. 2010, 65, 1163–1172. (In Chinese) [Google Scholar]
- Feng, W.W.; Xia, B.; Wu, X.Q.; Yang, B.L.; Feng, L.T.; Chen, H.S. Study on urban growth simulation of Dongguan city based on SLEUTH model. Geogr. Geo-Inf. Sci. 2008, 24, 76–79. (In Chinese) [Google Scholar]
- Zhang, Y.; Li, J.; Chen, Y.H. Simulation of Beijing urbanization using SLEUTH. Remote Sens. Appl. 2007, 2, 50–54. (In Chinese) [Google Scholar]
- Zhu, F.G.; Hu, H.W.; Shen, X.H.; Li, J.X. SLEUTH model-based prediction of urban growth of Shanghai. Chin. J. Ecol. 2011, 30, 2107–2114. (In Chinese) [Google Scholar]
- Cui, F.Q.; Xu, X.L.; Sun, X.H. Simulation and prediction of urban spatial expansion in Shanghai: A comparison of multiple models. Chin. J. Ecol. 2012, 31, 2703–2708. (In Chinese) [Google Scholar]
- Liu, Y. Using SLEUTH model to simulate and assess future scenarios of urban expansion. Econ. Geogr. 2009, 29, 1661–1664. (In Chinese) [Google Scholar]
- Tu, X.S.; Pu, L.J.; Wu, J.; Zhu, M. Using SLEUTH model to simulate land use change scenarios in Wuxi district. Resour. Environ. Yangtze Basin 2008, 17, 860–865. (In Chinese) [Google Scholar]
- Wu, W.; Zhou, S.L.; Wei, Y.H.; Liu, K.H.; Chen, J.L.; Guan, W.H. Scenario simulation and changes of urban growth patterns in central cities: A case study of Quanzhou, China. Geogr. Res. 2013, 32, 2041–2054. (In Chinese) [Google Scholar]
- Xu, J.; Luo, Z.D.; Yin, H.W.; Geng, L. Simulation of urban Expansion of Kunshan city based on SLEUTH model. Geogr. Geo-Inf. Sci. 2016, 32, 59–64. (In Chinese) [Google Scholar]
- Li, J.; Li, C.; Zhu, F.; Song, C.; Wu, J. Spatio-temporal pattern of urbanization in Shanghai, China between 1989 and 2005. Landsc. Ecol. 2013, 28, 1545–1565. [Google Scholar] [CrossRef]
- Yin, J.; Yin, Z.; Zhong, H.; Xu, S.; Hu, X.; Wang, J.; Wu, J. Monitoring urban expansion and land use/land cover changes of Shanghai metropolitan area during the transitional economy (1979–2009) in China. Environ. Monit. Assess. 2011, 177, 609–621. [Google Scholar] [CrossRef] [PubMed]
- Dai, X.; Guo, Z.; Zhang, L.; Wu, J. Spatio-temporal pattern of urban land cover evolvement with urban renewal and expansion in Shanghai based on mixed-pixel classification for remote sensing imagery. Int. J. Remote Sens. 2010, 31, 6095–6114. [Google Scholar] [CrossRef]
- Shi, L.J.; Wang, S.Y.; Yao, X.J.; Niu J, J.; Yu, L.Z. Spatial and temporal variation characteristics of land use and its driving force in Shanghai city from 1994 to 2006. Resour. Environ. Yangtze Basin 2012, 21, 1468–1479. (In Chinese) [Google Scholar]
- Yue, W.; Fan, P.; Wei, Y.D.; Qi, J. Economic development, urban expansion, and sustainable development in Shanghai. Stoch. Environ. Res. Risk Assess. 2014, 28, 783–799. [Google Scholar] [CrossRef]
- Zhang, Y.; Chen, Z.; Cheng, Q.; Zhou, C.; Jiang, P.; Li, M.; Chen, D. Quota Restrictions on Land Use for Decelerating Urban Sprawl of Mega City: A Case Study of Shanghai, China. Sustainability 2016, 8, 968. [Google Scholar] [CrossRef]
- Zeng, C.; Yang, L.; Dong, J. Management of urban land expansion in China through intensity assessment: A big data perspective. J. Clean. Prod. 2017, 153, 637–647. [Google Scholar] [CrossRef]
- Shi, L.; Shao, G.; Cui, S.; Li, X.; Lin, T.; Yin, K.; Zhao, J. Urban three-dimensional expansion and its driving forces—A case study of Shanghai, China. Chin. Geogr. Sci. 2009, 19, 291–298. [Google Scholar] [CrossRef]
- Lin, Y.; Wu, M. Urbanization, land development, and land financing: Evidence from Chinese cities. J. Urban Aff. 2014, 36, 354–368. [Google Scholar]
- Li, H.; Wei, Y.; Liao, H.; Huang, Z. Administrative hierarchy and urban land expansion in transitional China. Appl. Geogr. 2015, 56, 177–186. [Google Scholar] [CrossRef]
- Cheng, L.; Li, F.; Deng, H.F. Dynamics of land use and its ecosystem services in China’s megacities. Acta Ecol. Sin. 2011, 31, 6194–6203. (In Chinese) [Google Scholar]
- Zhou, Y.; Huang, X.J.; Xu, G.L.; Li, J.B. The coupling and driving forces between urban land expansion and population growth in Yangtze River Delta. Geogr. Res. 2016, 35, 313–324. (In Chinese) [Google Scholar]
- Quan, Q.; Tian, G.J.; Sha, M.Q. Dynamic simulation of Shanghai urban expansion based on multi-agent system and cellular automata models. Acta Ecologica Sinica 2011, 31, 2875–2887. (In Chinese) [Google Scholar]
- Zhao, S.; Da, L.; Tang, Z.; Fang, H.; Song, K.; Fang, J. Ecological consequences of rapid urban expansion: Shanghai, China. Front. Ecol. Environ. 2006, 4, 341–347. [Google Scholar] [CrossRef]
- Wei, Y.; Ye, X. Urbanization, urban land expansion and environmental change in China. Stoch. Environ. Res. Risk Assess. 2014, 28, 757–765. [Google Scholar] [CrossRef]
- Wang, J.; Gao, W.; Gao, Z.; Yin, J.; Xu, S. Urban Expansion and Landscape Diversity Change of Shanghai City, China. In Remote Sensing and Modeling of Ecosystems for Sustainability VII; Gao, W., Jackson, T.J., Wang, J., Eds.; Society of Photo-Optical Instrumentation Engineers: Bellingham, WA, USA, 2010. [Google Scholar]
- Li, Y.; Ye, J.; Chen, X.; Abdel-Atype, M.A; Cen, M. Transportation characteristics change under rapid urban expansion: A case study of Shanghai. Chin. Geogr. Sci. 2010, 20, 554–561. [Google Scholar] [CrossRef]
- Peng, B.F.; Shi, Y.S.; Wang, H.F.; Wang, Y.L. The impacting mechanism and laws of function of urban heat islands effect: A case study of Shanghai. Acta Geogr. Sin. 2013, 68, 1461–1471. (In Chinese) [Google Scholar]
- Hua, W.; Zhao, F. Metropolitan expansion and intensification of land use—Study on the model of urban development for Shanghai. Res. Environ. Yangtze Basin 1998, 7, 193–197. (In Chinese) [Google Scholar]
- Liang, S.M.; Le, T.T. Research on built up area expansion in major cities and suburban cultivated land protection. Environ. Prot. 2005, 11, 59–63. (In Chinese) [Google Scholar]
- Guo, J.X.; Hu, X.M. The study on the LUCC of Shanghai from 1987 to 2007. J. Shanghai Norm. Univ. 2010, 39, 105–110. (In Chinese) [Google Scholar]
- He, J. From concentrated construction area to urban development boundary: A study of spatial administration of land planning in Shanghai. Shanghai City Plan. 2015, 5, 81–86. (In Chinese) [Google Scholar]
- Costanza, R.; d’Arge, R.; de Groot, R.; Farber, S.; Grasso, M.; Hannon, B.; Limburg, K.; Naeem, S.; O’Neill, R.V.; Paruelo, J.; et al. The value of the world’s ecosystem services and natural capital. Nature 1997, 387, 253–260. [Google Scholar] [CrossRef]
- Batabyal, A.A.; Kahn, J.R.; O’Neill, R.V. On the scarcity value of ecosystem services. J. Environ. Econ. Manag. 2003, 46, 334–352. [Google Scholar] [CrossRef]
- Cao, Y.G.; Zhou, W.; Yuan, C. Regional ecosystem service value based on land use change. Bull. Soil Water Conserv. 2010, 30, 241–246. (In Chinese) [Google Scholar]
- Daily, G.C. Nature’s Services: Societal Dependence on Natural Ecosystems; Island Press: Washington, DC, USA, 1997. [Google Scholar]
- Daisy, N.; Nahuelhual, L.; Oyarzún, C. Forests and water: The value of native temperate forests in supplying water for human consumption. Ecol. Econ. 2006, 58, 606–616. [Google Scholar]
- Li, W.H. Theory, Method and Application of Value Assessment of Ecosystem Services; China People’s University Press: Beijing, China, 2008. (In Chinese) [Google Scholar]
- Millennium Ecosystem Assessment. Ecosystems and Human Wellbeing: Biodiversity Synthesis; Island Press: Washington, DC, USA, 2005. [Google Scholar]
- Per, B.; Sven, H. Ecosystem services in urban areas. Ecol. Econ. 1999, 29, 293–301. [Google Scholar]
- Xie, G.D.; Zhen, L.; Lu, C.X.; Xiao, Y.; Chen, C. Expert knowledge based valuation method of ecosystem services in China. Resour. Sci. 2008, 30, 911–919. (In Chinese) [Google Scholar]
- Jiang, J.; Tian, G.J. Response of ecosystem service value to land use change in Beijing from 1998 to 2005. Resour. Sci. 2010, 32, 1407–1416. (In Chinese) [Google Scholar]
Figure 1.
The structure of the SLEUTH model.
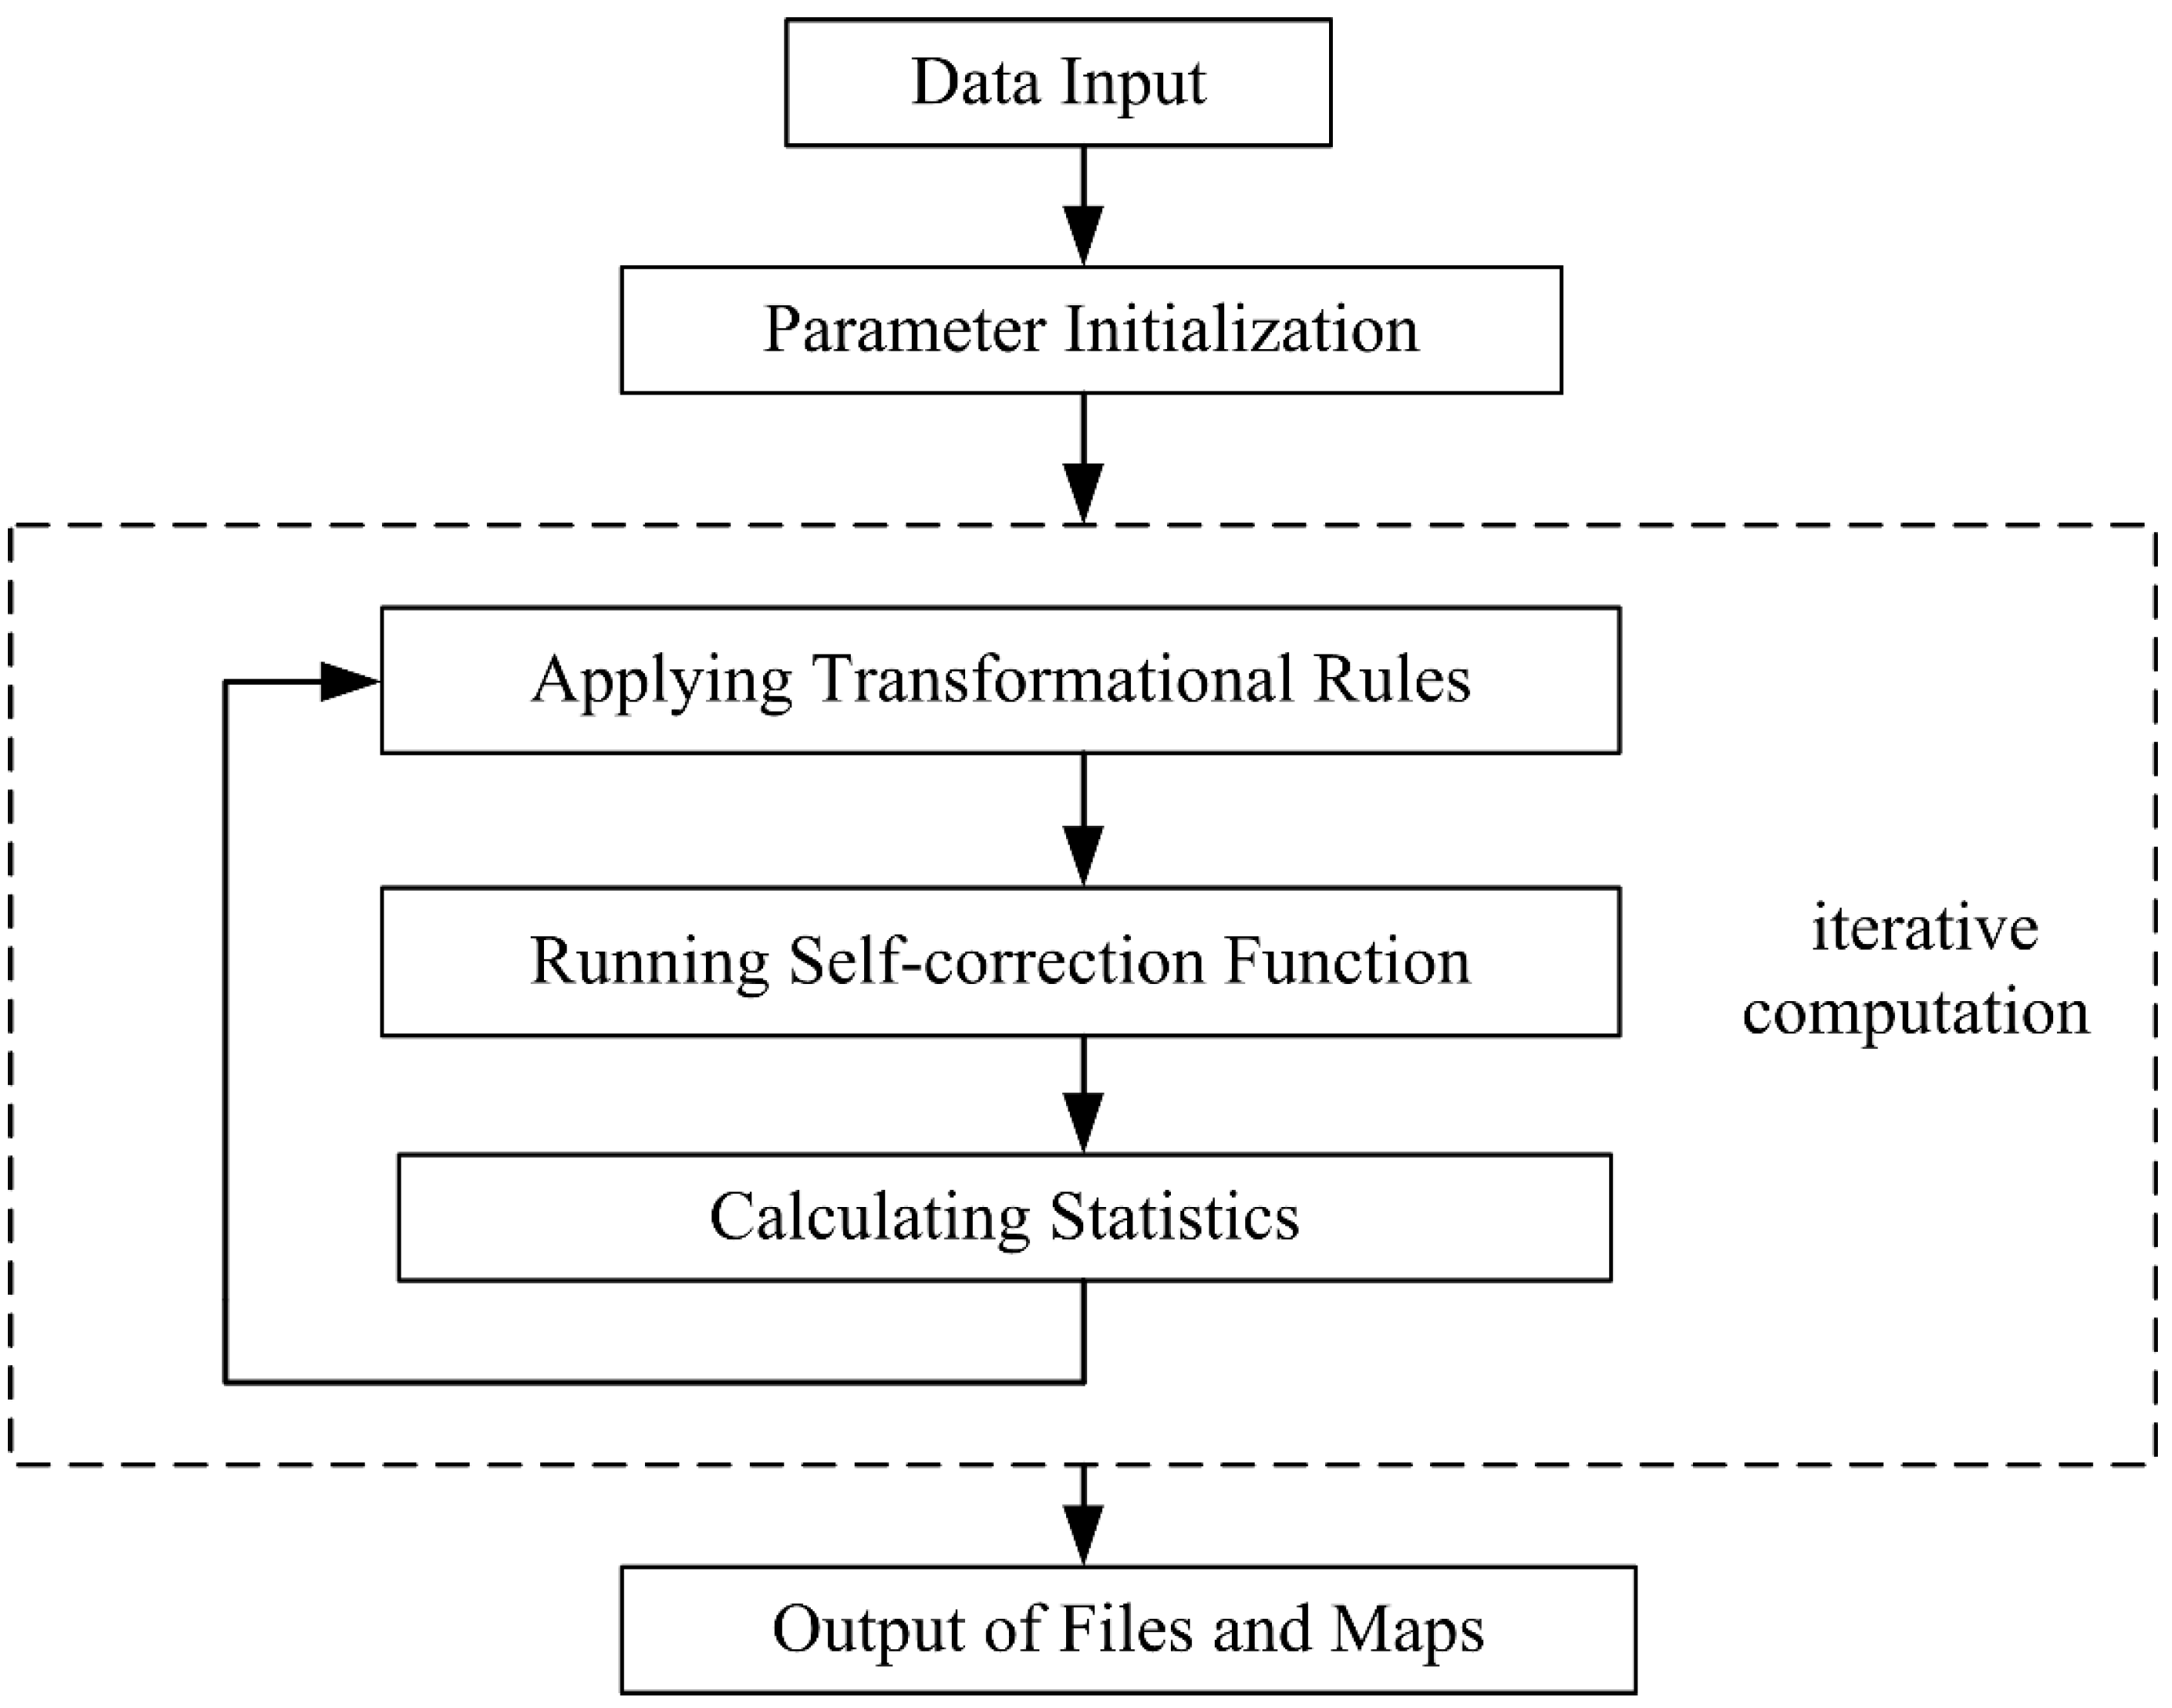
Figure 2.
Shanghai land use layers in 2009 and 2013.
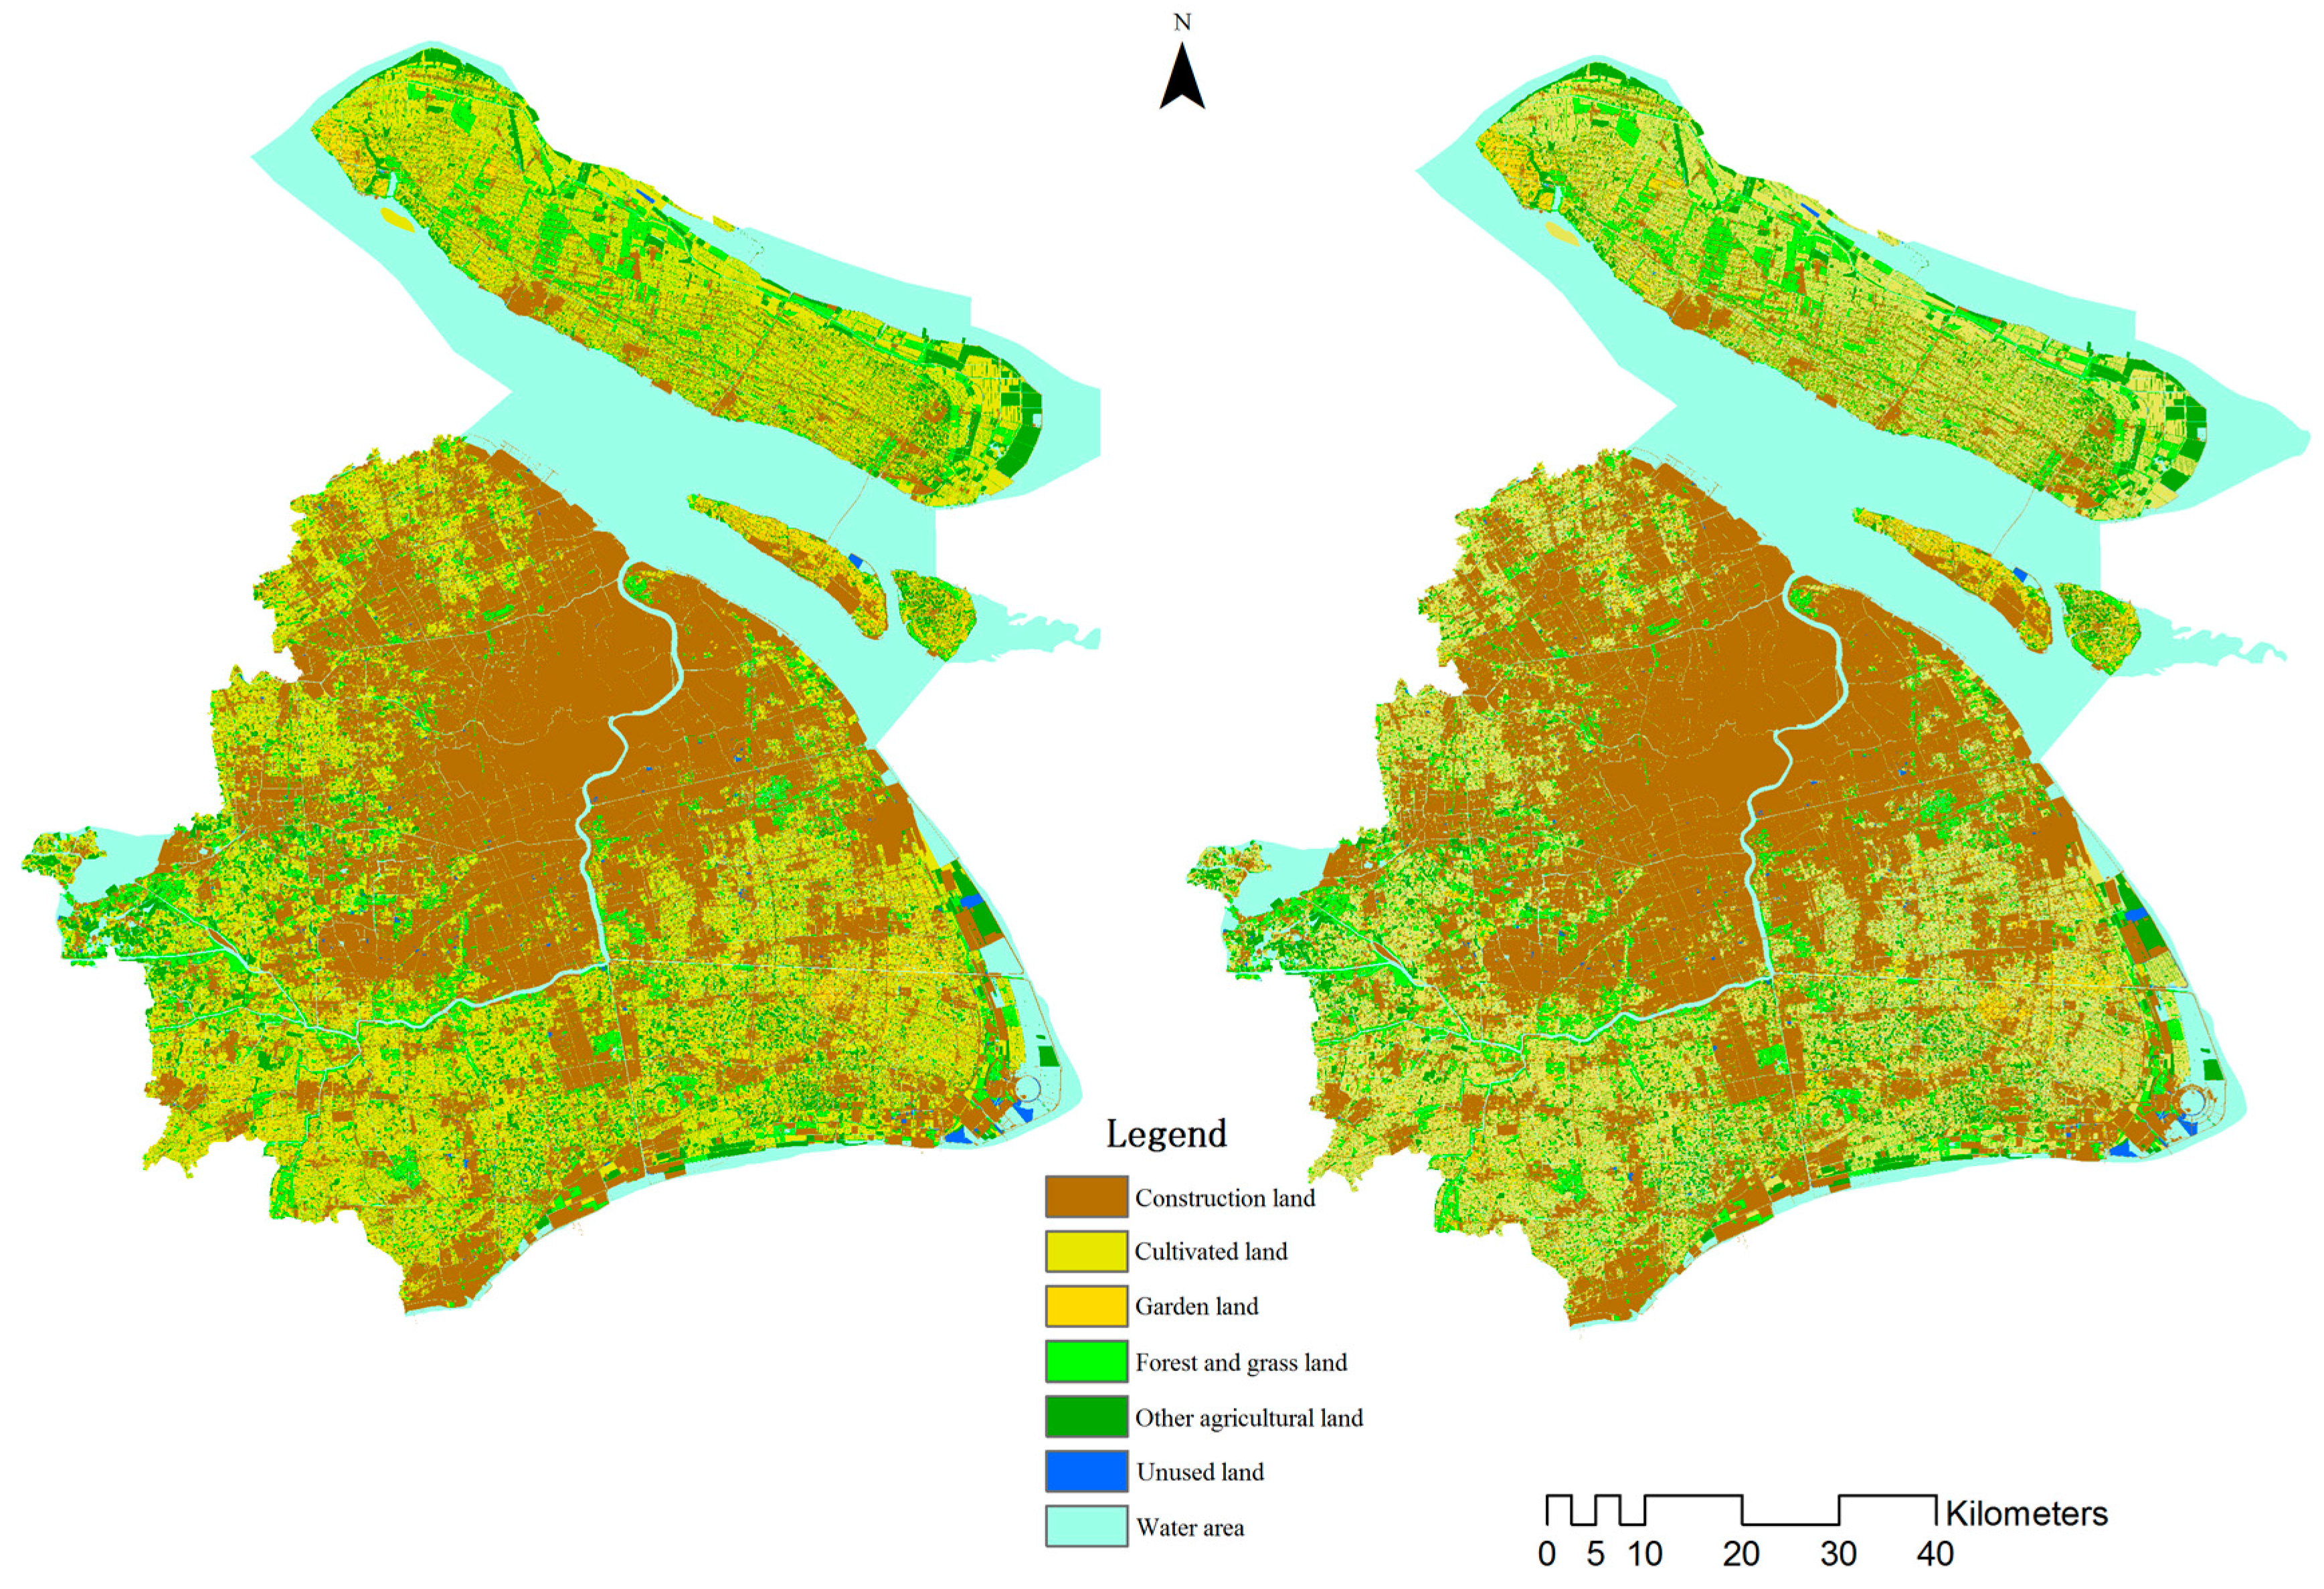
Figure 3.
Implementation of the SLEUTH model.

Figure 4.
Shanghai construction land expansion boundaries under the natural growth mode.

Figure 5.
Shanghai construction land expansion boundaries under the ecological priority mode.

Figure 6.
Changes in Shanghai land use types during 2013–2020 under the two scenario modes.

Table 1.
Land use types corresponding to the input gray-scale value.
| Land Use Types | Unused Land | Construction Land | Cultivated Land | Garden Plot | Forest and Grassland | Water Area | Other Agricultural Land |
|---|---|---|---|---|---|---|---|
| Input gray-scale value | 0 | 1 | 2 | 3 | 4 | 5 | 6 |
Table 2.
Calibration coefficients for model calibration.
| Growth Coefficient of Model | Coarse Calibration | Fine Calibration | Final Calibration | Optimal Coefficient | |||
| Number of Monte Carlo iterations = 4 | Number of Monte Carlo iterations = 6 | Number of Monte Carlo iterations = 10 | |||||
| Number of iteration cycle = 3250 | Number of iteration cycle = 7765 | Number of iteration cycle = 3756 | |||||
| Lee-Sallee index = 0.62836 | Lee-Sallee index = 0.64530 | Lee-Sallee index = 0.61244 | |||||
| Range | Step | Range | Step | Range | Step | ||
| Dispersion coefficient | 0–100 | 25 | 25–75 | 10 | 55–75 | 4 | 22 |
| Breed coefficient | 0–100 | 25 | 25–70 | 9 | 25–43 | 4 | 41 |
| Spread coefficient | 0–100 | 25 | 25–75 | 10 | 55–70 | 4 | 19 |
| Slope coefficient | 0–100 | 25 | 0–20 | 5 | 0–5 | 1 | 1 |
| Road gravity coefficient | 0–100 | 25 | 25–70 | 9 | 25–40 | 4 | 34 |
Table 3.
Land use scale prediction in Shanghai in 2020 (unit: ha).
| 2013 | 2020 | ||
|---|---|---|---|
| Mode I | Mode II | ||
| Cultivated land | 231,170.9 | 207,839.5 | 230,290.5 |
| Garden plot | 10,326.3 | 9284.1 | 10,247.6 |
| Forestry and grassland | 20,645.9 | 18,562.2 | 19,039.6 |
| Other agricultural land | 60,509.2 | 54,402.2 | 58,143.8 |
| Construction land | 295,066.4 | 327,898 | 301,260.9 |
| Unused land | 2647.9 | 2380.6 | 1384.2 |
| Water area | 192,981.4 | 192,981.4 | 19,2981.4 |
© 2017 by the authors. Licensee MDPI, Basel, Switzerland. This article is an open access article distributed under the terms and conditions of the Creative Commons Attribution (CC BY) license (http://creativecommons.org/licenses/by/4.0/).
Share and Cite
MDPI and ACS Style
Shi, Y.; Wu, J.; Shi, S. Study of the Simulated Expansion Boundary of Construction Land in Shanghai Based on a SLEUTH Model. Sustainability 2017, 9, 876. https://doi.org/10.3390/su9060876
AMA Style
Shi Y, Wu J, Shi S. Study of the Simulated Expansion Boundary of Construction Land in Shanghai Based on a SLEUTH Model. Sustainability. 2017; 9(6):876. https://doi.org/10.3390/su9060876
Chicago/Turabian StyleShi, Yishao, Jie Wu, and Shouzheng Shi. 2017. "Study of the Simulated Expansion Boundary of Construction Land in Shanghai Based on a SLEUTH Model" Sustainability 9, no. 6: 876. https://doi.org/10.3390/su9060876
Note that from the first issue of 2016, this journal uses article numbers instead of page numbers. See further details here.