Enhancing the Sustainability Narrative through a Deeper Understanding of Sustainable Development Indicators


1
State Key Joint Laboratory of Environment Simulation and Pollution Control, School of Environment, Beijing Normal University, Beijing 100875, China
2
Beijing Engineering Research Center for Watershed Environmental Restoration & Integrated Ecological Regulation, Beijing 100875, China
3
Center for Environmental Policy, Environmental Engineering Sciences, University of Florida, Gainesville, FL 32611, USA
4
University of Naples ‘Parthenope’, Centro Direzionale, Isola C4, 80143 Naples, Italy
*
Author to whom correspondence should be addressed.
Sustainability 2017, 9(6), 1078; https://doi.org/10.3390/su9061078
Submission received: 15 April 2017
/
Revised: 11 June 2017
/
Accepted: 12 June 2017
/
Published: 21 June 2017
(This article belongs to the Section Environmental Sustainability and Applications)
Abstract
:Different sustainability indicators tend to reflect different or even converse outcomes in terms of countries. A careful comparative study is needed to clarify whether these indicators are actually coherent with each other. We analyze and compare five sustainable development indicators. Pearson correlation was used to make a comparative study among them. Within the two groups, the indicators are positively correlated. The Sustainable Development Index (SDI) of the second group also shares a negative correlation with the Human Development Index. On the other side, the Emergy Sustainability Index was negatively correlated with the Environmental Performance Index, and had little or no correlation with the Environmental Sustainability Index. Furthermore, when examining the scores obtained from the different SDIs, the results demonstrate that they might present somewhat conflicting findings, if not considering their complementarity. This, from one side, depends on the fact that Human Development Index (HDI), Environmental Performance Index (EPI), and Environmental Sustainability Index (ESI) provide a short-term local perspective on “sustainability”, while the Emergy-based Sustainability Index (EmSI) and Surplus Biocapacity are more long-term and global in their perspective. HDI, EPI, and ESI have a more social and economic focus, including indicators whose dynamics are disjoined from the natural one. The emerging differences might be explained through the analysis of the individual sub-indicators for each of the SDIs.
1. Introduction
1.1. The Ecology of Sustainability
Ecologists, unlike economists, whose models provide no upper bound on economic growth, are accustomed to the idea of limits of development. Natural systems exist subject to the unyielding laws of thermodynamics, whose implications for living organisms were explored [1]. Industrialization, as a dominant development paradigm of the past two centuries, is not sustainable as an approach to development of either natural or human resources [2]. In fact, industrial systems are inherently extractive, exploitative, and ultimately dependent upon finite stocks of non-renewable resources. Furthermore, industrial systems will eventually degrade and deplete the resources upon which their productivity depends.
Industrialization is the physical manifestation of a specific philosophy of economics, the concept of science and worldview. Thus, the conceptual foundation of social-economic systems oriented to the requirements of ecosystem integrity and species diversity should be deepened before planning a sustainable system. Such a goal can be reached if both the system under study and the observable variables to measure and a set of meaningful indicators are univocally defined and used.
In parallel with such an axiomatization process, a reference framework must be defined. Sustainability, as a reference framework, has gained widespread acceptance in environmental political theory as an optimal conceptual and practical mechanism for encouraging mutually beneficial interactivity between three distinct systems—the economy, society, and the environment [3,4]. Introduced by the Brundtland Commission in 1987, sustainability means meeting the current needs of society in ways that enable future generations to meet their own needs [5]. Since then, wide expansion of the use of “sustainability” has helped to spread the concept even further. For instance, the concept of sustainable development (actually, according to [6]), sustainability and sustainable development could be used interchangeably) emerged in the early and mid-1980s [5,7,8] as an attempt to bridge the gap between environmental concerns about the increasingly evident ecological consequences of human activities and socio-political concerns about human development issues [9]. This view of sustainability parallels and differs from the human-centered conceptions put forward by the World Commission on Environment and Development and the consumption-based principles proposed by economic theorists.
A first action plan for a transition to sustainability was introduced at the 1992 United Nations Conference on Earth and Development in Rio de Janeiro, Brazil as Agenda 21. Its basic requirement was a transition to less materialistic values and lifestyles [10]. Later, the 2005 World Summit on Social Development identified sustainable development goals [11]: economic development; social development; environmental protection. These are also known as the three pillars of sustainability. The simple availability of various information sources gradually increased the spread of sustainability terms and their definitions, as employed by different authors and organizations [12].
In December 2014, the United Nations (UN) Secretary General published his report on the SDGs. However, the final goals and targets that were adopted by the UN General Assembly in September 2015 risk not meeting the expectations, because of what we call “cockpit-ism”: the illusion that top-down steering by governments and intergovernmental organizations alone can address global problems [13]. Some researchers argued that sustainable development has a meta-ethical foundation, a definition of right and wrong paths stemming from what one might consider a Universal Truth, that is humanity’s desire to survive and economic development [14]. This would imply that there cannot be a close relationship between economic efficiency and ecological sustainability. Nonetheless, an integration of economics and ecology is still required.
1.2. The Sustainable Development Indicators
Sustainable development indicators were produced for various purposes by a wide spectrum of institutions [15,16], leading to diverse approaches. Hopwood et al. emphasized that there is a fundamental divide on indicators selection between reformers and transformationists in their concept of and approach to sustainable development [17]. The reformers prefer those indicators, which change through management—top-down and incremental—of the existing structures of decision-making. The transformationists view is that change will occur mainly through political action, working both in and outside the existing structures. Hopwood et al. proposed that the sustainable development discourse at present is dominated by the managerial outlook [17].
Developing an adequate set of indicators and a more consistent sustainability metrology for a community, a country, or the world is not easy. It requires understanding about the level of viability of the systems involved and their contribution to sustainable development. An “anything-goes-mentality” measure [18], as well as a simple “feel-good-sustainability” one [19], are counterproductive to all serious sustainability efforts. For example, sustainability is measured by the United Nations or European Union by means of economic, social, environmental, and institutional indicators (United Nations Division for Sustainable Development. Indicators of sustainable development. See also: <http://www.un.org/esa/sustdev/natlinfo/indicators/isdms2001/table_4.htm>). Nearly all governments have committed themselves to sustainable development by integrating economic welfare, environmental quality, and social coherence [20]. Additionally, researchers monitor various indicators of ecological, economic, and social conditions to compare well-being and progress toward sustainability among nations (Emergy Accounting of the Resource Basis of Nations, Human Well-being and International Debt. See also: http://www.cep.ees.ufl.edu/emergy/documents/dissertations_theses/Devincenzo-king_2006_EmergyResourceBasisNations_Wellbeing_IntlDebt_Thesis-UF.pdf). Such comparisons are significant, because they can direct corresponding policies and effective actions toward better life conditions. Finally, a rapid expansion in the development and use of complex analytical tools (mainly built as aggregations of a suitable number of indicators) is presently supporting both environmental policy development and management decisions.
For more than a decade, the United Nations Development Programme (UNDP) has published the Human Development Index (HDI), which has generated diverse responses from experts (e.g., [21,22,23]), national media (e.g., [24]), and policymakers (e.g., [25,26]). The HDI is a measure of a country’s average achievement in human development, based on a long and healthy life (life expectancy at birth), knowledge (adult literacy rate and gross school enrollment ratio), and standard of living (Gross Domestic Product per capita). Countries are given a score in each of the three categories. These scores are, then, averaged to determine the HDI. The higher a country’s HDI, the higher its level of human development [27]. The UN maintains that the HDI is meant to provide a summary measure, not a comprehensive one, of human development by measuring average achievement.
The Environmental Performance Index (EPI; [28]) focuses on two overarching environmental objectives: (i) reducing environmental stresses to human health, and (ii) promoting ecosystem vitality and sound natural resource management. They are gauged using 25 performance indicators tracked in six policy categories, which are then combined to create a final score. By identifying specific targets and measuring the distance between the target and current national achievement, the EPI provides both an empirical foundation for policy analysis and a context for evaluating performance.
The Environmental Sustainability Index (ESI) is a composite index targeting environmental, socioeconomic, and institutional indicators as a means to assess sustainability. The ESI incorporates 20 indicators, each of which combines two to eight variables [29]. First published in 2001, it has seen increasing popularity in the popular media [20,21,22,23,24,25,26,27,28,29,30,31]. Values of the ESI for each country vary between 0 (most unsustainable) and 100 (most sustainable) [32].
The Ecological Footprint (EF; [33]) is perhaps the most referenced sustainability indicator in the current literature [34,35,36]. It provides a quantitative assessment of the biologically productive area (the amount of land surface) required to produce the necessary resources (food, energy, and materials) and to absorb the wastes for a given population [37]. In this study, we use Surplus Biocapacity (SB), an index developed by the Ecological Footprint network. Biocapacity measures the area of biologically productive land, defined on the basis of its environmental boundary conditions, which influence its productivity—actually available to provide renewable natural resources and absorb CO2 waste. Surplus Biocapacity is, therefore, biocapacity that exceeds the Ecological Footprint. The units of biocapacity are global hectares (gha), where 1 gha represents the productive capacity of 1 hectare of land at world average productivity.
Environmental accounting using emergy, which merges biophysical and economic accounting through specific indices, can be a systematic method of measuring the mutual influence between environmental and economic systems, reporting them to decision makers in terms of one common “currency”. The currency is emergy, which is the computation of available energy directly and indirectly involved in a process, starting from the formation to the transformation of resources and also including the required human labor and information [38,39,40]. Based on systems theory, the conceptual framework of emergy is both holistic and atomistic, combining both the representation of whole systems, having large time and special scales, with reductionist study of its parts and elements at smaller time and spatial scales.
The emergy-based sustainability index (EmSI) is a global index of sustainability used to assess the status of systems, combining concepts of socio-economic yield and environmental impact as shown below:
where EYR is the emergy yield ratio, and ELR is the environmental loading ratio [41,42]. In earlier publications, ESI was used as an abbreviation of Emergy Sustainability Index [41,43]. Brown et al. later used EmSI in their research paper to avoid the confusion with respect to ESI, the composite index tracking 21 elements of environmental sustainability [44], which was created through the joint initiative of the Yale Center for Environmental Law and Policy (YCELP) and the Center for International Earth Science Information Network (CIESIN) of Columbia University, in collaboration with the World Economic Forum and the Directorate-General Joint Research Centre (European Commission).
EmSI = EYR/ELR
The emergy approach is increasingly being applied to different systems. It scales from individual production processes to whole economies [45], both providing a comprehensive view of the interactions between economic growth and the environment and contributing to economic and environmental policy making. Of relevance to this study, emergy and the EmSI were applied at different spatial scales: the city/region ones [46,47,48,49,50]; the national one [44,51,52,53,54,55,56]; the global one [57,58].
The main characteristics of the five sustainability indicators chosen for this study are shown in Table 1.
It is worth mentioning that only integrated indicators, where more than one dimension of sustainability is aggregated, were selected for this study. Thus, for example, the International Union for Conservation of Nature (IUCN) Barometer of Sustainability [61] was not included in our analysis. In fact, this is a two-axes structural analysis program, that assesses sustainable development and provides a comprehensive method for measuring the state of sustainable development at national level. On the other hand, both the Index of Sustainable Economic Welfare (ISEW, [62]) and the Environmental Sustainability Index (ESI) move beyond economic accounting, encompassing numerous nature–society dimensions. ESI, in particular, aggregates 68 indicators from five categories of mostly environmental sustainability aspects, but also from social and institutional dimensions. ESI is selected in this study based on the data availability of all the countries.
1.3. Interpreting Sustainability
Interpretations of the sustainability concept can be very different across the various disciplines, often assuming that a sustainable system is simply the one that survives or persists over others. Biologically, sustainability means the property of biological systems to remain diverse and productive indefinitely [63]. Long-lived and healthy wetlands and forests are examples of sustainable biological systems. Economically, sustainability interfaces with economics through the social and ecological consequences of economic activity [64]. Sustainability economics represents: “...a broad interpretation of ecological economics where environmental and ecological variables and issues are basic but part of a multidimensional perspective. Social, cultural, health-related and monetary/financial aspects have to be integrated into the analysis.” [65,66]. On the other hand, social sustainability emphasizes living in ways that can be sustained because they are healthy and satisfying for people and communities [67]. Thus, “sustainability’’ lacks a clear and distinct meaning due to its intrinsic multidimensional nature. There are no exact limits in defining sustainability. Instead, the border between sustainable and unsustainable is fuzzy, meaning that it is often not possible to determine the exact reference values for what is sustainable and what is not [68].
In addition to its vague nature, the concept of sustainability, in general, suffers from a short-term outlook. In fact, the processes, that make a society sustainable or prone to collapse, develop over long time periods, typically stretching to generations or centuries [69]. It is difficult to discern, let alone comprehend, these processes within a single lifespan. Tainter suggests that statements about sustainability should be based on long-term observations, while those, that are not, should be considered somewhat suspect [70]. Thus, it is not surprising that different sustainability indicators, when applied to countries, tend to reflect different or even converse outcomes, partly because sustainability is an interdisciplinary concept and assessing it requires a combination of economic and ecological analyses [71]. Another reason is that sustainability is fraught with ambiguity and uncertainty (e.g., [72]). These elements potentially lead to results and conclusions that inevitably confuse learners, researchers, planners, decision makers, and politicians.
A further problem derives from the intrinsic difference among the available indicators. For example, the EPI results of countries [28] view the sustainability covering both environmental public health and ecosystem vitality have the exact opposite perspective to the SB (Surplus Biocapacity) of countries [29,73]. Just as Bradshaw et al. propose in their paper, “Most indices also incorporate (often arbitrarily) indicators of human health and economic performance, so the emphasis on the environmental component is diluted or confounded” [74]. Additionally, aggregated indices, such as the ESI, are criticized for their subjective methodology and for combining too many disparate variables [31], thereby masking more relationships than they reveal. Indeed, as the literature suggests [30], the nature of the data which composes the ESI gives an unmerited sustainability credit to developed countries and may not be exclusively measuring environmental sustainability, as its name suggests. Likewise, while aggregation of data to produce indicators is necessary, critics suggest that aggregations can be arbitrary and misleading [75].
The concept of sustainable development represents a shift in understanding of humanity’s place on the planet, but it is open to interpretation of being anything from almost meaningless to of extreme importance to humanity. Whatever view is taken, it is clearly an area of contention [17]. Whilst recognizing the deep debates and ambiguities about the meaning of sustainable development, this paper analyzes the status of 100 countries using five different sustainability indices: EF, EPI, ESI, HDI, and EmSI, considering the many concerns associated with the use of different indicators of sustainability, which often provide apparent contradictory outcomes.
The first goal of this paper is to move a step forward in the direction of removing such contradictions. We, then, compare the results of the chosen analytical tools, by ranking the top 10 and bottom 10 countries derived from the result of the chosen indices. Then, the data are compared through Pearson correlation to highlight the existing interdependences and differences.
2. Data and Methods
2.1. Data Sources
The latest available data for the country evaluation of sustainability, using EF, EPI, ESI and HDI, were taken from published sources. EF data (we used Surplus BioCapacity) were from [73]. EPI data were from the 2008 Environmental Performance Index [28] and ESI data were taken from the 2005 Environmental Sustainability Index: Benchmarking National Environmental Stewardship (http://www.yale.edu/esi/). HDI data were taken from the study of [74]. Data for the EmSI were derived from the National Environmental Accounting Database (NEAD) website [76]. The NEAD currently provides emergy data for 134 countries worldwide for three distinct years (2000, 2004 and 2008). The NEAD can be found at the following URL: (http://www.cep.ees.ufl.edu/emergy/nead.shtml). Some missing data in the NEAD constrained the number of countries that could be analyzed in this study. Consequently, the final number of selected countries was 100, the populations of which accounts for 83.41% of the total world population. In the case of ESI, the latest available dataset, relative to year 2005, was considered, since more recent and complete data were not available for this indicator. Nonetheless, this problem is overcome using ranking and coherency instead of absolute values, which would have limited the value of our analysis.
2.2. Analysis Methods
The ranking method is a known effective way to compare data which has been used in multiple studies (e.g., [20,44,77,78,79,80]). In this paper, the process was implemented using the “RANK” function in Microsoft Excel®. In particular, we ranked the computed sustainability indices for the 100 different selected countries. The main reason for ranking, rather than using the actual values, is to remove the adverse effects caused by extremes. It needs to be noted that the computed values increase as the corresponding ranking values approach 1, for instance, a nation with the highest sustainability index value has a rank of 1; while the nation with the lowest value has a rank of 100. Pearson correlation was also used for correlation analysis.
3. Results
3.1. Ranks of HDI, EPI, ESI, SB, and EmSI of Countries
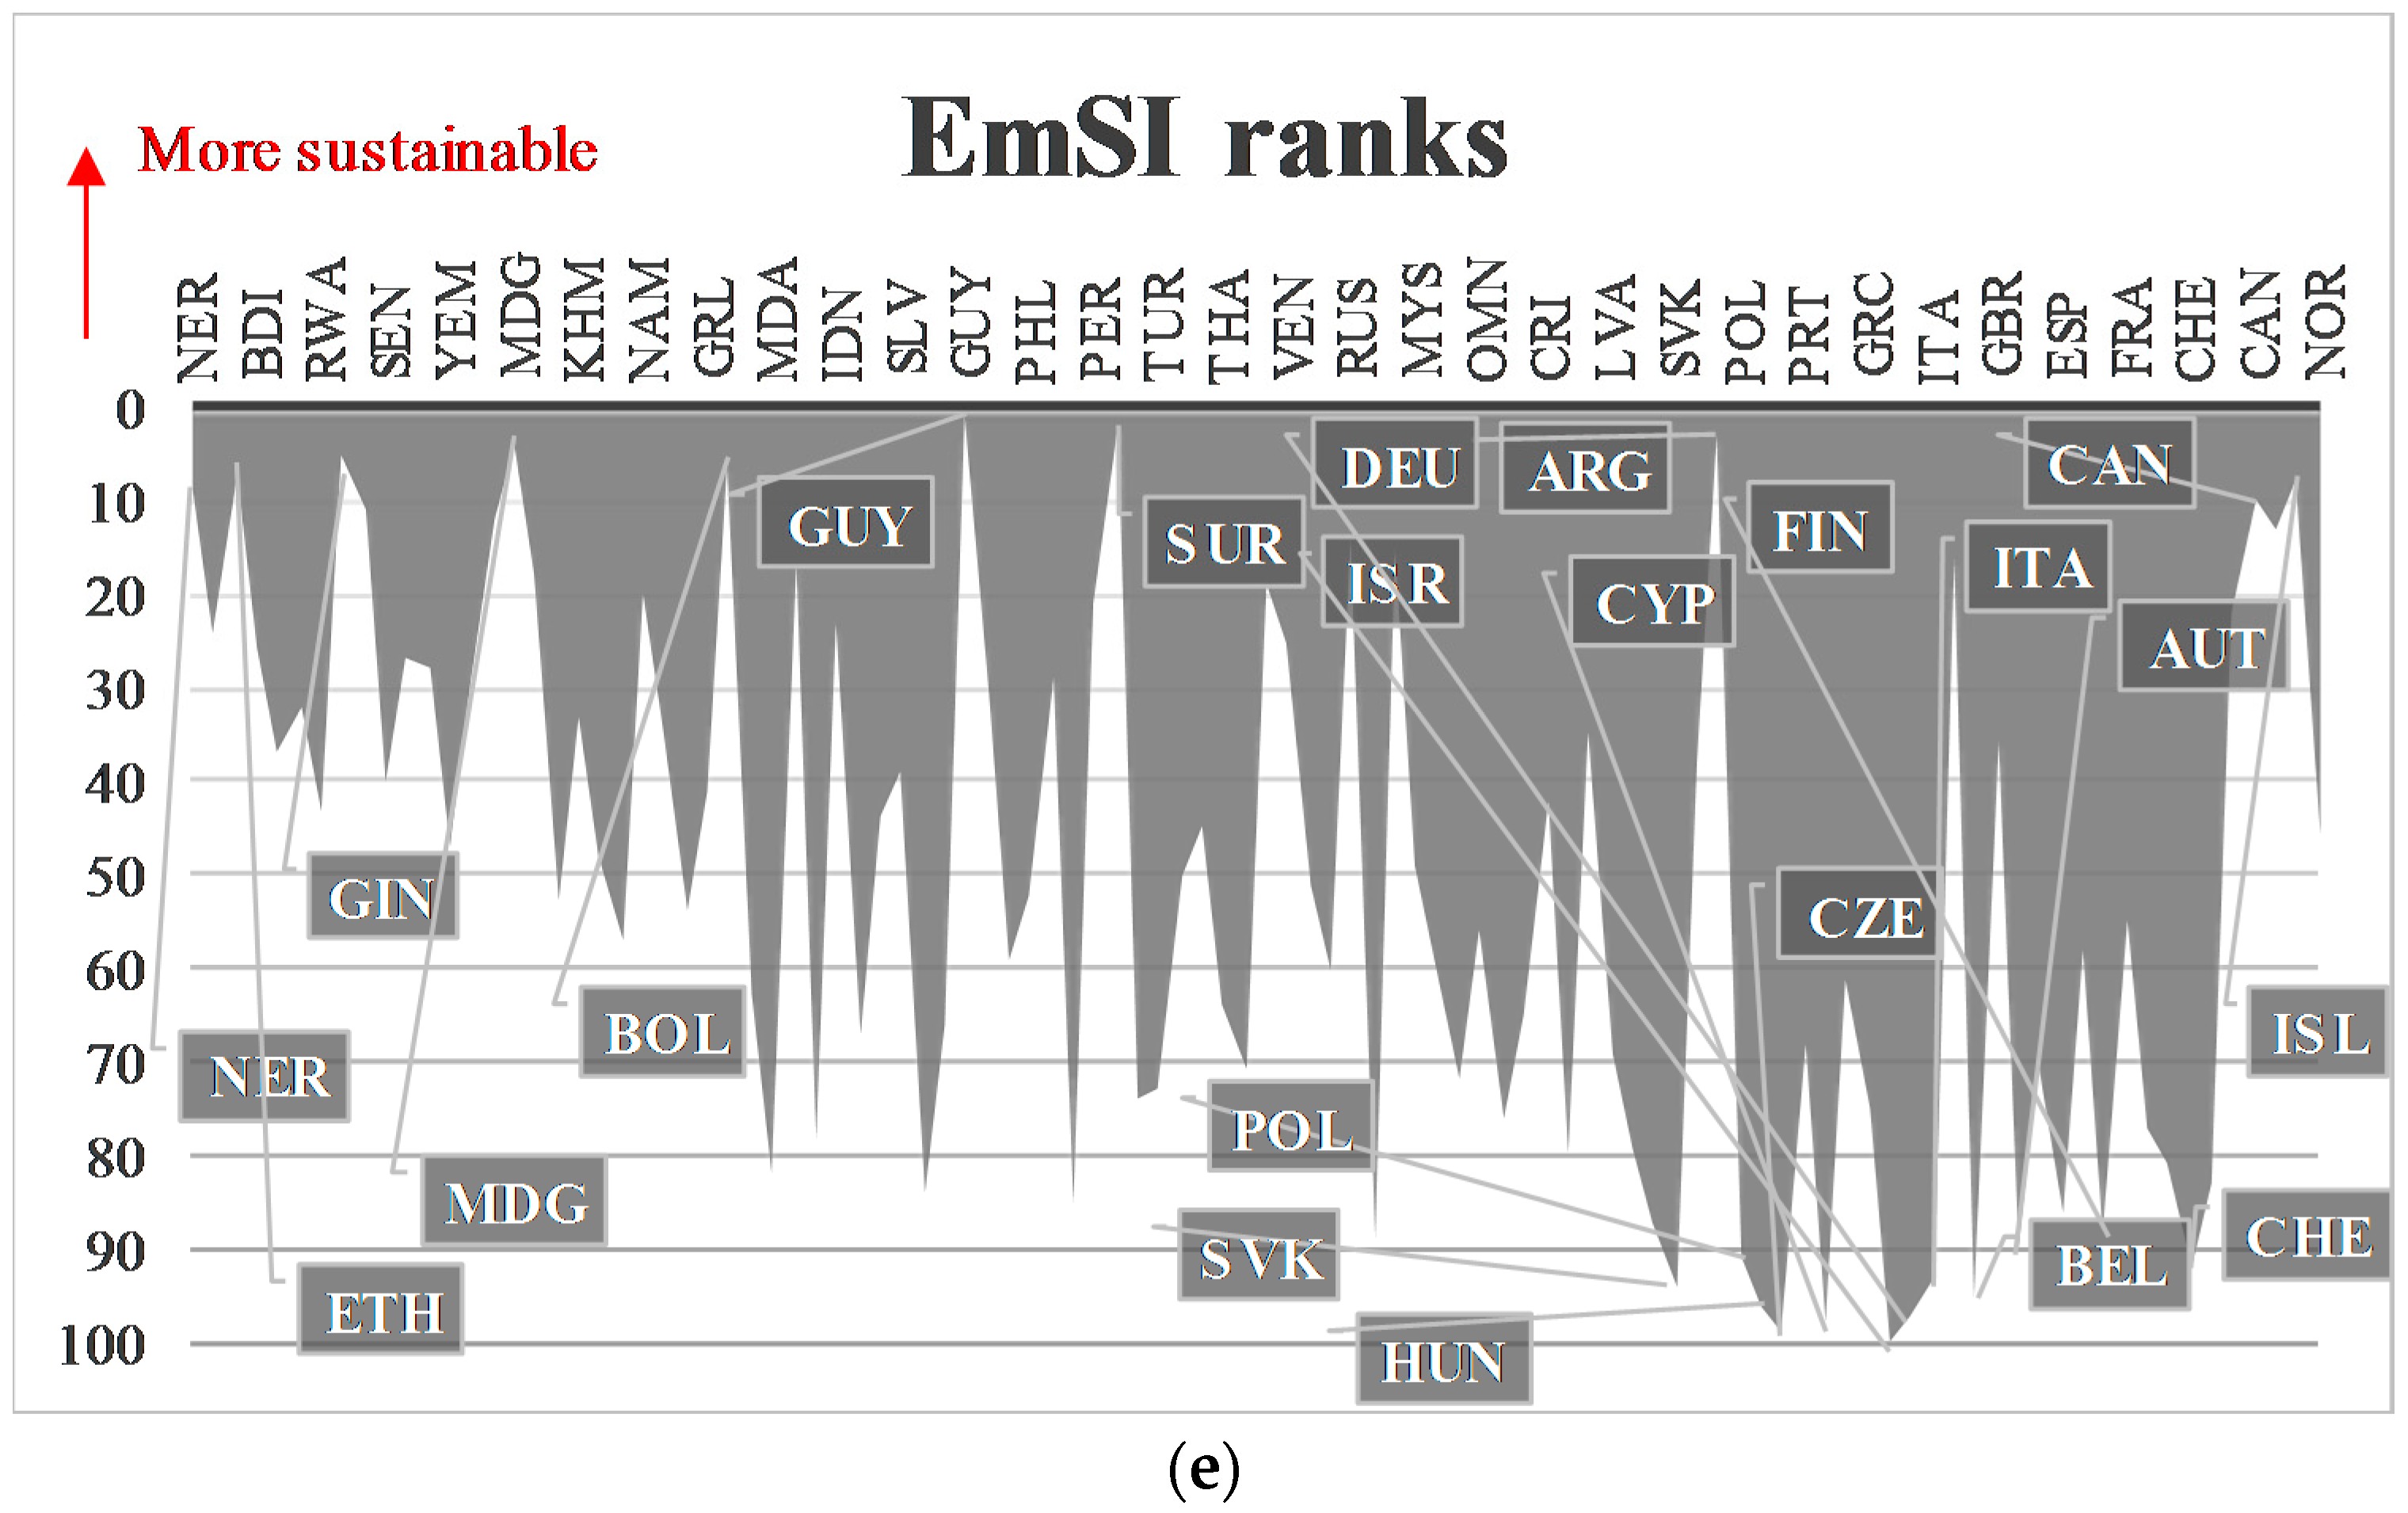
Figure 1 presents the ranking scores by country for each Sustainable Development Index (SDI). The countries were listed in order according to the HDI rank from 1 to 100 (right to left). Thus, in Figure 1, Norway (NOR) is ranked highest and Niger (NER) is ranked lowest. The top 10 and bottom 10 countries are identified in each of the graphs of Figure 1. By keeping the list of countries (from right to left) constant based on the HDI rank, Figure 1b–e demonstrate that the individual SDIs present divergent results for many countries.
Five countries ranked in the top 10 HDI were also ranked in the top 10 on EPI, and seven countries ranked in top 10 on HDI were also ranked in the top 10 on ESI. Norway, Austria, Sweden and Switzerland were ranked in the top 5 of the HDI, EPI and ESI. The appearance of several countries ranking in the top 10 for HDI, EPI and ESI reinforces the similarity among the SDIs. Of note is Canada with four top 5 scores.
Six countries, ranked in the bottom 10 on HDI, were ranked in the bottom 10 of EPI, while ESI shared only two countries in the bottom 10 with HDI. The countries of Ethiopia and Burundi had three bottom 5 scores. It is also noteworthy to point out that none of the bottom 10, according to SB and EmSI, ranked in the bottom 10 on the other SDIs (see Figure 1d,e). Three countries (Niger, Ethiopia and Guinea) ranked in the bottom 10 on HDI, EPI and ESI, while ranking in the top 10 on EmSI.
Figure 1e shows that the countries with the bottom EmSI scores are: Israel, Czech Republic, Cyprus, Germany, Hungary, Belgium, Slovakia, Italy, Switzerland, and Poland, of which Israel has the lowest score. The countries with the top EmSI scores are Guyana, Suriname, Argentina, Madagascar, Guinea, Bolivia, Ethiopia, Iceland, Niger, and Canada, of which Guyana is the top one. With the exception of Israel, the other nine countries ranked from 91 to 100 are all industrialized European countries (of course, Israel is also a developed industrialized country, outside of Europe).
In contrast, the countries with EmSI ranked from 1 to 10 are either from Africa or the Americas. Among them, Iceland is a geographical exception. However, this might depend on Iceland’s location at a relatively high latitude, its environmental conditions and its small population. Furthermore, this might depend upon the relatively high use of renewables, low local non-renewable resources and imported products, as visible in the NEAD database. Interestingly, European countries with relatively high GDP values, such as Germany and Italy, have a low EmSI score.
The differing assessment of country sustainability, when examining the top and bottom scores, reinforces the fact that the different SDIs might present conflicting findings, evidencing the multidimensional nature of sustainability concept. This explicitly highlights the influence that indicator selection can have on sustainability status assessment. Secondly, it is important to look at the driving factors for the sustainability scores, when interpreting the results and suggesting changes on national systems. Furthermore, comparability of results between national assessments requires a consistent approach over time. Despite the different SDIs Tool having been tested in very different countries according to needs, priorities and values, it may be necessary to adapt more suitable indicators for certain contexts in further applications.
3.2. Correlation Analysis of HDI, EPI, ESI, SB, and EmSI
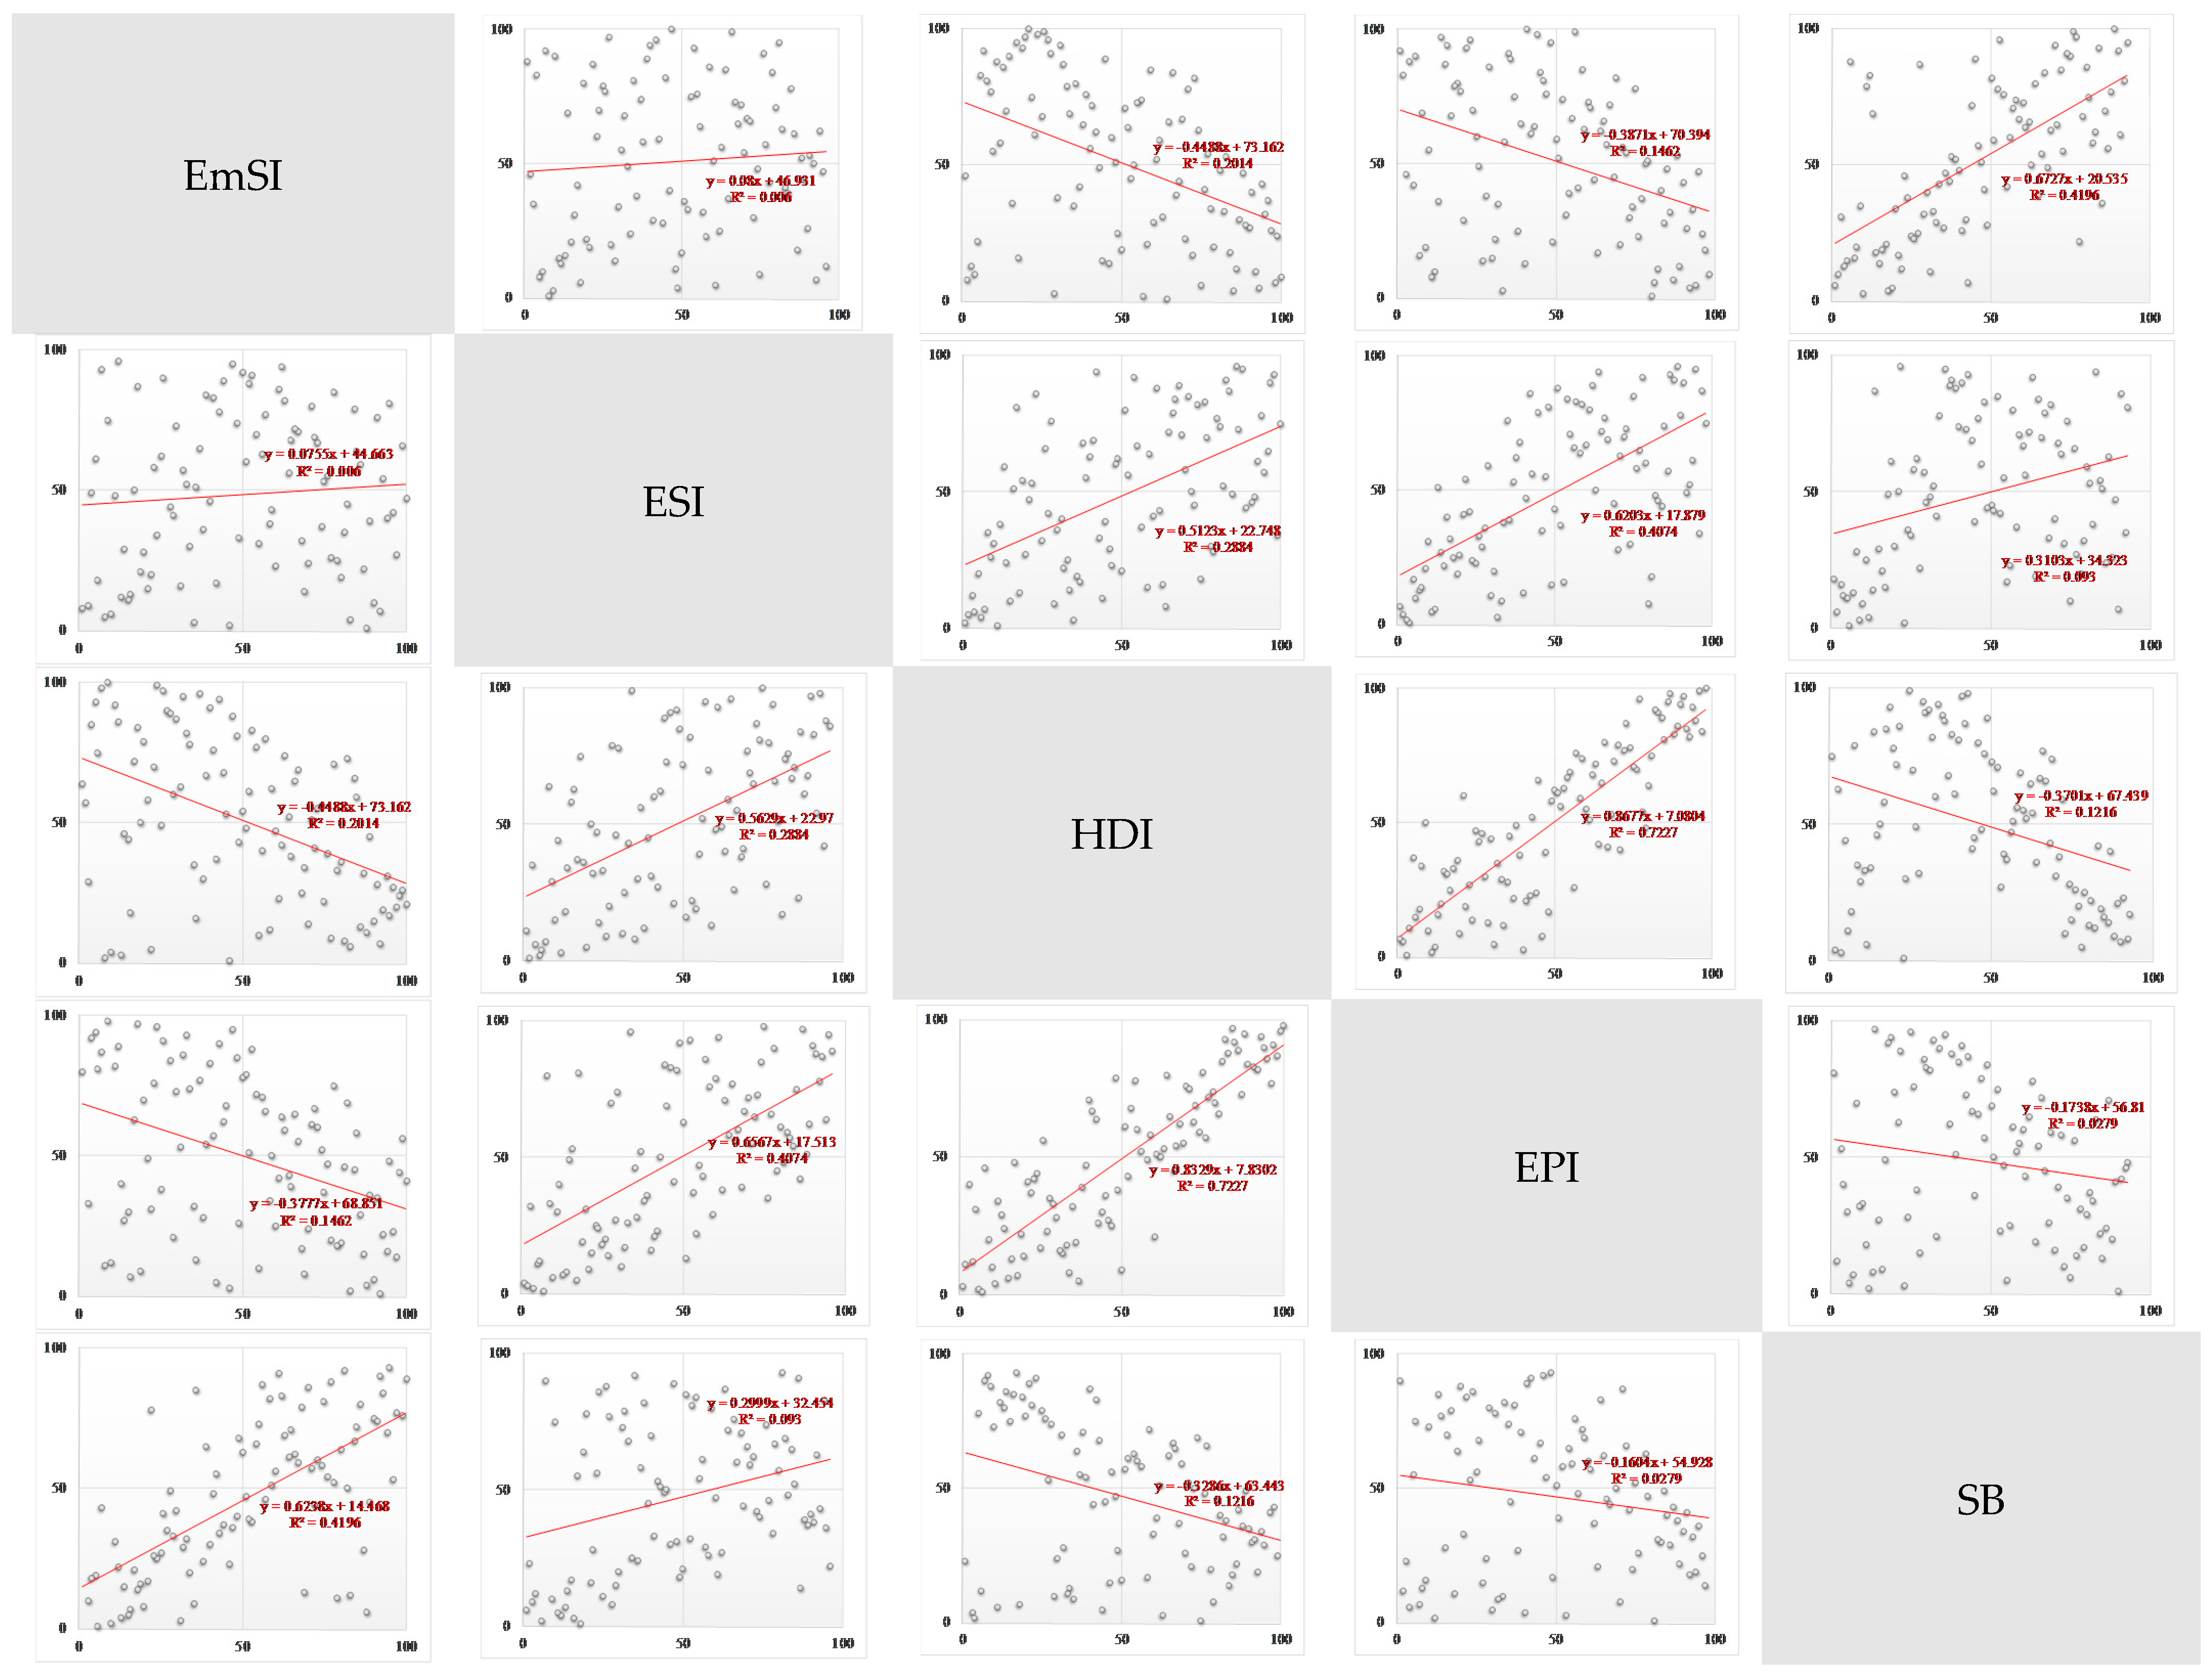
The coherency among HDI, EPI, ESI, SB, and EmSI were determined via Pearson correlation. The results show that, while Figure 2 highlights the individual differences among them, a fair degree of correlation exists among some of the SDIs. From Figure 2 and Table 2, it can be seen that the five SDIs can be divided into two groups. Group 1: composed of ESI, HDI and EPI, which are positively corrected with each other, especially HDI and EPI with a correlation coefficient of 0.83. Group 2: consisting of EmSI and SB, which are also positively correlated. On the other side, EmSI is negatively correlated with HDI and EPI, while SB is negatively correlated with HDI. This suggests the complementary nature of the two groups in providing sustainable development guidance. Scatter plots (in Figure 2) complement the correlation analysis, by providing a better sense of the relationship between corresponding SDIs.
If all the corresponding SDIs, users of SDI information could pick any of the measures as a barometer of sustainability, knowing that the other SDIs would provide similar results. The noticeable disparity in rankings between the two groups suggests that these different indicators can be used in conjunction with each other to provide a more holistic, complementary view. In particular, since the Group 1 indicators stress more social attributes, they could be used in conjunction with Group 2 indicators, to provide management and policy alternatives, which preserve high rankings between the two groups. In order to achieve such a goal, it would be necessary to proceed toward a more detailed analysis and understanding of the composition of the sub-indicators, that make up the indicators, while determining which ones are more or less sensitive to changes. In fact, we already know that the SDIs included in this analysis are not designed to be statistically independent of one another. For example, the GDP is included as an indicator within the HDI and the EPI index as well. The ESI and the HDI also share some indicators in common. It is natural therefore to expect that there will be a relationship of some nature among them.
Overall, to move a step further in the analysis of the Group 1 indicators in comparison with the Group 2 indicators, the correlations must be considered at a sub-indicators level for better understanding the intrinsic complex nature of the available analytical tools.
3.3. Correlation Analysis of SDIs with Sub-Indicators
To explore the possible driving forces of ESI, HDI, EPI, SB and EmSI, two social indices (area and population density, PD), two economic indices (GDP and GNI), and one environmental index (percent renewable, R%) were used to determine correlations via Pearson correlation (Figure 3 and Table 3).
There are outcomes of this further analysis, which we can separate in different points. First, Area. SB and EmSI have a positive relationship with Area (R = 0.3578, equation: y = 0.383x + 31.451 for SB; R = 0.4358, equation: y = 0.4358x + 28.495 for EmSI). In other words, a country with a large area tends to be sustainable in terms of SB and EmSI. Such countries are relatively more prone to have more renewable resources from nature than small-sized countries.
Second, PD. ESI, SB and EmSI have a negative relationship with PD (the latter two have markedly decreased, R = 0.6193 for SB and R = 0.5148 for EmSI), indicating that a country with a good sustainability in terms of the three SDIs tends to have a moderate or a low PD. This is unsurprising because population is generally seen as a major threat to sustainable development because it involves pressure on the overall system.
Third, GDP and GNI. Both GDP and GNI reflect the economy of a country, but the outcomes are interesting. HDI and EPI both have a positive relationship with GDP and GNI, i.e., the better economy a country has, the higher the HDI and EPI scores the same country would have. However, the relationships between GDP or GNI and EmSI are negative, and for SB, the circumstances are quite similar. That is to say, a country with a good economy may not have a high EmSI and would likely have a relatively low SB.
Fourth, R%. There are no evident correlations between R% and HDI, GNI, and even SB (R = 0.1752). These results are confirmed by the research of [81], in which the relationships among HDI, EF, ESI-2002, and available R resources were explored with Spearman correlation. Only EmSI has a positive relationship with R% (R = 0.5564). It is rational that a country with “high renewable energy input or low nonrenewable consumption” (a high R% score) has high EmSI values.
4. Discussions
4.1. The Evolution of Sustainability Indicators
Do some SDI distract us from the real problems and potential solutions by diverting our attention to the wrong directions? At least, according to [55], the present uncertainties are due to the different options in selecting the most representative underlying variables or indicators. Further studies on finding and checking robustness of indicators are needed to deepen discussion and verify those methodologies [56]. Indicator-based indices (in this paper, ESI, HDI, EPI) refer to the indices structured by combining different sub-indicators that represent different processes. The main criticisms against them have to do with the subjectivity of the choice of variables and the weighting of the indicators [60]. Sustainability sub-indicator sets should be backed by compelling theory, rigorous data collection, and analysis [82].
Traditional indicators of sustainable development focus on economic, environmental, and social measures of development, which do not provide substitute insights into sustainability. HDI is criticized as a human wellbeing indicator because it is partially composed of GDP per capita [75]. In contrast, the EF does not contain any information on economic or social development [35]. A global approach is needed to appropriately address sustainability issues and to incorporate natural capital in national accounting [83]; similarly, Giannetti et al. proposed that if humankind is concerned with the sustainable development of the planet as a whole, then progress indicators measured only in monetary or social terms are limited [84].
Emergy synthesis sees economic systems in the biosphere as open thermodynamic systems, considering all energy flows. The emergy perspective represents a unique step toward an eco-centric description of nature, even if it still contains anthropocentric elements, depending on the fact that elements, typical of human society are accounted (i.e., economy). The intrinsic value of all living organisms and their natural environment, typical of ecocentrism, emerges from the consequences of Maximum Empower Principle [85]. This is a re-statement of Lotka’s Maximum Power Principle [86], expressing resources in emergy and transformity terms. According to the Maximum Empower Principle, the simultaneous maximization of empower (emergy throughput flows) at all system’s levels is required for sustainability. Ulgiati further discussed such a concept, showing that hierarchies develop within each system (such as the biosphere), with higher levels feeding back and controlling the lower levels [87]. Furthermore, high-transformity flows interact with low-transformity ones for maximum empower output.
The different results in the outcome among the considered SDIs might be explained considering the inclusion of economic factors, which are anthropocentric, and still have properties and dynamics separate from the environment. This further confirms the critique of ecocentrism, which underlines the anti-ecological behavior and the subsequent construction of fundamentally new connections with the natural world [88]. Means suggested that ecocentrism can find potential openings in emerging discussions of the precautionary principle in environmental decision-making practices—a principle that challenges the superiority and axiological priority granted to human well-being and development.
Both the EF and SB indicators emphasize the environmental dimension of sustainability [29]. Here, we propose SB or “footprint to biocapacity ratio” [89] rather than just EF, because biocapacity tends to be more important than EF. The power and popularity of the EF indicator depends on the fact that the underlying metric is simple and intuitive. Thermodynamic ideas, by contrast, still appear rather esoteric to the non-specialist, becoming difficult to understand for managers and policymakers, who are used to a utilitarian/welfarist language and approach.
Emergy evaluation and SB can provide a one-dimensional view of this interaction, i.e., emergy and global hectares, describing different dimensions into the complex interactions between humans and nature [90]. Siche et al. made junction of ecological footprint with renewability emergy index, while combining the strong points of EF and EA (emergy analysis) through a new approach, called emergetic ecological footprint (EEF) [32,91]. Other works focused on the junction of EF and EA (e.g., [92,93,94,95]). Of course, innovative attempts for other new comprehensive and balanced sustainability indicators, such as the Emergy Index for Sustainable Development (EISD, [96]) and the Total System Wellbeing Index (HDI adjusted * %R) [97,98] are also desirable.
4.2. The Big Different Ecological Perspective behind the Emergy-Based Sustainable Index
Through emergy synthesis, it is possible to understand how much different parts of the system can contribute to the wealth of the total system [99]. Emergy values are, in fact, values of donor type. In economic science, wealth or value is measured in monetary terms. Since the currently dominating economic paradigm, the neoclassic economy, has a theoretical foundation of summing up economic man market valuations, the market values are often considered as the ‘normal’ way to assess the value [100]. Compared to the donor values, the market values can be characterized as the receiver values, since it is the receiver, as a market actor, who decides the value. The donor value approach is founded in system science rather than economic science, where a value focused on the system level is accepted [101]. Sustainable development is the name most commonly linked to this alternative, although many people do not yet realize that sustainability will also require different paradigms of economics, based on an organismic and evolutive rather than mechanistic worldview. From an ecological perspective, natural systems must exist subject to the unyielding laws of thermodynamics, and the science of population ecology has explored the implications of these laws for living organisms. Differences in views about the meaning and value of sustainability are partially rooted in different philosophical and moral conceptions of the appropriate way to conceive of the relationship between humanity and nature [102]. Divergent interpretations and opposing definitions of sustainability are sources of confusion rather than contributions that help to reinforce the root idea of sustainable development. Sustainability must be defined with respect to human-ascribed system goals (objectives) and the functioning of the overall system (feasibility) and may usefully be thought of in two dimensions [103].
5. Conclusions
In general, the main conclusions of this paper are: (1) the five typical sustainability indicators studied in this paper could be divided into two groups (Group1: ESI, HDI and EPI and Group 2: EmSI and SB) and the indicators of the same group correlate positively with each other; (2) when the five SDIs are applied to 100 countries, the rankings of individual countries suggest that the two groups of SDIs provide somewhat conflicting guidance for the attainment of sustainability; (3) Correlation analysis of SDIs with sub-indicators shows that, under different environmental–social–economic preferences, the sustainability indicators will pay attention to different decision-making rules. Thus, the contemporary use of SDI belonging to the two different groups might lead to a conflicting guidance in policy-making.
Furthermore, we have outlined both some of the general principles and some of the specific requirements of sustainable development. The concept has been broadly accepted, but the implications of the ecological theoretical restructuring which we have discussed are more far-reaching than may be apparent. Development SDIs, as we have noted, has always been normative as well as positive in its analytical vision. Today, we require a new normative vision drawing on strong but neglected traditions in ecology, political and social theory and combining traditional wisdom with modern technology. According to [88], we should recognize definitive ecological constraints and adjust the scale of anthropogenic systems to fit within the confines of the natural world. This is why, considering also the long-term perspective of policy making, the use of SDIs, which belong to the second group, seems to be more appropriate at the present time, if we are willing to preserve the integrity of the biosphere and to promote a path toward sustainability.
Acknowledgments
This work is supported by the National Key Research and Development Program of China (Grant Nos. 2016YFC0502802, 2016YFC0503005), the Projects of Sino-America International Cooperation and Exchanges of NSFC (No. 51661125010), the Fund for Innovative Research Group of the National Natural Science Foundation of China (Grant No. 51421065), the National Natural Science Foundation of China (Grant Nos. 41471466, 71673029) and the 111 Project (No. B17005).
Author Contributions
Gengyuan Liu designed this study, carried out the empirical work, wrote the literature review, and drafted the manuscript. Mark T. Brown participated in the empirical studies and helped to draft the literature review. Marco Casazza participated in the design of the study and the data analysis. All authors read and approved the final manuscript.
Conflicts of Interest
The authors declare no conflict of interest.
References
- Harris, J.M. Basic Principles of Sustainable Development. Available online: http://ase.tufts.edu/gdae/publications/working_papers/Sustainable%20Development.pdf (accessed on 6 August 2016).
- Iked, J. Family farms: Our promise for a sustainable future. Presentation at the Pennsylvania Farmer Union Annual Convention, Harrisburg, PA, USA, 7 December 2013. [Google Scholar]
- Connelly, J.; Graham, J.H.S. Politics and the Environment: From Theory to Practice, 2nd ed.; Routledge: New York, NY, USA, 2003. [Google Scholar]
- Dryzek, J.S. The Politics of the Earth: Environmental Discourses, 2nd ed.; Oxford University Press: Melbourne, Australia, 2005. [Google Scholar]
- WCED (World Commission on Environment and Development). Our Common Future; Oxford University Press: Oxford, UK, 1987. [Google Scholar]
- Adger, W.N.; Andrew, J. Sustainability: Exploring the Processes and Outcomes of Governance. In Governing Sustainability; Adger, W.N., Jordan, A., Eds.; Cambridge University Press: Cambridge, UK, 2009. [Google Scholar]
- IUCN/UNEP/WWF/FAO/UNESCO (International Union for Conservation of Nature/United Nations Environment Programme/Food and Agriculture Organization of the United Nations/United Nations Educational, Scientific and Cultural Organization). World Conservation Strategy: Living Resource Conservation for Sustainable Development; International Union for the Conservation of Nature: Gland, Switzerland, 1980. [Google Scholar]
- Brooks, H. The Typology of Surprises in Technology, Institutions and Development; Clark, W.C., Munn, R.E., Eds.; Sustainable Development of the Biosphere; Cambridge University Press: Cambridge, UK, 1986. [Google Scholar]
- Robinson, J. Squaring the circle? Some thoughts on the idea of sustainable development. Ecol. Econ. 2004, 48, 369–384. [Google Scholar] [CrossRef]
- Zidanšek, A. Sustainable development and happiness in nations. Energy 2007, 32, 891–897. [Google Scholar] [CrossRef]
- United Nations General Assembly. 2005 World Summit Outcome; Resolution A/60/1; The General Assembly: New York, NY, USA, 2005. [Google Scholar]
- Glavic, P.; Lukman, R. Review of sustainability terms and their definitions. J. Clean. Prod. 2007, 15, 1875–1885. [Google Scholar] [CrossRef]
- Hajer, M.; Nilsson, M.; Raworth, K.; Bakker, P.; Berkhout, F.; de Boer, Y.; Rockström, J.; Ludwig, K.; Kok, M. Beyond Cockpit-ism: Four Insights to Enhance the Transformative Potential of the Sustainable Development Goals. Sustainability 2015, 7, 1651–1660. [Google Scholar] [CrossRef]
- Lior, N. Sustainability Ethics and Metrics: Strategies for Damage Control and Prevention. J. Environ. Account. Manag. 2013, 1, 15–24. [Google Scholar] [CrossRef]
- Rametsteiner, E.; Pülzl, H.; Alkan-Olsson, J.; Frederiksen, P. Sustainability indicator development—Science or political negotiation? Ecol. Indic. 2011, 11, 61–71. [Google Scholar] [CrossRef]
- Dahl, A.L. Achievements and gaps in indicators for sustainability. Ecol. Indic. 2012, 17, 14–19. [Google Scholar] [CrossRef]
- Hopwood, B.; Mellor, M.; O’Brien, G. Sustainable development. Mapping different approaches. Sustain. Dev. 2005, 13, 38–52. [Google Scholar] [CrossRef]
- Waas, T.; Hugé, J.; Verbruggen, A.; Wright, T. Sustainable development: A bird’s eye view. Sustainability 2011, 3, 1637–1661. [Google Scholar] [CrossRef]
- Jickling, B.; Was, A.E.J. Globalization and environmental education: Looking beyond sustainable development. J. Curric. Stud. 2008, 40, 1–21. [Google Scholar] [CrossRef]
- Böhringer, C.; Jochem, P.E.P. Measuring the immeasurable—A survey of sustainability indices. Ecol. Econ. 2007, 63, 1–8. [Google Scholar] [CrossRef]
- Kelley, A.C. Human development index: ‘Handle with care’. Popul. Dev. Rev. 1991, 17, 315–324. [Google Scholar] [CrossRef]
- Noorbakhsh, F. A Modified Human Development Index. World Dev. 1998, 26, 517–528. [Google Scholar] [CrossRef]
- Luchters, G.; Menkhoff, L. Chaotic signals from HDI measurement. Appl. Econ. Lett. 2000, 7, 267–270. [Google Scholar] [CrossRef]
- Morse, S. Greening the United Nations’ human development index. Sustain. Dev. 2003, 11, 183–198. [Google Scholar] [CrossRef]
- Monni, S.; Spaventa, A. Beyond GDP and HDI: Shifting the focus from paradigms to politics. Development 2013, 56, 227–231. [Google Scholar] [CrossRef]
- Spierre, S.G.; Seager, T.P.; Selinger, E. The Diminishing Returns to the Human Development Index: Implications for Climate Policy and Sustainable Development. J. Sustain. Dev. 2013, 6, 34–47. [Google Scholar] [CrossRef]
- Fukuda-Parr, S. Human Development Indicators. In Human Development Report 2004: Cultural Liberty in Today’s Diverse World; Murphy, C., Ross-Larson, B., Eds.; United Nations Development Programme: New York, NY, USA, 2004; pp. 139–250. Available online: http://hdr.undp.org/sites/default/files/hdr_2004_summary_en.pdf (accessed on 6 July 2016).
- Esty, D.C.; Levy, M.A.; Kim, C.H.; de Sherbinin, A.; Srebotnjak, T.; Mara, V. Environmental Performance Index; Yale Center for Environmental Law and Policy: New Haven, CT, USA, 2008. [Google Scholar]
- Wilson, J.; Tyedmers, P.; Pelot, R. Contrasting and comparing sustainable development indicator metrics. Ecol. Indic. 2007, 7, 299–314. [Google Scholar] [CrossRef]
- Morse, S. Indices and Indicators in Development: An Unhealthy Obsession with Numbers; Earthscan Publications: Richmond, TX, USA, 2004. [Google Scholar]
- Morse, S.; Frasier, E.D.G. Making ‘Dirty’ Nations Look Clean? The Nation State and the Problem of Selecting and Weighting Indices as Tools for Measuring Progress towards Sustainability. Geoforum 2005, 36, 625–640. [Google Scholar] [CrossRef]
- Siche, R.; Agostinho, F.; Ortega, E.; Romeiro, A. Sustainability of nations by indices: Comparative study between environmental sustainability index, ecological footprint and the emergy performance indices. Ecol. Econ. 2008, 66, 628–637. [Google Scholar] [CrossRef]
- Rees, W. Ecological footprints and appropriated carrying capacity: What urban economies leaves out. Environ. Urban 1992, 4, 121–130. [Google Scholar] [CrossRef]
- Ko, J.Y.; Hall, C.A.S.; Lemus, L.G.L. Resource Use Rates and Efficiency as Indicators of Regional Sustainability: An Examination of Five Countries. Environ. Monit. Assess. 1998, 51, 571–593. [Google Scholar] [CrossRef]
- Van Vuuren, D.P.; Smeets, E.M.W. Ecological Footprints of Benin, Ghutan, Costa Rica and the Netherlands. Ecol. Econ. 2000, 34, 115–130. [Google Scholar] [CrossRef]
- York, R.; Eugene, A.R.; Thomas, D. The Ecological Footprint Intensity of National Economies. J. Ind. Ecol. 2005, 8, 139–154. [Google Scholar] [CrossRef]
- Wackernagel, M.; Rees, W. Our Ecological Footprint: Reducing Human Impact on the Earth; New Society Publishers: Gabriola Island, BC, Canada; Philadelphia, PA, USA, 1996. [Google Scholar]
- Odum, H.T. Systems Ecology; John Wiley and Sons: New York, NY, USA, 1983. [Google Scholar]
- Tilley, D.R.; Swank, W.T. EMERGY-based environmental systems assessment of a multi-purpose temperate mixed-forest watershed of the southern Appalachian Mountains, USA. J. Environ. Manag. 2003, 69, 213–227. [Google Scholar] [CrossRef]
- Campbell, D.E. Keeping the Books for the Environment and Society: The Unification of Emergy and Financial Accounting Methods. J. Environ. Account. Manag. 2013, 1, 25–41. [Google Scholar] [CrossRef]
- Brown, M.T.; Ulgiati, S. Emergy-based indices and ratios to evaluate sustainability: Monitoring economies and technology toward environmentally sound innovation. Ecol. Eng. 1997, 9, 51–69. [Google Scholar] [CrossRef]
- Brown, M.T.; Ulgiati, S. Energy quality, emergy and transformity: H.T. Odum’s contributions to quantifying and understanding systems. Ecol. Model. 2004, 178, 201–213. [Google Scholar] [CrossRef]
- Ulgiati, S.; Brown, M.T.; Bastianoni, S.; Marchettini, N. Emergy-based indices and ratios to evaluate the sustainable use of resources. Ecol. Eng. 1995, 5, 519–531. [Google Scholar] [CrossRef]
- Brown, M.T.; Cohen, M.J.; Sweeney, S. Predicting national sustainability: The convergence of energetic, economic and environmental realities. Ecol. Model. 2009, 220, 3424–3438. [Google Scholar] [CrossRef]
- Liu, G.Y.; Yang, Z.F.; Chen, B.; Ulgiati, S. Analysis of the Scientific Collaboration Patterns in the Emergy Accounting Field: A Review of the Co-Authorship Network Structure. J. Environ. Account. Manag. 2013, 1, 1–13. [Google Scholar] [CrossRef]
- Ascione, M.; Campanella, L.; Cherubini, F.; Ulgiati, S. Environmental driving forces of urban growth and development: An emergy-based assessment of the city of Rome, Italy. Landsc. Urban Plan. 2009, 93, 238–249. [Google Scholar] [CrossRef]
- Campbell, D.E.; Garmestanib, A.S. An energy systems view of sustainability: Emergy evaluation of the San Luis Basin, Colorado. J. Environ. Manag. 2012, 95, 72–97. [Google Scholar] [CrossRef] [PubMed]
- Liu, G.Y.; Yang, Z.F.; Chen, B.; Zhang, L.X. Modelling a thermodynamic-based comparative framework for urban sustainability: Incorporating economic and ecological losses into emergy analysis. Ecol. Model. 2013, 252, 280–287. [Google Scholar] [CrossRef]
- Zucaro, A.; Mellino, S.; Ghisellini, P.; Viglia, S. Environmental Performance and Biophysical Constrains of Italian Agriculture across Time and Space Scales. J. Environ. Account. Manag. 2013, 1, 65–83. [Google Scholar] [CrossRef]
- Liu, G.Y.; Yang, Z.F.; Chen, B.; Ulgiati, S. Emergy-based dynamic mechanisms of urban development, resource consumption and environmental impacts. Ecol. Model. 2014, 271, 90–102. [Google Scholar] [CrossRef]
- Brown, M.T.; Ulgiati, S. Emergy measures of carrying capacity to evaluate economic investments. Popul. Environ. 2001, 22, 471–501. [Google Scholar] [CrossRef]
- Brown, M.T. Resource Imperialism: Emergy perspectives on sustainability, balancing the welfare of nations and international trade. In Advances in Energy Studies, Proceeding of the Advances in Energy Study Conference, Porto Venere, Italy, 1 October 2002; Ulgiati, S., Ed.; University of Siena: Siena, Italy, 2003. [Google Scholar]
- Yang, Z.F.; Jiang, M.M.; Chen, B.; Zhou, J.B.; Chen, G.Q.; Li, S.C. Solar emergy evaluation for Chinese economy. Energy Policy 2010, 38, 875–886. [Google Scholar] [CrossRef]
- Lei, K.; Hu, D.; Zhou, S.Q.; Zhen, G. Monitoring the sustainability and equity of socioeconomic development: A comparison of emergy indices using Macao, Italy and Sweden as examples. Acta Ecol. Sin. 2012, 32, 165–173. [Google Scholar] [CrossRef]
- Giannetti, B.F.; Almeida, C.M.V.B.; Bonilla, S.H. Comparing emergy accounting with well-known sustainability metrics: The case of Southern Cone Common Market, Mercosur. Energy Policy 2010, 38, 3518–3526. [Google Scholar] [CrossRef]
- Giannetti, B.F.; Demétrio, J.F.C.; Bonilla, S.H.; Agostinho, F.; Almeida, C.M.V.B. Emergy diagnosis and reflections towards Brazilian sustainable development. Energy Policy 2013, 63, 1002–1012. [Google Scholar] [CrossRef]
- Brown, M.T.; Ulgiati, S. Emergy evaluation of natural capital and biosphere services. Ambio 1999, 28, 468–493. [Google Scholar]
- Brown, M.T.; Ulgiati, S. Updated evaluation of exergy and emergy driving the geobiosphere: A review and refinement of the emergy baseline. Ecol. Model. 2010, 221, 2501–2508. [Google Scholar] [CrossRef]
- Singh, R.K.; Murty, H.R.; Gupta, S.K.; Dikshit, A.K. An overview of sustainability assessment methodologies. Ecol. Indic. 2009, 9, 189–212. [Google Scholar] [CrossRef]
- Mori, K.; Christodoulou, A. Review of sustainability indices and indicators: Towards a new City Sustainability Index (CSI). Environ. Impact Assess. Rev. 2012, 32, 94–106. [Google Scholar] [CrossRef]
- WCU (World Conservation Union). 2000. Available online: http://iucn.org/themes/eval/english/barom.htm (accessed on 6 June 2016).
- FoE (Friends of the Earth). Index of Sustainable Economic Welfare. 2000. Available online: http://www.foe.co.uk/campaigns/sustainable_development/progress/templates/StoryIntro.html (accessed on 6 June 2016).
- James, P.; Magee, L.; Scerri, A.; Steger, M.B. Urban Sustainability in Theory and Practice; Routledge: Oxford, UK, 2015. [Google Scholar]
- Daly, H.; Cobb, J. For the Common Good: Redirecting the Economy toward Community, the Environment and a Sustainable Future; Beacon Press: Boston, MA, USA, 1989; ISBN 0-8070-4703-1. [Google Scholar]
- Soederbaum, P. Understanding Sustainability Economics; Earthscan: London, UK, 2008; ISBN 978-1-84407-627-7. [Google Scholar]
- Munda, G. Multiple Criteria Decision Analysis and Sustainable Development. In Multiple Criteria Decision Analysis; Greco, S., Ehrgott, M., Rui Figueira, J., Eds.; Springer: New York, NY, USA, 2016; pp. 1235–1267. [Google Scholar]
- Rogers, D.S.; Duraiappah, A.K.; Antons, D.C.; Munoz, P.; Bai, X.; Fragkias, M.; Gutscher, H. A vision for human well-being: Transition to social sustainability. Curr. Opin. Environ. Sustain. 2012, 4, 61–73. [Google Scholar] [CrossRef]
- Azar, C.; Holmberg, J.; Lindgren, K. Socio-ecological indicators for sustainability. Ecol. Econ. 1996, 18, 89–112. [Google Scholar] [CrossRef]
- Tainter, J.A. The Collapse of Complex Societies; Cambridge University Press: Cambridge, UK, 1988. [Google Scholar]
- Tainter, J.A. Energy and Existential Sustainability: The Role of Reserve Capacity. J. Environ. Account. Manag. 2013, 1, 1–17. [Google Scholar] [CrossRef]
- Kaufmann, R.K.; Cleveland, C.J. Measuring sustainability: Needed—An interdisciplinary approach to an interdisciplinary concept. Ecol. Econ. 1995, 15, 109–112. [Google Scholar] [CrossRef]
- Bond, A.; Morrison-Saunders, A.; Gunn, J.A.E.; Pope, J.; Retief, F. Managing uncertainty, ambiguity and ignorance in impact assessment by embedding evolutionary resilience, participatory modelling and adaptive management. J. Environ. Manag. 2015, 151, 97–104. [Google Scholar] [CrossRef] [PubMed]
- WWF. Living Planet Report 2012—Biodiversity, Biocapacity and Better Choices. 2012. Available online: http://awsassets.wwfpl.panda.org/downloads/lpr_2012_as_printed.pdf (accessed on 20 August 2012).
- Bradshaw, C.J.A.; Giam, X.; Sodhi, N.S. Evaluating the Relative Environmental Impact of Countries. PLoS ONE 2010, 5, e10440. [Google Scholar] [CrossRef] [PubMed]
- Steer, A.; Lutz, E. Measuring Environmentally Sustainable Development. Financ. Dev. 1993, 30, 20–23. [Google Scholar]
- Sweeney, S.; Cohen, M.J.; King, D.M.; Brown, M.T. Creation of a Global Emergy Database for Standardized National Emergy Synthesis. In Proceedings of the 4th Biennial Emergy Research Conference, Gainsville, FL, USA, 19–21 January 2006; Brown, M.T., Ed.; Center for Environmental Policy: Gainesville, FL, USA, 2007. [Google Scholar]
- Sagar, A.D.; Najam, A. The human development index: A critical review. Ecol. Econ. 1998, 25, 249–264. [Google Scholar] [CrossRef]
- Lei, K.; Zhou, S.Q. Per capita resource consumption and resource carrying capacity: A comparison of the sustainability of 17 mainstream countries. Energy Policy 2012, 42, 603–612. [Google Scholar] [CrossRef]
- You, J. China’s energy consumption and sustainable development: Comparative evidence from GDP and genuine savings. Renew. Sustain. Energy Rev. 2011, 15, 2984–2989. [Google Scholar] [CrossRef]
- Coscieme, L.; Pulselli, F.M.; Marchettini, N.; Sutton, P.C.; Anderson, S.; Sweeney, S. Emergy and ecosystem services: A national biogeographical assessment. Ecosyst. Serv. 2014, 7, 152–159. [Google Scholar] [CrossRef]
- Frugoli, P.A.; Almeida, C.M.V.B.; Agostinho, F.; Giannetti, B.F.; Huisingh, D. Can measures of well-being and progress help societies to achieve sustainable development? J. Clean. Prod. 2015, 90, 370–380. [Google Scholar] [CrossRef]
- Parris, T.M.; Kates, R.W. Characterizing and Measuring Sustainable Development. Annu. Rev. Environ. Resour. 2003, 28, 559–586. [Google Scholar] [CrossRef]
- Pillarisetti, J.R. The World Bank’s ‘genuine savings’ measure and sustainability. Ecol. Econ. 2005, 55, 599–609. [Google Scholar] [CrossRef]
- Giannetti, B.F.; Agostinho, F.; Almeida, C.M.V.B.; Huisingh, D. A review of limitations of GDP and alternative indices to monitor human wellbeing and to manage eco-system functionality. J. Clean. Prod. 2015, 87, 11–25. [Google Scholar] [CrossRef]
- Odum, H.T.; Odum, E.C. A Prosperous Way Down; University Press of Colorado: Boulder, CO, USA, 2001. [Google Scholar]
- Lotka, A.J. Contribution to the energetics of evolution. Natural selection as a physical principle. Proc. Natl. Acad. Sci. USA 1922, 9, 169–177. [Google Scholar]
- Ulgiati, S.H.T. Odum and E.C. Odum, the prosperous way down. Ecol. Model. 2004, 178, 247–250. [Google Scholar] [CrossRef]
- Means, B.; House, A.; Young, V.; Wang, H.; Lynch, S. Expanding Access to STEM-Focused Education: What Are the Effects [White Paper]? SRI International: Washington, DC, USA, 2013. [Google Scholar]
- Moran, D.D.; Wackernagel, M.; Kitzes, J.A.; Goldfinger, S.H.; Boutaud, A. Measuring sustainable development —Nation by nation. Ecol. Econ. 2008, 64, 470–474. [Google Scholar] [CrossRef]
- Niccolucci, V.; Pulselli, R.M.; Bastianoni, S. Emergy Evaluation and Ecological Footprint Analysis for Regional Environmental Sustainability Assessment: A Comparison. In Emergy Synthesis 4: Theory and Applications of the Emergy Methodology, Proceedings of the 4th Biennial Emergy Conference, Gainsville, FL, USA, 19–21 January 2006; Center for Environmental Policy, University of Florida: Gainesville, FL, USA, 2007. [Google Scholar]
- Siche, R.; Pereira, L.; Agostinho, F.; Ortega, E. Convergence of ecological footprint and emergy analysis as a sustainability indicator of countries: Peru as case study. Commun. Nonlinear Sci. Numer. Simul. 2010, 15, 3182–3192. [Google Scholar] [CrossRef]
- Zhao, S.; Li, Z.; Li, W. A Modified Method of Ecological Footprint Calculation and its Application. Ecol. Model. 2005, 185, 65–78. [Google Scholar] [CrossRef]
- Chen, B.; Chen, G.Q. Ecological footprint accounting based on emergy—A case study of the Chinese society. Ecol. Model. 2006, 198, 101–114. [Google Scholar] [CrossRef]
- Pereira, L.; Ortega, E. Emergy Synthesis and Ecological Footprint: Drawing a Parallel between Methodologies for a Sub-National Case Study. In Emergy Synthesis 7: Theory and Applications of the Emergy Methodology, Proceedings of the 7th Biennial Emergy Conference, Gainesville, FL, USA, 12–14 January 2012; Center for Environmental Policy, University of Florida: Gainesville, FL, USA, 2013. [Google Scholar]
- Pereira, L.G.; Ortega, E. Emergy Footprint—Ecological Footprint based on Emergy: Brazil as Case Study. Emergy. In Synthesis 5: Theory and Applications of the Emergy Methodology, Proceedings of the 5th Biennial Emergy Conference, Gainesville, FL, USA, 31 January–2 February 2008; Center for Environmental Policy, University of Florida: Gainesville, FL, USA, 2009. [Google Scholar]
- Lu, H.; Lan, S.; Peng, S. Emergy Assessment for Urban Sustainable Development. In Emergy Synthesis 3: Theory and Applications of the Emergy Methodology, Proceedings of the 3rd Biennial Emergy Conference, Gainesville, FL, USA, 29–30 January 2004; University of Florida, Center for Environmental Policy: Gainesville, FL, USA, 2005. [Google Scholar]
- King, D.; Cohen, M.J.; Sweeney, S.; Brown, M.T. Comparative Analysis of Indicators of Well-being Using Environmental Accounting. In Emergy Synthesis 4: Theory and Applications of the Emergy Methodology. Proceedings of the 4th Biennial Emergy Conference, Gainsville, FL, USA, 19–21 January 2006; Center for Environmental Policy, University of Florida: Gainesville, FL, USA, 2007. [Google Scholar]
- Cohen, M.J.; Sweeney, S.; King, D.; Brown, M.T. Environmental Accounting of National Economic Systems: An Analysis of West African Dryland Countries within a Global Context; United Nations Environment Programme: Nairobi, Kenya, 2012. [Google Scholar]
- Odum, H.T. Folio #2: Emergy of global processes. In Handbook of Emergy Evaluation: A Compendium of Data for Emergy Computation Issued in a Series of Folios; Center for Environmental Policy, University of Florida: Gainesville, FL, USA, 2000. [Google Scholar]
- Grönlund, E.; Fröling, M.; Carlman, I. Donor values in emergy assessment of ecosystem services. Ecol. Model. 2015, 306, 101–105. [Google Scholar] [CrossRef]
- Grönlund, E.; Hedin, D.; Eriksson, P.-O. Is emergy best suited for ecological economics, environmental economics, or with an economic context of its own? In Emergy Synthesis 5: Theory and Applications of the Emergy Methodology, Proceedings of the Fifth Biennial Emergy Research Conference, Gainesville, FL, USA, 31 January–2 February 2008; Brown, M.T., Ed.; The Center for Environmental Policy, University of Florida: Gainesville, FL, USA, 2009; pp. 485–490. [Google Scholar]
- Robinson, J.B.; Tinker, J. Reconciling Ecological, Economic and Social Imperatives: A new conceptual framework. In Surviving Globalism: Social and Environmental Dimensions; Schrecker, T., Ed.; Macmillan: London, UK, 1997. [Google Scholar]
- Hediger, W. Sustainable development and social welfare. Ecol. Econ. 2000, 32, 481–492. [Google Scholar] [CrossRef]
Figure 1.
HDI, EPI, ESI, Surplus Biocapacity (SB), and EmSI ranks of 2008. Note: Madagascar, Brazil, Ecuador, South Korea, Syria, Belgium and Cyprus have no data for SB from the data source we use. (a) HDI ranks; (b) EPI ranks; (c) ESI ranks; (d) SB ranks; (e) EmSI ranks.
Figure 1.
HDI, EPI, ESI, Surplus Biocapacity (SB), and EmSI ranks of 2008. Note: Madagascar, Brazil, Ecuador, South Korea, Syria, Belgium and Cyprus have no data for SB from the data source we use. (a) HDI ranks; (b) EPI ranks; (c) ESI ranks; (d) SB ranks; (e) EmSI ranks.
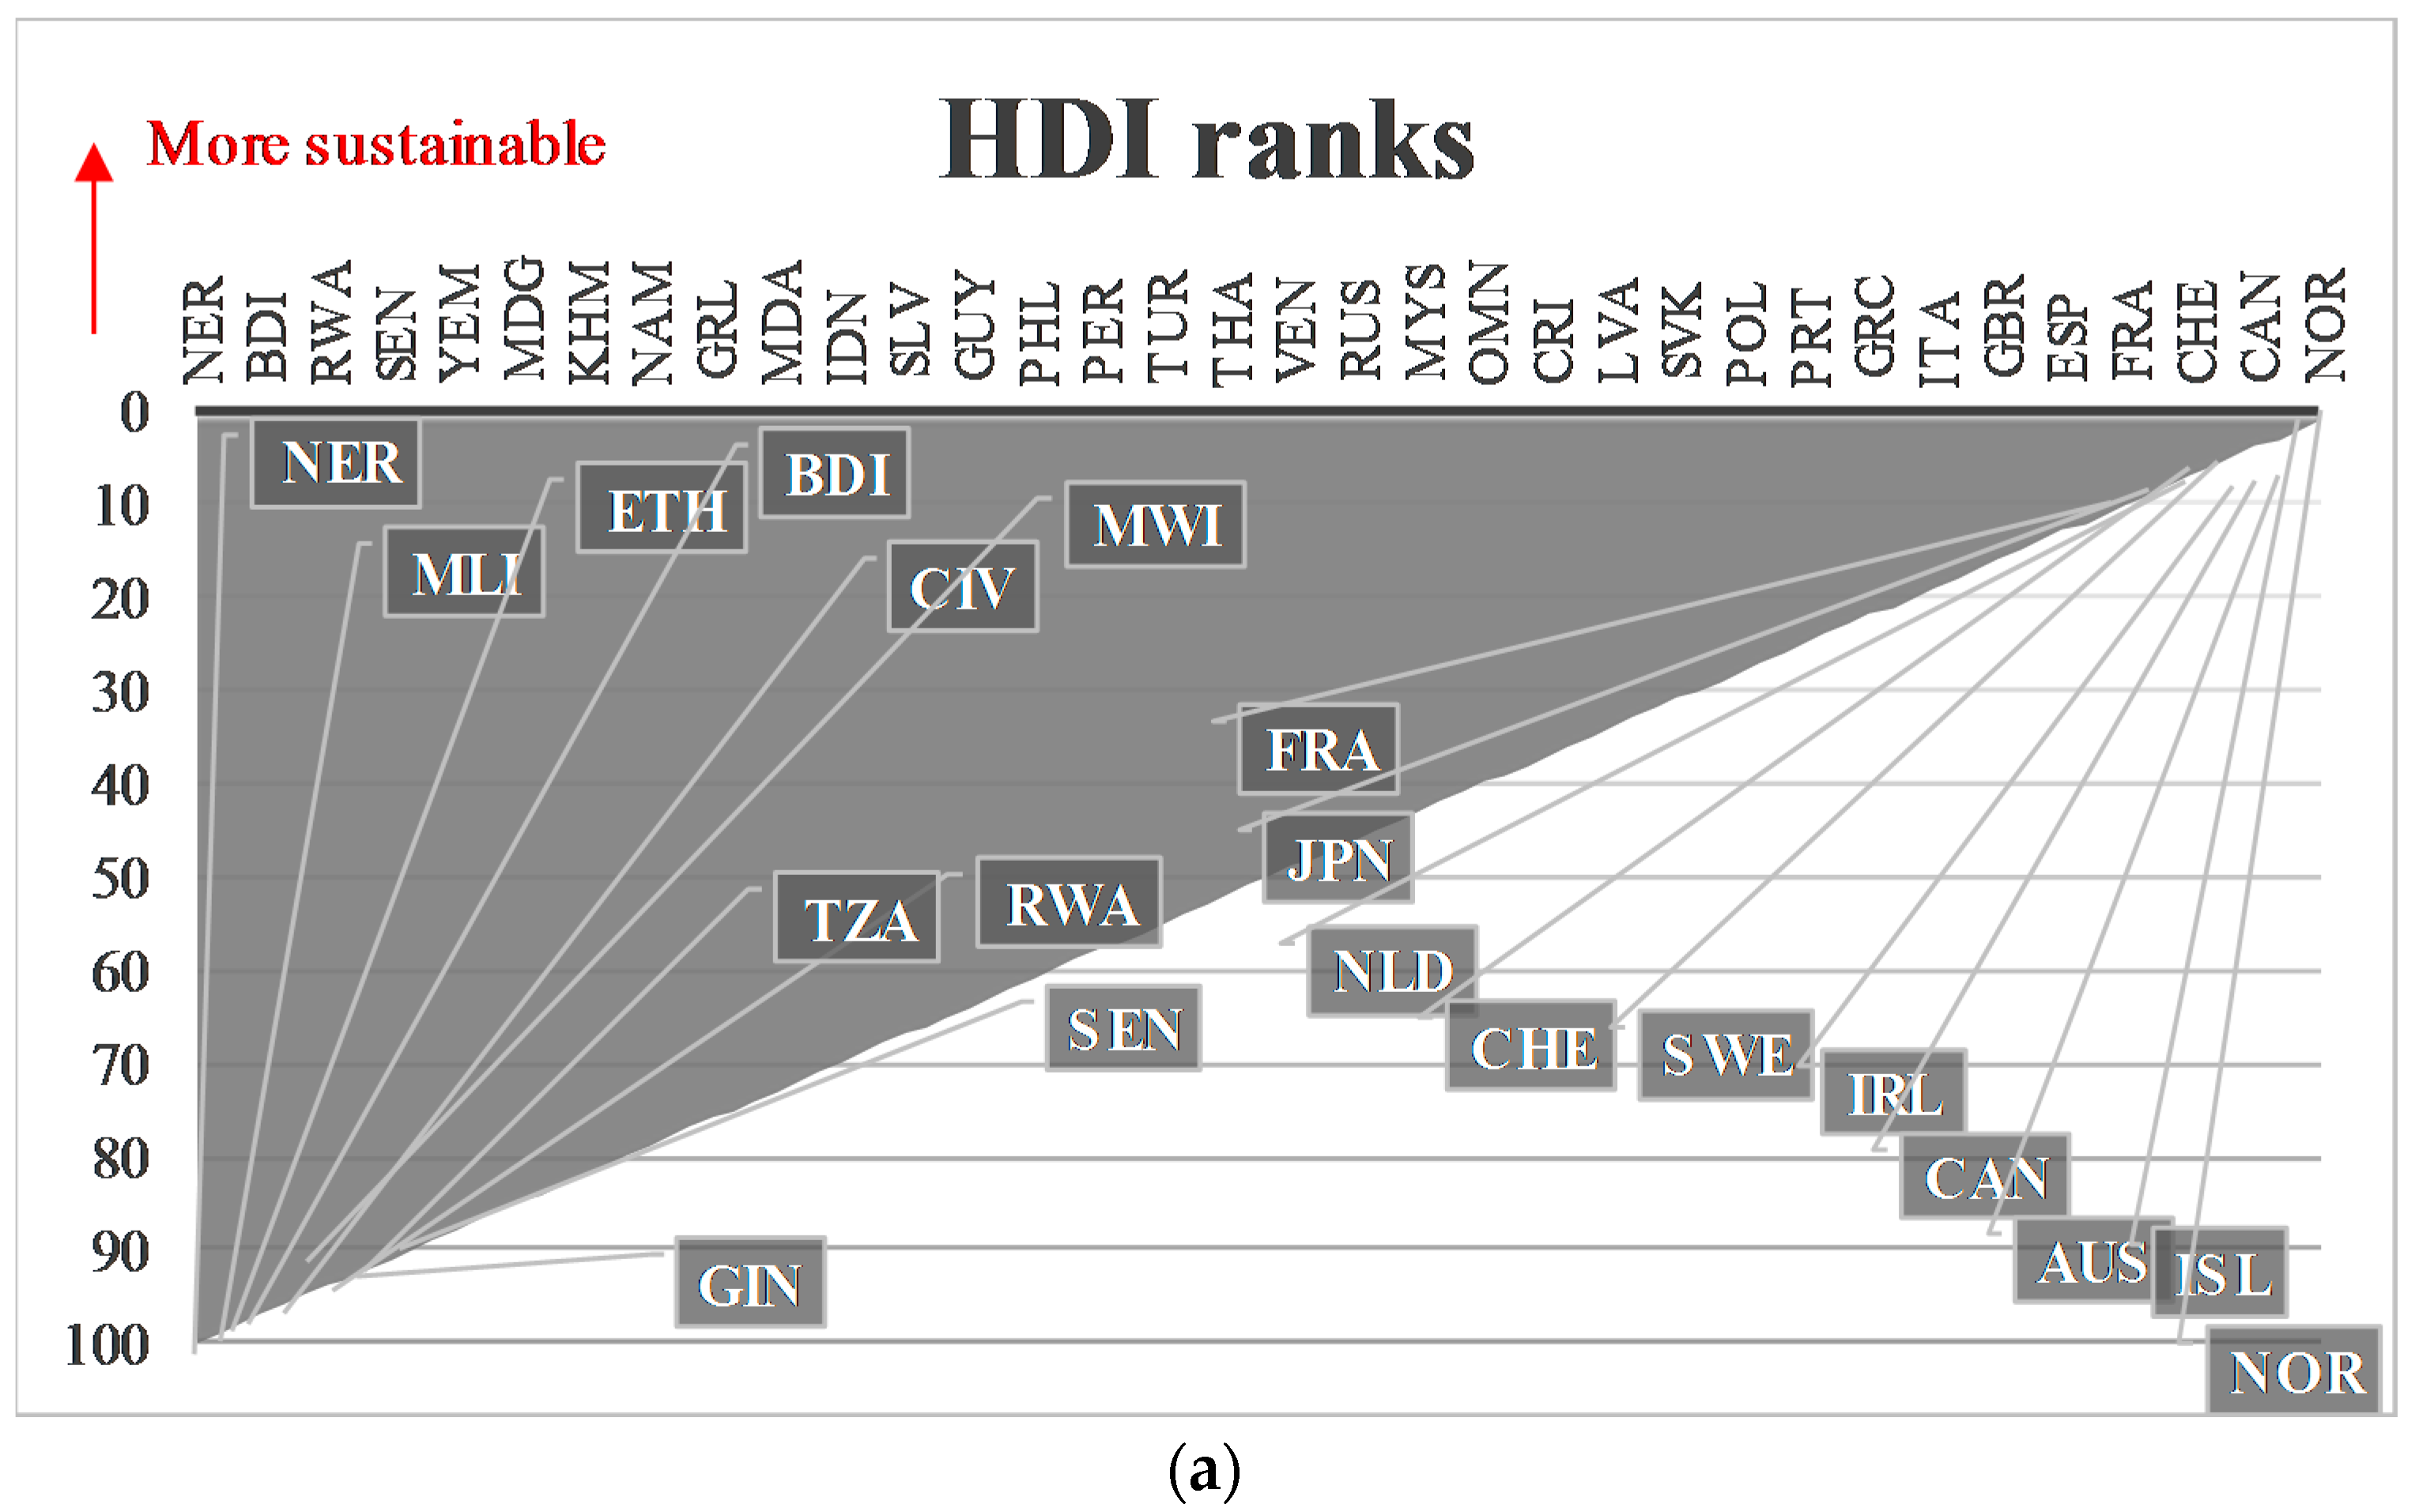
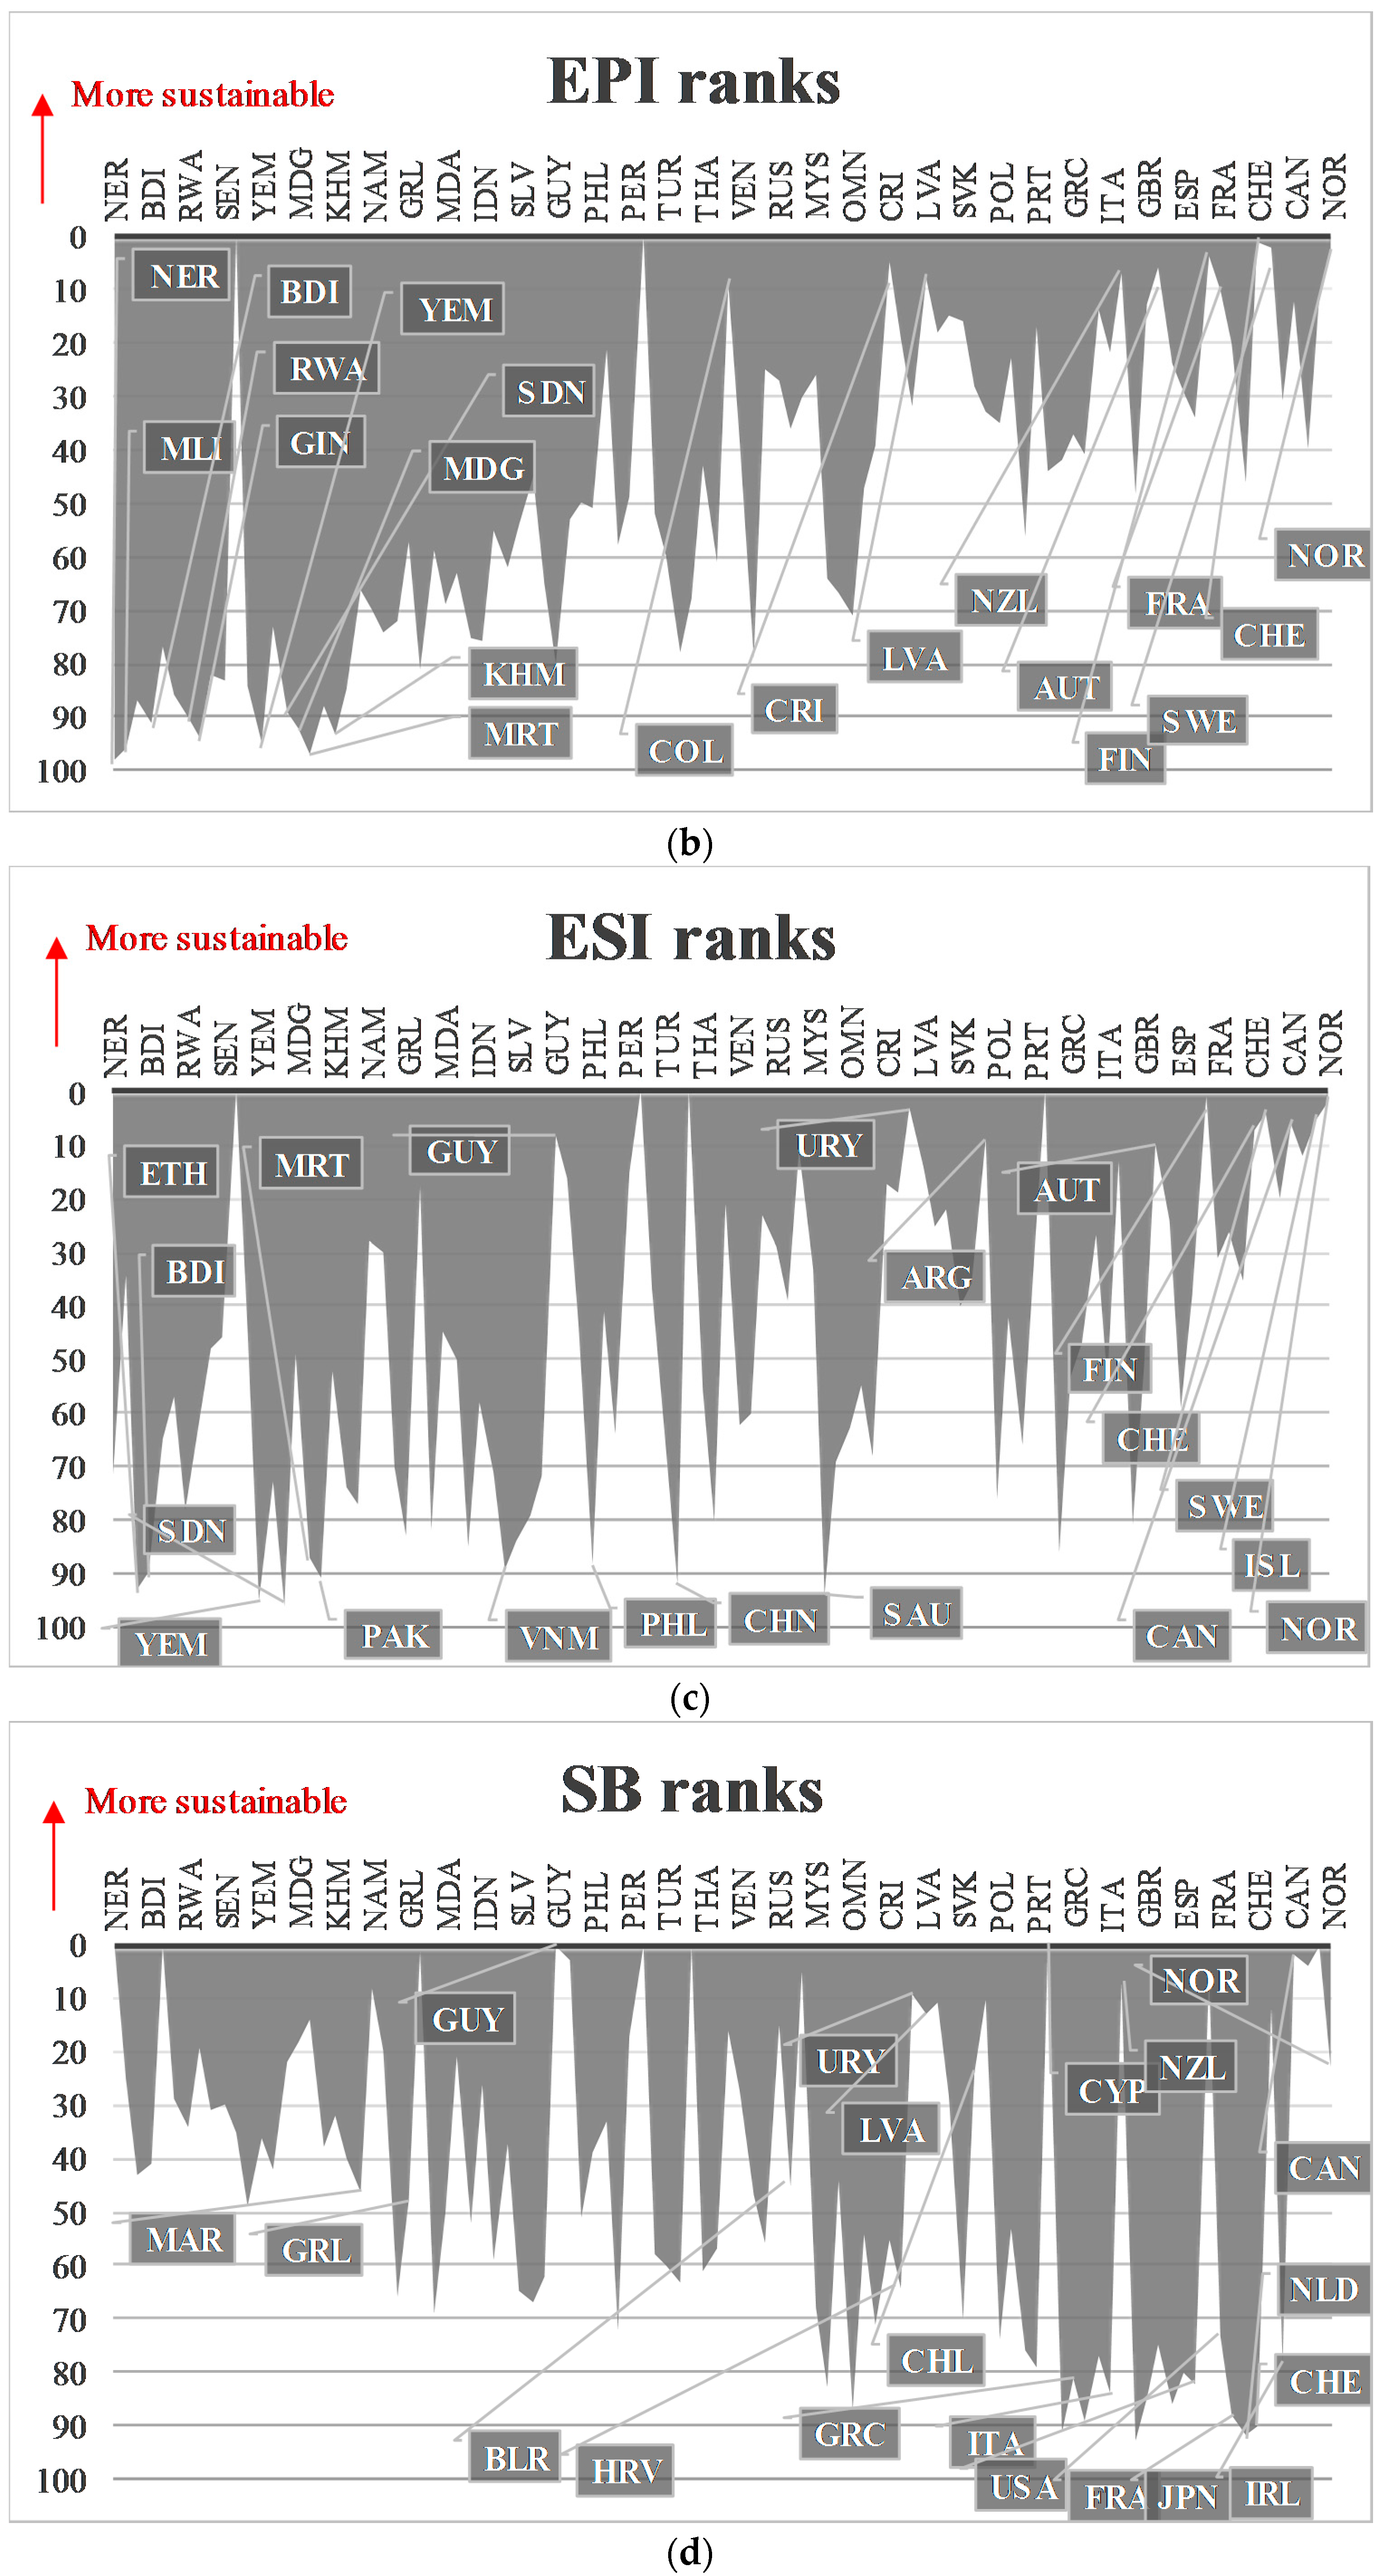

Figure 2.
Scatter plots of ESI, HDI, EPI, SB and EmSI ranks.

Figure 3.
Scatter plots between SDIs and AREA, PD, GDP, GNI, R% ranks. Notes: Area is Land Area of each country; PD is Population Density; GDP is Gross Domestic Product; GNI is Gross National Income; R% is percent renewable.
Figure 3.
Scatter plots between SDIs and AREA, PD, GDP, GNI, R% ranks. Notes: Area is Land Area of each country; PD is Population Density; GDP is Gross Domestic Product; GNI is Gross National Income; R% is percent renewable.


Table 1.
Summary table of the sustainability indicators.
| Name | Number of Sub-Indicators | Scaling/Normalization | Weighting | Indicators-Based/Single-Unit |
|---|---|---|---|---|
| HDI * | 3 | [0, 1], using minimum and maximum value for each indicator as goal post | Equal | indicators-based |
| EPI * | Six policy categories | [0, 100] | PCA/experts | indicators-based |
| ESI * | 68 | Mean subtraction and division by the standard deviation | Equal weights | indicators-based |
| EF ** | 6 | Area | Equal | Single-unit |
| EmSI | - | ≥0 | - | Single-unit |
Table 2.
R values of the Pearson correlation analysis of HDI, EPI, ESI, SB, and EmSI ranks.
| EmSI | ESI | HDI | EPI | SB | |
|---|---|---|---|---|---|
| EmSI | 1 | − | − | − | − |
| ESI | 0.0755 | 1 | − | − | − |
| HDI | −0.4488 (**) | 0.5629 (**) | 1 | − | − |
| EPI | −0.3777 (**) | 0.6567 (**) | 0.8329 (**) | 1 | − |
| SB | 0.6288 (**) | 0.2999 (**) | −0.3286 (**) | 0.1604 | 1 |
Note: ** Correlation is significant at the 0.01 level (2-tailed).
Table 3.
R values of the Pearson correlation analysis of SDI with AREA, PD, GDP, GNI and R% ranks in Figure 3.
Table 3.
R values of the Pearson correlation analysis of SDI with AREA, PD, GDP, GNI and R% ranks in Figure 3.
| AREA | PD | GDP | GNI | R% | |
|---|---|---|---|---|---|
| EIS | 0.1092 | 0.0892 | 0.5463 (**) | 0.5356 (**) | −0.3456 (**) |
| HDI | 0.1523 | 0.0510 | 0.6701 (**) | 0.6764 (**) | −0.4063 (**) |
| EPI | −0.2152 (*) | 0.0538 | 0.5393 (**) | 0.5487 (**) | −0.3321 (**) |
| SB | 0.0686 | −0.1491 | −0.5937 (**) | −0.5895 (**) | 0.3670 (**) |
| EmSI | 0.4358 (**) | −0.5155 (**) | −0.3544 (**) | −0.3543 (**) | 0.9622 (**) |
Note: ** Correlation is significant at the 0.01 level (2-tailed). * Correlation is significant at the 0.05 level (2-tailed).
© 2017 by the authors. Licensee MDPI, Basel, Switzerland. This article is an open access article distributed under the terms and conditions of the Creative Commons Attribution (CC BY) license (http://creativecommons.org/licenses/by/4.0/).
Share and Cite
MDPI and ACS Style
Liu, G.; Brown, M.T.; Casazza, M. Enhancing the Sustainability Narrative through a Deeper Understanding of Sustainable Development Indicators. Sustainability 2017, 9, 1078. https://doi.org/10.3390/su9061078
AMA Style
Liu G, Brown MT, Casazza M. Enhancing the Sustainability Narrative through a Deeper Understanding of Sustainable Development Indicators. Sustainability. 2017; 9(6):1078. https://doi.org/10.3390/su9061078
Chicago/Turabian StyleLiu, Gengyuan, Mark T. Brown, and Marco Casazza. 2017. "Enhancing the Sustainability Narrative through a Deeper Understanding of Sustainable Development Indicators" Sustainability 9, no. 6: 1078. https://doi.org/10.3390/su9061078
Note that from the first issue of 2016, this journal uses article numbers instead of page numbers. See further details here.