Nuclear Power and Resource Efficiency—A Proposal for a Revised Primary Energy Factor


Department of Building, Energy and Environmental Engineering, Faculty of Engineering and Sustainable Development, University of Gävle, Gävle SE 801 76, Sweden
Sustainability 2017, 9(6), 1063; https://doi.org/10.3390/su9061063
Submission received: 13 March 2017
/
Revised: 14 June 2017
/
Accepted: 14 June 2017
/
Published: 20 June 2017
(This article belongs to the Special Issue Nuclear Waste Management and Sustainability of Nuclear Systems)
Abstract
:Measuring resource efficiency can be achieved using different methods, of which primary energy demand is commonly used. The primary energy factor (PEF) is a figure describing how much energy from primary resources is being used per unit of energy delivered. The PEF for nuclear power is typically 3, which refers to thermal energy released from fission in relation to electricity generated. Fuel losses are not accounted for. However; nuclear waste represents an energy loss, as current plans for nuclear waste management mostly include final disposal. Based on a literature review and mathematical calculations of the power-to-fuel ratio for nuclear power, PEF values for the open nuclear fuel cycle (NFC) option of nuclear power and different power mixes are calculated. These calculations indicate that a more correct PEF for nuclear power would be 60 (range 32–88); for electricity in Sweden (41% nuclear power) PEF would change from 1.8 to 25.5, and the average PEF for electricity in the European Union (EU) would change from 2.5 to 18. The results illustrate the poor resource efficiency of nuclear power, which paves the way for the fourth generation of nuclear power and illustrates the policy implication of using PEFs which are inconsistent with current waste management plans.
1. Introduction
Nuclear power is sometimes seen as the solution to the climate crisis [1,2,3], as electricity produced in large quantities from the combustion of coal, oil, and natural gas needs to be replaced by alternatives with a much more limited climate impact. Renewable energy sources such as solar, wind, hydro, and wave power will have to be vastly expanded to replace the current use of fossil fuels, but will in turn result in significant challenges in balancing supply and demand in a smart grid [4]. Improving energy efficiency on large scale will be needed, as addressed in e.g., European energy targets [5], where efficiency measures are not only targeted on electricity. A countervailing force is the development of electric and fuel cell vehicles, which will further increase the need for clean power [6].
Leaving aside the fossil fuel energy required to produce uranium fuel, to build and maintain nuclear plants, and to establish and operate nuclear waste management, nuclear power can be considered a carbon neutral source of energy [7]. Nuclear power cannot, however, be regarded as a sustainable energy source due to the fact that it is a finite resource, in addition to the risk of nuclear radiation due to incidents and problems at mining sites, etc., cf. [8]. Attempts have been made to assess the environmental impact of nuclear power not only based on emissions, but also considering ionizing radiation from nuclear waste [9,10]. However, even if a serious nuclear accident can cause considerable damage to humans and other living organisms for a very long time period, the impact on the overall assessment is minor given the fortunately limited probabilities (whether calculated or based on radiation damage statistics) for such accidents [11].
This paper will not deal with environmental impact, such as the abovementioned important impacts from nuclear power, but instead focuses on resource efficiency. Evaluating resource use from energy use based on primary energy factors (PEF) has evolved both within the research community [12,13,14] and in, for example, the energy performance of buildings in the EU [15], and has gained a lot of interest due to its simplicity. The primary energy factor states the relationship between the total input of energy and the final energy use. The primary energy factor aims to measure the resource efficiency of different fuels or energy forms and neglects other environmental impacts such as pollution or other risks of damage to living organisms. As such, there are many flaws with primary energy measurements (e.g., it does not account for whether the resources are finite or not); nevertheless, this study focuses on an accurate primary energy factor for nuclear power.
The hypothesis is that current primary energy factors for nuclear power do not take all energy losses into consideration. In particular, losses related to fuel production and nuclear waste for an open nuclear fuel cycle (NFC) are not included. This may have an immense impact on the actual PEF value and, as nuclear power is prominent in energy systems of the industrial world, will also affect the weighted mean PEF value for individual countries as well as regions such as the EU. This study is a critical review of how the primary energy factor for nuclear power is currently calculated and it suggests a new, more accurate calculation of PEF for nuclear power.
2. Materials and Methods
The critical review consists of a combination of literature review and calculations. First, a literature review on current primary energy factors for open NFC nuclear power was compiled. Potential differences between different sources were followed up and values were evaluated in relation to the primary energy definition. The next step consisted of calculations, where potential inconsistencies in the literature were dealt with. An updated primary energy factor for nuclear power was calculated, as well as the updated primary energy factors for Swedish and European electricity mixes. Finally, an analysis of the findings was performed, where nuclear power is compared to other sources of electricity generation in terms of primary energy demand. Furthermore, implications of the current and new primary energy factor on energy policy are discussed.
3. Results
3.1. Literature Review
Primary energy of nuclear power is present in many scientific papers, but often just as an applied number in calculations or assessments. There are few references in scientific papers which actually elaborate on the issue. One study in Energy Policy [12] discusses different energy indicators in relation to different electricity generation technologies. Primary energy demand is one of these indicators, referred to as cumulative energy demand (CED). In Section 2.3.2 of Reference [12], the authors discuss the primary energy content of nuclear, hydro, and wind power. For nuclear power, two approaches are presented. One refers to primary energy as the energy content in the turbine of the power plant, i.e., multiplying final energy (electricity) by 3, thereby assuming a life cycle energy efficiency of 33% [16]. The second approach is found in the Ecoinvent database, commonly used in life cycle assessments. Here, the primary energy is defined as “the energy content of the fissile isotope in the natural uranium extracted from the mines” [17]. The second approach suggests a more holistic view, covering the whole life cycle back to the cradle, but according to the authors they do not result in great differences (10.8 MJ/kWh for the IEA (International Energy Agency) approach and 11.5–12.9 MJ/kWh for Ecoinvent approach).
Wilby et al. [13] present and discuss empirical and dynamic primary energy factors. Different tools and methodologies for calculating PEFs are mentioned, e.g., SAP (Standard Assessment Procedure) and GEMIS (Global Emission Model for Integrated Systems). The paper also mentions policy aspects such as directive 2009/28/EC on the promotion of the use of energy from renewable sources [18], the EPBD (energy performance of buildings directive) [15], and the ESD (energy service directive) [19,20]. These directives appeal to European standards such as EN 15603:2008 [21], which establishes the recommended PEFs for different types of electricity generation, and the standard prEN 15203/15315:2006 [22], which lists PEF values. Values of PEFs from different sources are also presented where the value for nuclear electrical power is included in Table 1 below.
One example of values based on GEMIS is found in a report from IINAS (International Institute for Sustainability Analysis and Strategy) [23]. GEMIS is both a model and a database used in EU and OECD (Organisation for Economic Co-operation and Development) countries for life-cycle assessment and it “evaluates environmental impacts of energy, material and transport systems, i.e., air emissions, greenhouse gases, wastes, and resource use (primary energy, raw materials, land, water)” [23]. The model takes into account direct impact from operation and indirect impact from auxiliaries and materials needed to construct the processes. Data on nuclear power is presented for Germany, France, and the UK; total value of PEFs are displayed in Table 1. A minor share (0.02) is attributed to renewable energy sources.
One of the most widely used data sources for PEF in Sweden is the book of environmental facts for fuels [24]. Nuclear power is included; the value is found in Table 1. System boundaries seem to be consistent with the GEMIS approach. Fuel production, including the production of auxiliary materials, is included. Construction and deconstruction of nuclear power plants are also included as well as nuclear waste management. Internal use of electricity is calculated as nuclear power.
In a report from Adapt Consulting [25], prepared for Energy Norway, different conversion factors for electricity are presented (Annex 1) as well as an assessment of their impact on EU energy and climate goals (Annex 5). In the report, the problem of associating nuclear power and renewable energy sources with correct PEF is acknowledged: “It may not be possible to quantify the energy content in the wind or the sun that serves as a fuel for wind and solar power plants. In conventional nuclear power plants, only 10% of theoretical energy content in the fuel is converted to electricity, but if the waste is reprocessed, it can be possible to recover large portions of the energy content.” This challenge is met by an approach called the “partial substitution method,” which focuses on the theoretical energy content of traditional fossil fuels. This means that renewable and nuclear energy is valued in terms of primary fossil energy (the overall efficiency is assumed to 40%). In the report, alternative methods for calculating PEFs are presented (physical energy content and European standard on energy performance of buildings for both non-renewable and total PEF); these are all displayed in Table 1. Except for the higher value for French nuclear power, suggesting a lower degree of efficiency, most data sources report a PEF of approximately 3, which is consistent with the thermal energy released in the turbine. In case upstream activities such as ore mining, etc. are included, losses are small.
A relevant question before continuing is whether PEF is an appropriate measure of resource efficiency. According to Alvarenga et al. [14], natural resources can be categorized as: (a) renewable or non-renewable; (b) stocks, funds, or flows; (c) biotic (living organisms) or abiotic (the result of past biological processes (e.g., crude oil) or chemical processes (e.g., metal)), among other classifications. In LCA (Life Cycle Assessment) [26], the environmental impact due to material and energy flows are calculated based on inflows to the technical system (use of resources) and outflows (emissions to air, water, and soil). Resource scarcity can be included in LCA to varying degree as RAM (Resource Accounting Method), mid-point resource depletion, or end-point depletion [14]. The PEF measure (CED) is to be categorized as a RAM. A vast number of different approaches to resource assessment using exergy approaches, etc. are presented and discussed, and are also applied to the case of ethylene [14]. Despite the fact that some of these approaches may actually be more scientific and informative than PEF, the use of PEF or CED has become so widespread that suggesting an improvement within the PEF measure would probably gain more attention than suggesting new ways of measuring.
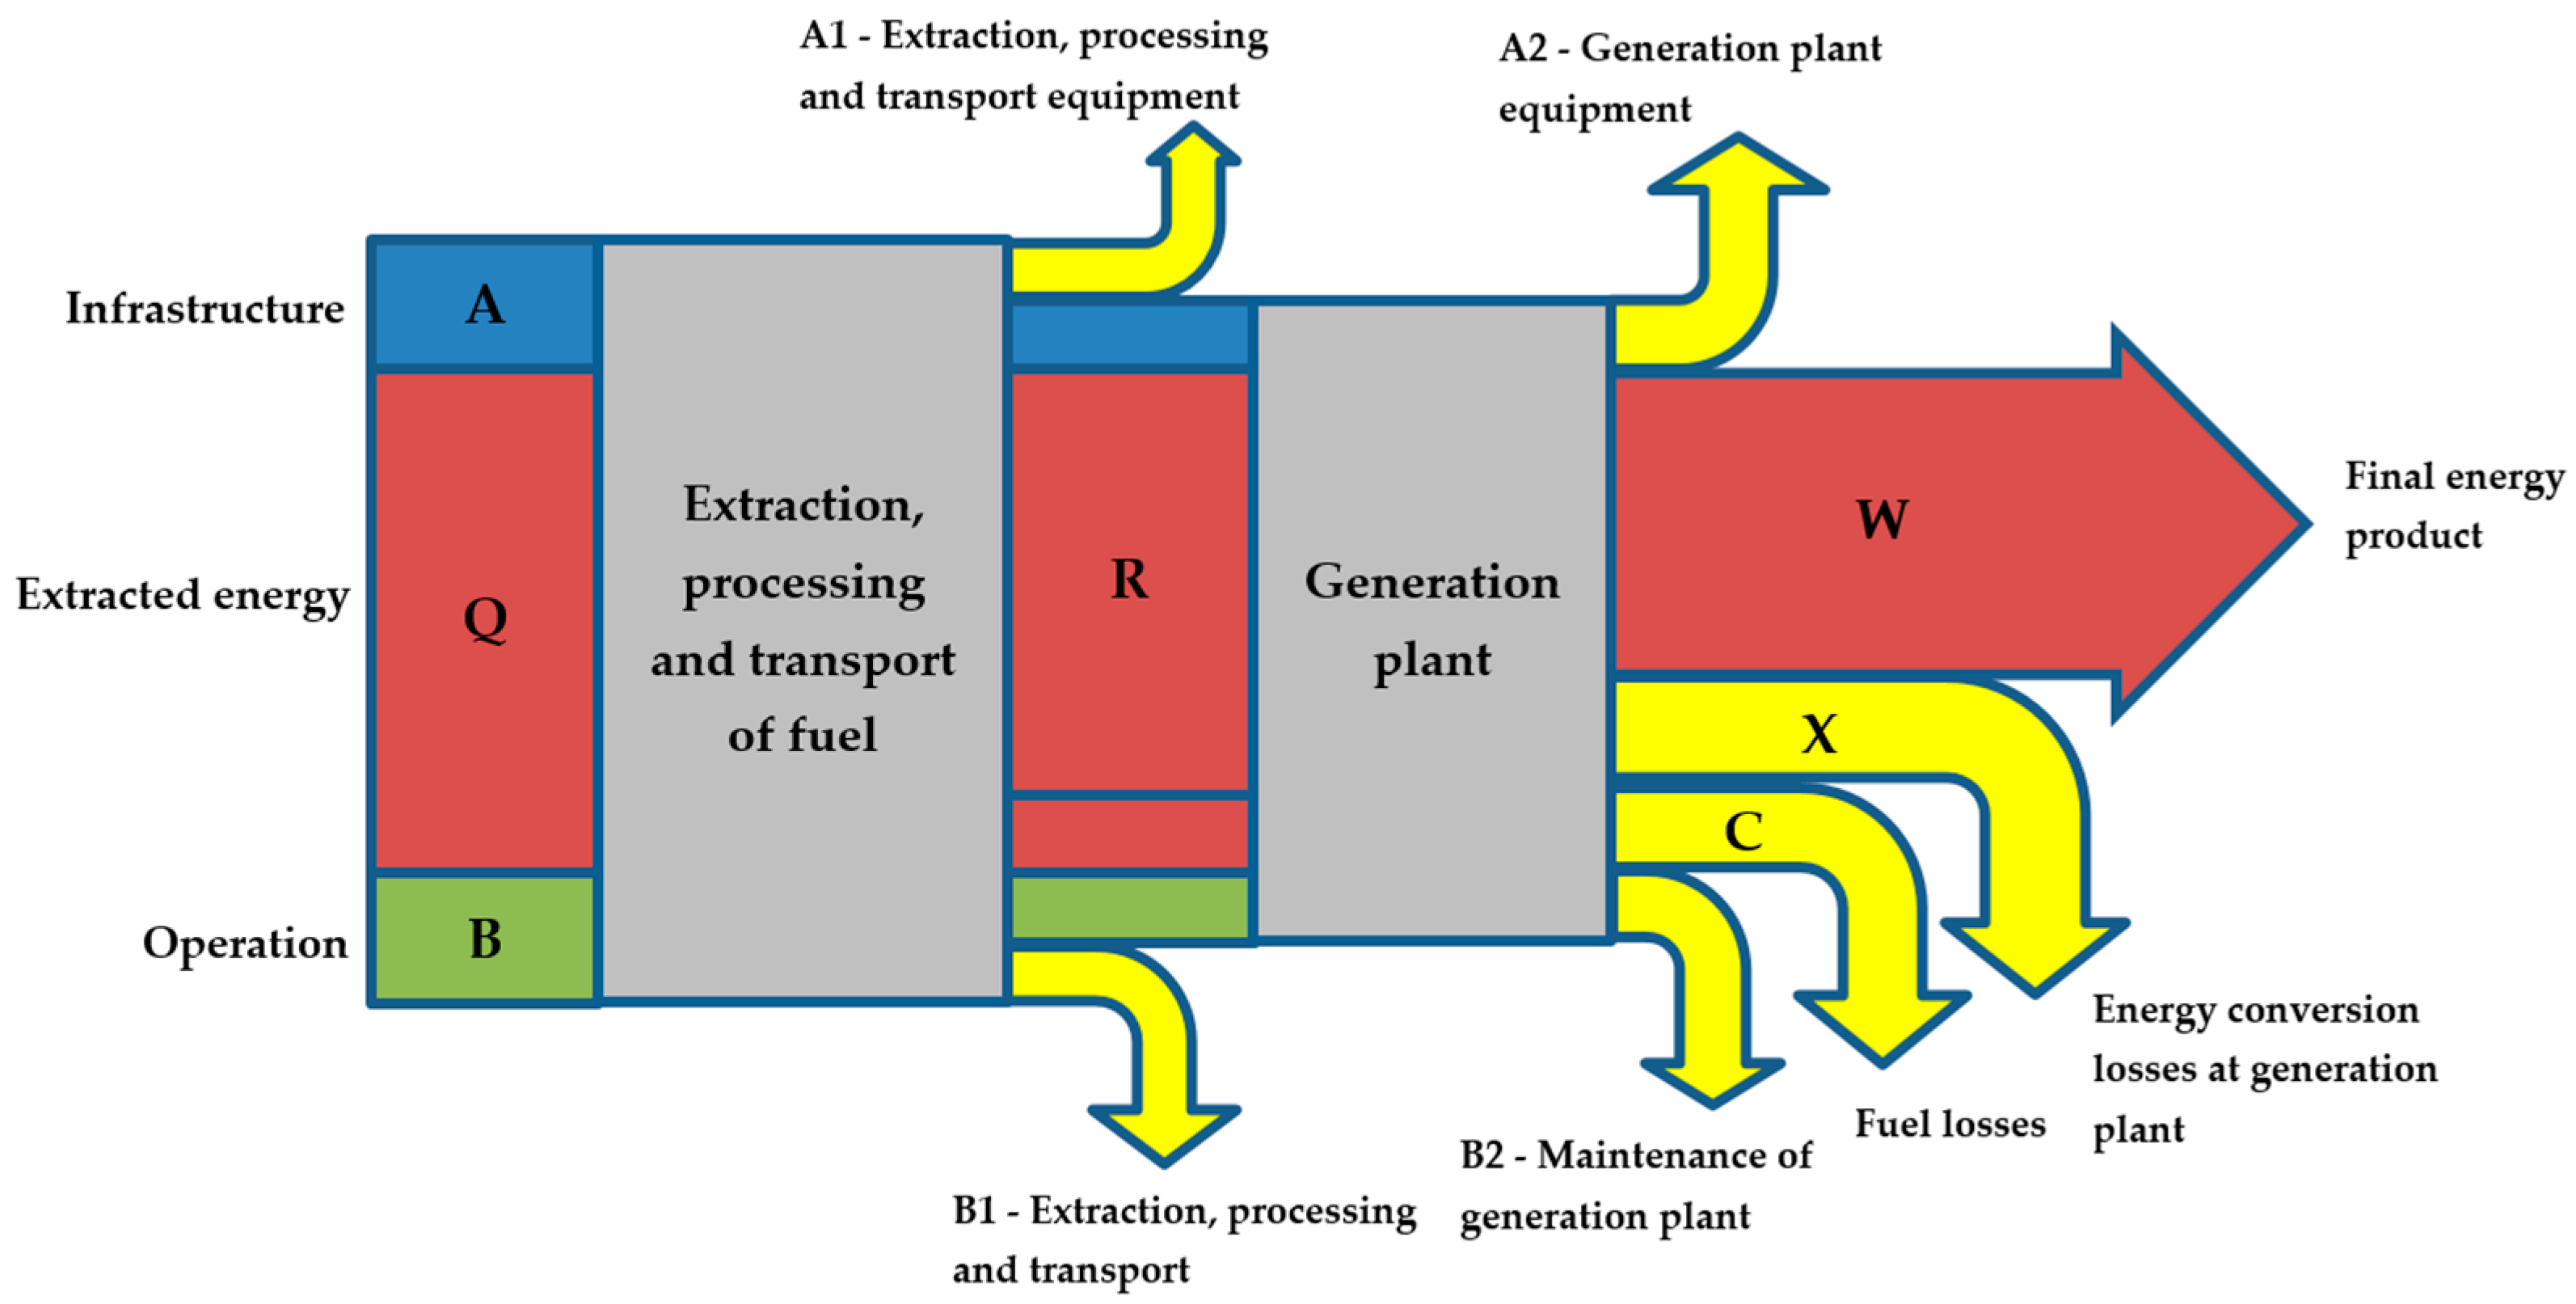
Coming back to the definition of primary energy, it is vital to consider all losses pre-combustion. In Figure 1, a reproduction from Reference [12], different types of losses are graphically illustrated.
The prevailing PEF = 3 for nuclear power sets the relation between W and the sum of W + X. Some data sources also include losses from operation (B1, B2) and infrastructure (A1, A2) but these are minor. It is obvious that fuel losses (C) have so far been neglected when assessing nuclear power. However, one of the most problematic issues with nuclear power is the problem with radioactive waste. The waste is partly low or medium active (used equipment, clothes, etc.) while the majority of the high active waste is spent fuel. Radioactivity is a form of energy, meaning that radioactive waste contains huge amounts of primary energy. This loss is not accounted for in the PEF, which suggests that the energy in spent fuel should be seen as a potential resource that has not been consumed. However, at least in Sweden, the major plan is to bury nuclear waste underground, preserving the waste at its final destination using a method which can be considered as “point of no return,” i.e., the waste is not intended to be used. This means that the current PEF for nuclear power is inconsistent with most current plans for the final disposal of spent fuel. It should also be noted that this circumstance separates nuclear power from the combustion of solid (like coal or biomass) or liquid (e.g., oil, gasoline) fuels, where fuel-related energy losses are moderate due to more or less complete combustion processes.
3.2. Calculations
Nuclear power plants are seldom fueled with natural uranium, but with uranium fuel. The form, or isotope, of uranium which is fissile is the uranium-235 (U-235) isotope. Natural uranium, as found in ore, has a low share (0.7%) of Uranium-235; the remaining part is Uranium-238 [27]. For most types of reactors, the concentration of U-235 needs to be increased (enriched)—typically to between 3.5% and 5% U-235 [27]. Used fuel still contains approximately 96% of its original uranium (U-235 and U-238), of which the U-235 content has been reduced to below 1%. About 3% of the used fuel contains waste products and the remaining 1% is plutonium (Pu) produced while the fuel still was in the reactor but not yet consumed. In the following, fuel losses (C in Figure 1) and PEF considering these losses are calculated. The calculation is focused on the energy transformation in the nuclear power plant (from nuclear energy to electrical energy), but also includes energy losses upstream from the nuclear power plant (enrichment and fuel fabrication) as well as its implication on PEF for the electrical power grid mix.
The first step is to consider the transformation of nuclear energy to electrical energy. In this step, the amount of nuclear energy (expressed as energy density) of the fuel is determined together with the released thermal energy, referred to as burn-up, and generated electricity, which is calculated by using the power-to-heat ratio. The energy density is expressed as the amount of energy released per unit of mass. Calculations made for the fission of any uranium, plutonium, thorium, or any other actinide isotope results in 200 MeV per fission on average [28]. The 200 MeV is converted to the so-called energy equivalent of appr. 372 kg/(GWyr), which is the rate at which the mass of any actinide is transferred to the mass of fission products (lantanides) in a fission reaction. The energy equivalent of 372 kg/(GWyr) is equivalent to 23,564 MWh/kg. This value has been validated against other references displayed in Table 2. The calculated energy density of 23,564 GWh is within the interval in Table 2, representing a good approximation.
The amount of energy that has been released during fission depends on the reactor type, enrichment level, etc.; it is measured as burn-up. The burn-up is the released thermal energy per mass unit of uranium, which is later transformed to electricity and heat losses [33]. Reported burn-up values from various sources are found in Table 3.
Based on the reported values in Table 3, a baseline assumption of 50 GWd/tHM is assumed [34]. As burn-up may vary considerably from one reactor to another, two additional burn-up scenarios of 40 [27] and 73 [34] have been included to be able to draw general conclusions.
Going from thermal energy to electrical energy is achieved using a regular power-to-heat ratio for nuclear power plants. The baseline power-to-heat ratio is set to 33%, which is consistent with the average PEF reported previously (Table 1). Lower efficiencies of 27.9 [17] and 41 [34] have been included as well.
Summing up previous calculations, the inverted power-to-fuel ratio (PEF) is hence calculated as:
ED = energy density; BU = burn-up; η = power-to-heat ratio.
Resulting PEFs for the different assumptions on burn-up and power-to-heat ratio are displayed in Table 4.
Two observations can be made from Table 4. The first is that the calculated PEFs vastly exceed the existing PEF of 3, which suggests that the current value underestimates the poor use of uranium fuel. The other observation is that, in contrast to the current PEF (cf. Table 1), which revolves around 3 irrespective of reactor type, etc., the calculated values in Table 4 suggest a large variation between different fuel cycles and reactor types.
Besides fuel losses, some additions following the life cycle of the fuel can be made. Adding fuel fabrication (2000 MJ/kg [35]) and enrichment (5177 MJ/kg [36]), upstream energy losses can be summarized as 1.9 × 10⁻³ GWh/kg (2000 + 5177 = 7177 MJ/kg =1944 kWh/kg). This is considerably lower than the energy intensity of the fuel itself, which means that this addition will not change the PEF value. Other possible additions would be the energy needed to mine the uranium ore, construct the nuclear power plant, etc. However, these are not accounted for, as it is assumed that they are also negligible.
To illustrate the consequence of a much higher PEFnuclear on the system level, the impact on the weighted average PEF for different power mixes were calculated. The Swedish power mix with 41% nuclear power in 2014 [37] and the European mix with 27.4% nuclear power in 2014 [38] were applied. Data on the Swedish power mix and PEFs used are displayed in Table 5.
The PEFs in Table 5 vary considerably, comprising different types of primary energy as shown in the units. For hydropower, a 90% degree of efficiency in the turbine is applied. Wind power is considered as “free” energy, where losses in transmission and distribution of 5% have been included. The PEFs below zero violates the first law of thermodynamics, which suggests a more proper value to be 1.05, but the value of 0.05 is still frequently used, at least in Sweden. For nuclear power, the power-to-heat ratio is 34% and for combined heat and power (CHP) plants, a high degree of efficiency of 57% was used as approximation.
Changing the PEFnuclear from 2.92 to 60 changes the primary energy demand to 3732 TWh for nuclear power and 3825 TWh for the Swedish power mix. The PEF for the Swedish power mix changes from 1.83 to 25.5.
For the European power mix, official statistics are somewhat troublesome as the term “conventional thermal” is used for almost 50% of the power supply without stating what fuels or processes are used [38]. However, according to EU directives [18,19,20], a mean PEF of 2.5 is set for electricity which reflects an average efficiency of 40%. As nuclear power constituted 27.4% of the total power supply of 3031 TWh in the EU in 2014 [38], the average PEF was recalculated to 18 (Appendix A).
4. Discussion
Changing, or perhaps the term should be ‘correcting,’ the PEFnuclear in line with what is suggested does not only increase the PEF for nuclear power itself, it may actually affect the PEF for an entire power mix. The examples above on PEF changes show that the PEF for Sweden increases from 1.83 to 25.5, while for the EU in increases from 2.5 to 18, suggesting that the EU mix, despite its high use of fossil fuels in comparison to Sweden, is more resource efficient. It is, however, important to bear in mind that in terms of emissions and use of fossil resources, the Swedish power mix can be regarded as having better environmental performance than the EU mix.
According to the IINAS report [23], a vast number of PEFs for different power sources are displayed in Table 4. Apart from ‘wastes-EU,’ which typically reflects incineration condense power plants with poor power-to-fuel data, the PEFs for nuclear power are already the highest, followed by various bioenergy sources, lignite, coal, and natural gas. The lowest PEFs are found for solar, hydro, and wind power. The finding in this study may seem controversial, as the range for current PEFs are 1–5 and sometimes even below 1 (depending on whether renewable energy is accounted for, how allocation is made for wastes, if biofuel is considered as waste, and how surplus heat from industrial production is valued). Suggesting a PEF of 60 (range 32–88) for nuclear power would just “move the whole system” and define a new “base level” for PEF for electricity. As nuclear power is being decommissioned, or as the fourth generation of nuclear power enters the market, the PEF for the power grid mix would drop.
Current primary energy factors implicitly mean there is no energy loss associated with the waste; that is, nuclear waste should in principle be reprocessed into plutonium (Pu-239) and used in a Breeder reactor along with excess of Uranium-238 from enrichment. The spent fuel from the Breeder reactor is also highly radioactive and must be subject to final disposal, but the half-life is significantly shorter. So, in addition to the fact that nuclear waste can be reused as fuel, the long-term problem of radioactive waste is reduced. The decisions taken today on nuclear power, being based on current primary energy factors, are in fact very costly as they require future investments in methods for extraction of the energy in nuclear waste. The spent fuel policy in most countries is based on direct disposal, whereas some countries such as China, France, and Japan have reprocessing policies supporting closed NFC [39,40]. Reprocessing used nuclear fuel provides a significant (by many orders of magnitude) reduction of the potential hazard of nuclear waste. The re-use of reprocessed used fuel is an environmentally friendlier option for nuclear power which provides a safer nuclear waste management route [41]. This suggests that PEF should be considered differently between different countries. However, reprocessing is still subject to research, and no large-scale plants have been built thus far [34,42,43]. On the other hand, with reprocessing, the need for final disposal is considerably reduced which implicitly means that the overall costs of fourth-generation nuclear power will be lower than projected.
These calculations are sensitive to the assumption for burn-up. The International Atom Energy Agency (IAEA) reports on retrospective and prospective data on burn-up worldwide [44]. Their data shows that the performance of existing fuels is continuously increasing and that the increase will continue for all types of light water reactors (LWRs). While the average discharge burnup of pressurized water reactors (PWRs) will increase to 60 GWd/t in 2050, boiling water reactor (BWR) will reach 54 GWd/t. The most dramatic increase is perhaps found for PHWRs (Pressurised Heavy Water Reactors), where slightly enriched uranium will substitute natural uranium, increasing the burn-up from 7 to 20 GWd/t. Such a development is, together with reprocessing plants, very positive in terms of the resource efficiency of nuclear power.
Another interesting aspect is how the view of Energiewende in Germany could change if the new primary energy factor of nuclear power takes effect. Some argue that it is a success story when Germany, and thereby also the EU, reduces the use of finite resources (uranium) and shifts towards renewable resources. Detractors argue that the use of fossil fuels such as coal has increased in the short term, and additionally the climate impact would have been decreased if renewable resources had replaced fossil fuels instead of nuclear power. However, in terms of resource efficiency, as measured by the proposed higher primary energy factor, Energiwende must be considered as a great success.
Possible future research could include a closer investigation of temporal aspects in both retrospective and forward-looking studies on the development of electricity systems with respect to PEFs. Inconsistencies in PEFs for other types of power supplies could also be addressed. Consequential analyses of introducing fourth generation nuclear power, given the new PEF, would also be interesting, both in terms of resource efficiency and economy.
5. Conclusions
- Most current primary energy factors are based on heat content in the turbine of the nuclear power plant, meaning PEF = 3.
- Previous PEFs do not include all relevant losses, in particular fuel losses as radioactive waste.
- This implies that spent fuel is seen as a potential resource which has not been used. This is inconsistent with current policy for the final disposal of nuclear waste in most countries.
- The calculations indicate that a more correct PEF would be 60.
- The PEF is highly sensitive to the actual burn-up, and may vary between 32 and 88 or more. This implies that PEFs for nuclear power have to be calculated on an individual plant level instead of using the current generic value.
- The average PEF for electricity in Sweden with 41% nuclear power in its mix would change from 1.8 to 25.5 if the calculated PEF was introduced.
- The average PEF for electricity in the EU would change from 2.5 to 18 if the calculated PEF was introduced.
Acknowledgments
Funding of the study is partly supplied by Fjärrsyn and partly by the University of Gävle. My gratitude to Björn Karlsson at the University of Gävle for his interest in the correctness of PEFs and the mental support and review of this work.
Conflicts of Interest
The author declares no conflict of interest. The founding sponsors had no role in the design of the study; in the collection, analyses, or interpretation of data; in the writing of the manuscript, and in the decision to publish the results.
Appendix A. Calculation of PEF for the EU Electricity Mix
Total primary energy demand: 3031 × 2.5 = 7578 TWh
Current primary energy demand, nuclear power: 3031 × 0.274 × 2.92 = 2425 TWh
New primary energy demand, nuclear power: 3031 × 0.274 × 60 = 49,830 TWh
New total primary energy demand: 7578 − 2425 + 47,338 = 54,983 TWh
New PEF: 54,983/3031 = 18
References
- Sailor, W.C.; Bodansky, D.; Braun, C.; Fetter, S.; van der Zwaan, B. A Nuclear Solution to Climate Change? Science 2000, 288, 1177–1178. [Google Scholar] [CrossRef]
- International Atomic Energy Agency (IAEA). Climate Change and Nuclear Power; International Atomic Energy Agency: Vienna, Austria, 2016. [Google Scholar]
- Intergovernmental Panel on Climate Change (IPCC). Climate Change 2014: Synthesis Report; Contribution of Working Groups I, II and III to the Fifth Assessment Report of the Intergovernmental Panel on Climate Change; Core Writing Team, Pachauri, R.K., Meyer, L.A., Eds.; IPCC: Geneva, Switzerland, 2014; p. 151. [Google Scholar]
- Lund, H.; Andersen, A.N.; Østergaard, P.A.; Mathiesen, B.V.; Connolly, D. From electricity smart grids to smart energy systems—A market operation based approach and understanding. Energy 2012, 42, 96–102. [Google Scholar] [CrossRef]
- European Commission. Communication from the Commission to the European Parliament, the Council, the European Economic and Social Committee and the Committee of the Regions; A Policy Framework for Climate and Energy in the Period from 2020 To 2030; European Commission: Brussels, Belgium, 2014. [Google Scholar]
- GEA. Global Energy Assessment—Toward a Sustainable Future; Cambridge University Press: Cambridge, UK; New York, NY, USA; The International Institute for Applied Systems Analysis: Laxenburg, Austria, 2012. [Google Scholar]
- Schlömer, S.; Bruckner, T.; Fulton, L.; Hertwich, E.; McKinnon, A.; Perczyk, D.; Roy, J.; Schaeffer, R.; Sims, R.; Smith, P.; et al. Annex III: Technology-specific cost and performance parameters. In Climate Change 2014: Mitigation of Climate Change; Contribution of Working Group III to the Fifth Assessment Report of the Intergovernmental Panel on Climate Change; Edenhofer, O., Pichs-Madruga, R., Sokona, Y., Farahani, E., Kadner, S., Seyboth, K., Adler, A., Baum, I., Brunner, S., Eickemeier, P., et al., Eds.; Cambridge University Press: Cambridge, UK; New York, NY, USA, 2014. [Google Scholar]
- Verbruggen, A. Renewable and nuclear power: A common future? Energy Policy 2008, 36, 4036–4047. [Google Scholar] [CrossRef]
- Frischknecht, R.; Braunschweig, A.; Hofstetter, P.; Suter, P. Human health damages due to ionizing radiation in life cycle impact assessment. Environ. Impact Assess. Rev. 2000, 20, 159–189. [Google Scholar] [CrossRef]
- Joint Research Center. ILCD Handbook: Recommendations for Life Cycle Impact Assessment in the European Context—Based on Existing Environmental Impact Assessment Models and Factors; Publication Office of the European Union: Luxembourg, 2011; JRC 61049, EUR 24571 EN. [Google Scholar]
- Glaumann, M.; Assefa, G.; Kindembe, B.; Eriksson, O. Miljövärdering av Bebyggelse Extern Miljöpåverkan Beskrivning av Olika Miljöpåverkanskategorier; FoU-rapport Nr 33; Högskolan i Gävle: Gävle, Sweden, 2009. [Google Scholar]
- Modahl, I.S.; Raadal, H.L.; Gagnon, L.; Bakken, T.H. How methodological issues affect the energy indicator results for different electricity generation technologies. Energy Policy 2013, 63, 283–299. [Google Scholar] [CrossRef]
- Wilby, M.R.; Rodríguez Gonzalez, A.B.; Vinagre Díaz, J.J. Empirical and dynamic primary energy factors. Energy 2014, 73, 771–779. [Google Scholar] [CrossRef]
- Alvarenga, R.A.F.; de Lins, I.O.; de Almeida Neto, J.A.D. Evaluation of Abiotic Resource LCIA Methods. Resource 2016, 5, 13. [Google Scholar] [CrossRef]
- European Commission. Directive 2010/31/EU of the European Parliament and of the Council of 19 May 2010 on the Energy Performance of Buildings (Recast). Off. J. Eur. Union 2010, 18, 13–35. [Google Scholar]
- International Energy Agency (IEA). Energy Statistics Manual; International Energy Agency (IEA): Paris, France, 2004; Available online: http:// www.iea.org/stats/docs/statistics_manual.pdf (accessed on 16 June 2017).
- Frischknecht, R.; Jungbluth, N.; Althaus, H.-J.; Doka, G.; Dones, R.; Hellweg, S.; Hischier, R. Implementation of Life Cycle Impact Assessment Methods; Final Report Ecoinvent v2.0 No. 3; Swiss Centre for Life Cycle Inventories: Dübendorf, Switzerland, 2007. [Google Scholar]
- European Commission. Directive 2009/28/EC of the European parliament and of the council of 23 April 2009 on the promotion of the use of energy from renewable sources and amending and subsequently repealing directives 2001/77/EC and 2003/30/EC. Off. J Eur. Union 2009, 5, 16–62. [Google Scholar]
- European Commission. Directive 2006/32/EC of the European parliament and of the council of 5 April 2006 on energy end-use efficiency and energy services and repealing council directive 93/76/EEC. Off. J. Eur. Union 2006, 27, 64–85. [Google Scholar]
- European Commission Communication (COM). 370 Final: Proposal for a Directive of the European Parliament and of the Council on Energy Efficiency and Repealing Directives 2004/8/EC and 2006/32/EC; European Commission Communication: Brussels, Belgium, 2011. [Google Scholar]
- Comité Européen de Normalisation (CEN). Energy Performance of Buildings Overall Energy Use and Definition of Energy Ratings; Standard EN 15603:2008; Comité Européen de Normalisation: Brussels, Belgium, 2008. [Google Scholar]
- Comité Européen de Normalisation (CEN). Energy Performance of Buildings Overall Energy Use, CO2 Emissions and Definition of Energy Ratings; Standard prEN 15203/15315:2006; Comité Européen de Normalisation: Brussels, Belgium, 2006. [Google Scholar]
- International Institute for Sustainability Analysis and Strategy. Development of the Primary Energy Factor of Electricity Generation in the EU-28 from 2010–2013; Fritsche, U.R., Greß, H.-W., Eds.; International Institute for Sustainability Analysis and Strategy (IINAS): Darmstadt, Germany, 2015. [Google Scholar]
- Gode, J.; Martinsson, F.; Hagberg, L.; Öman, A.; Höglund, J.; Palm, D. Miljöfaktaboken 2011—Uppskattade Emissionsfaktorer för Bränslen, el, Värme och Transporter; Värmeforsk Service AB: Stockholm, Sweden, 2011. [Google Scholar]
- Adapt Consulting. Conversion Factors for Electricity in Energy Policy; Adapt Consulting: Oslo, Norway, 2013. [Google Scholar]
- ISO 14040 International Standard. Environmental Management—Life Cycle Assessment—Principles and Framework; International Organisation for Standardization: Geneva, Switzerland, 2006. [Google Scholar]
- Nuclear Fuel Cycle Overview. Available online: http://www.world-nuclear.org/information-library/nuclear-fuel-cycle/introduction/nuclear-fuel-cycle-overview.aspx (accessed on 22 December 2016).
- Nuclear Theory. Available online: http://www.mpoweruk.com/nuclear_theory.htm#u235 (accessed on 22 December 2016).
- Fuel Comparison. Available online: http://www.euronuclear.org/info/encyclopedia/f/fuel-comparison.htm (accessed on 22 December 2016).
- Whatisnuclear. Available online: http://whatisnuclear.com/physics/energy_density_of_nuclear.html (accessed on 22 December 2016).
- Energy Numbers. Available online: http://www.ocean.washington.edu/courses/envir215/energy-numbers.pdf (accessed on 22 December 2016).
- Energy Density. Available online: http://en.wikipedia.org/wiki/Energy_density (accessed on 22 December 2016).
- Rondinello, V.V.; Wiss, T. The high burn-up structure in nuclear fuel. Mater. Today 2010, 13, 24–32. [Google Scholar] [CrossRef]
- Massachusetts Institute of Technology. The Future of the Nuclear Fuel Cycle—An Interdisciplinary MIT Study; Massachusetts Institute of Technology (MIT): Cambridge, MA, USA, 2011. [Google Scholar]
- Lenzen, M. Life cycle energy and greenhouse gas emissions of nuclear energy: A review. Energy Conver. Manag. 2008, 49, 2178–2199. [Google Scholar] [CrossRef]
- Energy Density of Uranium. Available online: http://www.plux.co.uk/energy-density-of-uranium/ (accessed on 22 December 2016).
- Swedish Energy Agency. Energy in Sweden, Facts and Figures 2016. Available online: http://www.energimyndigheten.se/statistik/energilaget/?currentTab=1#mainheading (accessed on 22 December 2016).
- EuroStat. Electricity Statistics. Available online: http://ec.europa.eu/eurostat/statistics-explained/index.php/File:Electricity_Statistics_2013-2015_(in_GWh)_update.png (accessed on 22 December 2016).
- Högselius, P. Spent nuclear fuel policies in historical perspective: An international comparison. Energy Policy 2009, 37, 254–263. [Google Scholar] [CrossRef]
- Fiori, F.; Zhou, Z. Sustainability of the Chinese nuclear expansion: Natural uranium resources availability, Pu cycle, fuel utilization efficiency and spent fuel management. Ann. Nucl. Energy 2015, 83, 246–257. [Google Scholar] [CrossRef]
- Ojovan, M.I.; Lee, W.E. An Introduction to Nuclear Waste Immobilisation, 2nd ed.; Elsevier: Amsterdam, The Netherlands, 2014. [Google Scholar]
- United States Department of Energy. Nuclear Fuel Cycle Evaluation and SCREENING—Final Report; United States Department of Energy (US DOE): Washington, DC, USA, 2014.
- United States Department of Energy. Advanced Demonstration and Test Reactor Study; United States Department of Energy (US DOE): Washington, DC, USA, 2017.
- International Atom Energy Agency (IAEA). Average Discharge Burnup. Available online: https://infcis.iaea.org/NFCSS/NFCSSMain.asp?RightP=Example&EPage=2#Burnup-tab (accessed on 16 May 2017).
Figure 1.
Life-cycle chain of energy products.

Table 1.
Compilation of primary energy factors for nuclear power from various sources.
| Method/Data | PEF a | MJ/kWh b | Degree of Efficiency (%) | Reference |
|---|---|---|---|---|
| IEA (2004) | 3.0 | 10.8 | 33 | [12] |
| EcoInvent | 3.19–3.58 | 11.5–12.9 | 27.9–31.3 | [17] |
| IEA (2009) | 3.4975 | 12.59 | 28.59 | [13] |
| Nuclear-DE | 3.29 | 11.8 | 30.4 | [23] |
| Nuclear-FR | 4.05 | 14.58 | 24.7 | [23] |
| Nuclear-UK | 3.15 | 11.34 | 31.7 | [23] |
| Nuclear-SE | 2.92 | 10.51 | 34.2 | [24] |
| Partial substitution | 2.5 | 9.0 | 40 | [25] |
| Physical energy content | 3 | 10.8 | 33 | [25] |
| EN 15603:2008 | 2.8 | 10.08 | 35.7 | [25] |
a: Primary Energy Factor; b: 1 kWh = 3.6 MJ.
Table 2.
Energy intensity of 1 kg of Uranium-235 from various references.
| MWh | TJ | Reference |
|---|---|---|
| 24,000 | 86.4 | [29] |
| 22,053 | 79.4 | [30] |
| 20,555 | 73.9 | [31] |
| 22,389 | 80.6 | [32] |
Table 3.
Burn-up and enrichment values from various references.
| Type | Enrichment (%) | Burn-up (GWd/tHM) * | Reference |
|---|---|---|---|
| - | 4 | 40 | [27] |
| - | 5 | 55 | [27] |
| - | 6 | 70 | [27] |
| Oxide fuel | - | 60 | [27] |
| CANDU | - | 7.5 | [27] |
| Once-through fuel cycle | 4.5 | 50 | [34] |
| Fast reactor recycle | - | 73 | [34] |
*: d = 24 h, t = tonne, HM = Heavy Metal.
Table 4.
Calculated PEF for nuclear power (Energy Density = 23.564 GWh/kg).
| Scenario | Burn-up (GWd/tHM) | Power-to-Heat Ratio | PEF |
|---|---|---|---|
| Baseline | 50 | 33 | 60 |
| Conservative scenario | 40 | 27.9 | 88 |
| Progressive scenario | 73 | 41 | 32 |
Table 5.
Calculation of PEF for the Swedish power mix in 2014.
| Source | Supply (TWh) [37] | PEF Value [24] | PEF Unit | Primary Energy Demand (TWh) |
|---|---|---|---|---|
| Hydro power | 63.3 | 110 | (kWhpotential energy)/kWhel) | 69.63 |
| Wind power | 11.2 | 0.05 | (kWhkinetic energy)/kWhel) | 0.56 |
| Nuclear power | 62.2 | 2.92 | (kWhthermal energy)/kWhel) | 181.62 |
| Combined Heat and Power | 13.3 | 1.75 | (kWhchemical energy)/kWhel) | 23.28 |
| Sum | 150.0 | 1.83 | (kWhprimary energy/kWhel) | 275.09 |
© 2017 by the author. Licensee MDPI, Basel, Switzerland. This article is an open access article distributed under the terms and conditions of the Creative Commons Attribution (CC BY) license (http://creativecommons.org/licenses/by/4.0/).
Share and Cite
MDPI and ACS Style
Eriksson, O. Nuclear Power and Resource Efficiency—A Proposal for a Revised Primary Energy Factor. Sustainability 2017, 9, 1063. https://doi.org/10.3390/su9061063
AMA Style
Eriksson O. Nuclear Power and Resource Efficiency—A Proposal for a Revised Primary Energy Factor. Sustainability. 2017; 9(6):1063. https://doi.org/10.3390/su9061063
Chicago/Turabian StyleEriksson, Ola. 2017. "Nuclear Power and Resource Efficiency—A Proposal for a Revised Primary Energy Factor" Sustainability 9, no. 6: 1063. https://doi.org/10.3390/su9061063
Note that from the first issue of 2016, this journal uses article numbers instead of page numbers. See further details here.