Technology Forecasting Using a Diffusion Model Incorporating Replacement Purchases

1
Korea Energy Economics Institute (KEEI), 405-11 Jongga-ro, Jung-gu, Ulsan 44543, Korea
2
Haas School of Business, University of California Berkeley, 2220 Piedmont Avenue, Berkeley, CA 94720, USA
*
Author to whom correspondence should be addressed.
Sustainability 2017, 9(6), 1038; https://doi.org/10.3390/su9061038
Submission received: 10 March 2017
/
Revised: 8 June 2017
/
Accepted: 14 June 2017
/
Published: 16 June 2017
(This article belongs to the Section Economic and Business Aspects of Sustainability)
Abstract
:Understanding the nature of the diffusion process is crucial for sustainable development of a new technology and product. This study introduces a replacement diffusion model that leads to a better understanding of the growth dynamics of a technology. The model operates in an environment with multiple competitors and overcomes the limitations of existing models. The model (1) consists of a diffusion model and an additional time series model; (2) separately identifies the diffusion of first-time purchases and that of replacement purchases; (3) incorporates players’ marketing-mix variables, affecting a new technology diffusion; and (4) characterizes consumers’ different replacement cycles. The proposed model is applied to South Korea’s mobile handset market. The model performs well in terms of its fit and forecasting capability when compared with other diffusion models incorporating replacement and repeat purchases. The usefulness of the model stems from its ability to describe complicated environments and its flexibility in including multiple factors that drives diffusion in the regression analysis.
1. Introduction
The sustainability of competitive advantage has been an important issue in management research [1,2]. For example, Datar et al. [3] addressed the importance of sustainable market share gains, especially in a fast-cycle high-technology industry. To enjoy sustainable pricing and market share advantage, firms should understand the structural characteristics of demand in the industry [1]. Adner and Zemsky [2] also emphasized demand-side factors, such as consumer utility, in analyzing firms’ sustainability of competitive advantage. In today’s dynamic and constantly changing business environment, the life cycle of a new technology is shortened, and competition between players in the market is intensifying. To plan the sustainable development of new technologies, therefore, a novel model considering the changing market environment is needed for mid- to long-term forecasts.
In this perspective, innovation diffusion models are very useful for companies to develop a strategic plan feasible enough to secure a sustainable competitive advantage [4]. They are based on models from the fields of biology, epidemiology, and ecology [5]. Mansfield [6] suggested an alternative diffusion model that follows a new technology’s simple logistic growth, representing word-of-mouth effects. Bass [7] offered analytical and empirical evidence for the existence of an S-shaped pattern of diffusion by suggesting a general model that reflects innovative and imitative factors. Simple though it may be, the Bass model has been used widely to analyze demand and diffusion in such fields as management, policy, economics, and marketing. The Bass model has been improved upon to reflect replacement and repeat purchasing [8,9,10,11], competition between different technologies [12], and diffusion at the brand level [13,14], among others.
As Parker [15] suggested, first-time adopters make their purchase only at the beginning of a technology’s life cycle and, therefore, replacement and repeat purchases become important factors over the long run in the diffusion of most technologies. Islam and Meade [16] also demonstrated the importance of modeling replacement components for a better total sales forecasting, especially for consumer durables. Given that many technologies’ replacement cycles become ever shorter, and that consumer preferences could change rapidly in the current competitive market environment, consideration of replacement purchases by existing users becomes a fair assumption for analyzing diffusion of both durable and nondurable technologies.
Diffusion models that take into account replacement and repeat purchases have a long history in the forecasting literature. Representative examples of early works are Dodson and Muller [17], Lilien et al. [18], Mahajan et al. [19], and Kamakura and Balasubramanian [20], which incorporated consumers’ subsequent purchase behavior, as well as their first-time purchase behavior. Recently, a few studies used novel methods, such as choice models [21] and agent based simulations [22], to analyze innovation diffusion of repeat purchase technologies. The diffusion models incorporating replacement and repeat purchases are widely applied to analyze the market dynamics of several products, as well as technologies, such as ethical drugs [23], motor vehicles [24], televisions [25], PC processors [26], and mobile handset units [27]. Despite their usefulness, such models are hampered by some limitations. First, some of them limit the research focus to nondurable technologies, such as pharmaceuticals [10,18]. Second, although other studies, such as Bass and Bass [28] and Bayus et al. [9], propose models that apply to durable products, those models are limited in that they neglect to account for marketing efforts and firms’ strategies that affect consumers’ subsequent purchase behavior. Third, most studies taking replacement and repeat purchases into account were applied only to a single technology category. Therefore, they failed to incorporate the competitive environment into the model, even though technology diffusion at the brand level is an important issue in most industries. Another drawback of existing models is that they do not separately identify first-time purchases and replacement purchases and, instead, use only aggregate sales data. Finally, the existing models do not estimate the replacement purchase rate, which may vary over consumers’ different replacement cycles.
The purpose of the current study is to present a new innovation diffusion model that accounts for replacement purchases, which overcomes the aforementioned limitations and enables a researcher to discuss an application involving a durable consumer technology. The proposed model is applied to South Korea’s mobile handset market. This application is believed suitable for verifying our diffusion model because South Korea’s mobile communication services market has become saturated, and demand for mobile handsets caused by the need for replacement has maintained the mobile handset market’s growth. For the mobile handset application, we compare our proposed model’s fit and forecasting performance with that of other diffusion models incorporating replacement and repeat purchases to verify its effectiveness. This study will provide firms with useful tools to plan an innovative and sustainable diffusion process of an alternative technology from a long-term perspective.
This research is organized as follows: The next section depicts the suggested model’s conceptual and analytical underpinnings. Section 3 describes the data and the empirical analysis of the diffusion of South Korea’s mobile handset market, followed by comparisons with other diffusion models that account for replacement and repeat purchases. The concluding section presents the study’s theoretical implications and suggested extensions.
2. Model Specifications
The two major components of the model are sales to first-time purchasers who try a technology initially and sales to replacement purchasers who have purchased a technology previously. This can be represented by a basic equation
where n(t) are the technology’s total sales at time t, s(t) are sales to first-time purchasers at time t, and r(t) are replacement sales at time t. Equation (1) is the category-level equation implied by our proposed model. Based on Equation (1) we suggest a new replacement diffusion model considering multiple competitors.
If we specify the number of players in the technology market as N, the total sales of player i consists of sales to first-time purchasers and replacement sales as
Note that Equation (2) adds up (across players) to Equation (1), where , , and . In Equation (2), first-time purchasers at time t determine to adopt the technology at time t, and then part of the triers would adopt the technology produced by player i. If is player i’s market share in terms of first-time purchases, then is defined as
where F(t) is the cumulative distribution function of triers of the technology up to time t and parameter m indicates the number of potential triers in the technology market. To estimate the sales to first-time purchasers, Equation (4), we must specify the functional form for the underlying cumulative distribution function, F(t). Various diffusion models, such as the original Bass [7] model and a generalized Bass model with marketing-mix variables [29], are available for F(t). The number of triers of the technology at time t is estimated in Equation (4) using the diffusion model, and that estimate is applied in Equation (3). The restriction is added to reflect that the summation of each player’s market share equals 1 for first-time purchasers. We explore this in more detail subsequently.
On the other hand, in diffusion by replacement purchasers at time t, the technology users’ replacement cycle should be reflected because consumers’ replacement cycles are not all alike. In the current study, we assume a replacement purchase rate that varies over replacement cycle τj (j = 1, 2), provided that is the replacement purchase rate in the case of replacement cycles of more than τ3 years. Then, r(t) is as
Replacement purchasers may adopt the new technologies of player i after taking into consideration multiple specific factors related to player i. In this study, we assume that consumers’ replacement-purchase behavior is affected by the bandwagon effect and marketing-mix. Marketing-mix variables, such as price and advertising, affect replacement purchases of buyers. Therefore, it is important to know the impact of controllable marketing variables on the replacement cycle because resources can then be allocated more effectively to accelerate the purchase timing decision of consumers looking to replace [30]. On the one hand, bandwagons are diffusion processes whereby consumers adopt an innovation because of a bandwagon pressure caused by the sheer number of other consumers that have already adopted this innovation [31]. Bandwagon effects pervade in high-technology industries and economic analysis of them provides valuable insights into managerial implications [32]. As proxy variables, we use market share data to reflect the bandwagon. We adopt price and product diversification as marketing-mix variables. As a proxy variable, we use the number of technology models of each player to reflect the product diversification.
Therefore, incorporating those determinants of consumer’s replacement purchase, replacement sales of player i can be expressed as
where is player I’s market share at time t − 1, are the marketing-mix variables of player i at time t. The subscript j denotes different types of marketing-mix elements such as price, advertising, product diversification, etc. In Equation (6), the parameters ξ represent the effects and magnitudes to which each player’s bandwagon effect and marketing-mix affect replacement sales. For example, the parameter represents the bandwagon effect on replacement purchases of previous users with regard to brand (player) i. The restriction is added to reflect that the summation of each player’s market share equals 1 for replacement purchasers.
The model’s final form is derived by combining Equations (3) and (6) as
Equation (7) includes the vector autoregressive (VAR) equation’s form in which player i’s sales volume is expressed as a linear combination of its lagged value and the lagged values of the sales volume of all other players in the category. This model is based on the assumption that each player’s sales volume is affected by competing players’ sales volumes, as well as its own previous sales volume. In addition, the above equation is expanded to include other exogenous variables, such as marketing-mix variables, as well as lagged endogenous values. A time series model, such as VAR, however, is applicable only for short-run forecasting because the forecasts of time series become ever more imprecise as the forecast horizon increases. To overcome the nonstationary problem of the time series model, researchers have developed an error correction model (ECM), which uses co-integrated variables to transform variables’ short-run equilibria into long-run equilibria. In other words, ECM is the methodology that matches economic variables’ short-run and long-run behavior by including co-integrated variables with lagged terms as explanatory variables. See Hamilton ([33], Chapter 19) for details of this error correction model.
Our proposed model in Equation (7) can also be understood as a replacement diffusion model with concepts such as ECM. Instead of ECM’s co-integrated variables, our model introduces the variable represented by the diffusion model, which shows the supremacy of its long-run forecast. The diffusion model provides medium- and long-run forecasts, such as an estimate of the ceiling point and estimates of the peak time and sales volume at the peak time [34]. Therefore, our model’s structure consists of a diffusion model (the first term of Equation (7)), which provides long-run information generated by first-time purchasers, and a time series model (the second term of Equation (7)), which provides short-run information generated by previous users’ technology replacement. In the next section, we will discuss the substantive findings on the mobile handset market and the results of the model’s fit and forecasting performance.
3. Empirical Analysis and Results
3.1. Data Description
The study uses quarterly data for three players of mobile handsets in South Korea. One reason for applying the proposed model to data on mobile handsets is that a mobile handset is a typical product with a relatively short replacement cycle. For this reason, issues on replacement and lifetimes of mobile handsets have been highlighted in several previous studies [21,27,35]. Moreover, South Korea is one of the markets with the shortest handset replacement cycles, among others [36]. Thus, the mobile handset is an important target of empirical analysis from the perspective of practical managerial implications. Another reason is that the proposed model considers brand-level replacement purchases. The quarterly data for mobile handsets in the Korean market was one of few available brand-level sales data at the time of our analysis. Although many players exist in the South Korean mobile handset market, we consider the two players that dominate the market, Samsung Electronics and LG Electronics (denoted as Player 1 and Player 2, respectively), plus an additional player that is defined by aggregating the sales of four other players and is denoted as Player 3. The remaining four companies are SMEs and full data for estimation is not available. However, since the aggregate handset data is available, we deduce data for Player 3. In addition, considering all players, the number of parameters to be estimated in the model increases, making it difficult to estimate significant parameters. The observation period used for our model’s estimate stretches from the first quarter of 2000 to the first quarter of 2005 due to the limitation of available data at the player level. Even though sales data at the category level are available from the first quarter of 1995, sales data and marketing-mix data at the player level are available from the first quarter of 2000. We chose to aggregate sales volume over models of the products produced by each player because the focus of this study is to develop a replacement diffusion model at the brand-level. Therefore, the primary goal of the model is to model consumers’ behaviors and factors affecting them when they purchase and repurchase a new mobile handset at the brand-level. The subscriber data for mobile communication services and the aggregate sales data for mobile handsets are reported by South Korea’s Ministry of Information and Communication [37] and by National Statistical Office [38], respectively. The value of domestic sales revenue divided by the average price of mobile handsets is taken as the value of each player’s sales volume data (i.e., the number of mobile handsets sold in each quarter) because of that figure’s unavailability. To ensure the estimated data’s reliability, we compared the estimated data to some actual data that we can observe, in part. The South Korean service DART provides domestic sales revenue data and average price data for mobile handsets, and Cetizen [39], a mobile handset market research firm, provides data related to each player’s number of technology models.
3.2. Model Estimation
Generally, consumers in the telecommunications market can use technologies such as mobile handsets and fax connections only after subscribing to a service. This means that users of a telecommunication technology always have to be subscribed to a telecommunication service. Therefore, we assume that new subscribers to a mobile communication service at time t are first-time purchasers of mobile handsets at time t. On the other hand, replacement purchasers of mobile handsets at time t are defined as consumers who have subscribed to a mobile communication service and tried new mobile handsets by t − 1. This assumption implies that replacement purchasers include both re-subscribers to a mobile communication service and subscribers switching to competing service providers because they have already used mobile handsets.
We use the original Bass model as the diffusion model in Equation (4). Thus, the cumulative distribution function for the Bass model considered in our empirical analysis is
In Equation (8), parameters p and q are the innovation and imitation coefficients, respectively. Parameter p reflects the impact of activities such as advertising and promotion on adoption. Similarly, parameter q captures communications internal to the social system, such as the word-of-mouth effect. To estimate the Bass model, we use nonlinear least squares (NLS) estimation due to its nonlinear function form. In addition, we reflect a seasonal dummy in the estimation process because the quarterly data contains fluctuations.
The Bass model is applied to the diffusion of new subscribers in South Korea’s mobile communication services market from 1995 to 2005. When m is estimated from the data, the parameter’s value is smaller than the number of actual cumulative subscribers, which is unreasonable. Therefore, we set the number of potential subscribers to mobile communication services to be about 44 million based on South Korea’s population. Many existing studies of diffusion, such as Hahn et al. [10], estimate the diffusion model using fixed values of m. Given the number of potential subscribers, the estimated parameters p and q in the Bass model are 0.0216 (σ = 0.0123) and 0.0972 (σ = 0.0491), respectively. We performed a sensitivity analysis with increasing or decreasing m by 10%. Increasing m by 10% results in a 2% MAPE (mean absolute percentage error) based on m = 44 million in estimated new first-time purchasers. On the other hand, if m is reduced by 10%, MAPE is 8%. That is, the estimates are not significantly sensitive to the value of m.
Next, our replacement diffusion model, Equation (7), is estimated using subscriber data estimated by the Bass model and other quarterly data. To simplify the model, we assume each player’s market share for first-time purchasers, , is constant throughout the time period: .
On the other hand, to determine Equation (7)’s lag order, the Akaike information criterion and the Schwarz information criterion, which choose the lag order to minimize some criterion function of lag, are used [40]. We determine the lag order, however, based on survey results reported by the market research firm Cetizen [39], indicating that the replacement cycle of South Korea’s mobile handsets is between one and two years. Therefore, the parameters , , and in Equation (5) can be simply expressed as , , and . The estimated parameters , , and provide information for the ratio of replacement purchasers with each replacement cycle, and those parameters are used to forecast the demand for the mobile handset.
In estimating our full model in Equation (7), the least squares estimators are inconsistent and biased because the endogenous variables are correlated with the disturbances (). In simultaneous equations like Equation (7), the interaction of the variables causes inconsistent and biased problem [41]. In this case, because an instrumental variable estimator can be used instead, we estimate our model’s parameters using three-stage least square, for discussion of the structure and estimation procedure of three-stage least squares, see Greene [41] (Chapter 15), as proposed by Zellner and Theil [42]. Only exogenous variables not included on the right side of Equation (7) can be used as instrumental variables. The instrumental variable used in this study is the squares of sales to first-time purchasers, . The joint estimates of the nonlinear simultaneous equations’ parameters were produced using TSP software. Table 1 shows our model’s estimated coefficients. The estimates of parameters and are significant at 1%, and they are positive, as expected. We see that about 40.1% of new mobile communication service subscribers adopt Player 1’s handset, and about 28% of new subscribers adopt Player 2’s handset. As for Player 3’s market share of new subscribers, 31.9% is automatically derived by Equation (7)’s constraint condition. We compared each player’s estimated market share to the actual market share in terms of actual aggregate sales to make several inferences about the difference between overall sales and estimated sales to first purchasers. The average market shares from 2000 to the first quarter of 2005 are reported as 44.6% for Player 1, 19.9% for Player 2, and 35.5% for Player 3. Players 1 and 3 occupy higher market shares in terms of actual overall sales than their market shares in terms of estimated sales to first-time purchasers, and vice versa for Player 2. This indicates that the diffusion speed for replacement purchases of Player 2 is slow compared with that of other players. This result, thus, implies that Player 2’s market condition may include threat factors for its technology’s diffusion, in that replacement purchasers have stimulated the demand for mobile handsets since the saturation of South Korea’s mobile communication service market around 1999.
The parameters , , and that describe the ratio of replacement purchasers with various replacement cycles are not significant at a significance level of 5%, except . From that, we can observe that about 17.6% of previous users who had adopted mobile handsets at time t − 2 are going to purchase new handsets at time t.
With two exceptions, all of the estimated parameters of variables related to replacement purchases are significant. First, the estimated values of and show that the bandwagon effect has a significant impact on the replacement-purchase behavior of previous users only with regard to Player 1. Therefore, we can infer that more users of Player 1 may increase that player’s market share. The results also prove that Player 1 has been more successful in creating bandwagon effects than the others in the Korean mobile handset market. Firms in high-technology industries clearly understand the importance of bandwagon effects because a successful proprietor of a bandwagon technology generally has a greater market power [35]. Second, both parameters of the price variables, and , are significant at a significance level of 5%. The signs of those parameters are positive, contrary to the general case showing a preference for lower-priced technologies. The phenomenon reveals that consumers prefer up-to-date technologies even though the price of mobile handsets increases as advanced technologies—such as MP3 and digital photography capability—are included in the handsets. In the mobile handset market, therefore, advanced functionality realized by new technology may have a greater effect on handset diffusion than price. The introduction of new telecommunication service content, in addition to advances in mobile terminal technology, can also contribute to strategies that seek more functionality. Consumers may exercise their discrimination by observing whether the technology is compatible with new telecommunication services. This phenomenon indicates that the development of new functionality and the introduction of new mobile communication services need to operate in parallel. Finally, the results of the estimated parameters and show that demand for mobile handsets is negatively affected by product diversification in the case of Player 1. These results are consistent with what has been reported by the market research firm iSuppli, that is, that South Korea’s mobile handset firms need to reduce the number of their product models and adopt a strategy, such as target marketing, to keep the mobile handset market’s dominant position in the world [43].
3.3. Sales to First-Time Purchasers and Replacement Purchasers in the Mobile Handset Market
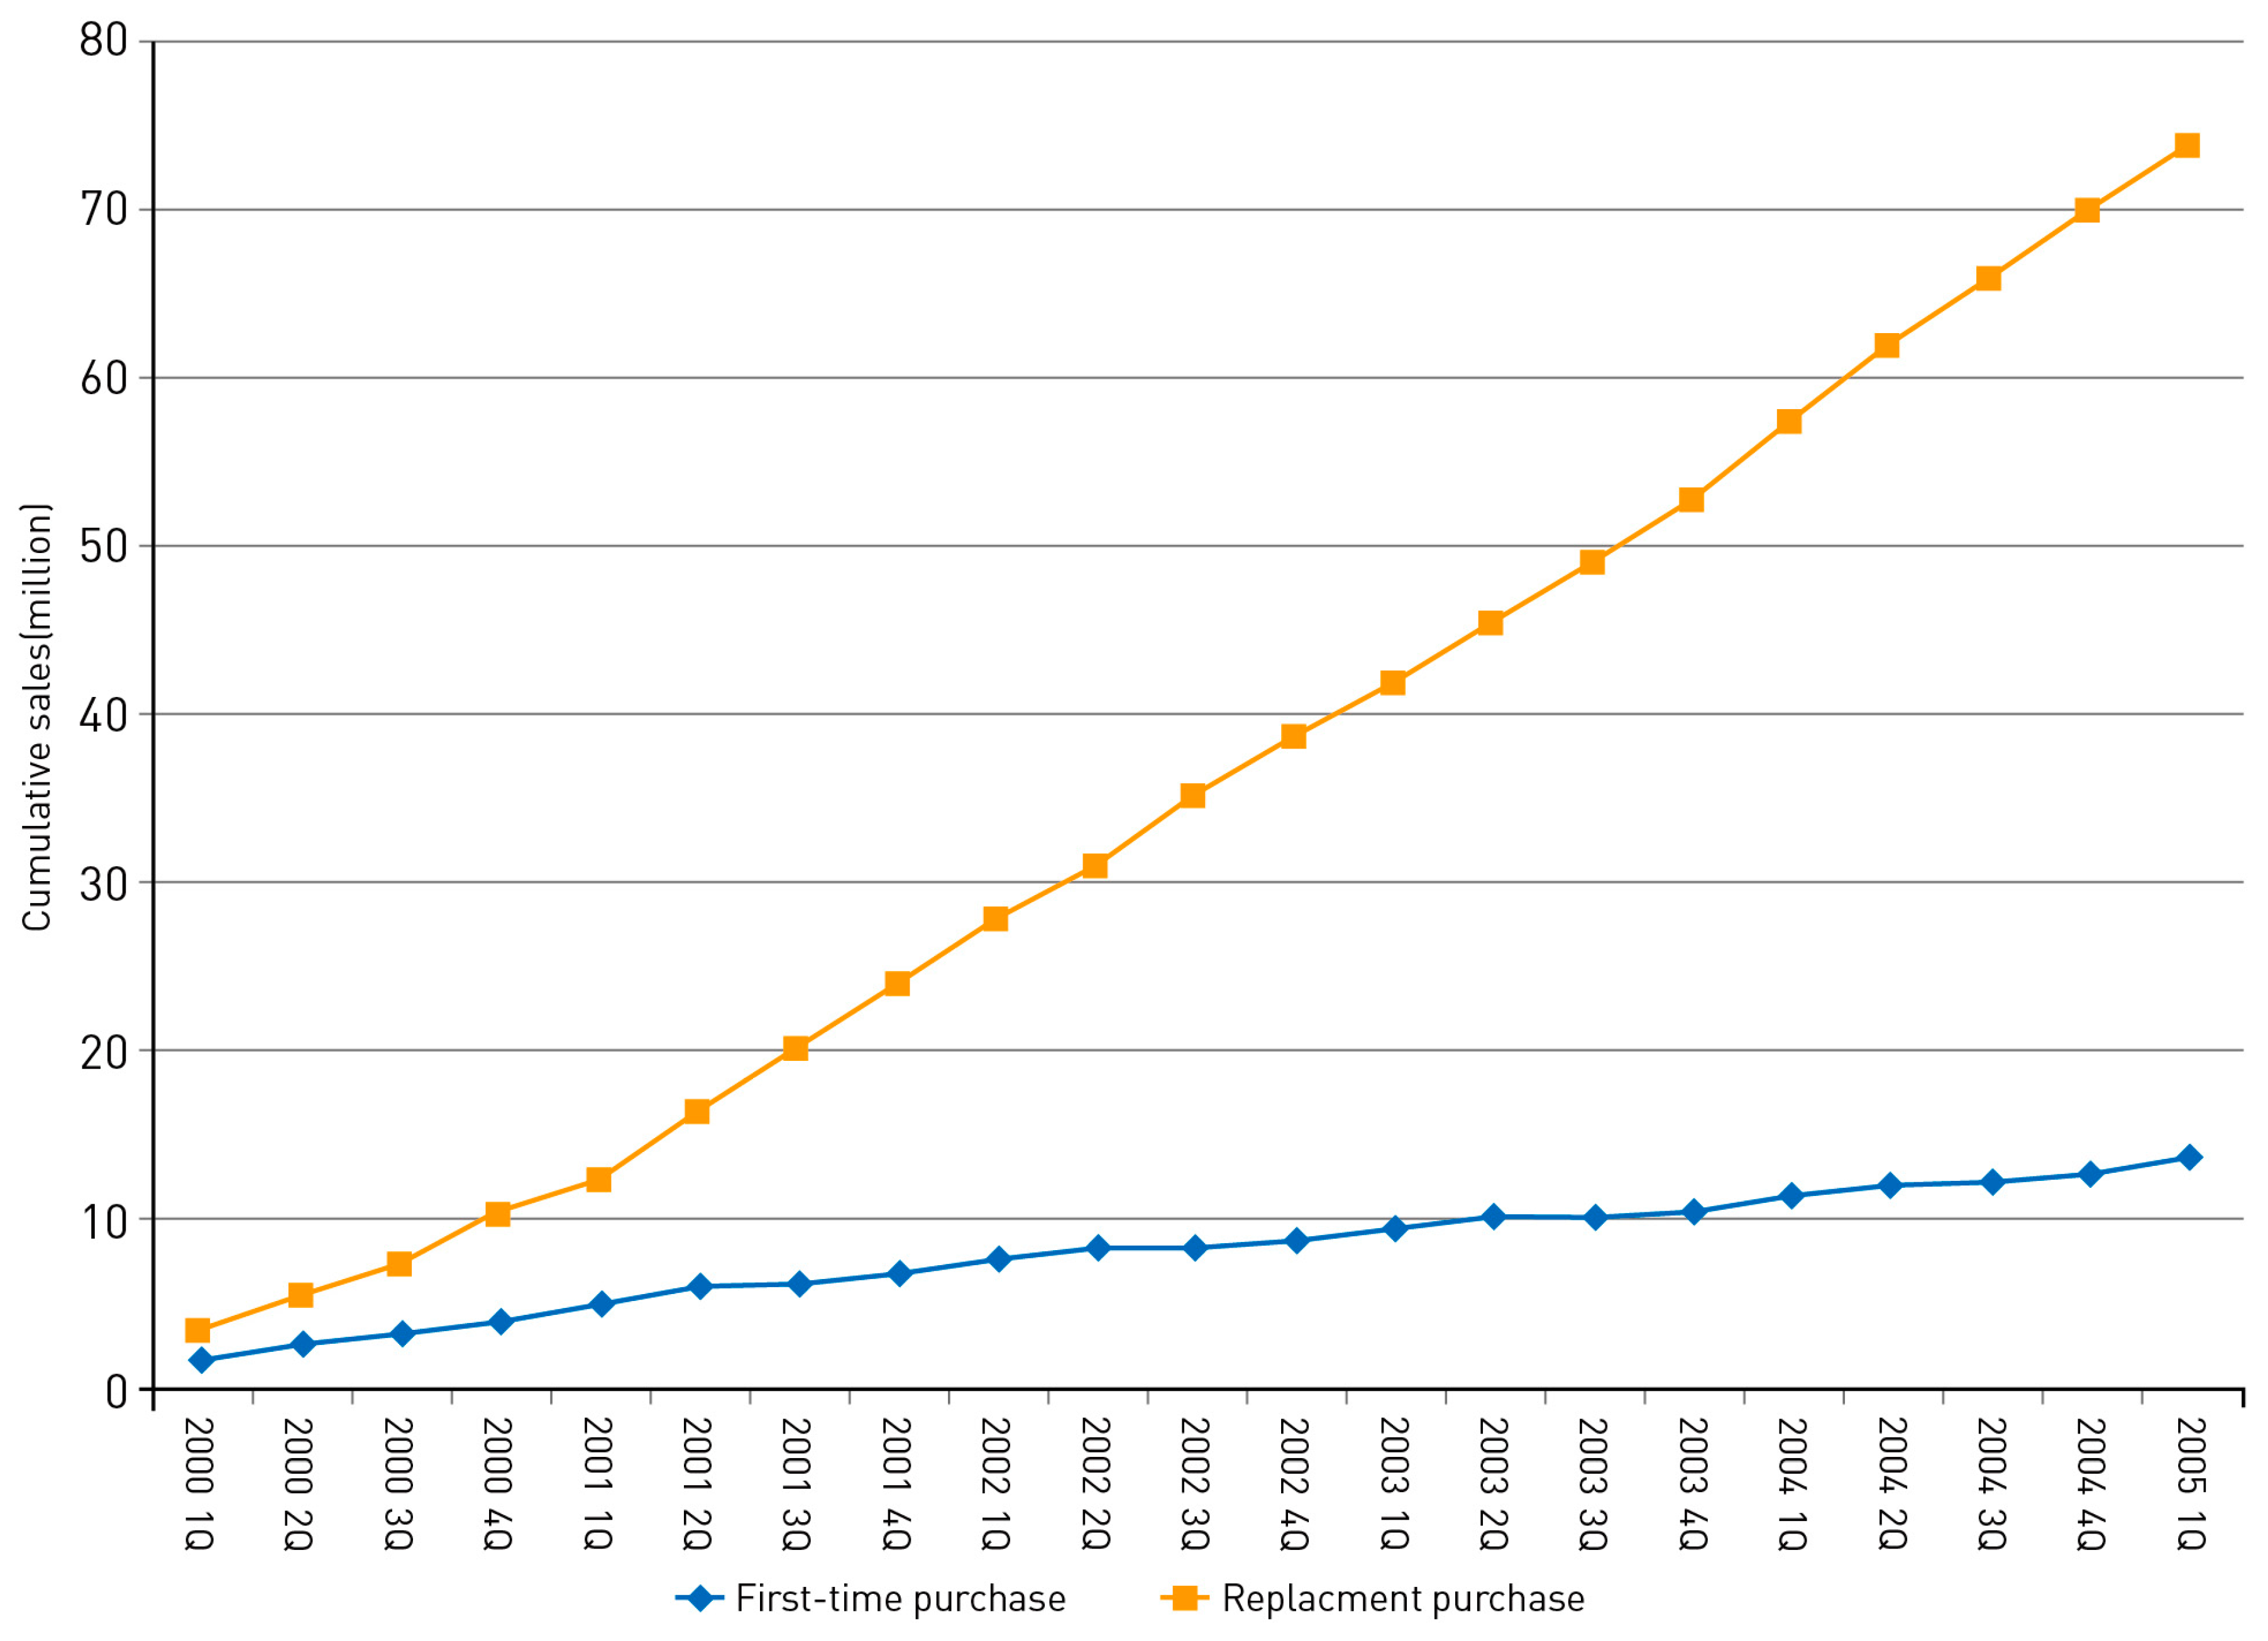
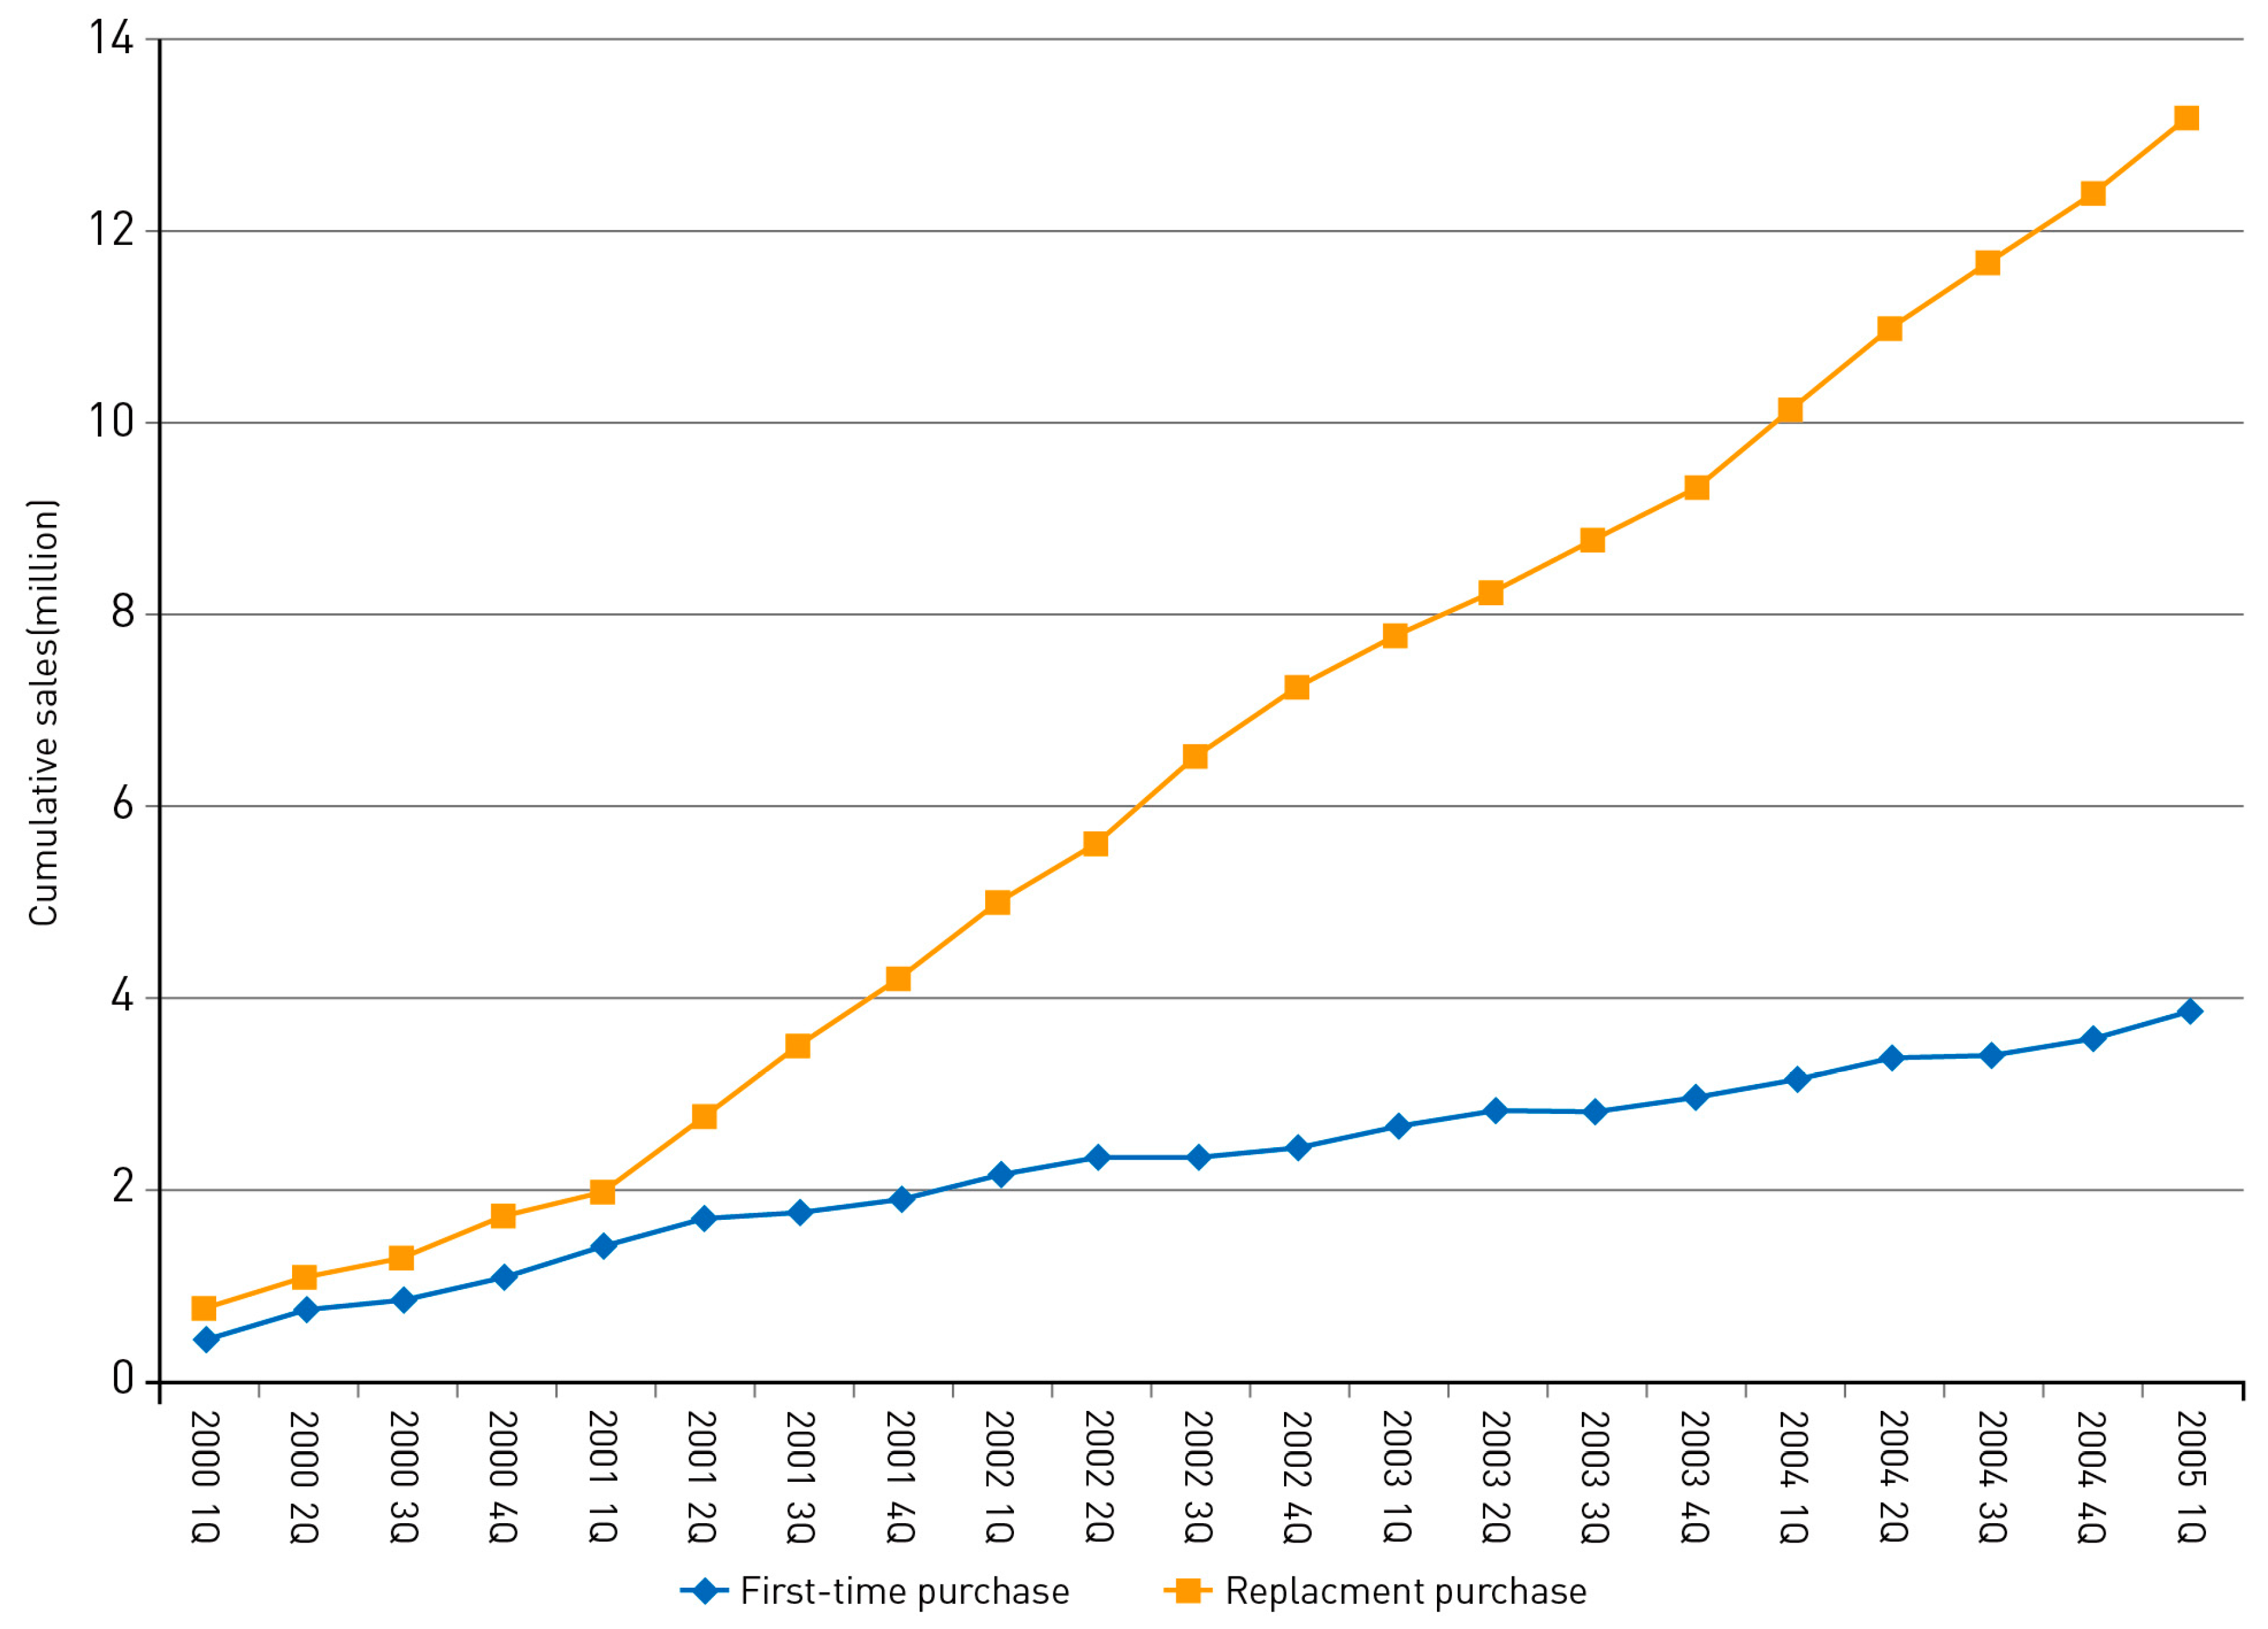
Most diffusion models do not separately identify first-time purchases and replacement purchases because most data sources report only aggregate sales volume, that is, the summation of sales to both first-time purchasers and replacement purchasers. To overcome that shortcoming, the results of the present diffusion model take into account first-time purchases and replacement purchases separately.
Figure 1, Figure 2 and Figure 3 show the estimated cumulative sales volume of mobile handsets in each quarter at the player level, and Figure 4 shows at the category level, since 2000. The gap between sales to first-time purchasers and replacement sales has grown over time, although the two sales figures began at a similar level. In cumulative sales from 2000 to the first quarter of 2005, total sales of Player 1 consist of replacement sales of 85.9% and sales to first-time purchasers of 14.1%. In the case of Players 2 and 3, replacement sales cover 77.4% and 86.1% of each player’s total sales, respectively. Overall, 84.3% of total sales in the mobile handset market are demanded by replacement purchasers. From those results, we can infer that growth of the mobile handset market is being driven mostly by replacement purchases, and a phenomenon we expect will become even more severe given that the market for mobile communication service is becoming saturated. As of the first quarter of 2006, the penetration of mobile telecommunication service in South Korea had already reached 80%. We can guess that the diffusion pattern of first-time purchases and replacement purchases in world’s mobile handset market is similar to that in South Korea’s market, because the number of the world’s mobile subscribers showed negative growth in 2001.
Therefore, to stimulate the mobile handset market, marketing to replacement purchasers should be given a higher priority than marketing to first-time purchasers. Specifically, the bandwagon effect, the incorporation of more sophisticated functions, and a smaller variety of product models may become more critical factors over time for market success in the mobile handset industry.
3.4. Comparisons with Other Diffusion Models Incorporating Replacement Purchases
Here we compare the fit and forecasting performance of the Lilien-Rao-Kalish (LRK) model [18], the Mahajan-Wind-Sharma (MWS) model [19], and the Hahn-Park-Krishnamurthi-Zoltners (HPKZ) model [10] to our study’s proposed model through applications of South Korea’s mobile handset market. It seems meaningful to compare the proposed model with a variety of diffusion models because it can provide several implications from a modeling perspective. As noted in Section 1, however, the focus of our research is to develop a new diffusion model incorporating replacement purchase and to overcome the limitations of existing models. If we compare our model with many other diffusion models which do not consider replacement purchases, our research may lose its focus. Therefore, here we compare the proposed model only with existing diffusion models incorporating replacement purchases. To ensure the comparison is fair, we exclude the variable describing product diversification in our proposed model. This forces the kinds of variables to be equal, as is the case in the other diffusion models incorporating replacement and repeat purchases.
The original LRK model is expressed in terms of adopters, not sales. After transforming the original LRK model into a sales model, modified by Hahn et al. [10], the LRK model is expressed as
where and are marketing-mix variables of player i and competing players at time t − 1, respectively. In our study, player i’s technology price and the competing players’ average technology price are used as marketing-mix data. In Equation (9), represents the potential sales in the mobile handset market. Parameters and capture the effect of marketing on converting nontriers to triers, and captures the effect of competition on converting previous triers to nonrepeaters. Finally, captures word-of-mouth’s effect on the trial.
Mahajan et al. [19] proposed a repeat-purchase diffusion model that uses only aggregate sales data. They base their model on the assumption that the word-of-mouth variable is nonuniform over time. The MWS model’s basic framework is simple in that it ignores players’ marketing-mix variables and consists only of purchasers and nonpurchasers. The MWS model expressed by our notation is
where the parameters and reflect technology diffusion’s innovative and imitative effects, respectively; the parameter captures the dynamic word-of-mouth effect; and indicates the fraction of adopters in time t − 1 who continue to adopt in period t.
The HPKZ model has two forms, which emphasize the marketing effort’s competitive aspect and its informative nature, respectively. In this study, we compare the competitive-aspect HPKZ model with our model, because that one is consistent with our formulation that reflects players’ competitive structure. The HPKZ model can be written as
where is player i’s marketing-mix variable in time t − 1, and is the cumulative adopters by time t − 1, which has the relation . Hahn et al. [10] estimate the model’s parameters using an iterative procedure and ordinary least squares estimation because is not directly observed from the data. For the specific estimation, see Hahn et al. [10] (p. 229). However, we estimated the HPKZ model’s parameters using nonlinear least squares (NLS) with mobile communication service subscriber data, which equals .
In each case, the estimates of the equation systems’ parameters were produced utilizing nonlinear least squares (NLS) on TSP software. To compare the models’ fit and forecasting performance, each model’s Bayesian information criterion (BIC) and mean absolute percentage error (MAPE) are computed. As the models have different numbers of parameters, BIC is used for the fit criterion. Each model’s BIC and MAPE are given in Table 2. The dataset’s estimation period was 21 quarters. The result of the fitted BIC (Table 2a), which is measured as logs of fit over the estimation period, reveals that our model produces the lowest BIC (average fitted BIC = 11.34) for the most part, except for Player 3. The HPKZ model that allows for marketing efforts’ competitive effect, and that includes a repeat-purchase component, also indicates a good model fit (average fitted BIC = 11.37). On the other hand, the MWS model reports the worst model fit overall (average fitted BIC = 11.57). From those results, we can infer that consideration of marketing-mix variables, such as price tends to have a significant impact on the model’s fit in that only the MWS model does not include marketing-mix variables.
To compare the models’ forecasting performance, Table 2b reports the MAPEs of one-ahead forecasts, which measure MAPEs for out-of-sample forecasts from the first quarter of 1995 to the fourth quarter of 2004. Our model also produces the lowest MAPE values for Players 1 and 3. In summary, our study’s proposed model shows good performance in terms of its fit and forecasting as it is combined with a diffusion model and a time series model considering various realistic factors, such as marketing effort, replacement cycle, and bandwagon effect.
4. Discussion and Conclusions
As the marketplace for a technology evolves, consumer preferences also evolve. Replacement cycles for a new technology become shorter, and competition among players becomes fiercer. To demonstrate and forecast complicated markets, diffusion models need to address consumers’ replacement patterns and the interrelationships among players. To that end, we have developed a new replacement diffusion model that can explain the diffusion of a technology at the player level and can forecast future demand for the technology taking into consideration such factors as the bandwagon effect and marketing mix. This model is especially appropriate for separating first-time purchases from replacement purchases.
We compared our model’s fit and forecasting performance to that of other diffusion models which account for replacement and repeat purchases, including the models proposed by Lilien et al. [18], Mahajan et al. [19], and Hahn et al. [10]. As shown in the results of fitted BICs and forecast MAPEs, our model outperforms previously-developed diffusion models despite its removal of a critical variable that indicates product diversification. The results demonstrate that the combination of a diffusion model and a time series model incorporating realistic factors—such as marketing effort, replacement cycle, and bandwagon effect—contributes to the model’s fit and forecasting performance. Particularly, the results suggest that multiple players competing in the new technology market should not be treated as being totally independent of each other as their mixed behavior drives the diffusion process of each player’s new technology.
As with any analysis, there are also limitations. Further research should explore diffusion with respect to several different technology categories. That should be done to see how well results derived from the model presented in this study can be applied to other datasets. Since our model is applied only to a single product category, its superiority in terms of fit and forecasting capability over other replacement diffusion models should not be generalized to all consumer durables. Future research must conduct detailed examinations of other product categories to test and verify the applicability of the proposed model. In addition, further research should investigate how the results drawn here change when other diffusion models or growth models, such as a multi-generation model or a logistic model, are used instead of the original Bass model. For example, if we can disaggregate the sales data of one player into different product models and assume that these are a series of technological generations, it is possible to apply a successive generation model, such as the one by Norton and Bass [44]. A diffusion model incorporating competitive relationship among players, such as [12,45], is also worth attempting as a more sophisticated modeling approach. Some parameters of our model may be biased because of ignoring such competitive effects; the parameters of price variables are most likely to be the ones because price is a key element both in the marketing strategy [46] and in the competitive diffusion model [47]. These variants of our model will offer considerable promise to increase the level of realism in diffusion modeling. Moreover, there are alternative specifications available for the lag order of a time series model used in this research. It would be worthwhile to investigate the implications of such alternative specifications.
Despite the limitations, our empirical results are promising. The replacement diffusion model described here should be useful in explaining the diffusion of new technology sales and in generating accurate long-term sales forecasts. Furthermore, the model has the flexibility to include marketing-mix variables in the regression process, the inclusion of which helps to explain differences across various players and the mechanisms leading to replacement purchases. The proposed model can be applied to new technologies such as smart phones and energy storage systems, and it can be applied to new technologies of other countries where replacement purchases occur. We believe practitioners and academics alike have interests in understanding new technology markets with competitive environments and in developing a diffusion model.
Author Contributions
Chul-Yong Lee designed the study, outlined the methodology, developed the model, and wrote the manuscript. Sung-Yoon Huh reviewed the related literature, estimated and compared the models, interpreted the results, and revised the manuscript. All authors have read and approved the final manuscript.
Conflicts of Interest
The authors declare no conflict of interest.
References
- Makadok, R. Can first-mover and early-mover advantages be sustained in an industry with low barriers to entry/imitation? Strateg. Manag. J. 1998, 19, 683–696. [Google Scholar] [CrossRef]
- Adner, R.; Zemsky, P. A demand-based perspective on sustainable competitive advantage. Strateg. Manag. J. 2006, 27, 215–239. [Google Scholar] [CrossRef]
- Datar, S.; Jordan, C.C.; Kekre, S.; Rajiv, S.; Srinivasan, K. Advantages of time-based new product development in a fast-cycle industry. J. Mark. Res. 1997, 34, 36–49. [Google Scholar] [CrossRef]
- Wang, H.T.; Wang, T.C. Application of the grey Lotka-Volterra model to forecast the diffusion and competition analysis of the TV and smartphone industries. Technol. Forecast. Soc. Chang. 2016, 106, 37–44. [Google Scholar] [CrossRef]
- Linton, J.D. Forecasting the market diffusion of disruptive and discontinuous innovation. IEEE Trans. Eng. Manag. 2002, 49, 365–374. [Google Scholar] [CrossRef]
- Mansfield, E. Technical change and the rate of imitation. Econometrica 1961, 29, 741–766. [Google Scholar] [CrossRef]
- Bass, F.M. A new product growth for model consumer durables. Manag. Sci. 1969, 15, 215–227. [Google Scholar] [CrossRef]
- Olson, J.; Choi, S. A product diffusion model incorporating repeat purchases. Technol. Forecast. Soc. Chang. 1985, 27, 385–397. [Google Scholar] [CrossRef]
- Bayus, B.L.; Hong, S.; Labe, R.P. Developing and using forecasting models of consumer durables: The case of color television. J. Prod. Innov. Manag. 1989, 6, 5–19. [Google Scholar] [CrossRef]
- Hahn, M.; Park, S.; Krishnamurthi, L.; Zoltners, A.A. Analysis of new product diffusion using a four-segment trial-repeat model. Mark. Sci. 1994, 13, 224–247. [Google Scholar] [CrossRef]
- Danaher, P.J.; Hardie, B.G.S.; Putsis, W.P. Marketing-mix variables and the diffusion of successive generations of a technological innovation. J. Mark. Res. 2001, 38, 501–514. [Google Scholar] [CrossRef]
- Eliashberg, J.; Jeuland, A.P. The impact of competitive entry in a developing market upon dynamic pricing strategies. Mark. Sci. 1986, 5, 20–36. [Google Scholar] [CrossRef]
- Parker, P.; Gatignon, H. Specifying competitive effects in diffusion models: An empirical analysis. Int. J. Res. Mark. 1994, 11, 17–39. [Google Scholar] [CrossRef]
- Krishnan, T.V.; Bass, F.M.; Kumar, V. Impact of a late entrant on the diffusion of a new product/service. J. Mark. Res. 2000, 37, 269–278. [Google Scholar] [CrossRef]
- Parker, P.M. Price elasticity over the adoption life cycle. J. Mark. Res. 1992, 29, 358–367. [Google Scholar] [CrossRef]
- Islam, T.; Meade, N. Modelling diffusion and replacement. Eur. J. Oper. Res. 2000, 125, 551–570. [Google Scholar] [CrossRef]
- Dodson, J.A.; Muller, E. Models of new product diffusion through advertising and word-of-mouth. Manag. Sci. 1978, 24, 1568–1578. [Google Scholar] [CrossRef]
- Lilien, G.L.; Rao, A.G.; Kalish, S. Bayesian estimation and control of detailing effort in a repeat purchase diffusion environment. Manag. Sci. 1981, 27, 493–506. [Google Scholar] [CrossRef]
- Mahajan, V.; Wind, Y.; Sharma, S. An approach to repeat purchase diffusion analysis. In Proceedings of the American Marketing Educator’s Conference, Chicago, IL, USA, 1983. [Google Scholar]
- Kamakura, W.A.; Balasubramanian, S.K. Long-term forecasting with innovation diffusion models: The impact of replacement purchases. J. Forecast. 1987, 6, 1–19. [Google Scholar] [CrossRef]
- Jun, D.B.; Kim, J.I. A choice-based multi-product diffusion model incorporating replacement demand. Technol. Forecast. Soc. Chang. 2011, 78, 674–689. [Google Scholar] [CrossRef]
- Stummer, C.; Kiesling, E.; Günther, M.; Vetschera, R. Innovation diffusion of repeat purchase products in a competitive market: An agent-based simulation approach. Eur. J. Oper. Res. 2015, 245, 157–167. [Google Scholar] [CrossRef]
- Rao, A.G.; Yamada, M. Forecasting with a repeat purchase diffusion model. Manag. Sci. 1988, 34, 734–752. [Google Scholar] [CrossRef]
- Steffens, P.R. An aggregate sales model for consumer durables incorporating a time-varying mean replacement age. J. Forecast. 2001, 20, 63–77. [Google Scholar] [CrossRef]
- Kreng, V.B.; Wang, H.T. A technology replacement model with variable market potential: An empirical study of CRT and LCD TV. Technol. Forecast. Soc. Chang. 2009, 76, 942–951. [Google Scholar] [CrossRef]
- Gordon, B.R. A dynamic model of consumer replacement cycles in the pc processor industry. Mark. Sci. 2009, 28, 846–867. [Google Scholar] [CrossRef]
- Riikonen, A.; Smura, T.; Töyli, J. The effects of price, popularity, and technological sophistication on mobile handset replacement and unit lifetime. Technol. Forecast. Soc. Chang. 2016, 103, 313–323. [Google Scholar] [CrossRef]
- Bass, P.I.; Bass, F.M. Diffusion of Technology Generations: A Model of Adoption and Repeat Sales. Available online: www.bassbasement.org/F/N/.../Bass%20and%20Bass%202001.pdf (accessed on 14 June 2017).
- Bass, F.M.; Krishnan, T.V.; Jain, D.C. Why the Bass model fits without decision variables. Mark. Sci. 1994, 13, 203–223. [Google Scholar] [CrossRef]
- Bayus, B.L. Accelerating the durable replacement cycle with marketing mix variables. J. Prod. Innov. Manag. 1988, 5, 216–226. [Google Scholar] [CrossRef]
- Abrahamson, E.; Rosenkopf, L. Institutional and competitive bandwagons: Using mathematical modeling as a tool to explore innovation diffusion. Acad. Manag. Rev. 1993, 18, 487–517. [Google Scholar]
- Rohlfs, J.H. Bandwagon Effects in High-Technology Industries; MIT Press: Cambridge, MA, USA, 2001. [Google Scholar]
- Hamilton, J.D. Time Series Analysis; Princeton University Press: Princeton, NJ, USA, 1994. [Google Scholar]
- Meade, N.; Islam, T. Forecasting the diffusion of innovations: Implications for time-series extrapolation. In Principles of Forecasting; Armstrong, J.S., Ed.; Kluwer Academic: Norwell, MA, USA, 2001; pp. 577–595. [Google Scholar]
- Kivi, A.; Smura, T.; Töyli, J. Technology product evolution and the diffusion of new product features. Technol. Forecast. Soc. Chang. 2012, 79, 107–126. [Google Scholar] [CrossRef]
- Entner, R. International Comparisons: The Handset Replacement Cycle. Available online: http://mobilefuture.org/wp-content/uploads/2013/02/mobile-future.publications.handset-replacement-cycle.pdf (accessed on 14 June 2017).
- Ministry of Information and Communication. Available online: http://english.msip.go.kr (accessed on 15 June 2017).
- National Statistical Office. Available online: http://kostat.go.kr/portal/eng/index.action (accessed on 31 June 2005).
- Cetizen. Available online: http://www.cetizen.com (accessed on 3 June 2005).
- Hatanaka, M. Time-Series-Based Econometrics; Oxford University Press: New York, NY, USA, 1996. [Google Scholar]
- Greene, W.H. Econometric Analysis; Prentice Hall: Upper Saddle River, NJ, USA, 2003. [Google Scholar]
- Zellner, A.; Theil, H. Three-stage least squares: Simultaneous estimation of simultaneous equations. Econometrica 1962, 30, 54–78. [Google Scholar] [CrossRef]
- Seoul Digital Forum. Available online: http://sdf.sbs.co.kr/english (accessed on 15 June 2005).
- Norton, J.A.; Bass, F.M. A diffusion theory model of adoption and substitution for successive generations of high-technology products. Manag. Sci. 1987, 33, 1069–1086. [Google Scholar] [CrossRef]
- Peterson, R.A.; Mahajan, V. Multi-product growth models. In Research in Marketing; Sheth, J., Ed.; JAI Press: Greenwich, CT, USA, 1978; pp. 201–231. [Google Scholar]
- Kohli, C.; Suri, R. The price is right? Guidelines for pricing to enhance profitability. Bus. Horiz. 2011, 54, 563–573. [Google Scholar] [CrossRef]
- Huh, S.Y.; Lee, C.Y. Diffusion of renewable energy technologies in South Korea on incorporating their competitive interrelationships. Energy Policy 2014, 69, 248–257. [Google Scholar] [CrossRef]
Figure 1.
Quarterly sales to first-time purchasers and replacement purchasers (cumulative since 2000): Player 1.
Figure 1.
Quarterly sales to first-time purchasers and replacement purchasers (cumulative since 2000): Player 1.
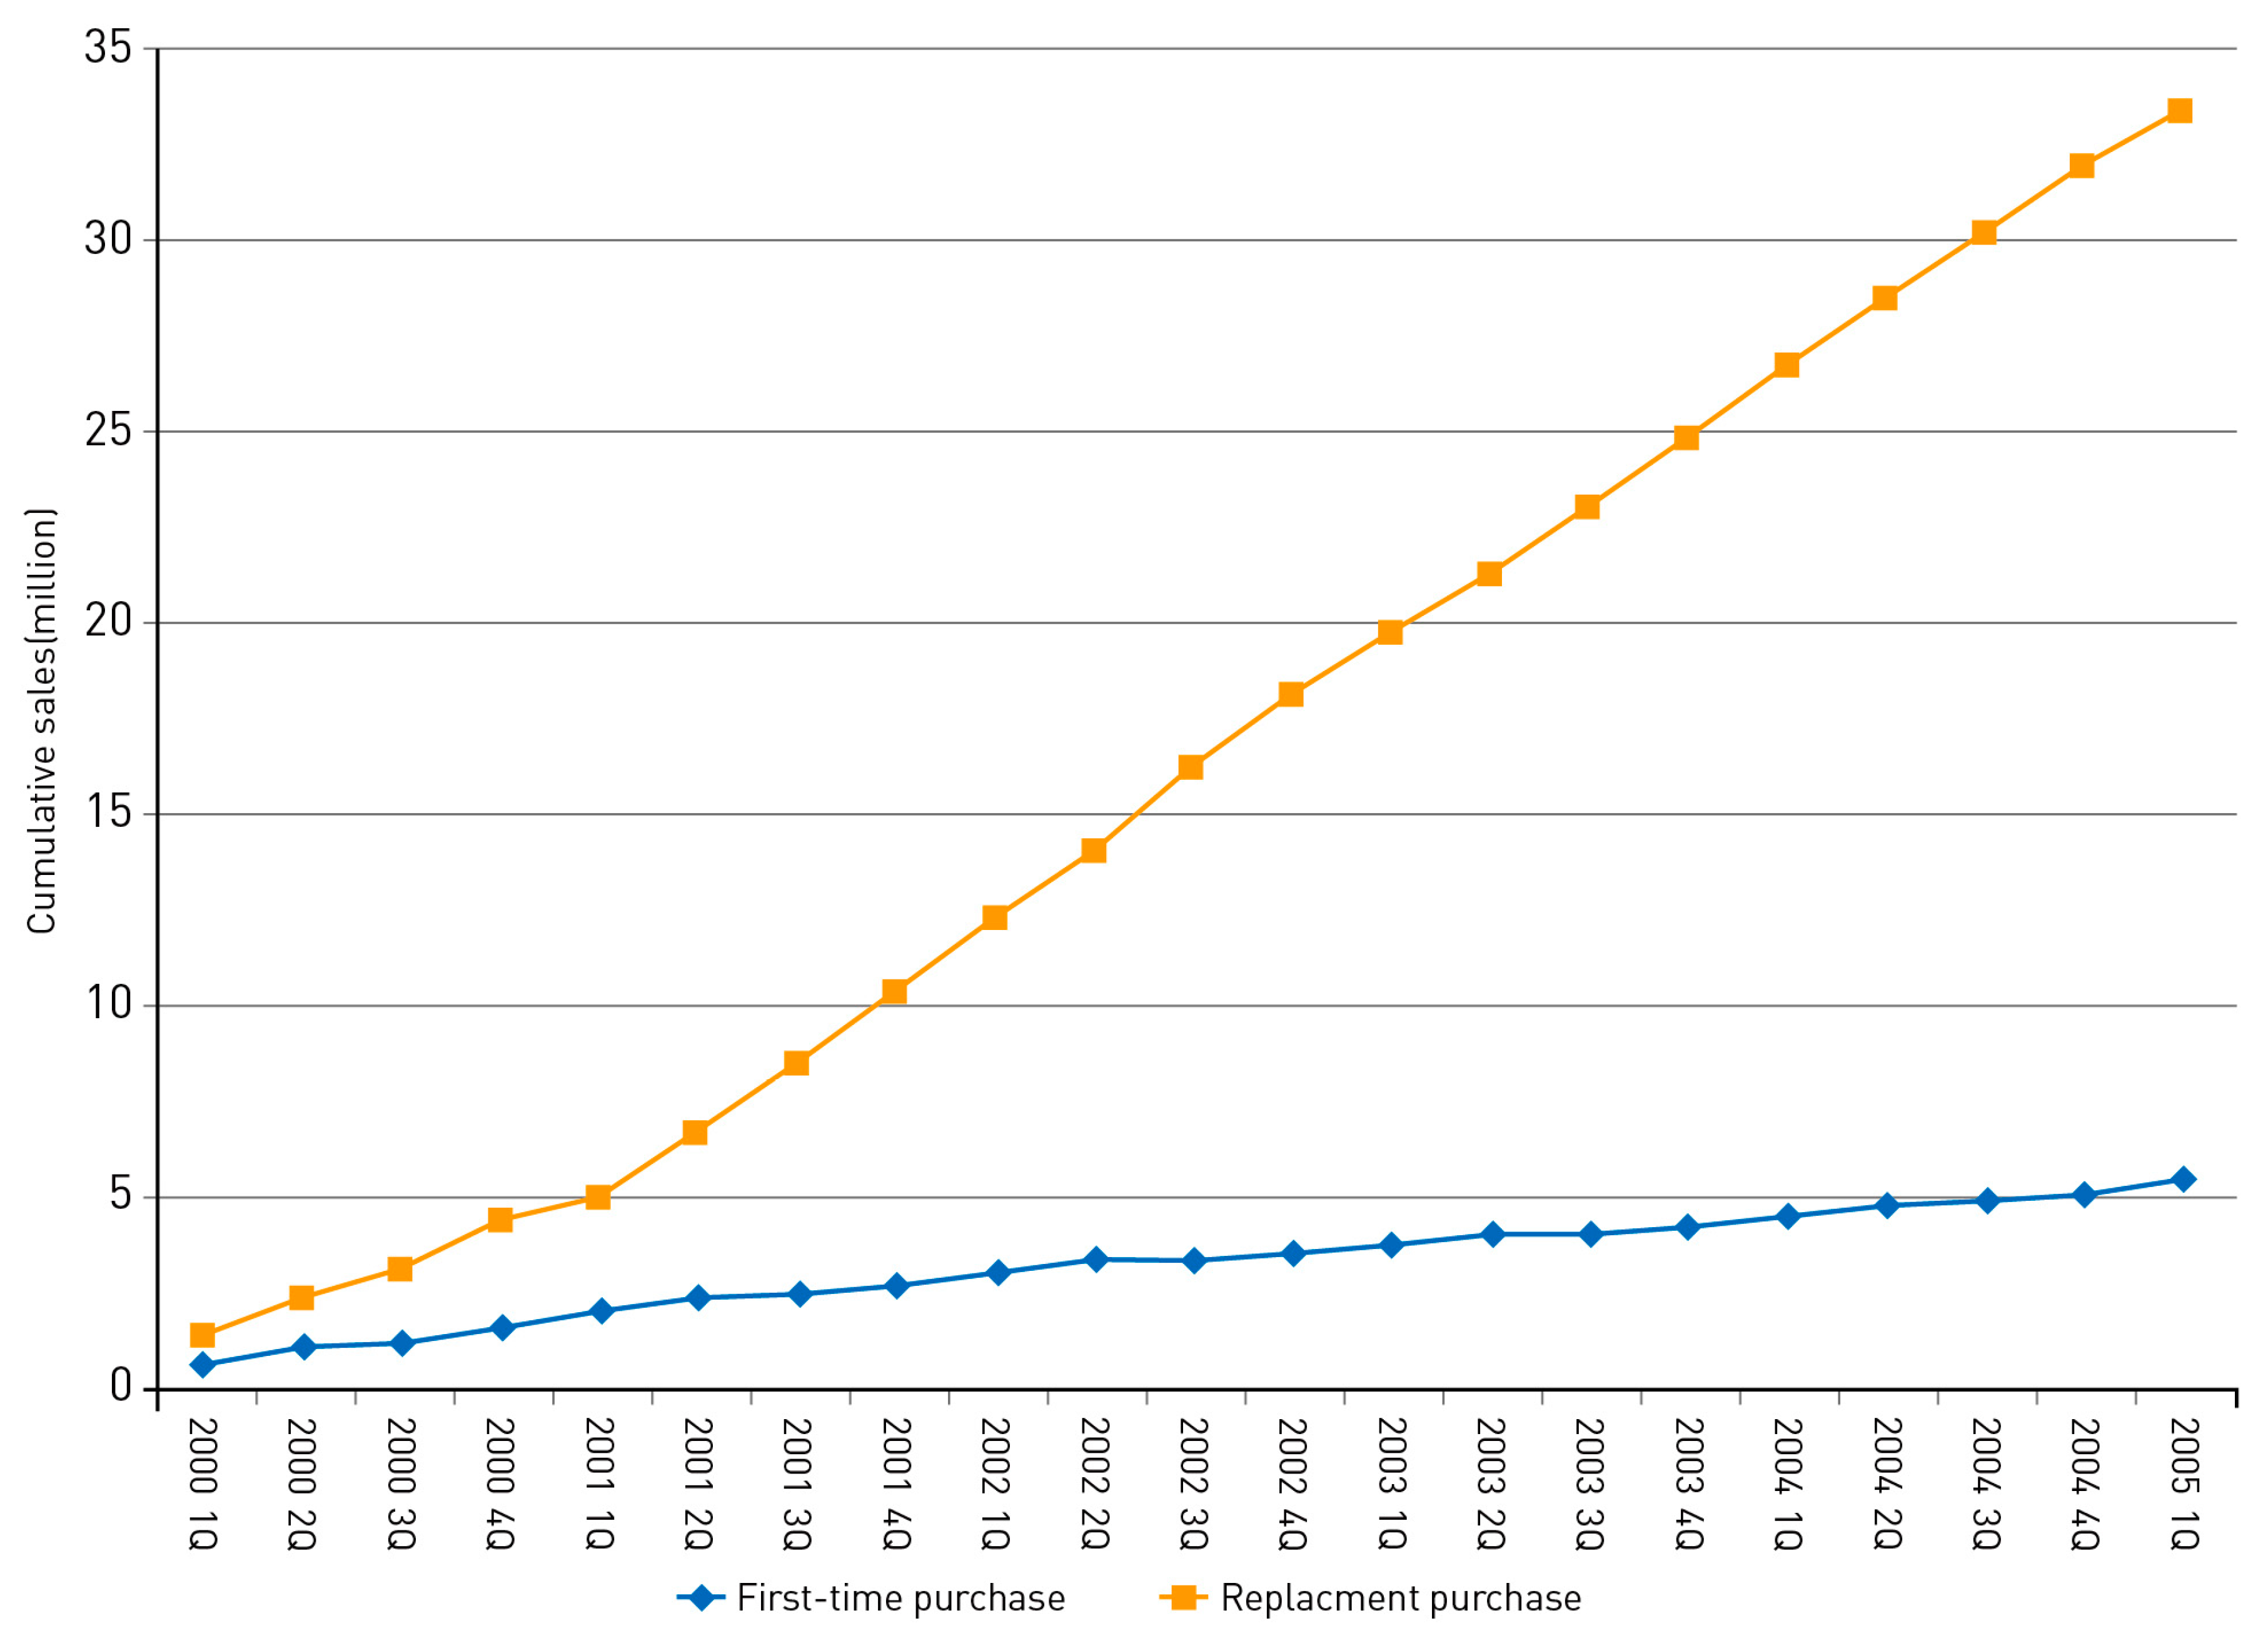
Figure 2.
Quarterly sales to first-time purchasers and replacement purchasers (cumulative since 2000): Player 2.
Figure 2.
Quarterly sales to first-time purchasers and replacement purchasers (cumulative since 2000): Player 2.

Figure 3.
Quarterly sales to first-time purchasers and replacement purchasers (cumulative since 2000): Player 3.
Figure 3.
Quarterly sales to first-time purchasers and replacement purchasers (cumulative since 2000): Player 3.
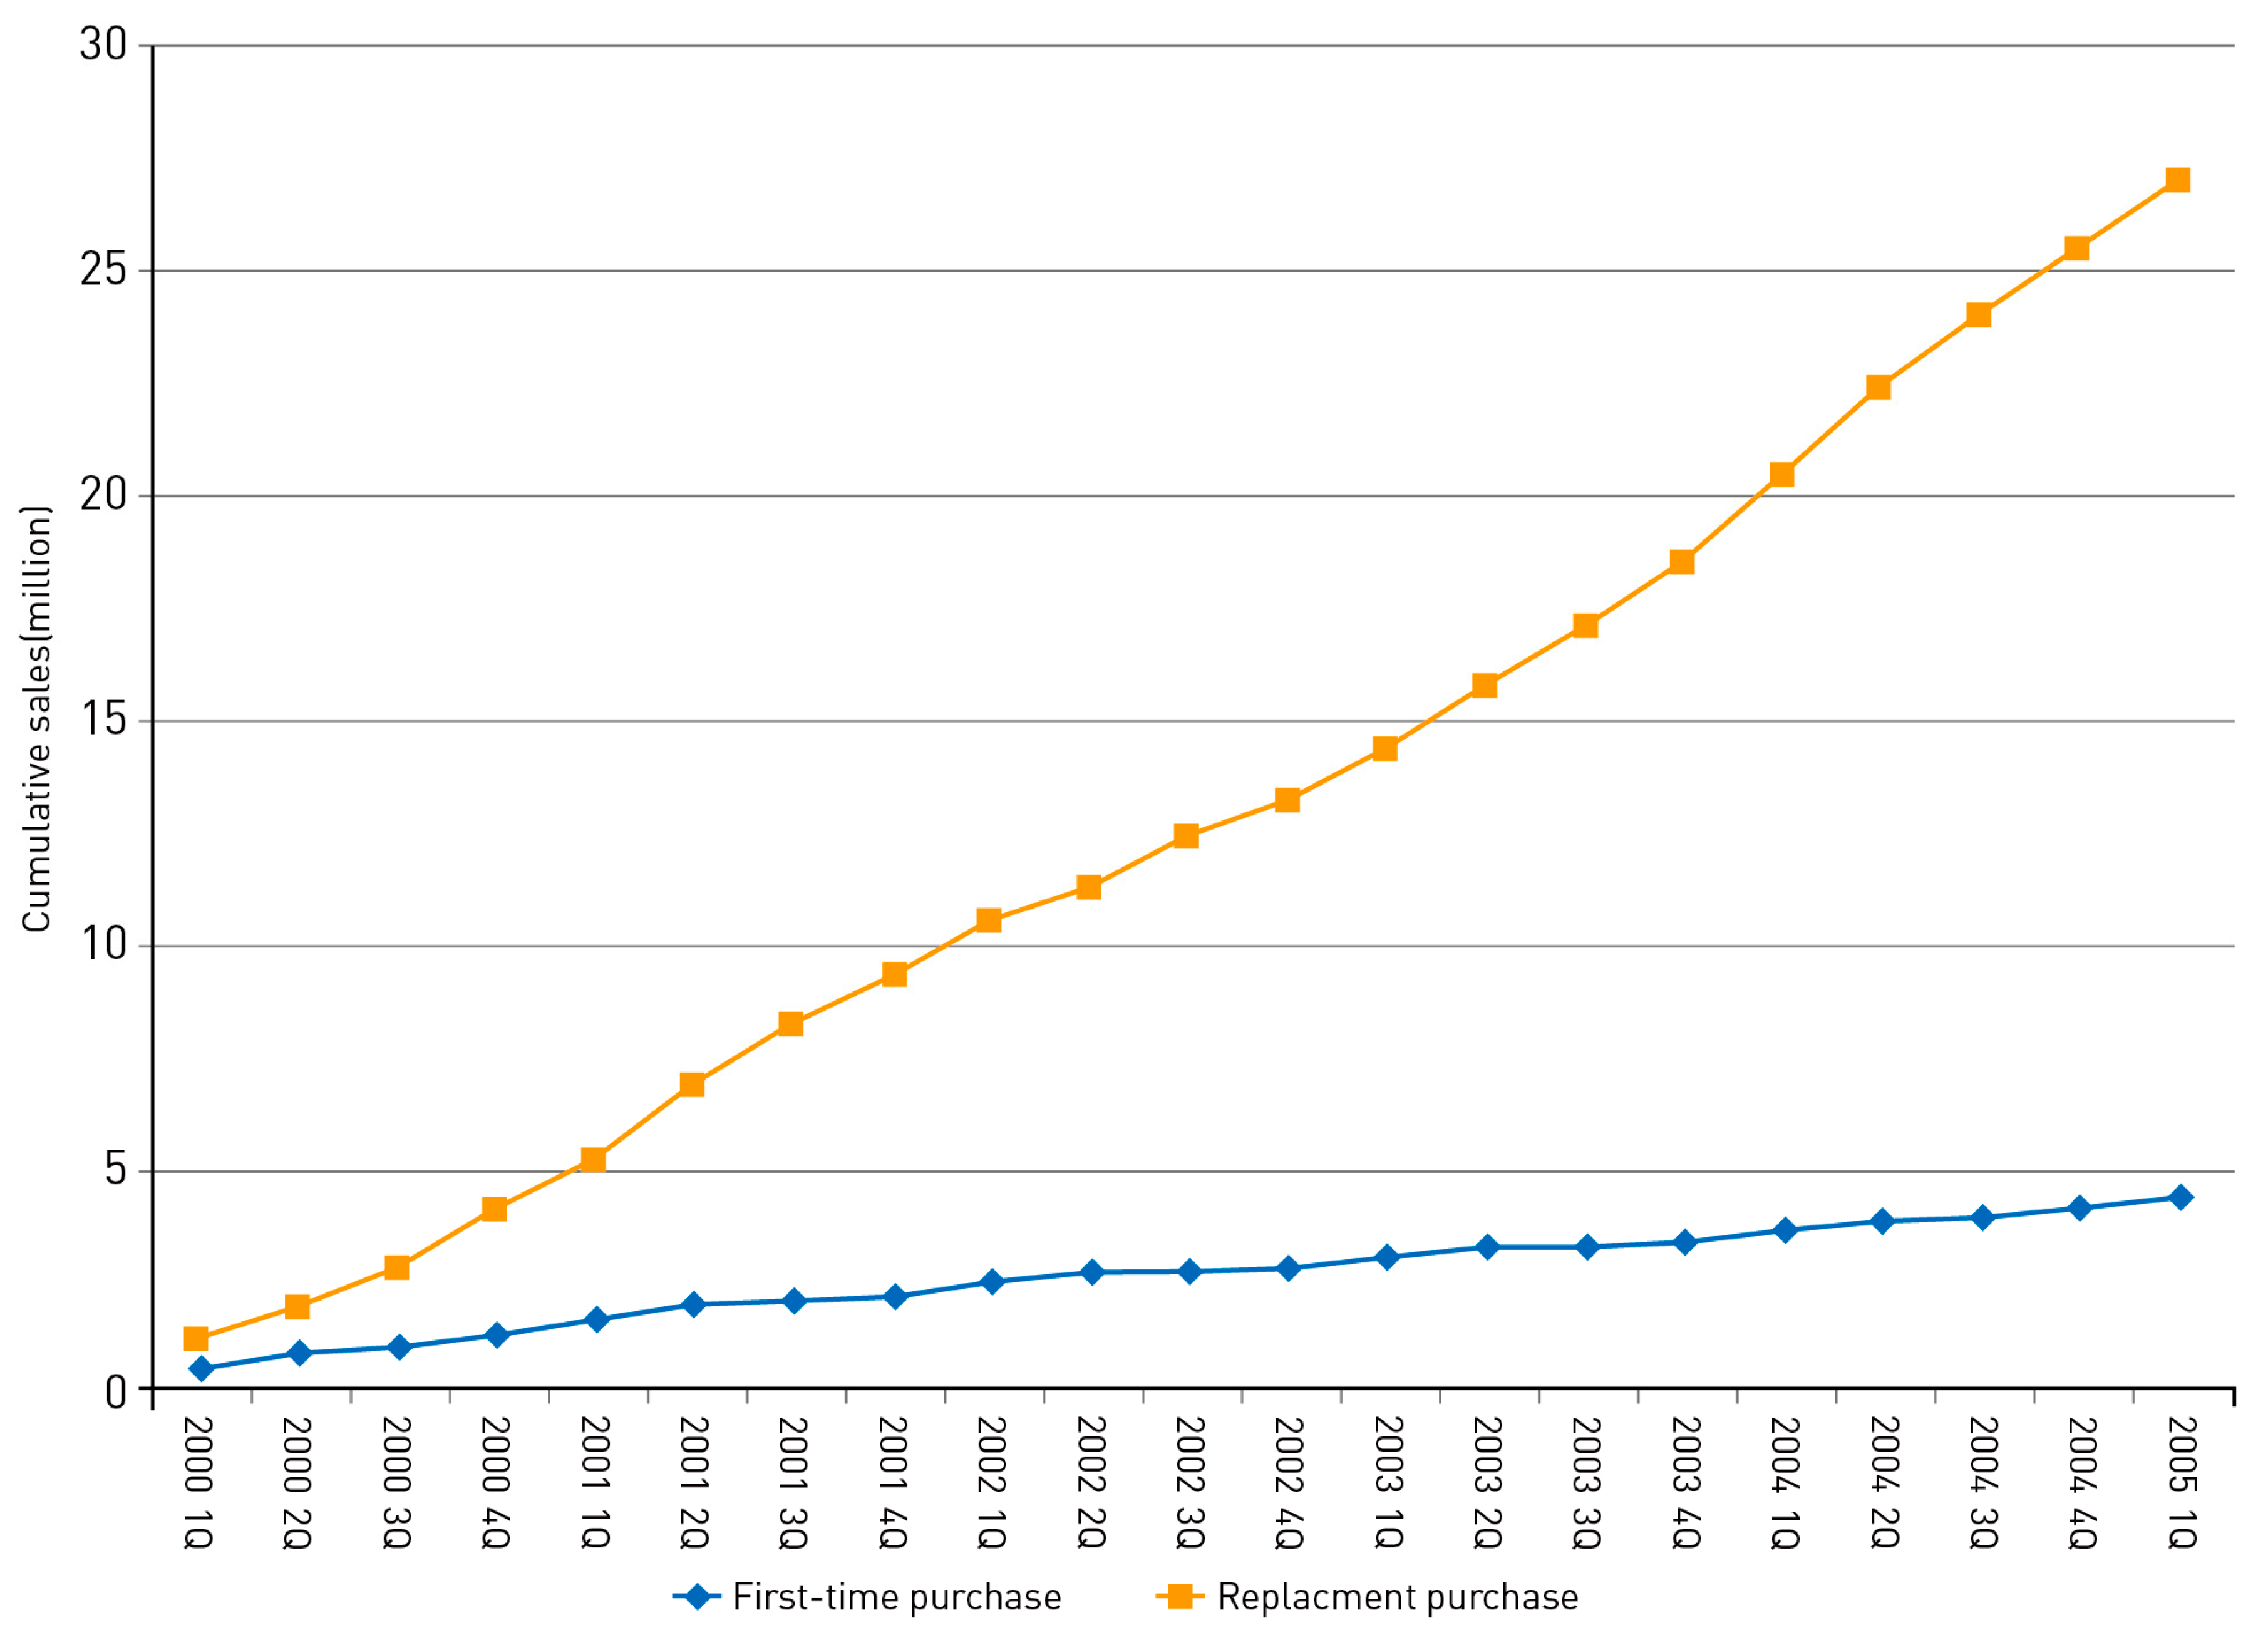
Figure 4.
Quarterly sales to first-time purchasers and replacement purchasers (cumulative since 2000): The total of all players.
Figure 4.
Quarterly sales to first-time purchasers and replacement purchasers (cumulative since 2000): The total of all players.

Table 1.
Parameter estimates of the proposed model.
| Parameter | Coefficient | Standard Error | t-Statistic |
|---|---|---|---|
| β1 | 0.401 *** | 0.127 | 3.156 |
| β2 | 0.280 *** | 0.078 | 3.594 |
| 0.024 | 0.066 | 0.364 | |
| 0.176 ** | 0.073 | 2.410 | |
| 0.008 | 0.010 | 0.745 | |
| ξ1band | 0.599 *** | 0.228 | 2.626 |
| ξ1price | 1.11 × 10⁻⁶ ** | 5.03 × 10⁻⁷ | 2.214 |
| ξ1diver | −5.84 × 10⁻³ * | 3.08 × 10⁻³ | −1.899 |
| ξ2band | 0.367 | 0.280 | 1.311 |
| ξ2price | 4.78 × 10⁻⁷ ** | 2.15 × 10⁻⁷ | 2.220 |
| ξ2diver | −1.05 × 10⁻³ | 7.78 × 10⁻⁴ | −1.352 |
* p < 0.10, ** p < 0.05, *** p < 0.01, (number of observations, N = 63; number of time periods, T = 21). ξprice and ξdiver represent the parameters of variables related to price and product diversification, respectively. All the parameters explaining Player 3’s diffusion (β3, ξ3band, ξ3price and ξ3diver) are not reported in Table 1 due to the constraint conditions.
Table 2.
Performance measures of diffusion models incorporating replacement and repeat purchases.
| LRK | MWS | HPKZ | Proposed Model | |
|---|---|---|---|---|
| (a) Fitted BIC | ||||
| Player 1 | 11.55 | 12.05 | 11.50 | 11.43 |
| Player 2 | 10.97 | 11.05 | 10.93 | 10.86 |
| Player 3 | 11.73 | 11.62 | 11.67 | 11.74 |
| (b) Forecast MAPE | ||||
| Player 1 | 9.68 | 9.15 | 9.62 | 8.38 |
| Player 2 | 48.52 | 16.63 | 16.21 | 51.89 |
| Player 3 | 85.29 | 24.68 | 39.05 | 2.33 |
© 2017 by the authors. Licensee MDPI, Basel, Switzerland. This article is an open access article distributed under the terms and conditions of the Creative Commons Attribution (CC BY) license (http://creativecommons.org/licenses/by/4.0/).
Share and Cite
MDPI and ACS Style
Lee, C.-Y.; Huh, S.-Y. Technology Forecasting Using a Diffusion Model Incorporating Replacement Purchases. Sustainability 2017, 9, 1038. https://doi.org/10.3390/su9061038
AMA Style
Lee C-Y, Huh S-Y. Technology Forecasting Using a Diffusion Model Incorporating Replacement Purchases. Sustainability. 2017; 9(6):1038. https://doi.org/10.3390/su9061038
Chicago/Turabian StyleLee, Chul-Yong, and Sung-Yoon Huh. 2017. "Technology Forecasting Using a Diffusion Model Incorporating Replacement Purchases" Sustainability 9, no. 6: 1038. https://doi.org/10.3390/su9061038
Note that from the first issue of 2016, this journal uses article numbers instead of page numbers. See further details here.