
Sustainability of Constructed Wetland under the Impact of Aquatic Organisms Overloading


Department of Civil and Ecological Engineering, I Shou University, Kaohsiung 84001, Taiwan
*
Author to whom correspondence should be addressed.
Sustainability 2017, 9(5), 863; https://doi.org/10.3390/su9050863
Submission received: 7 April 2017
/
Revised: 15 May 2017
/
Accepted: 16 May 2017
/
Published: 19 May 2017
(This article belongs to the Special Issue Wetland Ecology, Conservation and Sustainability: Applications of Geospatial Techniques)
Abstract
:Environmental impacts, such as earthquakes, chemical pollution and anthropogenic factors can affect the stability and sustainability of an ecosystem. In this study, a long-term (3.7 years) investigation experiment was conducted to estimate the sustainability of a constructed wetland (CW) under the impact of aquatic organisms overloading. The situation of aquatic organisms overloading in this study meant that around 27,000 kg of fishes had to be moved and accommodated in a 4 ha water area of wetland for six months. Experimental results indicated that the pH value of CW water was slightly acidic and the Dissolved Oxygen (DO) level decreased under the impact. On the other hand, the levels of Electrical Conductivity (EC), Suspended Solids (SS), Chemical Oxygen Demand (COD), and Total Kjeldahl Nitrogen (TKN) of CW water were increased under the impact. The pathogen analysis revealed that total coliforms, Salmonella spp., Enterococcus spp., and Escherichia coli, in the wetland water increased under the impact. The analyzed factors of water quality and amount of pathogens were all returned to their original statuses soon after the impact ended. Eventually, the results of microbial community structure analysis showed that overloading of aquatic organisms slightly increased the specific richness (R) of wetland bacteria, whereas higher structural biodiversity (H) of CW could stabilize the whole microbial community and prevent the pathogens or other bacteria from increasing to become the dominant strains. These results were novel and could be possible to conclude that a CW environment could not only stabilize the water quality and amount of pathogens resulting from the impact of aquatic organisms overloading, but also they could stabilize the microbial community structures, allowing the biogeochemical cycles of the CW to function. They could provide the useful information for wetland sustainability.
1. Introduction
Wetlands are defined as areas that are inundated by surface water or groundwater, whether natural or artificial, permanent or temporary, with water that is static or flowing, the depth of which at low tide does not exceed 6 meters. Contributing to environmental and ecological stability, wetlands act as biofilters through a combination of physical, chemical and biological factors. Due to the proven water purification capability of wetlands, engineers and scientists have been encouraged to construct artificial wetland systems to emulate the features of natural wetlands [1].
Constructed wetlands (CWs) are engineered systems which use natural functions of vegetation, soil and organisms to treat different water streams. In the past decade, CWs have been already widely utilized in the removal of many biological, chemical and physical pollutants [2,3,4,5,6,7]. As in the definition of wetlands, CWs also serve as the habitat for various organisms, such as plants, birds and aquatic organisms. The basic elements which occur among living organisms and move into the environment by a series of naturally biological, chemical and physical processes are called biogeochemical cycles. Microbial communities and biogeochemical cycles play major roles in stabilizing wetland systems [8,9]. Different kinds of microorganisms, such as hydrogen bacteria, nitrogen-fixing bacteria and sulfur-oxidizing bacteria, are living in wetland systems and influence the mechanism of biogeochemical cycles. However, only a limited number of studies have focused on investigations of wetland microbial community structure and diversity [10,11,12,13,14,15,16,17,18].
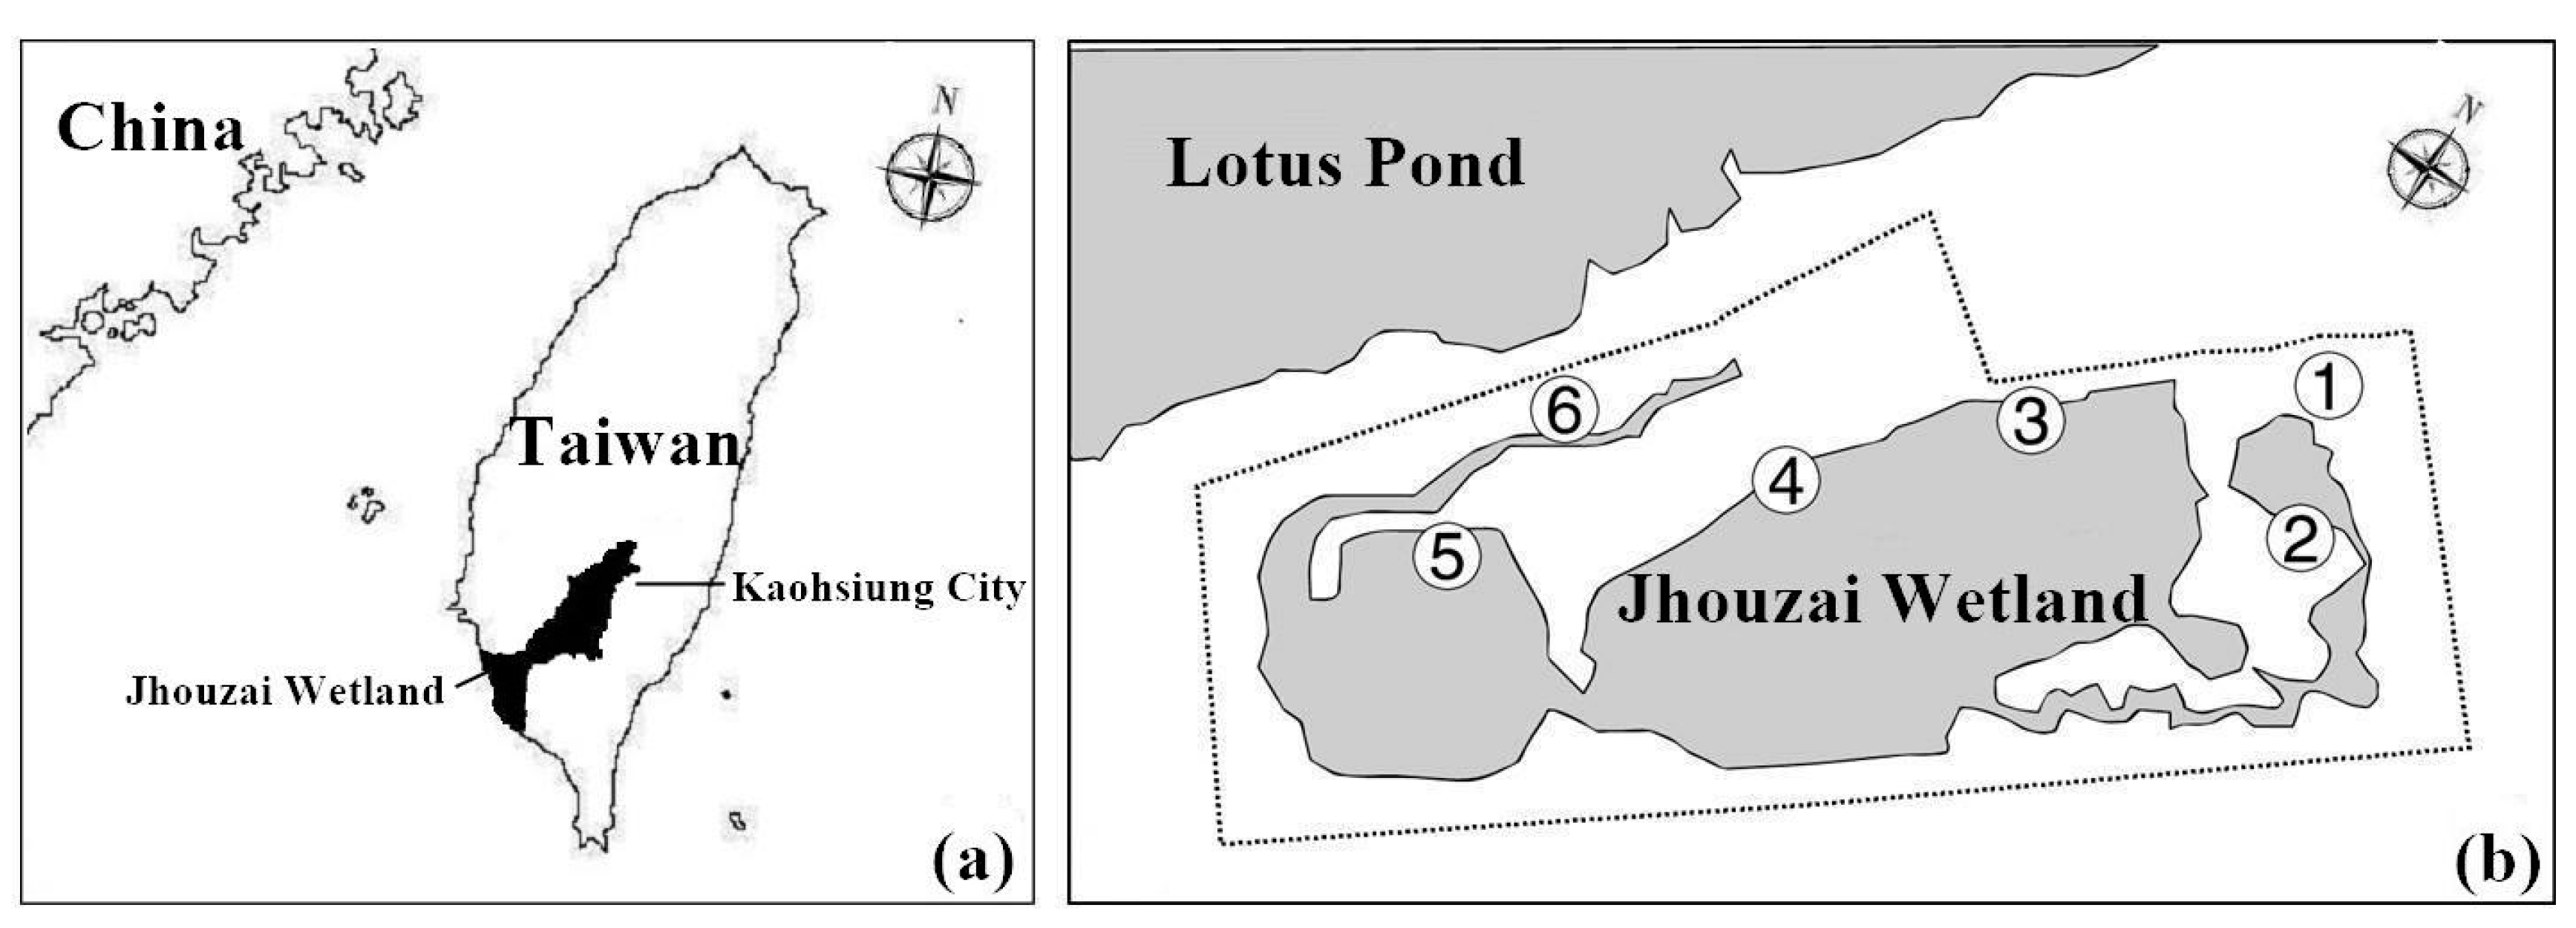
Located on the western edge of the Pacific Ocean, subtropical Taiwan has numerous natural wetlands and CWs. Kaohsiung City is the second-largest city of Taiwan and is located in the southern part of the country. Jhouzai Wetland, located in Kaohsiung City, is a horizontal free surface flow (FSF) CW. It used to be a paddy field. In 2002, it was constructed to become a constructed wetland. Adjacent to Jhouzai Wetland, Lotus Pond is a natural pond and also is the influent water source of Jhouzai Wetland. The water of Lotus Pond was drawn into Jhouzai Wetland every day by motor pumping and the effluent water was flown back to Lotus Pond from the water outlet. Due to the seasonal effects, the daily values of influent water were not fixed and then the values of the water recharge and flow rate were difficult to estimate.
In 2009, an investigative report of the Taiwan Wetland Conservation Association [19] indicated that Jhouzai Wetland and Lotus Pond were both of the natural habitats for various aquatic organisms. Aquatic organisms can be classified into four major groups: plants, microorganisms, invertebrates and vertebrates. The report revealed that over 30 species of the aquatic plants grow in Jhouzai Wetland and Lotus Pond. The major types of them are floating-leaved plants, such as Nymphaea tetragona (Water Lilies) and emerged plants, like Nelumbo nucifera (Lotus). Meanwhile, the report also revealed that 25 species of the vertebrates (fishes) inhabited Jhouzai Wetland and Lotus Pond. Among these, 9 are native species, such as Aristichthys nobilis (bighead carp) and Cyprinus carpio (platinum ogon), and 16 are alien species such as Liposarcus multiradiatus (armored catfish), Tilapia zillii (redbelly tilapia), and Chitala ornata (clown featherback). The total weight of fishes in Jhouzai Wetland and Lotus Pond was estimated to be 27,000 kg.
The carrying capacity of biological species in an environment is the maximum population size of the species. Organism overloading is defined when a biological population exceeds the carrying capacity of an area, leading to the decline of population growth rate, deterioration of living environment quality and accumulation of metabolites and toxins. In 2009, Kaohsiung City hosted the World Games, a multisport event primarily consisting of sports not featured in the Olympic Games, and Lotus Pond was the site of the aquatic sports competition arena. Therefore, Kaohsiung City government dredged Lotus Pond in January 2008. This dredging process continued for six months. The city government spent 200 million New Taiwan dollars (around 6.2 million US dollars) draining the green surface water of Lotus Pond and dredging the bottom sediments to ensure that it was deep and sufficiently clean. During the dredging process, the influent water from Lotus Pond was suspended and all the fishes of Lotus Pond were moved temporarily to Jhouzai Wetland. After the dredging process, these fishes were moved back to Lotus Pond. This situation meant that around 27,000 kg of fishes had to be moved and accommodated in a 4 ha water area (Jhouzai Wetland) for six months. The carrying capacity of Jhouzai Wetland was exceeded and the water quality, amount of pathogens, metabolites and microbial diversities were also affected. Hence, aquatic organism overloading became a significant problem in this stable CW.
The objective of this study is to estimate the sustainability of Jhouzai Wetland under the impact of aquatic organisms overloading. The impact of aquatic organisms overloading meant that around 27,000 kg of vertebrates (fishes) had to be moved and accommodated in the water area of Jhouzai Wetland for six months. Water quality items, such as Chemical Oxygen Demand (COD), Total Kjeldahl Nitrogen (TKN), pH value, Suspended Solids (SS), Dissolved Oxygen (DO), and Electrical Conductivity (EC), were analyzed. The amount and distribution of wetland water pathogens, such as total coliforms, Salmonella spp., Enterococcus spp., and Escherichia coli, were also analyzed. Eventually, the wetland microbial community, specific richness (R), structural biodiversity (H) and dominance (S) were all measured to analyze the microbial changes under the impact. The results of this study will provide the useful information for wetland sustainability.
2. Materials and Methods
2.1. Study Location and Sample Collection
The study location, Jhouzai Wetland, is a horizontal free surface flow (FSF) CW in Kaohsiung City, Taiwan (22°41′03″N; 120°17′29″E). This site has a 10 ha area which includes water area of 4 ha and land area of 6 ha. The length and the width of Jhouzai Wetland are 600 m and 150 m, respectively.
Water samples were collected from six sampling sites of the wetland (Figure 1). The sampling sites were numbered according to the route of the influent water. Sampling site 1 was the gate of the water inlet, site 2 was next to the swamp land, site 3 was next to the viewing platform, site 4 was the pool central area, site 5 was the deep water area, and site 6 was the gate of the water outlet. Surface water samples (depth, 0–20 cm) were collected in 3 L sterile glass bottles and stored at 4 °C. All water samples were mixed manually until homogeneity was observed before analysis. Water samples were collected in triplicate from each sampling site.
The first four samplings were conducted every six months from 16 December 2007 to 21 June 2009. Sampling date 1 was before the environmental impact and date 2 was under the environmental impact. Sampling date 3 was taken six months after the impact had ended and date 4 was taken after one year. Finally, sampling (sampling dates 5 and 6) was conducted twice between 2 January 2011 and 26 August 2012 at a gap of 18 months for long-term monitoring of the wetland.
2.2. Water Quality Analysis
To evaluate the water quality changes under the impact, COD, TKN, pH, SS, DO and EC were analyzed. All water quality analyses followed standard methods [20] and were performed in triplicate.
2.3. Pathogen Analysis
The total coliform count is an indicator of fecal contamination in water samples. It was determined using the standard membrane filtration method [21]. Water samples were diluted (typically in ratios of 1:2, 1:10 and 1:100; when necessary, 1:1000) in a phosphate buffer and the solution was passed through a 0.45 μm GN-6 mixed cellulose ester filter membrane to isolate the bacteria. After filtration, the filters were aseptically transferred to agar plates containing m-Endo agar (Difco, Sparks, MD, USA). The filters and pads were incubated at 35 °C for 24 h. After incubation, the filters were removed and yellow-gray, glossy, dome-shaped colonies on the plate were counted as coliforms.
Salmonella spp., Escherichia coli, and Enterococcus spp. are all indicators of environmental quality and were determined using Salmonella Shigella agar (SSA), mannitol salt agar (MSA), and m-Enterococcus agar (m-E agar), respectively. For the Salmonella spp. analysis, water samples were diluted in sterile deionized water and then spread on the SSA. The plates were incubated at 35 °C for 24 h. After incubation, Salmonella spp. formed black centers and colorless colonies on the SSA. For the Escherichia coli analysis, water samples were diluted in sterile deionized water and later spread on the MSA. The plates were incubated at 37 °C for 24 h. After incubation, colonies of Escherichia coli changed the agar from red to yellow. For the Enterococcus spp. analysis, water samples were diluted in sterile deionized water and spread on the m-E agar. The plates were subsequently incubated at 35 °C for 24 h. After incubation, Enterococcus spp. formed light and dark-red colonies on the m-E agar. All water samples used for pathogen analyses were processed within 6 h of collection. Samples were prepared in triplicate and enumeration counts between 20 and 200 were considered for analysis.
2.4. PCR-DGGE Analysis of Microbial Communities
In order to investigate wetland microbial community structure and diversity, polymerase chain reaction (PCR) and denaturing gradient gel electrophoresis (DGGE) are two of the most commonly used molecular bio-techniques. During the investigation period, microbial community changes of Jhouzai Wetland were measured by using the PCR-DGGE technique. On the first four sampling dates, the microbial DNA from the water samples (sampling site 6) of Jhouzai Wetland was obtained and analyzed. DNA extraction and PCR-DGGE analysis were performed as described in our previous study [22]. The total microbial DNA was extracted from the wetland water by using an UltraClean Soil DNA kit (MO BIO Laboratories, Inc., Carlsbad, CA, USA). After extraction, the total microbial DNA was purified to remove humic acids and subsequently the DNA extracts were loaded into a 1% agarose gel to conduct electrophoresis. After electrophoresis and staining with ethidium bromide, the total microbial DNA was excised from the gel and recovered using a QIAquick gel extraction kit (QIAGEN GmbH, Hilden, Germany). PCR reactions were conducted using the GeneAmp PCR System 9700 thermal cycler (Applied Biosystems, Foster City, CA, USA). The PCR primers 968f: 5′-GC-clamp + AACGCGAAGAACCTTAC-3′ and 1401r: 5′-CGGTGTGTACAAGACCC-3′ were combined to amplify a segment of eubacterial 16S rDNA gene sequences from nucleotide 968 to nucleotide 1401 [23]. The PCR was conducted as follows: an initial DNA denaturation step was carried out at 95 °C for 5 min, followed by 35 cycles of 45 s at 95 °C, annealing for 45 s at 55 °C, and extension for 1 min at 72 °C and a final extension at 72 °C for 10 min. The PCR product was analyzed using agarose gel electrophoresis and visualized using ethidium bromide staining.
The DGGE analysis was conducted using a d-Code universal mutation detection system (Bio-Rad, Hercules, CA, USA). The PCR products were separated on a double-gradient gel, as described by Cremonesi et al. [24]. The gel consisted of an 8% polyacrylamide gradient with a 30–60% denaturing gradient (100% = 7 M urea with 40% formamide). Electrophoresis was conducted at 200 V for 3 h in 1 × TAE buffer (40 mM Tris, 20 mM acetate, 1 mM EDTA, pH 7.4) at a constant temperature of 60 °C. After electrophoresis, polyacrylamide gel was stained with the silver staining and was scanned using a video system. Scanned gels have been analyzed with the QuantityOne software package (BioRad, Richmond, CA, USA), following the strategy proposed by Eichner et al. [25].
2.5. Statistical Analysis of Water Quality and Pathogens
The water quality measurements were compared using t tests. Pathogen variables in the wetland water samples were compared using analysis of variance (ANOVA). A significance level of p = 0.05 was used for all statistical tests, and the values are reported as the mean (average) ± standard error.
2.6. Statistical Analyses of DGGE Patterns
A cluster analysis [26] can be used to interpret the results from PCR and DGGE analysis. A statistical parameter, the minimum distance (MD) [27], is used to determine the cluster numbers of dendrograms constructed using the unweighted pair group method with arithmetic mean (UPGMA) [28].
The R, H and S of wetland microbial communities were measured by the following processes: (1) Total number of bands N in a gel lane was first corrected for crowding and transformed into richness estimates R as described by Nübel et al. [29]; (2) After matching bands from independent lanes, pairwise coefficient of Dice [30] were calculated [SD = (2nAB)/(nA + nB) where nA and nB are the total numbers of bands in lanes A and B, and nAB is the number of bands common to lane A and B]; (3) The Shannon–Weaver index of general diversity, H [31], was calculated using the following function:
where Pi is the importance probability of the bands in a lane. H was calculated on the basis of the bands on the gel lanes using the intensity of the bands as judged by peak heights in the densitometric curves. The importance probability Pi was calculated as:
where ni is the height of peak i in the densitometric curve.
3. Results and Discussion
3.1. Water Quality
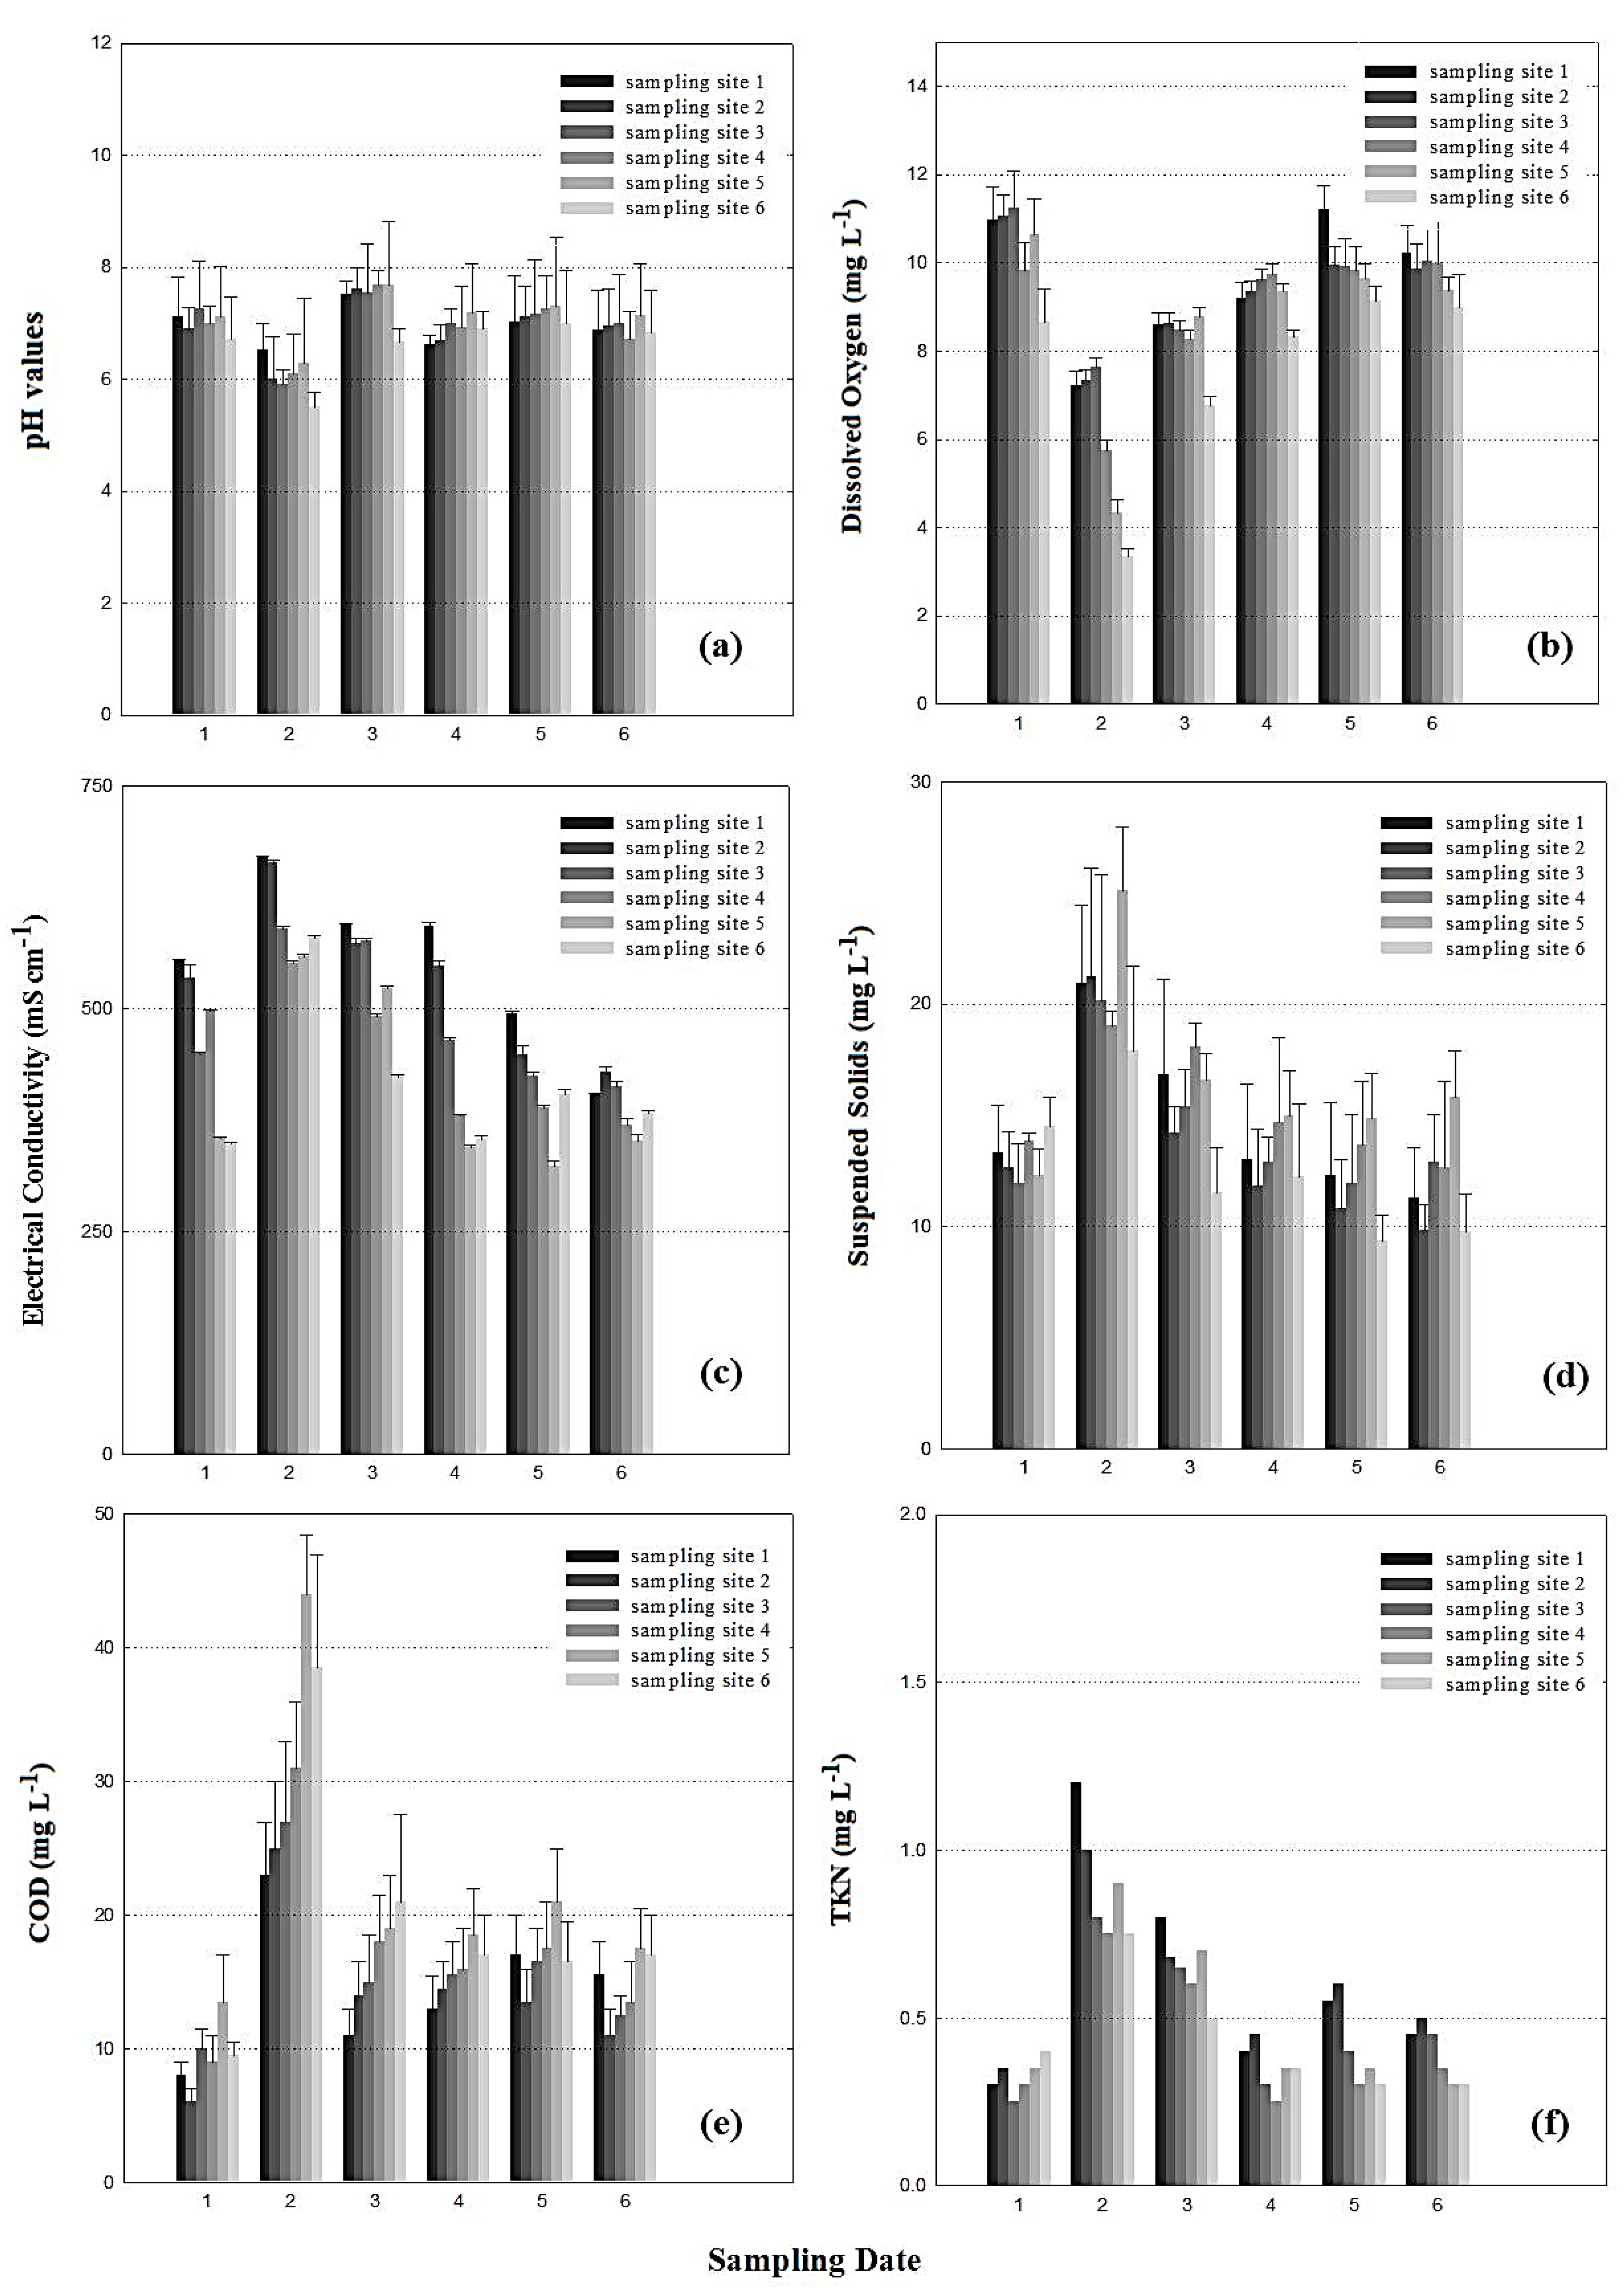
The water quality is a crucial parameter for evaluating the stability and sustainability of a wetland. The results of Jhouzai Wetland water quality analysis on the six sampling dates are shown in Figure 2. The pH values of the wetland water under the impact from overloading of aquatic organisms (sampling date 2) were slightly more acidic than they were before (Figure 2a). After the impact ended, the pH values returned to their original statuses immediately (sampling date 3). The pH values measured a half year after the impact ended (sampling date 4) and during long-term monitoring (sampling dates 5 and 6) all remained around 7. Regarding the sampling sites, the pH values of the samples which were collected from the water outlet (sampling site 6) were slightly more acidic than those collected from the other sites under and just after the impact ended (sampling dates 3 and 4). These results indicated that overloading of aquatic organisms, increasing of metabolites and wetland bacteria might all cause the acidification of wetland water. Once the pH values of wetland water are lower than 6, it could lead to decreasing rates of nitrification and easily cause the ammonia (NH3) to turn into ammonium (NH4+). These results would all lead to the deterioration of wetland water quality.
The DO level is a relative measure of the amount of oxygen dissolved or carried in a medium. Figure 2b shows the DO levels of the wetland water on the six sampling dates. As expected, the DO level was lower under the impact (sampling dates 2) than it was on other sampling dates. The DO levels of sampling dates 2 ranged from 3.34 ± 0.19 to 7.16 ± 0.23 mg L−1. In addition, the DO levels were the lowest at sampling sites 5 and 6 under the impact (sampling date 2). These results indicated that overloading of aquatic organisms in the wetland might have caused a gradual decrease in the DO levels from the gate of the water inlet to the gate of the water outlet. As the result of pH, the increasing of primary and secondary metabolites could lead to an increase in wetland bacteria. Both of these two situations could cause acidification and lower the DO of the wetland.
The EC value is a reciprocal quantity and measures the ability of a material to conduct an electric current. Figure 2c shows the EC values of the wetland water on the six sampling dates. The EC value of the wetland water increased slightly under the impact (sampling dates 2) compared with previous measurements. The EC values of sampling dates 2 ranged from 671.3 ± 3.65 to 550.6 ± 2.61 mS cm−1. After the impact ended (sampling dates 3 and 4), the EC value returned to its original status, and it retained this status during long-term monitoring (sampling dates 5 and 6). These results indicated that the ion content and electrolytes of the wetland water were increased under the impact. The EC value of the wetland water might have increased due to the dissolution of salts. The salts might have originated from the water and sediments of Lotus Pond that flowed into the wetland with the aquatic organisms. However, the EC values eventually returned to their original status after the impact ended due to the remediation ability of the wetland itself. Higher quality water has a lower EC.
The SS value refers to small solid particles that remain suspended in water in the form of colloids or due to the motion of the water. This parameter is typically used as an indicator of wetland water quality. Figure 2d shows the SS values of the wetland water on the six sampling dates. The result revealed that the SS value was increased under the impact (sampling dates 2). The SS values of sampling dates 2 ranged from 17.89 ± 3.82 to 25.13 ± 2.84 mg L−1. After the impact ended (sampling dates 3 and 4), the SS values returned to their original status, and they retained this status during long-term monitoring (sampling dates 5 and 6). These results indicate that increasing metabolites and wetland bacteria might have produced biological polymers and caused an increase in SS under the impact. The SS values eventually returned to their original status after the impact ended. This could be attributable to the sedimentation of biological polymers and biodegradation of wetland bacteria.
The COD value represents a class of organic compounds that are susceptible to oxidation by a strong chemical oxidant (potassium dichromate) under acidic conditions. This value is numerically higher than the Biochemical Oxygen Demand (BOD5) value because more organic compounds can be chemically oxidized than are biologically degraded. In the wetland environment, the presence of humic materials typically leads to higher COD values than BOD5 values. Figure 2e shows the COD level of the wetland water on the six sampling dates. The COD values increased under the impact (sampling dates 2). The COD values of sampling dates 2 were from 23 to 44 mg L−1. After the impact ended (sampling dates 3 and 4), the COD values returned to their original status, and they retained this status during long-term monitoring (sampling dates 5 and 6). The highest COD value, measured at sampling site 5 on sampling date 2, was 44 mg L−1. This may be due to the stagnation of wetland water at the water outlet gate compared with the other sites. However, this COD value was still lower than that of effluent standards established by the Taiwan Environmental Protection Administration (EPA).
TKN is the sum of organic nitrogen, ammonia (NH3) and ammonium (NH4+) in the environment. It is a required parameter for regulatory reporting at several CWs and a means of monitoring CW operations. Figure 2f shows the TKN of the wetland water on the six sampling dates. The TKN increased under the impact (sampling date 2). The TKN values of sampling dates 2 ranged from 0.75 to 1.2 mg L−1. The highest TKN, measured at sampling site 1 on sampling date 2, was 1.2 mg L−1. This result indicated that TKN accumulated at the gate of the water inlet (sampling site 1) and subsequently degraded inside the wetland. After the impact ended (sampling dates 3 and 4), the TKN values returned to their original status. These results indicate that the increased TKN might have originated from the primary and secondary metabolites of the wetland organisms and may have been transformed by the nitrogen bacteria of the wetland.
According to the results of water quality, the lower pH and DO of the wetland water might have been caused by increasing metabolites and wetland bacteria under the impact. On the other hand, the EC value of the wetland water might have increased due to the dissolution of salts. The salts might have originated from the water and sediments of Lotus Pond that flowed into wetland with the aquatic organisms. The increase of metabolites and wetland bacteria could also have produced biological polymers and thus increased SS, COD and TKN under the impact. The nitrogen bacteria in the wetland might also have caused the increase of TKN. Regarding the sampling sites, the results indicate that the stagnation of wetland water at the water outlet gate (sampling sites 5 and 6) might have caused the significant effects on pH, DO, SS, and COD when compared with the other sites. However, due to the high stability and sustainability of the wetland, the water quality of these sites eventually returned to their original status, and they retained this status during long-term monitoring (sampling dates 5 and 6). This demonstrates that wetlands have the ability to stabilize and restore the affected environment [1].
3.2. Pathogen Amounts and Distribution
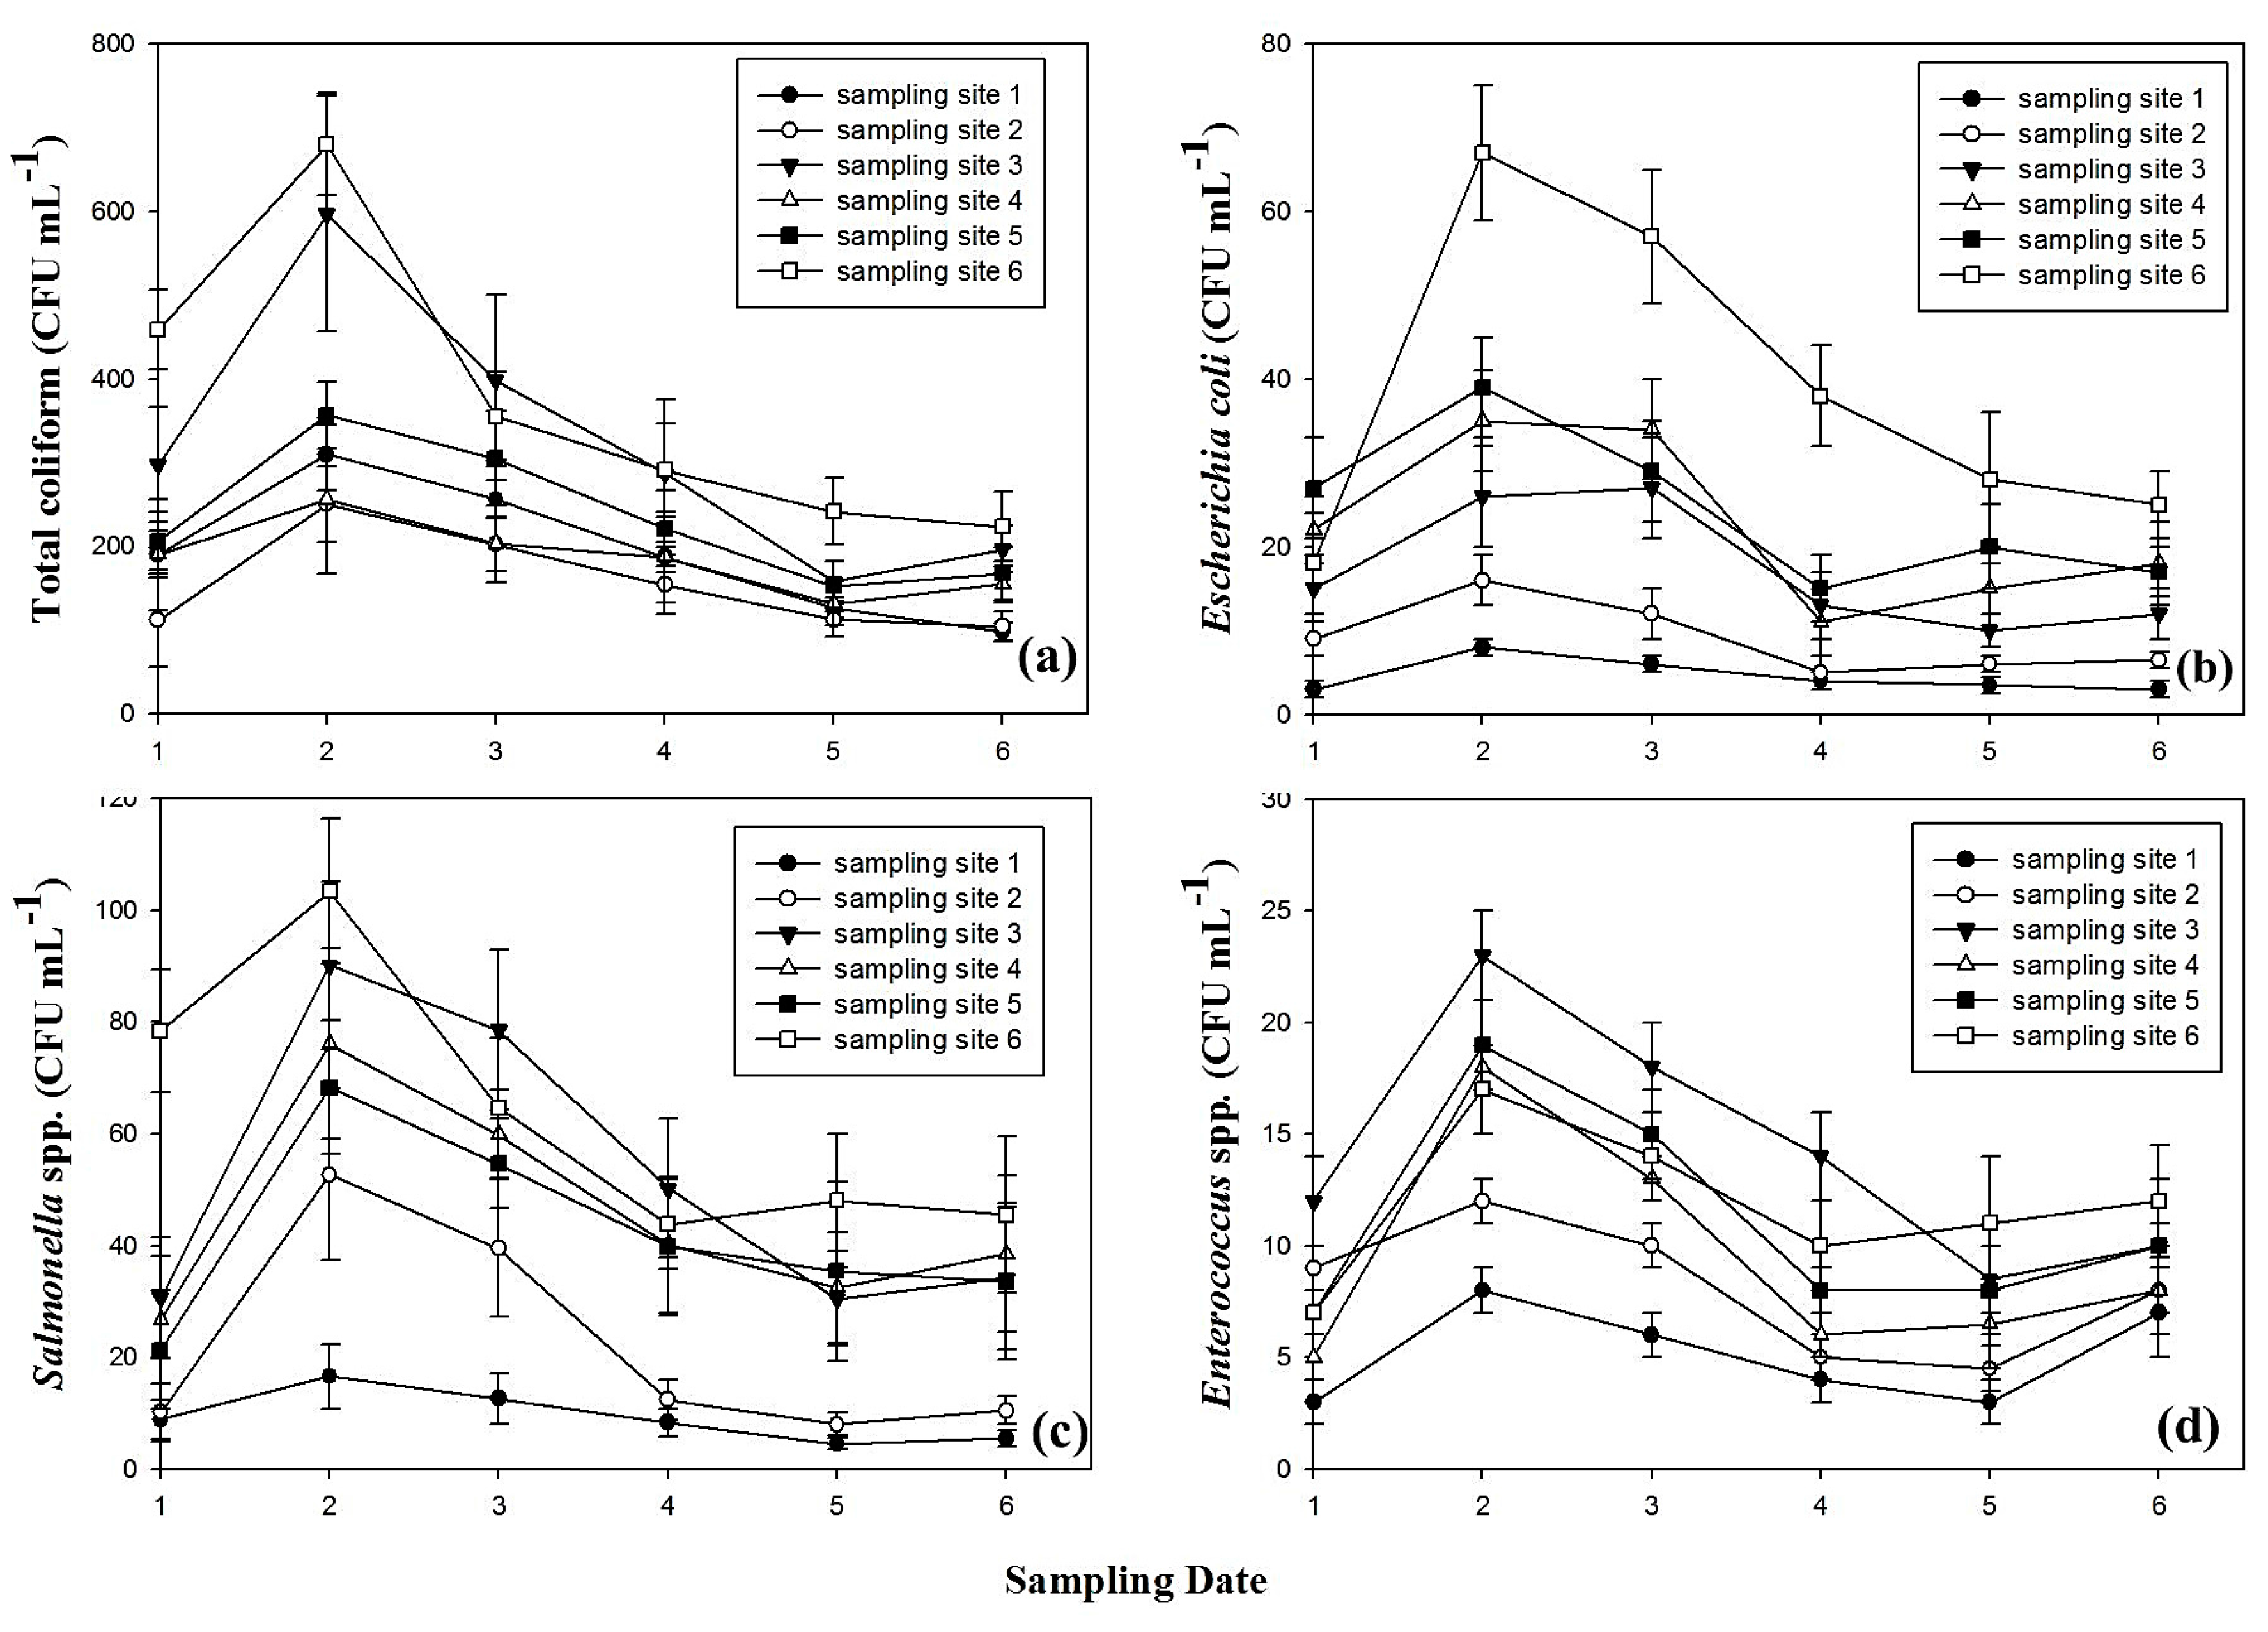
The amounts and distribution of pathogens in Jhouzai Wetland are depicted in Figure 3. The amounts of total coliforms increased significantly under the impact (sampling date 2) (Figure 3a). Every sampling site exhibited this trend. The amounts of total coliforms on sampling date 2 ranged from 250.2 ± 45.2 to 679.8 ± 61.1 CFU mL−1. After the impact ended, the amounts of total coliforms in the wetland water returned to the original status. The amounts of Escherichia coli in the wetland water are depicted in Figure 3b. These results indicate that the amounts of Escherichia coli increased significantly under the impact. The amounts of Escherichia coli on sampling date 2 ranged from 8.0 ± 1.0 to 67.0 ± 8.0 CFU mL−1. Similarly, with total coliforms, after the impact ended, the amounts of Escherichia coli decreased to their original status. The amounts of Salmonella spp. and Enterococcus spp. in the wetland water are depicted in Figure 3c,d, respectively. The amounts of Salmonella spp. and Enterococcus spp. both increased significantly under the impact. On sampling date 2, the amounts of Salmonella spp. ranged from 16.6 ± 5.7 to 103.4 ± 13.0 CFU mL−1 and the amounts of Enterococcus spp. ranged from 8.1 ± 1.2 to 23.4 ± 2.1 CFU mL−1. The growth trends of Salmonella spp. and Enterococcus spp. were similar to those of total coliforms and Escherichia coli. After the impact ended, the amounts of Salmonella spp. and Enterococcus spp. in the wetland water decreased to their original status.
A comparison of the pathogen amounts at different sampling sites showed that the total coliforms, Escherichia coli, and Salmonella spp. were the highest at sampling site 6 under the impact (sampling date 2). This might have been caused by stagnation of the wetland water at the water outlet gate, which created a more favorable environment for the growth of pathogens. Nevertheless, the amounts of pathogens in the wetland water remained lower than the value of effluent standards established by the Taiwan EPA.
A comprehensive review of the water quality and pathogen analysis results indicated two possible explanations. First, Jhouzai Wetland was overloaded with fish species. This produced ample metabolites and, therefore, caused the changes in the water quality and increased the amount of pathogens. The second explanation is derived from consideration of wetland microorganisms. The amount of whole wetland microorganisms might have been acceptable, but still affected the water quality and caused the amount of pathogens to increase. Nevertheless, both the water quality and pathogen amounts that were affected under the impact eventually returned to their original statuses after the impact ended. This result might be due to the remediation ability of the wetland itself [33,34,35].
3.3. Microbial Community Structure Analysis
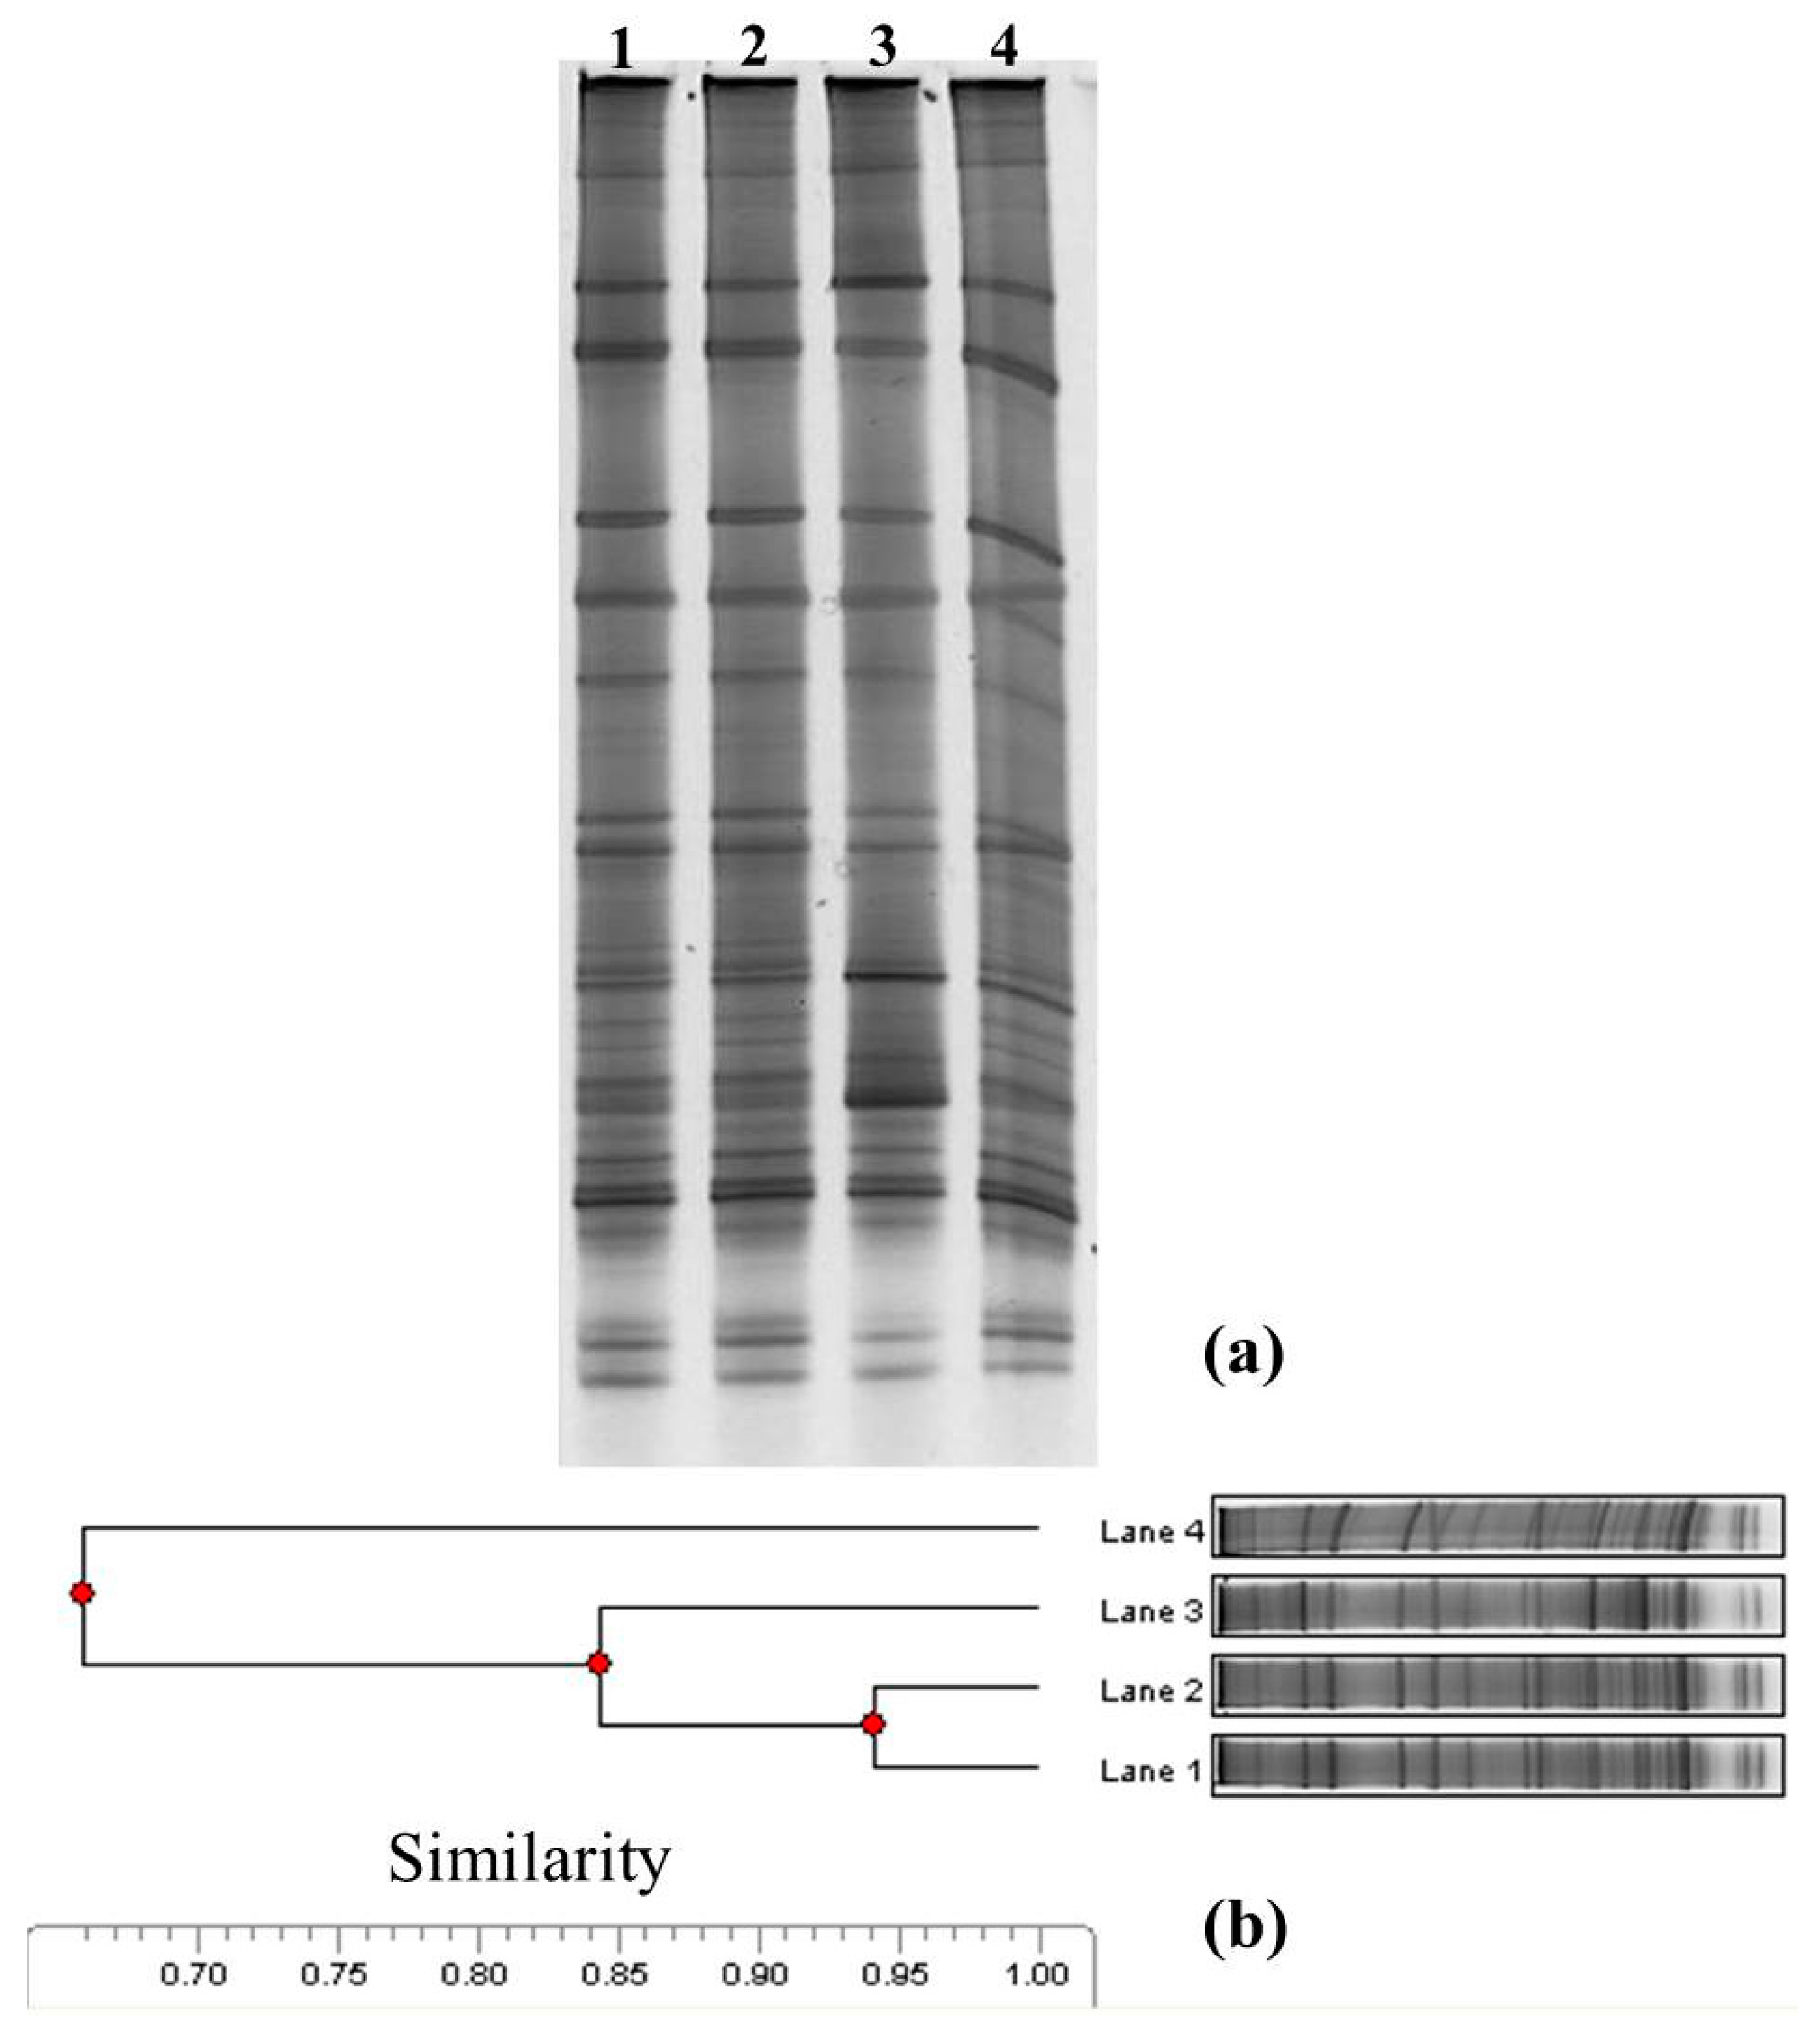
The overloading of aquatic organisms not only affected the water quality and the pathogens, but also the whole structure of the wetland microbial communities. Figure 4 shows the PCR-DGGE profile and phylogenic dendrogram of the wetland microbial community structures on the first four sampling dates. Lanes 1 to 4 represent the first four sampling dates, respectively. The result of the phylogenic dendrogram (Figure 4b) showed that the microbial communities retained high similarity throughout the whole experiment. Figure 4b indicates that the similarity in lanes 1 and 2 was 94%. These results indicate that the microbial community structures present before and under the impact had the highest similarity. A comparison with the data of pathogens revealed that although the amounts of pathogens increased under the impact, however, the microbial community structure of wetland remained uniform. Figure 4b also illustrates that the similarity of lane 3 with lanes 1 and 2 was 84% and the similarity of lane 4 with other lanes was 66%. These results indicated that the microbial community structures changed slightly after the impact ended.
On the other hand, Table 1 shows the R, H and S indexes calculated from the digitized DGGE patterns shown in Figure 4. R was equal to the number of bacterial bands. The concentration of S and the general index of H were calculated on the basis of the number and relative intensities of bands on a gel lane. The results showed that R and H were slightly increased under the impact. However, the result of S showed that the microbial communities did not appear to be the dominant strains during the whole experiment. These results indicate that overloading of aquatic organisms only slightly increased the richness of wetland bacteria, whereas higher H in the CW can stabilize the whole microbial community and prevent pathogens or other bacteria from becoming the dominant strains. They also showed that the microbial community changes of a wetland are a crucial item when analyzing wetland stability and sustainability [16,17].
4. Conclusions
This study analyzed the stability of a constructed wetland (CW) and the impact of overloading of aquatic organisms. According to the results of the water quality analysis, the lower pH and DO of the wetland water might have been caused by the increase of metabolites and overloading of aquatic organisms under the impact. On the other hand, the EC value of the wetland water might have increased due to the dissolution of salts. The salts probably have originated from the water and sediments of Lotus Pond, which flows into wetland, and contains aquatic organisms. The increasing of metabolites and wetland bacteria may also have produced biological polymers and caused the increase of SS, COD and TKN under the impact. Regarding the sampling sites, the results indicated that the stagnation of wetland water at the water outlet gate (sampling sites 5 and 6) might have caused the significant effects on pH, DO, SS and COD when compared with the other sites.
The results of pathogen analysis revealed that total coliforms, Salmonella spp., Escherichia coli, and Enterococcus spp. all were initially increased under the impact, but finally were returned to their original statuses after the impact ended. These results demonstrate that accommodation of too many fish species probably have produced excessive metabolites and, therefore, caused the changes in the water quality and increased the amount of pathogens. However, all the parameters eventually returned to their original statuses after the impact ended. This may be attributed to the remediation ability of wetland itself.
The result of microbial community structure analysis showed that the R and H values were slightly increased under the impact. However, the result of phylogenic dendrogram and S showed that the microbial communities retained high similarity and did not become dominant strains during the investigation period. The results also indicated that overloading of aquatic organisms only slightly increased the R of wetland bacteria, whereas higher H in the CW can stabilize the whole microbial community and prevent pathogens or other bacteria from increasing and becoming the dominant strains. Based on these observations, it is possible to conclude that a CW can not only stabilize the water quality and amount of pathogens when impacted by overloading of aquatic organisms, but also can stabilize the microbial community structures, allowing biogeochemical cycles to function. These results could provide the useful information for wetland sustainability. In future projects, it is to continue monitoring this CW and measuring the water quality and microbial diversity.
Acknowledgments
The authors are grateful to the members of the Taiwan Wetland Conservation Association for helping us collect the water samples for analysis.
Author Contributions
Chien-Sen Liao conceived and designed the experiments, managed the study, edited and finished the manuscript. Shih-Chieh Chen and Sung-Lin Chao collected the related experimental data, performed the experiments and wrote the draft of the manuscript. Ming-Young Jan conducted the literature review and completed the analytical results. Kuo-Liang Lin helped Shih-Chieh Chen to improve the English expression of the manuscript. All authors read and approved the final manuscript.
Conflicts of Interest
The authors declare no conflict of interest.
References
- Wu, H.; Zhang, J.; Ngo, H.H.; Guo, W.; Hu, Z.; Liang, S.; Fan, J.; Liu, H. A review on the sustainability of constructed wetlands for wastewater treatment: Design and operation. Bioresour. Technol. 2015, 175, 594–601. [Google Scholar] [CrossRef] [PubMed]
- Saeed, T.; Sun, G. A review on nitrogen and organics removal mechanisms in subsurface flow constructed wetlands: Dependency on environmental parameters, operating conditions and supporting media. J. Environ. Manag. 2012, 112, 429–448. [Google Scholar] [CrossRef] [PubMed]
- Avelar, F.F.; Matos, A.T.; Matos, M.P.; Borges, A.C. Coliform bacteria removal from sewage in constructed wetlands planted with Mentha aquatica. Environ. Technol. 2014, 35, 2095–2103. [Google Scholar] [CrossRef] [PubMed]
- Badhe, N.; Saha, S.; Biswas, R.; Nandy, T. Role of algal biofilm in improving the performance of free surface, up-flow constructed wetland. Bioresour. Technol. 2014, 169, 596–604. [Google Scholar] [CrossRef] [PubMed]
- Liu, G.J.; Zheng, D.; Deng, L.W.; Wen, Q.; Liu, Y. Comparison of constructed wetland and stabilization pond for the treatment of digested effluent of swine wastewater. Environ. Technol. 2014, 35, 2660–2669. [Google Scholar] [CrossRef] [PubMed]
- Tang, M.; Zhang, F.; Yao, S.; Liu, Y.; Chen, J. Application of Pseudomonas flava WD-3 for sewage treatment in constructed wetland in winter. Environ. Technol. 2015, 36, 1205–1211. [Google Scholar] [CrossRef] [PubMed]
- Wu, S.; Wallace, S.; Brix, H.; Kuschk, P.; Kirui, W.K.; Masi, F.; Dong, R. Treatment of industrial effluents in constructed wetlands: Challenges, operational strategies and overall performance. Environ. Pollut. 2015, 201, 107–120. [Google Scholar] [CrossRef] [PubMed]
- Wang, Y.; Yang, H.; Ye, C.; Chen, X.; Xie, B.; Huang, C.; Zhang, J.; Xu, M. Effects of plant species on soil microbial processes and CH4 emission from constructed wetlands. Environ. Pollut. 2013, 174, 273–278. [Google Scholar] [CrossRef] [PubMed]
- Mackintosh, T.J.; Davis, J.A.; Thompson, R.M. Impacts of multiple stressors on ecosystem function: Leaf decomposition in constructed urban wetlands. Environ. Pollut. 2016, 208, 221–232. [Google Scholar] [CrossRef] [PubMed]
- Nicomrat, D.; Dick, W.A.; Tuovinen, O.H. Assessment of the microbial community in a constructed wetland that receives acid coal mine drainage. Microbial. Ecol. 2006, 51, 83–89. [Google Scholar] [CrossRef] [PubMed]
- Jin, G.; Kelley, T.R. Characterization of microbial communities in a pilot-scale constructed wetland using PLFA and PCR-DGGE analyses. J. Environ. Sci. Health Part A 2007, 42, 1639–1647. [Google Scholar] [CrossRef] [PubMed]
- Weber, K.P.; Gehder, M.; Legge, R.L. Assessment of changes in the microbial community of constructed wetland mesocosms in response to acid mine drainage exposure. Water Res. 2008, 42, 180–188. [Google Scholar] [CrossRef] [PubMed]
- Calheiros, C.S.; Duque, A.F.; Moura, A.; Henriques, I.S.; Correia, A.; Rangel, A.O.; Castro, P.M. Substrate effect on bacterial communities from constructed wetlands planted with Typha latifolia treating industrial wastewater. Ecol. Eng. 2009, 35, 744–753. [Google Scholar] [CrossRef]
- Truu, M.; Juhanson, J.; Truu, J. Microbial biomass, activity and community composition in constructed wetlands. Sci. Total Environ. 2009, 407, 3958–3971. [Google Scholar] [CrossRef] [PubMed]
- Li, M.; Zhou, Q.; Tao, M.; Wang, Y.; Jiang, L.; Wu, Z. Comparative study of microbial community structure in different filter media of constructed wetland. J. Environ. Sci. 2010, 22, 127–133. [Google Scholar] [CrossRef]
- Ramond, J.B.; Welz, P.J.; Cowan, D.A.; Burton, S.G. Microbial community structure stability, a key parameter in monitoring the development of constructed wetland mesocosms during start-up. Res. Microbiol. 2012, 163, 28–35. [Google Scholar] [CrossRef] [PubMed]
- Mulling, B.T.; Soeter, A.M.; Van Der Geest, H.G.; Admiraal, W. Changes in the planktonic microbial community during residence in a surface flow constructed wetland used for tertiary wastewater treatment. Sci. Total Environ. 2014, 466–467, 881–887. [Google Scholar] [CrossRef] [PubMed]
- Wang, Y.F.; Wu, Y.; Pi, N.; Tam, N.F.Y. Investigation of microbial community structure in constructed mangrove microcosms receiving wastewater-borne polycyclic aromatic hydrocarbons (PAHs) and polybrominated diphenyl ethers (PBDEs). Environ. Pollut. 2014, 187, 136–144. [Google Scholar] [CrossRef] [PubMed]
- Taiwan Wetland Conservation Association. Available online: http://ppt.cc/HfCDl (accessed on 18 May 2017).
- American Public Health Association. Standard Methods for the Examination of Water and Wastewater; American Public Health Association: Washington, DC, USA, 2005. [Google Scholar]
- U.S. Environmental Protection Agency. Method 1604: Total Coliforms and Escherichia coli in Water by Membrane Filtration Using a Simultaneous Detection Technique (MI Medium); USEPA Office of Water: Washington, DC, USA, 2002.
- Chang, B.V.; Liu, J.H.; Liao, C.S. Aerobic degradation of bisphenol-A and its derivatives in river sediment. Environ. Technol. 2014, 35, 416–424. [Google Scholar] [CrossRef] [PubMed]
- Nübel, U.; Engelen, B.; Felske, A.; Snaidr, J.; Wieshuber, A.; Amann, R.I.; Ludwig, W.; Backhaus, H. Sequence heterogeneities of genes encoding 16S rRNAs in Paenibacillus. polymyxa detected by temperature gradient gel electrophoresis. J. Bacteriol. 1996, 178, 5636–5643. [Google Scholar] [CrossRef] [PubMed]
- Cremonesi, L.; Firpo, S.; Ferrari, M.; Righetti, P.G.; Gelfi, C. Double-gradient DGGE for optimized detection of DNA point mutations. Biotechniques 1997, 22, 326–330. [Google Scholar] [PubMed]
- Eichner, C.A.; Erb, R.W.; Timmis, K.N.; Wagner-Döbler, I. Thermal gradient gel electrophoresis analysis of bioprotection from pollutant shocks in the activated sludge microbial community. Appl. Environ. Microbiol. 1999, 65, 102–109. [Google Scholar] [PubMed]
- Johnson, S.C. Hierarchical clustering schemes. Psychometrika 1967, 32, 241–254. [Google Scholar] [CrossRef] [PubMed]
- Wolfowitz, J. The minimum distance method. Ann. Math. Stat. 1957, 28, 75–88. [Google Scholar] [CrossRef]
- Anderberg, M.R. Cluster Analysis for Applications: Probability and Mathematical Statistics: A Series of Monographs and Textbooks; Academic Press: New York, NY, USA, 2014. [Google Scholar]
- Nübel, U.; Garcia-Pichel, F.; Kühl, M.; Muyzer, G. Quantifying microbial diversity: Morphotypes, 16S rRNA genes, and carotenoids of oxygenic phototrophs in microbial mats. Appl. Environ. Microbiol. 1999, 65, 422–430. [Google Scholar] [PubMed]
- Dice, L.R. Measures of the amount of ecologic association between species. Ecology 1945, 16, 297–302. [Google Scholar] [CrossRef]
- Shannon, C.E.; Weaver, W. The Mathematical Theory of function. J. Am. Stat. Assoc. 1963, 58, 236–244. [Google Scholar]
- Simpson, E.H. Measurement of diversity. Nature 1949, 163, 688. [Google Scholar] [CrossRef]
- Perkins, J.; Hunter, C. Removal of enteric bacteria in a surface flow constructed wetland in Yorkshire, England. Water Res. 2000, 34, 1941–1947. [Google Scholar] [CrossRef]
- Karim, M.R.; Manshadi, F.D.; Karpiscak, M.M.; Gerba, C.P. The persistence and removal of enteric pathogens in constructed wetlands. Water Res. 2004, 38, 1831–1837. [Google Scholar] [CrossRef] [PubMed]
- García, M.; Soto, F.; González, J.M.; Bécares, E.A. Comparison of bacterial removal efficiencies in constructed wetlands and algae-based systems. Ecol. Eng. 2008, 32, 238–243. [Google Scholar] [CrossRef]
Figure 1.
Location (a) and sampling sites (b) of Jhouzai Wetland.

Figure 2.
Water quality analysis of Jhouzai Wetland on six sampling dates. (a) pH values; (b) Dissolved Oxygen (DO); (c) Electrical Conductivity (EC); (d) Suspended Solids (SS); (e) Chemical Oxygen Demand (COD); and (f) Total Kjeldahl Nitrogen (TKN).
Figure 2.
Water quality analysis of Jhouzai Wetland on six sampling dates. (a) pH values; (b) Dissolved Oxygen (DO); (c) Electrical Conductivity (EC); (d) Suspended Solids (SS); (e) Chemical Oxygen Demand (COD); and (f) Total Kjeldahl Nitrogen (TKN).

Figure 3.
Amount and distribution of wetland pathogens on six sampling dates. (a) Total coliforms; (b) Escherichia coli; (c) Salmonella spp.; and (d) Enterococcus spp.
Figure 3.
Amount and distribution of wetland pathogens on six sampling dates. (a) Total coliforms; (b) Escherichia coli; (c) Salmonella spp.; and (d) Enterococcus spp.

Figure 4.
Denaturing gradient gel electrophoresis (DGGE) profile (a) and phylogenic dendrogram (b) of the wetland microbial community structures on the first four sampling dates.
Figure 4.
Denaturing gradient gel electrophoresis (DGGE) profile (a) and phylogenic dendrogram (b) of the wetland microbial community structures on the first four sampling dates.


Table 1.
Specific richness (R), structural biodiversity (H) and dominance (S) indexes calculated from the digitized DGGE patterns.
Table 1.
Specific richness (R), structural biodiversity (H) and dominance (S) indexes calculated from the digitized DGGE patterns.
| Sampling Dates | R | H | S |
|---|---|---|---|
| 1 (lane 1, before the impact) | 34 | 4.69 | 0.05 |
| 2 (lane 2, under the impact) | 36 | 4.71 | 0.05 |
| 3 (lane 3, after the impact for 6 months) | 33 | 4.42 | 0.06 |
| 4 (lane 4, after the impact for 1 year) | 31 | 4.57 | 0.05 |
© 2017 by the authors. Licensee MDPI, Basel, Switzerland. This article is an open access article distributed under the terms and conditions of the Creative Commons Attribution (CC BY) license (http://creativecommons.org/licenses/by/4.0/).
Share and Cite
MDPI and ACS Style
Chen, S.-C.; Jan, M.-Y.; Lin, K.-L.; Chao, S.-L.; Liao, C.-S. Sustainability of Constructed Wetland under the Impact of Aquatic Organisms Overloading. Sustainability 2017, 9, 863. https://doi.org/10.3390/su9050863
AMA Style
Chen S-C, Jan M-Y, Lin K-L, Chao S-L, Liao C-S. Sustainability of Constructed Wetland under the Impact of Aquatic Organisms Overloading. Sustainability. 2017; 9(5):863. https://doi.org/10.3390/su9050863
Chicago/Turabian StyleChen, Shih-Chieh, Ming-Young Jan, Kuo-Liang Lin, Sung-Lin Chao, and Chien-Sen Liao. 2017. "Sustainability of Constructed Wetland under the Impact of Aquatic Organisms Overloading" Sustainability 9, no. 5: 863. https://doi.org/10.3390/su9050863
Note that from the first issue of 2016, this journal uses article numbers instead of page numbers. See further details here.