
A Note on Medium- and Long-Term Global Energy Prospects and Scenarios
by
 , ,
, ,
Carlo Andrea Bollino
1, 
Francesco Asdrubali
2,
Paolo Polinori
1,
Simona Bigerna
1,
Silvia Micheli
1,
Claudia Guattari
2 and
Antonella Rotili
3,* 1
Department of Economics, University of Perugia, Via A. Pascoli 20, 06125 Perugia, Italy
2
Department of Engineering, Roma TRE University, Via Vito Volterra 62, 00146 Rome, Italy
3
Department of Engineering, University of Perugia, Via G. Duranti 93, 06125 Perugia, Italy
*
Author to whom correspondence should be addressed.
Sustainability 2017, 9(5), 833; https://doi.org/10.3390/su9050833
Submission received: 15 February 2017
/
Revised: 23 April 2017
/
Accepted: 9 May 2017
/
Published: 16 May 2017
Abstract
:The paper presents recent and future trends of the world energy market, as highlighted by medium- and long-term projections. Energy demand and energy consumptions projected by IEA (International Energy Agency) are examined, in comparison with projections provided by other international agencies and companies in the energy sector. In particular, energy resources, energy consumption and economic growth both in developing and developed countries are presented, with a particular attention to the role of energy efficiency, nuclear power, unconventional fossil resources and renewable energies. Sustainable development issues, according to the global climate agreement signed at COP21, are also presented. The outlook period extends up to 2040. The results confirm a worldwide interest in renewable and unconventional resources for the forthcoming decades, as well as efforts to increase the energy efficiency potential in all end-use sectors to reduce the overall environmental impact of energy production.
1. Introduction
Energy is a key factor both for the rapid growth of emerging economies and for the maintenance of high rates of consumption in developed countries. Demographic trend, sustainable development, economic growth and changes in energy prices have important implications on the world energy scenario. For instance, energy prices, with particular reference to oil prices, have a central role because they impact heavily on environmental and energy policies, and consumption patterns.
Each year, the OECD’s International Energy Agency (IEA) sets out the present energy situation, defining future scenarios with particular reference to energy development, renewables and carbon reductions in the World Energy Outlook (WEO) reports. As in previous Outlooks, three scenarios are defined in the WEO-2015: The New Policies Scenario, the Current Policies Scenario and the 450 Scenario. The New Policies Scenario takes into account the policies and measures adopted as of mid-2015 and the relevant intentions that have been announced by governments. It is the central scenario of the WEO-2015. The Current Policies Scenario incorporates policies formally adopted as of mid-2015 and it does not assume that the current policies will change. The 450 Scenario assumes a set of policies to be implemented to limit the rise in the long-term average global temperature to two degrees Celsius. For instance, the WEO-2014 had a special focus on nuclear power [1]; the WEO-2015 had a focus on India’s energy outlook [2]; and the WEO-2016 had a focus on renewable energy, addressing many of the key questions [3].
From an economic point of view, the link between energy and income demand, economic growth, sustainable development and energy prices is of great interest. Since the pioneering work of Kraft and Kraft [4], there has been a large body of published literature investigating the relationship between income and the energy consumption. The results about the relationship between income and energy consumption can be summarized into two main strands [4,5,6]. One strand suggests that energy is a limiting factor to economic growth, because energy is essential for factors of production, such as labor and capital [5,6,7,8]. The other strand argues that energy is neutral to growth, because the cost of energy is a small part of the Gross Domestic Product (GDP), thus cannot have a significant impact on economic growth [9].
Wong et al. investigated the causal relationship among energy consumption [10], real GDP, fossil fuel consumption and economic growth for 20 OECD countries from 1980 to 2010. They found that that not only energy consumption is important for economic growth, but also renewable energy sources (RES) consumption and energy research and development (R&D) have a crucial role in promoting economic growth.
Finally, several forecast models are based on the GDP and the ratio between energy use and GDP (energy intensity) to make projections on the future energy mix [11,12]. For instance, Pao and Tsai implemented a Grey prediction model [13], which is a tool for those systems whose structure is complex, uncertain and chaotic, to forecast emissions, energy consumption and real GDP in Brazil.
Furthermore, in its annual report, the IEA makes forecasts for the next decades on the basis of the main trends of the energy consumption, such as some international oil companies that analyze the development of energy demand and supply in the long-term (British Petroleum (BP), the Exxon Mobil Corporation or Shell Corporation).
In recent years, it has become increasingly clear that new key factors are affecting the current and the future energy market. For example, renewable energy sources (RES) and unconventional resources have acquired an increasing and interesting role in the future energy mix. Ballester and Furió observed [14], for the Spanish case, how the inclusion of RES into the electricity generation system has actually impacted the level and volatility of day-ahead market prices. The advance of RES technologies has environmental and social benefits, but it also involves positive and negative economic impacts [14]. Burgos-Payán et al. dealt with the production of electricity from RES in Spain [15]. They reviewed the current support system, the costs of integrating RES into the electric system as well as the effects of RES on electricity price, the GDP, the environment, human health and employment. The authors found that the development of RES technologies has very favorable economic, social, and environmental impacts and improves the control of dependence on foreign energy. In addition, unconventional resources represent an interesting, though controversial, solution to access new and significant energy sources, as was observed by Moncada Lo Giudice et al. [16]. All the efforts towards the energy efficiency improvements, the sustainable development, the low carbon production and the integration of clean energy sources, such as RES, are impactful on the energy market aiming at decreasing the environmental impact of energy production.
The aim of this paper is to analyze medium- and long-term energy scenarios of energy market, as projected by the main international reports, with a particular focus on the most interesting sectors: energy efficiency, nuclear power, renewable energies, unconventional fossil and low carbon sources. The analysis includes correlations of the energy demand and consumption with economic growth, sustainable development, demographic aspects and energy prices. Investments in the various sectors are discussed and a country analysis is provided.
The structure of the paper is the following. Section 2 introduces the outlooks for the energy scenarios based on the projections made by the major official sources. Section 3, Section 4 and Section 5 discuss, respectively, the new role of energy efficiency, nuclear power and unconventional resources. Section 6 analyzes the future developments of RES, including their costs and investments; Section 7 presents data on future energy markets; and Section 8 concludes.
2. Primary Energy Demand and Consumption
The GDP growth and the energy consumption are strictly connected. However, since the current economic scenarios are uneven, it is hard to make projections on the global economic activity in the medium and long terms.
For example, the short- and medium-term projections of GDP growth rate were presented in Table 1, made by the International Monetary Fund (IMF) in 2016 [17].
The economic activity level and demographic changes will represent critical issues for the future energy trends. It is assumed that World GDP will increase of 3.4% per year on average, over 2014–2040, up to more than 2.5 times its current value (IEA, 2016) [3]. Indeed, the projected worldwide GDP in 2015 was +3.3%, slightly downward with respect to 2014, and the growth is projected to continue in 2016 (+3.8%). It is expected that the world’s population will grow from 7.1 billion in 2013 to 9 billion in 2040 with a major increase in Africa, India, Southeast Asia and the Middle East. By 2020, India will be the most populous country in the world overtaking China [2].
In the Euro area, there was an economic recovery, thanks to an increase of the domestic demand, but not strong enough to raise the weak consumption (Figure 1).
Examining the data series, the setback of energy consumption follows the economic crisis began in 2008. As shown in Figure 2, after the slowdown in 2008, both the British Petroleum [19] and the International Energy Agency [20] show that the consumptions grew until to reach about 13 million tonnes oil equivalent (Mtoe) with the same trend for the two sources [19,20].
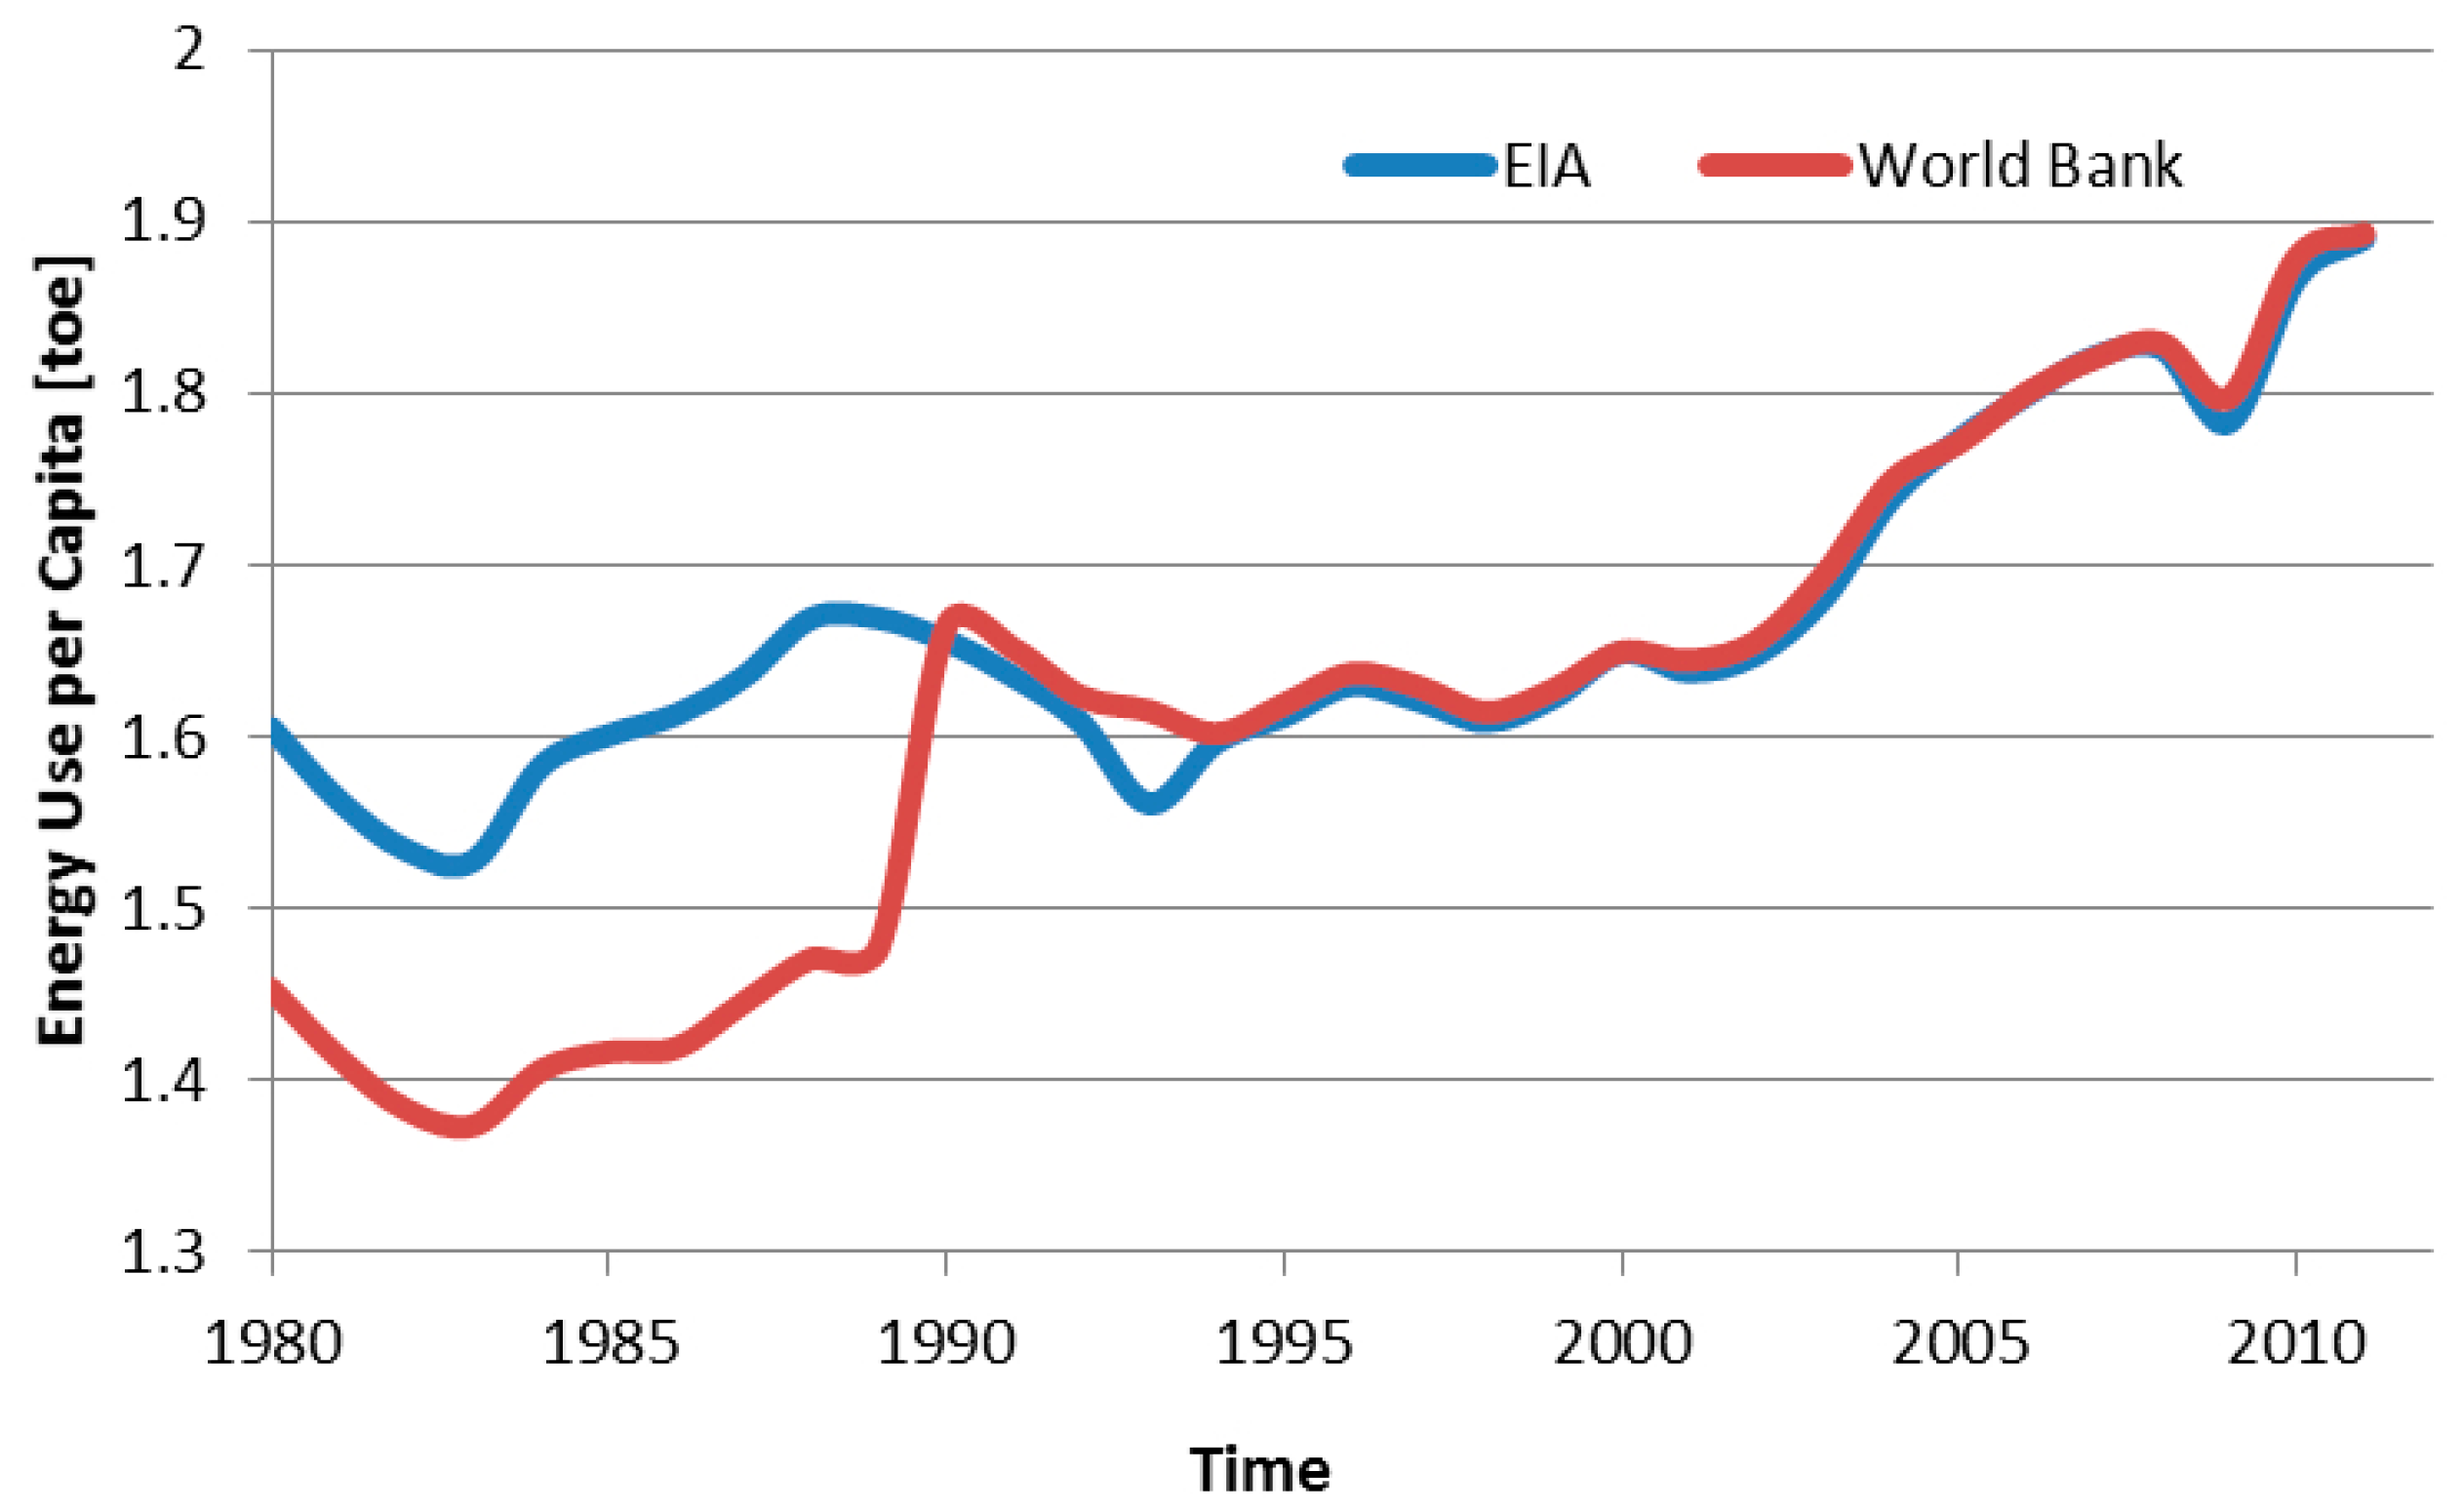
In 2012, fossil fuels and in particular oil, played a key role in the primary energy demand [20,21]. More in detail, the energy use per capita reached a peak in 2012, the second maximum value after 2008, when it was 9% higher than the peak in 1990. At the beginning of the financial crisis, the value decreased from 1.83 to 1.80 tonnes of oil equivalent (toe) per capita. Then, it increased again to 1.92 toe in 2012 [22]. Figure 3 shows data regarding the energy use per capita during the last thirty years from the International Energy Agency [20] and the World Bank [22]. Both these sources show uniform values regarding the Energy use per capita after 1990.
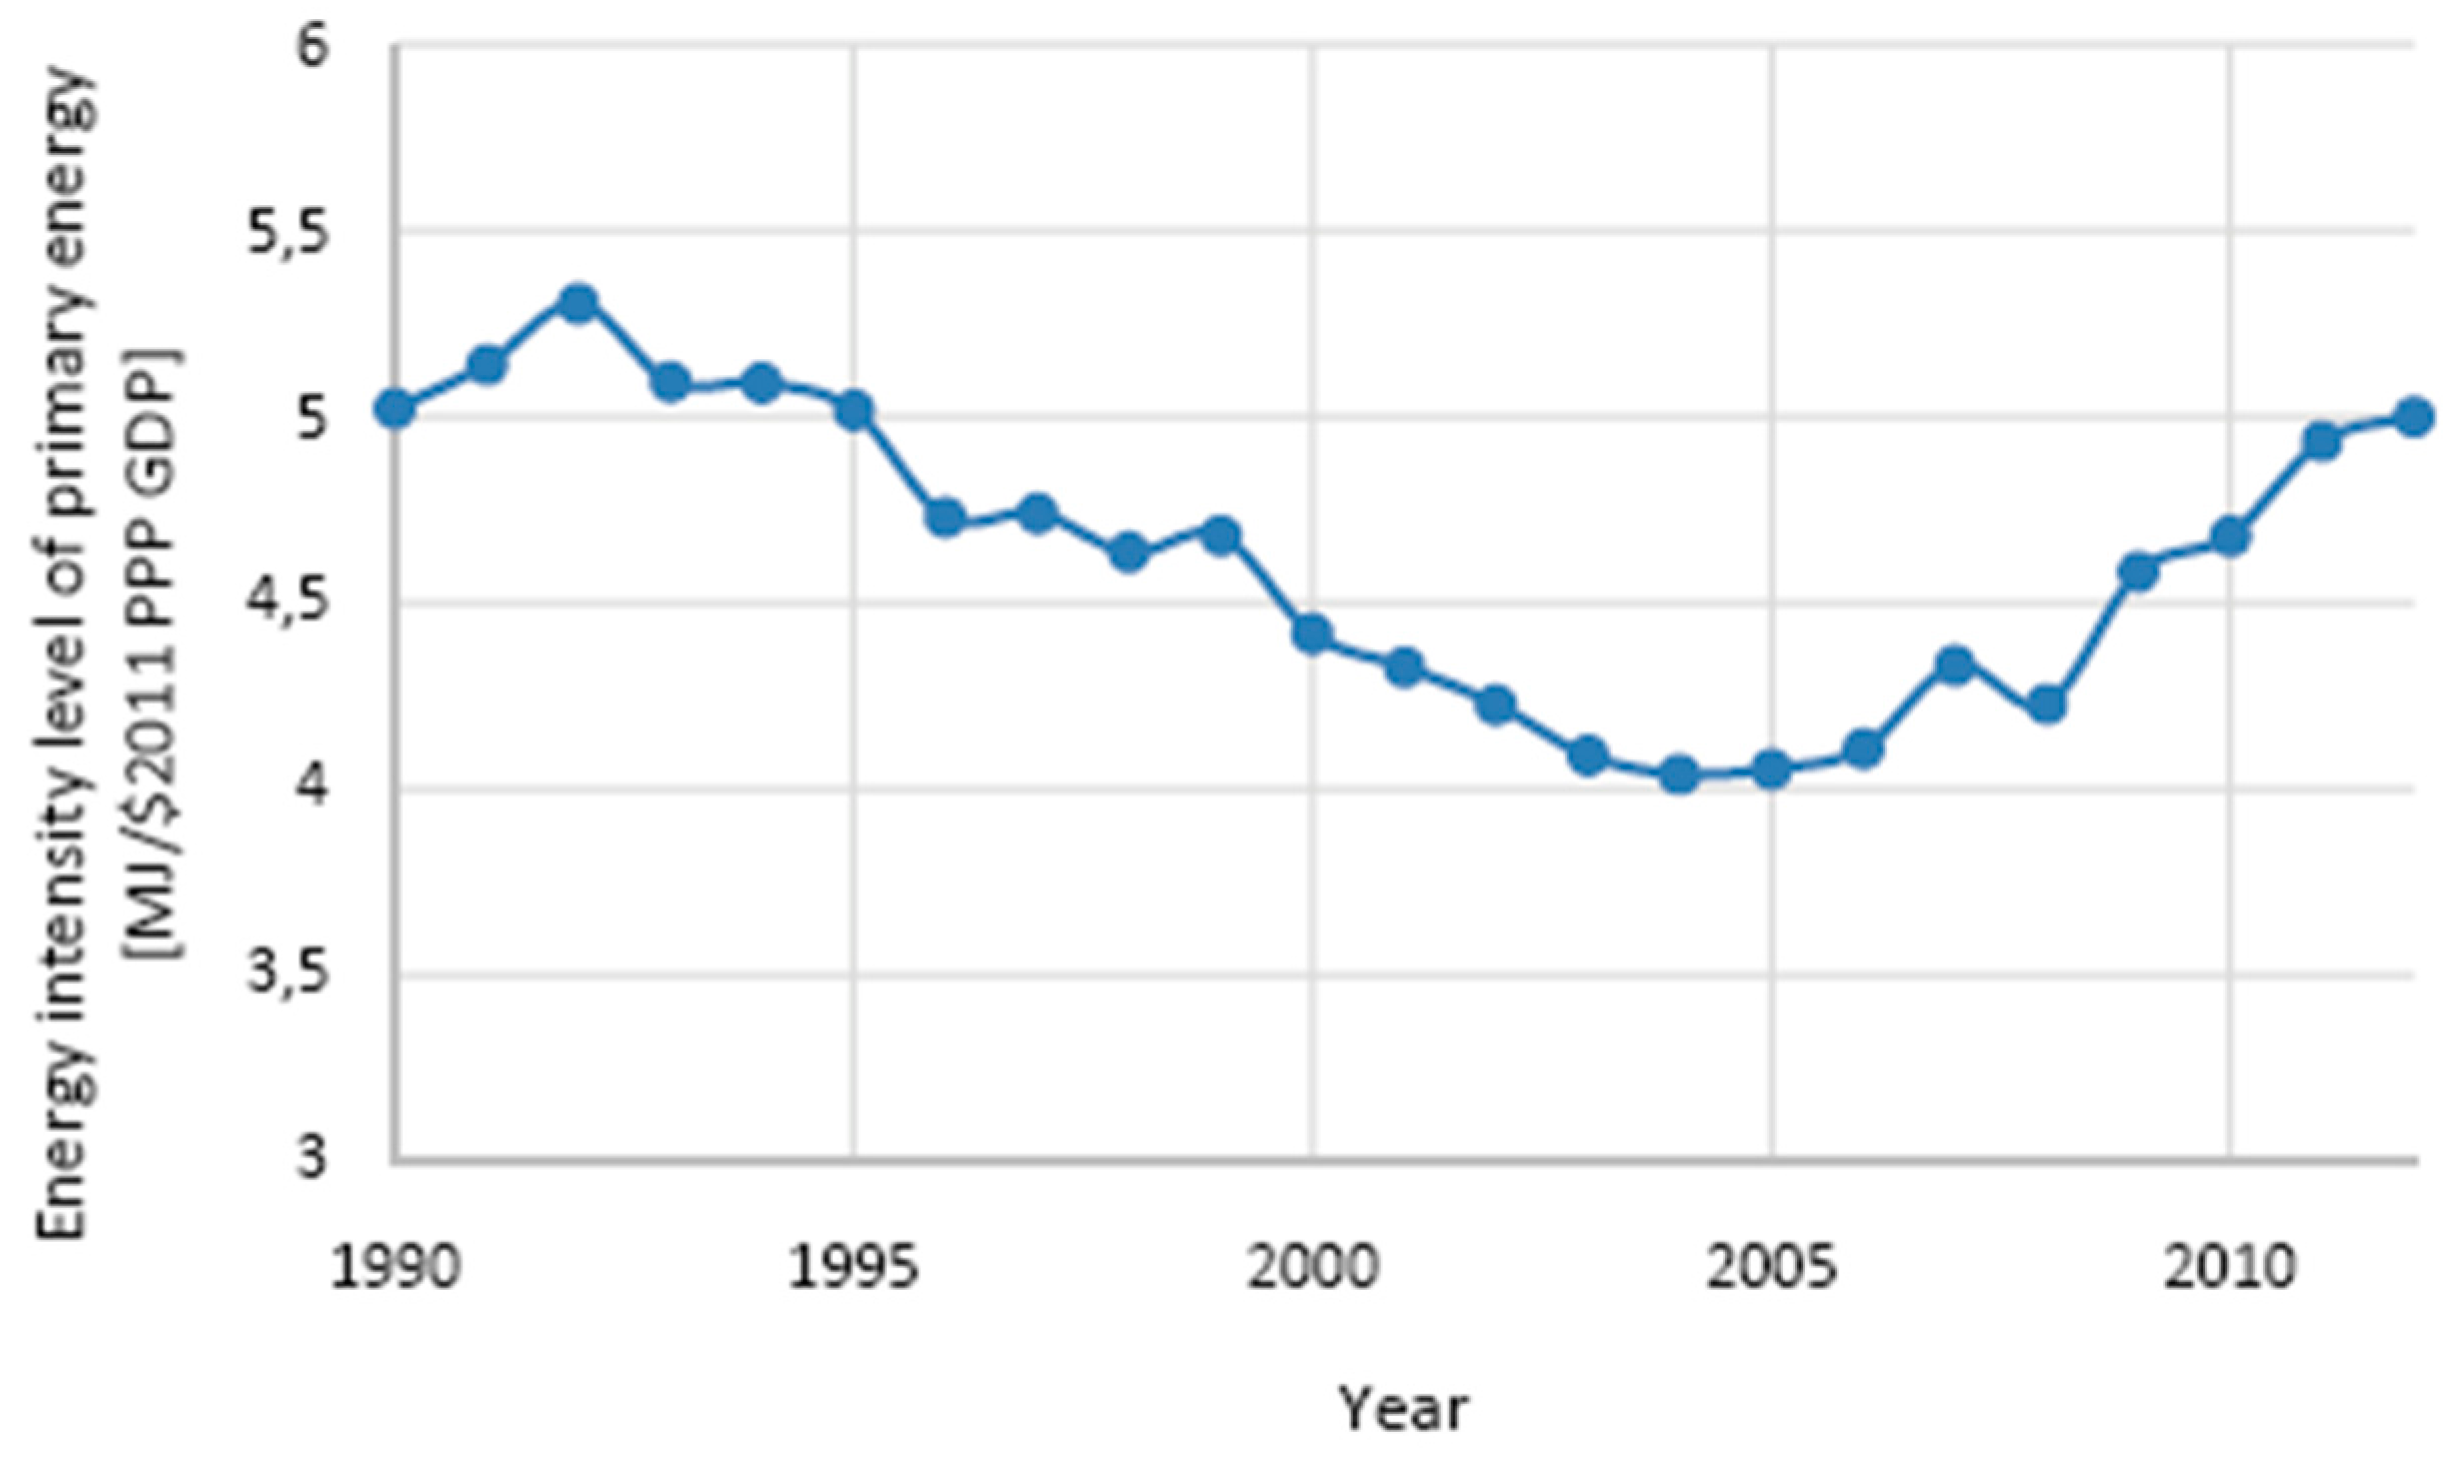
Energy intensity was used as an indicator to evaluate the energy efficiency in past years, although differences exist between energy intensity and the measure of energy efficiency [23,24]. In fact, the energy use per dollar of GDP depends on several factors, among them there is the conversion of energy. A reduction in energy intensity might represent an improvement in energy efficiency, e.g., thanks to new technologies, but also an increase in energy prices. The non-OECD economies have still high energy intensities. Khatib affirmed that the decrease of energy intensity in the Organization for Economic Co-operation and Development (OECD) members has been caused by the heavy industry movement from the OECD to non-OECD countries [25].
Figure 4 shows the energy intensity during the period from 1990 to 2012. The global energy intensity is projected to decline by 2035, about 36% lower than in 2013 [26]. Meanwhile, the worldwide energy demand is projected to rise thanks to the GDP increase and the world population growth over the coming decades. The energy consumption is projected to grow 1.4% per year from 2013 to 2035 [27].
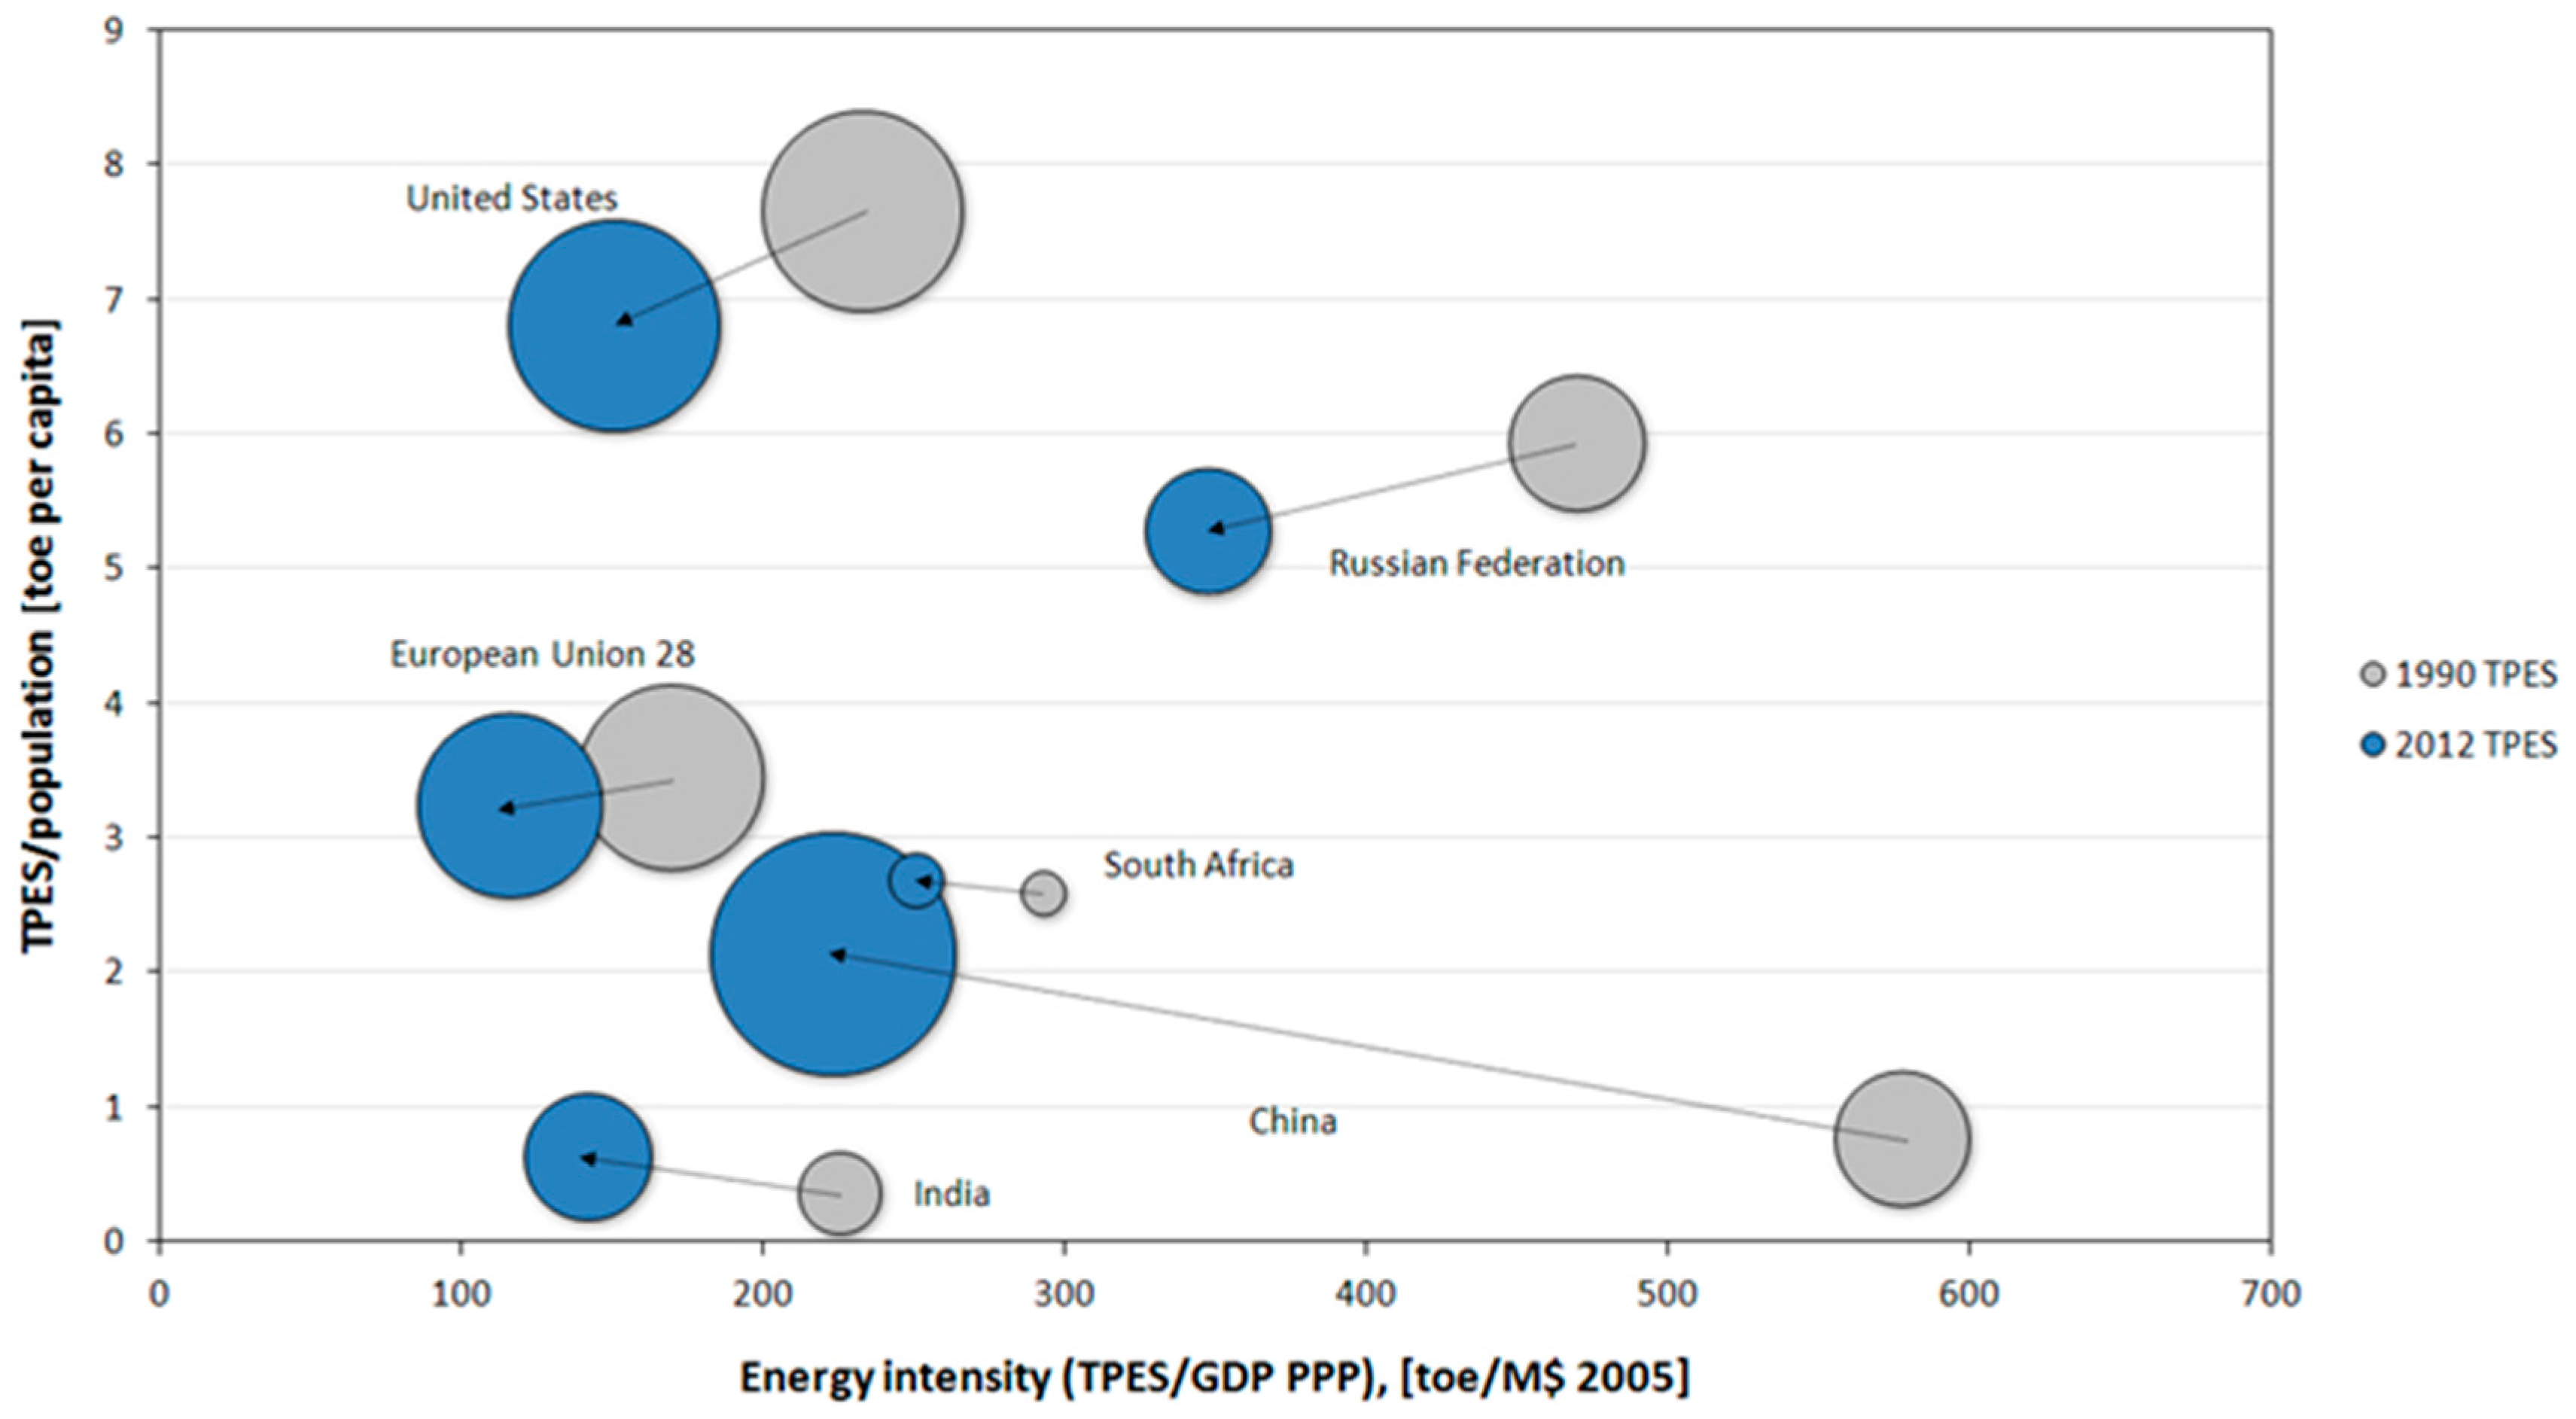
The total amount of energy, needed by a country in order to create a unit of GDP, is expressed by means of the energy intensity. On the other hand, the energy consumption per capita is the TPES divided by the country’s population.
The years between 1990 and 2012 were characterized by an energy intensity decrease for China, Russia and India; this appears clear making a comparison with United States and European Union (Figure 5). United States, European Union and Japan, countries characterized by a higher GDP per capita, show an energy consumption decrease. On the other hand, developing countries characterized by an increase of GDP, such as China and India, showed an energy consumption increase [20].
According to the IEA New Policies Scenario [3], primary energy demand is projected to increase by 43% between 2014 and 2040. However, the trend is heterogeneous among countries (Table 2). In most OECD countries, primary energy demand is set to fall over the coming years, while China and India, as well as South and Southeast Asia, will have a prominent role in increasing energy demand. Taking into account Chinese situation, China should be the largest source of global demand increase by the mid-2020s, and then energy demand will grow slowly, because some energy-intensive sectors are expected to decline.
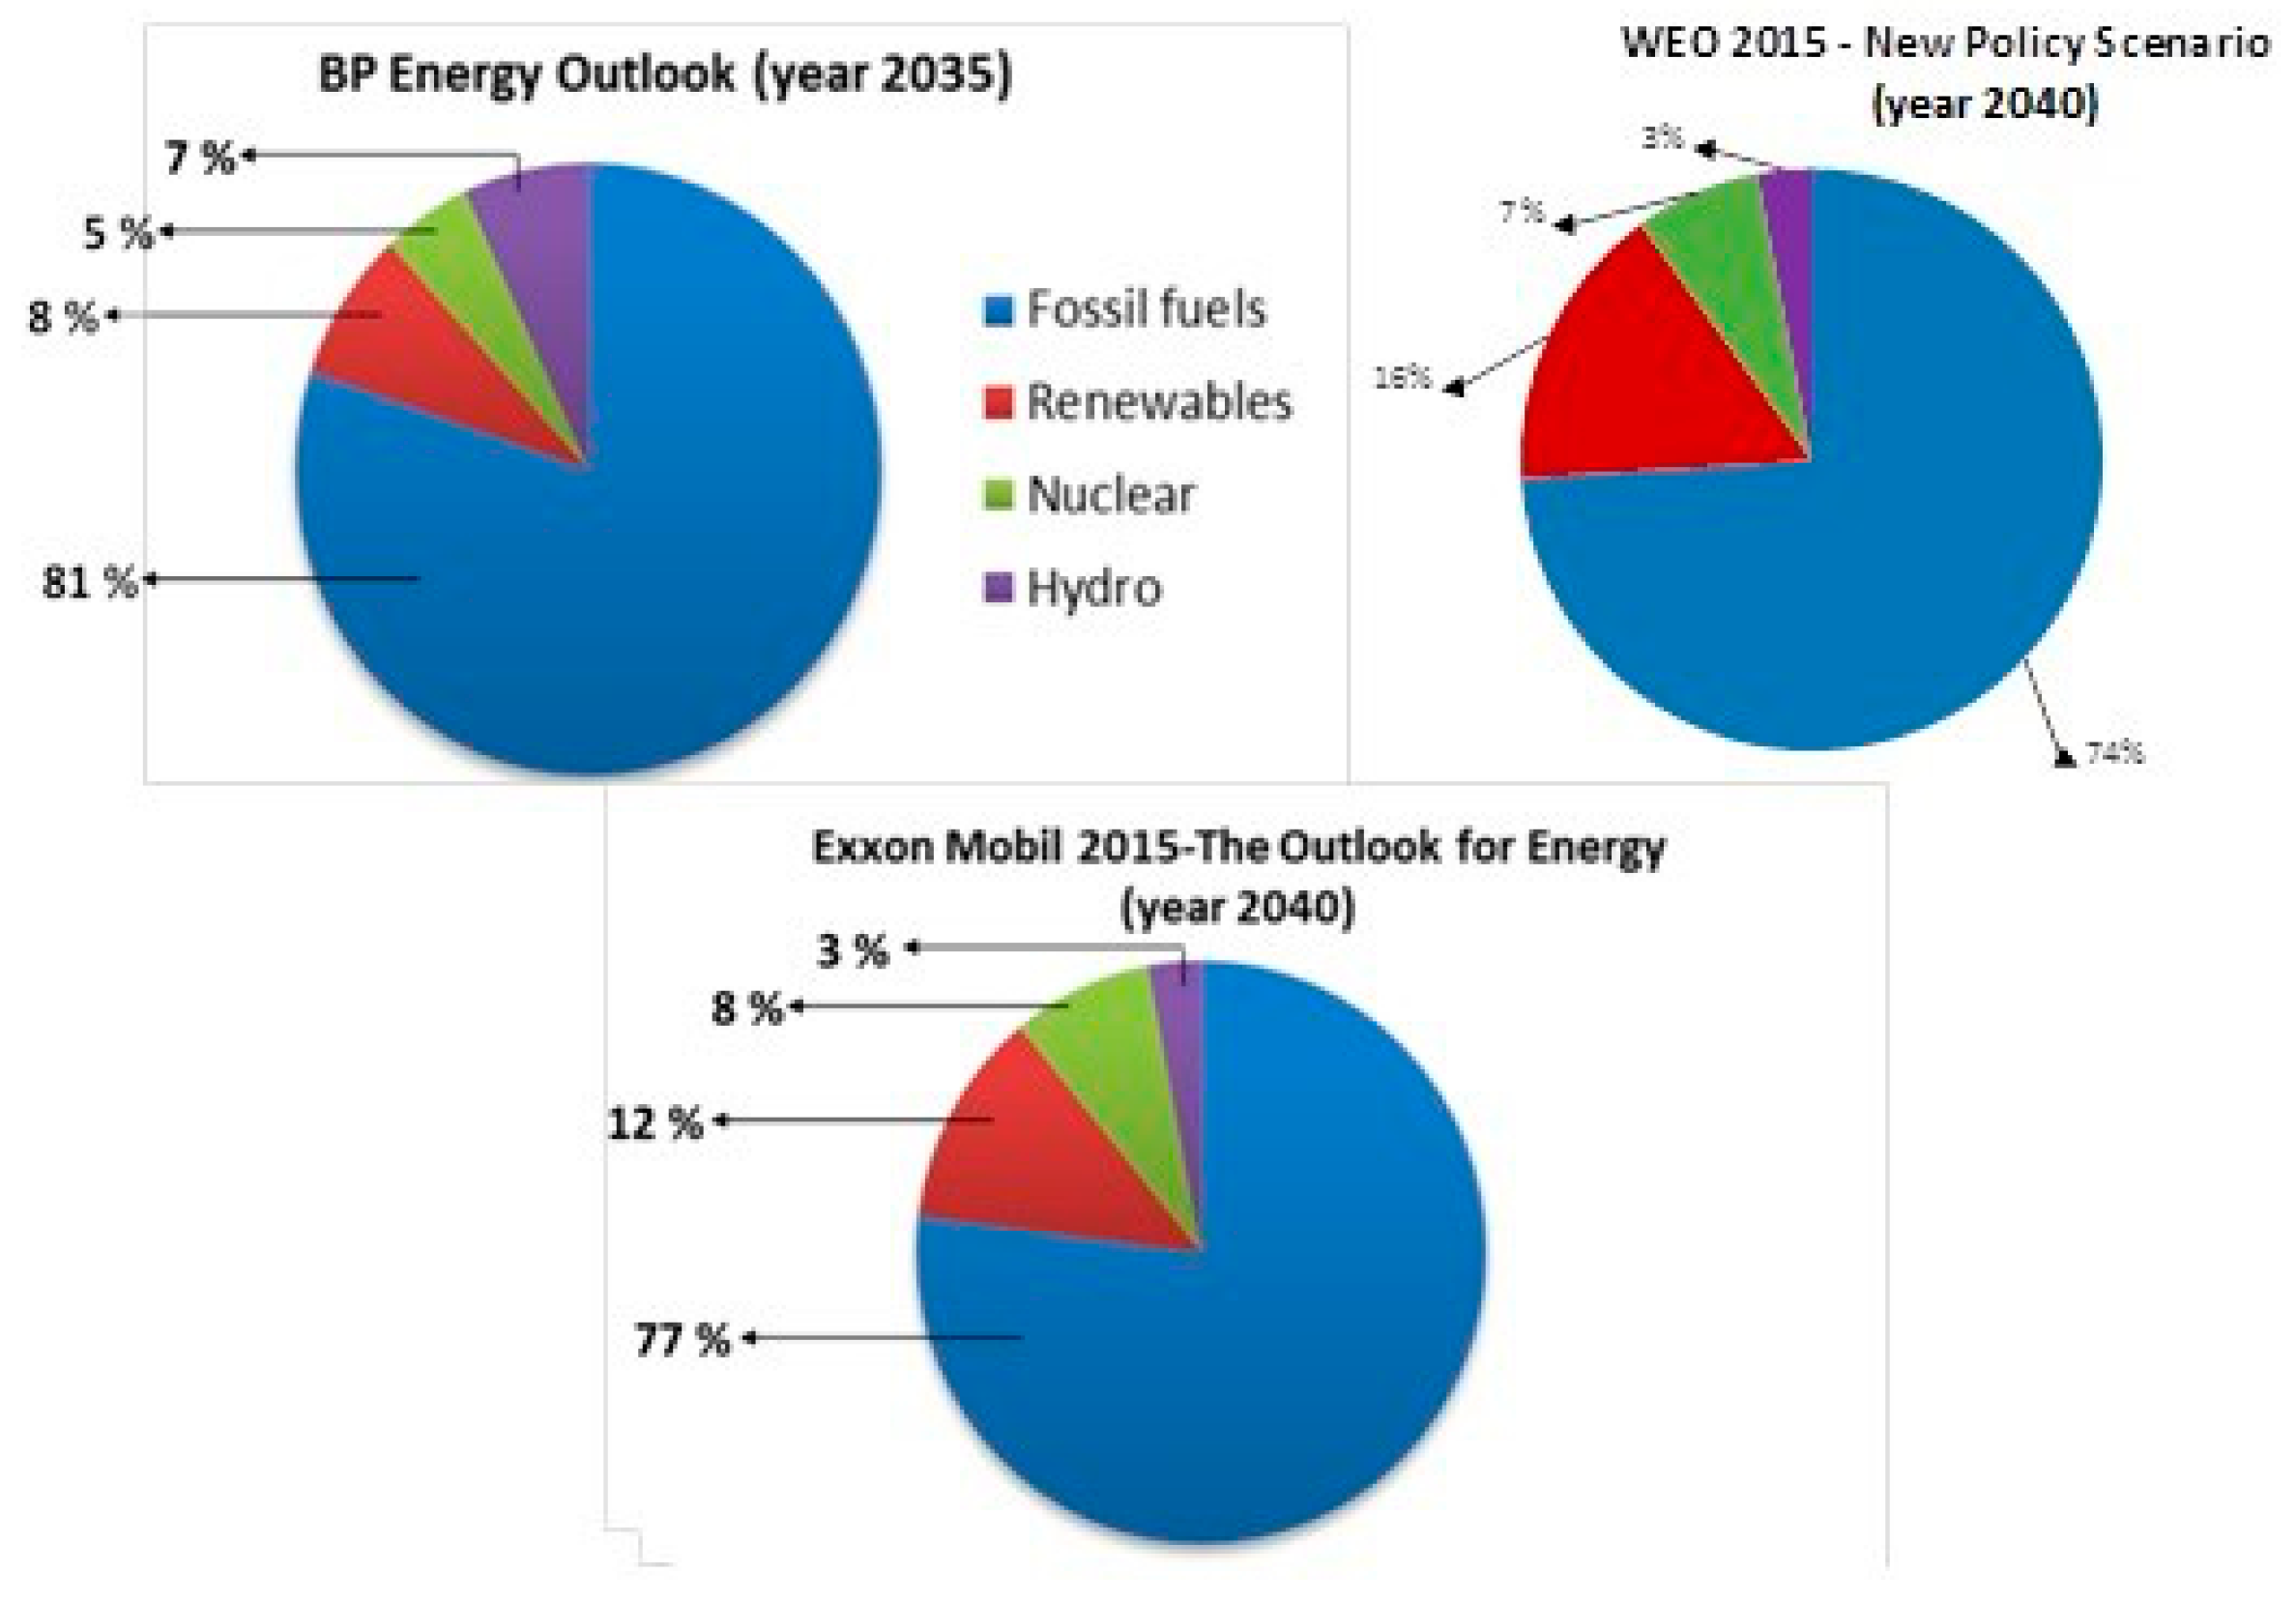
Over the last thirty years, the share of fossil fuels in the global energy mix has not significantly decreased (81% in 2013), despite the efforts employed in decarbonizing the energy system. According to the projections of the New Policy Scenario [3], coal and oil should remain the most used fuels worldwide mainly because of the demand growth in India and Southeast Asia. However, with particular reference to coal, its growth is expected to be offset by the decline in coal use in North America and in the European Union, thus resulting in a coal demand annual growth at 0.2% by 2040 at the world level. Oil demand should increase, on average, by 0.5% for the period 2014–2040. Natural gas consumption should grow almost everywhere, with 1.5% annual rate of growth to 2040. China and the Middle East will be the largest natural gas consumers. The largest expansion in the primary energy mix is supposed to come from RES that are supposed to represent a share of 13% in the energy mix by 2040, compared to the current 8%.
As shown in Figure 6, comparing several reference type scenarios, it is notable that the total share of oil, coal and natural gas to the primary energy demand will remain constantly higher than 70% in each scenario.
Analyzing primary energy demand for all fuels in the New Policies Scenario, in 2040 (Figure 7), it is composed of: RES 16%, natural gas 24%, nuclear 7%, oil 27% and coal 23%. After 2025, a rapid increase of non-hydro RES will occur, while oil will strongly slow and coal will remain low over the forecast period.
The so-called “golden age of gas” declared by the IEA analysts will continue, because natural gas is an attractive resource, cheaper than oil and largely available. There were reserves of about 28,500 trillion cubic feet (tcf), corresponding to 807 thousand billion cubic meters (bcm), at the end of 2014 [3,29]. Nevertheless, the share of fossil fuels will gradually drop over the next twenty years; in 2014 it amounted to 81% of the total demand. This variation is due to the measures and the policies that address to cleaner fuels and the development of new technologies.
On the other hand, shares of RES, such solar and wind, and the nuclear are expected to grow.
More in detail, an increase of almost 60% of global nuclear power capacity is expected, from 392 GW in 2013 to about 620 GW in 2040, but its share of global electricity generation should have a weak rise (just 1%) [3].
RES, excluding biomass and biofuels, are projected to grow of 7% per year. Accordingly, the contribution of all RES is expected to account for about 16% of the energy mix in 2040 [3,28]. Based on the same assumptions, the BP projected a similar trend but a moderate share is expected [26].
The share of liquid fuels, including oil and biofuels, will continue to grow. By 2035, the demand will reach 111 million barrels per day (mb/d), the contribution of transports will account for 55% [30]. Furthermore, the demand will be driven by the non-OECD countries. Asian, Indian and Middle-East countries will remain the major consumer of fossil fuels, addressed to the industry and transports. In Latin America, Brazil will remain the leader of biofuels production.
It is worth noting that the global oil and gas supply will be supported by the unconventional resources, such as tight oil or shale gas.
Shale gas will account for 12% and the aggregated tight oil, oil sands and biofuels will account for 6% of the energy production in 2035 [26].
The non-OECD countries will remain dominant forces in the future energy scenarios. China and India are expected to be among the largest economies in the world in 2035 [30]. In the same period, Russia will become the major exporter in the energy market. The fast increase of the GDP and the population growth will be the drivers of the non-OECD demand.
The non-OECD contribution will account for 96% of the growth rate, although the economic growth is projected to slow in this country group [26]. A reduction in the energy intensity is expected in the non-OECD, because of the dependence of the domestic economy to the heavy industry gradually decline.
The energy demand in the Asian countries will grow by 1.8% per year between 2014 and 2040. The demands in China and India will rise, respectively, by 1.3% and 2.9% per year (p.y.) [3]. As previously said, a slowdown is expected in the Chinese economy after 2025, with a gradual reduction of the growth rate.
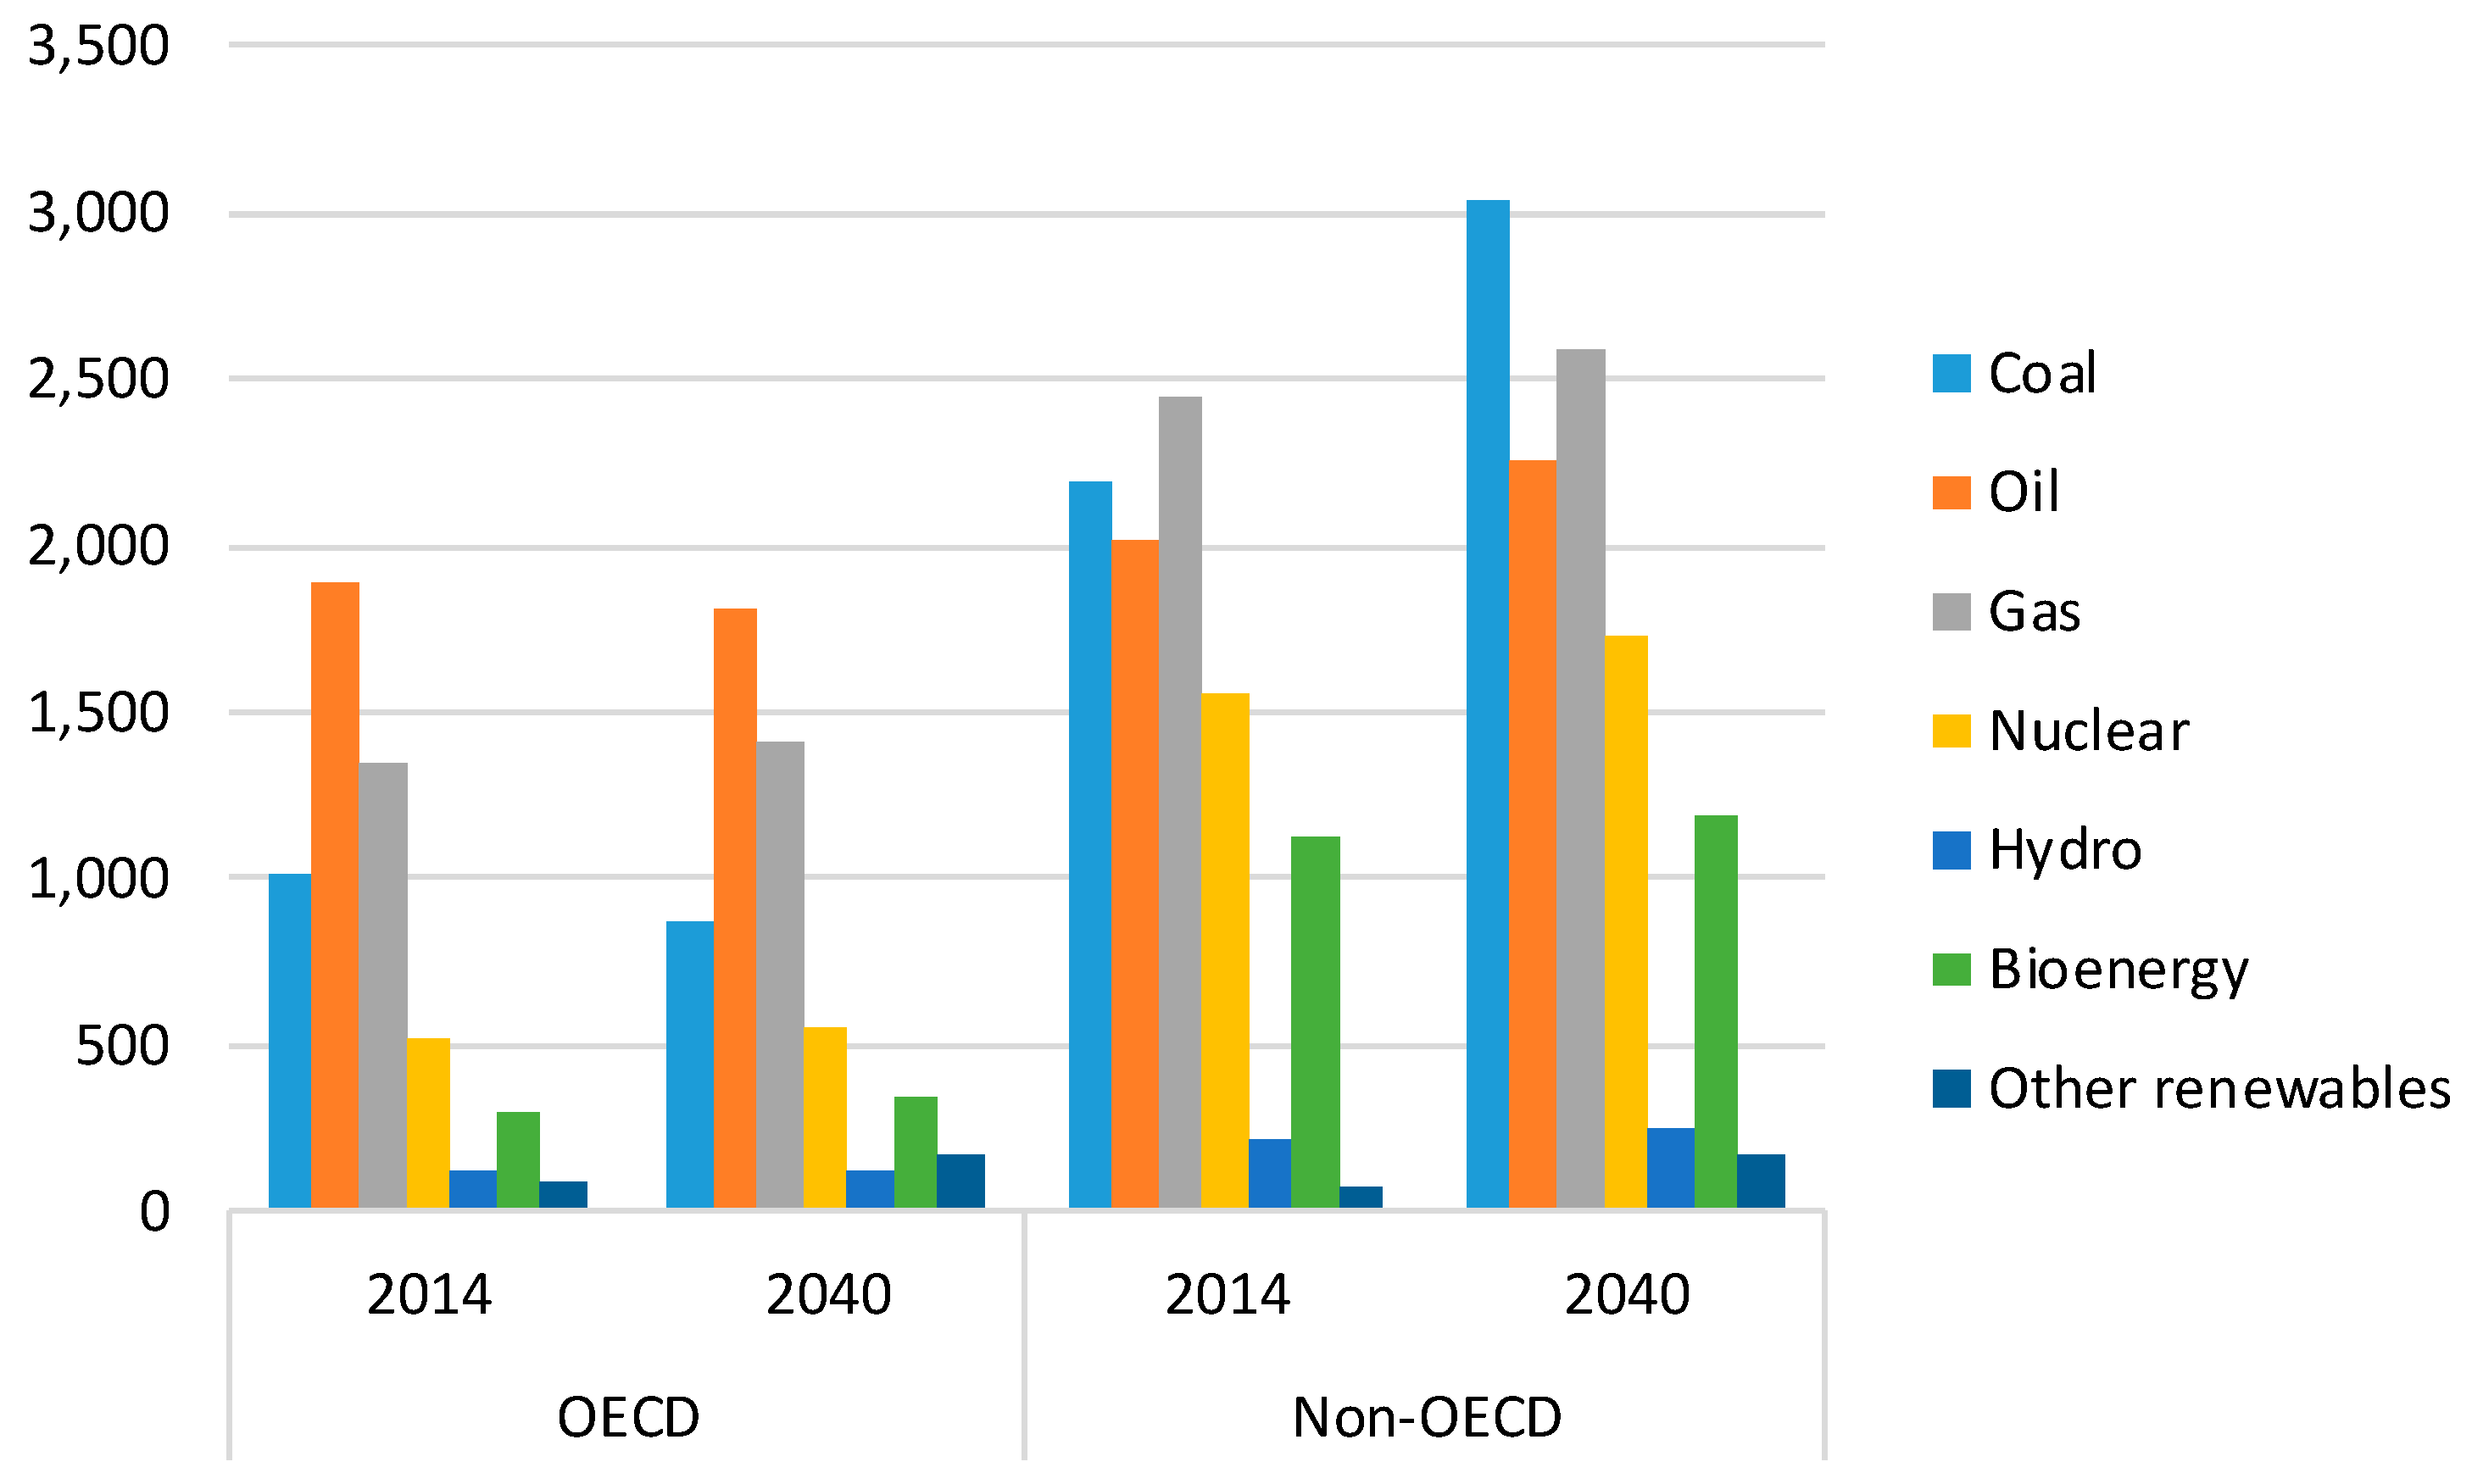
Figure 8 shows the energy demand split by OECD and non-OECD countries. The natural gas demand will overtake the other fuels in 2040 in the OECD. Meanwhile, the coal share will drive non-OECD demand, supported by the increasing of the electricity generation. The oil demand will grow in the countries with low efficiency in transport sector. The non-OECD will remain high carbon-intensive economies.
The debate about the higher fossil-fuels subsidies still continues, as they are unbalanced with respect to RES investments. The WEO-2015 projected an increasing global electricity generation by RES that are responsible of about half of the growth rate [2]. Despite the slowdown after the Fukushima accident in 2011, the share of electricity by nuclear will account for 12% by 2035. The IEA also projected that the high energy prices will offset by the energy efficiency improvements. Similar considerations were made in the WEO-2016 edition [3]. It also questioned the future of fossil fuels and nuclear power. The oil and coal demands grow exclusively in non-OECD. The global natural gas production continues to grow, the contribution of unconventional gas accounts for 60%. Nuclear power is seen by IEA analysts an alternative way to decrease carbon dioxide emissions.
The most recent World Energy Outlook edition [3] shows signs of change in global energy since the last WEO-2015 [2]. Oil and other fuels prices dramatically fell and other countries, such as India and Indonesia, took advantage of this decrease to move ahead with the interruption of fossil-fuel subsidies. In 2014, RES represented about half of the total new power generation all over the world. The global energy use is expected to increase by one-third to 2040, driven by India, China, Africa, the Middle East and Southeast Asia. The reduction of the collective consumption in OECD countries from the peak reached in 2007 is led by the European Union (−15%), Japan (−12%) and the United States (−3%). It is clear that the prospects are sensitive to the effects of global recession and geopolitical events. However, all the examined studies agree in identifying new drivers of the future energy scenarios. The development of the low-carbon technologies defines the new role of nuclear power and the RES. It is also clear that shares of unconventional gas and oil rapidly increase in the future energy mix. Finally, energy efficiency plays a key role in the energy and emissions saving.
3. Energy Efficiency
There is an interesting change in the projection of the energy demand in the next twenty years. The WEO shows an annual increase in energy demand by 1.1% to 2040, which is significantly lower than the projected annual economic growth over the same period. This is mainly associated with the improvement in energy efficiency. Energy saving is expected to be 38% in the industrial sector, 31% in building sector, 27% in transport, and 2% in agriculture [2].
The fuel and technology switch, and moving towards a service-oriented economy, permit obtaining the difference in the energy consumptions with respect to the past decades. Energy gains are favored by mandatory energy efficiency regulations, which have been put in place in OECD and non-OECD countries. In 2015, global final energy consumption has been covered for 30% by efficiency-regulated energy use, and the average stringency of regulation has increased by 23% since 2005 [3]. As seen in Figure 9, efficiency-regulated energy uses in 2015 covered around 30% of global final energy consumption and it has an increasing trend. The major efforts were addressed towards the industry sector in China, while United States and Japan were more interested in building sector.
Generally, investments in energy efficiency are related to new technologies to exploit energy in all end-use sectors and all expenditures finalized to improve energy performances.
The costs in energy supply amounted about 1600 billion dollars per year over 2007–2013, twice that in 2000 [31]. The major part of the costs was addressed to the fossil fuels supply for the extraction, the transport, the distribution and the conversion processes. The major efforts were addressed in the investments in power generation, with an average investment of 479 billion dollars in the period 2000–2013 [31].
In 2015, about 1.8 trillion dollars have been invested in the global energy sector and about 1744 billion dollars per year are required for energy supply investments are required during 2016–2040, as in this shown in Table 3.
By 2035, investments will grow in the transport sectors, as shown in Figure 10, thanks to a more efficient vehicle fleet. Meanwhile, investments in building sector will rise, for both residential and services sectors, reaching 2334 billion dollars by 2035 [30]. The investments in building include the use of less-consuming devices and appliances, as well as interventions of insulation or retrofits.
Regarding industrial activity, the contributions in electricity and primary demand respectively accounts for 50% and 30% today [31]. The use of natural gas and electricity will increase in the manufacturing replacing oil and coal, a total share of 60% is projected by 2040 [32]. In addition, the Chinese industry, which is the major consumer of coal today, will show a significant increase in natural gas and electricity share in 2040.
It is notable that the growth in investments in energy efficiency in industry is slower, about 9% of the cumulative investments in the outlook period [32]. IEA justified this marginal rate considering the long life span of the plants respect to equipment. Hence, the gains in energy efficiency are obtained acquiring new machinery or improving the processing techniques.
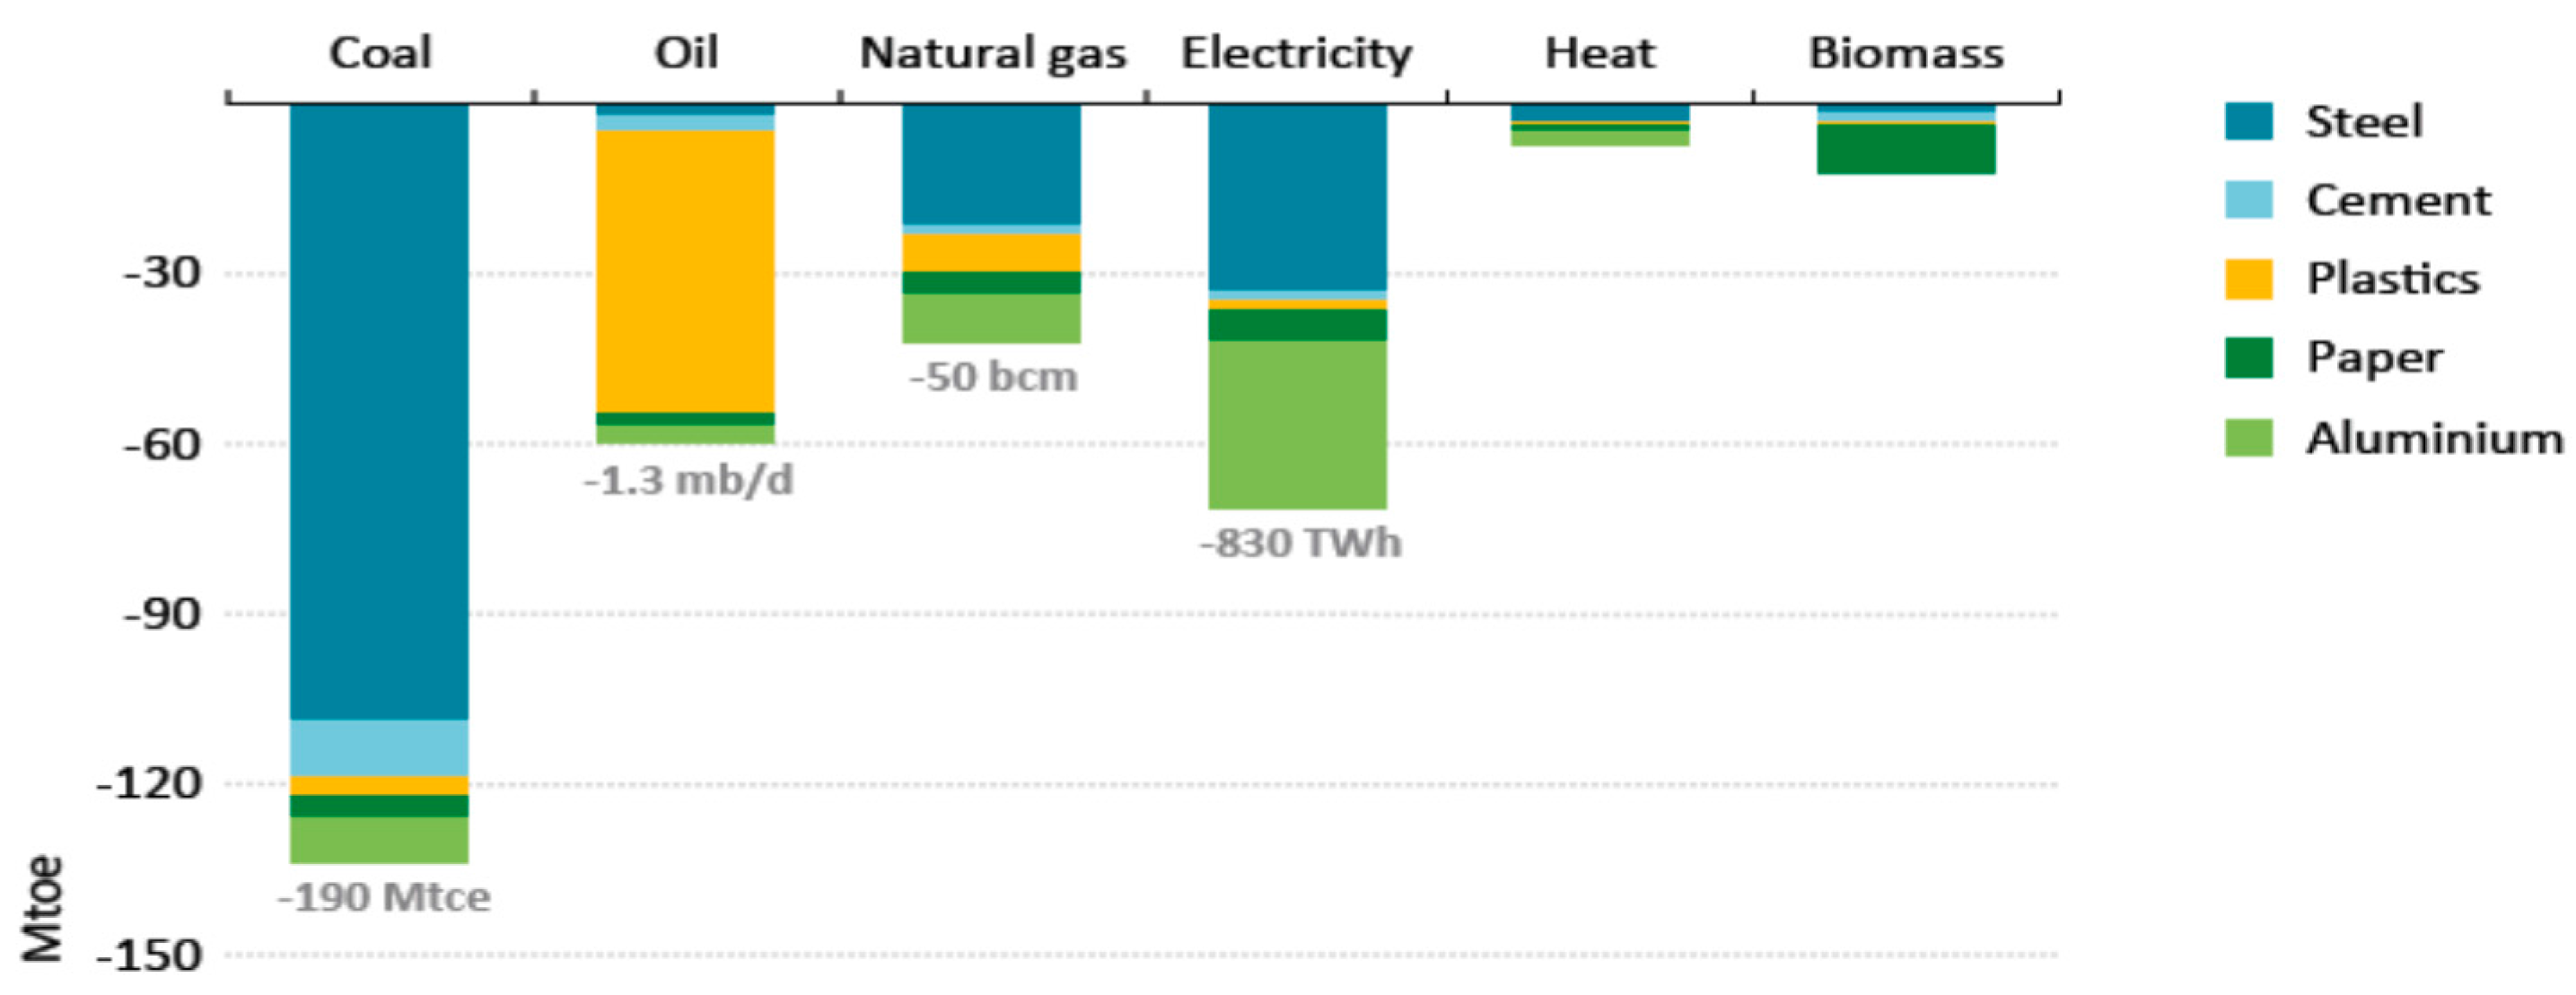
In the WEO-2015 [2], IEA introduces an interesting scenario considering the rate of recycled and recovered materials in the energy-intensive sectors (steel, cement, plastic, paper and aluminum). It is clear that all the efforts made to improve energy and material efficiency lead to energy saving, as shown in Figure 11.
In the last decade, the extension of the energy efficiency regulations had a positive influence on the energy consumption. Now the most efficient appliances, covered by mandatory efficiency regulation, account for 27% of the world consumption, an increase from the estimated share of 14% in 2005 [2].
4. Nuclear Power
In 2014, the nuclear power provides 11% of the worldwide electricity generation. The electricity production by nuclear power reactors in 2015 was 2411 TWh. In 2015, four countries (France, Ukraine, Slovakia and Hungary) exploited nuclear energy to supply more than half of their electricity demand.
In 2016, the International Atomic Energy Agency (IAEA) counted 449 operational reactors corresponding to about 391 GW of net installed capacity, and 60 reactors under construction, 24 of which are in China [33]. Meanwhile, 157 reactors are in permanent shutdown. Figure 12 shows the current status of the nuclear reactors, including reactors in operation and in long-term shutdown.
Lovering et al. [29] analyzed construction costs of nuclear power plants for 349 reactors located in the United States, France, Canada, West Germany, Japan, India and South Korea. Analyzing nuclear’ s experience cost curves, they asserted that there was not an expected cost trend because there was a large variance, depending on reactor technology, regulation and international cooperation. This constitutes a limitation for making projection on future power plant costs.
Regarding external costs of nuclear power plants, Rabl and Rabl [31] evaluated costs of nuclear electricity and its alternatives (i.e., coal, natural gas, wind, solar, hydropower). They observed that the retirement of nuclear plants favors the increase of electricity costs, so the choice depends on the reduction of external costs with respect to the increase of costs.
The WEO-2014 in its special focus on the outlook for nuclear power predicted an increasing nuclear power capacity, reaching 620 GW over the period 2013–2040 [1]. The growth is significant in China (+46%), followed by India, Korea, Russia and USA. On the contrary, the OECD share in nuclear capacity falls from 80% to 52% in 2013–2040.
In WEO-2014, the nuclear share in the energy mix is about 7% in 2040, while nuclear power accounted for 12% of electricity generation. In WEO-2015, the share of nuclear in power generation remains similar with respect to the previous outlook (Table 4) [2].
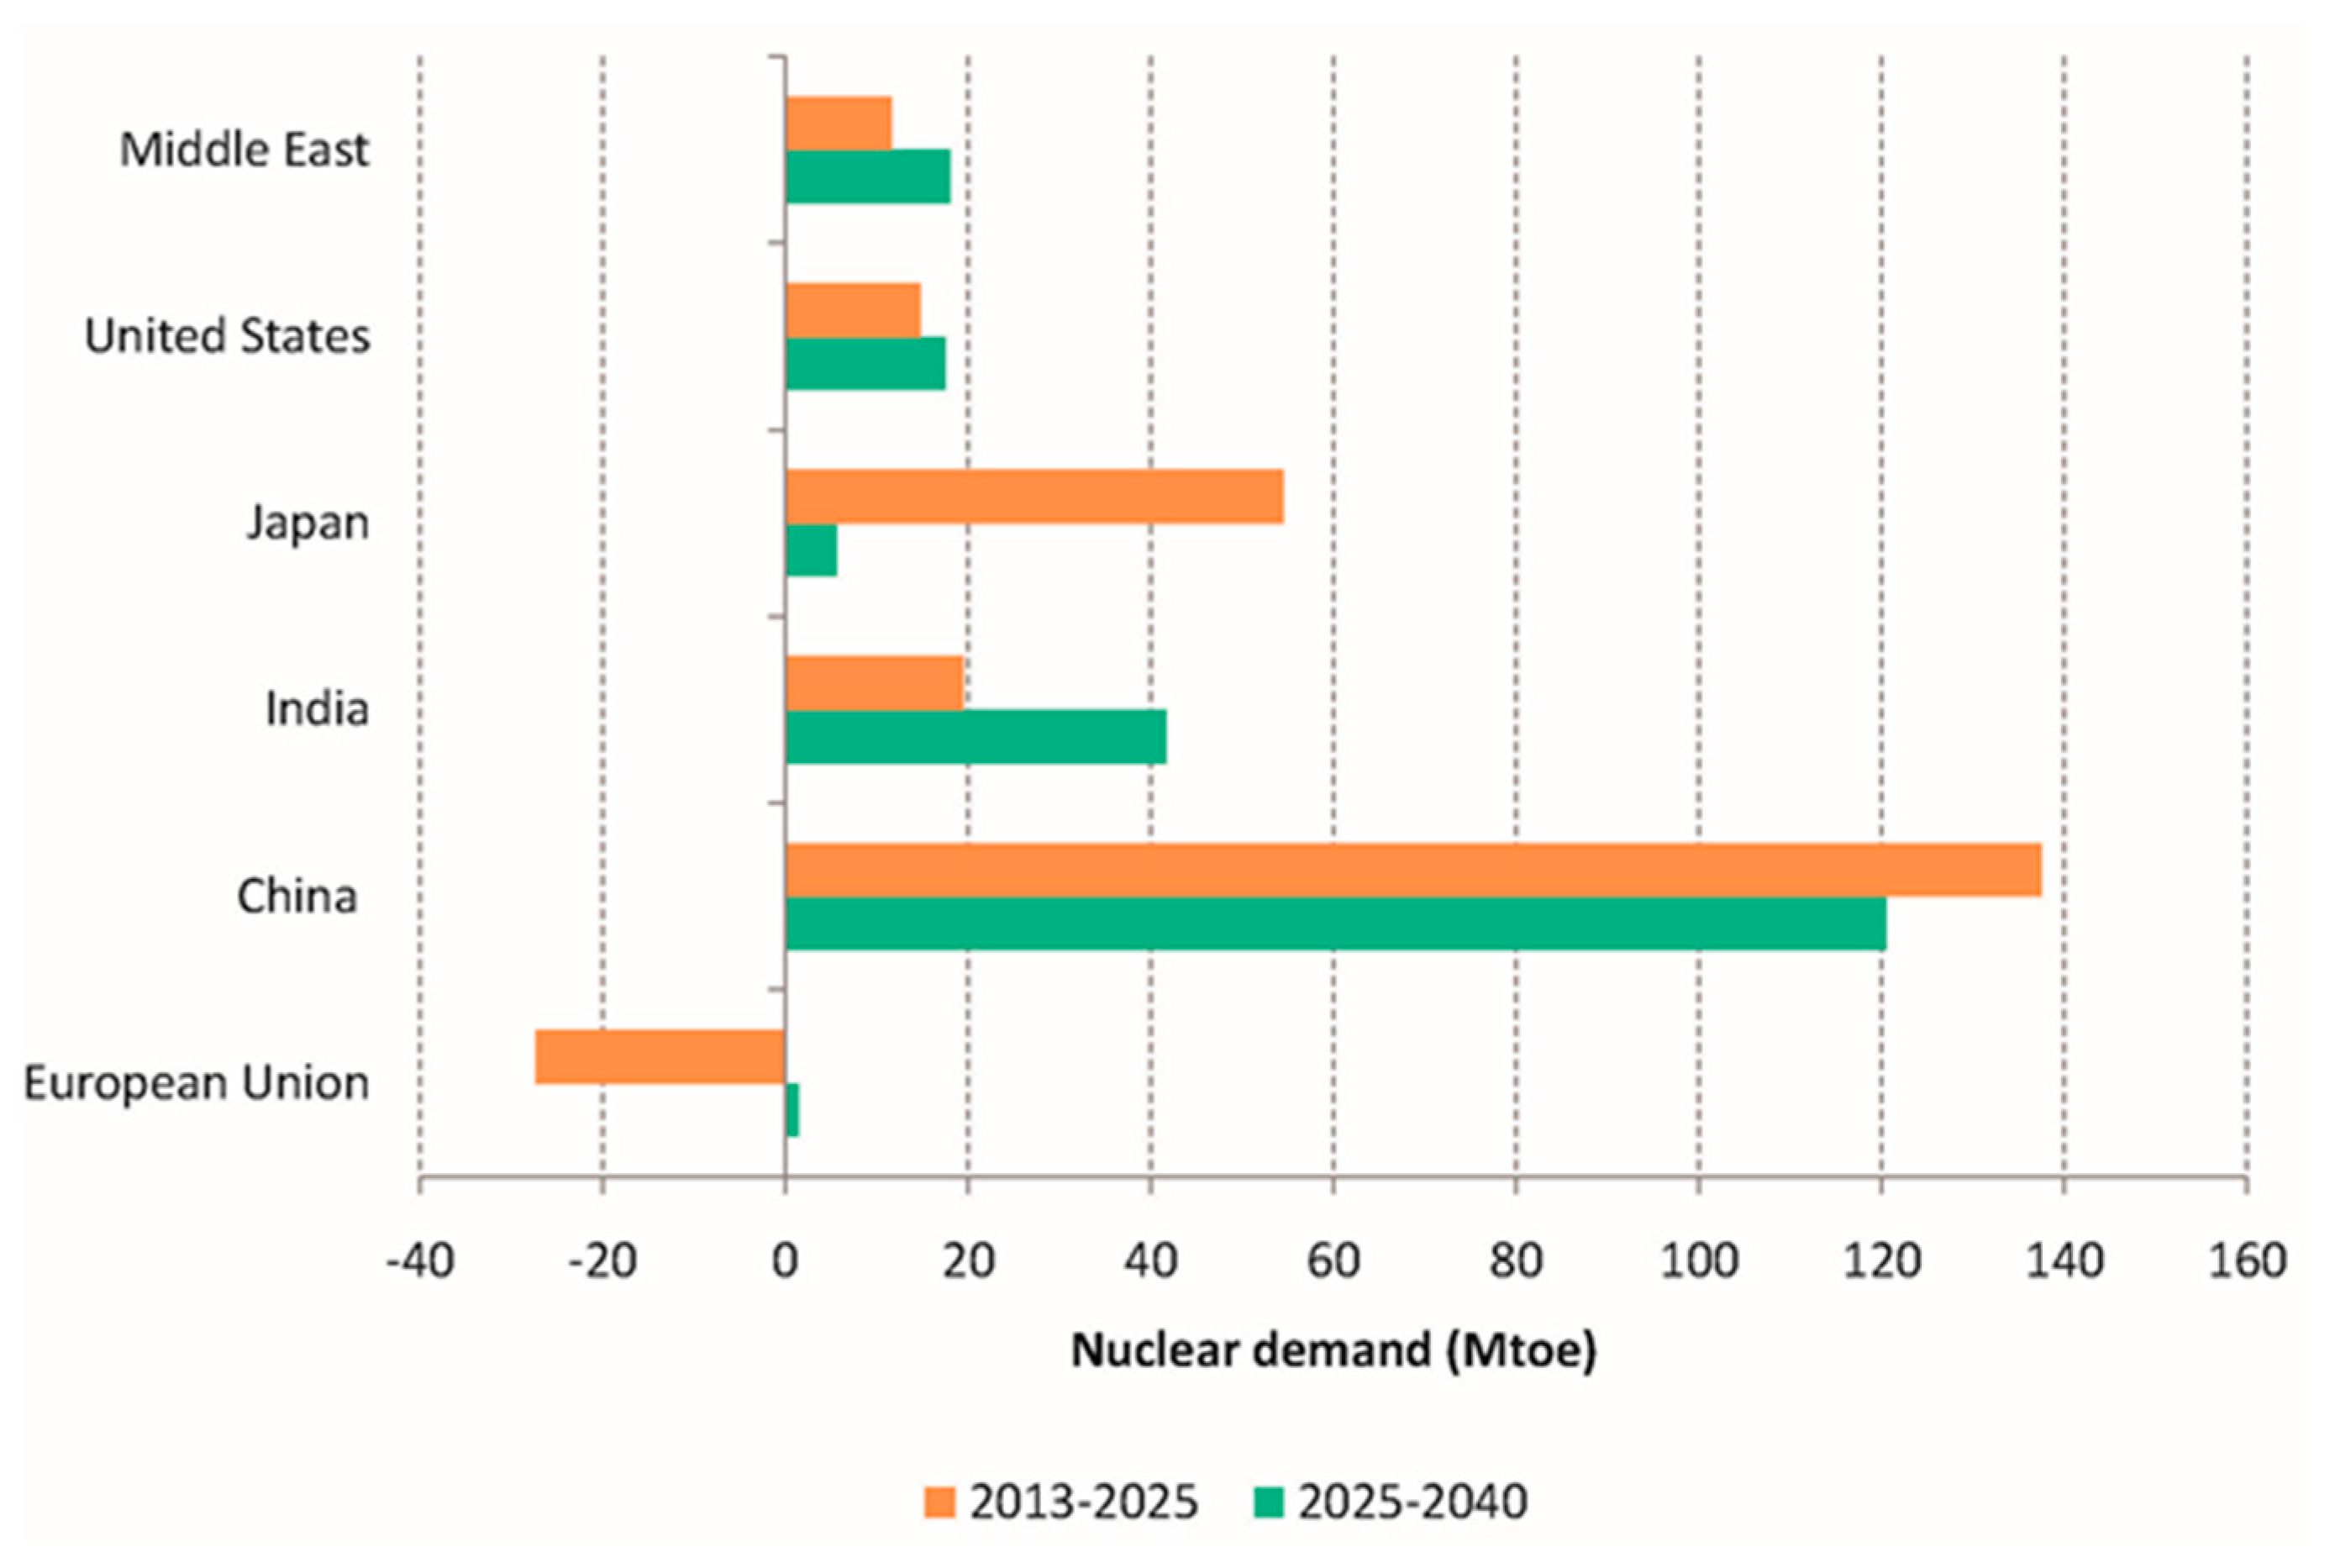
It is noteworthy that the nuclear demand continues to grow considerably in Russia, China, Korea and India, while it declines drastically in Europe, as shown in Figure 13. According to the IEA projections, the attention is focused on India’s nuclear capacity, which increased seven times with respect to 2014, up to 39 GW in 2040, following only China’s nuclear capacity [2].
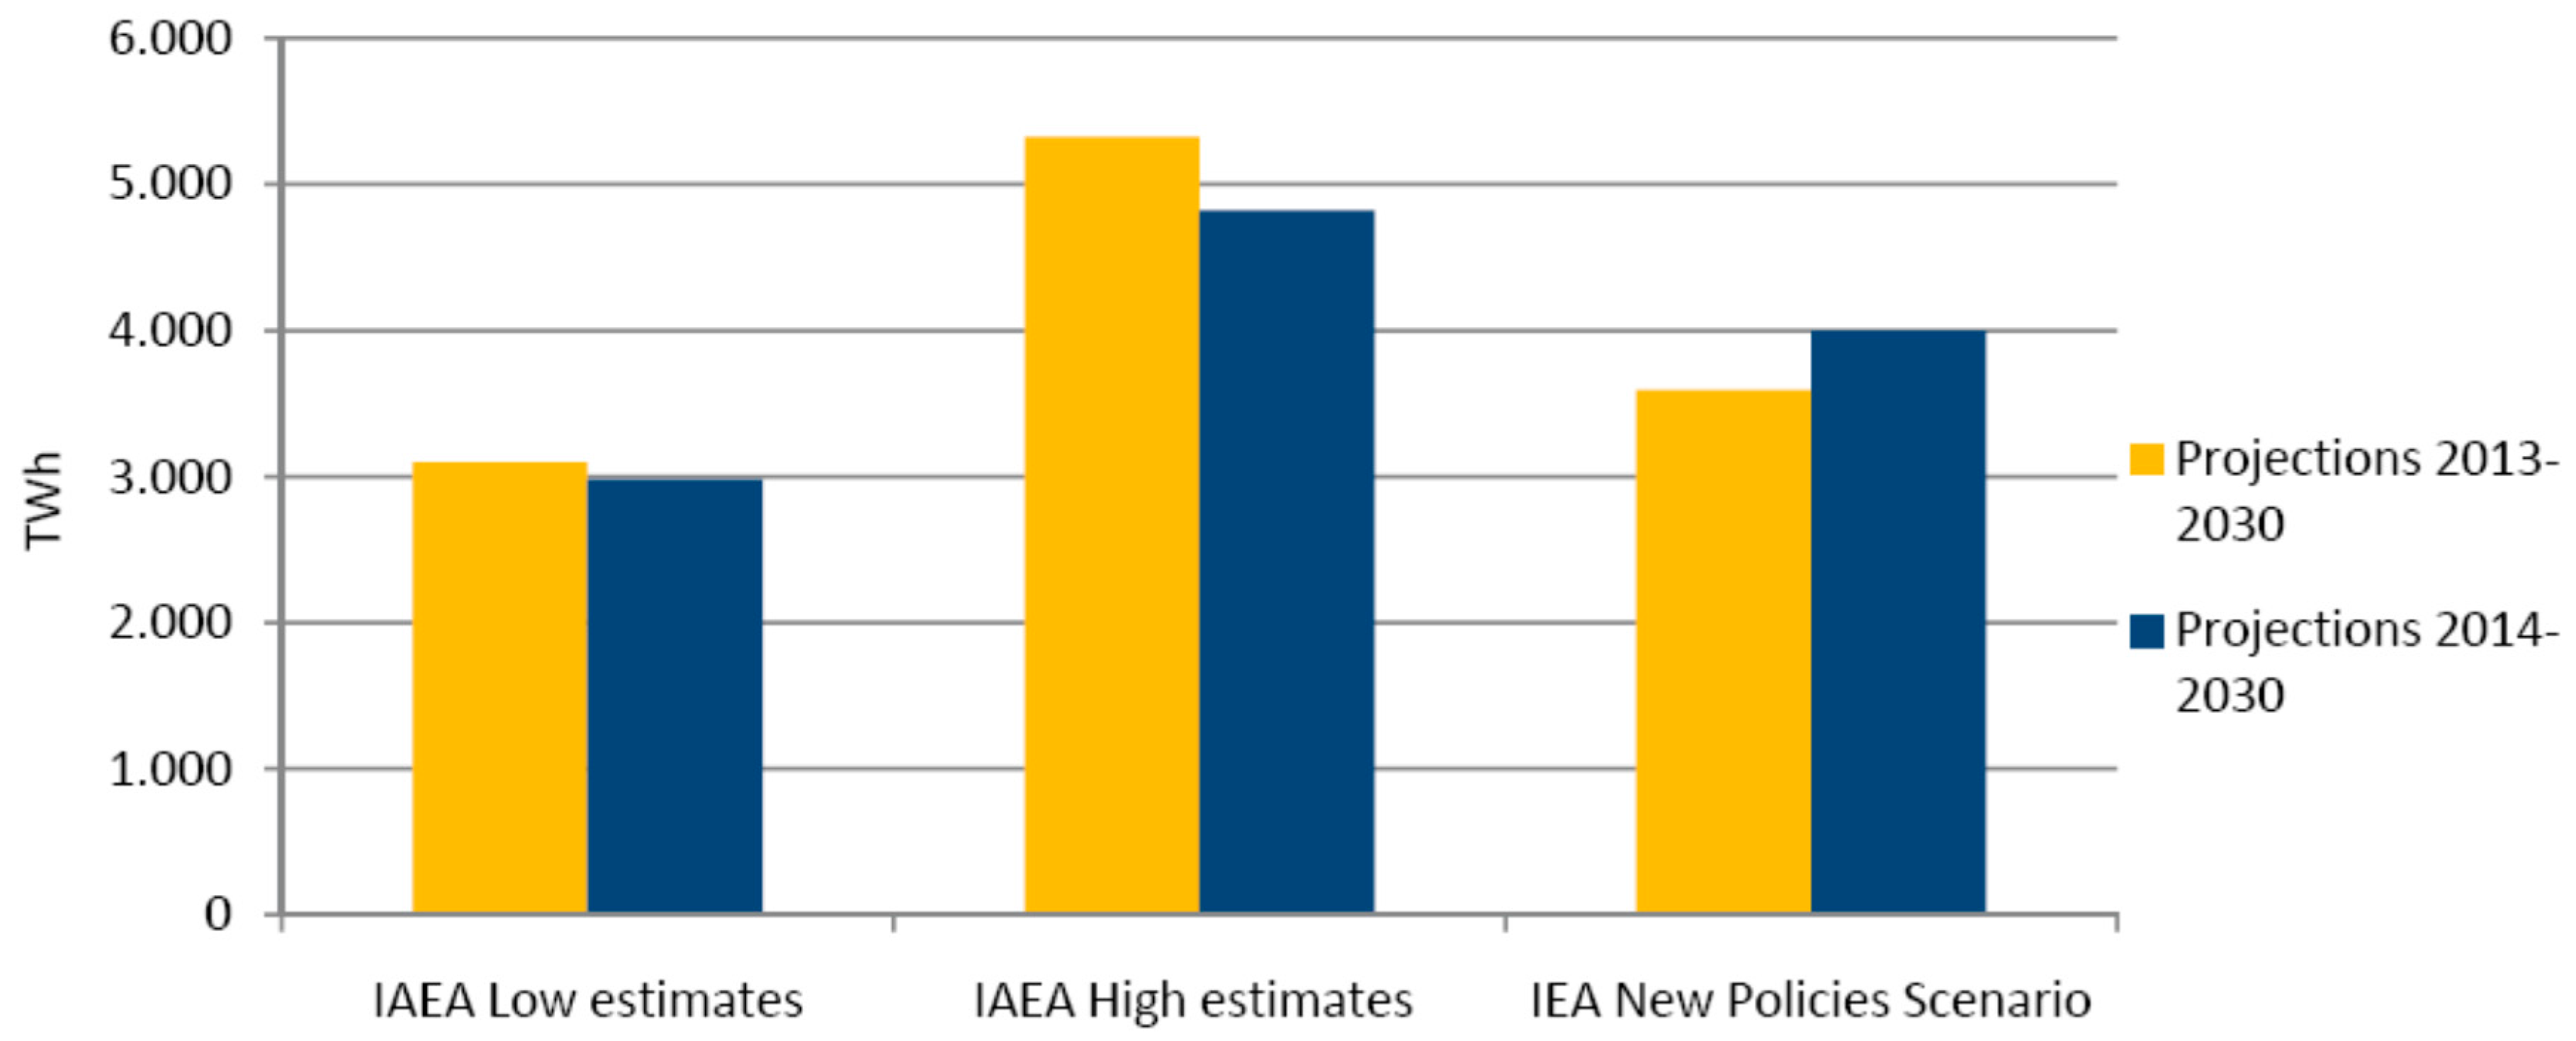
Figure 14 shows the prospects for nuclear in the IEA New Policies scenario and IAEA scenarios: the IAEA “Low” scenario is based on the current market conditions, on the contrary “High” scenario is more positive: it expects a continuous growth of economic and nuclear demand. Figure 15 compares the contribution of nuclear power in the electricity generation between WEO’s central scenario and the IAEA’s prospects: in the latest outlook editions, the nuclear share has been revised downward in the IAEA estimates [1,32]. The policies adopted after the Fukushima accident are included in the assumptions. In addition, IAEA assumes that the low prices of natural gas and the subsidies to RES affected the growth rate of nuclear power. Growth in nuclear power for electricity generation is confirmed by the World Energy Outlook 2016 [3]. Indeed, between 2015 and late 2016, 19, new nuclear reactors are in operation, most of them in China. Currently, around 64 GW of nuclear power capacity are under construction, mainly in China, Russia, United States, the European Union and India.
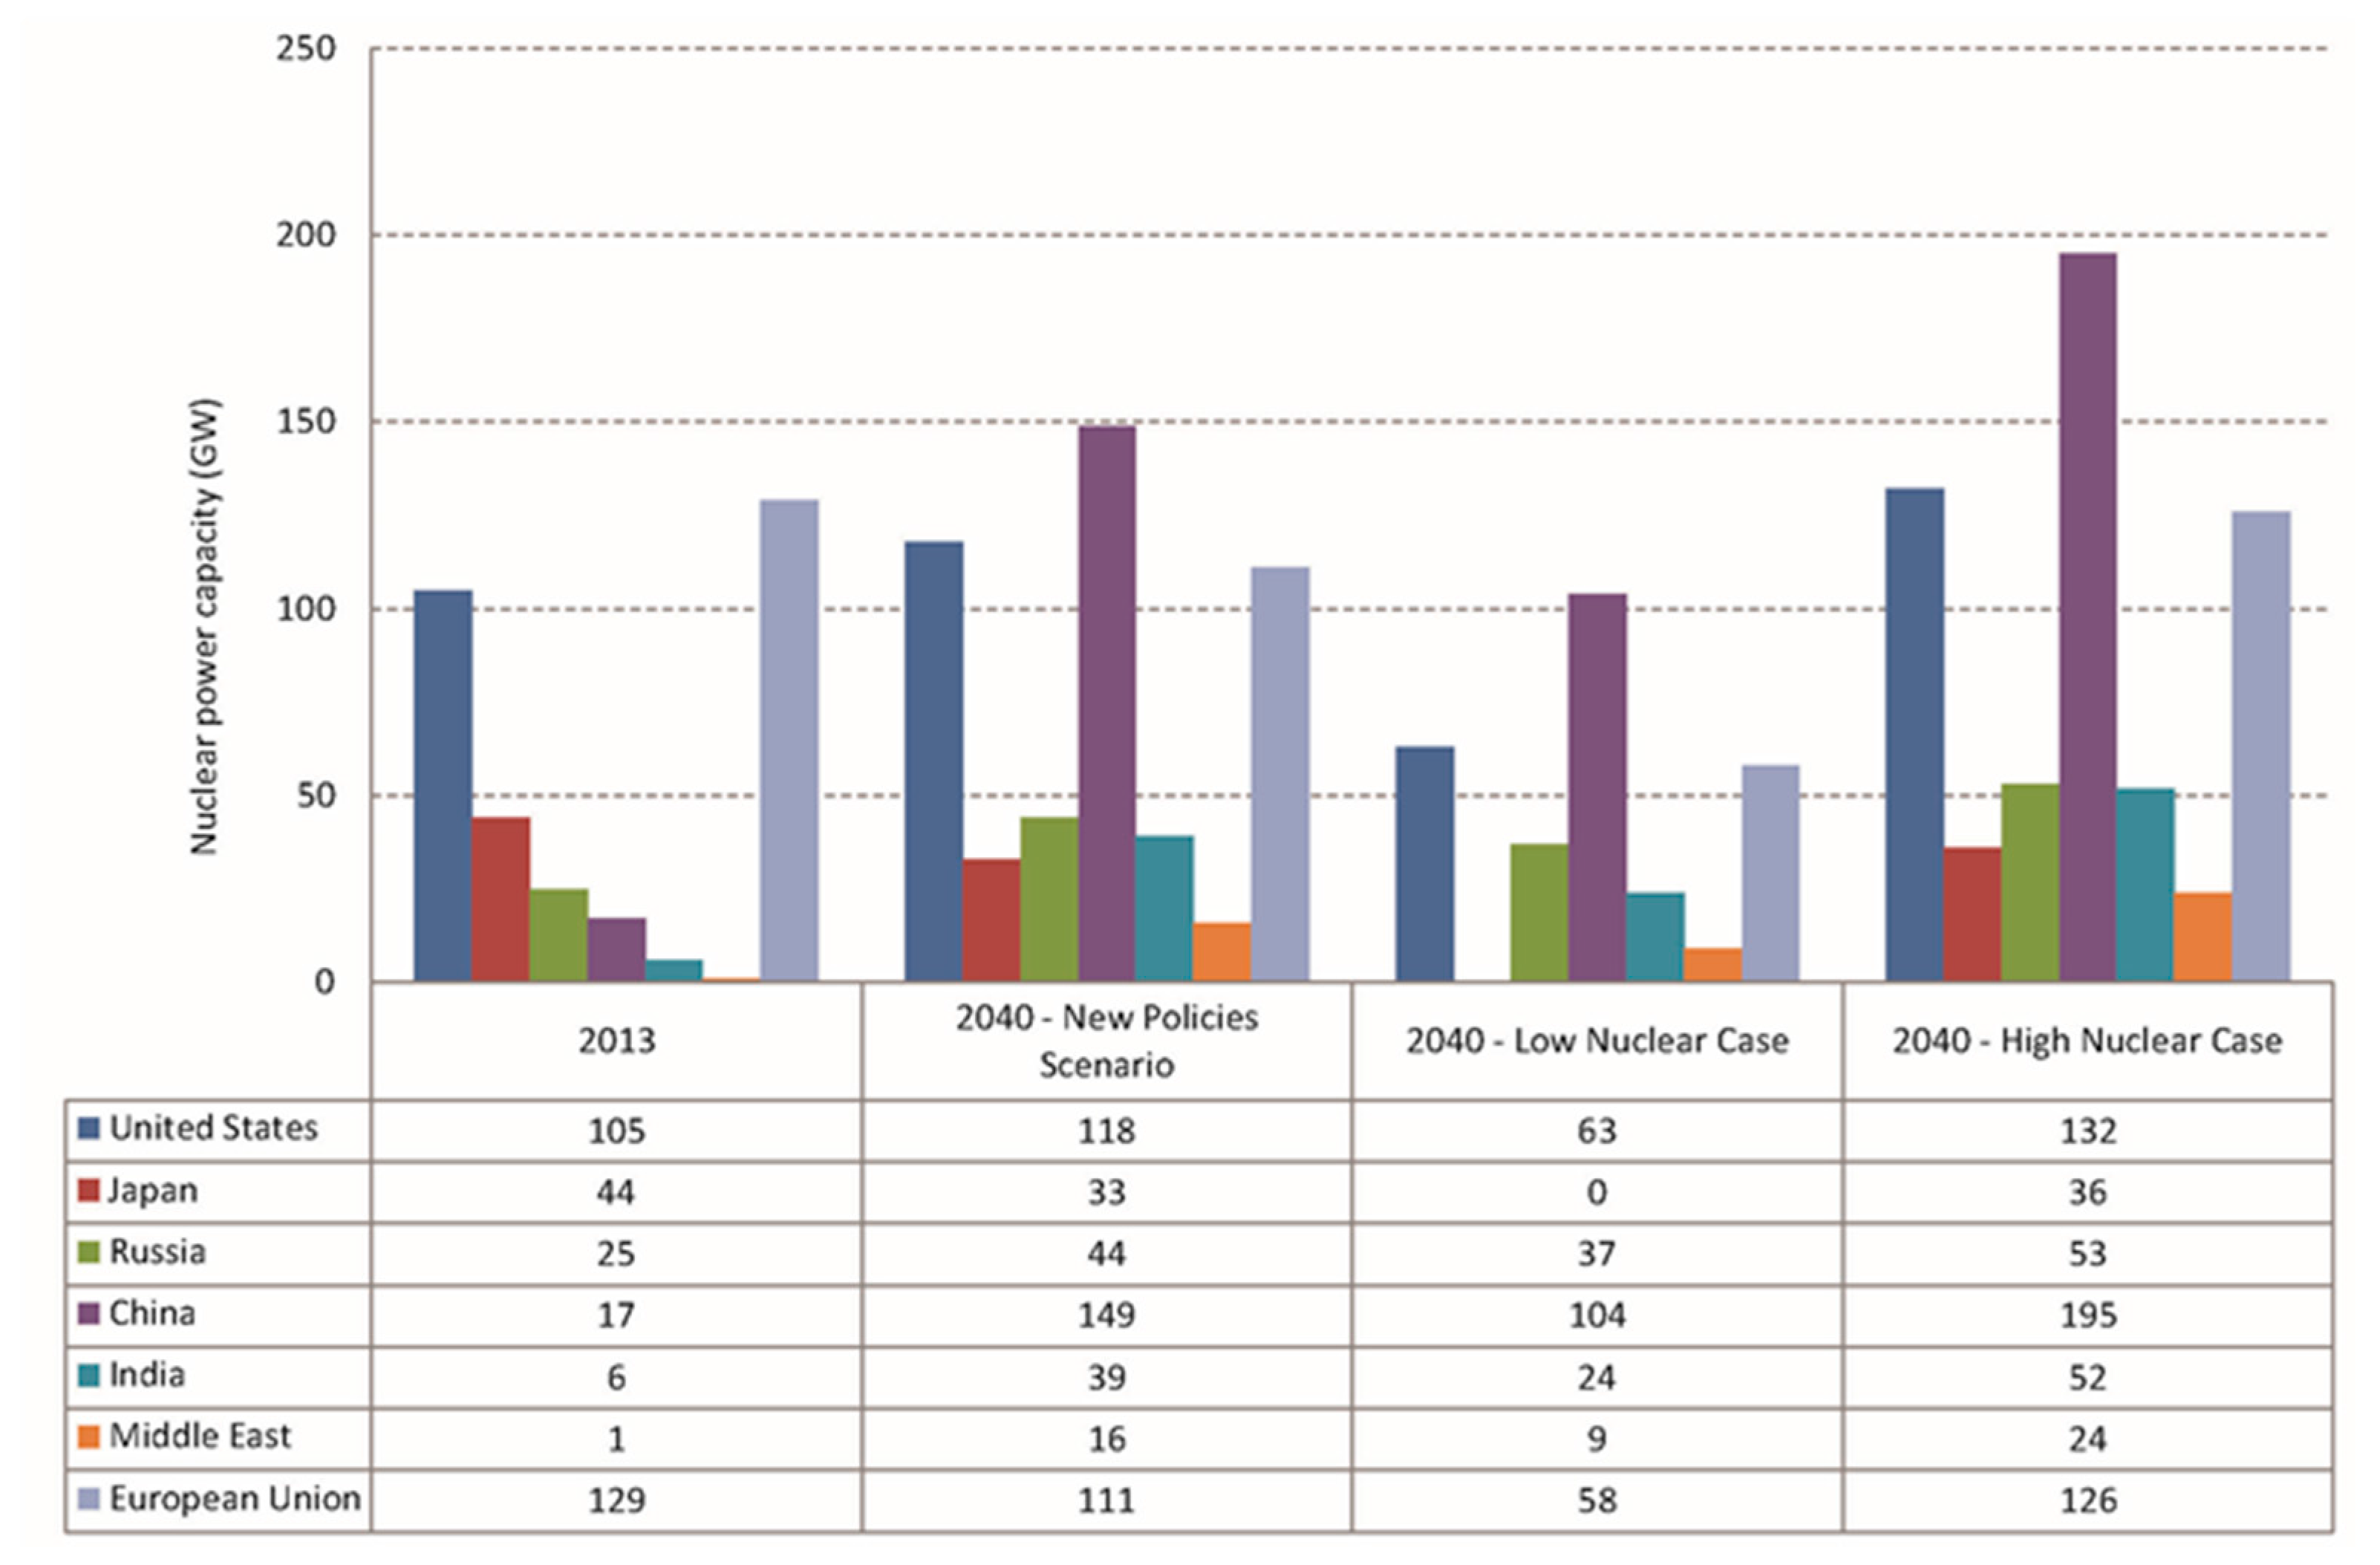
Starting from the WEO-2011, a “Low Nuclear case” has been examined by IEA to better understand the effects of less nuclear power, in comparison with the New Policies Scenario. The prospects are based on the assumptions that all Governments gradually adopted plans to stop nuclear generation. No new reactors are built in OECD and limited number of new reactors are realized in non-OECD regions. The nuclear capacity declines from 392 to 366 GW between 2012 and 2040 [1]. The RES are favored in power generation during this period and environmental benefits are obtained with low nuclear waste to dispose.
On the contrary, the “High Nuclear Case” in the WEO-2014 [1] forecasts that the nuclear capacity will be 776 GW by 2040. In this case, the rapid increase permits countries to be more independent in terms of energy supply.
Figure 15 compares the trends of the nuclear power capacity among the three scenarios. The gap between the High and Low curves is mainly due to the difference between the retirements of reactors and the build of new plants. It is evident that, in the non-OECD countries, the trends remain constantly upward.
The strength of nuclear power is the security of the supply and its role as a low carbon technology. Despite the impacts of Fukushima accident, in the recent years, nuclear power is underpinned by two forces: the growth in electricity demand, above all in the non-OECD countries, and the necessity to reduce greenhouse gas emissions in OECD countries. In WEO-2015, 13% of investments are addressed to build new nuclear power plants in the next 20 years, which mainly comes from non-OECD countries. In detail, Table 5 shows the worldwide distribution of investments in nuclear power.
5. Unconventional Resources
At the end of 2015, the remaining recoverable resources of shale gas, tight gas, and coalbed methane totals 349 trillion cubic meters (tcm), close to the proven reserves of conventional gas (434 tcm) [3]. The unconventional oil reserves are 3298 billion barrels, larger than the recoverable resources of crude oil and NGL, equal to 2787 billion barrels [2].
Among the unconventional resources, shale gas and extra-heavy oil and bitumen (EHOB) are the most abundant today; tight oil too is expanding in the oil market. To be more exhaustive, an overview of current oil and gas market, included unconventional resources, is presented in Table 6 and Table 7; the data are derived from IEA estimates [2]. However, the success of aforementioned resources strongly depends by the competiveness with the other conventional resources, primarily due to the costs of drilling and the amount of recovered gas or oil [3].
Regarding unconventional gas, it is noticed that there are alarming concerns about the environmental impacts derived from the technique of extraction. They are called “unconventional” because of their atypical geological locations; in fact, unconventional gas is found in highly compact rock or coalbeds and requires a specific set of production techniques. Hydraulic fracturing cracks the rocks, releasing the trapped gas. The concerns regard the consequences due to the high amount of water needed, about 20,000 cubic meters per well; the impacts of transporting by truck; and the disposal of waste water. The amount of water needed to drill and fracture one horizontal shale gas well depends on the basin and formation characteristics. Water supply is a major concern of policymakers within the U.S. particularly given heightened competition between competing industries and shrinking supplies [29,34]. In addition, the risks of contamination of water and ground are examined, because of the quantities of chemicals that must be stored at drilling sites and the volumes of liquid and solid waste that are produced. Moreover, significant care must be taken in order to avoid that these materials contaminate surface water and soil.
However, the unconventional resources production is expected to significantly increase and, starting from 2020, the unconventional resources are estimated to become dominant compared to the conventional ones [35,36]. The share of unconventional gas is projected to increase by an average annual growth rate of 3.5% in the period 2014–2040. Meanwhile, unconventional oils are expected to account for 45% of global oil supply by 2040 [28].
Unconventional natural gas, including shale gas, tight gas and coalbed methane, accounts for more than 60% of the increase in total gas production to 2040; consequently, this resource is going to become a crucial part of the global gas supply [2].
North America is expected to remain the major producer of shale gas and tight oil in 2040. In addition, the unconventional gas is expected to have a large contribute to electricity generation in the United States.
In the World Energy Outlook 2016 previsions, unconventional gas production growth is at the beginning concentrated in United States, Canada and Australia, and during the 2020s, production will also increase in China and Argentina. Taking into account the outlook period, most of the production is still provided by conventional resources, but unconventional supply is about 65% of the production growth. As can be seen in Figure 16, the unconventional gas production is estimated to triple by 2040, rising from around 630 billion cubic meters (bcm) in 2013 to around 1700 bcm in 2040, accounting for about one-third of total natural gas production [2].
In the New Policies Scenario, U.S. unconventional gas production is estimated to be larger than the global gas production by 2020 and to overtake Russia. In particular, shale gas production is projected to increase rapidly in the coming years, reaching 660–670 bcm after 2030 [3]. While significant unconventional gas production growth occurs in Canada and Mexico, North America maintains its fundamental role as unconventional gas producer [37,38,39]. Meanwhile, Australian natural gas production significantly increases by 2020, and European conventional gas output decreases in Norway, the Netherlands and the United Kingdom. By 2040, OECD countries are expected to account for the 80% of global natural gas supply growth. In particular, China will approximately triple its production by 2040, reaching around 355 bcm (see Figure 17 [3]).
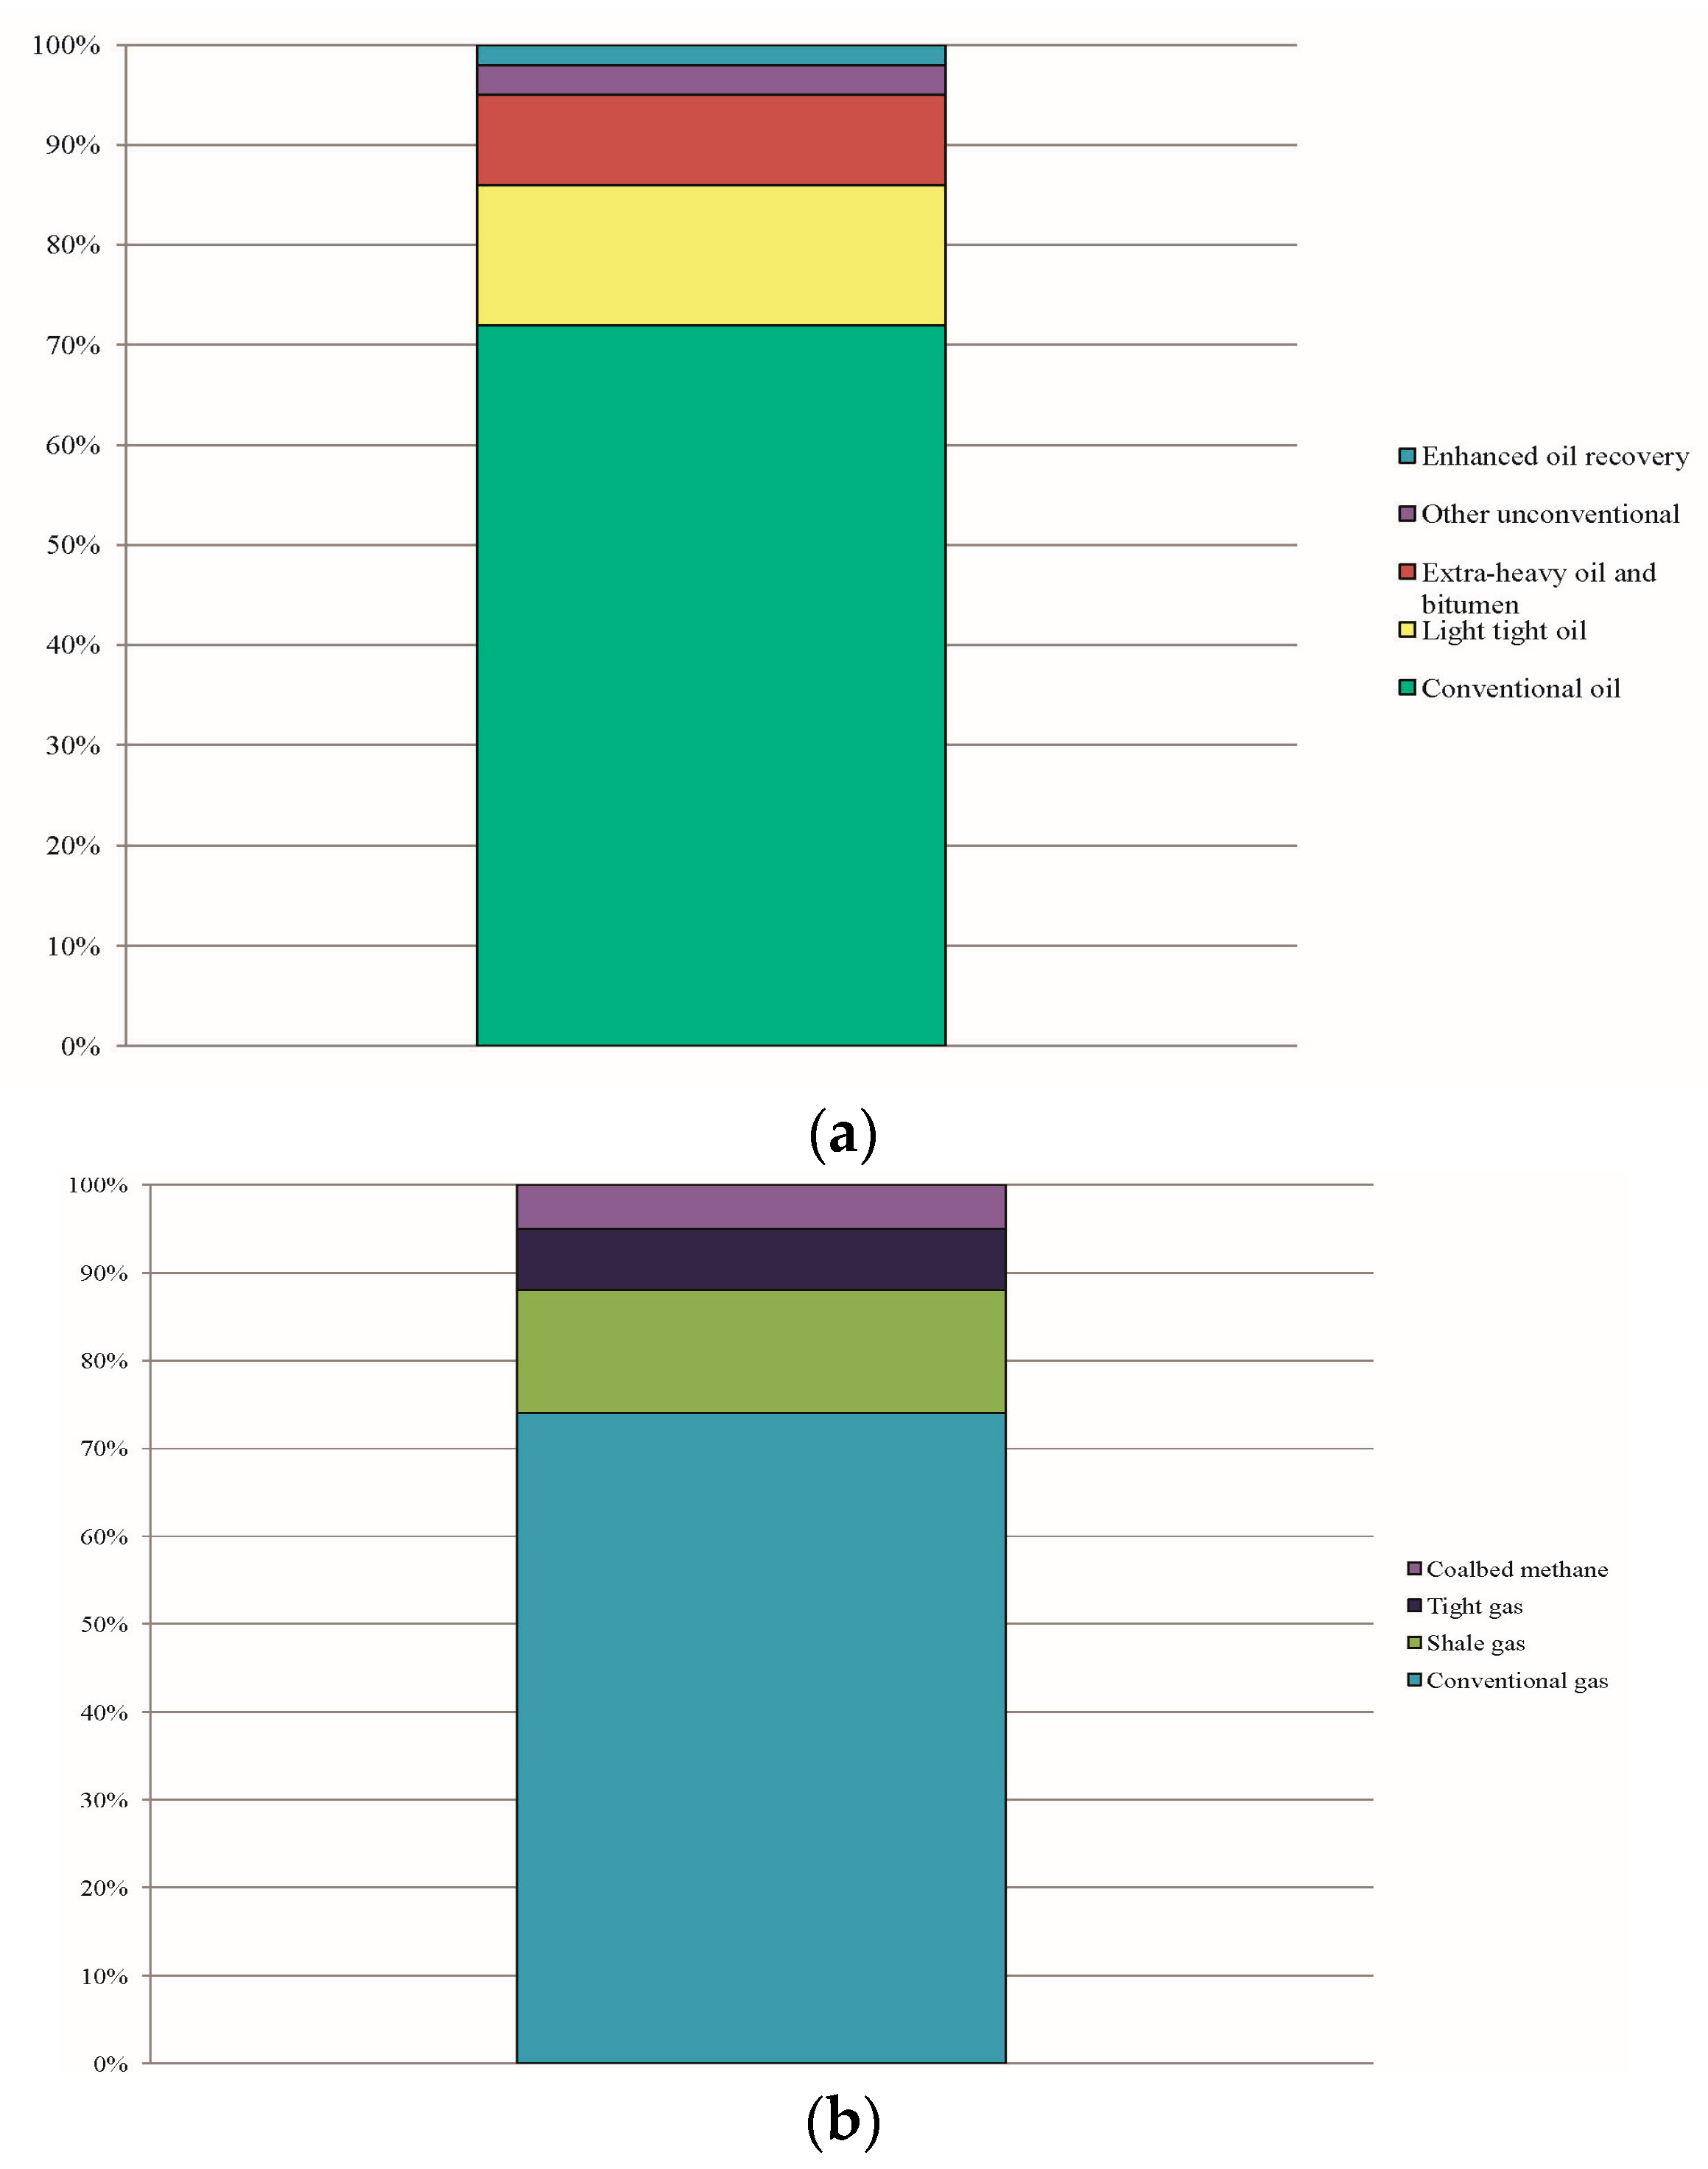
Although the current production costs of unconventional resources are high because of the difficult extraction activities with current technologies, the investments to the unconventional recovery are increasing over 2014–2035. The contribution of unconventional to the total investment is shown in Figure 18a,b. These investments underpin the boom in expansion of the unconventional resources and are supported by the development of the extraction techniques.
6. Renewable Energy Sources
According to the WEO-2016 [3], a transition in energy production model is taking place: in 2014, RES accounted for about half of the additional capacity of the energy’s generation worldwide; and, regarding electricity generation capacity, with 130 gigawatt (GW) of installed capacity in 2014 (23% of global electricity supply), RES have already become the second largest source of electricity behind coal at the world level. The energy mix changes significantly across the three scenarios (Figure 19).
Over the last ten years, RES have accounted for 36% of new power generation capacity, 16% of incremental demand in road transport and 21% of incremental demand for heat. In this framework, renewables represent a critical issue in the European energy policy scenario and they are considered a significant choice for obtaining several advantages [40,41,42]. Among RES, hydropower is the leading RES technology, providing more new capacity than the remaining RES, especially in China. Indeed, although the European Union and North America have led the way to hydropower, currently China is the world leader in hydropower, with 300 GW of installed capacity in 2014. The installed capacity in the European Union and North America together amounted to 340 GW in 2040, i.e., 13% higher than in China. Regarding wind power, in 2014, the installed capacity has increased by more than 40% compared to the previous year, with 48 GW of capacity additions, reaching 350 GW of global installed capacity in 2014. Wind power is mainly produced in China, with an increase of installed capacity of 20 GW, followed by the European Union (12 GW) and the United States (5 GW). Wind power development is mainly based on onshore wind because its levelized cost of electricity is more competitive than offshore wind. However, offshore wind power, which tends to operate in conditions with higher wind speeds, is expected to achieve higher capacity factors than onshore ones. The solar photovoltaic installed capacity has reached 40 GW in 2014. Most of the installations have occurred in China and Japan (10 GW), due to the introduction of generous support policies for solar photovoltaic deployment.
In each of the scenarios outlined by the WEO-2016 [3], it is expected that electricity will be the sector that will increase at higher rates with respect to the other sectors, i.e., road transport and heat consumption. Electricity generation from RES is projected to increase by 125–250% from 2013 to 2040. By taking into account the New Policies Scenario, which is the central scenario of the WEO-2016, 37% of world electricity generation by 2040 will come from RES. In the Current Policies scenario, the share of RES in electricity generations will amount to 29% by 2040, while in the 450 scenario it would reach 58% (Table 8).
Hydropower remains the main RES to produce electricity, covering 16% of the total electricity. China is expected to remain the world leader. Latin America plans to add hydropower projects, while, in most of the OECD countries, hydropower potentials have already been reached.
Deployment of wind and solar photovoltaic is expected to increase as well, but at a lower rate compared to hydropower. The European Union was the world leader in wind power until 2008. Then, in 2008, China surpassed the 5-GW wind power level of the European Union, becoming the largest wind energy market in the world. According to the New Policies scenario, China will remain the main wind market, installing more than 300 GW from 2015 to 2040, followed by the European Union, North America and India. Almost 98% of the global wind power installed capacity will be derived from onshore. The capacity of European offshore installed capacity amounted 8 GW by 2015, with UK and Denmark as the two biggest markets for offshore wind power in the European Union. China ranks number three globally, with around 0.5 GW of installed capacity in 2014. However, countries pay great attention to offshore wind power because it has huge market potential.
Worldwide, the installed capacity of solar photovoltaic has grown from 1 GW in 2000 to 181 GW in 2015. The largest market in 2015 was China, followed by Japan and the USA with 10.6 GW, 9.7 GW and 6.2 GW of new power connected to the grid, respectively. The European Union registered a decline, with 7 GW installed, less than a third compared to the record year 2011. These data confirm the geographical tipping in place over the last two years: in 2012, Europe accounted for 59% of new installations, while, in 2014, 60% of the new capacity has been installed in Asia. According to the New Policies scenario, solar photovoltaic is expected to grow, thus exceeding the threshold of 1000 GW of installed capacity at the world level by 2040.
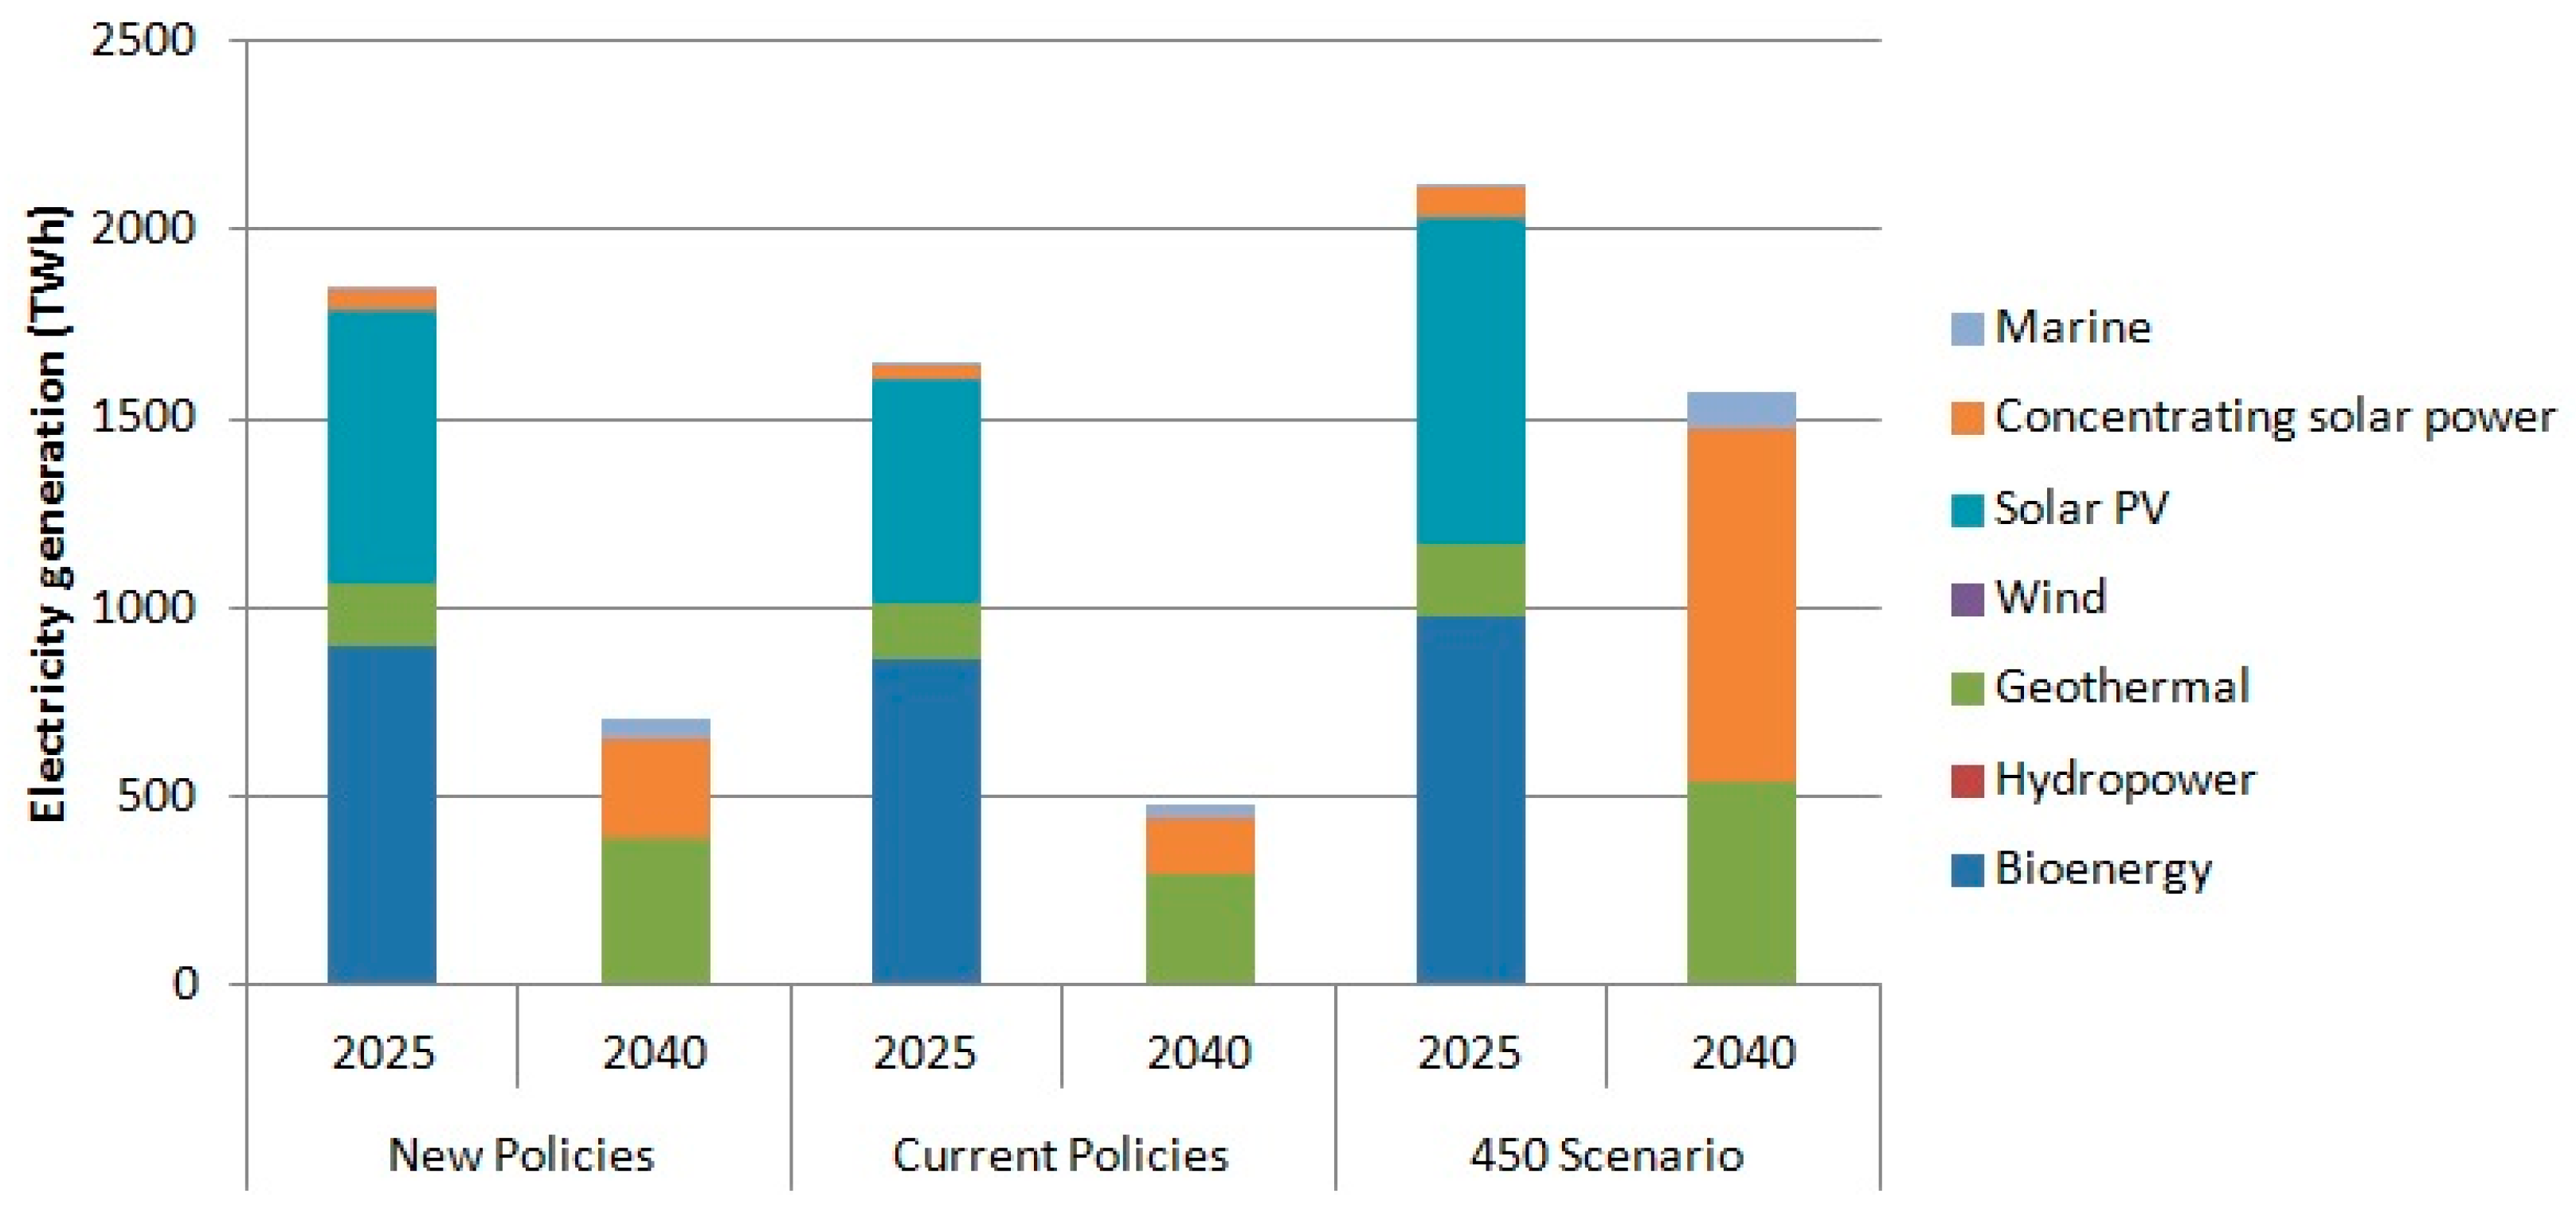
Regarding other RES, such as concentrating solar power, geothermal and marine power, in the long term, it is expected that countries will produce more energy from these RES. However, it is unlikely they will play a big role in the energy market because of their low competitiveness in terms of cost among RES. In addition, biomass production and energy enhancement of organic residues have significant potentialities of employment in the next years [43,44,45].
Energy consumption in industry, buildings [46,47,48] and road transport sectors came in at the lower levels with respect to the electricity sector. In industry and buildings, energy consumption amounted to 5.7 billion toe in 2013, and RES are used to cover 20% of the energy consumption. In the building sector, the main RES used are represented by bioenergy and solar, while in the transport sector it is represented by biofuels. Over time, it is expected that the share of RES will grow in these sectors.
To establish an effective framework of interventions designed to facilitate the integration of RES in the energy sector, policy makers have recognized that technological development and market experience are closely related. There is a positive and synergic relationship among technology, research and development activities and the progress made in the RES production. This relationship works differently for each RES technology, depending on the specific maturity of the technology and its progress on the markets. For many technologies, such as RES, costs decrease with increasing experience. The learning curve is an important tool for evaluating the timing of costs reduction and then for evaluating the cost effectiveness of public policies to support new technologies. Then, the learning rates represent what percentage varies productivity at each percentage variation of the volume of production; that is, what is the relationship between the productivity by passing a cumulative volume of production to a multiple (Table 9).
As discussed above, some RES technologies have already achieved an appreciable market share and their industry is relatively mature. In particular, in 2015, almost three-quarters of power generation from RES, mainly based on hydropower, was competitive with fossil fuel based technologies. The remaining RES technologies have been subsidized by governments. Then, the majority of non-hydro RES are not yet fully competitive in the energy market. For instance, solar photovoltaic is competitive in areas where the high level of solar radiation coincides with both peak daily demand and the high cost of retail electricity, in a context of supportive policies. California and other southwestern areas of the United States are examples of such conditions so that these regions have become important commercial markets. However, the evaluation of the competitiveness of RES should take into account not only the costs alone, such as the levelized cost of electricity, but also the environmental and social externalities.
The expected RES deployment is the basis on which policy makers define investment. In 2015, investments in RES amounted at 288 billion dollars, which is 70% of total electricity generation investments. China led such investments, followed by the European Union and the United States. According to the New Policies scenario, global investment in RES amounts to USD 7.8 trillion in the period 2014–2040, of which USD 7 trillion refer to RES power capacity additions, USD 360 billion to transmission and distribution and USD 290 billion in new refineries for biofuels. However, in the last few years, investment in RES in non-OECD countries is 7% less than that of the OECD countries. Then, investment and the development of RES are accelerating particularly in emerging markets, mainly driven by the growth of energy demand and the concern for local pollution.
7. The Future of Energy Carriers
The first universal and legally binding global climate agreement (COP21) was adopted by 195 countries in December 2015 in Paris. The agreement came into force on 4 November 2016. The agreement sets out a comprehensive action plan, which aims to put the world on track to avoid dangerous climate change by limiting global warming below 2 °C. Indeed, the warming of the climate system is perceived as unequivocal, as it is clear for instance from the observation of the increase in global average air and ocean temperatures and the rising average sea levels [49,50,51,52,53]. In particular, according to the COP21, governments have agreed to make sure that global emissions have to peak as soon as possible, while recognizing that developing countries will need more time, and then proceed to rapid emissions reductions in accordance with the most advanced scientific solutions available. In particular, the Agreement is based on the principle of common but differentiated responsibility in reducing emissions, meaning that developing countries, such as India and China, will be allowed to proceed more slowly because of their more recent industrialization. China is one of the fast growing economies worldwide with a fast rise in energy consumption and CO2 emissions, reaching 25.9% of global emissions [54].
The energy sector has an important role in mitigating climate change, given that around two-thirds of the world’s greenhouse gas emissions come from energy production and use (Table 10).
Since the beginning of the 2000s, the demand of energy by the emerging countries, primarily China and India, has become much more considerable. Everyone wants more energy, and this poses new economic, political and environmental problems.
During 2015, energy consumption increased for all fuels, reaching 9301 Mtoe. Oil remained the world’s leading fuel (39.9%) followed by electricity (18%), natural gas (15.1%), biofuels and waste (12.2%), coal (11.5%) and other (3.3%, geothermal, solar, wind, heat, etc.) [3].
Global oil consumption grew by 0.8 million barrels per day in 2014 with respect to the previous year [23]. According to the New Policy Scenario, oil demand is projected to grow till 2020, with an average annual increase of 900,000 barrels per day, but future scenario with higher oil prices and policies aimed at replacing oil with alternative fuels should lead to a reduction of oil consumption.
World natural gas consumption grew by 0.4% in 2014 [19]. It represents a viable option in the process of gradual de-carbonization of the energy system but the natural gas expansion rate will be limited by the energy efficiency policies, particularly in the residential sector, and competition RES and coal (in some countries) in the electricity generation [55].
Global coal consumption grew by 0.4% in 2014 [19]. So far, the growth in coal consumption has been lower than expected, generating excess capacity and falling prices. In the OCSE area, coal demand is expected to decrease by 40% by 2040, while Asia will account for four-fifths of the world’s demand due to the electricity system in many Asian countries.
Electricity is gaining ground in many end uses. Global nuclear output and global hydroelectric output grew by 1.8% and 2.0% during 2014, respectively. RES increased in 2014, reaching 3.0% of global energy consumption (both power generation and transport). Electricity in the New Policy Scenario should cover about a quarter of final energy demand by 2040. Among RES, solar power generation has experienced 41% growth, while wind energy grew by 10.8% [3].
Despite the change in energy policies encouraged by COP21, more efforts are needed both on the supply and demand sides to reduce energy consumption and prevent the effects of climate change. This is the challenge of the 21st century, i.e., meeting the needs of billions of people who need energy while simultaneously undertaking a path of de-carbonization and lower polluting emissions [56]. Aiming at reducing CO2 emissions, in the last years also nuclear energy has playing a key role and can provide a significant contribution [57,58,59,60]. Currently, there are several effective responses to the problem of climate change. Among them, smart grids are energy networks capable of integrating, in a smart way, the behavior and actions of all users connected to it, be they generators, consumers or prosumers, aimed at realizing, in an efficient way, a sustainable supply and demand of electricity. According to the IEA (2015b) [54], the main impacts arising from the development of smart grids are related to the development and integration of RES, the use of electric vehicles and the possibility to induce structural changes in consumption habits. Indeed, electric vehicles are crucial to help climate change mitigation in the short- and long-term, given that the transport sector is responsible for around 14% of greenhouse gas emissions and this is projected to increase to 50% by 2030 [61]. Currently, there is a small market share of electric vehicles in service due to both technical and social barriers (e.g., perceived inequity, conflicting values, goals, and aspirations, perceived risks, sunk costs) [62]. Thus far, although sustainability and environmental benefits of such vehicles have an influence on consumers towards their adoption, the interest is moderate [62,63].
Looking towards future developments of the energy markets, although government plays an essential role through legislation and regulatory action, a behavioral change by individuals is needed. In some cases, behavioral deficit occurs because people face structural barriers, such as low income, living in rural areas, etc. However, for those who not face structural barriers, then socio barriers are to be overcome for individuals to make more climate-friendly choices in the energy field.
8. Conclusions
This study has provided an analysis of some of the most important trends of the world energy market, according to the IEA (2014–2016) [1,2,3] and other sources: energy efficiency, nuclear power, unconventional resources and RES were particularly taken into account. The investigation of these technologies is important for determining future developments of energy consumption, which will decide future policy interventions.
The analysis of the main important international research centers indicates that investigating the new drivers of energy demand is crucial for sustainable developments. In fact, a crucial issue for the future policy intervention is to understand that energy efficiency, i.e. better use of energy, leads to decrease specific energy consumption. However, the associated cost reduction may spur a wider diffusion of energy usage.
Despite the challenges of acceptability and security management of nuclear power, increasing the diversity of power generation technologies in the energy mix can reduce dependence on foreign supplies for countries that import energy, and can limit their exposure to fuel price movements in international markets. Furthermore, the development of unconventional fossil resources, such as shale gas, tight-gas and coalbed methane, though controversial, may represent an opportunity to change the energy trajectory and then the economic opportunities for countries characterized by the presence of such low-cost resources. Moreover, it is worth noting that increasing the use of RES allows replacing carbon-intensive energy sources and reducing global CO2 emissions. Indeed, most RES, such as wind, solar photovoltaic and hydroelectric technologies, generate electricity with no associated air pollution emissions. There still exists some variability in the future trends of RES penetration projections according to major international studies, ranging from a conservative 30% RES share in 2050 up to an innovative and optimistic view of 95% of RES share by 2050. Nonetheless, general consensus points toward the importance of policy actions to continue to spur technology innovation in non-mature segments of the RES, such as integrated smart grid technologies in the electric and residential sectors, and integrated technology control of heating and cooling in the residential sector.
In conclusion, our analysis highlights the importance of the new, clean technologies to face the growth in energy demand at the world level and to comply with the targets of the global climate agreement signed at COP21. Although some of these technologies are still costly, it should be stressed that society will benefit in terms of environmental and social enhancement of the quality of life of future generations. Future research should regard the comparison among the results from different outlooks and sources in terms of life cycle cost of different energy technologies.
Author Contributions
This paper is the result of a collaboration of all the authors. Francesco Asdrubali, Carlo Andrea Bollino and Paolo Polinori designed and supervised the research. Claudia Guattari and Antonella Rotili wrote the Sections related to energy efficiency, unconventional resources and nuclear power. Simona Bigerna and Silvia Micheli wrote the Sections related to primary energy demand and consumption, renewable energy sources and future energy markets. All authors contributed to the various revisions of the manuscript.
Conflicts of Interest
The authors declare no conflict of interest.
References
- International Energy Agency. World Energy Outlook 2014; IEA Publications: Paris, France, 2014. [Google Scholar]
- International Energy Agency. World Energy Outlook 2015; IEA Publications: Paris, France, 2015. [Google Scholar]
- International Energy Agency. World Energy Outlook 2016; IEA Publications: Paris, France, 2016. [Google Scholar]
- Kraft, J.; Kraft, A. On the relationship between energy and GNP. J. Energy Dev. 1978, 3, 401–403. [Google Scholar]
- Belloumi, M. Energy consumption and GDP in Tunisia: Cointegration and causality analysis. Energy Policy 2009, 37, 2745–2753. [Google Scholar] [CrossRef]
- Cheng, B. An investigation of cointegration and causality between energy consumption and economic growth. J. Energy Dev. 1995, 21, 73–84. [Google Scholar]
- Ozturk, I. A literature survey on energy–growth nexus. Energy Policy 2010, 38, 340–349. [Google Scholar] [CrossRef]
- Coers, R.; Sanders, M. The energy—GDP nexus; addressing an old question with new methods. Energy Econ. 2013, 36, 708–715. [Google Scholar] [CrossRef]
- Salamaliki, P.K.; Venetis, I.A. Energy consumption and real GDP in G-7: Multi-horizon causality testing in the presence of capital stock. Energy Econ. 2013, 39, 108–121. [Google Scholar] [CrossRef]
- Wong, S.L.; Chang, Y.; Chia, W.-M. Energy consumption, energy R&D and real GDP in OECD countries with and without oil reserves. Energy Econ. 2013, 40, 51–60. [Google Scholar]
- Zhou, P.; Ang, B.W.; Poh, K.L. A trigonometric grey prediction approach to forecasting electricity demand. Energy 2006, 31, 2839–2847. [Google Scholar] [CrossRef]
- Adams, F.G.; Shachmurove, Y. Modeling and forecasting energy consumption in China: Implications for Chinese energy demand and imports in 2020. Energy Econ. 2008, 30, 1263–1278. [Google Scholar] [CrossRef]
- Pao, H.T.; Tsai, C.M. Modeling and forecasting the CO2 emissions, energy consumption, and economic growth in Brazil. Energy 2011, 36, 2450–2458. [Google Scholar] [CrossRef]
- Ballester, C.; Furió, D. Effects of renewables on the stylized facts of electricity prices. Renew. Sustain. Energy Rev. 2015, 52, 1596–1609. [Google Scholar] [CrossRef]
- Burgos-Payán, M.; Roldán-Fernández, J.; Trigo-García, A.; Bermúdez-Ríos, J.; Riquelme-Santos, J. Costs and benefits of the renewable production of electricity in Spain. Energy Policy 2013, 56, 259–270. [Google Scholar] [CrossRef]
- Moncada Lo Giudice, G.; Asdrubali, F.; Rotili, A. Influence of new factors on global energy prospects in the medium term: Comparison among the 2010, 2011 and 2012 editions of the IEA’s World Energy Outlook reports. Econ. Policy Energy Environ. 2013, 3, 67–89. [Google Scholar]
- International Monetary Fund, World Economic Outlook-Update. Available online: http://www.imf.org (accessed on 14 January 2017).
- Enerdata. Global Energy Statistical Yearbook 2015. Available online: http://yearbook.enerdata.net/ (accessed on 9 February 2017).
- British Petroleum, BP. Statistical Review of World Energy, 64th ed.; BP p.l.c.: London, UK, 2015. [Google Scholar]
- International Energy Agency. World Energy Outlook 2013; IEA Publications: Paris, France, 2013. [Google Scholar]
- Mirchi, A.; Hadian, S.; Madani, K.; Rouhani, O.M.; Rouhani, A.M. World Energy Balance Outlook and OPEC Production Capacity: Implications for Global Oil Security. Energies 2012, 5, 2626–2651. [Google Scholar] [CrossRef]
- World Bank Database. 2015. Available online: http://www.worldbank.org (accessed on 3 August 2015).
- Filippini, M.; Hunt, L. Energy demand and energy efficiency in the OECD countries: A stochastic demand frontier approach. Energy J. 2011, 32, 59–80. [Google Scholar] [CrossRef]
- Filippini, M.; Zhang, L. Estimation of the energy efficiency in Chinese provinces. Energy Effic. 2016, 9, 1315–1328. [Google Scholar] [CrossRef]
- Khatib, H. IEA World Energy Outlook 2010—A comment. Energy Policy 2011, 39, 2507–2511. [Google Scholar] [CrossRef]
- British Petroleum, BP. Statistical Review of World Energy, 63th ed.; BP p.l.c.: London, UK, 2014. [Google Scholar]
- British Petroleum, BP. Energy Outlook 2035; BP p.l.c.: London, UK, 2015. [Google Scholar]
- Exxon Mobil. The Outlook for Energy: A View to 2040; Exxon Mobil Corporation: Irving, Texas, 2014. [Google Scholar]
- Lovering, R.; Yip, A.; Nordhaus, T. Historical construction costs of global nuclear power reactors. Energy Policy 2016, 91, 371–382. [Google Scholar] [CrossRef]
- IAEA (International Atomic Energy Agency). Energy, Electricity and Nuclear Power Estimates for the Period up to 2050–2015 Edition; IAEA: Vienna, Austria, 2015. [Google Scholar]
- Rabl, A.; Rabl, V.A. External costs of nuclear: Greater or less than the alternatives? Energy Policy 2013, 57, 575–584. [Google Scholar] [CrossRef]
- International Energy Agency. World Energy Investment Outlook 2014; IEA Publications: Paris, France, 2014. [Google Scholar]
- IAEA. PRIS-Power Reactor Information System. Available online: http://www.iaea.org/pris/ (accessed on 8 February 2016).
- Zoback, M.; Kitasei, S.; Copithorne, B. Addressing the Environmental Risks from Shale Gas Development; Worldwatch Institute: Washington, DC, USA, 2010. [Google Scholar]
- Franco, A.; Fantozzi, F. Analysis and clustering of natural gas consumption data for thermal energy use forecasting. J. Phys. Conf. Ser. IOP Publ. 2015, 655, 1–10. [Google Scholar] [CrossRef]
- Toscano, A.; Bilotti, F.; Asdrubali, F.; Guattari, C.; Evangelisti, L.; Basilicata, C. Recent Trends in the World Gas Market: Economical, Geopolitical and Environmental Aspects. Sustainability 2016, 8, 154–178. [Google Scholar] [CrossRef]
- Reynolds, D.B.; Kolodziej, M. North American Natural Gas Supply Forecast: The Hubbert Method Including the Effects of Institutions. Energies 2009, 2, 269–306. [Google Scholar] [CrossRef]
- Yaritani, F.; Matsushima, J. Analysis of the Energy Balance of Shale Gas Development. Energies 2014, 7, 2207–2227. [Google Scholar] [CrossRef]
- Ciarreta, A.; Espinosa, M.P.; Pizarro-Irizar, C. Is green energy expensive? Empirical evidence from the Spanish electricity market. Energy Policy 2014, 69, 205–215. [Google Scholar] [CrossRef]
- Abedin, M.J.; Masjuki, H.H.; Kalam, M.A.; Sanjid, A.; Ashrafur Rahman, S.M.; Masum, B.M. Energy balance of internal combustion engines using alternative fuels. Renew. Sustain. Energy Rev. 2013, 2, 20–33. [Google Scholar] [CrossRef]
- Moosavian, S.M.; Rahim, N.A.; Selvaraj, J.; Solangi, K.H. Energy policy to promote photovoltaic generation. Renew. Sustain. Energy Rev. 2013, 25, 44–58. [Google Scholar] [CrossRef]
- Cotana, F.; Petrozzi, A.; Cavalaglio, G.; Coccia, V.; Pisello, A.L.; Bonamente, E. A batch digester plant for biogas production and energy enhancement of organic residues from collective activities. Energy Proc. 2014, 61, 1669–1672. [Google Scholar] [CrossRef]
- Asdrubali, F.; Cotana, F.; Rossi, F.; Presciutti, A.; Rotili, A.; Guattari, C. Life cycle assessment of new oxy-fuels from biodiesel-derived glycerol. Energies 2015, 8, 1628–1643. [Google Scholar] [CrossRef]
- Castellani, B.; Rossi, F.; Filipponi, M.; Nicolini, A. Hydrate-based removal of carbon dioxide and hydrogen sulphide from biogas mixtures: Experimental investigation and energy evaluations. Biomass Bioenerg 2014, 70, 330–338. [Google Scholar] [CrossRef]
- Evangelisti, L.; Guattari, C.; Gori, P.; De Lieto Vollaro, R. In situ thermal transmittance measurements for investigating differences between wall models and actual building performance. Sustainability 2015, 7, 10388–10398. [Google Scholar] [CrossRef]
- Evangelisti, L.; Guattari, C.; Gori, P. Energy retrofit strategies for residential building envelopes: An Italian case study of an early-50s building. Sustainability 2015, 7, 10445–10460. [Google Scholar] [CrossRef]
- Battista, G.; Carnielo, E.; Frascarolo, M.; Evangelisti, L.; De Lieto Vollaro, R. Energy performance and thermal comfort of a high efficiency house: RhOME for denCity, winner of Solar Decathlon Europe 2014. Sustainability 2015, 7, 9681–9695. [Google Scholar] [CrossRef]
- Azevedo, I.; Jaramillio, P.; Rubina, E.; Yehb, S. Technology learning curves and the future cost of electric power generation technology. In Proceedings of the 18th Annual Energy and Climate Change Research Seminar, Washington, DC, USA, 22 May 2013. [Google Scholar]
- Bawayelaazaa Nyuor, A.; Donkor, E.; Aidoo, R.; Saaka Buah, S.; Naab, J.B.; Nutsugah, S.K.; Bayala, J.; Zougmoré, R. Economic Impacts of Climate Change on Cereal Production: Implications for Sustainable Agriculture in Northern Ghana. Sustainability 2016, 8, 724. [Google Scholar] [CrossRef]
- Baccarin Zanetti, V.; Cabral de Sousa Junior, W.; De Freitas, D.M. A Climate Change Vulnerability Index and Case Study in a Brazilian Coastal City. Sustainability 2016, 8, 811. [Google Scholar] [CrossRef]
- Kim, D.; Lim, U. Urban Resilience in Climate Change Adaptation: A Conceptual Framework. Sustainability 2016, 8, 405. [Google Scholar] [CrossRef]
- Allred, S.B.; Schneider, R.L.; Reeder, J.G. The Role of Natural Resource Professionals in Addressing Climate Change. Climate 2016, 4, 38. [Google Scholar] [CrossRef]
- Zhang, N.; Wang, B. Toward a Sustainable Low-Carbon China: A Review of the Special Issue of “Energy Economics and Management”. Sustainability 2016, 8, 823. [Google Scholar] [CrossRef]
- International Energy Agency. Smart Grids in Distribution Networks—Roadmap Development and Implementation; International Energy Agency: Paris, France, 2015. [Google Scholar]
- Tomkiewicz, M. On the Feasibility of a Timely Transition to a More Sustainable Energy Future. Sustainability 2010, 2, 204–214. [Google Scholar] [CrossRef]
- IPCC. Climate Change 2014—Mitigation of Climate Change; Contribution of Working Group III to the Fifth Assessment Report of the Intergovernmental Panel on Climate Change; Cambridge University Press: New York, NY, USA, 2014. [Google Scholar]
- Cerullo, N.; Lomonaco, G. Generation IV reactor designs, operation and fuel cycle. In Nuclear Fuel Cycle Science and Engineering; Crossland, I., Ed.; Woodhead Publishing Limited: Sawston, CA, USA, 2012; Chapter 13; pp. 333–395. [Google Scholar]
- Chersola, D.; Lomonaco, G.; Marotta, R. The VHTR and GFR and their use in innovative symbiotic fuel cycles. Prog. Nucl. Energy 2015, 83, 443–459. [Google Scholar] [CrossRef]
- Vezzoni, B.; Cerullo, N.; Forasassi, G.; Fridman, E.; Lomonaco, G.; Romanello, V.; Shwageraus, E. Preliminary evaluation of a nuclear scenario involving innovative gas cooled reactors. Sci. Technol. Nucl. Install. 2009, 2009. [Google Scholar] [CrossRef]
- Bomboni, E.; Cerullo, N.; Lomonaco, G. Assessment of LWR-HTR-GCFR integrated cycle. Sci. Technol. Nucl. Install. 2009, 2009. [Google Scholar] [CrossRef]
- Gifford, R. The dragons of inaction: Psychological barriers that limit climate change mitigation and adaptation. Am. Psychol. 2011, 66, 290–302. [Google Scholar] [CrossRef] [PubMed]
- Egbue, O.; Long, S. Barriers to widespread adoption of electric vehicles: An analysis of consumer attitudes and perceptions. Energy Policy 2012, 48, 717–729. [Google Scholar] [CrossRef]
- Barth, M.; Jugert, P.; Fritsche, I. Still under detected—Social norms and collective efficacy predict the acceptance of electric vehicles in Germany. Trans. Res. Part F Traffic Psychol. Behav. 2016, 37, 64–77. [Google Scholar] [CrossRef]
Figure 1.
Primary energy consumption, in Mtoe, in 2014. Source: Enerdata [18].
Figure 1.
Primary energy consumption, in Mtoe, in 2014. Source: Enerdata [18].
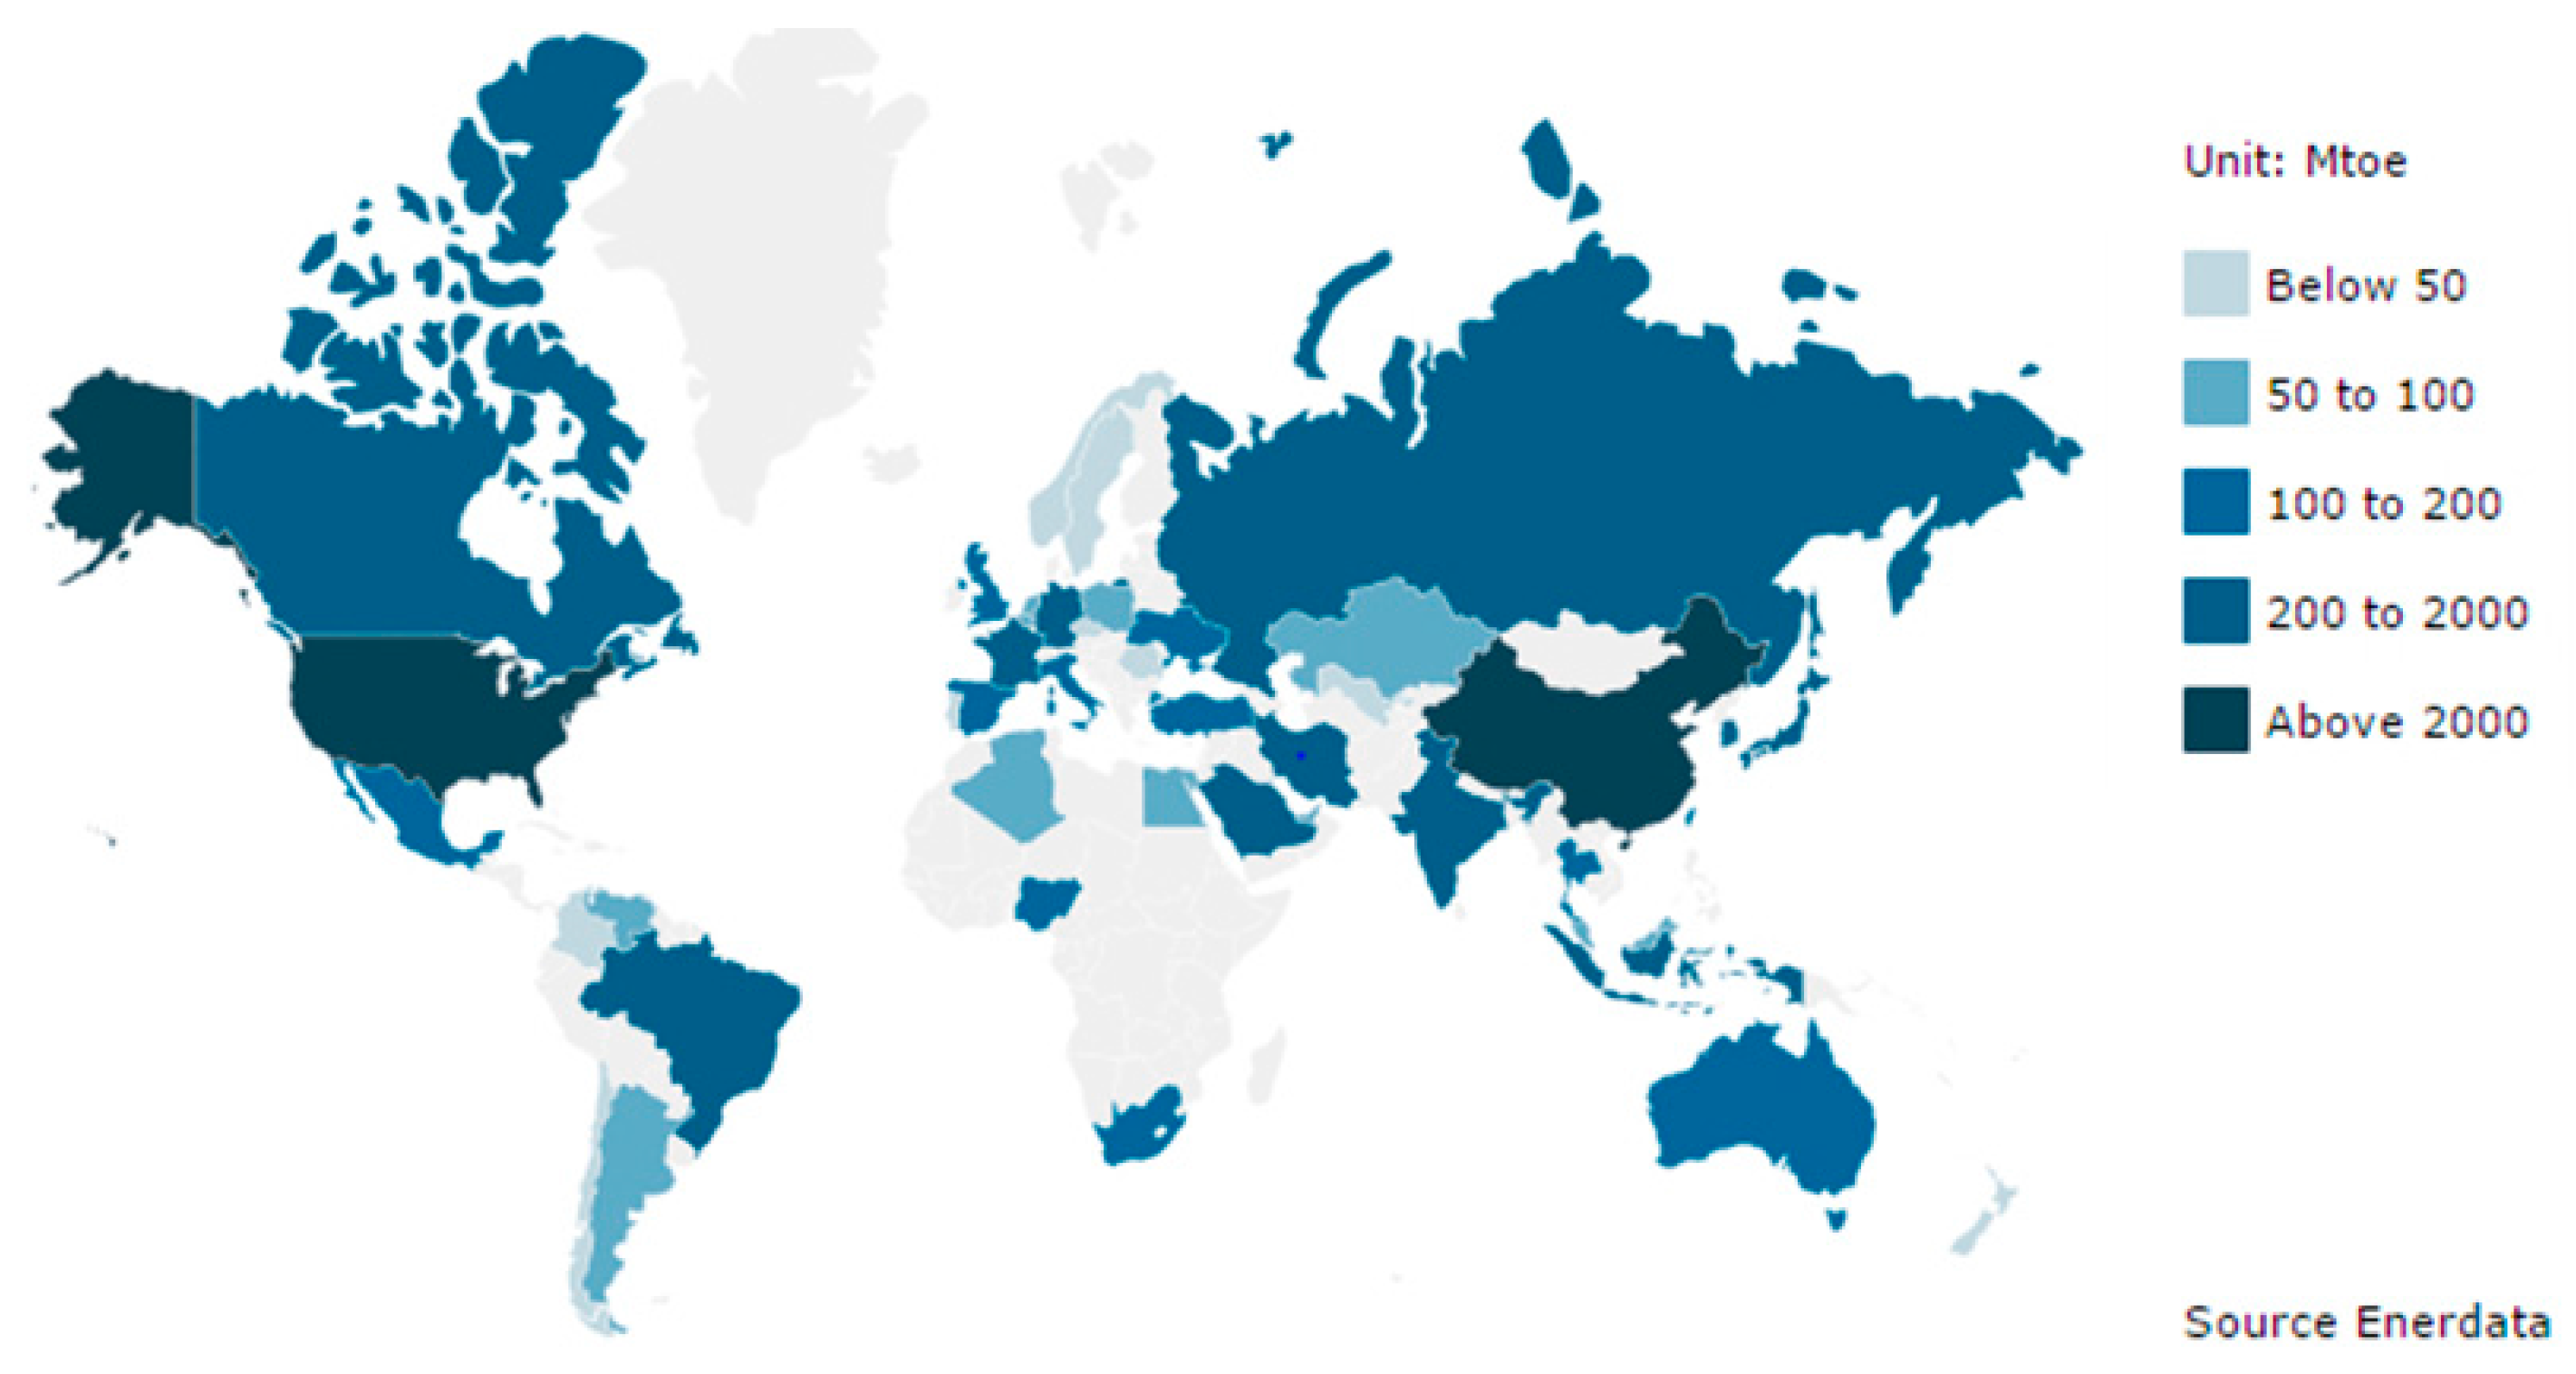
Figure 2.
Primary energy consumption, in Mtoe, from 1980 to 2012. Sources: BP, 2015 and IEA, 2013 [19,20].
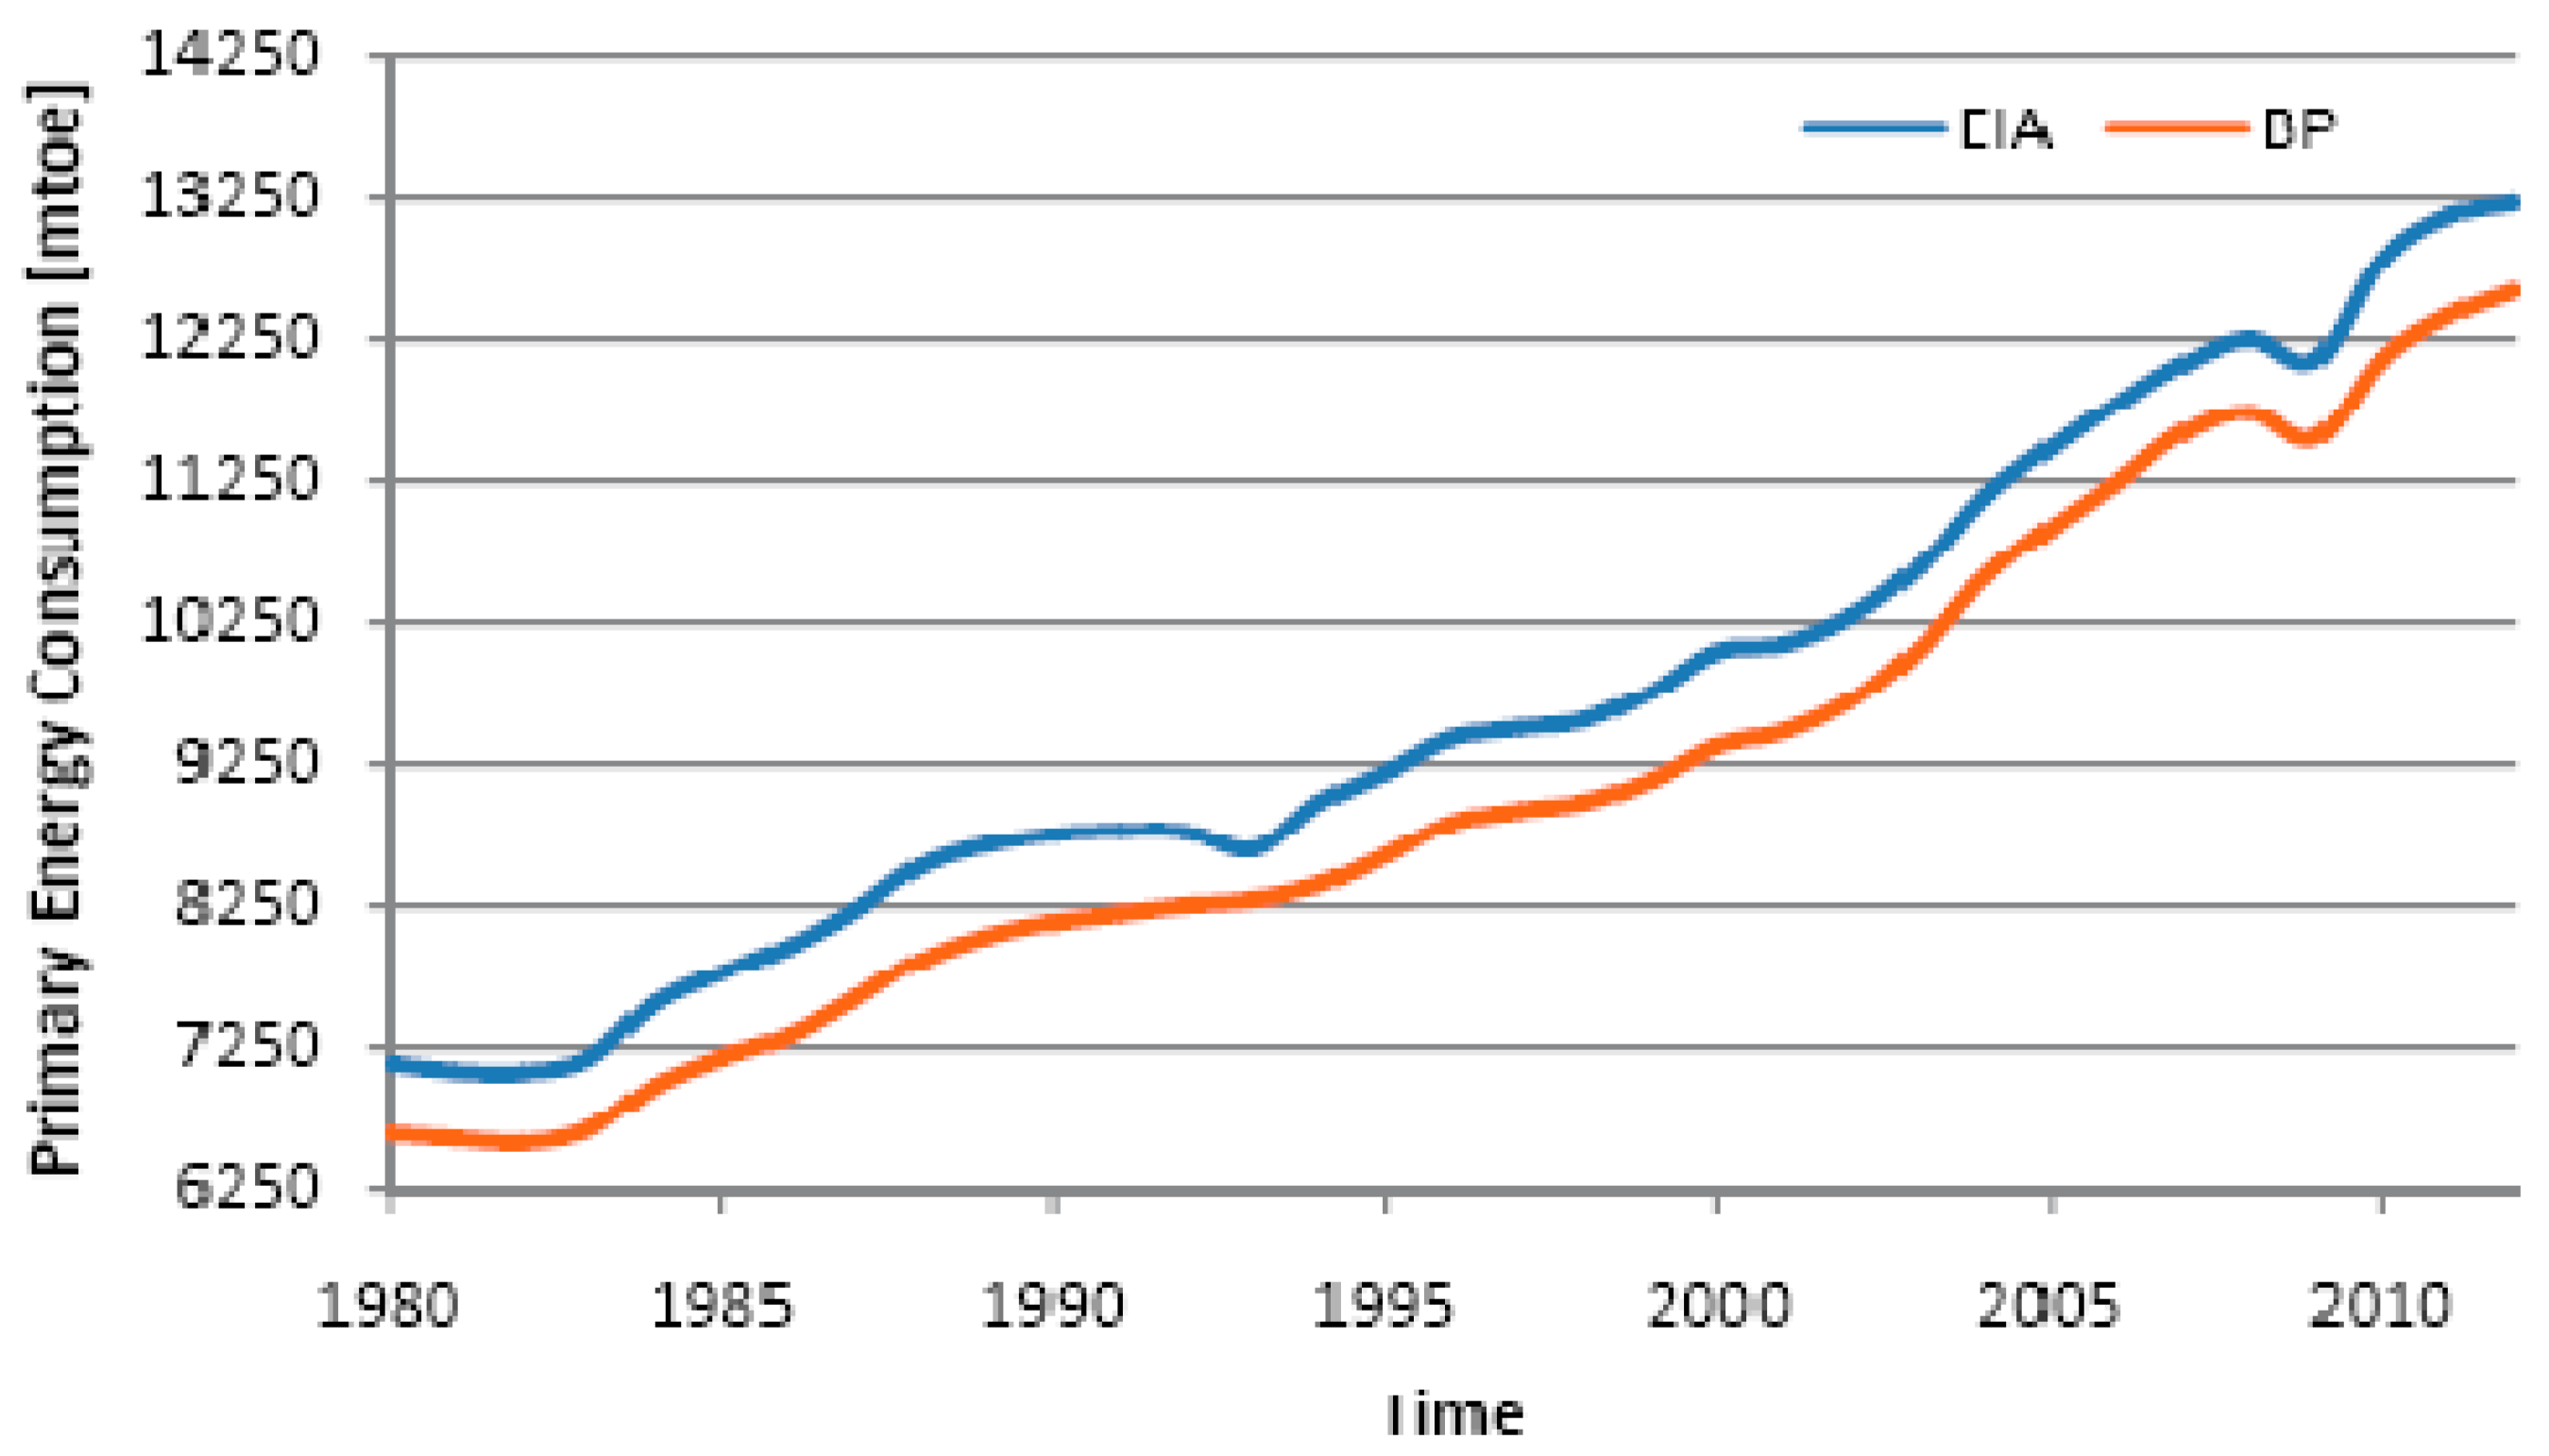

Figure 4.
Energy intensity, expressed in prices and Purchasing Power Parity (PPP). Source: World Bank, 2015 [22].
Figure 4.
Energy intensity, expressed in prices and Purchasing Power Parity (PPP). Source: World Bank, 2015 [22].

Figure 5.
Energy intensity from 1990 to 2012. Source: IEA 2013 [19].
Figure 5.
Energy intensity from 1990 to 2012. Source: IEA 2013 [19].

Figure 6.
Comparison of future energy mix among different scenarios. Source: BP, 2015 [19]; IEA, 2015 [2]; Exxon Mobil, 2014 [28].

Figure 7.
Primary energy demand by fuel in the New Policies Scenario. Source: IEA, 2015 [2].
Figure 7.
Primary energy demand by fuel in the New Policies Scenario. Source: IEA, 2015 [2].
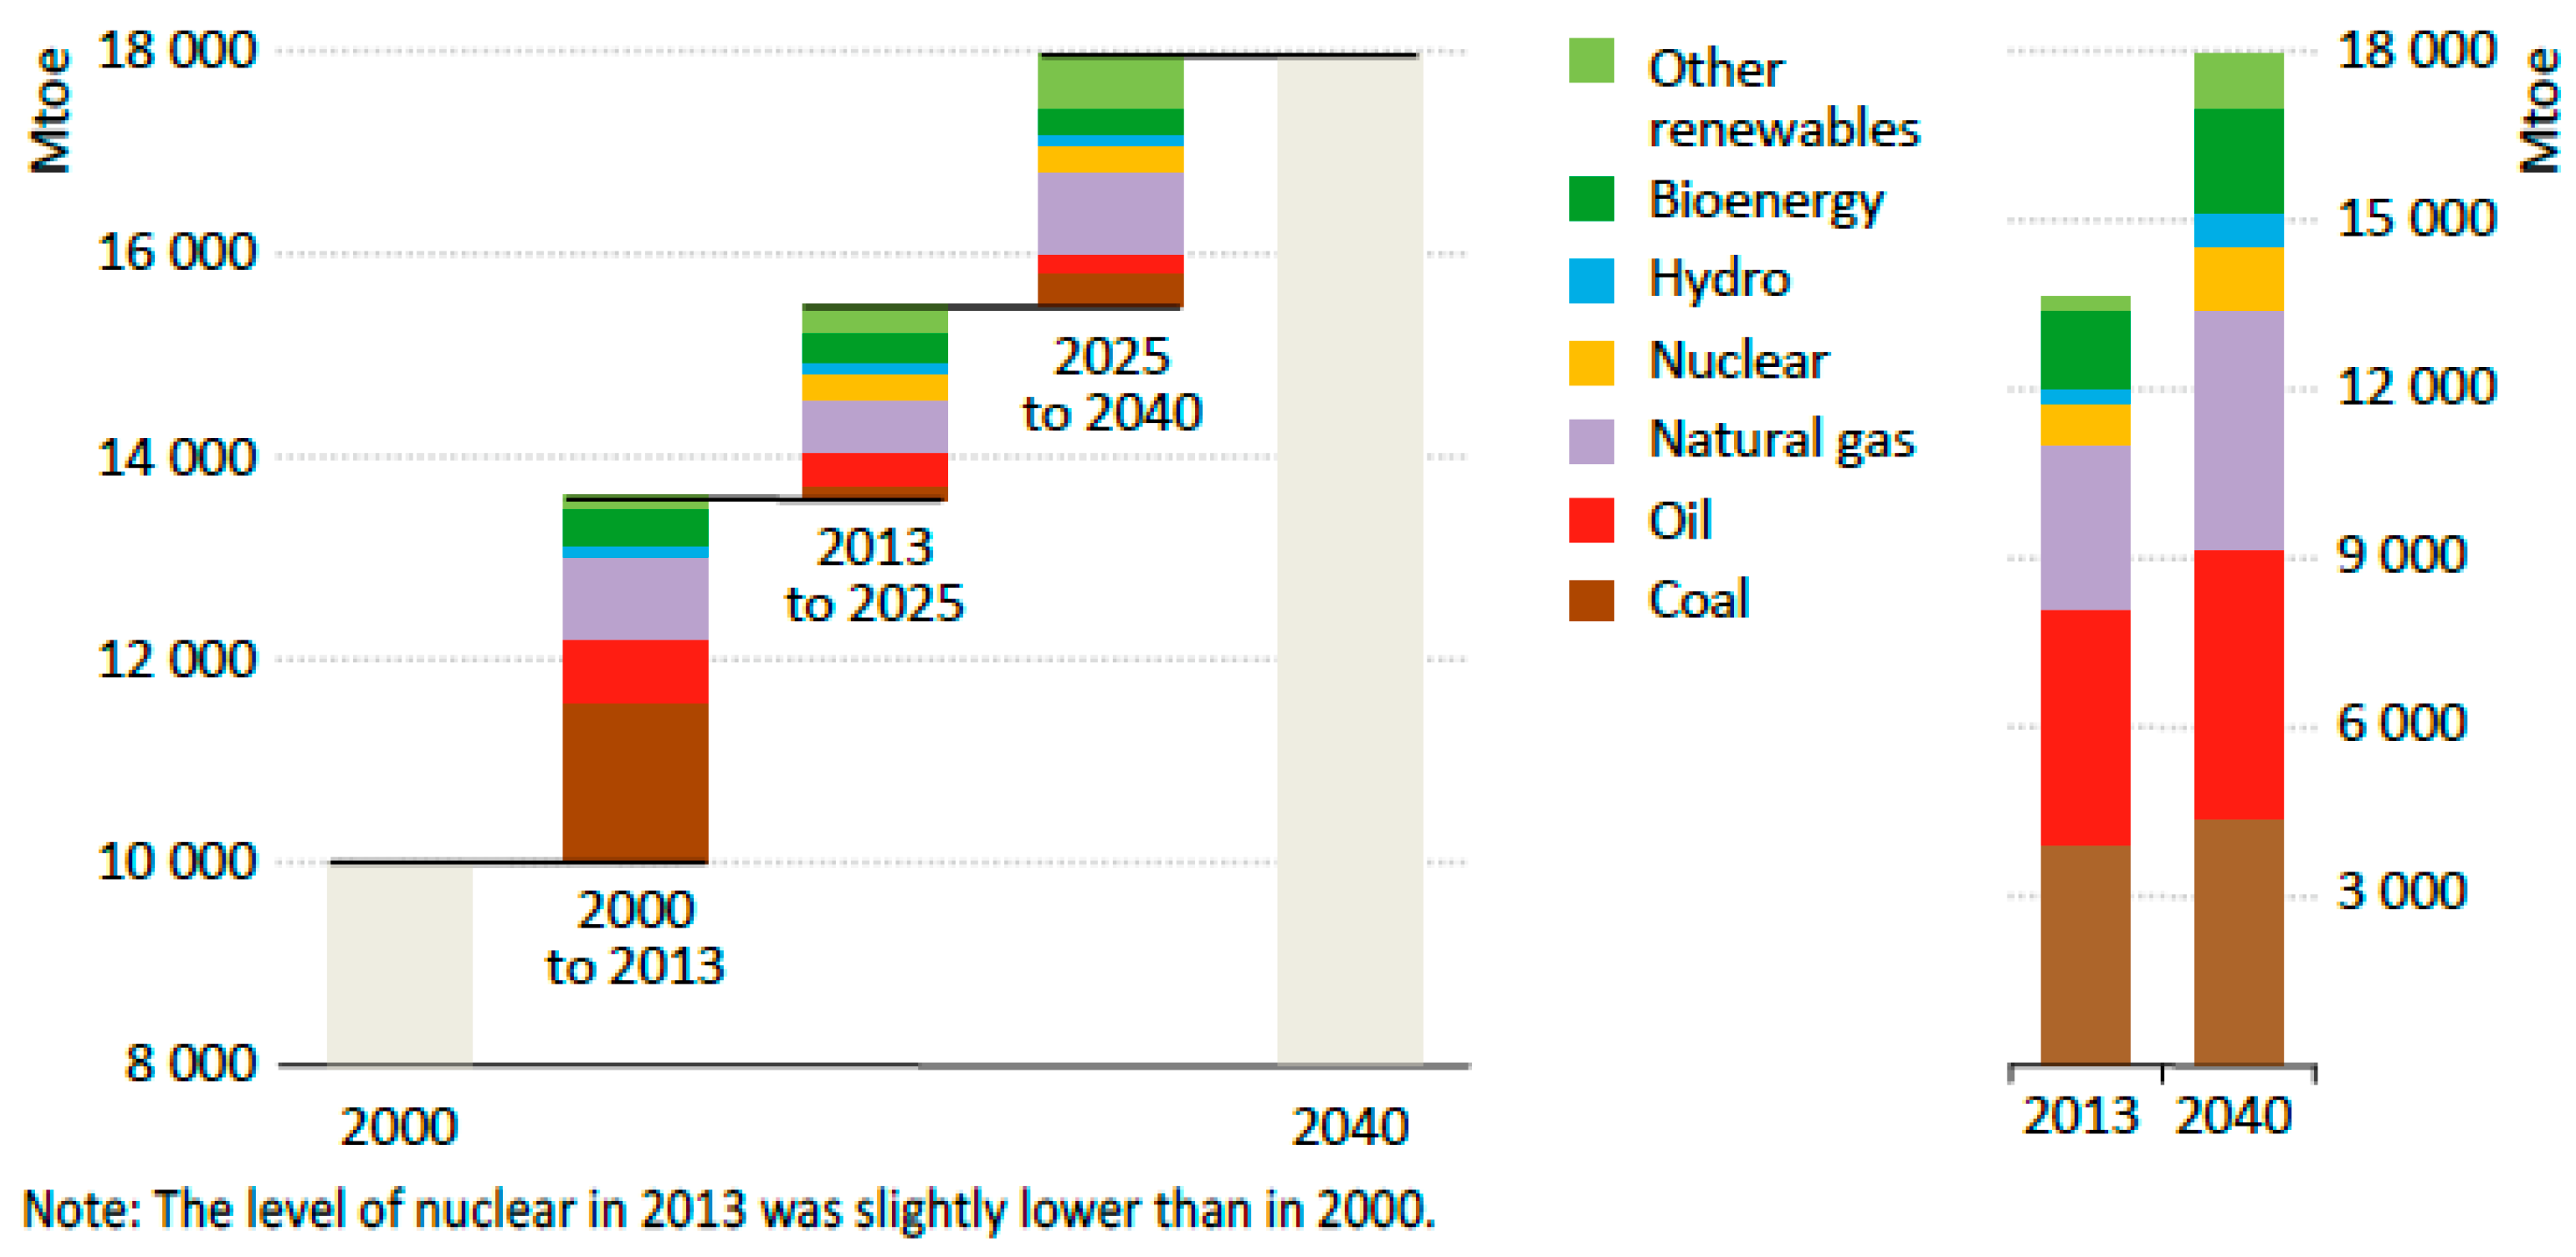
Figure 8.
Energy demand by region in 2014 and 2040 (Mtoe). Source: IEA, 2016 [3].
Figure 8.
Energy demand by region in 2014 and 2040 (Mtoe). Source: IEA, 2016 [3].

Figure 9.
Share of global final energy consumption covered by mandatory energy efficiency regulation. Source: IEA, 2016 [3].
Figure 9.
Share of global final energy consumption covered by mandatory energy efficiency regulation. Source: IEA, 2016 [3].
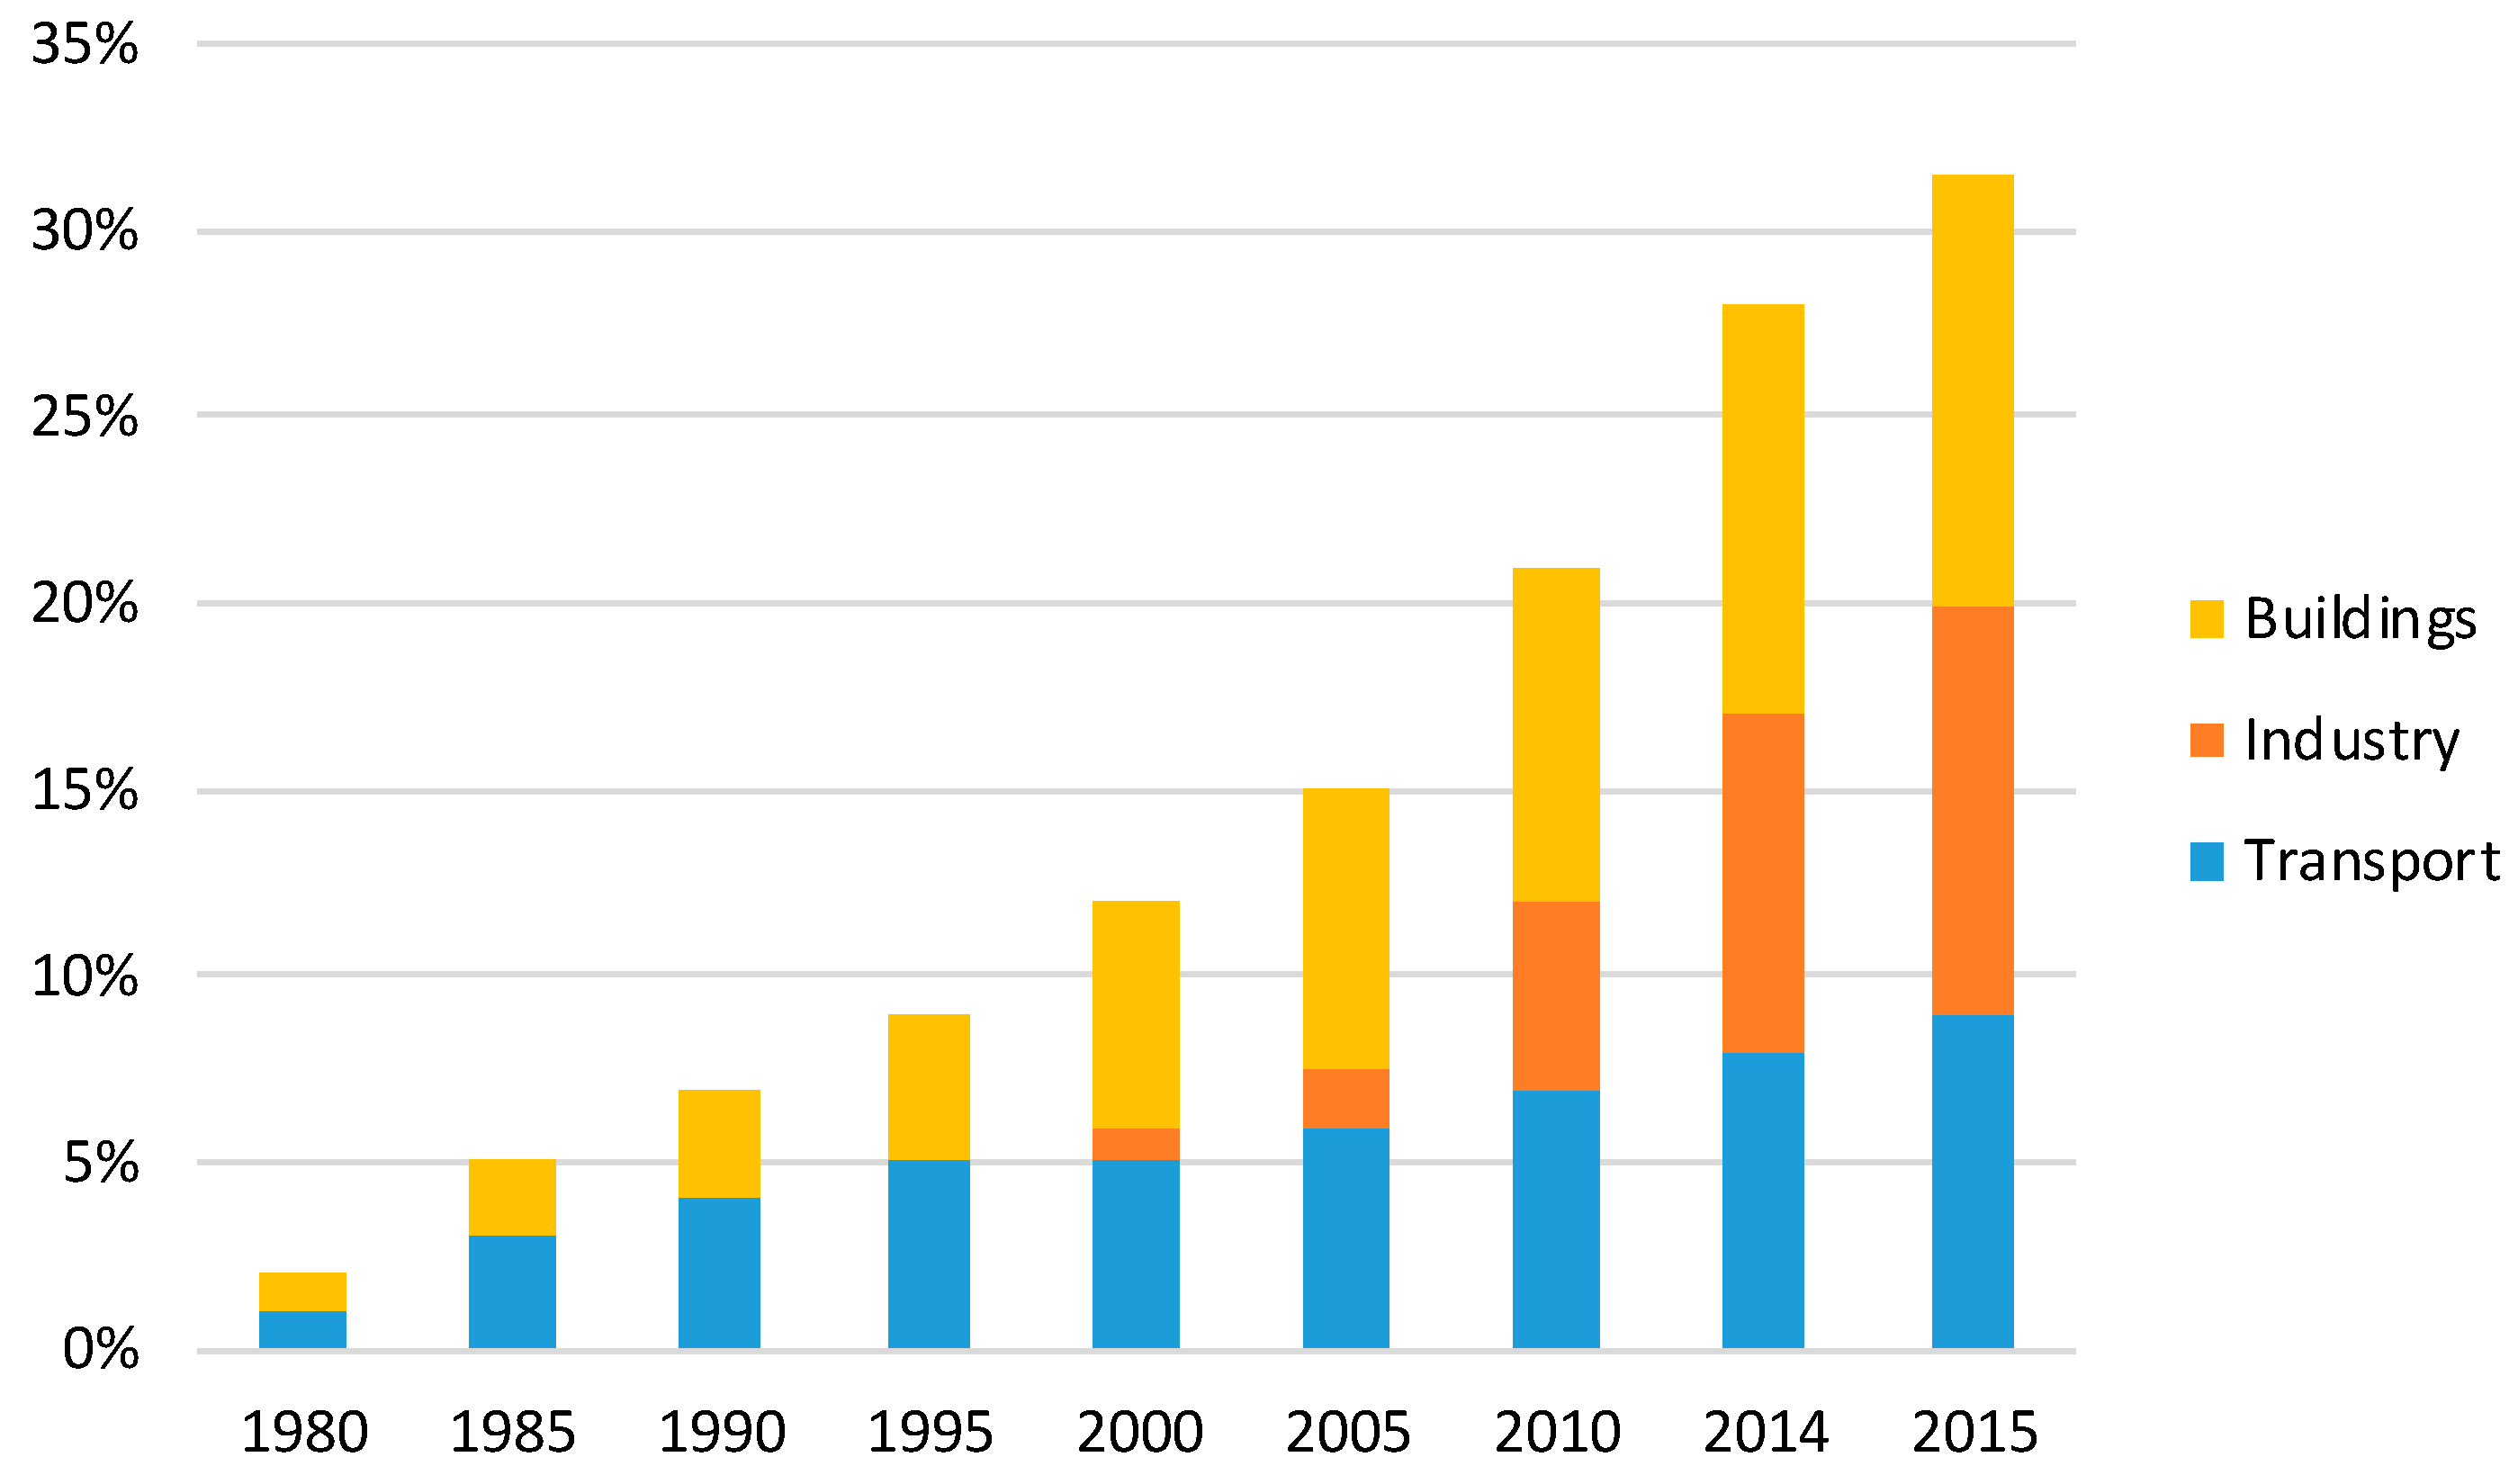
Figure 10.
Investments in energy efficiency by sector. Source: IEA, 2014b [32].
Figure 10.
Investments in energy efficiency by sector. Source: IEA, 2014b [32].
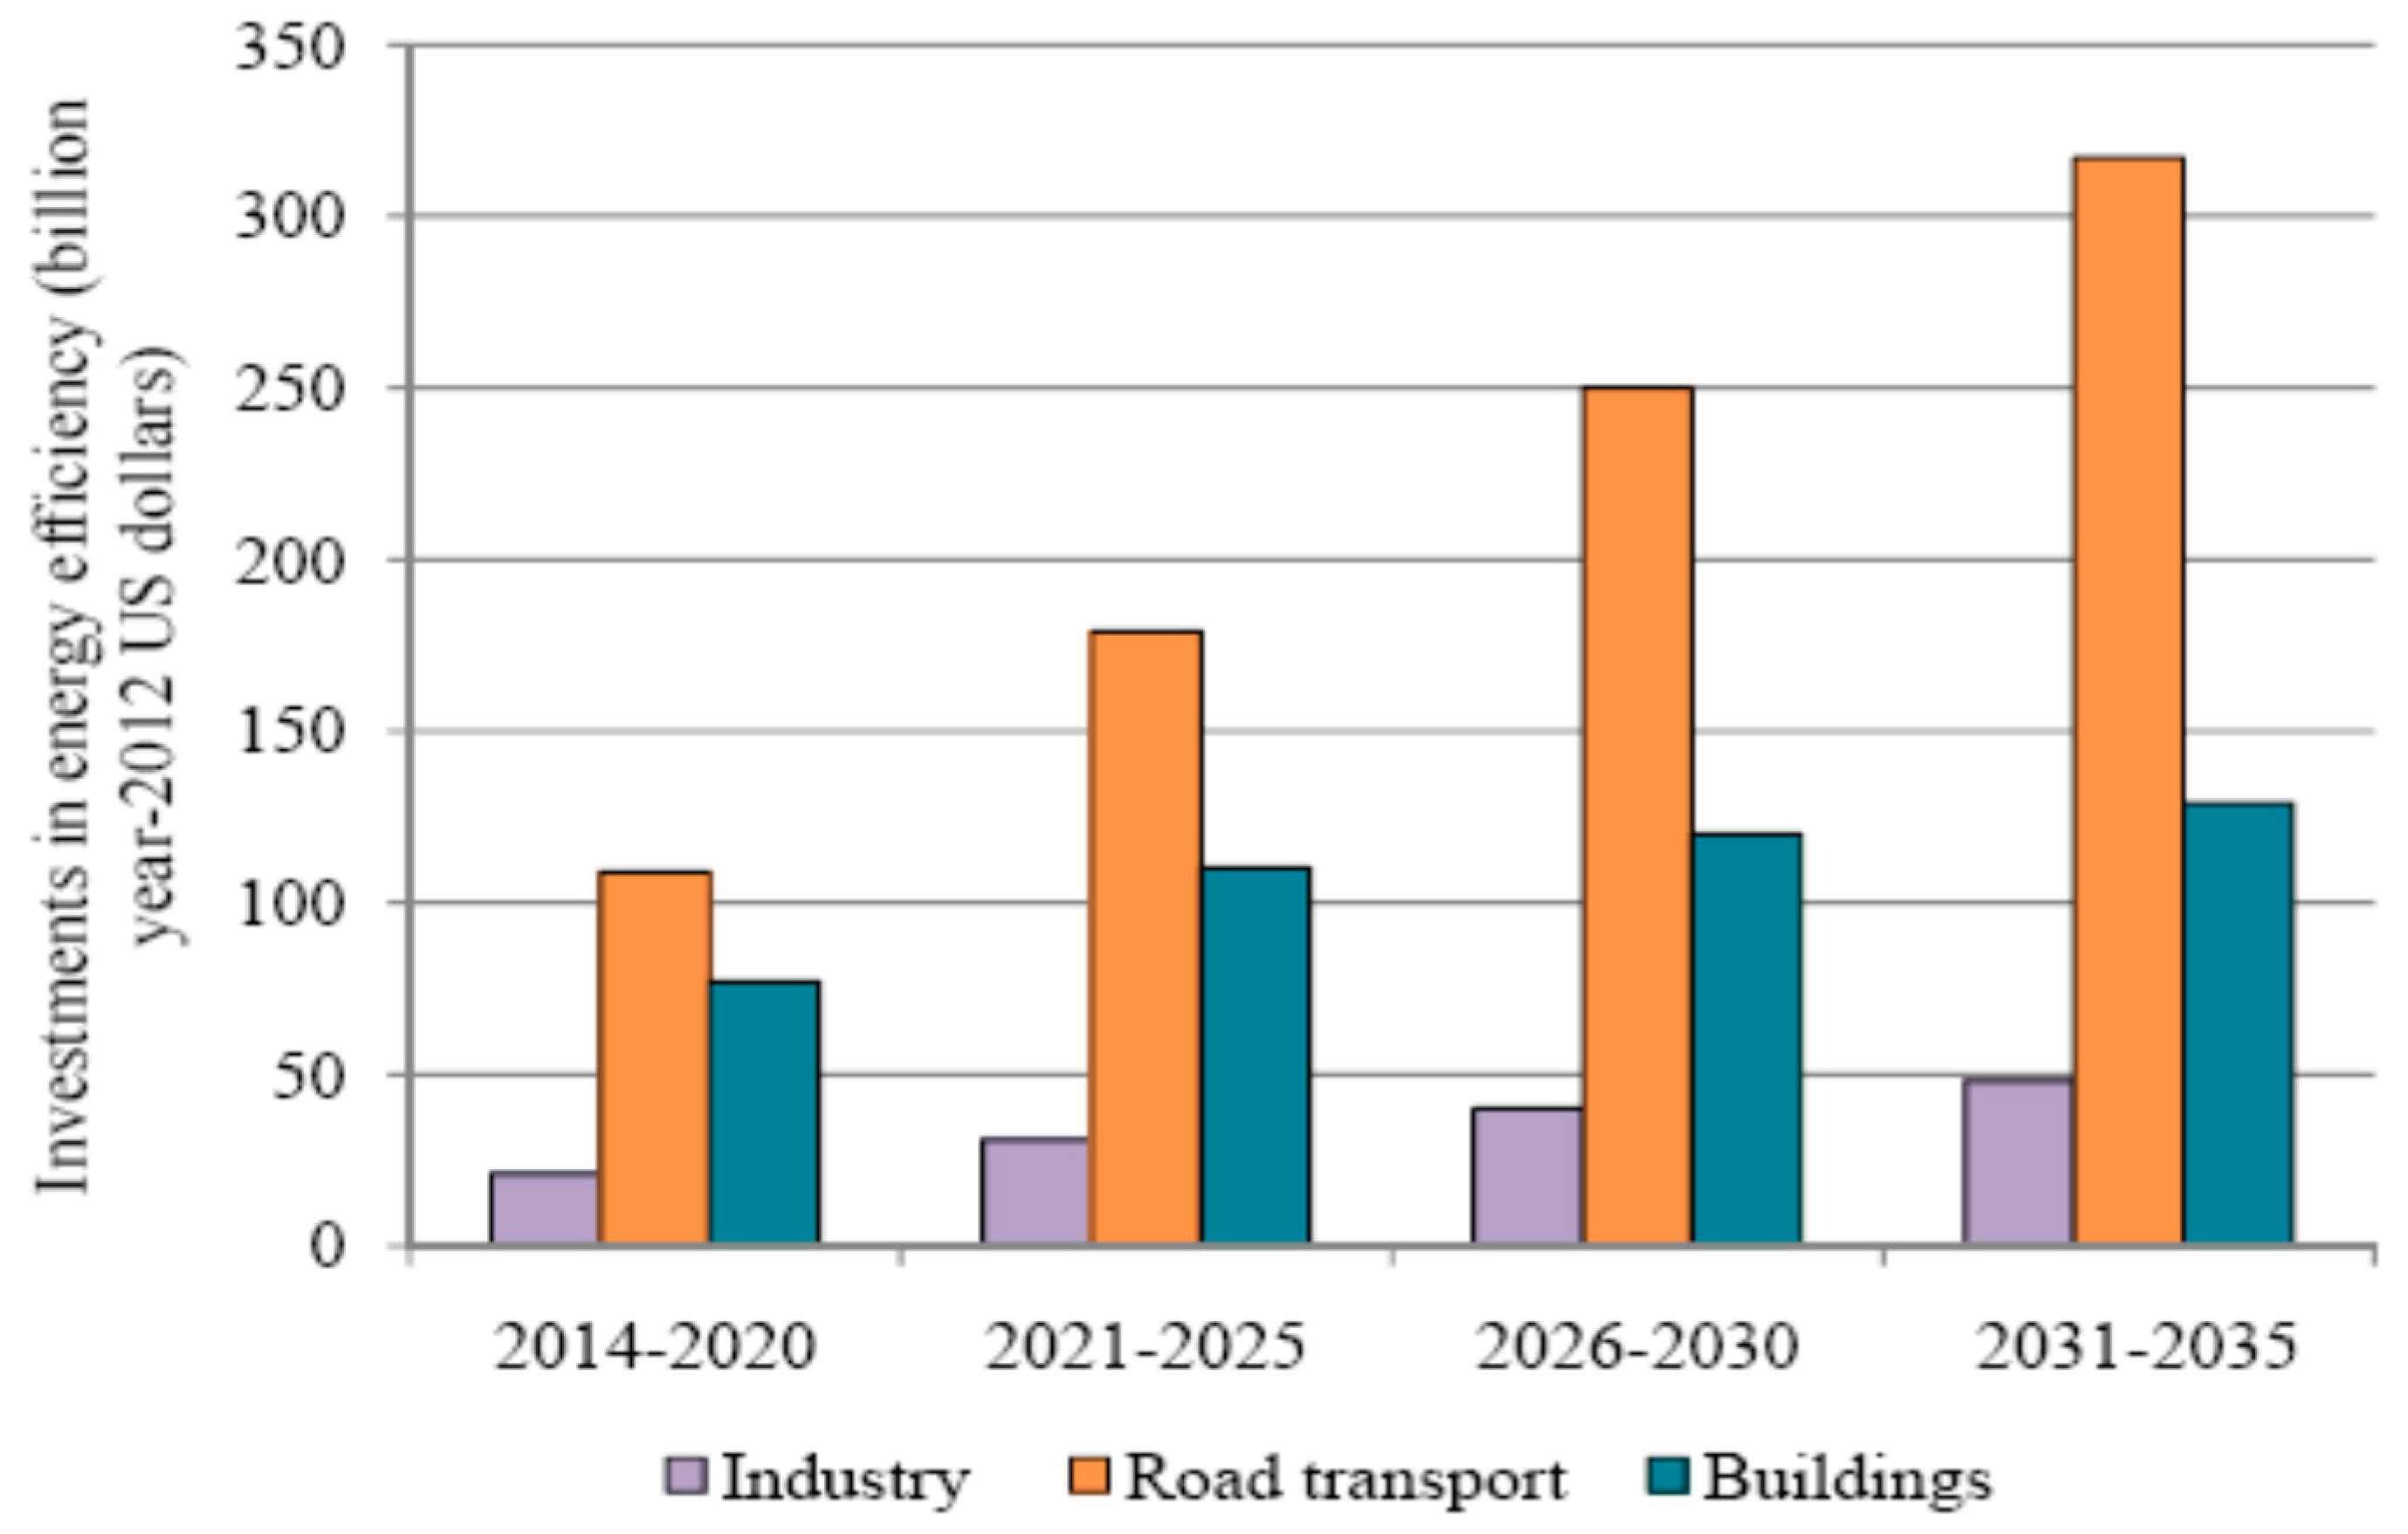
Figure 11.
Change in energy demand in energy-intensive industry in the IEA’s Material Efficiency Scenario. Source: IEA, 2015 [2].
Figure 11.
Change in energy demand in energy-intensive industry in the IEA’s Material Efficiency Scenario. Source: IEA, 2015 [2].

Figure 12.
Number of power reactors at the beginning of 2016. Source: IAEA, 2016 [33].
Figure 12.
Number of power reactors at the beginning of 2016. Source: IAEA, 2016 [33].
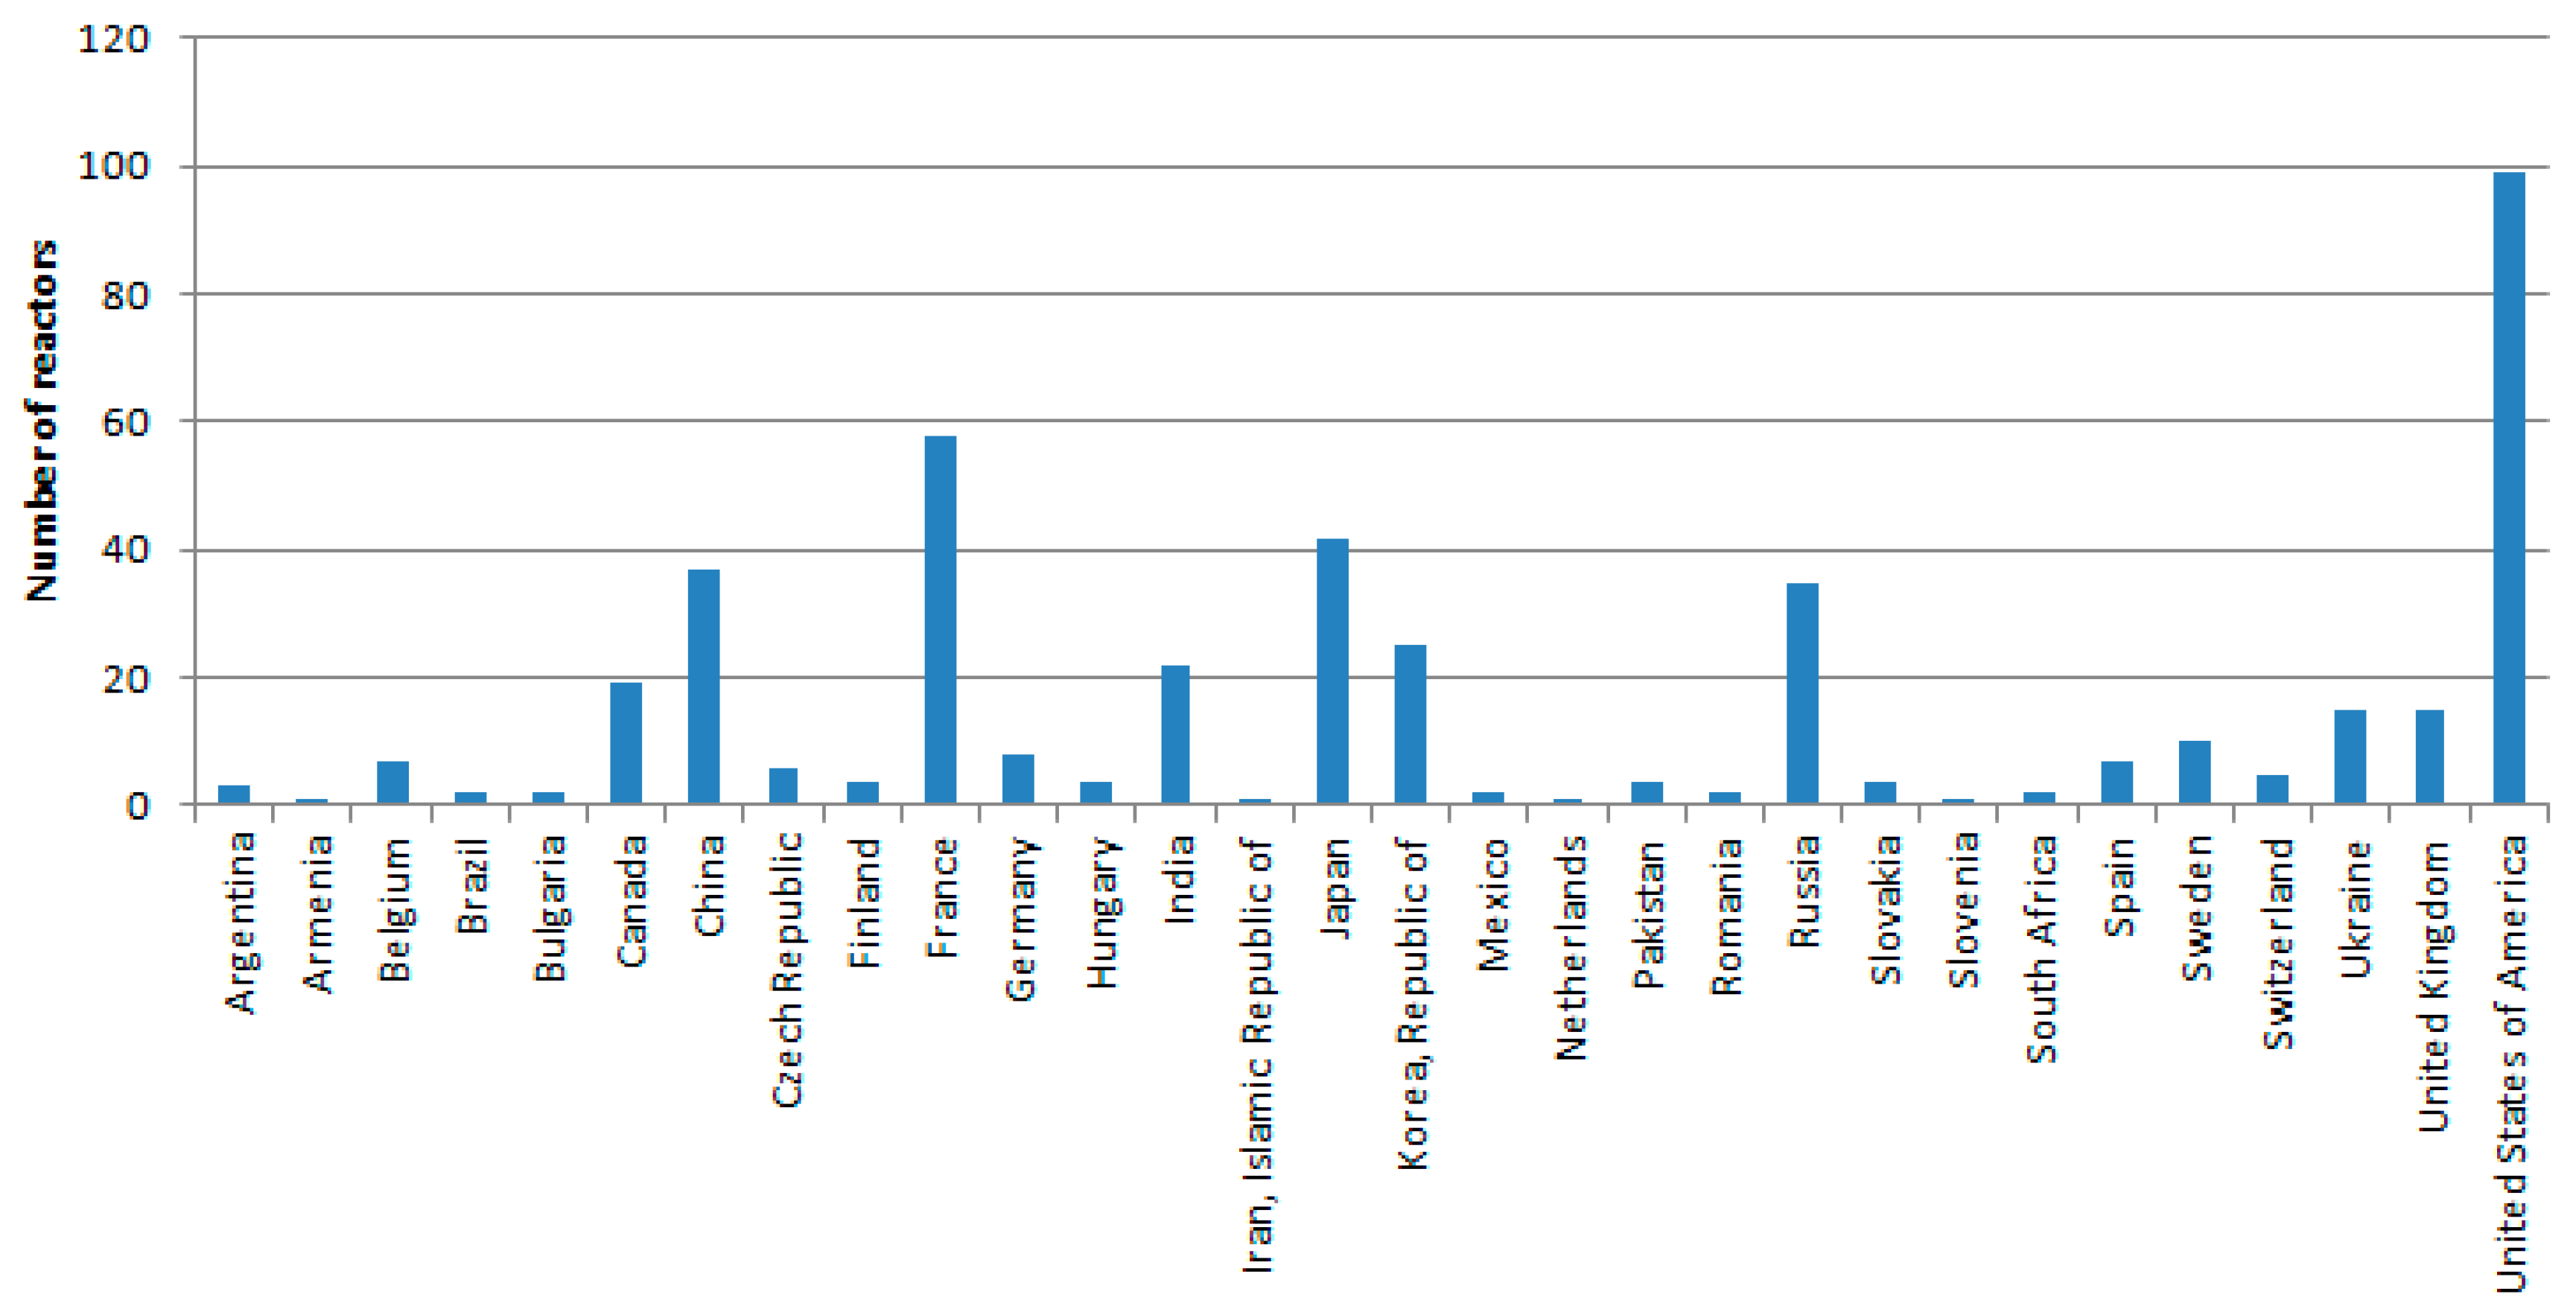
Figure 13.
Variation of nuclear demand over the period 2013–2025 and the period 2025–2040. Source: IEA, 2015 [2].
Figure 13.
Variation of nuclear demand over the period 2013–2025 and the period 2025–2040. Source: IEA, 2015 [2].

Figure 14.
Electricity generation by nuclear, in TWh, by 2030. Source: IAEA, 2015 [30]; IEA, 2015 [2]; IEA, 2014a [1].

Figure 15.
The evolution of installed nuclear capacity by regions during 2013–2040: comparison between IEA’s scenarios. Source: IEA, 2014a [1].
Figure 15.
The evolution of installed nuclear capacity by regions during 2013–2040: comparison between IEA’s scenarios. Source: IEA, 2014a [1].

Figure 16.
Global natural gas production by type in the New Policies Scenario. Source: IEA, 2015 [2].
Figure 16.
Global natural gas production by type in the New Policies Scenario. Source: IEA, 2015 [2].
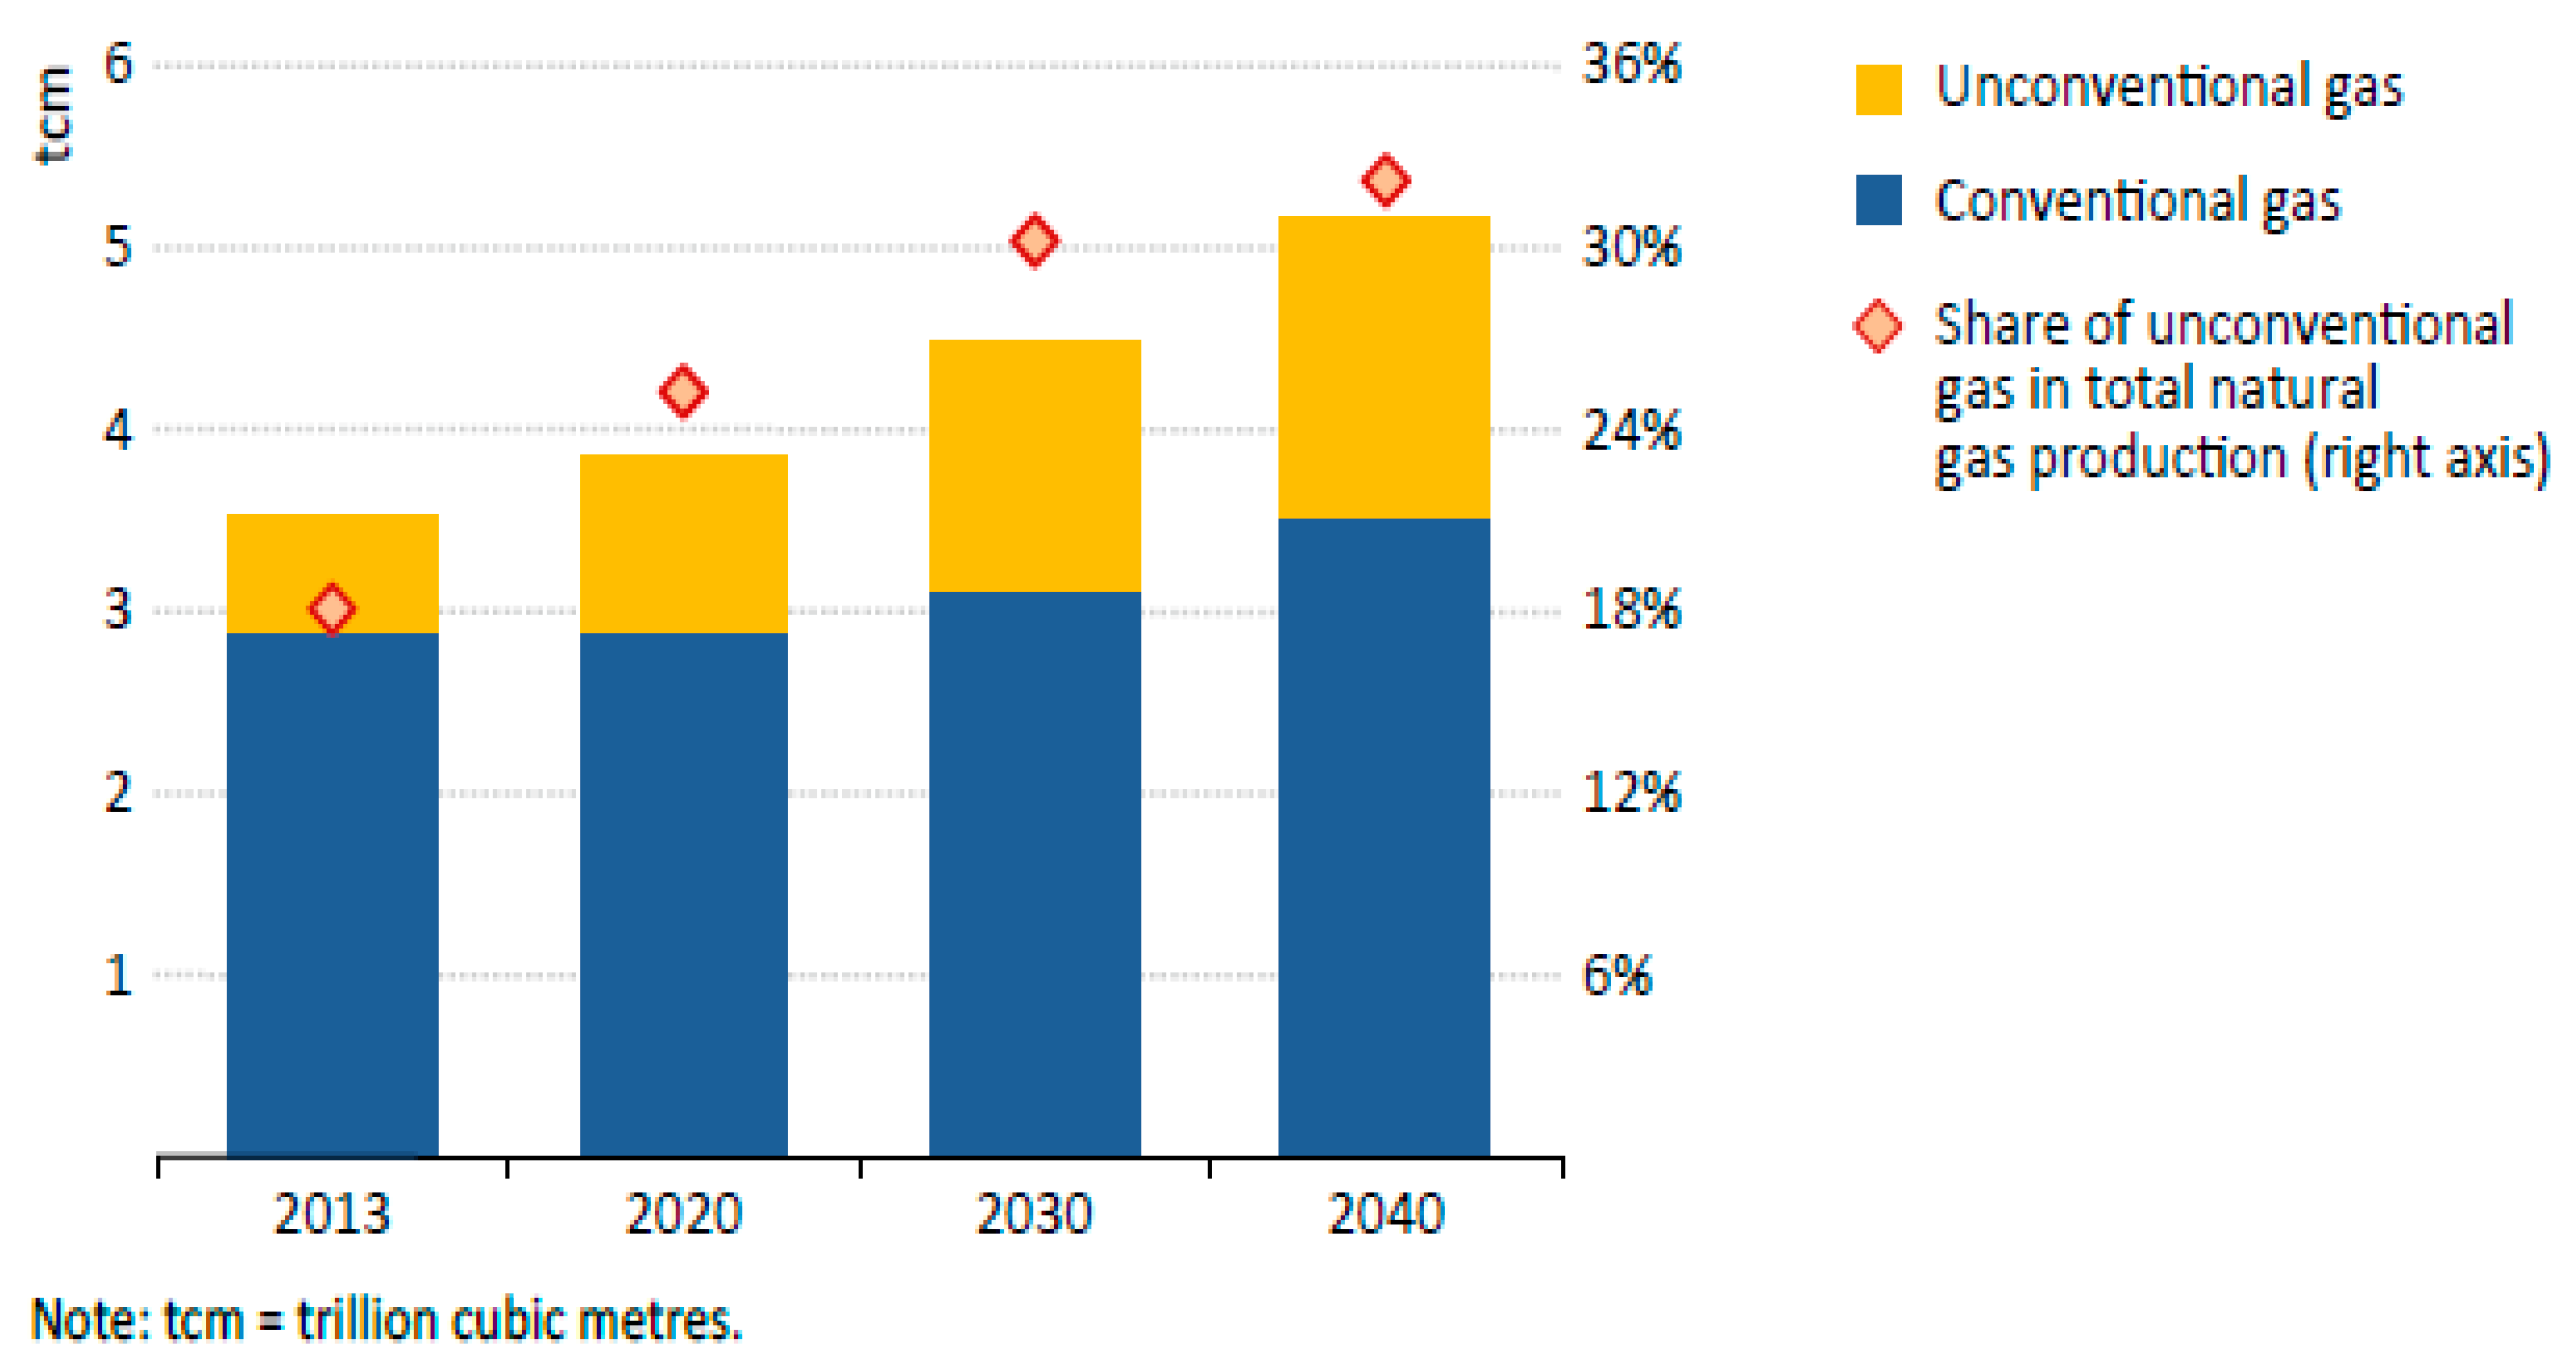
Figure 17.
Unconventional gas production (bcm) in the New Policies Scenario. Source: IEA, 2016 [3].
Figure 17.
Unconventional gas production (bcm) in the New Policies Scenario. Source: IEA, 2016 [3].
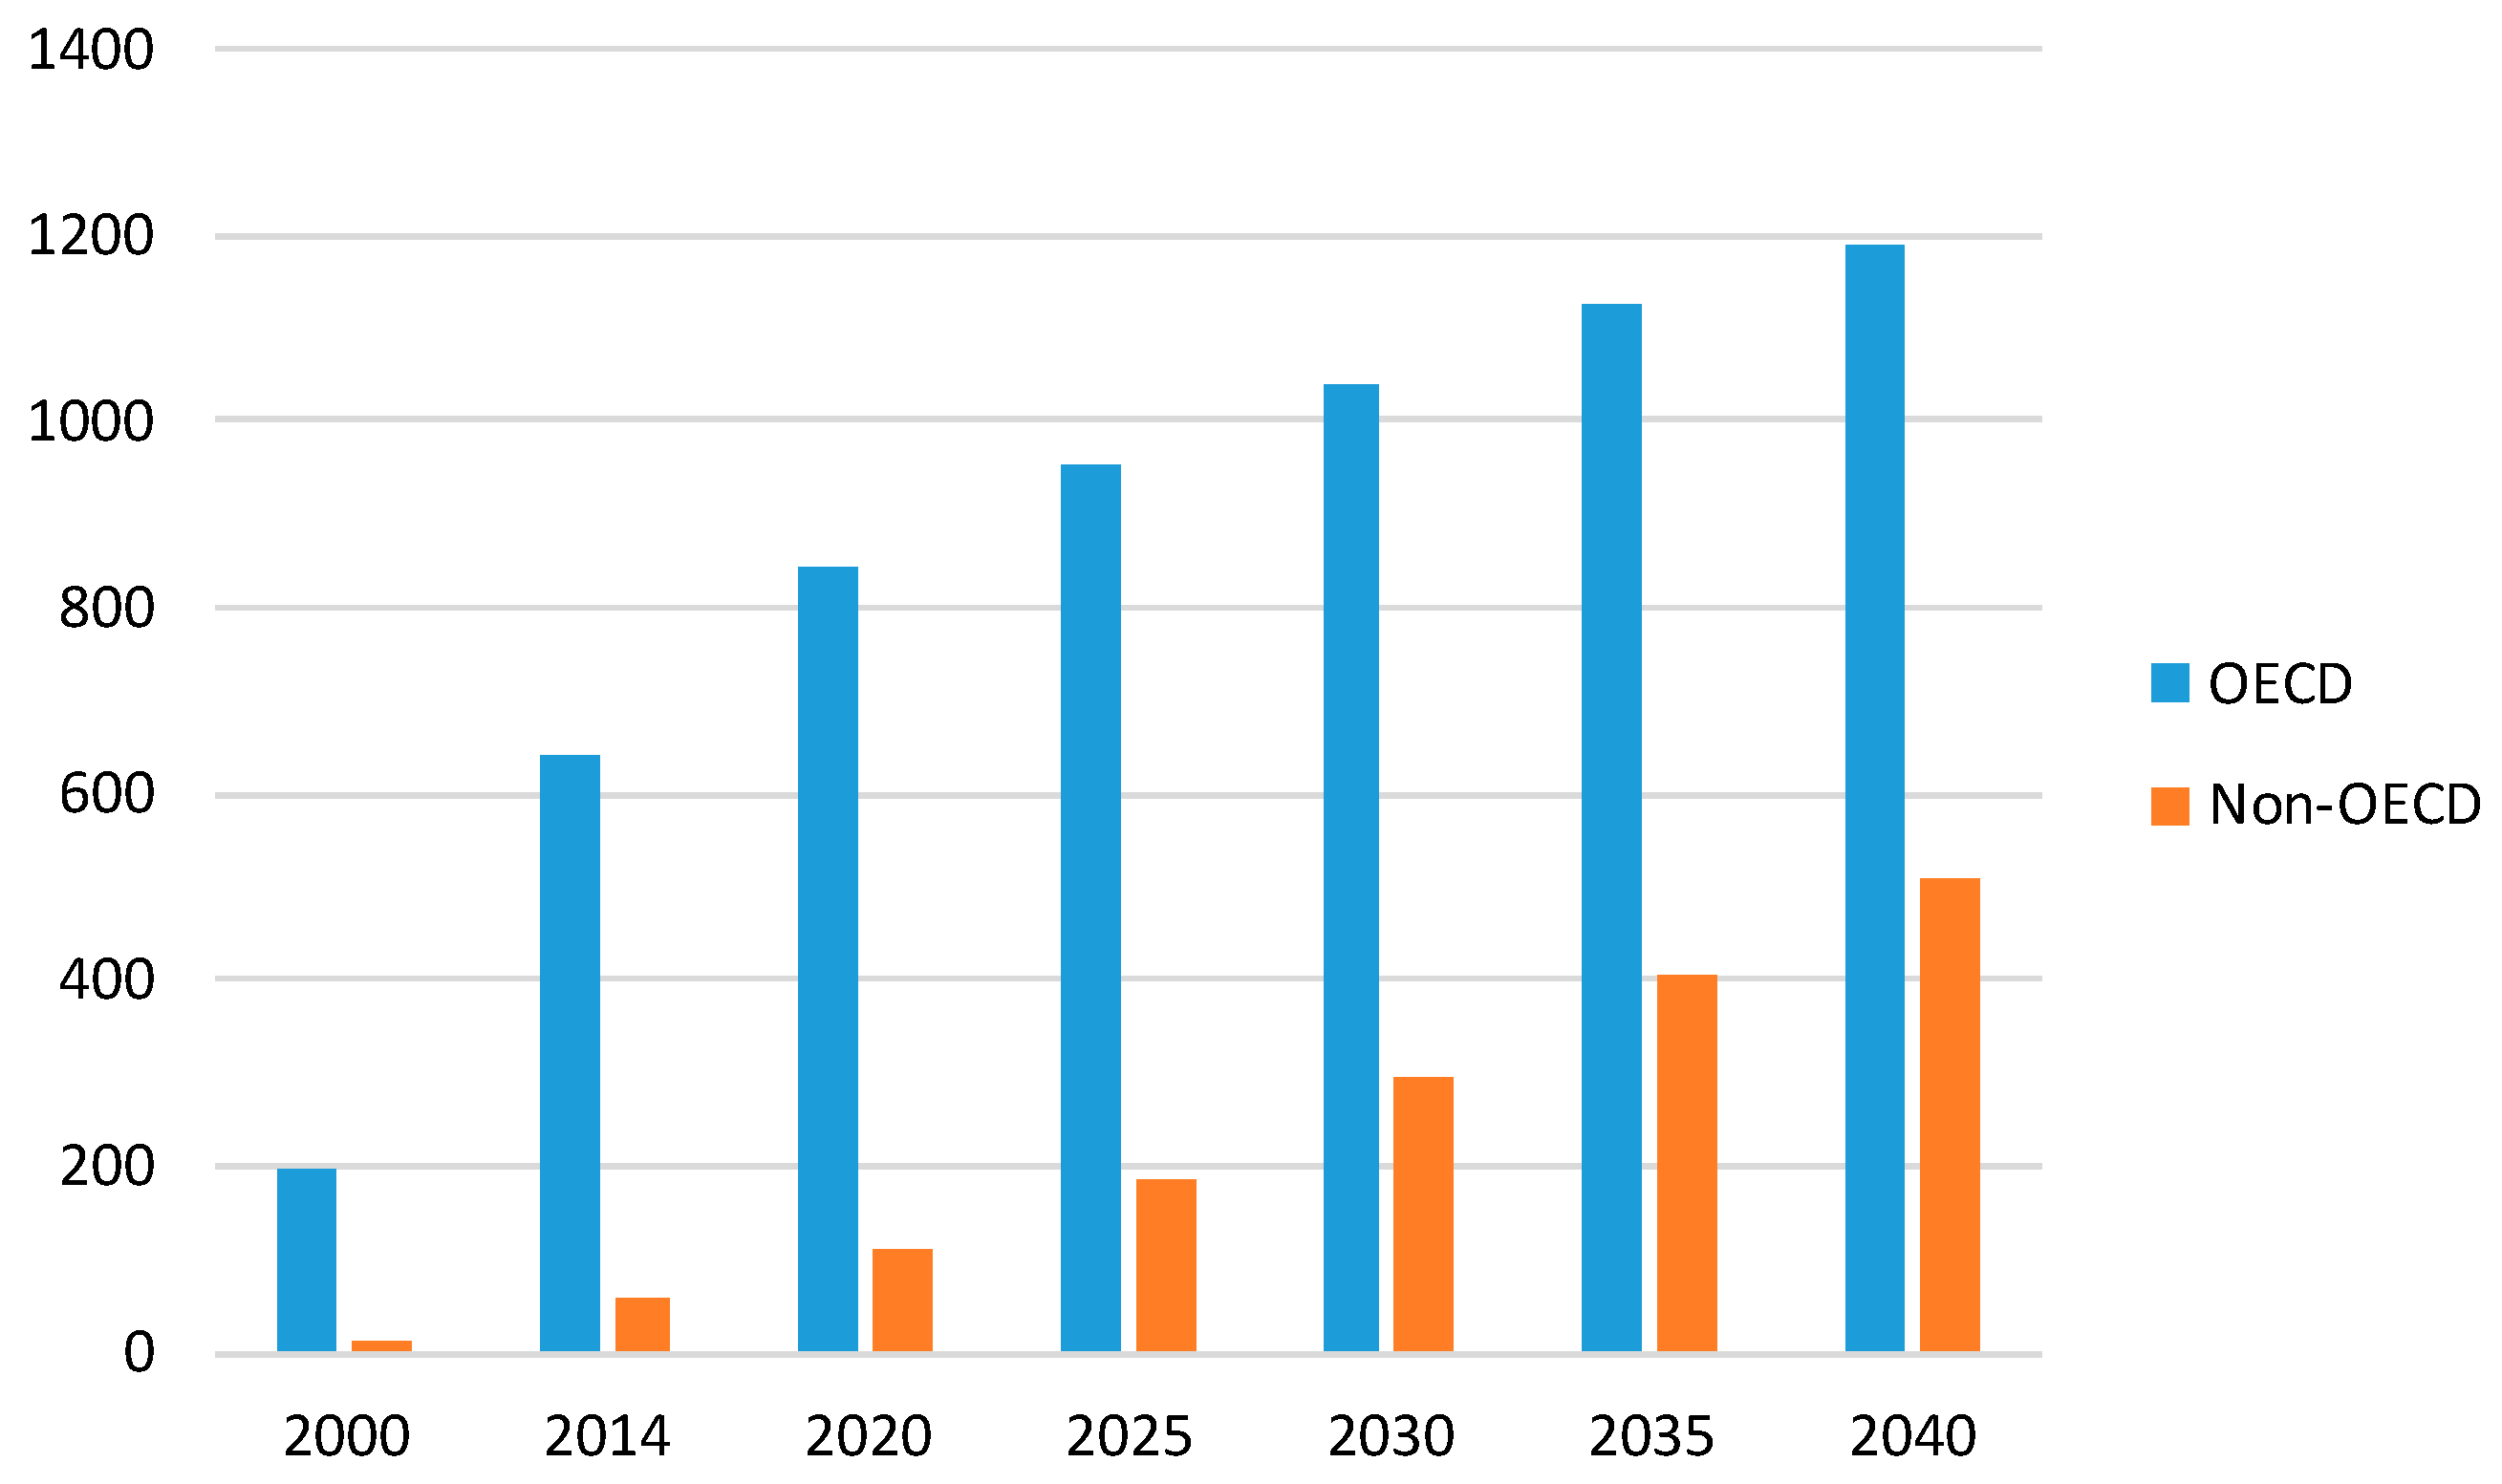
Figure 18.
Upstream investments in: (a) oil; and (b) gas during 2014–2035. Source: IEA, 2015 [2].
Figure 18.
Upstream investments in: (a) oil; and (b) gas during 2014–2035. Source: IEA, 2015 [2].

Figure 19.
Electricity generation by scenario (terawatt-hours) in OECD countries, 2020–2040. Source: IEA, 2015 [2].
Figure 19.
Electricity generation by scenario (terawatt-hours) in OECD countries, 2020–2040. Source: IEA, 2015 [2].

Table 1.
Real GDP growth rate and short- and medium-term projections. Source: IMF, 2015 [17].
Table 1.
Real GDP growth rate and short- and medium-term projections. Source: IMF, 2015 [17].
| Country | Projections | |
|---|---|---|
| 2016 | 2017 | |
| Advanced economies | 3.1 | 3.4 |
| United States | 1.6 | 1.8 |
| Euro Area | 1.6 | 2.2 |
| Germany | 1.7 | 1.5 |
| France | 1.3 | 1.3 |
| Italy | 0.8 | 0.9 |
| Spain | 3.1 | 2.2 |
| Japan | 0.5 | 0.6 |
| United Kingdom | 1.8 | 1.1 |
| Canada | 1.2 | 1.9 |
| Emerging market and developing economies | 4.2 | 4.6 |
| Commonwealth and Independent States | −0.3 | 1.4 |
| Russia | −0.8 | 1.1 |
| Emerging and Developing Asia | 6.5 | 6.3 |
| China | 6.6 | 6.2 |
| India | 7.6 | 7.6 |
| Latin America and the Caribbean | −0.6 | 1.6 |
| Brazil | −3.3 | 0.5 |
| Mexico | 2.1 | 2.3 |
| Middle East, North Africa, Afghanistan | 3.4 | 3.4 |
| Saudi Arabia | 1.2 | 2.0 |
| Sub-Saharan Africa | 1.4 | 2.9 |
| Nigeria | −1.7 | 0.6 |
| South-Africa | 0.1 | 0.8 |
Table 2.
Primary energy demand in the New Policies Scenario, in Mtoe. Source: IEA, 2016 [3].
Table 2.
Primary energy demand in the New Policies Scenario, in Mtoe. Source: IEA, 2016 [3].
| 1990 | 2014 | 2020 | 2025 | 2030 | 2035 | 2040 | |
|---|---|---|---|---|---|---|---|
| OECD | 4526 | 5276 | 5293 | 5215 | 5140 | 5093 | 5077 |
| Americas | 2264 | 2722 | 2734 | 2708 | 2680 | 2674 | 2696 |
| United States | 1915 | 2212 | 2211 | 2176 | 2130 | 2101 | 2094 |
| Europe | 1631 | 1697 | 1690 | 1641 | 1601 | 1568 | 1540 |
| European Union | 1643 | 1563 | 1547 | 1492 | 1441 | 1398 | 1360 |
| Asia Oceania | 631 | 857 | 870 | 866 | 859 | 851 | 842 |
| Japan | 439 | 442 | 424 | 411 | 399 | 389 | 381 |
| Non-OECD | 4045 | 8046 | 8866 | 9664 | 10,535 | 11,406 | 12,178 |
| Eastern Europe/Eurasia | 1539 | 1101 | 1120 | 1152 | 1189 | 1232 | 1271 |
| Russia | 880 | 686 | 683 | 696 | 714 | 737 | 758 |
| Asia | 1578 | 4809 | 5398 | 5930 | 6488 | 7010 | 7437 |
| China | 879 | 3070 | 3328 | 3544 | 3728 | 3855 | 3892 |
| India | 307 | 824 | 1033 | 1225 | 1457 | 1700 | 1938 |
| Middle East | 211 | 715 | 819 | 912 | 1026 | 1142 | 1244 |
| Africa | 390 | 781 | 884 | 979 | 1085 | 1207 | 1336 |
| South Africa | 90 | 147 | 148 | 152 | 158 | 165 | 173 |
| Latin America | 327 | 639 | 646 | 691 | 747 | 815 | 890 |
| Brazil | 138 | 300 | 296 | 317 | 344 | 376 | 408 |
Table 3.
Cumulative global energy supply investment by type in the New Policy Scenario, 2016–2040 ($2015 billion). Source: IEA, 2016 [3].
Table 3.
Cumulative global energy supply investment by type in the New Policy Scenario, 2016–2040 ($2015 billion). Source: IEA, 2016 [3].
| 2010–2015 Per Year | Cumulative | Per Year | |
|---|---|---|---|
| Fossil fuels | 1112 | 26,626 | 1065 |
| Renewables | 283 | 7478 | 299 |
| Electricity networks | 229 | 8059 | 322 |
| Other low-carbon (nuclear and CCS) | 13 | 1446 | 58 |
| Total supply | 1637 | 43,609 | 1744 |
| Energy efficiency | 221 | 22,980 | 919 |
Table 4.
Nuclear share in electricity generation in 2040.
| Countries | Nuclear Share |
|---|---|
| World | 12% |
| Non-OECD | 8% |
| China | 21% |
| India | 7% |
| Russia | 25% |
| OECD | 19% |
| Japan | 21% |
| USA | 19% |
| European Union | 23% |
Table 5.
Investments in nuclear in the period 2015–2040.
| Cumulative Investments 2015–2040 (Billion 2014 Dollar) | |
|---|---|
| World | 1495 |
| OECD | 703 |
| United States | 257 |
| Europe | 299 |
| Asia Oceania | 132 |
| Japan | 36 |
| Non-OECD | 792 |
| Russia | 150 |
| China | 329 |
| India | 96 |
| Middle East | 53 |
| Latin America | 25 |
| Africa | 27 |
Table 6.
The current gas market, in bcm. Source: World Energy Outlook 2016 [3].
Table 6.
The current gas market, in bcm. Source: World Energy Outlook 2016 [3].
| Country | Conventional Gas | Tight Gas | Shale Gas | Coalbed Methane |
|---|---|---|---|---|
| OECD | 78 | 24 | 81 | 16 |
| Americas | 51 | 11 | 55 | 7 |
| Europe | 17 | 4 | 13 | 2 |
| Asia Oceania | 10 | 8 | 13 | 8 |
| Non-OECD | 356 | 57 | 138 | 34 |
| Eastern Europe and Eurasia | 138 | 11 | 15 | 20 |
| Middle East | 104 | 9 | 4 | n.a. (*) |
| Africa | 51 | 10 | 39 | 0 |
| Latina America | 28 | 15 | 40 | n.a. (*) |
| World | 434 | 81 | 218 | 50 |
(*) n.a. = not available.
Table 7.
The current oil market, in billion barrels. Source: World Energy Outlook 2015 [2].
Table 7.
The current oil market, in billion barrels. Source: World Energy Outlook 2015 [2].
| Country | Crude Oil | EHOB | Kerogen Oil | Coalbed Methane |
|---|---|---|---|---|
| OECD | 320 | 809 | 1016 | |
| North America | 250 | 806 | 1000 | 83 |
| Europe | 60 | 3 | 4 | 17 |
| Asia Oceania | 10 | n.a. (*) | 12 | 18 |
| Non-OECD | 1908 | 1068 | 57 | 230 |
| Eastern Europe and Eurasia | 265 | 552 | 20 | 78 |
| Middle East | 651 | 14 | 30 | 0 |
| Africa | 320 | 2 | n.a. (*) | 38 |
| Latina America | 244 | 497 | 3 | 57 |
(*) n.a. = not available.
Table 8.
World RES use by type and scenario (Mtoe). Source: IEA, 2016 [3].
Table 8.
World RES use by type and scenario (Mtoe). Source: IEA, 2016 [3].
| New Policy Scenario | Current Policy Scenario | 450 Scenario | |||||
|---|---|---|---|---|---|---|---|
| 2013 | 2025 | 2040 | 2025 | 2040 | 2025 | 2040 | |
| Primary energy demand (Mtoe) | 1161 | 1786 | 2837 | 1705 | 2528 | 2017 | 4049 |
| Share of global total primary energy demand | 8% | 12% | 16% | 11% | 13% | 14% | 27% |
| Electricity generation (TWh) | 5383 | 8960 | 14,271 | 8384 | 12,305 | 9890 | 19,883 |
| Bioenergy | 495 | 785 | 1353 | 754 | 1151 | 843 | 1899 |
| Hydropower | 3894 | 4887 | 6230 | 4817 | 5984 | 4994 | 6891 |
| Wind | 717 | 2118 | 3881 | 1859 | 3132 | 2575 | 6127 |
| Geothermal | 77 | 150 | 361 | 141 | 299 | 181 | 548 |
| Solar photovoltaic | 190 | 953 | 2137 | 761 | 1539 | 1153 | 3209 |
| Concentrating solar power | 9 | 61 | 254 | 49 | 170 | 137 | 1118 |
| Marine | 1 | 6 | 54 | 3 | 30 | 7 | 92 |
| Share of total generation | 23% | 30% | 37% | 27% | 29% | 36% | 58% |
| Heat consumption (Mtoe) * | 436 | 611 | 920 | 597 | 862 | 665 | 1168 |
| Industry | 221 | 296 | 434 | 296 | 432 | 316 | 527 |
| Buildings and agriculture | 215 | 315 | 485 | 300 | 430 | 349 | 641 |
| Share of total heat demand | 9% | 11% | 15% | 11% | 13% | 13% | 22% |
| Biofuels (mboe/d **) | 1.6 | 2.5 | 4.2 | 2.2 | 3.6 | 4.0 | 9.0 |
| Share of total transport fuels | 3% | 4% | 6% | 3% | 4% | 7% | 18% |
| Aviation | - | 0.02 | 0.1 | 0.02 | 0.1 | 0.4 | 1.8 |
| Share of total transport | 3% | 4% | 6% | 4% | 5% | 7% | 18% |
| Traditional biomass (Mtoe) | 759 | 722 | 600 | 727 | 611 | 711 | 574 |
| Share of total bioenergy | 55% | 44% | 32% | 45% | 33% | 41% | 25% |
| Share of RES energy demand | 41% | 29% | 18% | 30% | 20% | 26% | 13% |
| Traditional biomass (Mtoe) | 759 | 722 | 600 | 727 | 611 | 711 | 574 |
| Share of total bioenergy | 55% | 44% | 32% | 45% | 33% | 41% | 25% |
| Share of RES energy demand | 41% | 29% | 18% | 30% | 20% | 26% | 13% |
* excludes traditional biomass; ** million barrels of oil equivalent per day.
Table 9.
Estimated learning rates. Source: Azevedo et al., 2013 [48].
Table 9.
Estimated learning rates. Source: Azevedo et al., 2013 [48].
| Technology | Range of Learning Rates | Time Period |
|---|---|---|
| Coal | 5.6–12% | 1902–2006 |
| Natural Gas | 0.65–5.3% | 1980–1998 |
| Nuclear | 0–6% | 1975–1993 |
| Wind (on-shore) | −3–32% | 1980–2010 |
| Solar PV | 10–53% | 1959–2001 |
| Biomass production | 12–45% | 1971–2006 |
| Biopower generation | 0–24% | 1976–2005 |
| Hydropower | 0.5–11.4% | 1980–2001 |
Table 10.
CO2 emissions in the New Policy Scenario. Source: IEA, 2016 [3].
Table 10.
CO2 emissions in the New Policy Scenario. Source: IEA, 2016 [3].
| CO2 Emissions (Mt) | Shares (%) | CAAGR (%) | ||||||||
|---|---|---|---|---|---|---|---|---|---|---|
| 1990 | 2014 | 2020 | 2025 | 2030 | 2035 | 2040 | 2014 | 2040 | 2014–2040 | |
| Total CO2 | 20,448 | 32,175 | 32,795 | 33,596 | 34,485 | 35,452 | 36,290 | 100 | 100 | 0.5 |
| Coal | 8280 | 14,868 | 14,561 | 14,661 | 14,841 | 14,939 | 14,975 | 46 | 41 | 0.0 |
| Oil | 8492 | 10,995 | 11,334 | 11,496 | 11,570 | 11,747 | 11,926 | 34 | 33 | 0.3 |
| Gas | 3676 | 6351 | 6900 | 7439 | 8075 | 8766 | 9389 | 20 | 26 | 1.5 |
| Power generation | 7599 | 13,496 | 13,194 | 13,353 | 13,657 | 14,037 | 14,351 | 100 | 100 | 0.2 |
| Coal | 4995 | 9899 | 9598 | 9648 | 9792 | 9911 | 9992 | 73 | 70 | 0.0 |
| Oil | 1237 | 868 | 730 | 643 | 556 | 512 | 481 | 6 | 3 | −2.2 |
| Gas | 1367 | 2729 | 2866 | 3062 | 3309 | 3614 | 3879 | 20 | 27 | 1.4 |
| Total final consumption * | 11,879 | 16,997 | 17,901 | 18,525 | 19,104 | 16,674 | 20,182 | 100 | 100 | 0.7 |
| Coal | 3313 | 4562 | 4581 | 4638 | 4683 | 4677 | 4644 | 27 | 23 | 0.1 |
| Oil | 6739 | 9488 | 9996 | 10,249 | 10,421 | 10,647 | 10,858 | 56 | 54 | 0.5 |
| Gas | 2008 | 2984 | 3324 | 3638 | 4000 | 4350 | 4680 | 17 | 23 | 1.8 |
* Total final consumption is the sum of consumption by the different end-use sectors: industry, transport, buildings and other (including agriculture and non-energy use).
© 2017 by the authors. Licensee MDPI, Basel, Switzerland. This article is an open access article distributed under the terms and conditions of the Creative Commons Attribution (CC BY) license (http://creativecommons.org/licenses/by/4.0/).
Share and Cite
MDPI and ACS Style
Bollino, C.A.; Asdrubali, F.; Polinori, P.; Bigerna, S.; Micheli, S.; Guattari, C.; Rotili, A. A Note on Medium- and Long-Term Global Energy Prospects and Scenarios. Sustainability 2017, 9, 833. https://doi.org/10.3390/su9050833
AMA Style
Bollino CA, Asdrubali F, Polinori P, Bigerna S, Micheli S, Guattari C, Rotili A. A Note on Medium- and Long-Term Global Energy Prospects and Scenarios. Sustainability. 2017; 9(5):833. https://doi.org/10.3390/su9050833
Chicago/Turabian StyleBollino, Carlo Andrea, Francesco Asdrubali, Paolo Polinori, Simona Bigerna, Silvia Micheli, Claudia Guattari, and Antonella Rotili. 2017. "A Note on Medium- and Long-Term Global Energy Prospects and Scenarios" Sustainability 9, no. 5: 833. https://doi.org/10.3390/su9050833
Note that from the first issue of 2016, this journal uses article numbers instead of page numbers. See further details here.