Article

Exploring Interface Problems in Taiwan’s Construction Projects Using Structural Equation Modeling

1
Department of Construction Engineering, National Kaohsiung First University of Science and Technology, Kaohsiung City 824, Taiwan
2
Graduate Institute of Engineering Science and Technology, National Kaohsiung First University of Science and Technology, Kaohsiung City 824, Taiwan
*
Author to whom correspondence should be addressed.
Sustainability 2017, 9(5), 822; https://doi.org/10.3390/su9050822
Submission received: 17 March 2017 / Revised: 10 May 2017 / Accepted: 11 May 2017 / Published: 16 May 2017
(This article belongs to the Section Economic and Business Aspects of Sustainability)

Abstract

:
Construction projects are complex systems that inherently contain complex interface problems. This study explored the root causes of interface problems in construction projects using structural equation modeling. This technique is a systematic approach that combines factor analysis and path analysis to investigate the causal relationships among multidimensional factors. The literature on construction interface problems was reviewed, and a questionnaire survey was conducted in Taiwan to identify 27 initial factors that cause interface problems in three dimensions: owner, design, and construction. Then, a series of structural equation models (SEMs) was developed to further explore the root causes of the interface problems and their causal relationships. This study has three main findings: (1) poor design causes interface problems; (2) ineffective communication and coordination among the owner, design, and construction dimensions are the main factors that cause construction interface problems; and (3) a lack of communication and coordination has a greater influence on the construction dimension than on the owner and design dimensions. The above findings can be used as important references and sustainable management strategies for academia and decision-makers in the construction industry.

1. Introduction

Every construction project is a specific and unique system. Because of the rapid development of modern technology, the scale of construction has gradually increased, and construction projects have become increasingly complex. Interface problems occur at various stages of project implementation. Therefore, prudent analyses and timely management are required to control the predetermined construction cost, duration, and quality. In this study, construction interface problems include conflicts and problems caused by differences in subjective and objective views regarding functional or physical objects between two or more systems. Therefore, factors that cause construction interface problems involve two or more overlapping or successive events that influence engineering projects. During project implementation, the root causes of interface problems must be predicted or identified in a timely manner so that these problems can be solved effectively. Failure to identify these factors will result in unpredictable and uncontrollable events that impede the completion of construction projects; in addition, an antagonistic relationship may form among the interested parties, reducing the effectiveness of project implementation through low productivity, cost increases, and schedule delays. Contractors, design consultants, and business owners all believe that construction interface problems can influence the results of project implementation and determine the successful completion of projects while meeting predetermined requirements.
The purpose of this study is to develop a series of structural equation models (SEMs) to explore the root causes of project interface problems among three dimensions: owner, design, and construction.

2. Literature Review

2.1. Interface Issues in Construction Projects

In recent years, conventional statistical techniques have been used in studies on construction project interface issues to identify, classify, and rank factors that cause interface problems and to understand the degree to which these factors influence construction projects. For example, Al-Hammad, A. et al. [1] identified and assessed the relationship between building owners and designers in terms of interface problems. This resulted in the identification of 20 interface problems, which were classified into three categories: inadequate contract and specifications, financial problems, and lack of proper communication. Alarcon et al. [2] described the performance of the design-construction interface (with a total of 21 factors) using quality function deployment (QFD) to identify the most effective tools and to set priorities for implementation. Later, Al-Hammad [3] identified 19 common interface problems among the various construction parties, which were classified into four categories: financial problems, inadequate contract and specification, environmental problems, and other common problems. The relative severity of the categories and their related problems were determined, and then the categories were ranked according to a severity index. Faisal et al. [4] focused on the sources of problems at the design and construction interface of large building projects in Saudi Arabia. The results suggested that the contractor’s lack of comprehension regarding drawing details and specifications, the involvement of the contractor as a consultant, the time limitation in the design phase, the design complexity, and participants’ honest but wrong beliefs were considered as the most important sources of the project design and construction interface problems. Huang, R.Y. et al. [5] used factor analysis and multiple regression analyses to categorize the 28 interface problems among the parties and to evaluate their impacts on project performance. Chen, Q. et al. [6] presented a multi-perspective approach that systematically explored comprehensive cause factors for various interface issues. The findings of this multi-perspective approach not only add a holistic view of interface issues (with a total of 44 factors) to the existing body of knowledge but also provide a base for researchers and practitioners to seek all-around Interface Management (IM) solutions. Jarkas et al. [7] used the relative importance index technique to identify, explore, and rank the relative importance of ten interface factors that were perceived to impact the motivational level of master craftsmen involved in primary construction trades.

2.2. Application of SEMs for Construction Projects

In recent years, numerous researchers have used SEMs to study various issues related to construction engineering. For example, Molenaar et al. [8] presented the results of an SEM used to describe and quantify the fundamental factors that affect contract disputes between owners and contractors in the construction industry; the model measures both the qualitative and quantitative aspects of contract disputes, management ability, financial planning, risk allocation, and project scope definition for both owners and contractors. Wan Mohamed Radzi et al. [9] established a firm sustainability performance index model by applying both classical and Bayesian structural equation modeling. The findings showed that knowledge management and business strategy have a significant impact on the firm sustainability performance index. Mainul et al. [10] used structural equation modeling to provide theoretical insight into how individual influence factors work together to determine the effectiveness of project planning efforts. The focus was on the relative influence of three latent variable constructs, i.e., planning efforts, project environment, and the organizational characteristics of construction firms, on the dependent construct, i.e., project planning effectiveness. Yang et al. [11] employed an SEM to analyze the relationships among the quantitative impact values of the key causes of construction delays. The analytical results clearly showed the correlations among key causes of delay, which act as the bases for resolving future schedule delays. Cho et al. [12] developed an SEM to identify the project characteristics that affect the level of project performance required by an owner in the planning stage. This study deduced (1) the overall causal relationship and (2) the degree of influence between 17 project characteristics and five project performance indices. Kim et al. [13] developed an SEM for predicting the project success of uncertain international construction projects to promote the clear understanding of a complex system and the underpinning causes that critically affect project success. The comparison analysis between their SEM and other models indicated that their SEM has strong potential to accurately and reliably predict the probable performance of international construction projects. Yang et al. [14] attempted to identify the causes of delays in the various stages of build-operate-transfer (BOT) projects. Those outcomes were analyzed using traditional statistical methods and the structural equation modeling method. Thomas et al. [15] established an SEM evaluation framework for the initial feasibility evaluation of a public-private partnership (PPP) project that can satisfy all stakeholders. The results should enable relevant stakeholders to improve their understanding regarding the relative importance of the evaluation factors and facilitate the establishment of a comprehensive framework for decision makers that can be used to evaluate the feasibility of PPP projects. Zeynep et al. [16] used an SEM to investigate the impacts of company resources, capabilities, and strategic decisions on construction company performance. The findings indicated that, as expected, resources, capabilities, and strategic decisions have an important and direct impact on company performance, whereas project management competencies and strength of relationships with other parties impact company performance only indirectly through their impact on company resources, capabilities, and strategic decisions. Hemanta et al. [17] attempted to understand the pre-emptive qualification criteria using an SEM that adapted a total of 29 technical attributes across five confirmatory factors: soundness of business and workforce (SBW), planning and control (PC), quality performance (QP), past performance (PP), and overall project success (OPS). Based on the survey data collected from medium sized construction projects in Australia, the results of the model confirmed that the technical planning and controlling expertise of the contractor is the key to achieving success in projects.
According to the above literature review on construction interface issues and the application of SEMs in the construction industry, no previous study has used an SEM to investigate the factors that influence construction interface problems. Structural equation modeling is a systematic statistical technique used to investigate causal relationships between multidimensional factors; this technique can be used to analyze problems related to construction projects with interactive dynamic complexity.
Structural equation model (SEM) is a systematic statistical technique used to combine factor analysis and path analysis and involves two procedures: a measurement model and a structural model. The measurement model of SEM allows a researcher to evaluate how well his or her observed (measured) variables can identify underlying hypothesized constructs. The structural model of SEM which has causal connections between latent variables, contains observed variables with a complexity greater than one [18]. Observed variables have data that can be directly measured by a researcher, for example, numeric responses to a rating scale question on a questionnaire. Latent variables are variables that are of interest to a researcher but are not directly observable [19]. SEM enables the development of a causal indicator model in which a latent theoretical construct of interest is represented by measured variables [10]. Anderson and Gerbing provided a two-step approach for assessing the structural model, the operation analysis of constructs, and the convergent and discriminative validity [20].
According to the abovementioned literature review of interface causes and the application of SEMs for construction projects, the 27 most important factors (see Table 1) that influence the interface problems of the Large Kaohsiung area of southern Taiwan were identified. The interface problems caused by the mutual influence relationships among the owner, design, and construction, which inherently contains complex interface problems, dimensions must now be explored and improved. This study develops three theoretical SEMs (a tridimensional correlation SEM, a second-order SEM, and six mediated SEMs) to investigate the influence mechanism of project interface problems among three dimensions: owner, design, and construction. Following the theoretical rationale presented above, the following hypotheses are developed: Hypothesis 1: There are positive mutual causal effect relationships among the three dimensions of owner, design, and construction. Hypothesis 2: The CAC (communication and coordination) has a positive impact on the three dimensions (owner, design, and construction). Hypothesis 3: The construction dimension has a positive mediatory effect on the owner perspective with respect to the design dimension. Hypothesis 4: The design dimension has a positive mediatory effect on the owner perspective with respect to the construction dimension. The following sections describe the methodology used to test the model and hypotheses, including a two-stage operation analysis of the measurement and structural modeling of the SEM.
This research framework and process are presented as follows: (1) theme identification (this study used structural equation modeling to explore the important influence factors of three dimensions of interface problems and the different levels of influence mechanisms among the three dimensions); (2) literature review (theoretical development and identification of the 27 most important factors that influence interface problems); (3) structural equation modeling, stage 1: measurement modeling of the SEM, including model specification, sample structure analysis, model assessment of fit and modification (Table 1 and Table 2); (4) advanced SEM, stage 2: structural modeling of the SEM, including advanced structural equation modeling outputs from a tridimensional correlation SEM, a second-order SEM, and six mediated SEMs; and (5) the conclusion. This research framework is depicted in Figure 1.

3. Structural Equation Modeling Process

Prior to establishing an SEM, an initial measurement model for the SEM must first be determined. After the measurement model fitness is determined, an advanced SEM can be logically developed. Therefore, the structural equation modeling process is as follows: (1) stage 1 of SEM: sample structure analysis (sampling method, pre-testing process), model specification (initial measurement modeling of the SEM), measurement model assessment of fit and modification; and (2) stage 2 of SEM: advanced structural equation modeling (a tridimensional correlation SEM, a second-order SEM, and six mediated SEMs).

3.1. Stage1 of SEM

3.1.1. Model Specification

According to the literature review and the questionnaire survey results, three dimensions (i.e., owner, design, and construction) were used as latent variables, while 27 related factors were used as observed variables. Table 1 shows the measurement results related to the three dimensions obtained using the initial measurement model. The configuration is as follows: (a) For the design measurement model, the design dimension was a latent variable that influenced the following observed variables: short design time (D1), minimal funds (D2), inadequate professional knowledge and experience (D3), insufficient information for design (D4), lack of design manpower (D5), no knowledge of the actual construction processes during design (D6), inadequate integration of construction interfaces (D7), lack of design standards (D8), and lack of communication and coordination among design interfaces (D9). (b) For the construction measurement model, the construction dimension was a latent variable that influenced the following observed variables: short construction time (C1), a low-cost contract (C2), lack of communication and coordination among various construction interfaces (C3), inadequate professional knowledge possessed by the construction and technical personnel (C4), unsuitable machinery and materials for the construction methods (C5), inadequate on-site management and supervision (C6), inadequate construction scheduling (C7), construction mistakes due to the improper reading of construction plans (C8), and construction mistakes and reworking (C9). (c) For the owner measurement model, the owner dimension was a latent variable that influenced the following observed variables: no quality control because of a low budget (O1), lack of supervision because of insufficient manpower (O2), interface problems and coordination difficulties (O3), extremely complex procedures for subcontracting (O4), inadequate communication and coordination among various departments (O5), delayed payments (O6), changes in business owner decisions (O7), requirements that were not clearly defined in advance (O8), and delayed modification and approval of design documents (O9).

3.1.2. Sample Structure Analysis

Sampling Method

In this study, construction units in the Large Kaohsiung area of southern Taiwan that participated in recent public construction projects were selected as the research targets. The factors that influenced the construction interface problems experienced by these units were investigated. Based on the literature review, we identified the 27 most important factors that influence the interface problems of the Large Kaohsiung area of southern Taiwan and conducted a questionnaire using a 5-point Likert-type scale. We issued a total of 250 questionnaires and received 203 completed questionnaires, which is a response rate of 81.2%. It was previously determined that the number of SEM questionnaire samples needed to be greater than 150, with greater than 200 completed samples being preferable [22,23]. The characteristics of the valid questionnaire samples are as follows: (a) 36% of the interviewees were design engineers, 35% were field engineers, 16% were project management engineers, and 13% were supervisors; (b) 21% of the interviewees had 0 to 5 years of work experience, 31% had 6 to 10 years, 22% had 11 to 15 years, and 26% had more than 16 years.

Pre-Testing Process

The data collected from the valid samples were analyzed and the results are as follows: (a) According to the reliability analysis, the three values of the reliability coefficient (Cronbach’s α, alpha) were all greater than 0.7 (Table 1). The closer alpha is to 1.0, the greater the internal consistency of the items in the scale [24]. (b) According to the multivariate normal distribution tests, the absolute value of maximum kurtosis was 1.490 (<7), and the absolute value of maximum skewness was 1.106 (<2); the results showed a multivariate normal distribution [25]. These two statistical tests confirmed that the questionnaire data met the normal distribution and consistency requirements. Therefore, the initial measurement model for the SEM could be calculated. Table 1 shows the factor loading (F.L.) values for the three initial measurement models. Factor loading is a statistical estimate of the direct effects of factors (latent variables) on indicators (observed variables) and is generally interpreted as a regression coefficient [25]. Kline, R.B. [21] asserted that for models used to measure structural equation modeling, a factor loading greater than 0.6 is acceptable. Therefore, in this study, the threshold criterion for the factor loadings of the observed variables was set to 0.6. In other words, a factor loading greater than or equal to 0.6 was chosen.

Model Assessment of Fit and Modification

To build an SEM, a model goodness-of-fit (GOF) test must be performed to obtain a stable and reliable model. In this study, the main model GOF indices for the SEM were χ2/df (relative/norm chi-square), the goodness-of-fit index (GFI), the adjusted goodness of fit index (AGFI), the comparative fit index (CFI), the root mean square error of approximation (RMSEA), the root mean square residual (RMR), the standardized root mean square residual (SRMR), and the measurement model (confirmatory factor analysis), including the convergent validity (CR, composite reliability) and the discriminate validity (AVE, average variance extracted). The recommended χ2/df range is from 1 to 5, where numbers close to 1.0 indicate the best fit [26]. The GFI is an absolute fit index that estimates the proportion of covariance in the sample data matrix explained by the model; the recommended range is generally 0~1.0, where 1.0 indicates the best fit [27]. The AGFI is based on the degrees of freedom, and more saturated models reduce the fit; the recommended range is generally 0~1.0, where 1.0 indicates the best fit [28]. The CFI compares the improvement in the fit of the researcher’s model; The CFI ranges from 0 to 1.0, with values closer to 1.0 indicating a better fit [29]. The RMSEA is a parsimony-corrected index; the recommended range is from 0 to 1.0, but <0.08 indicates the most acceptable model [30]. The RMR is the square root of the difference between the residuals of the sample covariance matrix and those of the hypothesized covariance model; the recommended range is from 0 to 1.0, but <0.08 indicates the most acceptable model [28]. The SRMR is based on the covariance residuals, with smaller values indicating a better fit; the recommended range is from 0 to 1.0, but <0.08 indicates the most acceptable model [31,32]. The CR is the measure of the internal consistency which ensures that items assumed to measure a particular construct actually measure it and not another construct. A CR of more than 0.7 indicates the most acceptable model [33]. The AVE measures the amount of variance that a latent variable gains from its measurement items relative to the amount of variance due to measurement errors. A AVE of more than 0.5 indicates the most acceptable model [34].
The initial measurement model for the SEM was modified by performing a pretesting process; the observed variables whose factor loadings were less than 0.6 were removed. The results are in accordance with the model GOF test results, CR and AVE, as shown in Table 2. Three final measurement models (included in Figure 2, Figure 3, Figure 4 and Figure 5) for the SEM were obtained and configured as follows:
(1)
The design dimension measurement model: Five observed variables were the main components that influenced the interface problems in the design dimension: D3 (F.L. = 0.61), D4 (F.L. = 0.57), D5 (F.L. = 0.60), D6 (F.L. = 0.69), and D9 (F.L. = 0.71). Therefore, D9 (lack of communication and coordination among design interfaces) is the most important influence factor for the design dimension.
(2)
The construction dimension measurement model: Six observed variables were the main components that influenced the interface problems in the construction dimension: C3 (F.L. = 0.81), C4 (F.L. = 0.78), C5 (F.L. = 0.60), C6 (F.L. = 0.68), C7 (F.L. = 0.65), and C8 (F.L. = 0.77). Therefore, C3 (lack of communication and coordination among various construction interfaces) is the most important influence factor for the construction dimension.
(3)
The owner dimension measurement model: Five observed variables were the main components that influenced the interface problems in the owner dimension: O3 (F.L. = 0.67), O4 (F.L. = 0.62), O5 (F.L. = 0.77), O7 (F.L. = 0.63), and O8 (F.L. = 0.62). Therefore, O5 (inadequate communication and coordination among various departments) is the most important influence factor for the owner dimension.
The three final measurement models obtained in this study were used to assess the factor loadings and rankings to determine the degrees to which various variables influenced the interface problems in various dimensions (see Table 3). The main factor that influenced construction project interface problems was insufficient communication and coordination. This factor influenced activities in various dimensions, including construction duration and quality. Therefore, the factor loadings and the rankings enable managers to understand the entire model and serve as a reference for taking early and adequate actions during project planning to reduce the occurrence of interface problems and to improve the effectiveness of project implementation.

4. Advanced Structural Equation Modeling: Stage 2 of SEM

To thoroughly explore the root causes of the interface problems and the causal relationships among these problems, three advanced SEMs were developed: (a) a tridimensional correlation SEM (TDC-SEM), (b) a second-order SEM, and (c) six mediated SEMs.

4.1. Tridimensional Correlation Structural Equation Model (TDC-SEM)

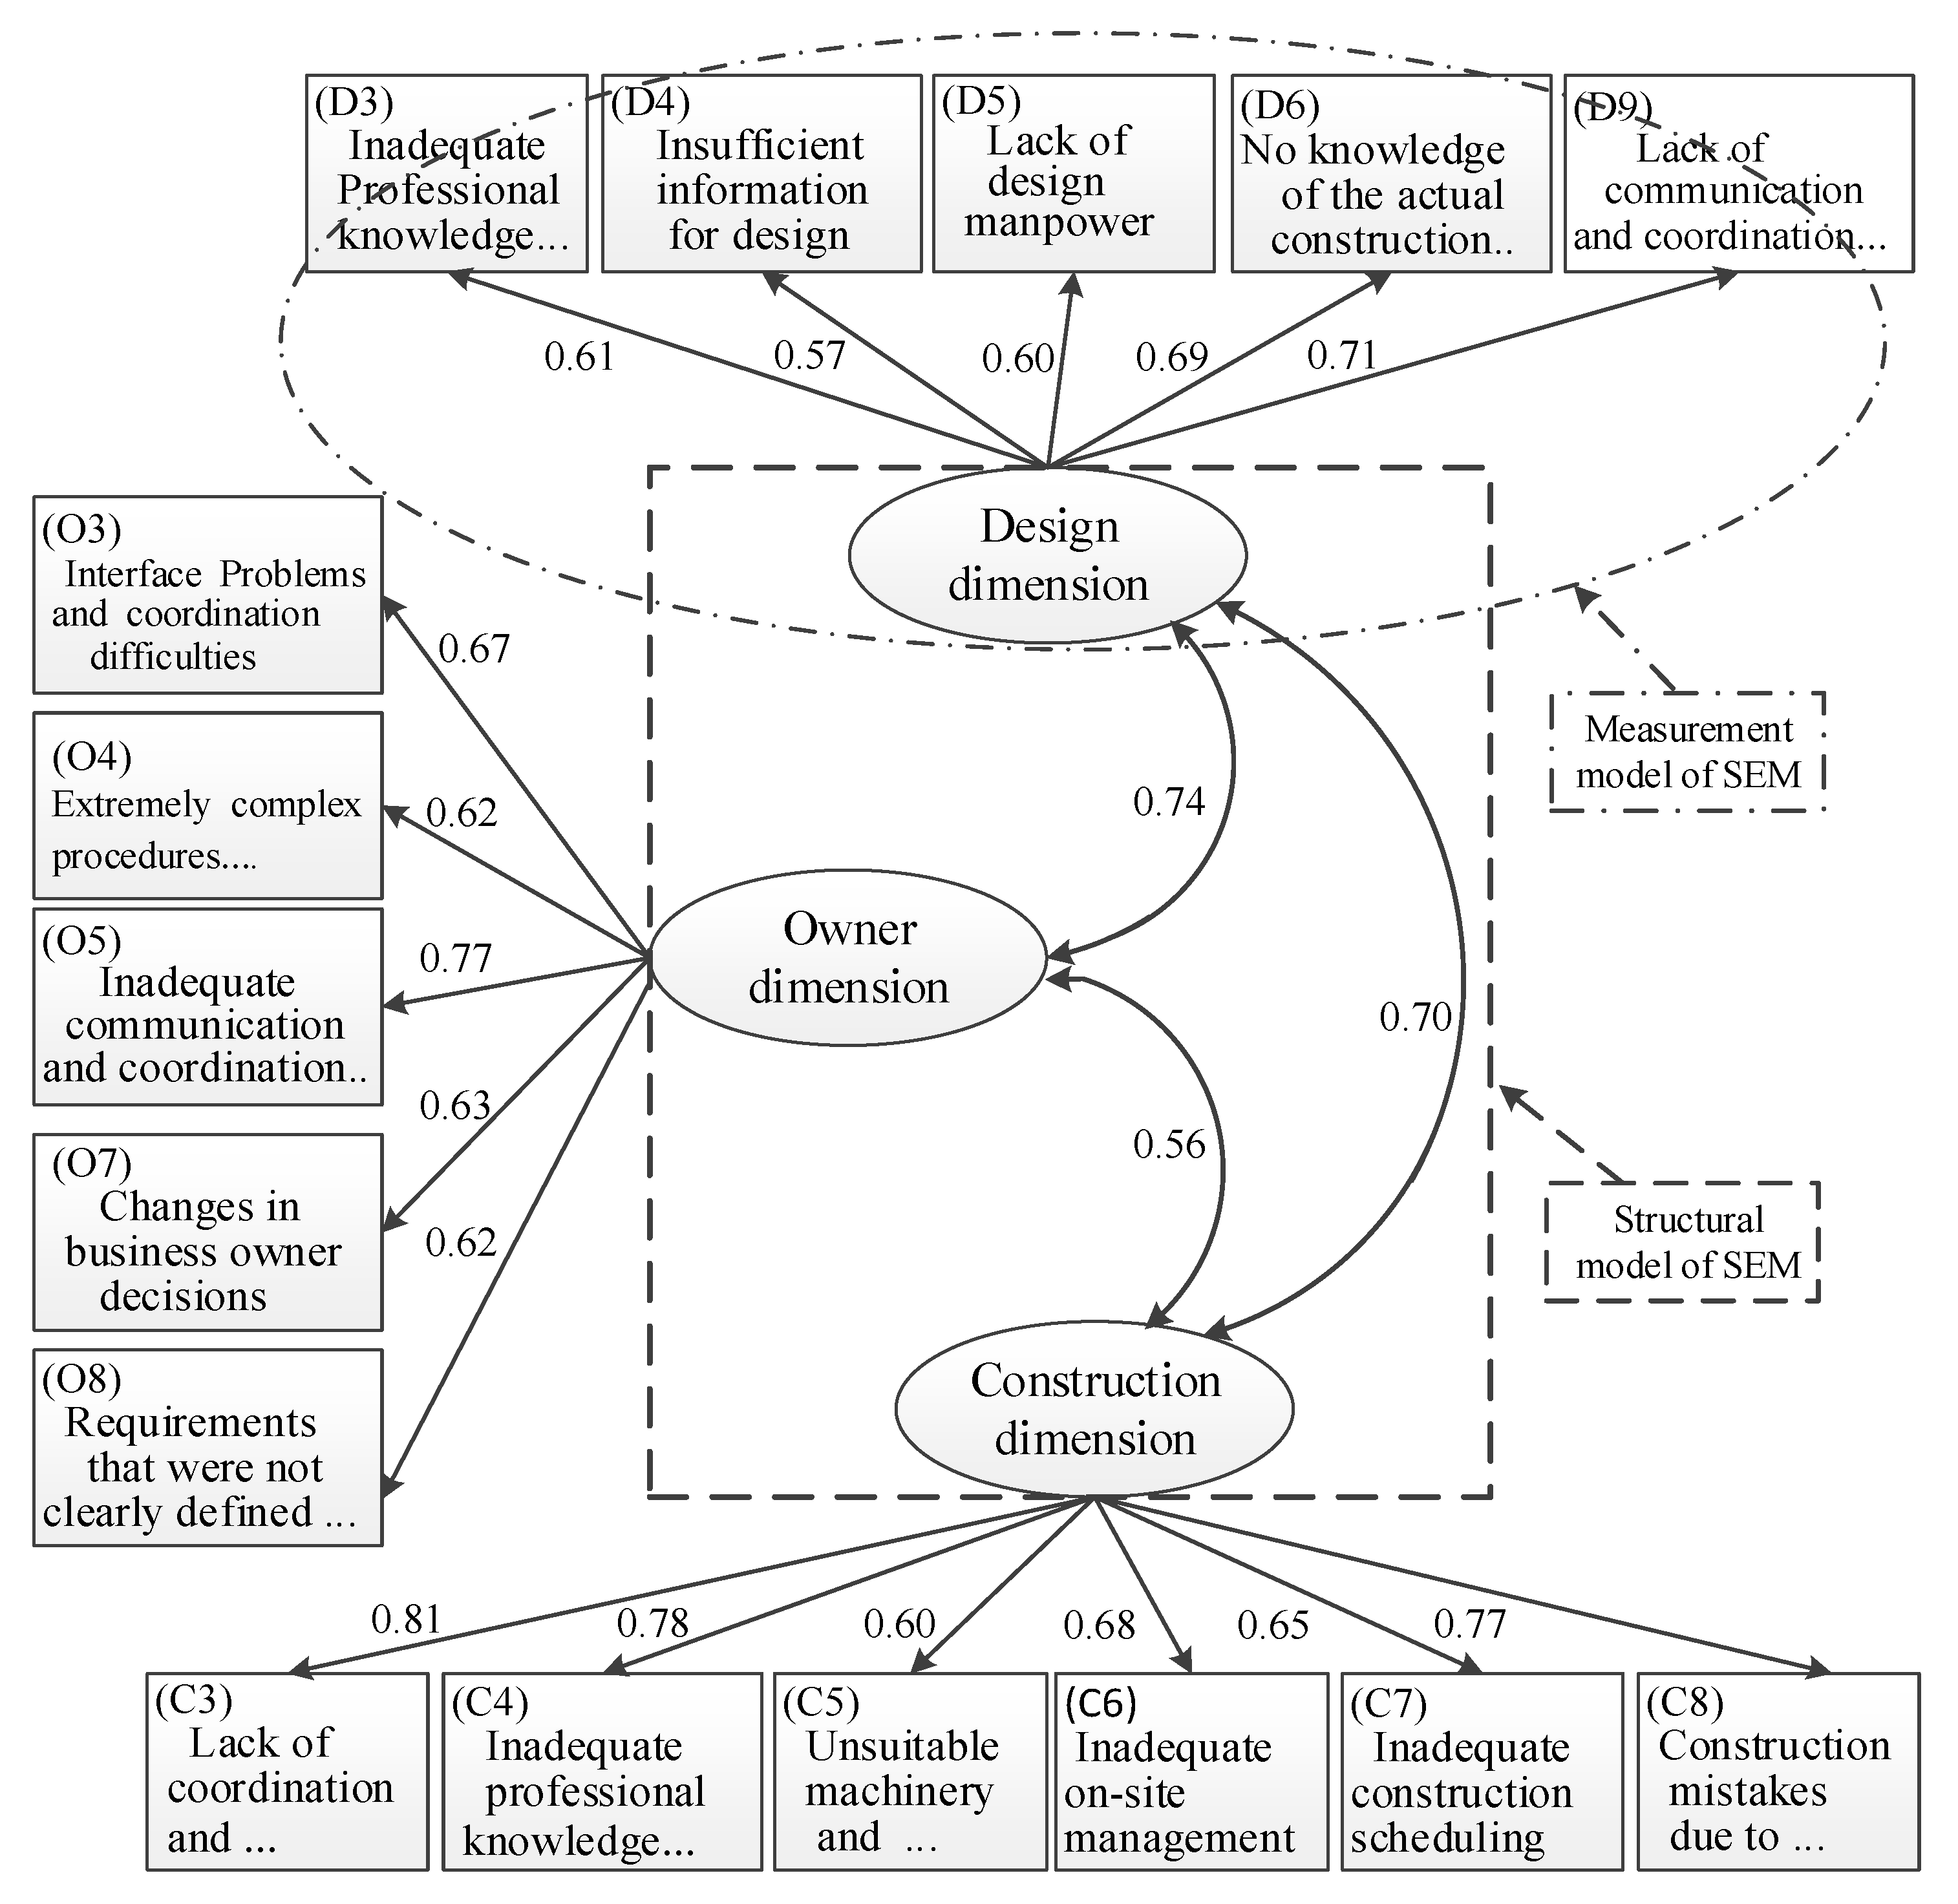
The TDC-SEM shown in Equation (1) [17] was built to explore in detail how the three dimensions of construction projects influence each other. This model met the requirements for a model GOF test, and the results of the TDC-SEM are shown in Figure 2.
x = Λx ξ + δ
where xi is the ith observed variable, the rectangles (□) represent observed variables, δi is the error term associated with the ith observed variable (xi), Λx is the coefficient vector (F.L.) that relates x to ξ, ξ is a vector for endogenous latent variables, and the ellipses (〇) represent latent factors. The single-headed arrows (→) represent the impact of one variable on another, and double-headed arrows (←→) represent correlations between pairs of variables.
The tridimensional correlation structural equation model (TDC-SEM) (see Figure 2) is composed of a structure model and a measurement model; the structure model uses a double-headed arrow to show a mutual connection between two out of the three dimensions (i.e., owner, design, and construction), and the measurement model uses a single-headed arrow to show connections between various observation variables.
The TDC-SEM results show the degrees of mutual influence (F.L. values) between owner and design, design and construction, and business owners and construction, which were 0.74, 0.70, and 0.56, respectively (Figure 2). Therefore, the three dimensions mutually influenced one another to a medium or high degree (i.e., F.L. > 0.5). In other words, if interface problems occur in one dimension, the problems influence other dimensions and thus the project performance to varying degrees. Because all three factor loadings of the model were greater than 0.5, we can infer that a latent variable simultaneously influences all three dimensions (design, construction, and business owners) [19,25]; this inference is explained further in the following section.

4.2. Second-Order SEM

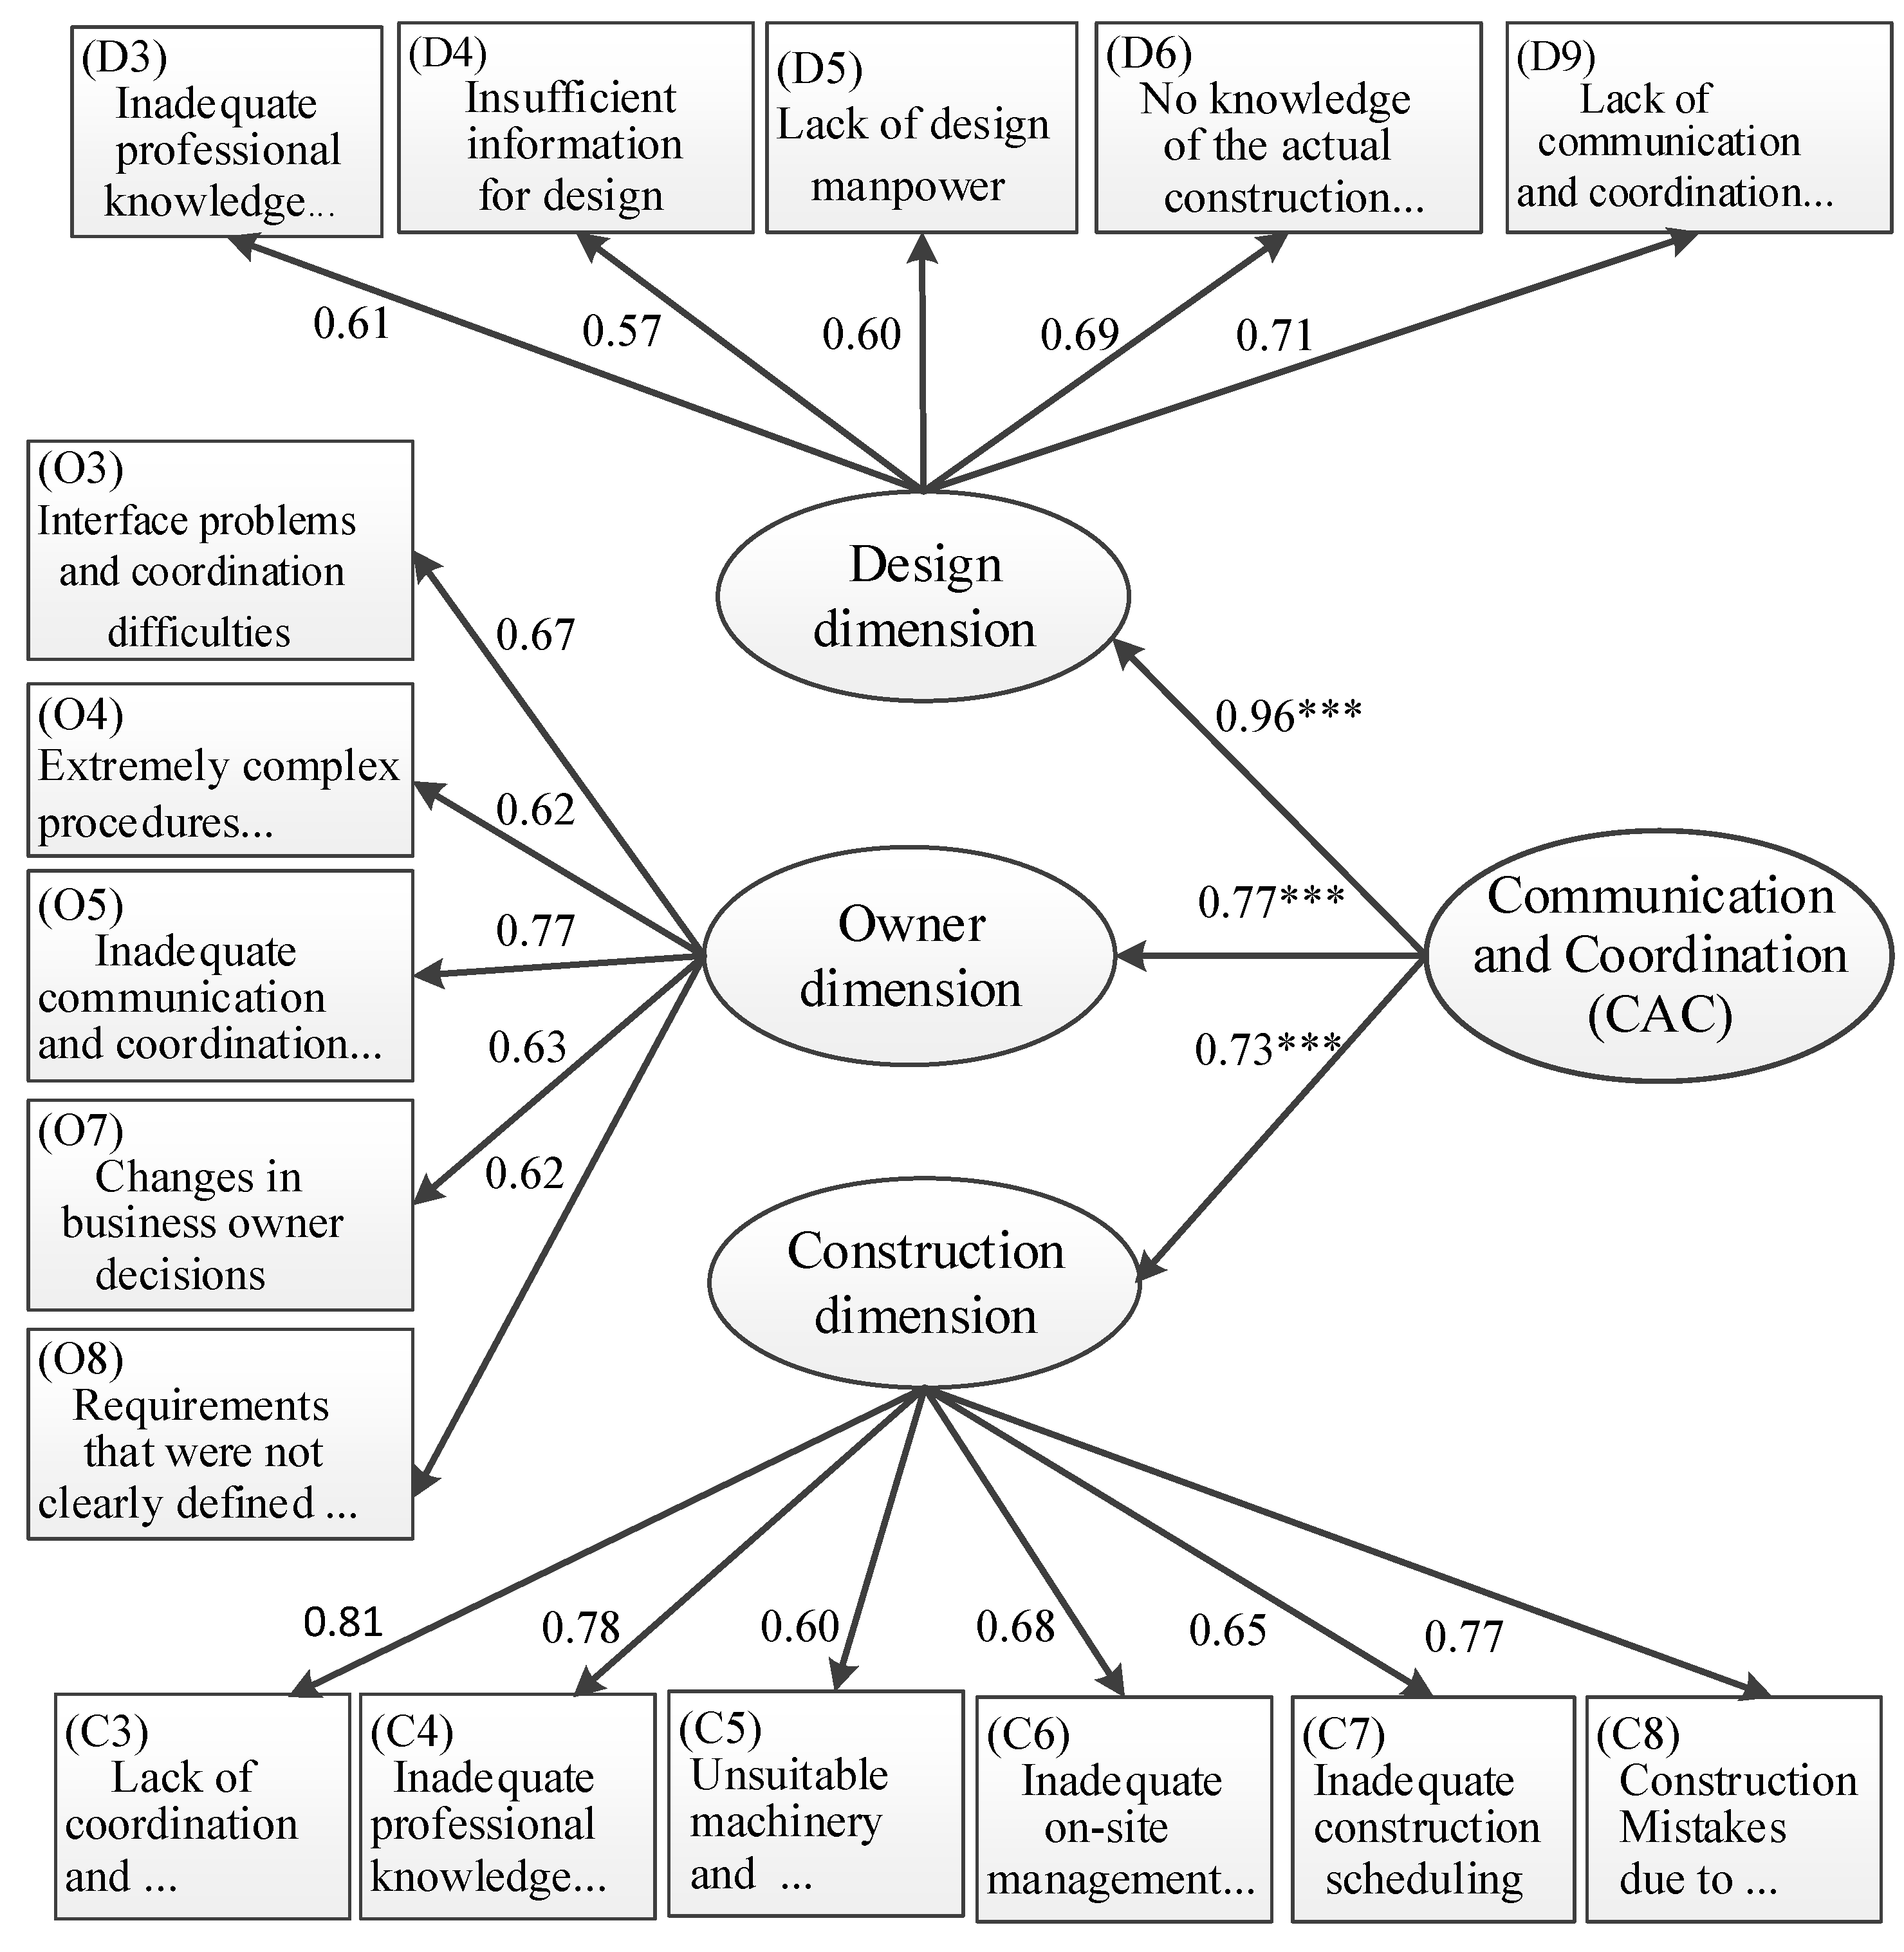
To explore the latent variable, a second-order SEM (Figure 3) was developed. This model is valid because it passes the GOF test; it can be expressed as shown in Equations (2) [17] and (3).
y = Λy η + ε
ηi = Γi1ξ1 + ςi…i = 1, 2, 3
where y is the indicator (observed variables) and ε is the error term associated with the ith observed variable y (indicator). Λy is the coefficient (F.L.) vector that relates yi to ηi, ξ1 is a second-order exogenous latent variable (i.e., communication and coordination, CAC), η represents the three endogenous latent variables (i.e., design, construction, and owner), Γi1 is the coefficient matrix of the factors loadings of the three endogenous latent variables (dimension factors) and the exogenous latent variable (CAC), and ςi is the measurement error of the three endogenous latent variables.
In this second-order SEM, the latent variable most heavily influenced the design dimension (F.L. = 0.96) and influenced the owner and construction dimensions to a smaller extent (F.L. = 0.77 and 0.73, respectively). The influence of the second-order exogenous latent variable was medium with a high degree of positive influence.
Figure 3 graphically shows that the main influence factors that caused interface problems in all three dimensions (design, owner, and construction) were all related to communication and coordination problems (D9, F.L. = 0.77; O5, F.L. = 0.77 and C3, F.L. = 0.81). Accordingly, communication and coordination (CAC) is the second-order exogenous latent variable.
Poor communication and coordination could cause each dimension to become egotistical and to consider only their own interests. Therefore, communication and coordination can help participants understand each other so that prevention and improvement measures can be implemented early on to reduce the influence of interface problems on construction projects and to ensure successful project implementation.

4.3. Mediated SEM

After employing the TDC-SEM (Figure 2) and second-order SEM (Figure 3), we further explored the mutual influences among the three dimensions from a different perspective. Six mediated SEMs were established from the perspectives of the three dimensions: (1) owner perspective: construction mediated SEM (CM-SEM-O) and design mediated SEM (DM-SEM-O); (2) design perspective: construction mediated SEM (CM-SEM-D) and owner mediated SEM (OM-SEM-D); (3) construction perspective: owner mediated SEM (OM-SEM-C) and design mediated SEM (DM-SEM-C). The mathematical models of these SEMs are expressed as shown in Equation (4) [25].
η = Bη + Γξ + ζ
where B is a mediated matrix consisting of Λy (the coefficient vector that relates y to η), Γ is a matrix consisting of Λx (the coefficient vector that relates x to ξ), η is a vector for endogenous variables, and ξ is a vector for exogenous variables expressing latent errors.
Because the underlying principles of the six mediated SEMs are the same, only two (CM-SEM-O and DM-SEM-O) are explained in more detail, as follows.

4.3.1. The Construction Mediated Structural Equation Model from the Owner Perspective (CM-SEM-O)

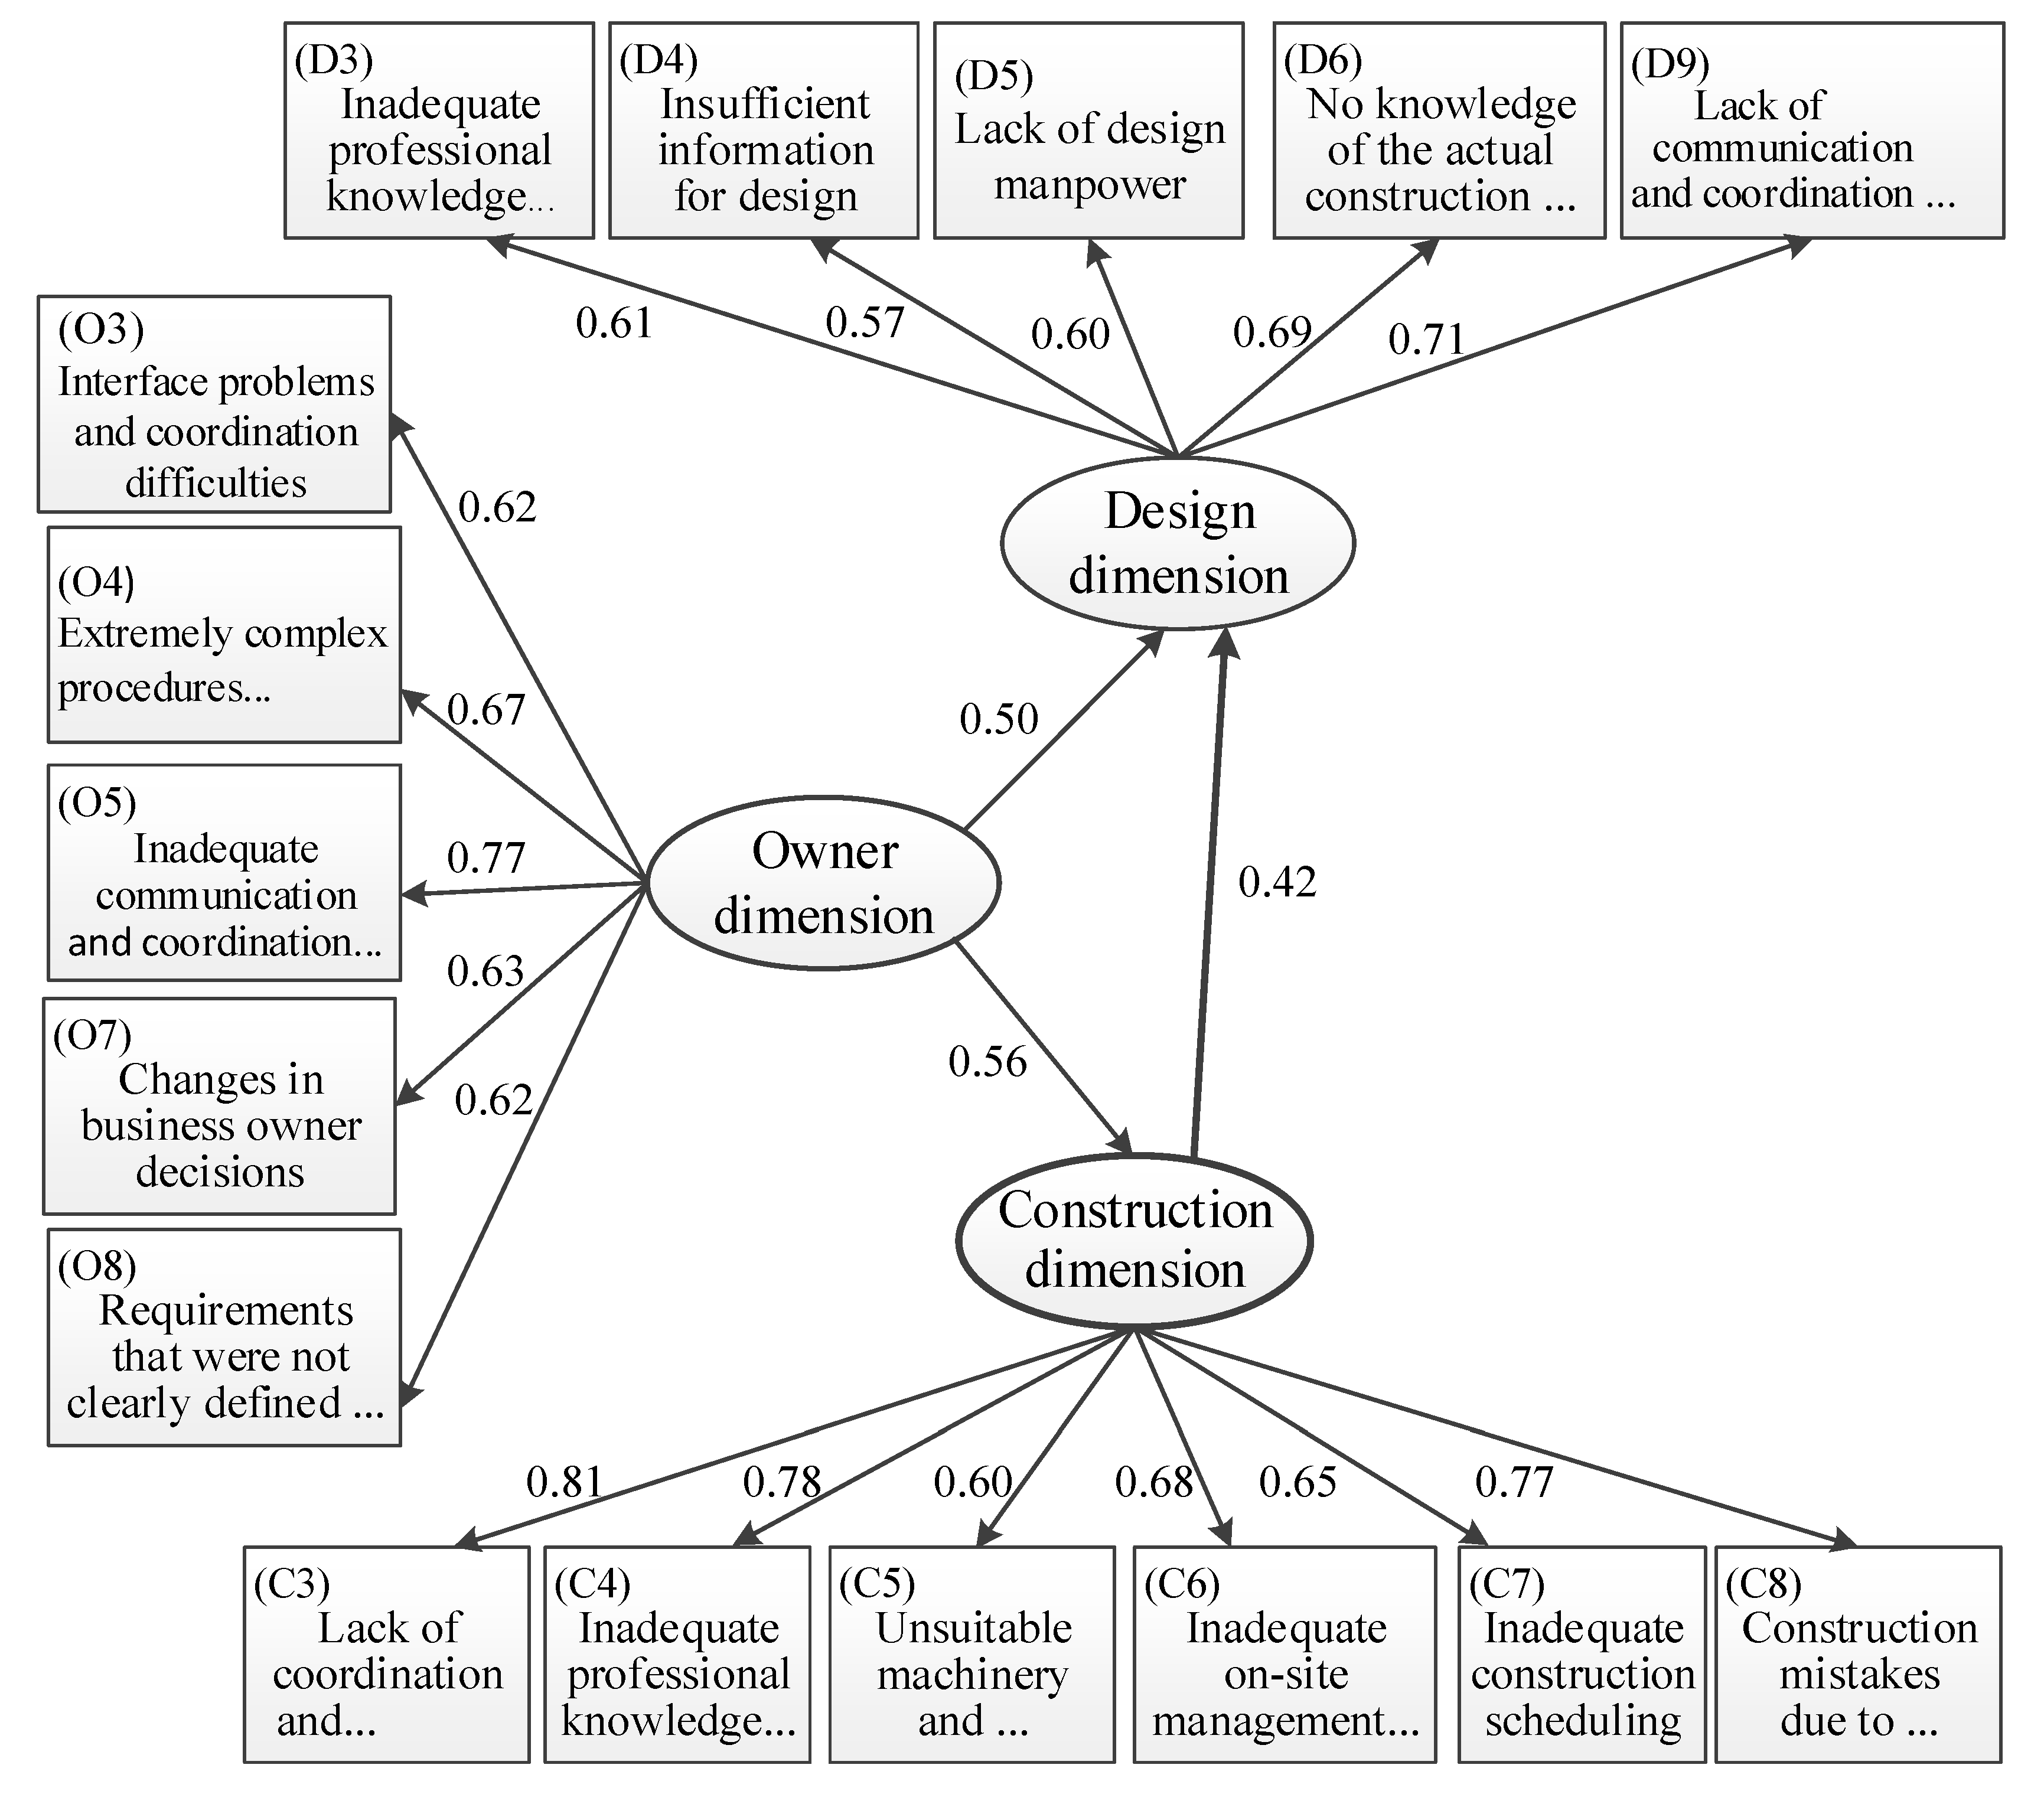
The CM-SEM-O (Figure 4) consists of three parts: (1) exogenous latent variables in the owner dimension; (2) endogenous latent variables in the design and construction dimensions; and (3) mediated variables in the construction dimension that directly influence the design dimension latent variables. A GOF test for the CM-SEM-O was performed, and the results proved its validity.
Figure 4 shows that the standardized direct effects of the owner dimension on the construction and design dimensions are 0.56 and 0.50, respectively. The total effect of the owner dimension on the design dimension is 0.74 (=0.50 + 0.56 × 0.42). The standardized direct effect of the mediated construction dimension on the design dimension is 0.42. This suggests that construction dimension fully mediates the effect of the owner dimension on the design dimension.

4.3.2. The Design Mediated Structural Equation Model from the Owner Perspective (DM-SEM-O)

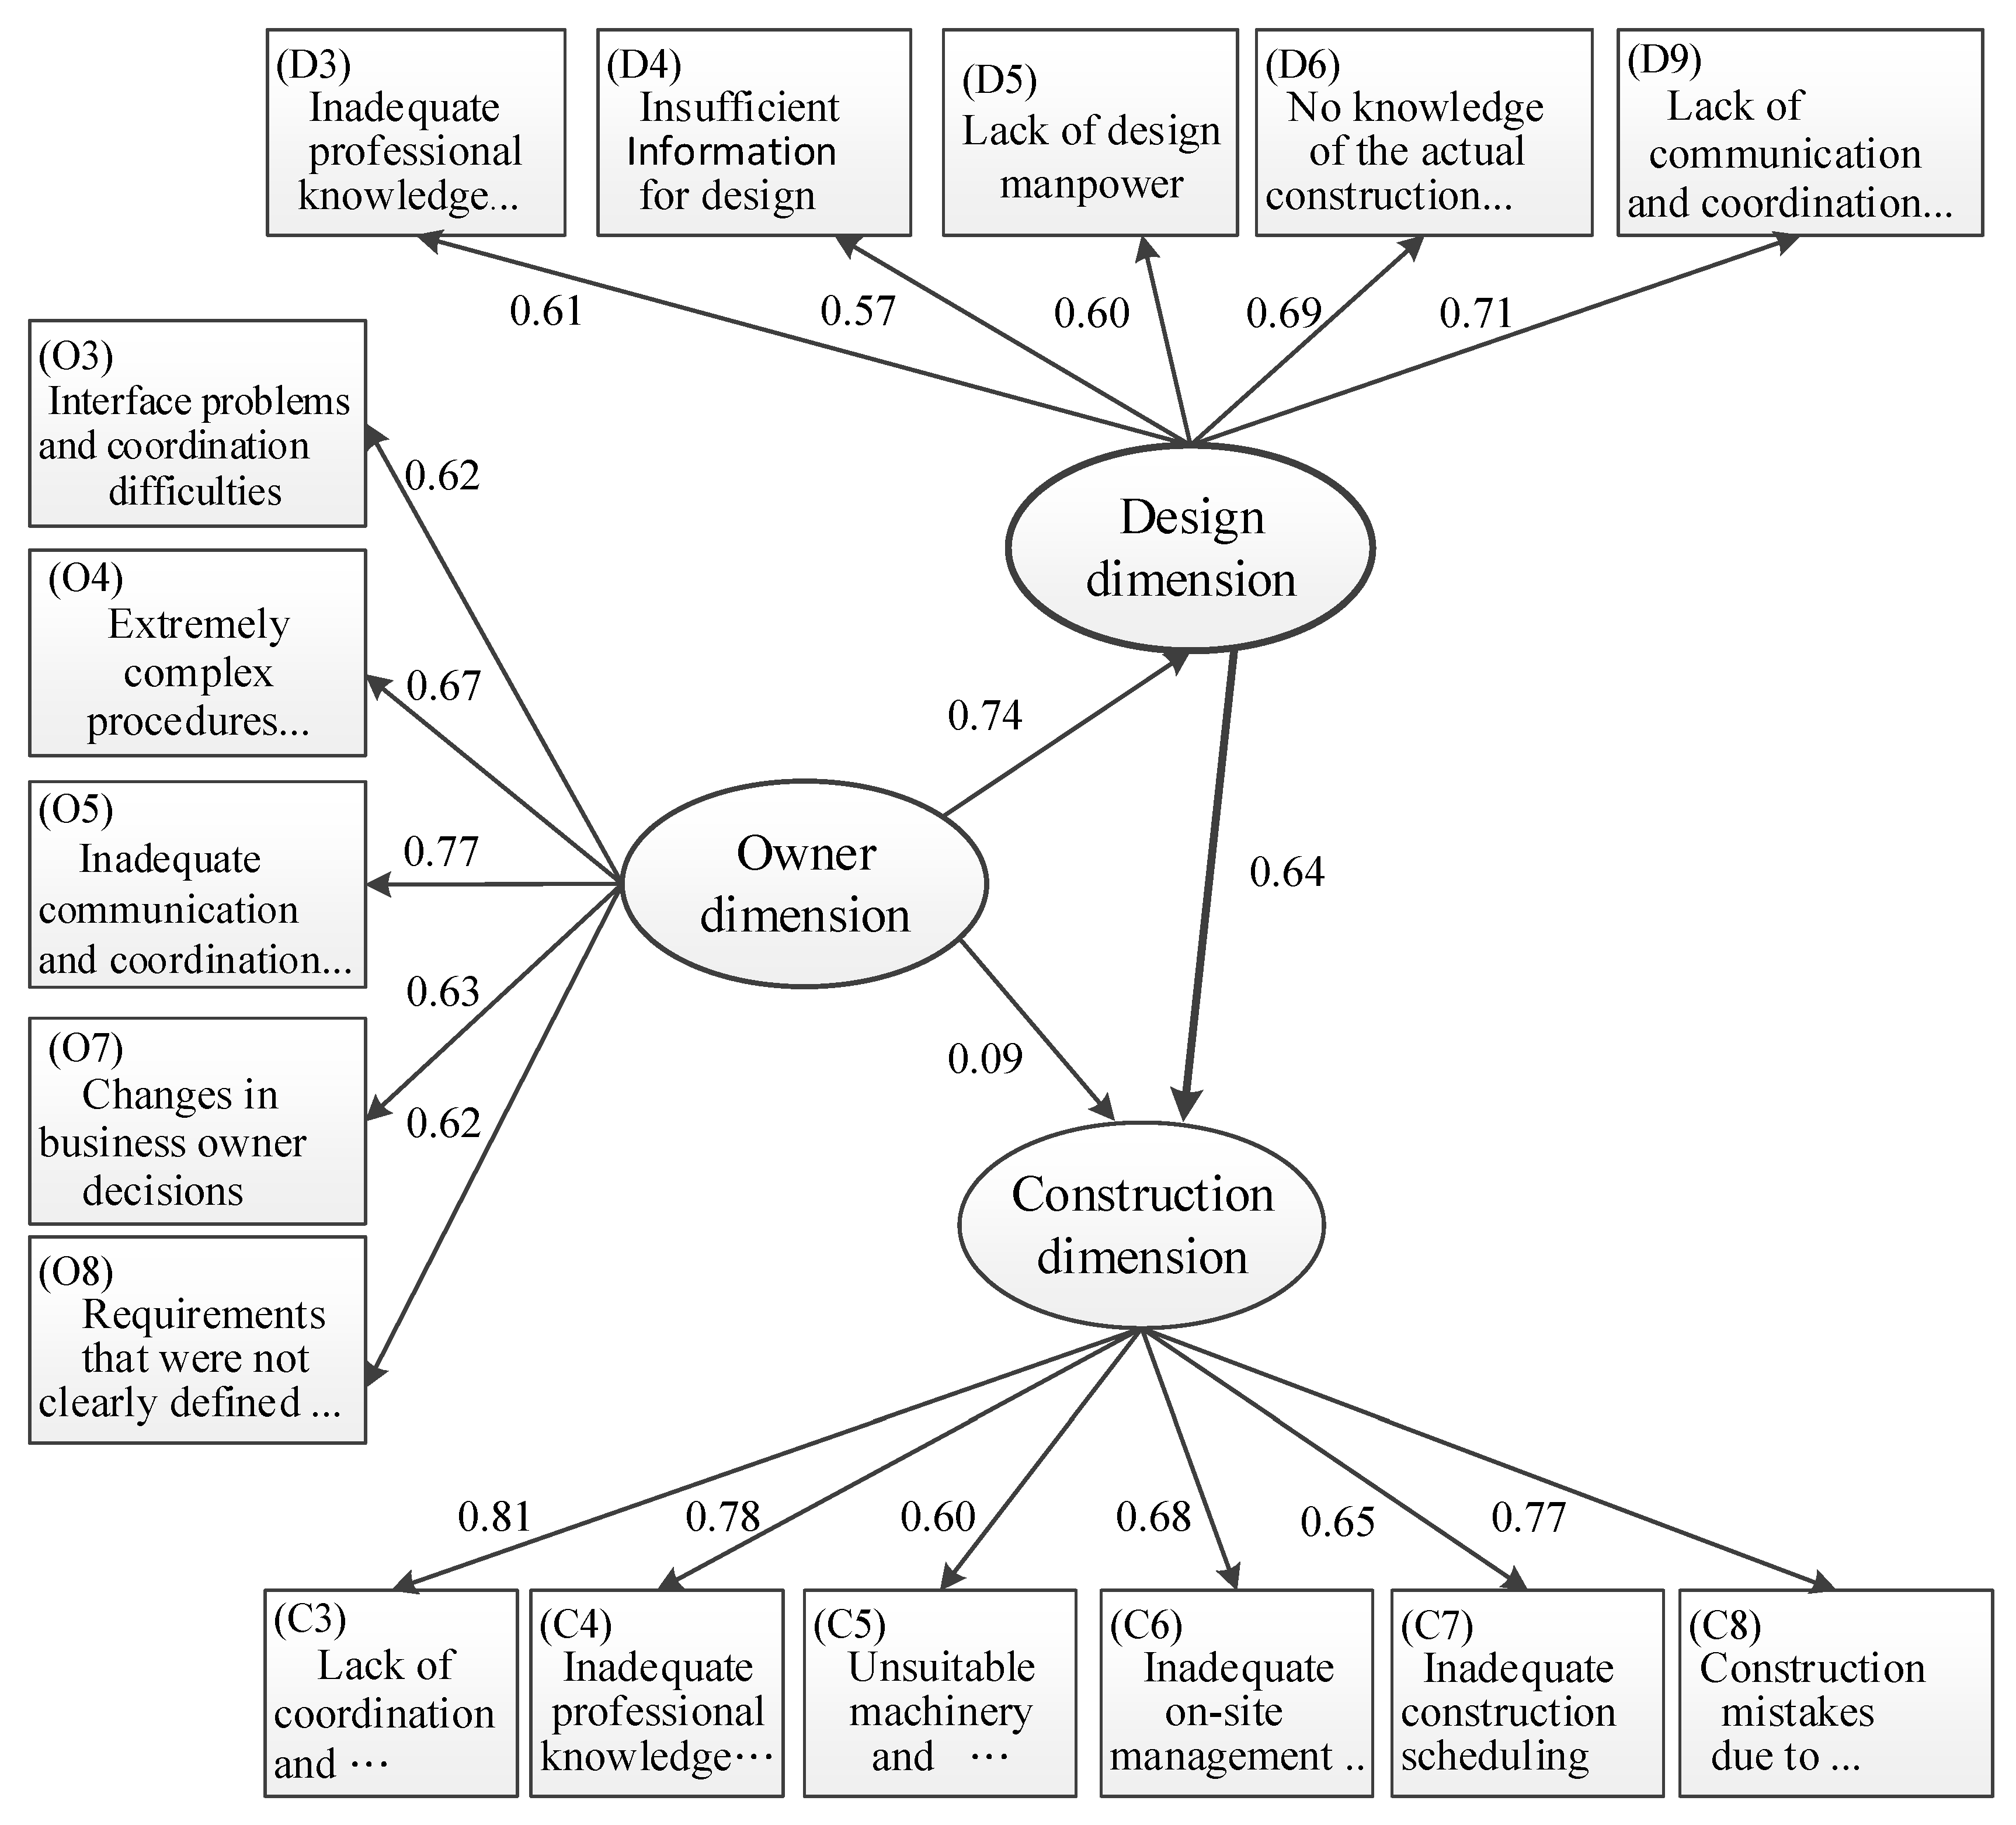
The DM-SEM-O (Figure 4) consists of three parts: (1) exogenous latent variables in the owner dimension; (2) endogenous latent variables in the design and construction dimensions; and (3) mediated variables in the design dimension that directly influence the construction dimension latent variables. A GOF test for the DM-SEM-O was performed, and the results proved its validity. Figure 5 shows that the standardized direct effects of the owner dimension on the design and construction dimensions are 0.74 and 0.09, respectively. The total effect of the owner dimension on the construction dimension is 0.56 (=0.09 + 0.74 × 0.64). The standardized direct effect of the mediated design dimension on the construction dimension is 0.64. This suggests that the design dimension fully mediates the effect of the owner dimension on the construction dimension.
For brevity, only two mediated SEMs are demonstrated here (Figure 4 and Figure 5). All six mediated SEMs are presented in Table 4, which clearly shows that design is the most influential dimension among the three primary dimensions and that the design dimension has the greatest influence with regard to triggering interface problems.
In summary, during project implementation, the direct influence of design on owners (or construction) was greater than the influence of owners on design (or construction); the indirect (mediated) influence of design on construction (or owner) was greater than the influence of construction (or design) on design (or owner). The aforementioned analysis showed that the design dimension directly or indirectly influenced other dimensions, indicating that the design dimension substantially influenced project implementation. Therefore, the design dimension is a critical dimension during project implementation, that is, the design should be given priority during the implementation of construction project management.

5. Conclusions

The primary contribution of this article is the logical construction a series of SEMs to investigate construction interface problems and to clarify the causal relationship and reveal the hidden influential relationships among the owner, design, and construction dimensions for construction projects in Taiwan. Given the all-positive path coefficients, the hypotheses proposed in this study appear to have been validated, that is, three SEM models were established.
The findings are as follows: First, the design dimension has the greatest influence with regard to triggering interface problems. Second, ineffective communication and coordination existing in or among the owner, design, and construction dimensions are the main factors that cause construction interface problems. Third, the influence of “lack of communication and coordination” in the construction dimension (C3, F.L. = 0.81) is higher than that in the owner and design dimensions (O5, F.L. = 0.77 and D9, F.L. = 0.71).
Based on these findings, this study suggests that all project participants should (1) invest considerably more effort in project planning and design and (2) establish effective communication and coordination mechanisms during the entire project life cycle to reduce egotistical thinking patterns and cognitive conflicts and to improve understanding and cooperation.
A limitation of the study is that sampling was limited to the area of Kaohsiung in southern Taiwan; regardless, the research results can provide new insights into construction interface problems, facilitate the understanding of the problems that may influence construction projects, and be used to suggest prevention and improvement measures that can be taken. Furthermore, there is a need for cross-validation of the model, as it was fitted to be expanded to other fields of industry in order to obtain a more complete verification and more application.
Furthermore, this study demonstrates a clear and complete SEM building process that can be easily adopted by academia or practitioners to help solve a variety of problems and that can help both managers and stakeholders to better manage these projects.

Author Contributions

Chien-Liang Lin conceived and designed the experiments; Chen-Huu Jeng performed the experiments/ analysis tools and wrote the paper.

Conflicts of Interest

The authors declare no conflict of interest.

References

  1. Al-Hammad, A.; Al-Hammad, I. Interface Problems between Building Owners and Designers. J. Perform. Constr. Facil. 1996, 10, 123–126. [Google Scholar] [CrossRef]
  2. Alarcón, L.F.; Mardones, D.A. Improving the design construction interface. In Proceedings of the 6th Annual Conference International Group for Lean Construction (IGLC-6), Guarujá, Brazil, 13–15 August 1998. [Google Scholar]
  3. Al-Hammad, A. Common Interface problems among various construction parties. J. Perform. Constr. Facil. 2000, 14, 71–74. [Google Scholar] [CrossRef]
  4. Arain, F.M.; Sadi, A.A. Consultant’s Prospects of the Sources of Design and Construction Interface Problems in Large Building Projects in Saudi Arabia. JKAU Environ. Des. Sci. 2007, 5, 15–37. [Google Scholar]
  5. Huang, R.Y.; Huang, C.T.; Lin, H. The study of interface problems among construction parties in MRT. J. Chin. Inst. Civ. Hydraul. Eng. 2008, 20, 269–283. [Google Scholar] [CrossRef]
  6. Chen, Q.; Reichard, G.; Beliveau, Y. Multi-perspective Approach to Exploring Comprehensive Cause Factors for Interface Issues. J. Constr. Eng. Manag. 2008, 134, 432–441. [Google Scholar] [CrossRef]
  7. Jarkas, A.M.; Radosavljevic, M. Motivational Factors Impacting the Productivity of Construction Master Craftsmen in Kuwait. J. Manag. Eng. 2013, 29, 446–454. [Google Scholar] [CrossRef]
  8. Molenaar, K.; Washington, S.; Diekmann, J. Structural equation model of construction contract dispute potential. J. Constr. Eng. Manag. 2000, 126, 268–277. [Google Scholar] [CrossRef]
  9. Wan Mohamed Radzi, C.W.J.B.; Salarzadeh Jenatabadi, H.; Hasbullah, M.B. Firm Sustainability Performance Index Modeling. Sustainability 2015, 7, 16196–16212. [Google Scholar] [CrossRef]
  10. Mainul Islam, M.D.; Faniran, O.O. Structural equation model of project planning effectiveness. Constr. Manag. Econ. 2005, 23, 215–223. [Google Scholar] [CrossRef]
  11. Yang, J.B.; Ou, S.F. Using structural equation modeling to analyze relationships among key causes of delay in construction. Can. J. Civ. Eng. 2008, 35, 321–332. [Google Scholar] [CrossRef]
  12. Cho, K.M.; Hong, T.H.; Chang, T.H. Effect of project characteristics on project performance in construction projects based on structural equation model. Expert Syst. Appl. 2009, 36, 10461–10470. [Google Scholar] [CrossRef]
  13. Kim, D.Y.; Han, S.H.; Kim, H.; Heedae, P. Structuring the prediction model of project performance for international construction projects: A comparative analysis. Expert Syst. Appl. 2009, 36, 1961–1971. [Google Scholar] [CrossRef]
  14. Yang, J.B.; Yang, C.C.; Kao, C.K. Evaluating schedule delay causes for private participating public construction works under the build Operate Transfer model. Int. J. Proj. Manag. 2010, 28, 569–579. [Google Scholar] [CrossRef]
  15. Thomas, S.N.; Yoki, M.W.W; James, W.M.W. A Structural Equation Model of Feasibility Evaluation and Project Success for Public-Private Partnerships in Hong Kong. IEEE Trans. Eng. Manag. 2010, 57, 310–322. [Google Scholar] [CrossRef]
  16. Zeynep, I.; David, A.; Irem, D.; Talat, B.M. Impact of Resources and Strategies on Construction Company Performance. J. Manag. Eng. 2010, 26, 9–18. [Google Scholar] [CrossRef]
  17. Hemanta, D.; Iyer, K.C.; Sawhney, A. Structural equation model for assessing impacts of contractor’s performance on project success. Int. J. Proj. Manag. 2011, 29, 687–695. [Google Scholar] [CrossRef]
  18. Bollen, K. Structural Equations with Latent Variables; Wiley-Interscience Inc.: Holoken, NJ, USA, 1989; ISBN 978-0-471-01171-2. [Google Scholar]
  19. Byrne, B.B. Structural Equation Modeling with AMOS: Basic Concepts, Applications, and Programming, 2nd ed.; Routledge: New York, NY, USA, 2010; ISBN 978-0-8058-6373-4. [Google Scholar]
  20. Anderson, J.C.; Gerbing, D.W. Structural Equation Modeling in Practice: A Review and Recommended Two-Step Approach. Psychol. Bull. 1988, 103, 411–423. [Google Scholar] [CrossRef]
  21. Kline, R.B. Principles and Practice of Structural Equation Modeling, 2nd ed.; Guilford Publications, Inc.: New York, NY, USA, 2005; ISBN 978-1-59385-057-3. [Google Scholar]
  22. Boomsma, A. The robustness of LISREL against small sizes in factor analysis models. In Systems under Indirect Observation: Causality, Structure, Prediction (Part I); Wold, H., Jöreskog, K.G., Eds.; North-Holland: Amsterdam, The Netherlands, 1982; pp. 149–173. [Google Scholar]
  23. Rigdon, E.E. Structural Equation Modeling: Nontraditional Alternatives. In Encyclopedia of Statistics in Behavioral Science; Brian, E., David, H., Eds.; Wiley: New York, NY, USA, 2005. [Google Scholar]
  24. Cronbach, L.J. Coefficient Alpha and the internal structure of tests. Psychometrika 1951, 16, 297–334. [Google Scholar] [CrossRef]
  25. Kline, R.B. Principles and Practice of Structural Equation Modeling, 3rd ed.; Guilford Publications, Inc.: New York, NY, USA, 2011; ISBN 978-1-60623-876-9. [Google Scholar]
  26. Schmacker, E.R.; Richard, G.L. A Beginer’s Guide to Structural Equation Modeling, 2nd ed.; Lawrence Erlbaum Associates: Mahwah, NJ, USA, 2004; ISBN 0-8058-4017-6. [Google Scholar]
  27. Jöreskog, K.G.; Sörbom, D. LISREL VI: Analysis of Linear Structural Relationships by the Method of Maximum Likelihood; National Educational Resources: Chicago, IL, USA, 1984; ISBN 0-8949-8024-6. [Google Scholar]
  28. Jöreskog, K.G.; Sörbom, D. LISREL VII: A Guide to the Program and Applications; SPSS: Chicago, IL, USA, 1991. [Google Scholar]
  29. Bentler, P.M. Comparative fit indexes in structural models. Psychol. Bull. 1990, 107, 238–246. [Google Scholar] [CrossRef] [PubMed]
  30. Browne, M.W.; Cudeck, R. Alternative ways of assessing model fit. In Testing Structural Equation Models; Bollen, K.A., Long, J.S., Eds.; Sage: New York, NY, USA, 1993; pp. 247–261. [Google Scholar] [CrossRef]
  31. Jöreskog, K.G.; Sörbom, D. LISREL 8: Structural Equation Modeling with the SIMPLIS Command Language; Scientific Software International: Chicago, IL, USA, 1993; ISBN 0-8949-8033-5. [Google Scholar]
  32. Hu, L.T.; Bentler, P.M. Cutoff Criteria for Fit Indexes in Covariance Structure Analysis: Conventional Criteria versus New Alternatives. Struct. Equ. Model. 1999, 6, 1–55. [Google Scholar] [CrossRef]
  33. Akter, S.; Ambra, J.D.; Ray, P. Trustworthiness in Health Information Services: An assessment of a Hierarchical Model with Mediating and Moderating Effects Using Partial Least Square (PLS). J. Am. Soc. Inf. Sci. 2011, 62, 100–116. [Google Scholar] [CrossRef]
  34. Fornell, C.; Bookstein, F.L. Two structural equation models: Lisrel and PLS applied to customer exit-voice theory. J. Mark. Res. 1982, 19, 440–452. [Google Scholar] [CrossRef]
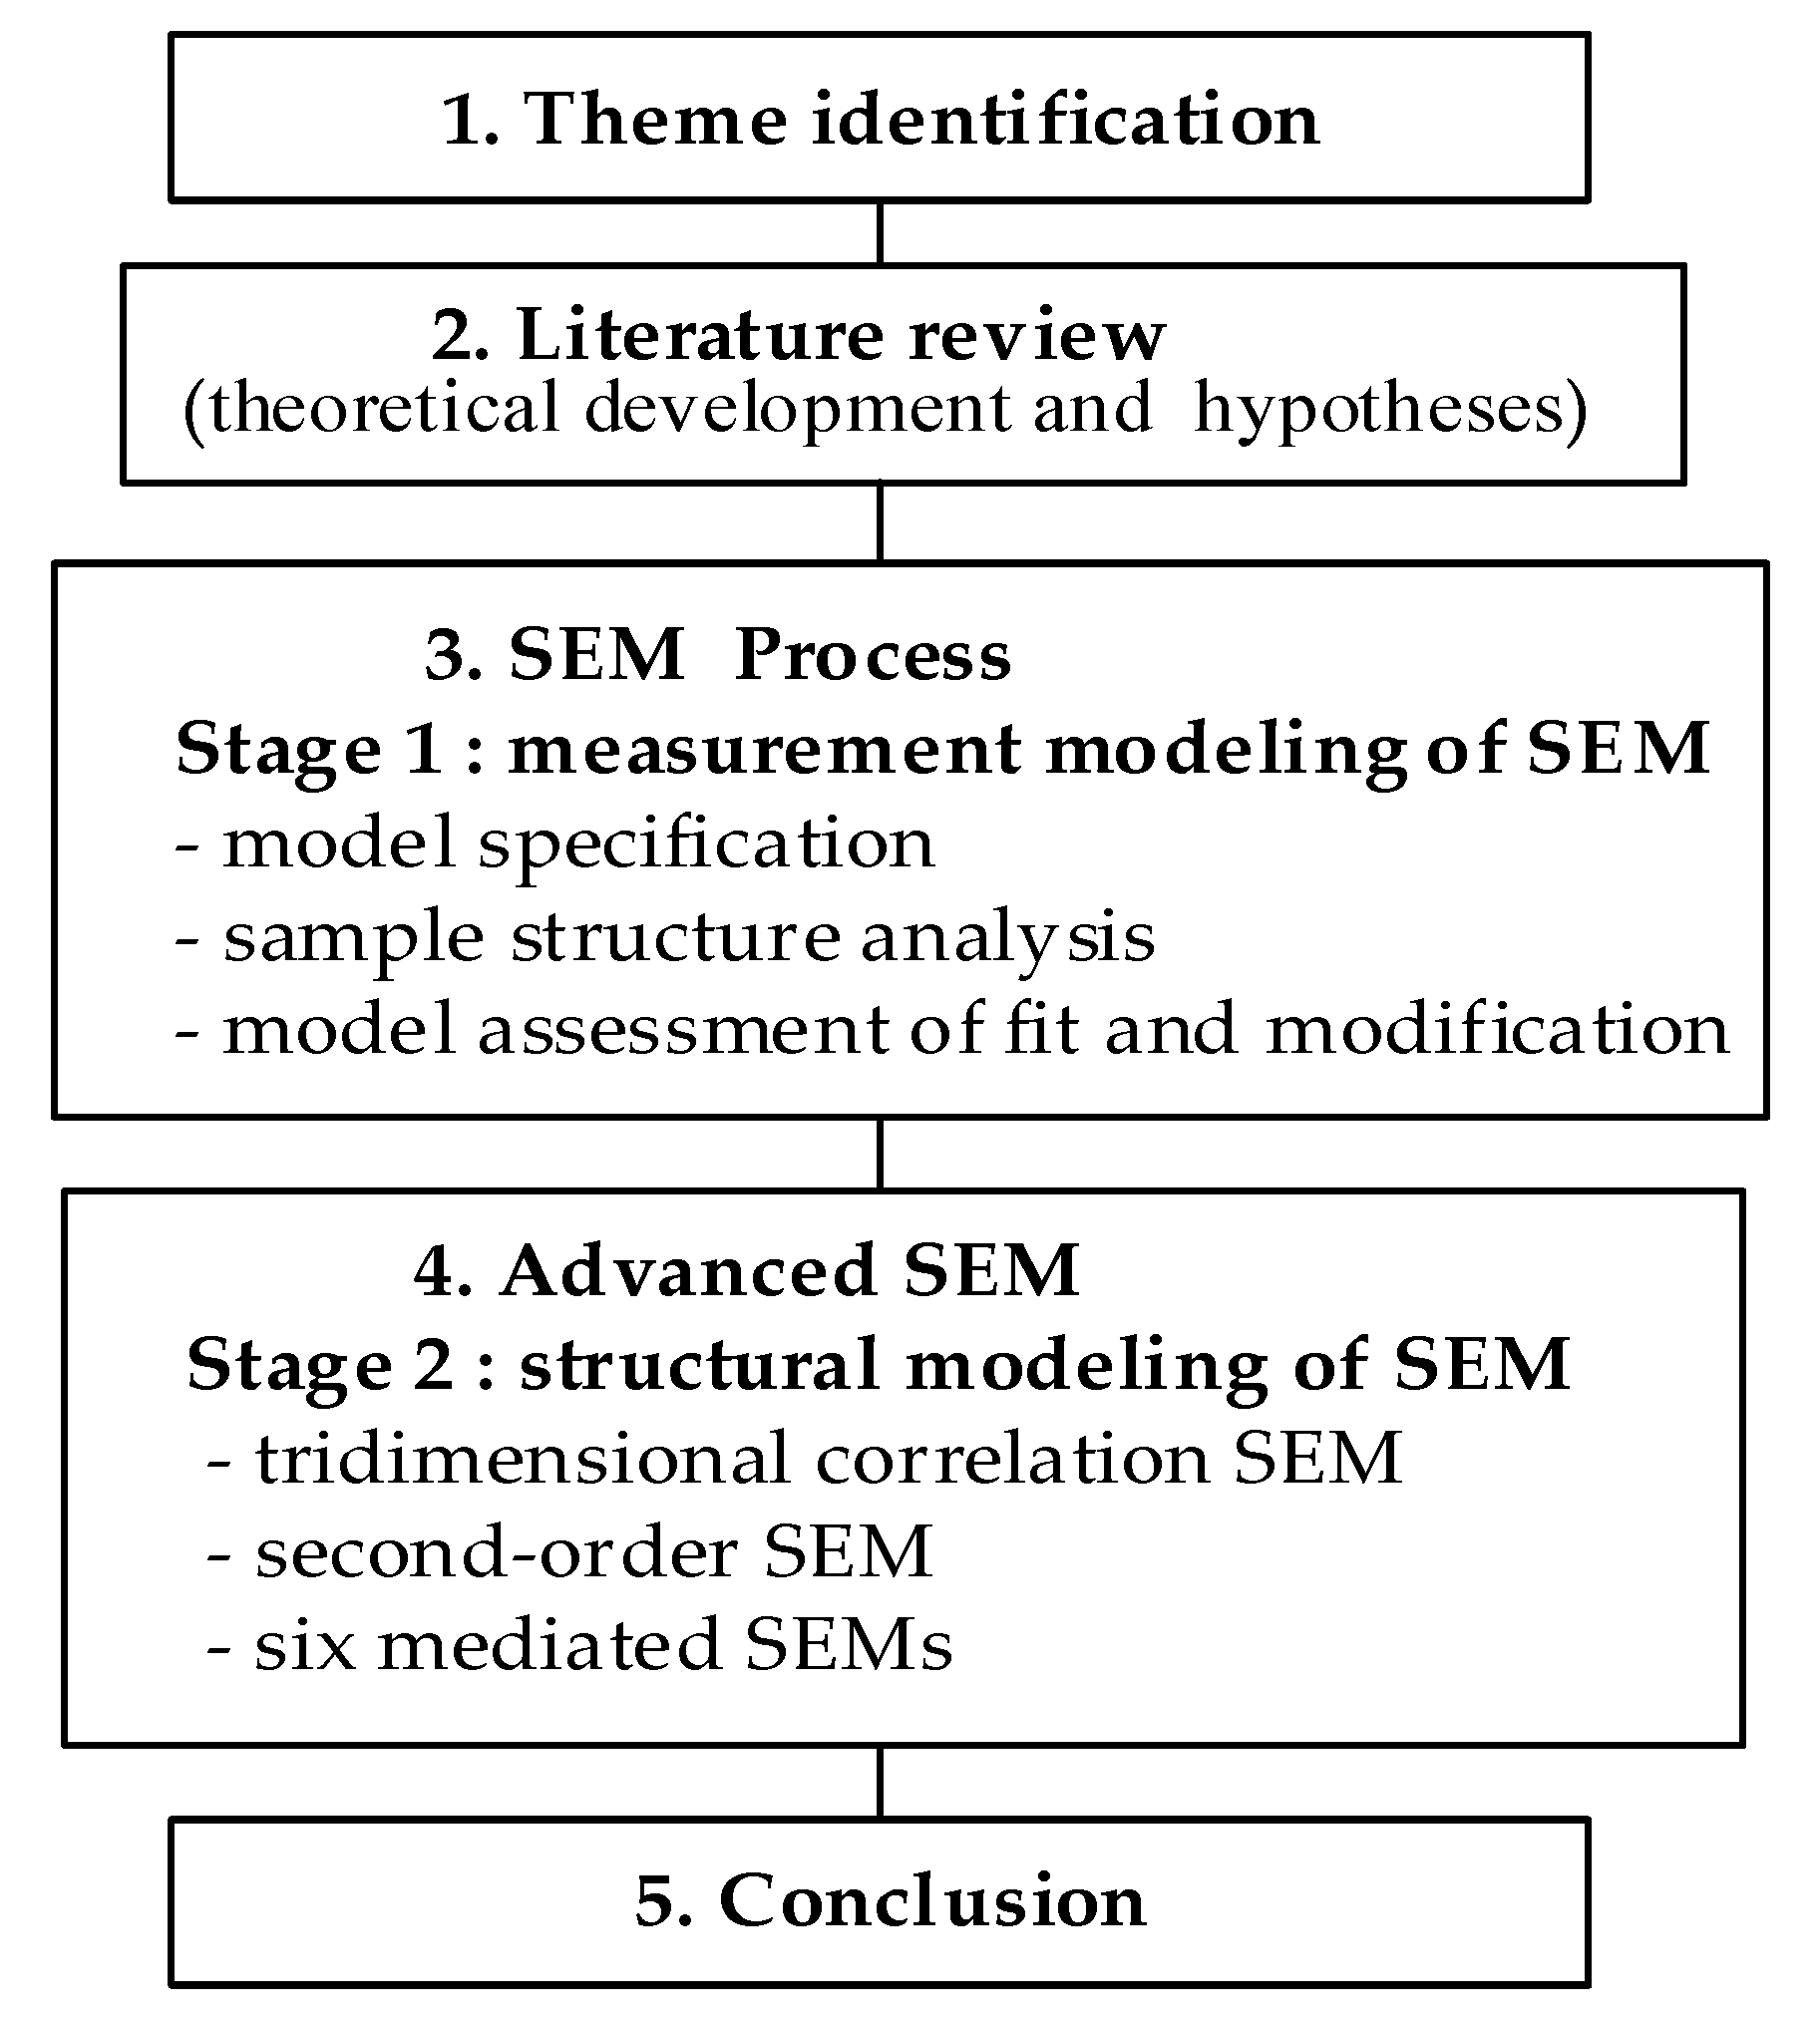
Figure 1. Research framework. SEM, structural equation model.
Sustainability 09 00822 g001
Figure 2. The tridimensional correlation SEM (TDC-SEM).
Sustainability 09 00822 g002
Figure 3. The second-order structural equation model; (***: Significantly different from zero at the 0.001 level).
Sustainability 09 00822 g003
Figure 4. Construction mediated structural equation model from owner perspective (CM-SEM-O).
Sustainability 09 00822 g004
Figure 5. Design mediated structural equation model from owner perspective (DM-SEM-O).
Sustainability 09 00822 g005
Table 1. Measures of interface factor for three initial measurement models.
FactorsFactor LoadingReliability (α)
Design dimension
D1-Short design time [4]0.470.87
D2-Minimal funds [3,5,6]0.23
D3-Inadequate professional knowledge and experience [2,5]0.66
D4-Insufficient information for design [4,5,7]0.65
D5-Lack of design manpower [4]0.67
D6-No knowledge of the actual construction processes during design [4,14]0.65
D7-Inadequate integration of construction interfaces [2,6]0.51
D8-Lack of design standards [2,12]0.57
D9-Lack of communication and coordination among design interfaces [4,5,6,11]0.67
Construction dimension
C1-Short construction time [6]0.480.86
C2-A low-cost contract [3,6,7]0.30
C3-Lack of communication and coordination among various construction interfaces [2,4,14]0.81
C4-Inadequate professional knowledge possessed by the construction and technical personnel [3,4,5,6]0.74
C5- Unsuitable machinery and materials for the construction methods [6]0.60
C6-Inadequate on-site management and supervision [1,3,4,6]0.67
C7-Inadequate construction scheduling [3,6]0.67
C8-Construction mistakes due to the improper reading of construction plans [4]0.78
C9-Construction mistakes and reworking [2,3,7] 0.57
Owner dimension
O1-No quality control because of a low budget [3,5,6]0.370.79
O2-Lack of supervision because of insufficient manpower [5,6]0.43
O3-Interface problems and coordination difficulties [5,6]0.63
O4-Extremely complex procedures for subcontracting (this study)0.63
O5-Inadequate communication and coordination among various departments [4,5,6]0.76
O6-Delayed payments [3,6,7]0.25
O7-Changes in business owner decisions [5,6,7]0.63
O8-Requirements that were not clearly defined in advance [1,3]0.62
O9-Delayed modification and approval of design documents [6,11]0.52
Note: Bold numbers in the table are factor loadings that are greater than 0.6, indicating that interface causes (observed variables) should be reserved [21].
Table 2. Measures of goodness-of-fit (GOF) for three dimension measurement models.
GOF IndicesAllowable Range (No Fit to Perfect Fit)Measurement Model
Design DimensionConstruction DimensionOwner Dimension
Initial ModelFinal ModelInitial ModelFinal ModelInitial ModelFinal Model
χ2/df5 to 12.7001.4002.2100.9203.2702.910
GFI0 to 10.8600.9900.8800.9700.8300.940
AGFI0 to 10.7600.9100.7900.9300.7300.810
CFI0 to 10.7900.9900.8900.9990.7200.920
RMSEA1 to 00.1370.0660.1150.0010.1580.145
RMR1 to 00.0760.0340.0730.0330.0950.062
SRMR1 to 00.0850.0350.0740.0330.1000.066
CR~ to 0.7 (or >0.7)0.7850. 8120.8570.8640.7910.797
AVE~ to 0.5 (or >0.5)0.3370.4250.4130.5170.3120.442
Table 3. Measures of interface factor ranking influenced for three final measurement models.
FactorsFactor LoadingRanking Influence
   Design dimension
D3-Inadequate professional knowledge and experience0.613
D4-Insufficient information for design0.575
D5-Lack of design manpower0.604
D6-No knowledge of the actual construction processes during design0.692
D9-Lack of communication and coordination among design interfaces0.711
   Construction dimension
C3-Lack of communication and coordination among various construction interfaces0.811
C4-Inadequate professional knowledge possessed by the construction and technical personnel0.782
C5- Unsuitable machinery and materials for the construction methods0.606
C6-Inadequate on-site management and supervision 0.684
C7-Inadequate construction scheduling 0.655
C8-Construction mistakes due to improper reading of construction plans0.773
   Owner dimension
O3-Interface problems and coordination difficulties0.672
O4-Extremely complex procedures for subcontracting0.624
O5-Inadequate communication and coordination among various departments 0.771
O7-Changes in business owner decisions0.633
O8-Requirements that were not clearly defined in advance0.624
Table 4. Summary of the Six Mediated Structural Equation Models.
Primary Perspective DimensionMediatorDirect Effect (1)Mediated (Indirect) Effect (2)Total Effect (1) + (2)
OwnerConstruction (C) (CM-SEM-O)O to D = 0.50O to C to D = 0.56 × 0.42 = 0.240.74
Design (D) (DM-SEM-O)O to C = 0.09O to D to C = 0.74 × 0.64 = 0.470.56
DesignOwner (O)D to C = 0.64D to O to C = 0.74 × 0.09 = 0.060.70
Construction (C)D to O = 0.68D to C to O = 0.70 × 0.08 = 0.050.73
ConstructionDesign (D)C to O = 0.08C to D to O = 0.70 × 0.68 = 0.470.55
Owner (O)C to D = 0.42C to O to D = 0.50 × 0.56 = 0.280.70
Note: The boldface characters in the table represent dimensions that directly or indirectly influenced the design dimension or were directly or indirectly influenced by the design dimension.