
Low Purchase Willingness for Battery Electric Vehicles: Analysis and Simulation Based on the Fault Tree Model


School of Management, China University of Mining and Technology, Da Xue Road 1, Xuzhou 221116, China
*
Authors to whom correspondence should be addressed.
Sustainability 2017, 9(5), 809; https://doi.org/10.3390/su9050809
Submission received: 20 April 2017
/
Revised: 8 May 2017
/
Accepted: 9 May 2017
/
Published: 12 May 2017
(This article belongs to the Section Energy Sustainability)
Abstract
:Purchase intention is the key to popularizing battery electric vehicles (BEVs) and to developing the industry. This study combines classical theoretical and qualitative research, and applies fault tree analysis (FTA) methods to study factors that hinder BEV purchase, and identify the logical relationship between top fault events and basic events, by calculating minimal cut sets and minimal path sets. Activity based classification analysis was used to investigate the key basic event and key event combination (i.e., minimal cut sets) that hinders purchase intention, with the effectiveness and feasibility of the proposed method verified by Monte Carlo simulation. The results indicate (1) there were 26 minimal cut sets and 18 minimal path sets in the fault tree model, and the fault tree was defined by four key event combinations and five key basic events; and (2) by reducing key events’ failure probability, the probability of fault tree cumulative occurrence was reduced from 0.86021 to 0.57406 over 100,000 Monte Carlo simulations, i.e., the willingness to purchase BEVs was significantly increased. Thus, the proposed FTA method was feasible and effective for addressing low purchase intentions. Consequently, some policy implications are suggested.
1. Introduction
The Paris Agreement came into effect on 4 November 2016 with the intention to limit global temperature rise to less than 2 °C above pre-industrial levels [1]. The transportation sector is a major oil consumer, and is one of the major sources of greenhouse gas and air pollutant emissions [2]. Carbon emission from vehicles has grown by 25% [3], and carbon emission from private cars now exceeds that from freight [4]. China has become the largest car producer and seller in the world, and is expected to maintain rapid growth such that by 2020, car ownership will exceed 200 million. Thus, energy supply and demand contradictions and environmental pollution problems will only become more prominent. China’s 13th Five Year period is important for low carbon energy transformation, and the car industry will face more severe energy problems, environmental protection, and other issues. To alleviate these problems, the development of clean, energy efficient cars must be a strong development direction. Battery electric vehicles (BEVs) energy efficiency significantly exceeds traditional fuel vehicles, particularly within cities, since BEVs are more suitable for low speed driving [5].
From an international perspective, the US Congress proposed the Electric Vehicle Development Act in 2010 to invest $800 million for five pilot cities to provide consumer BEV subsidies and infrastructure. The Japanese government has also promised to invest 21 billion yen by 2020 to develop new large capacity BEV batteries. The EU issued the EU Future Energy: Green Paper on Renewable Energy, to promote BEV development in major European countries. In China, the 2015 National Development and Reform Commission issued the Electric Vehicle Charging Infrastructure Development Guide, which proposed 12,000 charging stations and 4.8 million pieces of scattered charging piles to meet the expected 5 million electric vehicles charging demand by 2020, along with the Electric Vehicle Power Battery Recycling Technology Policy, which covered electric vehicle battery design, production, recycling, and utilization with specific provisions.
Although many countries have developed policies to encourage BEV development, even with policy support, energy savings, and environmental protection advantages, BEVs have not been favored by consumers. Even in Norway, the BEV market leader, BEVs account for only approximately 2% of the total national fleet [6]. Therefore, it is essential to investigate consumer willingness to purchase BEVs. Factors that hinder purchase intention will be of great significance to the formulation of relevant guidance policies.
Fault tree analysis (FTA) is a graphical deduction method that follows the principle of logical deductive analysis to derive an event’s cause from the event results. The unwanted event is placed as the fault tree top event, and logical OR and AND gates are used to analyze all possible direct causes and logical relationships that lead to its occurrence. The tree is gradually deepened until the basic cause of unwanted events can be defined, i.e., the basic event of the fault tree. FTA comprises qualitative and quantitative levels to determine the root causes of system failure, where the quantitative level is characterized by intuitive, clear, strong logic, and has been widely applied for aerospace, energy, electricity, transportation, and other areas of fault diagnosis. It is recognized as a simple and effective means of evaluating system reliability and safety. In this particular case, many factors could prevent residents from buying BEVs. FTA can effectively identify the most critical factors, providing a sound basis for formulating relevant policies and measures.
Many scholars have been exploring the impacts of BEV purchase intention factors using a variety of methods, but FTA has rarely been applied. Therefore, the current study incorporates three innovations.
- (1)
- Apply FTA from a micro-scale perspective, i.e., low willingness to purchase BEVs. Basic events are deduced from the top event, and the minimal cut sets and minimal path sets are calculated, to identify the logical relationship among these basic events.
- (2)
- Apply Monte Carlo simulation and activity based classification (ABC) analysis to identify the key combination (factor), sub-key combination (factor), and the general combination (factor) for the minimal cut sets and basic events from the fault tree, providing quantitative priority decisions for corresponding measures. The effectiveness and feasibility of the proposed method was verified by Monte Carlo simulation by reducing the failure probability of key basic events failure probabilities.
- (3)
- Combining classical theoretical and qualitative research, maximization reduces the influence of subjective factors on FTA and ensures reliability and universality of the final model.
Section 2 reviews BEV policy implementation, supporting facilities, and related attributes to identify factors that hinder consumer BEV purchase. Section 3 constructs the fault tree, calculates the minimal cut sets and minimal path sets, and provides the analytic expressions for the structural and probability importance. Section 4 details the Monte Carlo simulation and analyzes the outcomes, which are further discussed in Section 5. Section 6 provides our conclusions and suggests some policy implications.
2. Literature Review
2.1. Policy Factors That Hinder BEV Purchase
There has been much research studying factors that hinder BEV purchase, with many significant achievements. BEVs are a new type of automobile product, and their promotion is largely dependent on government policy support. Zhang et al. [7] and Green et al. [8] showed that in the current market environment, unwillingness to purchase BEVs is mainly because residents do not understand electric car policies. From an economic point of view, studies such as Lane and Potter [9], Aasness and Odeck [10], Sierzchula et al. [11], and Hackbarth and Madlener [12] have shown that government economic incentives can save significant money for BEVs users, and various tax incentives, loan policies, and other economic stimulus policies have significantly affected purchase behavior. Lai et al. [13] showed that, although China has introduced many incentives for BEV development, the policy is not comprehensive and systematic, and the weak competitiveness of the policy environment is an important factor that hinders BEV purchase. Franke and Krems [14] argued that low subsidy and tax incentives had a negative impact on purchase intentions. Some non-fiscal policies’ effects are not obvious, such as free parking and the use of special lanes [6,12,15]. Currently, the Chinese government provides resident subsidies, purchase tax relief, and other one-time preferential policies only in the purchase links, but preferential policies around purchase links usage are relatively backward [16]. In terms of industrial development, charging facilities with unified charging interfaces are a prerequisite for BEV promotion. Interface standardization is critical to ensure operational safety and interchangeability for BEV charging [17]. The current randomness and intermittence of BEV charging results in disordered charging and increases the load on the electricity network. Standardizing the charging interface and information is essential for achieving efficient two-way interaction between the BEVs and the power grid, promoting BEV development, and meeting the growing demand for BEVs [18]. China’s charging facilities have not yet formed clear planning objectives, unified supervision policies, technical standards, or standard operation procedures, resulting in lagging and uneven distribution of charging infrastructure, which has become a significant obstacle to the promotion and popularization of BEVs.
2.2. Full Life Cycle Service Factors That Hinder BEV Purchase
BEV sales are currently not high, and imperfect supporting facilities are an important factor restricting purchases [19]. Rezvani et al. [20] argued that BEVs have many technological differences compared to traditional fuel vehicles, but the market lacks professional pre-sales consulting staff. David [21] showed that potential consumers with a lower level of BEV knowledge had lower purchase intention. In addition to the lack of professional pre-sale consulting services, the lack of a true BEV trial drive also impacted purchase willingness, and practical experience of BEVs can enhance the degree of understanding, changing previous negative views [22,23]. Most studies suggest that residents should be provided with opportunities to experience BEVs, such as a trial drive, car sharing, etc., to improve purchase willingness.
There is generally only a single purchase channel for BEVs, and there are less car insurance options. Hence, residents perceive BEVs as having greater risk.
Barth et al. [24] showed that the low penetration rate of charging points seriously hinders purchase willingness, mainly because installation of a private charging point is severely restricted and approval procedures are extremely complex [25,26]. Compounding this, public charging points have long installation periods, coupled with higher urban construction land acquisition costs, resulting in higher installation costs and larger installation resistance [6]. A study by the National Renewable Energy Laboratory showed that the penetration rate of charging points was low and 79% of US respondents did not know of any charging stations, although 53% of respondents indicated that they could park their vehicles near electrical outlets at home [27]. Hackbarth and Madlener [12] showed that BEV battery endurance was lowered due to the lack of charging points and the development of battery technology. This made it difficult to meet long distance travel requirements, and the owner generally experienced mileage anxiety, further reducing their purchase intention [28].
BEVs are an emerging industry with significantly less repair and maintenance points than conventional vehicles. Diverse BEV models have different maintenance techniques, which increases maintenance difficulty and hence cost [29]. Residents perceive that once a problem occurs, it will be difficult to get BEVs quickly repaired.
Xiao and Li [30] believe that the annual inspection of BEV battery systems is very complex. The factory has already performed puncture, wading, and other tests, but these tests are not suitable for the annual inspection, and the battery aging problem has become increasingly prominent, further increasing the difficulty of the annual inspection and affecting purchase intention.
2.3. Attribute Factors That Hinder BEV Purchase Intention
Certain BEV attributes greatly hinder purchase intention [31].
- (1)
- Cost. Rezvani et al. [20], Lieven et al. [32], and Adepetu and Keshav [33] showed that compared to the same level of fuel vehicles, BEV’s higher acquisition cost was a major factor hindering purchase. Furthermore, repair (once a problem occurred) and maintenance costs were higher. Jensen et al. [22] showed that BEVs were generally considered to have three shortcomings: high acquisition cost, long charging time, and limited mileage. More than 51% of residents consider the higher BEV price as the main obstacle for purchase. Caulfield et al. [34], and Caperello and Kurani [35] showed that BEV purchase and operating costs were the most important factors for residents. Li [36] proposed that the key factors restricting China‘s BEVs industry was still the high cost of BEV purchase, coupled with low market acceptance and government subsidies. Ye and Zhou [37] reached the same conclusion, and showed that in addition to the high purchase cost, residents were also concerned about security risks due to immature BEV technology and the high cost of battery replacement. Singer (2015) surveyed 1015 households in the US and showed that although 45% of respondents believed that BEVs were as good as or better than gasoline vehicles, respondents who did not consider buying BEVs considered the expensive price (55%) and unreliable technology (31%) as the two major factors hindering their purchase decision [27].
- (2)
- Dynamic performance. BEV purchase intention is still relatively conservative, with residents mainly concerned about performance and cognitive factors. Hackbarth and Madlener [12] showed that battery endurance was one of the main technical factors affecting BEV use. Egbue and Long [38] showed that battery endurance was more of a concern for residents than cost. Battery technology constraints means that battery endurance is low, approximately 100–300 km, which does not meet residents’ long distance travel requirements, and battery life is quite short. Meanwhile, BEVs would need to travel 300 miles for a majority of US consumers (56%) to consider purchasing them [27]. These factors significantly reduce BEV market acceptance [39]. Michael et al. [40], and Glerum et al. [41] showed that immature battery technology meant less charge points and longer charge times. Thus, residents were concerned that BEVs could not be quickly charged, affecting daily work and life, or could not meet long distance travel requirements [28]. Lieven et al. [32] showed that residents were mainly concerned with BEVs purchase price, driving distance, engine performance, vehicle durability, convenience, and environmental impact. Ewing and Sarigöllü [42] showed that some residents were concerned that BEVs speed and performance could not meet their needs.
- (3)
- Hardware facilities. With increasing resident incomes, more cars are being purchased by the public. Residents consider more than just the initial price, including quality, brand, after sales service, appearance, style, comfort, and other issues. Graham et al. [29] surveyed 40 UK BEV owners and found that some owners were embarrassed because of the vehicle appearance or poor performance. Brownstone et al. [43] showed that the size of the car’s luggage compartment was an important consideration for household cars. Deloitte Consulting showed that for the United States, BEV reliability is one of the most important factors that residents consider. Residents are most concerned about BEV battery issues, mainly including charging, lifetime, driving range, and maintenance, which are also the biggest obstacles in the BEV market. Skippon and Garwood [26] and Lieven et al. [32] showed that residents were more concerned with BEV reliability and safety, such as structural design, materials used in collision sites, safety equipment, etc.
Residents’ BEV purchase behavior is a type of consumption behavior. Therefore, consumer behavior theory is the main theoretical basis for studying residents’ motives for green consumption. The current study considers six typical theories and models on the formation process and influencing factors of individual consumption behavior: reasoned action [44], planned behavior [45], attitude context behavior [46], responsible environmental behavior [47], environmental value attitude system model [48], and interpersonal behavior [49].
Reviewing consumer behavior choice theory, we found that there was currently no relevant behavior theory. BEV purchase, with planned behavior, attitude context behavior, and other related behavior theories only cover general individual behaviors. Definitions of factors influencing individual behaviors are not consistent between the different behavioral theories. Thus, existing behavior theories cannot fully explain individual green consumer behavior, and a specific green consumption behavior comprehensive theoretical model should be constructed based on general behavior theory to study the driving mechanisms for green consumption behavior.
Therefore, the current study differs from previous behavioral economics studies as follows. (1) Existing literature regarding the definition of factors affecting specific green consumption behavior is not consistent. Most scholars have studied only the direct impact of each factor on green consumption behavior, and rarely considered interactions between the factors. In particular, few studies have focused on key factors or combinations of obstacles to BEV purchase. (2) The current paper combined qualitative and quantitative research to construct a fault tree for low BEV purchase willingness, and analyzed the key factors that hindered BEV purchase. Logical relationships between basic events and the occurrence mode and root cause of the fault tree are discussed. Monte Carlo simulation and ABC analysis identified the fault tree key factors and combinations, and verified the effectiveness and feasibility of this method in reducing the failure probability of key basic events. This study provides a new basis for management assistance.
3. Research Methodology
3.1. Fault Tree Construction
3.1.1. Research Method
Grounded theory is an exploratory method, and one of the most influential research paradigms in social science. It stands at the forefront of the qualitative research revolution, providing not only validation for previous theories, but also extracts new concepts from the bottom up in the analysis of materials, and perfect classical theory to complement each other [50,51].
Our previous field survey showed that many people are not consistent in their understanding of BEV, or misunderstand the survey. Thus, difference structured questionnaires may not be effective for large sample quantification studies. Therefore, this paper used an unstructured questionnaire, i.e., an open questionnaire, based on the exploratory qualitative research method of grounded theory to conduct one-on-one in-depth interviews with representative urban residents. Grounded theory steps include open, axial, and selective coding [52].
3.1.2. Sample Selection
This study used the method of theoretical sampling, and the first process of qualitative research is data collection, which was in-depth interviews with representative urban residents. Since the interview dialogue was the main data source, interviewee choice was somewhat cautious, requiring participants to have a certain understanding of BEVs. Thus, interviewees were limited to residents who wished to purchase, or already owned, a private car. They were all active middle aged or young people. The number of interviewees was based on theoretical saturation, using the concept of continuous comparison in the data analysis process, constantly refining and correcting the theory until saturation was achieved, i.e., if a new sample provided no new important information, sample acquisition extraction can be stopped. Thus, we selected 32 interviewees from Beijing, Shanghai, and Jiangsu, as summarized in Table 1. During the in-depth interviews, two respondents chose to leave halfway (after 27 and 19 min, respectively). The remaining 30 interviewees were interviewed for approximately 1 h, to provide sufficient time for the interviewee to consider the questions and provide thoughtful answers. Interviewers established a participatory dialogue, to guide the interview from their own point of view that focused on the interview content.
To ensure the data was comprehensive and effective, all the interviews were completed independently by the author, using face-to-face and online interviews (see Table 1). The open interview outline design is summarized in Table 2. The specific interview content was adjusted according to the actual situation, but influencing factors for the interviewee’s willingness to purchase a BEV was the constant focus. Detailed inquiries from different angles were made during the interview according to real time conditions.
All interviews were recorded, with the consent of the interviewee. Once all interviews were complete, we sorted the recordings and established approximately 50,000 interview words. We randomly selected 2/3 of the interview records (20 copies) for grounded coding analysis, with the remaining 1/3 (10 copies) used for saturation testing. To ensure reliability and validity, the procedure was strictly based on Strauss and Corbin’s grounded coding technology. To avoid coders’ personal bias influencing the coding results, and to improve coding objectivity, a combination of personal and Delphi method coding was employed [53].
Glaser and Strauss (1967) proposed the theoretical saturation standard to determine whether sampling for a particular category was saturated [52]. Saturation means that no more information can be found relevant to the category characteristics. Saturation tests were performed on the reserved interview records (10 copies), and showed that the model categories were well developed. No new category or relationship within the main category hindered consumers from purchasing BEVs, and no new constituent factors were formed within the main category. Therefore, the grounded theory analysis was theoretically saturated.
In Section 2 we reviewed a large number of representative relevant literature studies to explore factors that hinder BEV purchase, and defined three main categories and 18 sub-categories. Yue et al. [54] and Elnakat and Gomez [55] used similar research methods for sample selection. The interview results were consistent with the literature research, which validates that the results of the grounded theory are reliable.
After processing the interview records and showing theoretical saturation, 30 samples were analyzed based on grounded theory to establish the preliminary model. The interviews showed that obstacles to BEV purchase were mainly concentrated in the following three areas.
- (1)
- Construction of charging facilities is very slow.
- (2)
- BEV attributes need to be optimized.
- (3)
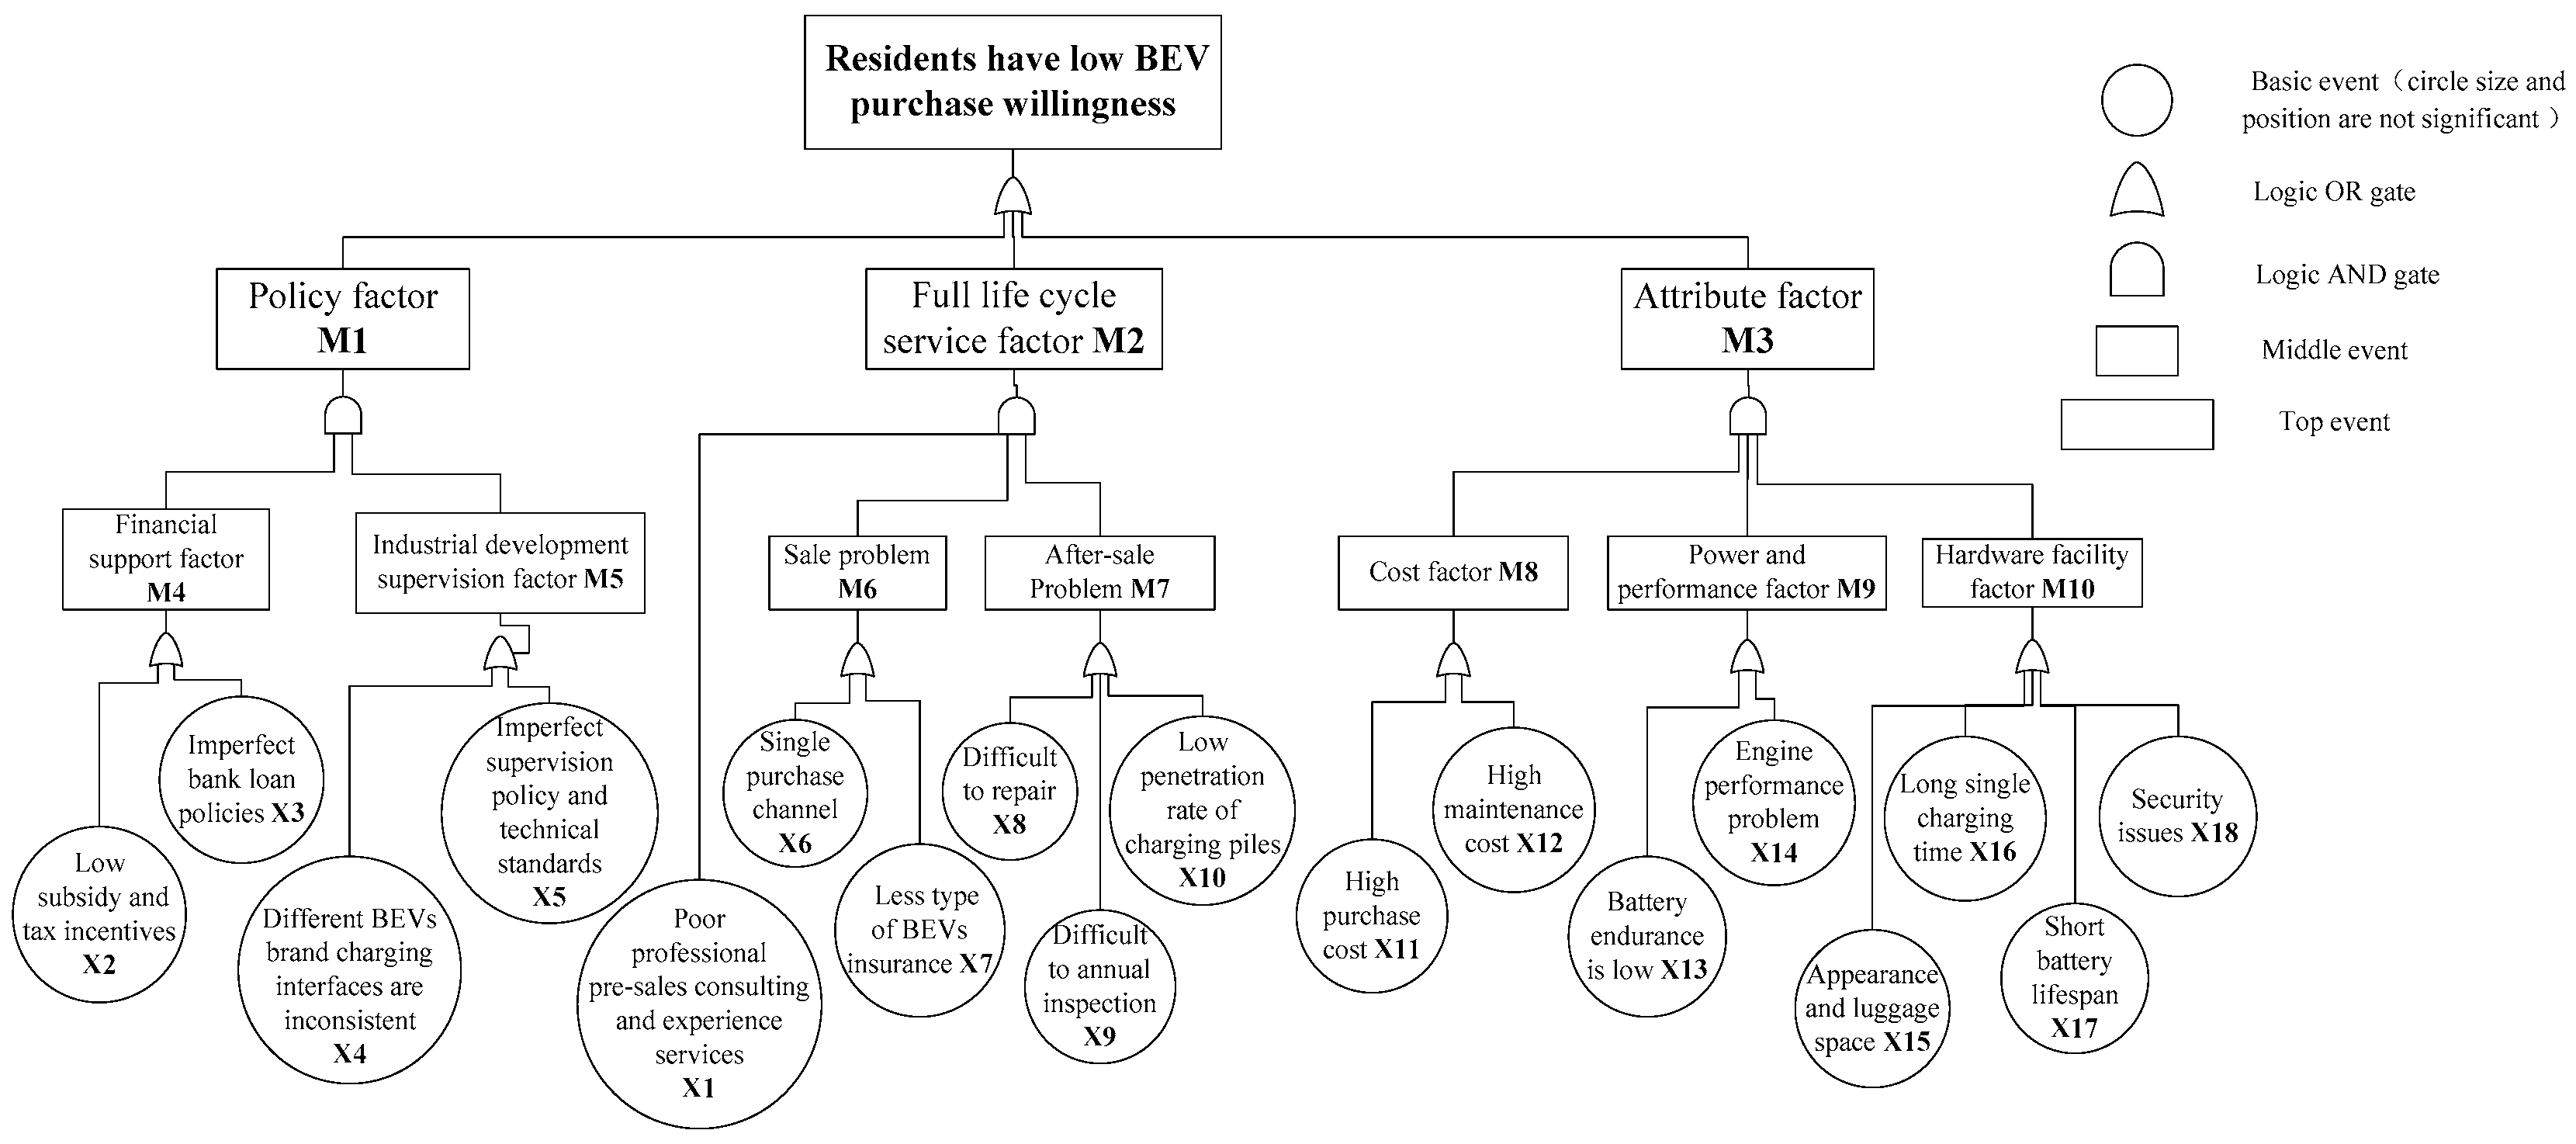
- Policy supervision is poor, and particularly the charging interface standard for public charging points is not unified. The various enterprises use their own charging interface standards, resulting in non-universal BEV brand charging interfaces, and it is difficult to unify public charging facilities across a large area, causing distress to the residents. They hope the government can implement unified charging interface specifications and standards. Therefore, this paper proposes that “different BEV brand charging interfaces are inconsistent” for the fault tree model.
3.2. Qualitative Analysis
3.2.1. Minimal Cut Sets
Let the fault tree structure function be ; and be an n-dimensional state vector, where is the state vector of the i-th basic event, and is the total number of basic events.
Let be the cut sets of a fault tree, where , i.e., when all the basic events occur in any cut sets, the top event will occur. If the basic event contained in a cut set is arbitrarily removed, the set is no longer a cut set, and is called the minimal cut set (MCS). The total number of MCS is denoted by K.
3.2.2. Minimal Path Sets
We define the minimal path set (MPS) of fault trees, where the total number of MPS is denoted by P. The Boolean expression of the successful tree is
and the MPS of the successful tree is
The fault tree has 18 MPSs, indicating that there are 18 types of programs that can be used if the top event occurs. P1, P2, P4, and P5 are composed of five basic events, representing the shortest path to enhance resident willingness to buy BEVs. P17 and P18 are composed of nine basic events, which is difficult to control. However, one of the five basic events relates to BEVs attributes (technical bottlenecks). If this were overcome, the control difficulty would be significantly reduced.
3.3. Quantitative Analysis
To calculate the fault tree, we assume that (1) the basic events are independent of each other, and (2) only two states–occurred or not, are considered in both basic events and the top event.
Importance is an important index of fault tree analysis, and is divided into structural importance degree and probability importance degree. The structural importance degree represents the magnitude of the impact of the basic event in the position of the fault tree. The probability importance degree represents the impact of the probability of occurrence of a basic event on the top event.
The structural importance degree is
where is the structural importance degree of the i-th basic event, and n is the number of basic events contained in the system.
The probability importance degree is
where is the top event occurrence probability, and is the probability of occurrence of the i-th basic event.
4. Monte Carlo Simulation of the Fault Tree
Monte Carlo simulation is a numerical method based on probabilistic mathematical statistics theory, using statistical experiments and stochastic simulation of random variables to solve approximate solutions of mathematical, physical, and engineering problems. The Monte Carlo method is used for computer simulations, which can not only deal with a large amount of data quickly, but also avoids subjective data, which improves the objectivity of the results.
4.1. System Description and Simulation Process
The MCSs of policy, full life cycle service, and attribute factors in the fault tree were calculated following Equation (1). Let S be the system, be the j-th event of the i-th MCS that causes the policy factor to fail, and be the j-th event of the i-th minimal cut set that causes the full life cycle service factor to fail, then represents the j-th event of the i-th MCS that causes the attribute factor to fail, and is the state vector of the basic event in the k-th run of the system,
- , the basic event does not occur during the k-th run,
- , the basic event occurs during the k-th run.represents the state vector of the top event in the k-th run of the system,
- , the top event does not occur during the k-th run;
- , the top event occurs during the k-th run.
where is determined by .
Let N be the number of simulations of the system, then represents the number of occurrences of the j-th event of the i-th minimal cut set that causes the policy factor to fail, represents the number of occurrences of the j-th event of the i-th minimal cut set that causes the full life cycle service factor to fail, and represents the number of occurrences of the j-th event of the i-th minimal cut set that causes the attribute factor to fail.
The failure simulation process is described in Figure 2.
4.2. Simulation Process and Results
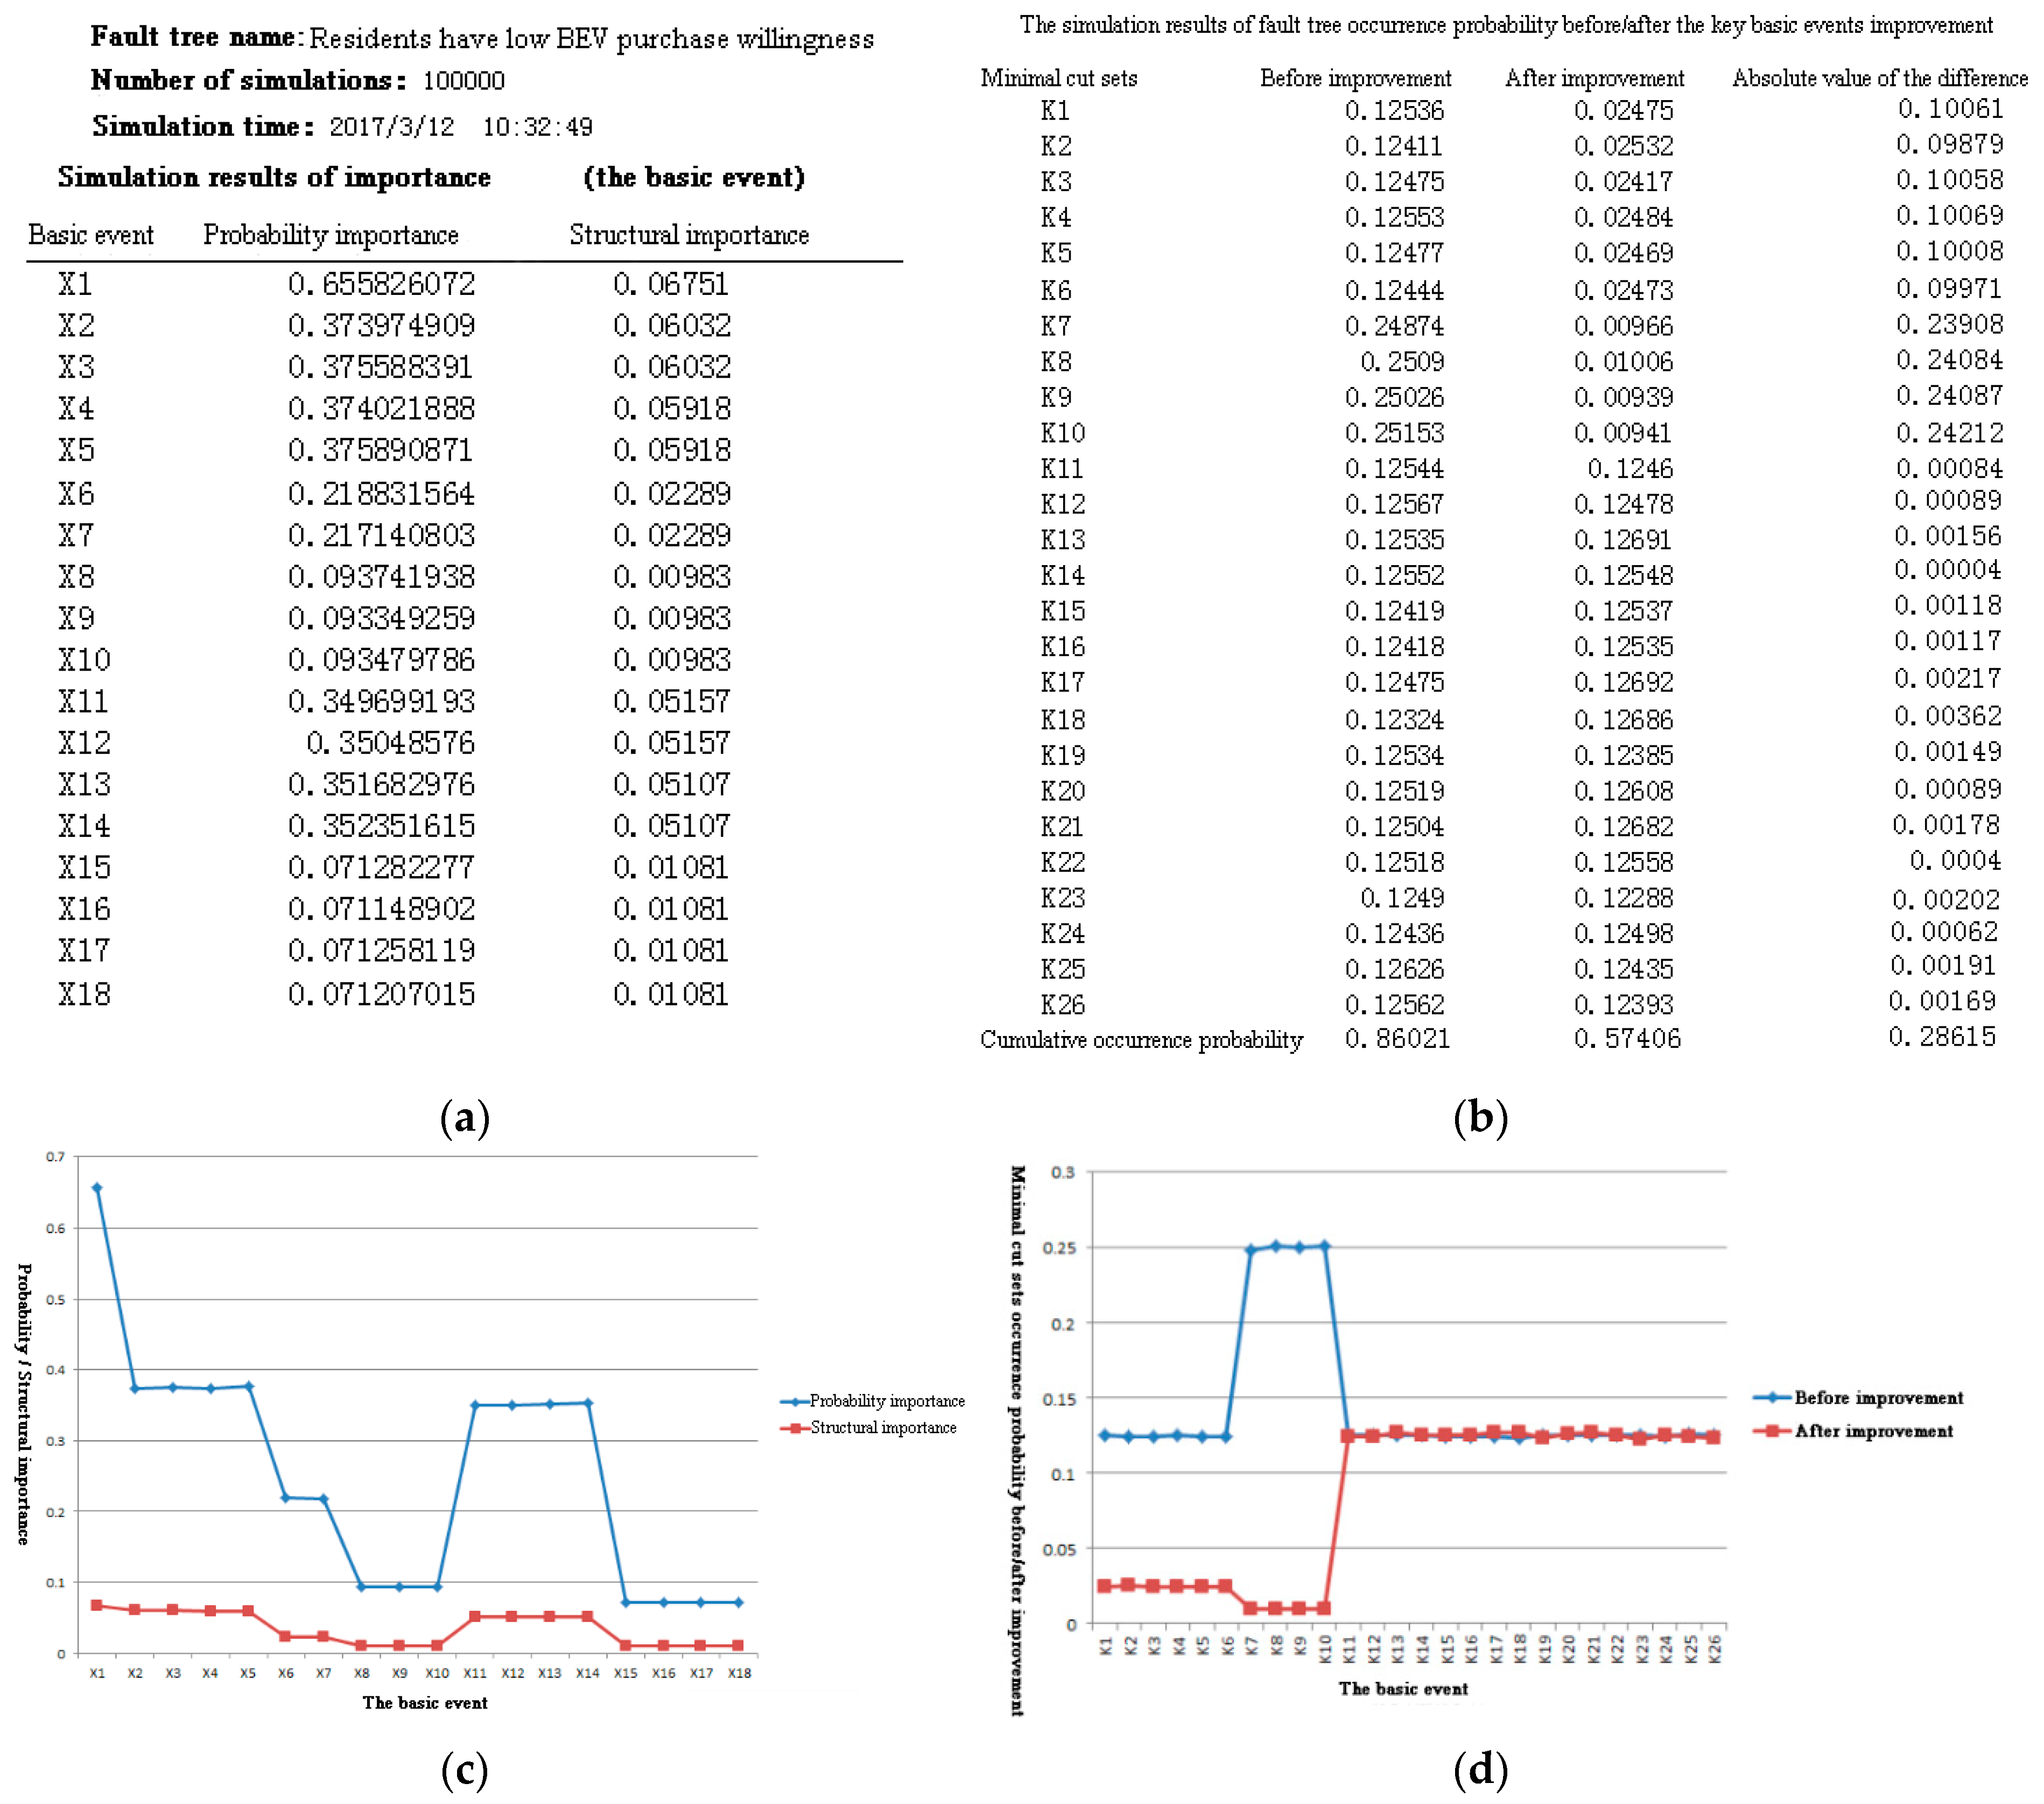
Assuming that each basic event is uniformly distributed, the simulation results obtained by the Monte Carlo simulation (100,000 cycles) are shown in Figure 3.
To quantitatively identify the key factors that hinder BEV purchase intention, i.e., the key basic events, and the key factor combinations, i.e., the key MCSs, the basic events and MCSs were classified by ABC analysis. ABC analysis is based on the technical or economic aspects of the main features to distinguish between key and general factors to distinguish the management of different methods. The objects to be analyzed are generally classified into class A (key factors), B (sub-key factors), or C (general factors).
The structural importance of the 18 basic events of the fault tree were calculated following Equation (3), and sorted by Monte Carlo simulation (100,000 cycles). The structural importance of the basic events is , with the simulation results shown in Figure 3a. Based on the degree of aggregation of the structural importance of basic events, ABC analysis was used to analyze the structural importance of basic events and divide them into three categories, as shown in Table 4.
Similarly, from Equation (4), we assumed that the probability of occurrence of the key basic events X1, X2, X3, X4, and X5 is and other events remained uniformly distributed. Monte Carlo simulations were used to calculate the probability importance of the 26 MCSs before and after improvement. The simulation results shown in Figure 3b,d show the probability of occurrence before and after improvement. From the difference between the probability of occurrence before and after improvement, the ABC method divided the MCSs into three categories, as shown in Table 5.
Thus, the key to improving the fault tree is the class A basic events and class A MCSs. Reducing the probability of failure of the key basic events and Monte Carlo simulations, the occurrence probability of the key minimal cut sets K7, K8, K9, and K10 in Figure 3b were reduced from to , and the probability of the cumulative occurrence of the fault tree was reduced from 0.86021 to 0.57406. Therefore, the improvement of key basic events can reduce the probability of occurrence, thereby reducing MCSs’ probability of occurrence, and reducing the failure probability for BEV purchase intention and ensuring the effectiveness of the relevant measures.
The Monte Carlo method requires that the number of simulations be sufficient to meet the desired simulation precision. Previous studies have often used the trial method, i.e., gradually increasing the number of simulation operations to observe the changes in the output of the results, and the simulation is terminated when the general trend is stable convergence [56,57]. However, since the probability of occurrence of the 18 basic events of the fault tree cannot be accurately assigned in practice, it can only be assumed that each basic event is uniformly distributed. Therefore, the simulation results were analyzed for 100,000 and 200,000 simulations, where the basic events of the fault tree were simulated with a random number. Randomness was checked to ensure that uniformity and independence are in accordance with the requirements. The simulation results for 100,000 cycles were consistent with those from 200,000 cycles, indicating that the simulation had converged after 100,000 cycles. The simulation results were in agreement with the actual results, and the literature also supports the results of this study.
To further verify the simulation accuracy, this paper used the Boolean algorithm to sort the structural importance of fault tree basic events [58]. Four principles were followed in sorting the structural importance of basic events using the Boolean algorithm. (1) When the minimal cut/path set contains only one basic event, that basic event has the largest structural importance. (2) All basic event structures that appear only in the same minimal cut/path set are equal. (3) When the number of basic events included in the minimal cut or path sets are equal, the more often a basic event occurs, the larger its structural importance. (4) When two basic events occur simultaneously in different minimal cut/path sets, the structural importance of the basic event in the minimal cut/path set with less basic events is larger.
The MCSs and MCPs of the fault tree were calculated in Section 3.2.1 and Section 3.2.2, and the structural importance of the basic events of the fault tree is .
From the Monte Carlo simulation, we can also sort the structural importance of the basic events as .
The two sorted lists only differ slightly for basic events with relatively low structural importance, while basic events with relatively high structural importance are identical, i.e., there was no effect on the final determination of key basic events for classes A, B, and C. Therefore, the simulation results are reliable.
5. Discussion
The BEV industry has entered a new stage in time and market share. During the transition from a policy-driven industry to being driven by both policies and markets, it is crucial for manufacturers and dealers to win over customers as soon as possible. Previous studies have considered higher purchase costs [20,32,35], lack of charging points [40,41], and shorter driving mileage [12,28,38] as key factors hindering BEV purchase. However, the current study found that professional pre-sales consulting and service experience (such as the trial ride/drive experience) and policy factors have become key factors affecting residents BEV purchase willingness, i.e., the key basic event X1.
Regarding the class A key basic event X1, Schulte et al. [59] argued that experience was a prerequisite for the formation of intention, which determines whether people can accept a product. For this study, this is the BEV knowledge and driving or riding experience. Thus, a real BEV driving experience can effectively change resident’s BEV perceptions, highlighting BEV advantages and improving their purchase intention. This is consistent with previous findings. Franke and Krems [14] showed that actual BEV experience was helpful for residents to correctly estimate their usual travel distances, reducing their mileage anxiety, and increasing their purchase willingness. Barth et al. [24] have also shown that actual experience has a positive impact on the formation of BEV purchase intentions.
The trial ride or drive experience will not only involve businesses and residents, but also the government. Future research must consider how to design and organize activities to attract more residents to participate. The 2016 China’s new car market trend survey report shows people who have BEV driving experiences are 10% more likely to purchase a BEV than those without the driving experience. Of those respondents with BEV driving experience, 71% said they would consider buying BEVs [60]. Therefore, professional pre-sale consulting services and test drive activities could significantly increase residents’ BEVs purchase intention, but manufacturers often ignore this point. Wu [60] tracked approximately 2000 car buyers through their car buying process, and found that nearly 1/3 of the buyers were concerned about the car blog, forum information, or listened to family and friends’ advice. Therefore, the promotion process must create opportunities for trend leaders to experience BEVs and actively promote them by word of mouth.
This study shows that poor professional pre-sales consulting and experience services seriously hindered consumer’s willingness to purchase. For more comprehensive discussion of this conclusion, we introduce the product service system (PSS). The PSS is a function-oriented business model, defined as a marketable set of products and services capable of jointly fulfilling user needs. The company produces and distributes not only simple physical products, but a more holistic solution that satisfies consumer demand. It is the integration of products and services that are independent of each other [61]. PSSs were largely motivated by the need of traditional firms to cope with changing market forces and the recognition that services in combination with products could provide higher profits than products alone [62]. PSSs are an innovative design strategy, no longer confined to the design of new products, but also to the development of new processes, services, interaction, communication, and cooperation. This provides the capacity to propose solutions for complex problems.
Compared with traditional models, PSSs have better design, sustainability, and consider relationships between companies. (1) Different role orientation. In traditional markets, stakeholders only optimize themselves, paying no attention to the interests of others in the supply chain. PSSs include strategic thinking, where stakeholder interests are merged to facilitate system resource optimization. (2) Different points of interest. Traditional product design need not consider the economic profit of a single stakeholder or whole system resource optimization. PSS business models establish a new form of cooperation between stakeholders and new economic benefits, and the accompanying system resource optimization. (3) Specific user needs. Traditional product design simply assigns end users as the design object, investigating their requirements to find opportunities and design products. This is a general market demand, and does not specify user requirements. PSSs can be segmented, meeting the needs of many specific customers. Users can purchase or rent the required functionality without having to own the product itself, and do not have to undertake additional product maintenance and processing. Users can save significant money, but the PSS does not hinder satisfaction of their needs. Therefore, applying PSSs to BEVs will be very worthy of further study, with the expectation that a mature PSS will significantly increase consumer willingness to purchase BEVs.
This study shows that class A key basic events X2 and X3 are key factors in preventing residents from buying BEVs, which is consistent with previous research. Economic subsidies and policy support have long been advocated as an effective measure to stimulate low carbon travel [63,64], while the exemption from purchase tax has been promoted as one of the most effective ways of dealing with external costs associated with energy consumption [16,64]. BEVs are a new product, with higher purchase and maintenance costs (such as BEV battery replacement). From an economic point of view, governmental fiscal and taxation support policy can save a lot of money for BEVs users or reduce the pressure for residents to buy a car. In particular, a one-time subsidy policy is more likely to stimulate purchase willingness than staging policies [65]. Current support policies were designed to achieve large scale BEV use, and thus target residents in the mainstream market. However, the policy cost is usually high and inefficient, so targeting the policy to niche markets may be more effective [8]. Residents are the recipients of BEVs policies, and their understanding of existing policies will determine whether they use BEVs. Therefore, future research should not only focus on the impact of BEV policies on residents, but also residents’ views and evaluations.
Class A key basic event X4 comprises the basic elements to achieve BEVs conduction charging. Unification and specification of the interface for BEV charging is the technical basis for ensuring interconnection between the BEVs and the charging infrastructure. Those residents that already have BEVs or strong purchase intention are more concerned about BEV charging interface problems. There are currently five major international charging interface standards: China GB/T 20234, Japan CHAdeMO, European Combo, CCS, and Tesla. Hackbarth and Madlener [12] showed non universal BEV charging interfaces make it difficult to popularize public charging over large areas. Therefore, companies and governments need to strengthen cooperation, encouraging the development of BEVs.
In addition to the charging interface problem, the current study shows that the lack of charging facilities hindered resident purchase intention. Regarding the selection of installation locations for charging facilities, the first choice should be residential areas, the second office locations, and the third highways or ordinary roads. Hidrue et al. [40] and Hackbarth et al. [66] found that if the residential areas had charging facilities for BEVs, this would improve the resident willingness to buy BEVs. For actual BEV users, it was also important for supermarkets, shopping malls, cinemas, restaurants, and other public places in the city to have charging facilities. The use of shopping, watching movies, or eating time to charge BEVs can greatly reduce the worry due to lack of electricity, but such charging facilities are still relatively sparse.
We must also realize that once the BEV charging interface is consistent, coupled with governmental promotion, the BEV industry will enter a period of rapid development. The impact of BEV large scale access to power grids should not be overlooked. Since BEV charging loads have some controllability, optimizing the charging process to reduce adverse effects on the grid will be required. With standardization and better information regarding the charging facilities and vehicle interface, the distribution network can be based on their own situation to control BEV charging times, reducing charging facilities equipment investment. Bayram and Papapanagiotou [67] showed that the grid was becoming congested due to the introduction of BEV charging points, particularly the use of household charging points. Management and control of charging requirements should be consistent with the available resources. If the long term solution involves upgrading grid components, considering the potential cost of such investments, the practical solution for the near term would be to develop intelligent control and scheduling techniques to aid power grid operations. Bayram et al. [68] proposed a model that employed pricing mechanisms to control BEV demand. Analyzing the charging requirements, charging technology, and charging characteristics for different BEV users, they proposed a framework to adapt large and small two level grids. They recommended price leverage for large power grids to coordinate the scale of BEV charging and charging service quality. For small power grids, they recommended using minimum demand for charging resources as the goal. Clement-Nyns et al. [69] argued that disordered BEV charging may exacerbate grid load fluctuations and worsen energy loss and economic benefits. Whereas, if BEV charging behavior was coordinated and optimized, peak load demand of the system could be reduced. The method could effectively reduce operating losses of the distribution system. With increasing numbers of BEVs entering the home, large scale distributed household BEV charging will be an important impact to consider on the grid. Future policy making regarding the integration of BEV charging should consider the power grid capacity and limitations.
Class A key basic event X5 shows that standardizing BEV development and production in China would be conducive to promoting the BEV market, and strengthening BEV management would promote the healthy development of the BEV industry. China's current BEV supervision policies and technical standards are not perfect, such as issuance and management of BEV licenses, less BEV insurance types, difficult annual inspections, products that do not meet standards, and suspected fraudulent subsidies.
In contrast to other green buying behavior, BEVs are expensive, and purchase depends on family individual details, such as the number of elderly people and children. However, car manufacturers may be more concerned about BEV safety and comfort [32]. BEVs still pose significant technical risks, and mitigating these risks and reducing traffic accidents are the main security demands. Among these, reversing assistance is the most widely used intelligent assistance system, and is particularly welcomed by female drivers, with 46% of female respondents in the current study stating that reversing assistance was very important. Auxiliary braking and night vision assistance was also relatively widely desired.
6. Conclusions and Policy Implications
6.1. Conclusions
Combining previous research outcomes and new qualitative analysis, this paper established a fault tree model for low BEV purchase willingness, and established the following conclusions.
- (1)
- There were 26 MCSs and 18 MPSs in the fault tree model, and the structural importance of the basic event was .
- (2)
- Using ABC analysis on the calculated probability and structure importance of basic events, and the MCS occurrence probability, the key MCSs of class A were identified as , , , and ; and the key basic events of class A were X1 (poor professional pre-sales consulting and experience services), X2 (low subsidy and tax incentives), X3 (Imperfect bank loan policies), X4 (different BEVs brand charging interfaces are inconsistent), and X5 (imperfect supervision policy and technical standards).
- (3)
- Reducing the probability of failure of key basic events and performing Monte Carlo simulations (100,000 cycles) reduced the probability of cumulative occurrence of the fault tree from 0.86021 to 0.57406. Improving the key basic events also reduced MCS probabilities, achieving reduced occurrence probability of the fault tree and significantly increasing resident BEVs purchase willingness. This verified the feasibility and effectiveness of the proposed FTA method to solve the problem of low purchase intention. This paper effectively expands the directions for promoting research and policy making for BEVs.
6.2. Policy Implications
- (1)
- Government policies should be more focused, reflecting basic service functions. This study showed that poor professional pre-sales consulting and experience services is a key factor hindering BEVs purchase. Therefore, the government and manufacturers should actively cultivate trend leaders through trial ride and drive experiences, low cost leases, etc., to create experience opportunities for residents, and encourage word of mouth BEV support. An active platform should be promoted to enhance services, including connecting sellers and users, communication between users, and cooperation between enterprises. Based on user needs, thoughtful products and services are required to influence the business model, and enhance user experience satisfaction. The design of sustainable programs, such as companies providing charging points and related services to ensure users’ convenient access to services, and a quality experience to attract more users to use BEVs will achieve a win-win situation for the companies and users.For sale and after sales services, rapid feedback of residents’ problems to BEV manufacturers will help improve resident satisfaction, confidence, and loyalty; and increase their willingness to purchase BEVs. Car enterprises should actively improve BEV’s after sales service networks, integrating with existing car service channels and facilities as much as possible. Governments could also purchase more BEVs rather than conventional gasoline vehicles to set the example for ordinary citizens, as well as offering a way for more residents to experience BEVs directly. Finally, governments should promote green related activities. When the concept of green consumption is generally accepted, residents will be more willing to buy BEVs.
- (2)
- BEV promotion should consider residents’ real needs.
- Governments should increase the intensity of infrastructure construction, standardize BEVs technical standards (such as annual inspection standards, universal charging point interfaces, battery recycling standards, etc.), increase subsidies to purchase BEVs, encourage BEV companies to increase their research and development investment, and provide funding to reduce research costs for related companies. Although there is currently no country or region that has achieved BEV standardization, the process of developing BEV standards must consider the existing international standards, in line with the interests of most market participants.
- Governments should speed up construction of private, e.g., residential parking, and public, e.g., office parking lots, expressway service areas, subway stations, etc., charging facilities. Specification and implementation of universal and shared charging points are essential to break local protectionism.
- The rational deployment of BEV charging facilities is the basic requirement for realizing BEV large scale access to the power grid. This requires implementation of an orderly charging model, and time-of-use pricing to control BEV charging behavior. For fast charging, relevant aspects from the UK Rapid Charging Infrastructure Project to help establish a fast charging network should be adopted, providing residents with fast electric charging points along residential streets, and the commercial fleet with special fast charging points, through a series of regional plans promoting new charging infrastructures, policies, and projects.
- (3)
- Promote technological development and enhance enterprises’ core competitiveness. The government should support the study of economic incentive policies and measures, such as fiscal tax incentives, and science and technology innovation policy. From a technical point of view, fast charging technology and inductive charging can simplify the charging process, greatly enhancing user BEV acceptance. Therefore, manufacturers should encourage innovation and development of the technology. Since a full charge takes significant time, and it is difficult to solve the problem in the short term, resident purchase intentions could be enhanced by replacing fully charged BEV batteries. The BEV industry should focus on battery, drive motor, and other technical breakthroughs, to develop a complete industrial chain, and enhance BEV quality, particularly with regard to safety and convenience.
Acknowledgments
This study was supported by the Fundamental Research Funds for the Central Universities (2017XKZD12).
Author Contributions
Ruyin Long and Hong Chen came up with the original idea for this article; Qianwen Li and Jichao Geng designed the model, performed the Monte Carlo simulations, and wrote the paper. All authors read and approved this version.
Conflicts of Interest
The authors declare that they have no conflict of interest.
References
- United Nations. The Paris Agreement. Available online: http://unfccc.int/paris_agreement/items/9485.php (accessed on 12 December 2015).
- Geng, J.C.; Long, R.Y.; Chen, H.; Yue, T.; Li, W.B.; Li, Q.W. Exploring Multiple Motivations on Urban Residents’ Travel Mode Choices: An Empirical Study from Jiangsu Province in China. Sustainability 2017, 9, 136. [Google Scholar] [CrossRef]
- Fuglestvedt, J.; Berntsen, T.; Myhre, G.; Rypdal, K.; Skeie, R.B. Climate forcing from the transport sectors. Proc. Natl. Acad. Sci. USA 2008, 105, 454–458. [Google Scholar] [CrossRef] [PubMed]
- Xu, B.; Lin, B. Carbon dioxide emissions reduction in China’s transport sector: A dynamic VAR (vector autoregression) approach. Energy 2015, 83, 486–495. [Google Scholar] [CrossRef]
- Raslavičius, L.; Azzopardi, B.; Keršys, A.; Starevičius, M.; Bazaras, Ž.; Makaras, R. Electric vehicles challenges and opportunities: Lithuanian review. Renew. Sustain. Energy Rev. 2015, 42, 786–800. [Google Scholar] [CrossRef]
- Bjerkan, K.Y.; Nørbech, T.E.; Nordtømme, M.E. Incentives for promoting Battery Electric Vehicle (BEV) adoption in Norway. Transp. Res. Part D Transp. Environ. 2016, 43, 169–180. [Google Scholar] [CrossRef]
- Zhang, Y.; Yu, Y.; Zou, B. Analyzing public awareness and acceptance of alternative fuel vehicles in China: The case of EV. Energy Policy 2011, 39, 7015–7024. [Google Scholar] [CrossRef]
- Green, E.H.; Skerlos, S.J.; Winebrake, J.J. Increasing electric vehicle policy efficiency and effectiveness by reducing mainstream market bias. Energy Policy 2014, 65, 562–566. [Google Scholar] [CrossRef]
- Lane, B.; Potter, S. The adoption of cleaner vehicles in the UK: Exploring the consumer attitude—Action gap. J. Clean. Prod. 2007, 15, 1085–1092. [Google Scholar] [CrossRef]
- Aasness, M.A.; Odeck, J. The increase of electric vehicle usage in Norway—Incentives and adverse effects. Eur. Transp. Res. Rev. 2015, 7, 1–8. [Google Scholar] [CrossRef]
- Sierzchula, W.; Bakker, S.; Maat, K.; van Wee, B. The influence of financial incentives and other socio-economic factors on electric vehicle adoption. Energy Policy 2014, 68, 183–194. [Google Scholar] [CrossRef]
- Hackbarth, A.; Madlener, R. Willingness-to-pay for alternative fuel vehicle characteristics: A stated choice study for Germany. Transp. Res. Part A Policy Pract. 2016, 85, 89–111. [Google Scholar] [CrossRef]
- Lai, I.K.W.; Liu, Y.; Sun, X.; Zhang, H.; Xu, W.W. Factors Influencing the Behavioural Intention towards Full Electric Vehicles: An Empirical Study in Macau. Sustainability 2015, 7, 12564–12585. [Google Scholar] [CrossRef]
- Franke, T.; Krems, J.F. What drives range preferences in electric vehicle users? Transp. Policy 2013, 30, 56–62. [Google Scholar] [CrossRef]
- Potoglou, D.; Kanaroglou, P.S. Household demand and willingness to pay for clean vehicles. Transp. Res. Part D Transp. Environ. 2007, 12, 264–274. [Google Scholar] [CrossRef]
- Tang, T.Q.; Xu, K.W.; Yang, S.C.; Shang, H.Y. Analysis of the traditional vehicle’s running cost and the electric vehicle’s running cost under car-following model. Mod. Phys. Lett. B 2016, 30, 1650084. [Google Scholar] [CrossRef]
- Soeiro, T.; Friedli, T.; Kolar, J.W. Three-phase high power factor mains interface concepts for Electric Vehicle battery charging systems. In Proceedings of the Twenty-Seventh IEEE Applied Power Electronics Conference and Exposition, Orlando, FL, USA, 5–9 February 2012; pp. 2603–2610. [Google Scholar]
- Stein, S.; Gerding, E.H.; Nedea, A.; Rosenfeld, A.; Jennings, N.R. Bid2Charge: Market User Interface Design for Electric Vehicle Charging. In Proceedings of the International Conference on Autonomous Agents & Multiagent Systems, Singapore, 9–13 May 2016; pp. 882–890. [Google Scholar]
- Yang, T.; Long, R.; Li, W.; Rehman, S. Innovative Application of the Public–Private Partnership Model to the Electric Vehicle Charging Infrastructure in China. Sustainability 2016, 8, 738. [Google Scholar] [CrossRef]
- Rezvani, Z.; Jansson, J.; Bodin, J. Advances in consumer electric vehicle adoption research: A review and research agenda. Transp. Res. Part D Transp. Environ. 2015, 34, 122–136. [Google Scholar] [CrossRef]
- David, D. The impact of government incentives for hybrid-electric vehicles: Evidence from US states. Energy Policy 2009, 37, 972–983. [Google Scholar]
- Jensen, A.F.; Cherchi, E.; Mabit, S.L. On the stability of preferences and attitudes before and after experiencing an electric vehicle. Transp. Res. Part D Transp. Environ. 2013, 25, 24–32. [Google Scholar] [CrossRef]
- Burgess, M.; King, N.; Harris, M.; Lewis, E. Electric vehicle drivers’ reported interactions with the public: Driving stereotype change? Transp. Res. Part F Traffic Psychol. Behav. 2013, 17, 33–44. [Google Scholar] [CrossRef]
- Barth, M.; Jugert, P.; Fritsche, I. Still underdetected—Social norms and collective efficacy predict the acceptance of electric vehicles in Germany. Transp. Res. Part F Traffic Psychol. Behav. 2016, 37, 64–77. [Google Scholar] [CrossRef]
- Plötz, P.; Schneider, U.; Globisch, J.; Dütschke, E. Who will buy electric vehicles? Identifying early adopters in Germany. Transp. Res. Part A Policy Pract. 2014, 67, 96–109. [Google Scholar] [CrossRef]
- Skippon, S.; Garwood, M. Responses to battery electric vehicles: UK consumer attitudes and attributions of symbolic meaning following direct experience to reduce psychological distance. Transp. Res. Part D Transp. Environ. 2011, 16, 525–531. [Google Scholar] [CrossRef]
- Singer, M. Consumer, Views on Plug-in Electric Vehicles—National Benchmark Report. Available online: https://www.osti.gov/scitech/biblio/1238321 (accessed on 8 May 2017).
- Browne, D.; O’Mahony, M.; Caulfield, B. How should barriers to alternative fuels and vehicles be classified and potential policies to promote innovative technologies be evaluated? J. Clean. Prod. 2012, 35, 140–151. [Google Scholar] [CrossRef]
- Graham-Rowe, E.; Gardner, B.; Abraham, C.; Skippon, S.; Dittmar, H.; Hutchins, R.; Stannard, J. Mainstream consumers driving plug-in battery-electric and plug-in hybrid electric cars: A qualitative analysis of responses and evaluations. Transp. Res. Part A Policy Pract. 2012, 46, 140–153. [Google Scholar] [CrossRef]
- Whether It Should Be Differentiated to Treat New Energy Vehicles “Annual Inspection”? Available online: http://auto.sohu.com/20160817/n464724447.shtml (accessed on 17 August 2016).
- Carley, S.; Krause, R.M.; Lane, B.W.; Graham, J.D. Intent to purchase a plug-in electric vehicle: A survey of early impressions in large US cites. Transp. Res. Part D Transp. Environ. 2013, 18, 39–45. [Google Scholar] [CrossRef]
- Lieven, T.; Mühlmeier, S.; Henkel, S.; Waller, J.F. Who will buy electric cars? An empirical study in Germany. Transp. Res. Part D Transp. Environ. 2011, 16, 236–243. [Google Scholar] [CrossRef]
- Adepetu, A.; Keshav, S. The relative importance of price and driving range on electric vehicle adoption: Los Angeles case study. Transportation 2017, 44, 353–373. [Google Scholar] [CrossRef]
- Caulfield, B.; Farrell, S.; McMahon, B. Examining individuals preferences for hybrid electric and alternatively fuelled vehicles. Transp. Policy 2010, 17, 381–387. [Google Scholar] [CrossRef]
- Caperello, N.D.; Kurani, K.S. Households’ Stories of Their Encounters with a Plug-In Hybrid Electric Vehicle. Environ. Behav. 2012, 44, 493–508. [Google Scholar] [CrossRef]
- Li, G. Research on the Key Factors Impacting on the Development of Electric Vehicle Industrv in China; Wuhan University of Technology: Wuhan, China, 2011. (In Chinese) [Google Scholar]
- Ye, N.; Zhou, M.H. Exploring the Attitude—Action Gap for New Energy Vehicle Adoption. East China Econ. Manag. 2012, 26, 135–137. (In Chinese) [Google Scholar]
- Egbue, O.; Long, S. Barriers to widespread adoption of electric vehicles: An analysis of consumer attitudes and perceptions. Energy Policy 2012, 48, 717–729. [Google Scholar] [CrossRef]
- Krupa, J.S.; Rizzo, D.M.; Eppstein, M.J.; Brad, L.; Anute, D.; Gaalema, D.E.; Lakkaraju, K.; Warrender, C.E. Analysis of a consumer survey on plug-in hybrid electric vehicles. Transp. Res. Part A Policy Pract. 2014, 64, 14–31. [Google Scholar] [CrossRef]
- Michael, K.H.; George, R.P.; Willett, K.; Meryl, P.G. Willingness to pay for electric vehicles and their attributes. Resour. Energy Econ. 2011, 33, 686–705. [Google Scholar]
- Glerum, A.; Stankovikj, L.; Themans, M.; Bierlaire, M. Forecasting the Demand for Electric Vehicles: Accounting for Attitudes and Perceptions. Transp. Sci. 2014, 48, 483–499. [Google Scholar] [CrossRef]
- Ewing, G.O.; Sarigöllü, E. Car fuel-type choice under travel demand management and economic incentives. Transp. Res. Part D Transp. Environ. 1998, 3, 429–444. [Google Scholar] [CrossRef]
- Brownstone, D.; Bunch, D.S.; Train, K. Joint mixed logit models of stated and revealed preferences for alternative-fuel vehicles. Transp. Res. Part B Methodol. 2000, 34, 315–338. [Google Scholar] [CrossRef]
- Fishbein, M.; Ajzen, I. Belief, Attitude, Intentions, and Behavior: An Introduction to Theory and Research; Addison-Wesley: Menlo Park, MA, USA, 1975. [Google Scholar]
- Ajzen, I. The theory of planned behavior. Org. Behav. Hum. Decis. Process. 1991, 50, 179–211. [Google Scholar] [CrossRef]
- Guagnano, G.A.; Stern, P.C.; Dietz, T. Influences on attitude-behavior relationships: A natural experiment with curbside recycling. Environ. Behav. 1995, 27, 699–718. [Google Scholar] [CrossRef]
- Hines, J.M.; Hungerford, H.R.; Tomera, A.N. Analysis and synthesis of research on responsible environmental behavior: A meta-analysis. J. Environ. Educ. 1986, 18, 1–8. [Google Scholar] [CrossRef]
- Dembkowski, S.; Hanmer, L.S. The environmental value-attitude-system model: A framework to guide the understanding of environmentally conscious consumer behavior. J. Mark. 1994, 10, 593–603. [Google Scholar] [CrossRef]
- Triandis, H.C. Interpersonal Behavior; Brooks/Cole: Monterey, CA, USA, 1977. [Google Scholar]
- Stebbins, R.A. Book Review: Constructing grounded theory: A practical guide through qualitative analysis. Health 2006, 10, 378–380. [Google Scholar] [CrossRef]
- Charmaz, K. Constructing Grounded Theory: A Practical Guide through Qualitative Analysis. Int. J. Qual. Stud. Health Well-Being 2006, 1, 378–380. [Google Scholar]
- Glasscr, B.G.; Strauss, A.L. The Discovery of Grounded Theory: Strategies for Qualitative Research; Aldine Publishing Company: New York, NY, USA, 1967. [Google Scholar]
- Skulmoski, G.J.; Hartman, F.T.; Krahn, J. The Delphi Method for Graduate Research. J. Inf. Technol. Educ. 2007, 6, 1–21. [Google Scholar]
- Yue, T.; Long, R.; Chen, H. Factors influencing energy-saving behavior of urban households in Jiangsu Province. Energy Policy 2013, 62, 665–675. [Google Scholar] [CrossRef]
- Elnakat, A.; Gomez, J.D. Energy engenderment: An industrialized perspective assessing the importance of engaging women in residential energy consumption management. Energy Policy 2015, 82, 166–177. [Google Scholar] [CrossRef]
- Ejlali, A.; Miremadi, S.G. FPGA-based Monte Carlo simulation for fault tree analysis. Microelectron. Reliab. 2004, 44, 1017–1028. [Google Scholar] [CrossRef]
- Rao, K.D.; Gopika, V.; Rao, V.V.S.S.; Kushwaha, H.S.; Verma, A.K.; Srividya, A. Dynamic fault tree analysis using Monte Carlo simulation in probabilistic safety assessment. Reliab. Eng. Syst. Saf. 2009, 94, 872–883. [Google Scholar]
- Lim, H.G.; Jang, S.C. An analytic solution for a fault tree with circular logics in which the systems are linearly interrelated. Reliab. Eng. Syst. Saf. 2007, 92, 804–807. [Google Scholar] [CrossRef]
- Schulte, I.; Hart, D.; Vorst, R.V.D.V. Issues affecting the acceptance of hydrogen fuel. Int. J. Hydrogen Energy 2004, 29, 677–685. [Google Scholar] [CrossRef]
- Wu, G.X. Investigation on consumption trend of new energy vehicles in China. Auto Rev. 2016, 6, 66–68. (In Chinese) [Google Scholar]
- Beella, S.; Silvester, S.; Brezet, H. Product Service Systems and Sustainable Mobility: An Electric Vehicle in Introduction Case. Available online: https://www.researchgate.net/publication/236024717_Product_service_systems_and_sustainable_mobility_an_electric_vehicle_in_introduction_case (accessed on 8 May 2017).
- Morelli, N. Developing new product service systems (PSS): Methodologies and operational tools. J. Clean. Prod. 2006, 14, 1495–1501. [Google Scholar] [CrossRef]
- Barla, P.; Proost, S. Energy efficiency policy in a non-cooperative world. Energy Econ. 2012, 34, 2209–2215. [Google Scholar] [CrossRef]
- Eliasson, J.; Proost, S. Is sustainable transport policy sustainable? Transp. Policy 2015, 37, 92–100. [Google Scholar] [CrossRef]
- Ko, W.; Hahn, T. Analysis of Consumer Preferences for Electric Vehicles. IEEE Trans. Smart Grid 2013, 4, 437–442. [Google Scholar] [CrossRef]
- Hackbarth, A.; Madlener, R. Consumer preferences for alternative fuel vehicles: A discrete choice analysis. Transp. Res. Part D Transp. Environ. 2013, 25, 5–17. [Google Scholar] [CrossRef]
- Bayram, I.S.; Papapanagiotou, I. A survey on communication technologies and requirements for internet of electric vehicles. EURASIP J. Wirel. Commun. Netw. 2014, 2014, 1–18. [Google Scholar] [CrossRef]
- Bayram, I.S.; Tajer, A.; Abdallah, M.; Qaraqe, K. Capacity Planning Frameworks for Electric Vehicle Charging Stations with Multiclass Customers. IEEE Trans. Smart Grid 2015, 6, 1934–1943. [Google Scholar] [CrossRef]
- Clement-Nyns, K.; Haesen, E.; Driesen, J. The Impact of Charging Plug-In Hybrid Electric Vehicles on a Residential Distribution Grid. IEEE Trans. Power Syst. 2008, 25, 371–380. [Google Scholar] [CrossRef]
Figure 1.
Proposed fault tree model.

Figure 2.
Monte Carlo simulation for the fault tree.
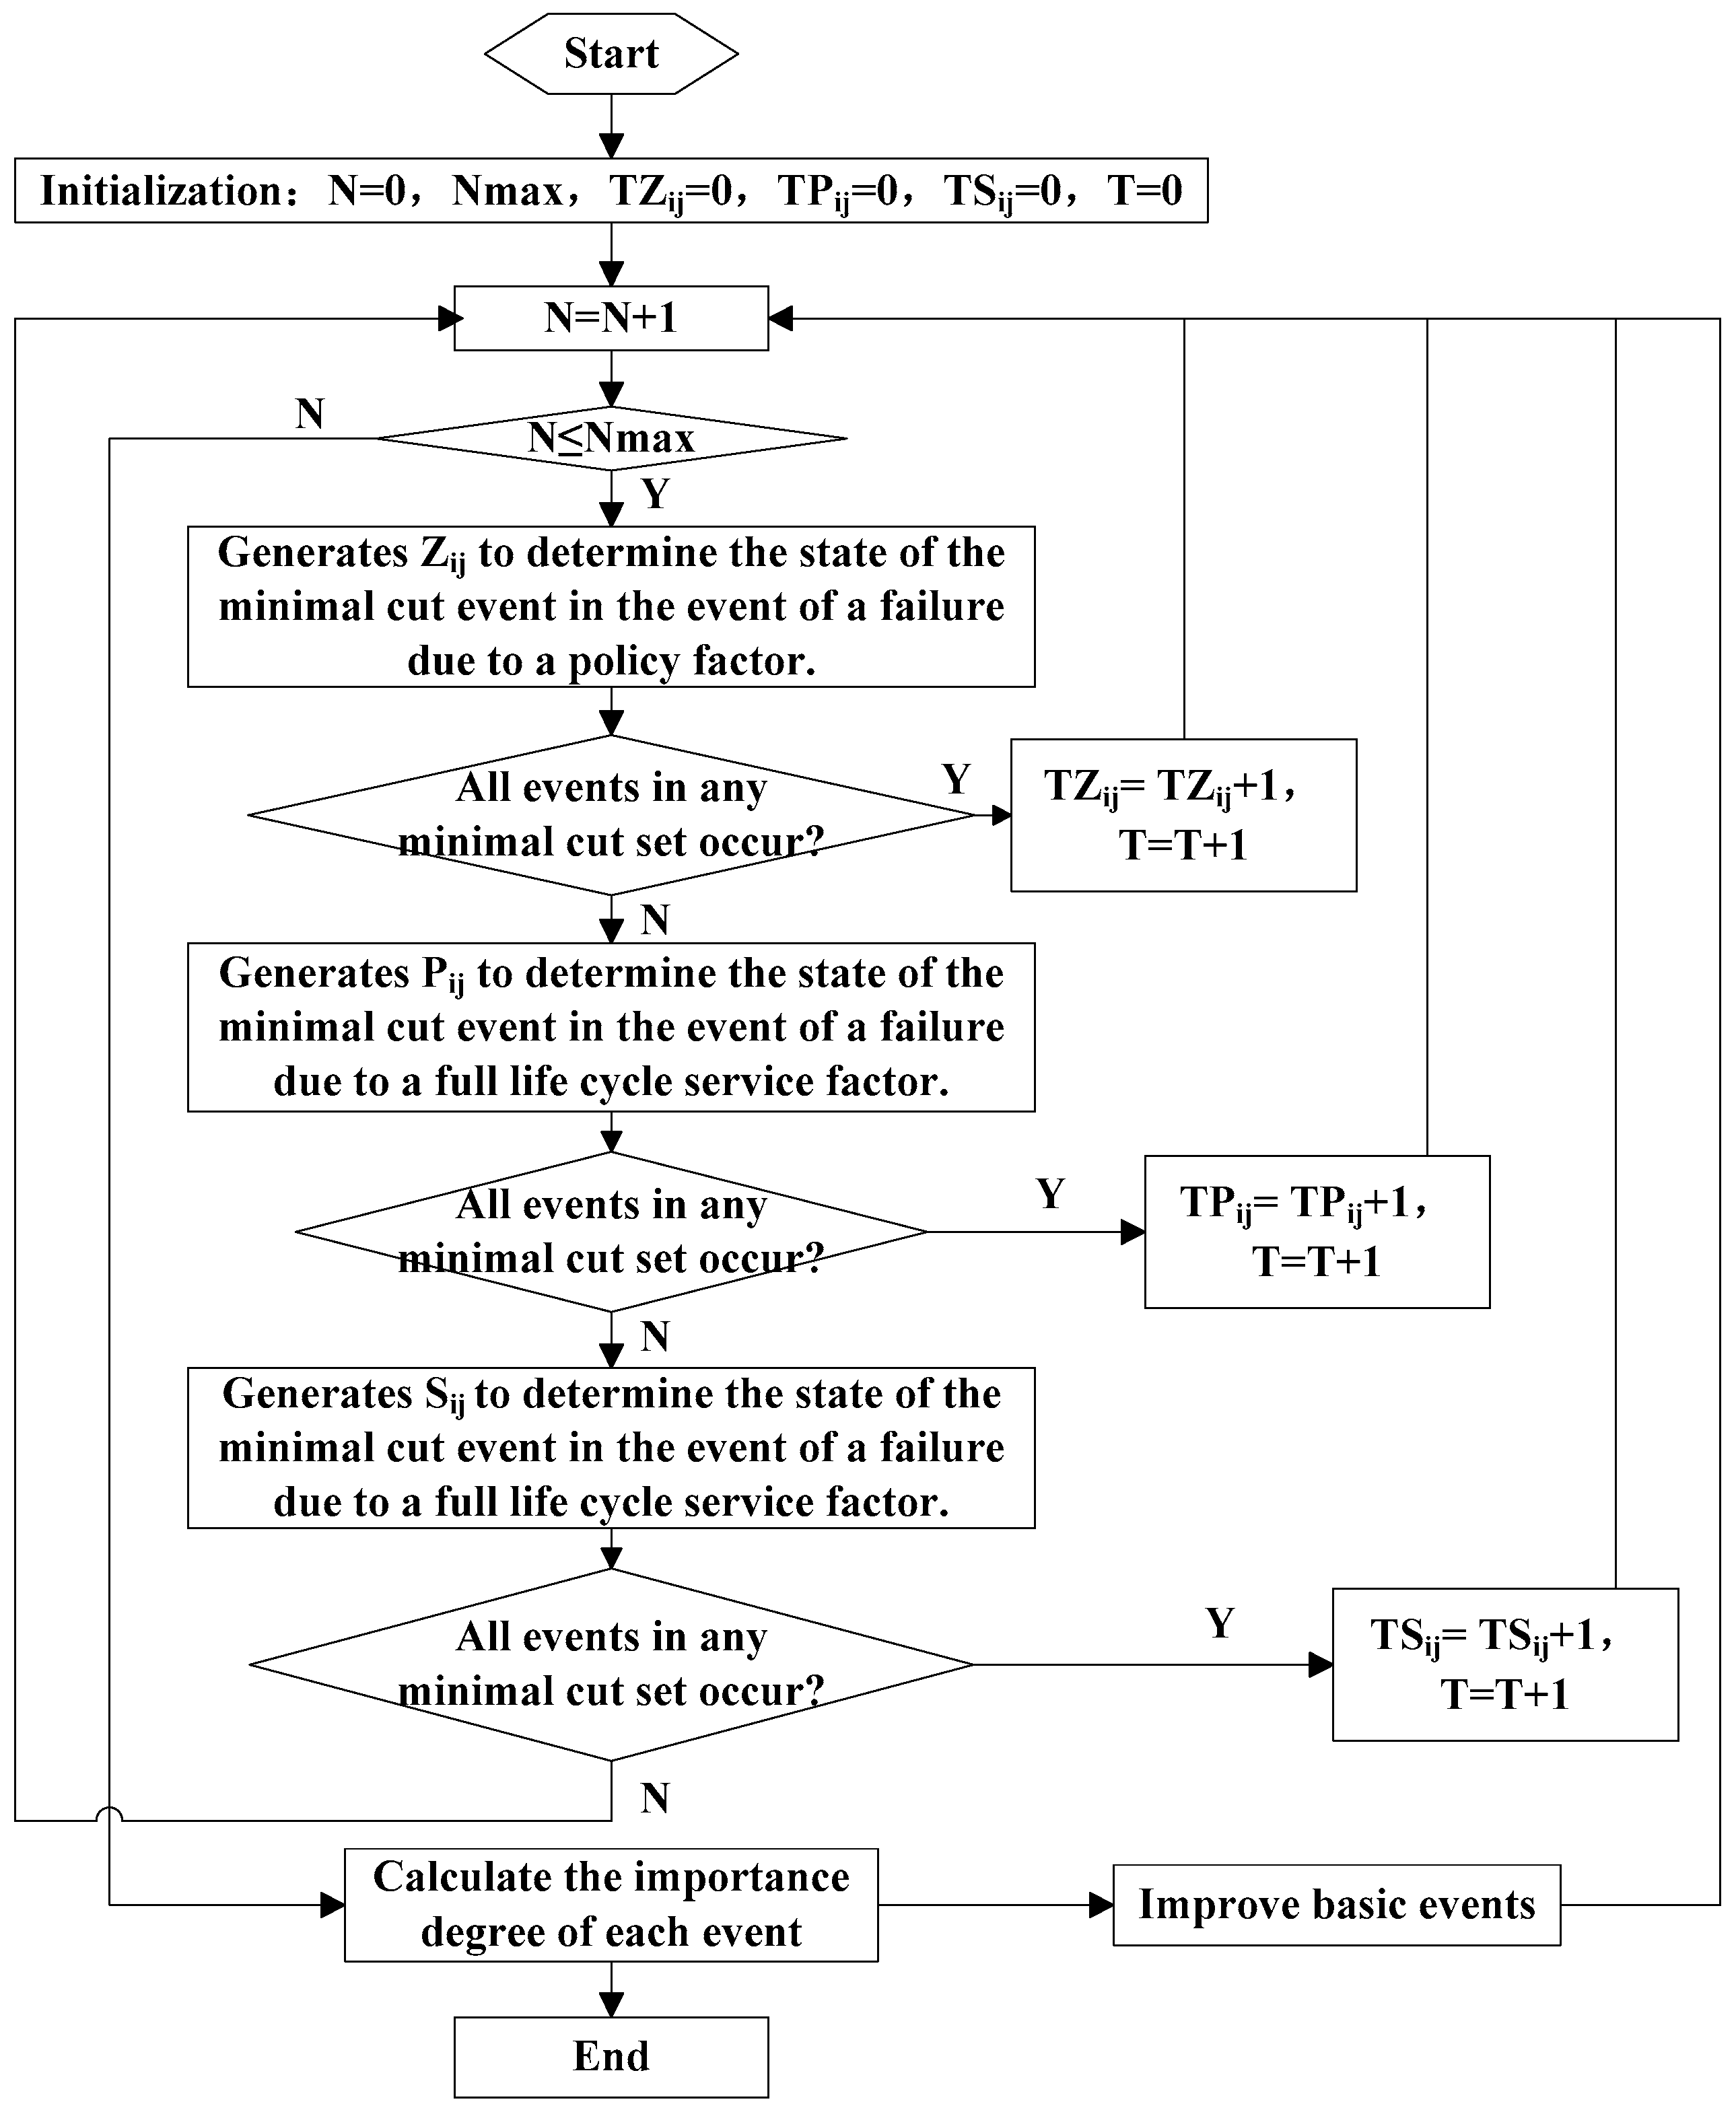
Figure 3.
Monte Carlo simulation for the fault tree of Figure 1. (a) Basic events importance. (b) Fault tree occurrence probability. (c) Probability/structural importance of basic events. (d) Minimal cut sets occurrence probability.
Figure 3.
Monte Carlo simulation for the fault tree of Figure 1. (a) Basic events importance. (b) Fault tree occurrence probability. (c) Probability/structural importance of basic events. (d) Minimal cut sets occurrence probability.


Table 1.
Basic interviewee information.
| Number | Percentage | ||
|---|---|---|---|
| City | Beijing | 9 | 30.0% |
| Shanghai | 10 | 33.3% | |
| Jiangsu | 11 | 36.7% | |
| Interview method | face-to-face interview | 15 | 50.0% |
| online interview | 15 | 50.0% | |
| Gender | Male | 16 | 53.3% |
| Female | 14 | 46.7% | |
| Age | 20–30 | 11 | 36.7% |
| 31–45 | 14 | 46.7% | |
| Over 45 | 5 | 16.6% | |
| Household income level monthly (Yuan) | <5000 | 7 | 23.3% |
| 5000–10,000 | 13 | 43.3% | |
| 10,000–30,000 | 8 | 26.7% | |
| >30,000 | 2 | 6.7% | |
| Occupation | Education, scientific research, or professional technicians | 14 | 46.7% |
| Government institutions or state owned enterprises | 6 | 20.0% | |
| Business, service, sales, and individual operators | 10 | 33.3% | |
| Private car ownership | 0 | 7 | 23.3% |
| 1 | 15 | 50.0% | |
| 2 or more | 8 | 26.7% | |
Table 2.
Open interview outline.
| Interview Topics | Main Content Outline |
|---|---|
| BEV knowledge | Do you know BEVs? What benefits do you think BEVs could bring to your life? |
| Attitude toward BEV purchase | Have your family, friends, or colleagues purchased BEVs? What was the purchase motive? Would you like to buy a BEV? What is the main reason? Do you support China to implement more measures to encourage individuals to buy BEVs? |
| Factors affecting BEV purchase | What factors do you think would encourage you to buy a BEV? What do you think is the main obstacle to you purchasing a BEV? What measures do you think could be taken to enhance BEV purchase willingness? |
Table 3.
Minimal cut sets of the fault tree.
| Minimal Cut Sets | |
|---|---|
| Policy factor | , , , |
| Full life cycle service factor | , , |
| Attribute factor | , , , , , , , , , , , , , , , |
Table 4.
Basic event classification table based on ABC analysis.
| Class | Basic Event | Structural Importance Degree |
|---|---|---|
| A: Key factor | X1 (Poor professional pre-sales consulting and experience services) X2 (Low subsidy and tax incentives) X3 (Imperfect bank loan policies) X4 (Different BEVs brand charging interfaces are inconsistent) X5 (Imperfect supervision policy and technical standards) | = 0.06751 = 0.06032 = 0.06032 = 0.05918 = 0.05918 |
| B: Sub-key factor | X11 (High purchase cost) X12 (High maintenance cost) X13 (Battery endurance is low) X14 (Engine performance problem) | = 0.05157 = 0.05157 = 0.05107 = 0.05107 |
| C: General factor | X6 (Single purchase channel) X7 (Less types of BEVs insurance) X15 (Appearance and luggage space) X16 (Long single charging time) X17 (Short battery lifespan) X18 (Security issues) X8 (Difficult to repair) X9 (Difficultly of annual inspection) X10 (Low penetration rate of charging piles) | = 0.02289 = 0.02289 = 0.01081 = 0.01081 = 0.01081 = 0.01081 = 0.00983 = 0.00983 = 0.00983 |
Table 5.
Minimal cut sets classification table based on ABC analysis.
| Class | Minimal Cut Sets | Absolute Value of the Difference between the Probability Importance Degree before and after Improvement |
|---|---|---|
| A: Key factor | 0.23908 0.24084 0.24087 0.24212 | |
| B: Sub-key factor | 0.10061 0.09879 0.10058 0.10069 0.10008 0.09971 | |
| C: General factor | 0.00084 0.00089 0.00156 0.00004 0.00118 0.00117 0.00217 0.00362 0.00149 0.00089 0.00178 0.0004 0.00202 0.00062 0.00191 0.00169 |
© 2017 by the authors. Licensee MDPI, Basel, Switzerland. This article is an open access article distributed under the terms and conditions of the Creative Commons Attribution (CC BY) license (http://creativecommons.org/licenses/by/4.0/).
Share and Cite
MDPI and ACS Style
Li, Q.; Long, R.; Chen, H.; Geng, J. Low Purchase Willingness for Battery Electric Vehicles: Analysis and Simulation Based on the Fault Tree Model. Sustainability 2017, 9, 809. https://doi.org/10.3390/su9050809
AMA Style
Li Q, Long R, Chen H, Geng J. Low Purchase Willingness for Battery Electric Vehicles: Analysis and Simulation Based on the Fault Tree Model. Sustainability. 2017; 9(5):809. https://doi.org/10.3390/su9050809
Chicago/Turabian StyleLi, Qianwen, Ruyin Long, Hong Chen, and Jichao Geng. 2017. "Low Purchase Willingness for Battery Electric Vehicles: Analysis and Simulation Based on the Fault Tree Model" Sustainability 9, no. 5: 809. https://doi.org/10.3390/su9050809
Note that from the first issue of 2016, this journal uses article numbers instead of page numbers. See further details here.