
Decomposition and Decoupling Analysis of Life-Cycle Carbon Emission in China’s Building Sector

School of Economic & Management, China University of Petroleum (Huadong), No. 66 West Changjiang Road, Qingdao 266580, China
*
Author to whom correspondence should be addressed.
Sustainability 2017, 9(5), 793; https://doi.org/10.3390/su9050793
Submission received: 10 April 2017
/
Revised: 8 May 2017
/
Accepted: 8 May 2017
/
Published: 10 May 2017
(This article belongs to the Special Issue Sustainability Assessments of Buildings)
Abstract
:With accelerating urbanization, building sector has been becoming more important source of China’s total carbon emission. In this paper, we try to calculate the life-cycle carbon emission, analyze influencing factors of carbon emission, and assess the delinking index of carbon emission in China’s building sector. The results show: (i) Total carbon emission in China’s building industry increase from 984.69 million tons of CO2 in 2005 to 3753.98 million tons of CO2 in 2013. The average annual growth rate is 18.21% per year. Indirect carbon emission from building material consumption accounted to 96–99% of total carbon emission. (ii) The indirect emission intensity effect was leading contributor to change of carbon emission. The following was economic output effects, which always contributed to increase in carbon emission. Energy intensity effect and energy structure effect took negligible role to offset carbon emission. (iii) Delinking index show the status between carbon emission and economic output in China’s building industry during 2005–2006 and 2007–2008 was weak decoupling; during 2006–2007 and during 2008–2010 was expansive decoupling; and during 2010–2013 was expansive negative decoupling.
1. Introduction
According to National Economical Industry Classification (GB/T4754-2012) [1], the building industry includes: construction of buildings, civil engineering, renovation and decoration four categories. The energy consumption of building industry includes the energy consumed during occupancy in the various buildings. The sources of carbon emissions are distinguished as two scopes: (i) direct emissions, which refer to the CO2 emissions from the consumption of energy of building industry; and (ii) indirect emissions, which refer to CO2 emissions from the consumption of construction materials. Buildings accounted for 32% of total global final energy use (equal to 117 ExaJoules), 19% of energy-related GHG emissions, 51% of global electricity consumption, 33% of black carbon emissions, and an eighth to a third of F-gases emission (large differences in F-gases data are due to differing accounting conventions) [2,3,4]. In particular, the building energy consumption in China recently surpassed the US building consumption, and it is expected to increase significantly in the next decades, pushed by the demand for new residential buildings [5,6,7,8]. In 2009, the building sector was responsible for one fifth of China’s total primary energy consumption and 18% of the overall Chinese GHG emissions.
China has experienced urbanization with an excessively large number of building projects in the past decades [9,10]. Even more, China’s urbanization is projected to be accelerating in the future [11,12,13]. The accelerating urbanization will lead to a rapid growth of energy usage and material consumption, and a commensurate increase in carbon emission, which means carbon emission from building industry will become more important source of China’s total carbon emission. Thus, curbing China’s building sector carbon emission, and even China’s total carbon emission, requires a better understanding of carbon emission from China’s building industry.
Growth in building energy use poses a challenge for the Chinese government; in recent years, to curb energy consumption in buildings, the Chinese government has undertaken many actions at national level, as shown in Table 1. Other countries also face this problem and issue building codes and regulations for energy efficiency [8,14,15,16,17], as presented in Table 2.
In addition, a large number of scholars have studied carbon emission from building industry at global-level [2,3,18,19,20], national-level [8,17,21,22,23,24,25,26,27,28,29], sub-national-level [30,31,32,33,34], etc. What attracted these scholars are three issues: (i) they usually conducted empirical analysis to estimate or predict carbon emission in building industry; (ii) they use quantitative model to quantify these influencing factors of carbon emission in building industry; and (iii) they use qualitative or quantitative model to explore the relationship between economic output and carbon emission in building industry.
In this paper, we try to calculate carbon emission in China’s building industry, to explore its influencing factors, and to assess its decoupling status. To be more specific, we firstly estimate direct (fossil fuel combustion) and indirect (building material consumption) carbon emission in building industry, using China’s official data and carbon emission coefficient from IPPCC. Then, we conduct a quantitative analysis of the key influencing factors of carbon emission in China’s building industry, using the combination method of kaya identity and logarithmic mean Divisia index (LMDI) model. Finally, we assess the decoupling status between economic output and carbon emission in China’s building industry, using Tapio method and decoupling effort index. Given that many developing countries have experienced, or will experience urbanization, which lead to building industry booming, and a commensurate rapidly increase in carbon emission [12,35], our work would bring some implications for carbon emission of building industry in some other developing countries.
2. Methods and Data
2.1. Methodologies
2.1.1. Method for Calculating CO2 Emission
According to National Economical Industry Classification (GB/T4754-2012), the building industry includes: construction of buildings, civil engineering, and renovation and decoration four categories. Based on the previous studies [29,37,38,39,40,41] and the IPCC method of carbon emission inventories [2], we build the CO2 emission calculation model for China’s building industry. The CO2 emission calculation of building industry includes two parts: first part is the direct CO2 emissions and second part is indirect CO2 emissions shown in the following equation:
where C represents total carbon emissions in China’s building industry; represents the direct CO2 emissions, which refer to the CO2 emissions from the consumption energy of building industry; and represents indirect CO2 emissions, which refer to CO2 emissions from the consumption construction materials.
where is the i-th energy consumption, and (kgCO2/kg or kgCO2/m3 or kgCO2/kWh) indicates the total energy consumption and the total CO2 emission coefficient of i-th energy, which is shown in Table 3 and Table 4.
where is the quantity of j-th kind of consumption construction materials, and represents the CO2 emission coefficient of j-th kind of consumption construction materials, which is shown in Table 5 [42].
2.1.2. Logarithmic Mean Divisia Index Technique
IDA is an analytical tool originated from energy studies. Based on IDA, many specific decomposition methods can be developed and the LMDI approach introduced by Ang and Choi [43] has become the most popular IDA (Index Decomposition Analysis) methodology in the last decade among researchers [44]. The reasons are clear: its theoretical and practical advantages (demonstrated by Ang et al. [45]) make it superior to other alternatives. LMDI is an exhaustive (or refined) decomposition method, which ensures decompositions with identically null residual terms. The LMDI can be expressed as an extended Kaya identity, which was first proposed by Kaya [46]. Assume that V is an aggregate composed of n factors (x1, …, xn), i.e., and Further assume that from period 0 to T the aggregate changes from V0 to VT. The objective is to derive the contributions of the n factors to the change in the aggregate which can be expressed as [47]:
Additive form
Multiplicative form
General Formulae of LMDI
where is the logarithmic mean of a and b, and Because Additive form is easy to understand and calculate, this article uses this form. The extended Kaya identity and LMDI is combined shown in the following formula:
In this expression, we define the following variables, where
- represents the carbon emissions in the t year, the subscript i represents energy type; the superscript t represents year;
- is the carbon emissions from the i-th energy in the t year;
- is the consumption of the i-th energy in the t year;
- is total energy consumption in the t year;
- is the economical outputs of building industry;
- denotes the carbon coefficient of i-th energy;
- illustrates the energy structure effect of i-th energy;
- represents energy intensity; and
- is the effects of intensity of indirect carbon emission.
According to the LMDI method, the change of carbon consumption between a base year 0 and a target year t, is denoted by , and we use the additive decomposition to make further decomposition of Equation (8) to get the following formula:
In this expression, we can consider the is basically unchanged, so is 0. Thus, can be decomposed into the following determinant factors:
where refers to the total changes in carbon emissions, which can be further decomposed into the following indictors:(the effect of energy structure: changes in the amount of CO2 emissions caused by changes in the proportion of nine energy consumption in total energy consumption), (the effect of energy intensity: changes in the amount of CO2 emissions caused by changes in the proportion of total energy consumption in the gross industrial output value), (the effect of industrial scale: changes in the amount of CO2 emissions caused by changes in gross output value of construction industry;), and (the effect of indirect carbon emission intensity: changes in the amount of CO2 emissions caused by the changes in the proportion of indirect carbon emissions and gross industrial output value). Equations (11)–(17) are used to calculate the changes in the amount of CO2 emissions caused by the change of the factors of decomposition; based on the LMDI method, can be expressed as follows:
2.1.3. Decoupling Elasticity Model
The decoupling model is proposed by the Tapio model, which has been developed the OECD decoupling model, which has been widely used to analyze the relationship between economic growth and carbon emission [48,49]. In this paper, based on the additive decomposition results of CO2 emission changes [50], the decoupling elasticity e can be formulated as follows:
In this expression, e is the decoupling elasticity, %C is the percent change in carbon emissions, and %GDP is the percent change of economic output of building industry. Carbon emission is the carbon emission of construction for the current year, ∆carbon is the variation of carbon emission at the current time compared with the base period, GDP is the economic output of building industry in the current year, and ∆GDP is the variation of economic output of building industry at the current time compared with the base period. According to the values of e, there are eight logical possibilities [51,52], including weak decoupling, expansive decoupling, expansive negative decoupling, strong negative decoupling, weak negative decoupling, recessive coupling, recessive decoupling, and strong decoupling.
2.1.4. Decoupling Effort Index
In this paper, we identify the factors contributing to carbon emission of building industry in China using the Kaya identity and LMDI techniques; however, they cannot specifically and objectively measure the actual effects of energy conservation and pollution reduction efforts on CO2 emissions. Effort is a general term referring to the actions that decrease the carbon emissions, both directly and indirectly, such as reducing energy intensity, improving energy efficiency, as well as optimizing the energy structure and excluding the expansion of economical outputs [53]. Thus, the effort in absolute terms or absolute effort during the period starting from the base year 0 to year t can be represented as the sum of the three factors identified [54]:
The decoupling effect index D from a base year 0 to a target year t takes the following values and is evaluated according to the standards below [54]:
, denotes no decoupling effort, carbon emissions increase faster than economic outputs because of inefficient emission reduction efforts [55]. denotes weak decoupling effort, the efforts of carbon emission reduction have only compensated for a small part of the carbon emissions from economic outputs growth. denotes strong decoupling effort, the emission reduction achieved through various efforts was three or two times higher than the carbon emission increase.
2.2. Data Sources and Definition
The data of economic output and energy consumption in China’s building industry are from China Energy Statistical Yearbook for the different sectors [56,57,58]. The unit of economic output is RMB (Yuan) at constant price of 2005. The unit of energy consumption is ton of coal equivalent (tce). The data of consumption of building materials and building industry output data are from China Statistical Yearbook on Construction [59,60,61]. The default value of carbon content, carbon oxidation rate, average lower heating value, and carbon coefficient for different kinds of energy are shown in Table 3 and Table 4, based on the GHG Protocol Tool for Energy Consumption in China [62]. It should be noted that the carbon coefficients of power sector vary due to the china’s energy structure for power generation varying every year. The default value of the ratio of thermal power (%), the ratio of other (water, nuclear, and wind) (%), consumption standard of power and carbon coefficient is represented in Table 4 [17,63]. Carbon emission coefficients of building materials are shown in Table 5, according to the reference [64,65].
3. Result and Analysis
3.1. Estimation of CO2 Emissions from China’s Building Industry
Based on previous studies [17,29,37,38,39,40], carbon emissions from the building industry should include two parts: one is direct carbon emission from direct fossil fuel combustion in building industry and the other is indirect carbon from building material consumption.
3.1.1. Estimated Direct Carbon Emission
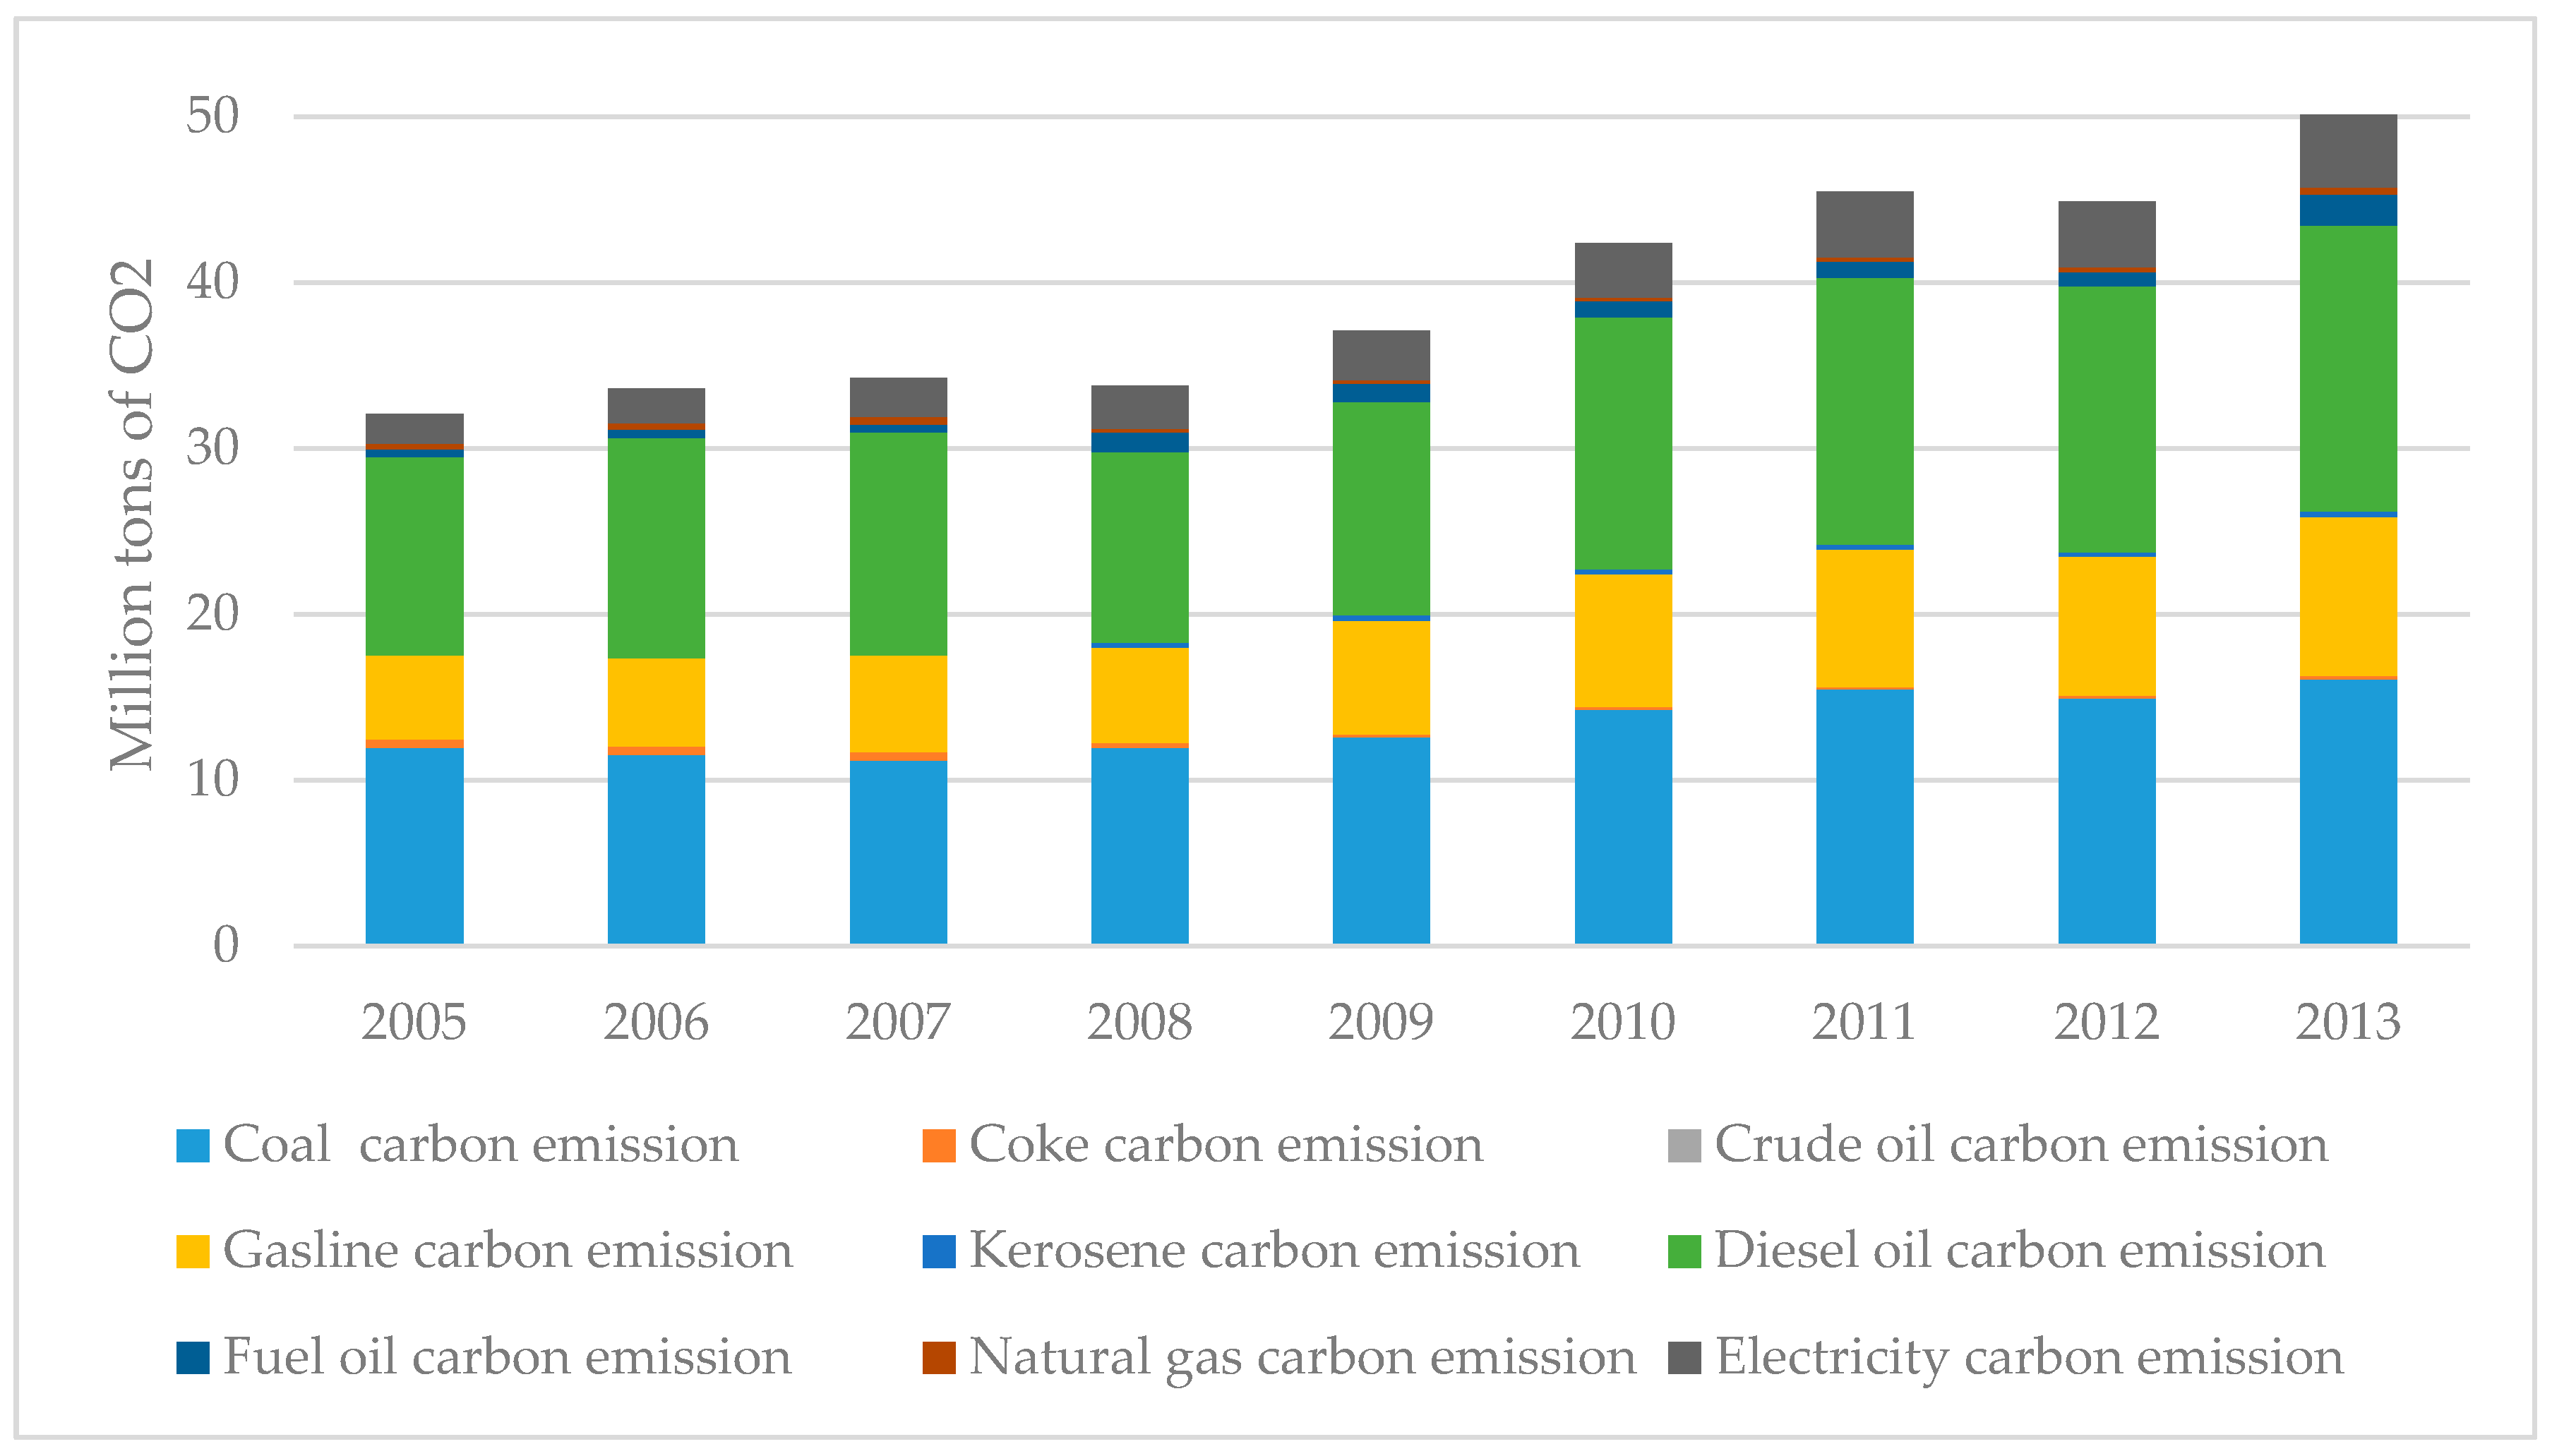
Using Equation (2) and carbon emission coefficients shown in Table 3 and Table 4, we computed the direct carbon emission of China’s building industry (see Figure 1). Total direct carbon emission of China’s building industry increased from 32.06 million tons of CO2 in 2005 to 50.12 million tons of CO2 in 2013. The compound annual growth rate of direct carbon emission in China’s industry was 5.74% during 2005–2013.
As shown in Figure 1, the direct carbon emission includes carbon emission from eight type of fuels (coal, coke, crude oil, fuel oil, gasoline, kerosene, diesel oil and natural gas) and electricity of building industry. The main sources of direct carbon emission in China’s building industry are diesel oil coal, gasoline, and electricity. In 2005, burning diesel oil, coal, gasoline, and electricity consumption contributions to total direct carbon emission in China’s building industry were 37.34%, 37.29%, 15.70% and 5.62%, respectively. In 2013, burning diesel oil, coal, gasoline, electricity consumption contributions to total direct carbon emission in China’s building industry were 34.41%, 32.07%, 19.05% and 8.72%, respectively. Thus, burning diesel oil is the biggest source of direct carbon emission in China’s building industry, followed by coal, gasoline, and electricity between 2005 and 2013.
3.1.2. Estimated Indirect Carbon Emission
Using Equation (3) and carbon emission coefficients shown in Table 5, we calculated the indirect carbon emission of China’s building industry (see Figure 2). Total direct carbon emission of China’s building industry increased from 86.61 million tons of CO2 to 370.37 million tons of CO2 between 2005 and 2013. The compound annual growth rate of direct carbon emission was 18.50% for this period. It should be noted that direct carbon emission was not always rising. Instead, direct carbon emission decreased from 518.56 million tons of CO2 in 2012 to 370.37 million tons of CO2 in 2013.
The indirect carbon emission includes five types of building materials: cement, steel, wood, aluminum and glass. As shown in Figure 2, the dominant source of indirect carbon emission in China’s building industry is the carbon emission from cement. Because the consumption of building materials is large and their carbon emission coefficient is high, the proportion of indirect carbon emissions is large.
In 2005, carbon emission from cement, steel, wood, aluminum and glass consumption produced 56.64%, 33.69%, 7.08%, 2.36% and 0.24% of total indirect carbon emission in China’s building industry, respectively. In 2013, carbon emission from cement, steel, wood, aluminum and glass consumption contributed to total direct carbon emission in China’s building industry were 52.80%, 35.91%, 6.86%, 3.62%, and 0.81%, respectively.
3.1.3. Estimated Total Carbon Emission
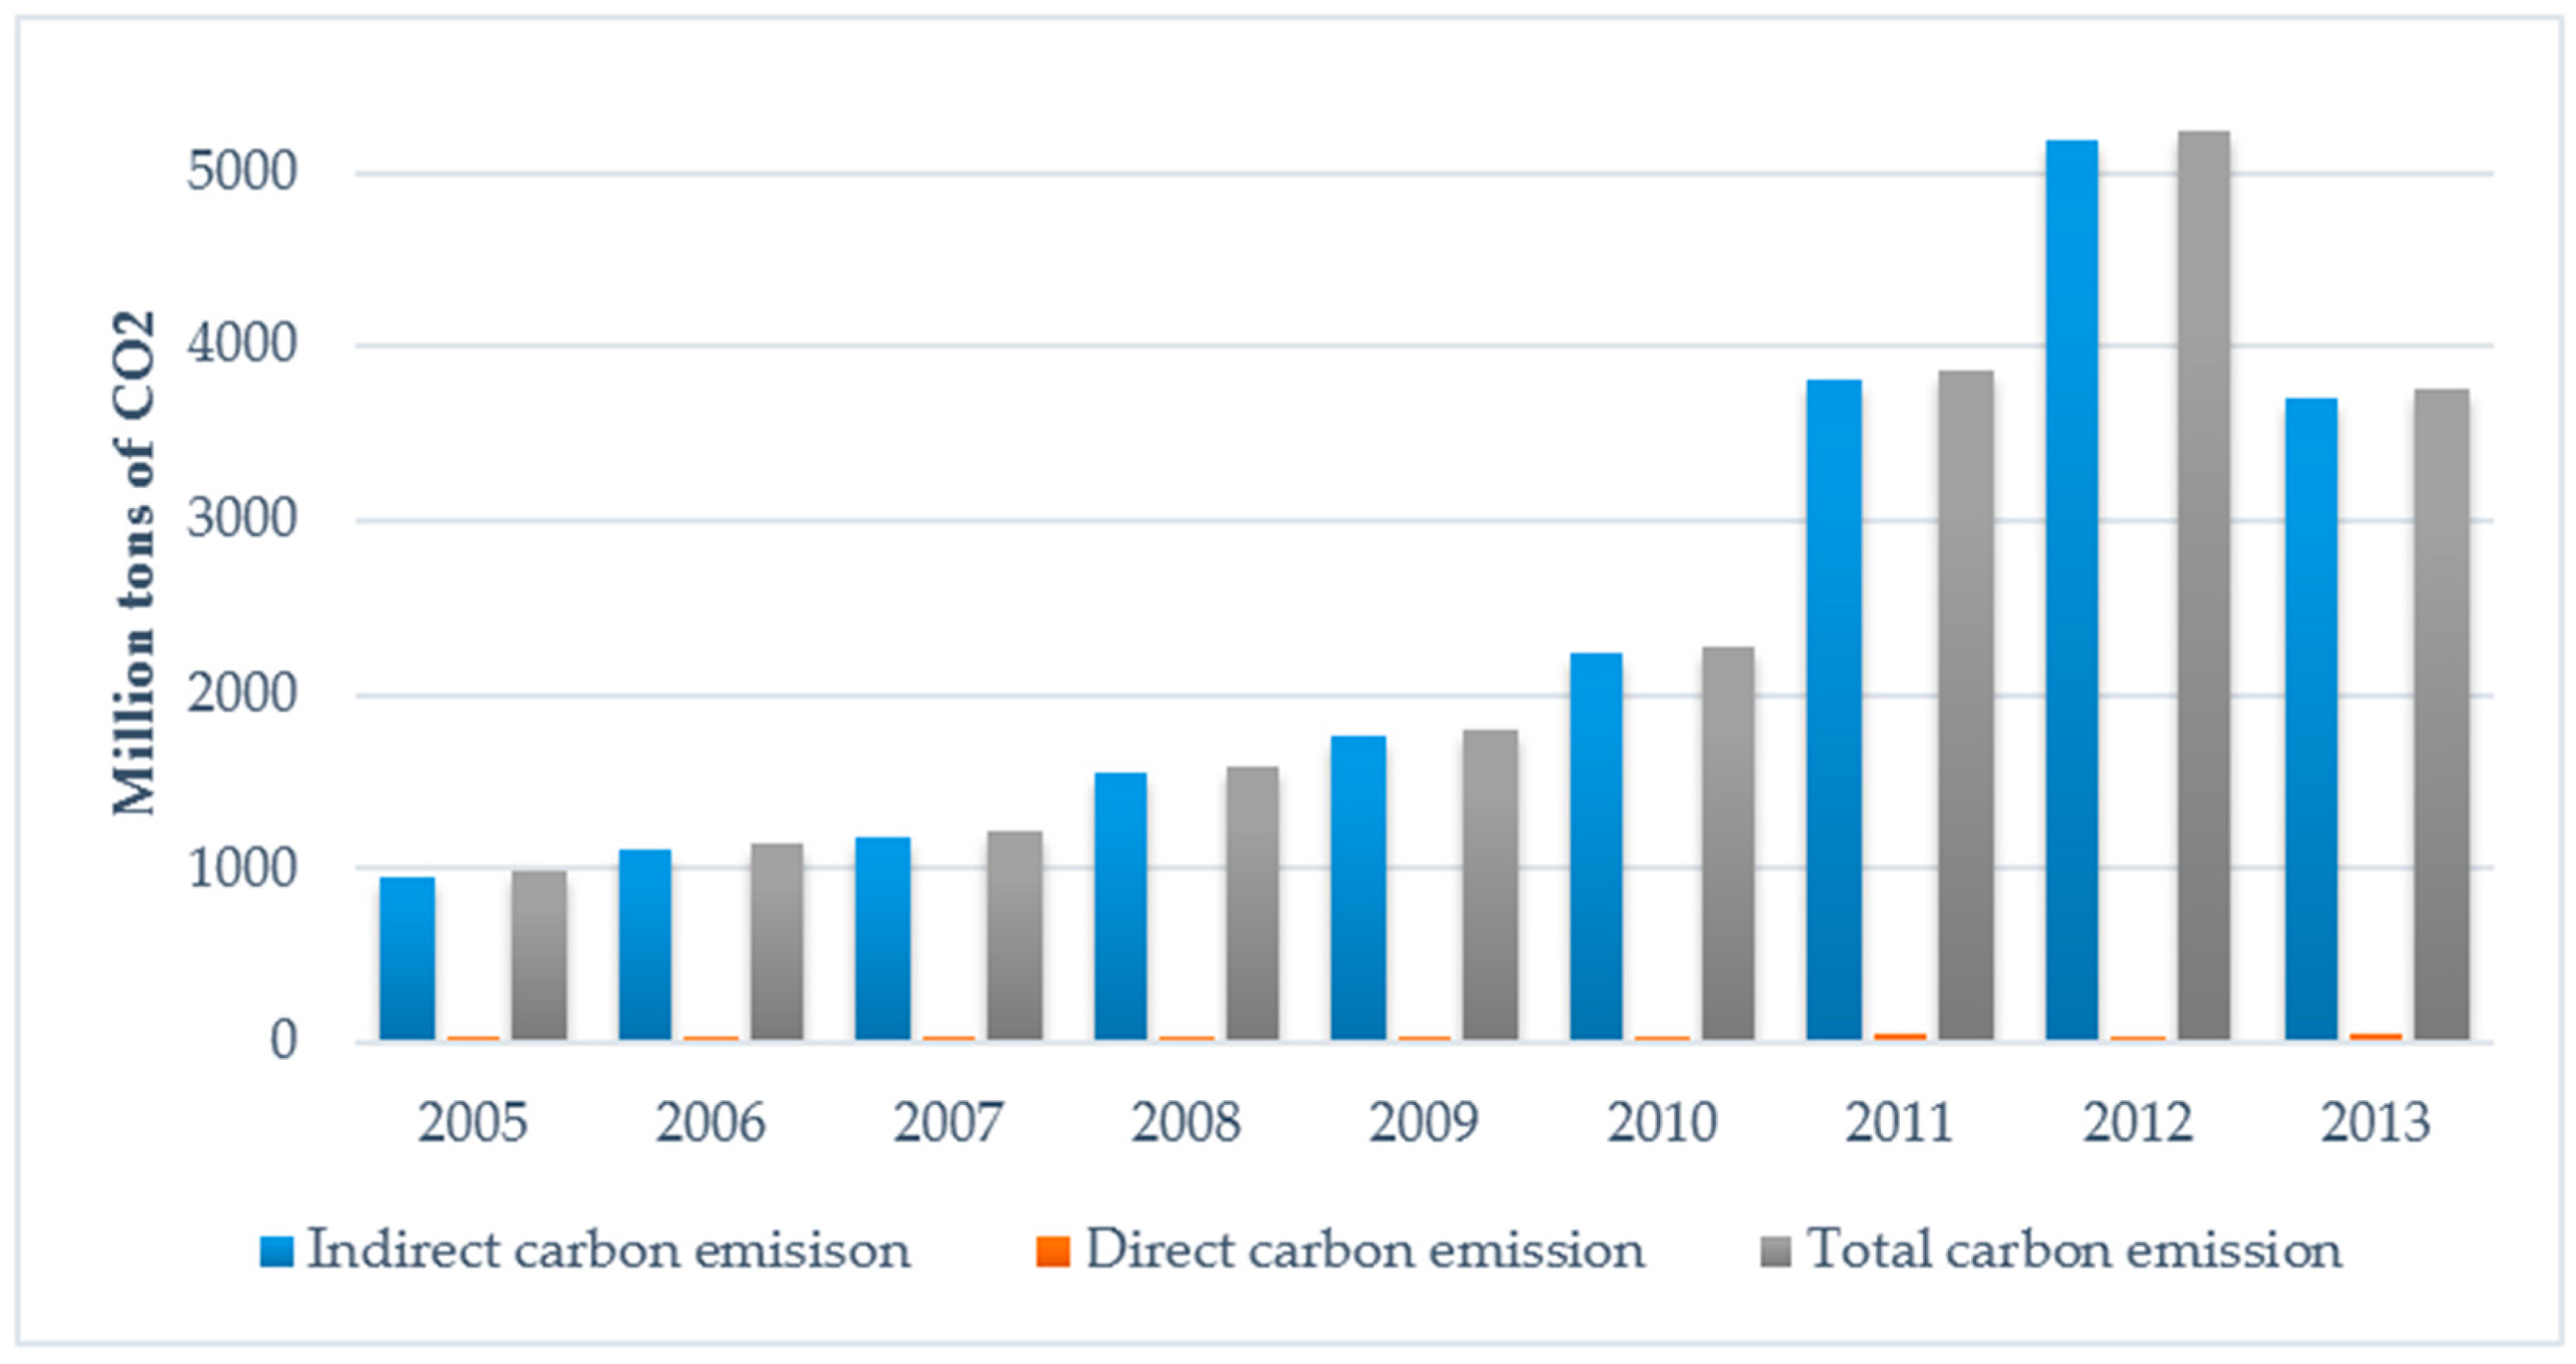
Total carbon emission in China’s building industry was calculated using Equation (3). As shown in Figure 3, total carbon emission in China’s building industry increased from 984.69 million tons of CO2 in 2005 to 3753.83 million tons of CO2 in 2013. The compound annual growth rate of total carbon emission was 18.21%, which was close to the compound annual growth rate of direct carbon emissions. The overwhelming dominant source of total carbon emission was indirect carbon emission, which accounted for 96–99% of total carbon emission from China’s building industry during 2005–2013.
3.2. Decomposition Analysis
Inspired by earlier studies [66,67,68,69,70,71,72,73,74,75], the total changes in carbon emissions is decomposed into the four indictors: (the effect of energy structure), (the effect of energy intensity), (the effect of industrial scale), and (the effect of indirect carbon emission intensity). Using Equations (11)–(17), we qualify effects of energy structure, energy intensity, economy, and indirect emission on change in total carbon emission from China’s building industry between 2005 and 2013. The results are shown in Figure 4.
3.2.1. Economic Effects
As shown in Figure 4, economic effects (economic output from building industry) were the biggest contributor to the increase in carbon emission. During 2005–2013, economic effect contributed to increase carbon emission by 71.22%. Economic effects have always taken a positive role in increasing carbon emission. However, it should also be noted that economic effects became the second biggest contributor after indirect emission intensity since 2009.
3.2.2. Indirect Emission Intensity Effects
Generally, indirect emission intensity (indirect carbon emission economic output of building industry) effects are the second contributor to increase in total carbon emission of China’s building industry. From 2005 to 2013, the accumulated contributing rate of indirect emission effects to increase total carbon emission reached 29.66%. However, the contribution from indirect emission intensity was not always positive. Indeed, indirect emission intensity effects offset the increase in carbon emission during 2005–2008, 2009–2010, and 2012–2013. During 2010–2012, indirect emission intensity offset became the leading contributor to increase in carbon emission. The change of indirect emission intensity effects might be related to the massive RMB 4 trillion (~US$0.6 trillion) infrastructure plan, which was proposed to deal with the 2008 global finance crisis in November 2008. Such rapid large-scale infrastructure investment might lead to inefficient material consumption. Indirect carbon emission intensity (indirect carbon emission per unit of GDP) increased from 0.96 kgCO2/Yuan in 2009 to 1.07 kg CO2/Yuan in 2010, to 1.66 kg CO2/Yuan in 2011, and further to 2.05 kg CO2/Yuan in 2012. Fortunately, the indirect carbon emission intensity decreased to 1.34 kg CO2/Yuan in 2013. The indirect carbon emission intensity was reversed to leading contributor to offset the increase in carbon emission between 2012 and 2013.
3.2.3. Energy Intensity Effects and Energy Structure Effects
Both energy intensity effects and energy structure effects contributed to offset carbon emission. The accumulated contributing rate of energy intensity effects and energy structure effects to increase in carbon emission from 2005 to 2013 were −0.66% and −0.22%, respectively. This is closely related to the energy consumption structure in China’s building industry. Coal and oil were the overwhelming dominant sources of energy consumption in China’s building industry, whereas clean energy remained a smaller proportion. Given the energy consumption structure has not changed, the energy structure effects and energy intensity effects were minimal.
3.3. Decoupling Analysis
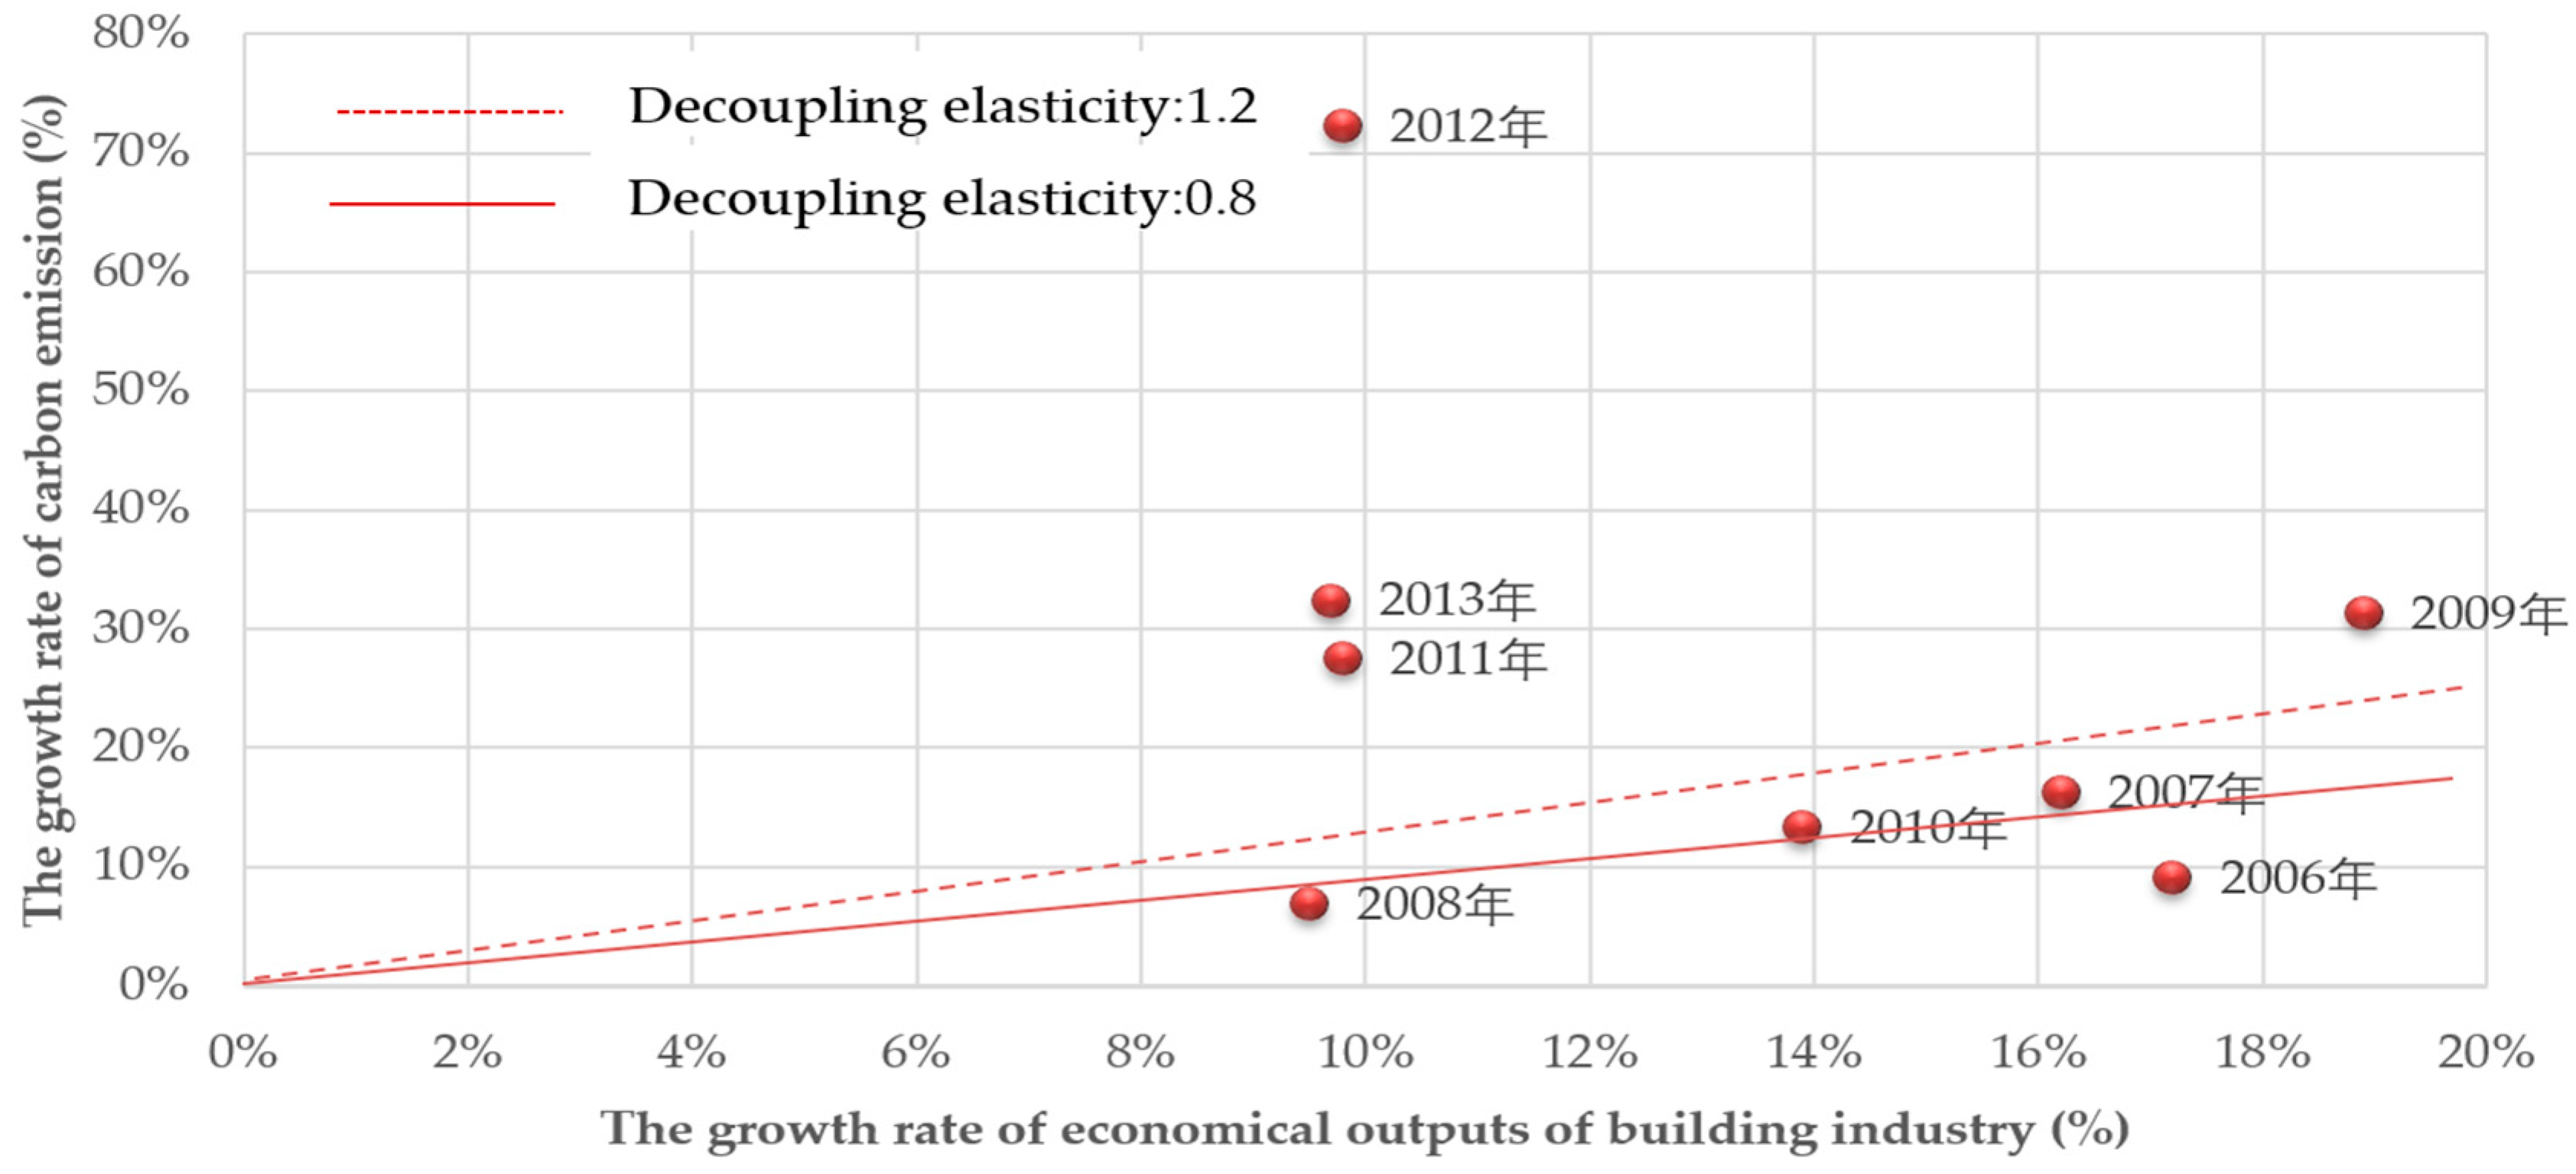
Based on former studies [49,54,76,77,78,79,80,81,82,83,84,85,86,87], we develop decoupling elasticity model and decoupling efforts model. Using Equations (18)–(20), we calculated the decoupling elasticity and decoupling efforts index. As illustrated in Figure 5, the growth rate of carbon emission and economical outputs, and the decoupling elasticity values of economic outputs are positive during the whole period. The values of Decoupling elasticity (e) is less than 0.8 in 2006 and 2008; the e is between 0.8 and 1.2 in 2007 and 2010; and the e is more than 1.2 in 2009 and 2011–2013. Consequently, the economic outputs decoupling states exhibit weak decoupling in 2006 as well as 2008, expansive decoupling in 2007 as well as 2010, and turn into expansive negative decoupling in 2009 and during 2011–2013. That means the growth rate of carbon emission is slower than the growth rate of economical outputs in 2006, 2008 and 2010, however, the growth rate of carbon emission is faster than the growth rate of economical outputs in 2007, 2009 and during 2011–2013, which is mainly attributed to the economy increase in China mainly depending on the infrastructure. The 2008–2009 Chinese economic stimulus plan is a US$586 billion stimulus package announced by the State Council of the People’s Republic of China as an attempt to minimize the impact of the global financial crisis; in addition, China has experienced urbanization and industrialization. Its urbanization and industrialization has been accelerated in the past decade. The accelerating urbanization and industrialization led to booming of building industry, which means more energy were consumed and more building materials were used. Especially the indirect carbon emission from the building materials is the leading contributor of carbon emission, which is consistent with the estimated indirect carbon emission analysis.
We can see in Figure 6 that the change of decoupling effort indexes is consistent with the change of decoupling elasticity of carbon emissions. In addition, it is concluded that the reducing of intensity of indirect carbon emissions is a key factor in decoupling from the construction industry, however, the efforts of the energy structure effect and energy intensity are rarely small, which indicates the current status of unreasonable energy structure and energy intensive industry, and the energy supply is still dominated by high-carbon energy supply when the demand of energy is increasing while the supply of clean low-carbon energy supply cannot keep up with the economic development.
4. Conclusions and Policy Implication
4.1. Conclusions
In this paper, we calculated the direct and indirect carbon emission in China’s building industry from 2005 to 2013, then analyzed the drivers of carbon emission in China’s building industry, and finally estimated the decoupling status of China’s building industry. The main conclusions are as follows.
Using data of energy consumption and materials in China’s building industry from China’s official statistics, and carbon emission coefficient from IPCC, we calculated that the total carbon emission in China’s building industry increased from 984.69 million tons of CO2 in 2005 to 3753.98 million tons of CO2 in 2013. The average annual growth rate is 18.21% per year. Indirect carbon emission from building material consumption accounted for 96–99% of total carbon emission.
Using LMDI technique, we qualify the four key influencing factors for carbon emission in China’s building industry. The indirect emission intensity effect was leading contributor to change of carbon emission. It was followed by economic output effects, which always contributed to increase carbon emission. Energy intensity effect and energy structure effect took a negligible role to offset carbon emission.
The status between carbon emission and economic output in China’s building industry during 2005–2006 and during 2007–2008 was weak decoupling; during 2006–2007 and during 2008–2010 was expansive decoupling; and during 2010–2013 was expansive negative decoupling. Indirect carbon intensity decoupling index was a leading contributor to the total decoupling index in China’s building industry. It was followed by the energy structure and energy intensity decoupling index.
4.2. Policy Implication
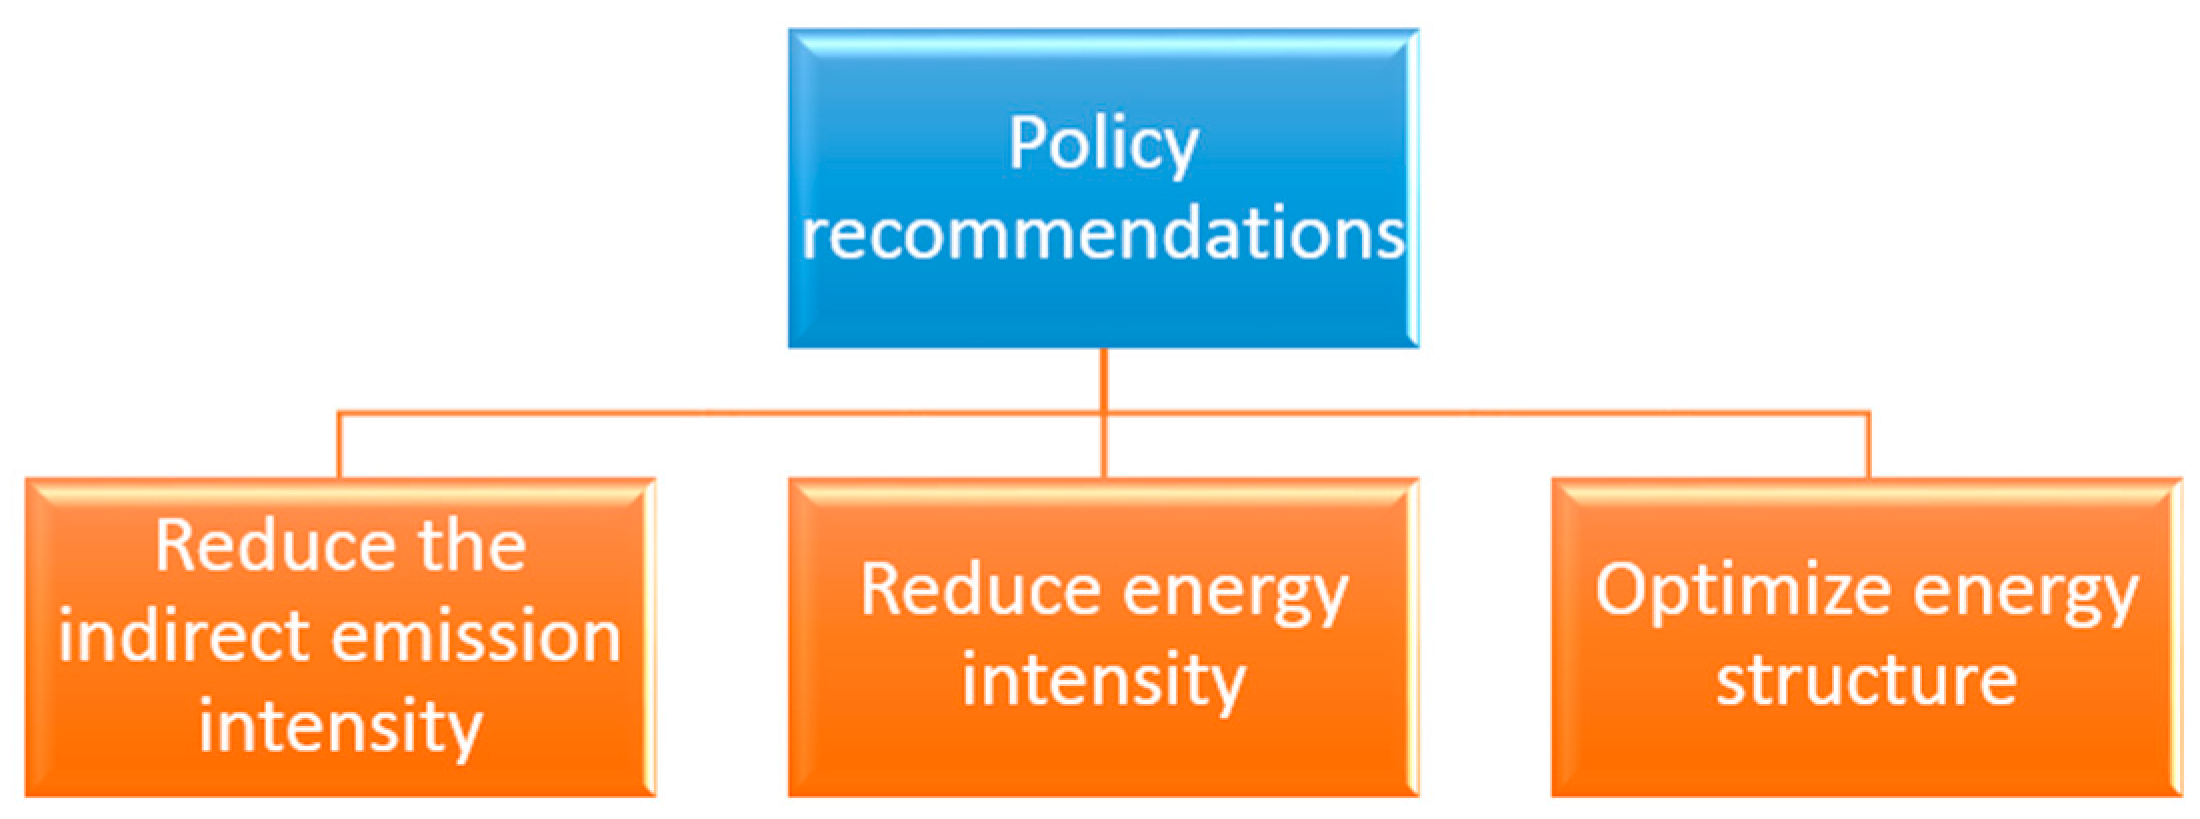
Based on the above analysis, three policy recommendations are offered to decouple China’s building industry from carbon emission (Figure 7).
- (1)
- Reducing the indirect emission intensity: Above all, the reduction of indirect emission intensity is a key to delinking economic output from carbon emission, given that indirect emission is the overwhelming dominant source of carbon emission in China’s building industry. The measures to reduction of indirect emission intensity include, but are not limited to: (i) development of new building materials to reduce the consumption of traditional building materials, such as cement, steel, and aluminum; (ii) improving energy efficiency to lower carbon intensity of traditional building materials; and (iii) phasing out the low energy efficient building materials as soon as possible.
- (2)
- Reducing energy intensity: As shown in our study, energy intensity effects were leading contributor to offset carbon emission in China’s building industry. Improving energy efficiency is a cost-effective approach to decouple between economic output and carbon in China’s building industry. The government should introduce policies and establish financial support systems to promote the development of low-carbon technologies, and encourage construction companies to adopt low-carbon construction technology to optimize building design, thereby improving energy efficiency and improving the suppression effect of energy intensity on carbon emission.
- (3)
- Optimizing energy structure: We can fully develop the use of hydropower, wind energy, solar energy and other clean energy, reduce dependence on high-carbon energy, and establish a sound energy-saving emission reduction standard building system.
Acknowledgments
The current work is supported by “the Fundamental Research Funds for the Central Universities (27R1706019B)” and the Recruitment Talent Fund of China University of Petroleum (Huadong) (05Y16060020). We have received grants in support of our research work. The funds we have received covered the costs to publish in open access.
Author Contributions
Rui Jiang performed the experiments, analyzed the data, and contributed reagents/materials/analysis tools. Rongrong Li conceived and designed the experiments and wrote the paper. All authors read and approved the final manuscript.
Conflicts of Interest
The authors declare no conflict of interest.
References
- National Bureau of Statistics of China. National Economical Industry Classification; China Statistics Press: Beijing, China, 2013; p. 2012. (In Chinese)
- Allen, S.K.; Plattner, G.K.; Nauels, A.; Xia, Y.; Stocker, T.F. Climate Change 2013: The Physical Science Basis. In An Overview of the Working Group 1 Contribution to the Fifth Assessment Report of the Intergovernmental Panel on Climate Change (IPCC). 2014. Available online: http://www.ipcc.ch/report/ar5/wg1/ (accessed on 8 May 2017).
- United Nations Environment Programme. Buildings and Climate Change; United Nations Environment Programme Sustainable Buildings & Climate Initiative: Paris, France, 2009. [Google Scholar]
- Berardi, U. A cross-country comparison of the building energy consumptions and their trends. Resour. Conserv. Recycl. 2017. [Google Scholar] [CrossRef]
- Cubi, E.; Doluweera, G.; Bergerson, J. Incorporation of electricity GHG emissions intensity variability into building environmental assessment. Appl. Energy 2015, 159, 62–69. [Google Scholar] [CrossRef]
- Herrera, J.C.; Chamorro, C.R.; Martín, M.C. Experimental analysis of performance, greenhouse gas emissions and economic parameters for two cooling systems in a public administration building. Energy Build. 2015, 108, 145–155. [Google Scholar] [CrossRef]
- Chau, C.K.; Hui, W.K.; Ng, W.Y.; Powell, G. Assessment of CO2 emissions reduction in high-rise concrete office buildings using different material use options. Resour. Conserv. Recycl. 2012, 61, 22–34. [Google Scholar] [CrossRef]
- Wang, Q.; Li, R. Journey to burning half of global coal: Trajectory and drivers of China’s coal use. Renew. Sustain. Energy Rev. 2016, 58, 341–346. [Google Scholar] [CrossRef]
- Zhang, X.; Wang, F. Life-cycle assessment and control measures for carbon emissions of typical buildings in China. Building Environ. 2015, 86, 89–97. [Google Scholar] [CrossRef]
- Wang, Q. China has the capacity to lead in carbon trading. Nature 2013, 493, 273. [Google Scholar] [CrossRef] [PubMed]
- Wang, X.-R.; Hui, E.C.-M.; Choguill, C.; Jia, S.-H. The new urbanization policy in China: Which way forward? Habitat Int. 2015, 47, 279–284. [Google Scholar] [CrossRef]
- Chauvin, J.P.; Glaeser, E.; Ma, Y.; Tobio, K. What is Different about Urbanization in Rich and Poor Countries? Cities in Brazil, China, India and the United States. J. Urb. Econ. 2016. [Google Scholar] [CrossRef]
- Wang, Q. China should aim for a total cap on emissions. Nature 2014, 512, 115. [Google Scholar] [CrossRef] [PubMed]
- Chmutina, K. Building energy consumption and its regulations in China. In China Policy Institute, School of Contemporary Chinese Studies, International House; The University of Nottingham: Nottingham, UK, 2010. [Google Scholar]
- Yu, S.; Evans, M.; Delgado, A. Building Energy Efficiency in India: Compliance Evaluation of Energy Conservation Building Code. Curr. Politics Econ. North. West. Asia 2015, 24, 119. [Google Scholar]
- Salvalai, G.; Masera, G.; Sesana, M.M. Italian local codes for energy efficiency of buildings: Theoretical definition and experimental application to a residential case study. Renew. Sustain. Energy Rev. 2015, 42, 1245–1259. [Google Scholar] [CrossRef]
- Wang, Q.; Chen, X. Energy policies for managing China’s carbon emission. Renew. Sustain. Energy Rev. 2015, 50, 470–479. [Google Scholar] [CrossRef]
- Qiang, W.; Li, R.; Hua, L. Toward Decoupling: Growing GDP without Growing Carbon Emissions. Environ. Sci. Technol. 2016, 50, 11435. [Google Scholar]
- Dodman, D. Blaming cities for climate change? An analysis of urban greenhouse gas emissions inventories. Environ. Urban. 2009, 21, 185–201. [Google Scholar] [CrossRef]
- Wang, Q.; Li, R. Impact of cheaper oil on economic system and climate change: A SWOT analysis. Renew. Sustain. Energy Rev. 2016, 54, 925–931. [Google Scholar] [CrossRef]
- Wang, Q.; Li, R. Drivers for energy consumption: A comparative analysis of China and India. Renew. Sustain. Energy Rev. 2016, 62, 954–962. [Google Scholar] [CrossRef]
- Acquaye, A.A.; Duffy, A.P. Input–output analysis of Irish construction sector greenhouse gas emissions. Build. Environ. 2010, 45, 784–791. [Google Scholar] [CrossRef]
- Nässén, J.; Holmberg, J.; Wadeskog, A.; Nyman, M. Direct and indirect energy use and carbon emissions in the production phase of buildings: An input–output analysis. Energy 2007, 32, 1593–1602. [Google Scholar] [CrossRef]
- Buchanan, A.H.; Honey, B.G. Energy and carbon dioxide implications of building construction. Energy Build. 1994, 20, 205–217. [Google Scholar] [CrossRef]
- Ali, H.H.; Al Nsairat, S.F. Developing a green building assessment tool for developing countries—Case of Jordan. Build. Environ. 2009, 44, 1053–1064. [Google Scholar] [CrossRef]
- Wang, Q.; Chen, X.; Jha, A.N.; Rogers, H. Natural gas from shale formation—The evolution, evidences and challenges of shale gas revolution in United States. Renew. Sustain. Energy Rev. 2014, 30, 1–28. [Google Scholar] [CrossRef]
- Wang, Q.; Li, R. Sino-Venezuelan oil-for-loan deal–the Chinese strategic gamble? Renew. Sustain. Energy Rev. 2016, 64, 817–822. [Google Scholar] [CrossRef]
- Rodríguez Serrano, A.; Porras Álvarez, S. Life Cycle Assessment in Building: A Case Study on the Energy and Emissions Impact Related to the Choice of Housing Typologies and Construction Process in Spain. Sustainability 2016, 8, 287. [Google Scholar] [CrossRef]
- Zabalza, I.; Scarpellini, S.; Aranda, A.; Llera, E.; Jáñez, A. Use of LCA as a tool for building ecodesign: A case study of a low energy building in Spain. Energies 2013, 6, 3901–3921. [Google Scholar] [CrossRef]
- Wang, Q.; Li, R.; Jiang, R. Decoupling and Decomposition Analysis of Carbon Emissions from Industry: A Case Study from China. Sustainability 2016, 8, 1059. [Google Scholar] [CrossRef]
- Wang, Q. Effective policies for renewable energy—The example of China’s wind power—Lessons for China’s photovoltaic power. Renew. Sustain. Energy Rev. 2010, 14, 702–712. [Google Scholar] [CrossRef]
- Han, M.; Chen, G.; Shao, L.; Li, J.; Alsaedi, A.; Ahmad, B.; Guo, S.; Jiang, M.; Ji, X. Embodied energy consumption of building construction engineering: Case study in E-town, Beijing. Energy Build. 2013, 64, 62–72. [Google Scholar] [CrossRef]
- Zhang, X.; Shen, L.; Zhang, L. Life cycle assessment of the air emissions during building construction process: A case study in Hong Kong. Renew. Sustain. Energy Rev. 2013, 17, 160–169. [Google Scholar] [CrossRef]
- Wang, Q.; Li, R. Natural gas from shale formation: A research profile. Renew. Sustain. Energy Rev. 2016, 57, 1–6. [Google Scholar] [CrossRef]
- Duranton, G. Growing through cities in developing countries. World Bank Res. Obs. 2015, 30, 39–73. [Google Scholar] [CrossRef]
- Evans, M.; Shui, B.; Halverson, M.; Delgado, A. Enforcing Building Energy Codes in China: Progress and Comparative Lessons. Available online: http://www.pnl.gov/main/publications/external/technical_reports/PNNL-19247.pdf (accessed on 8 May 2017).
- Ortiz, O.; Castells, F.; Sonnemann, G. Sustainability in the construction industry: A review of recent developments based on LCA. Constr. Build. Mater. 2009, 23, 28–39. [Google Scholar] [CrossRef]
- Hammond, G.P.; Jones, C.I. Embodied energy and carbon in construction materials. Proc. Inst. Civ. Eng. Energy 2008, 161, 87–98. [Google Scholar] [CrossRef]
- Cabeza, L.F.; Barreneche, C.; Miró, L.; Morera, J.M.; Bartolí, E.; Fernández, A.I. Low carbon and low embodied energy materials in buildings: A review. Renew. Sustain. Energy Rev. 2013, 23, 536–542. [Google Scholar] [CrossRef]
- Cabeza, L.F.; Rincón, L.; Vilariño, V.; Pérez, G.; Castell, A. Life cycle assessment (LCA) and life cycle energy analysis (LCEA) of buildings and the building sector: A review. Renew. Sustain. Energy Rev. 2014, 29, 394–416. [Google Scholar] [CrossRef]
- Zhang, Z.H.; Liu, R.J. Carbon Emissions in the Construction Sector Based on Input-Output Analyses. Available online: http://en.cnki.com.cn/Article_en/CJFDTOTAL-QHXB201301010.htm (accessed on 8 May 2017).
- Li, Z. Study on the Life Cycle Consumption of Energy and Resource of Air Conditioning in Urban Residential Buildings in China. Available online: http://www.globethesis.com/?t=1102360272977717 (accessed on 8 May 2017).
- Ang, B.; Choi, K.-H. Decomposition of aggregate energy and gas emission intensities for industry: A refined Divisia index method. Energy J. 1997, 18, 59–73. [Google Scholar] [CrossRef]
- González, P.F.; Landajo, M.; Presno, M. Tracking European Union CO2 emissions through LMDI (logarithmic-mean Divisia index) decomposition. The activity revaluation approach. Energy 2014, 73, 741–750. [Google Scholar] [CrossRef]
- Ang, B.W.; Zhang, F.Q.; Choi, K.H. Factorizing changes in energy and environmental indicators through decomposition. Energy 1998, 23, 489–495. [Google Scholar] [CrossRef]
- Kaya, Y. Impact of Carbon Dioxide Emission Control on GNP Growth: Interpretation of Proposed Scenarios. Available online: http://www.ipcc.ch/ipccreports/sres/emission/index.php?idp=48 (accessed on 8 May 2017).
- Ang, B.W. The LMDI approach to decomposition analysis: A practical guide. Energy Policy 2005, 33, 867–871. [Google Scholar] [CrossRef]
- Gray, D.; Anable, J.; Illingworth, L.; Graham, W. Decoupling the Link between Economic Growth, Transport Growth and Carbon Emissions in Scotland. Available online: https://www.researchgate.net/publication/267221393 (accessed on 8 May 2017).
- Tapio, P. Towards a theory of decoupling: Degrees of decoupling in the EU and the case of road traffic in Finland between 1970 and 2001. Transp. Policy 2005, 12, 137–151. [Google Scholar] [CrossRef]
- Zhao, J.; Shi-Ping, H.E. Research on the Vibration Characteristics of Simply Supported Plate Covered by a Decoupling Layer and Immersed in Water. Available online: http://en.cnki.com.cn/Article_en/CJFDTOTAL-JCKX201302005.htm (accessed on 8 May 2017).
- Arrow, K.; Bolin, B.; Costanza, R.; Dasgupta, P. Economic growth, carrying capacity, and the environment. Science 1995, 268, 520. [Google Scholar] [CrossRef] [PubMed]
- De Bruyn, S.M.; van den Bergh, J.C.; Opschoor, J.B. Economic growth and emissions: Reconsidering the empirical basis of environmental Kuznets curves. Ecol. Econ. 1998, 25, 161–175. [Google Scholar] [CrossRef]
- Lu, Q.; Yang, H.; Huang, X.; Chuai, X.; Wu, C. Multi-sectoral decomposition in decoupling industrial growth from carbon emissions in the developed Jiangsu Province, China. Energy 2015, 82, 414–425. [Google Scholar] [CrossRef]
- Diakoulaki, D.; Mandaraka, M. Decomposition analysis for assessing the progress in decoupling industrial growth from CO2 emissions in the EU manufacturing sector. Energy Econ. 2007, 29, 636–664. [Google Scholar] [CrossRef]
- Wang, Z.; Yang, L. Delinking indicators on regional industry development and carbon emissions: Beijing–Tianjin–Hebei economic band case. Ecol. Indic. 2015, 48, 41–48. [Google Scholar] [CrossRef]
- China Statistics Press. China Energy Statistical Yearbook; China Statistics Press: Beijing, China, 2005. (In Chinese)
- China Statistics Press. China Energy Statistical Yearbook; China Statistics Press: Beijing, China, 2010. (In Chinese)
- China Statistics Press. China Energy Statistical Yearbook; China Statistics Press: Beijing, China, 2013. (In Chinese)
- China Statistics Press. China Statistical Yearbook on Construction; China Statistics Press: Beijing, China, 2005. (In Chinese)
- China Statistics Press. China Statistical Yearbook on Construction; China Statistics Press: Beijing, China, 2010. (In Chinese)
- China Statistics Press. China Statistical Yearbook on Construction; China Statistics Press: Beijing, China, 2013. (In Chinese)
- United States Agency for International Development. GHG Protocol Tool For Energy Consumption in China. 2013. Available online: http://www.ghgprotocol.org/calculation-tools/all-tools/ (accessed on 8 May 2017).
- HE Ai-zhong, L.P. Factor decomposition and decoupling analysis on CO2 emissions: Evidence from China’s circulation sector. China Environ. Sci. 2015, 35, 953–960. [Google Scholar]
- Fan, Y.; Liu, L.-C.; Wu, G.; Tsai, H.-T.; Wei, Y.-M. Changes in carbon intensity in China: Empirical findings from 1980–2003. Ecol. Econ. 2007, 62, 683–691. [Google Scholar] [CrossRef]
- Feng, B.; Wang, X.Q. Research on Carbon Decoupling Effect and Influence Factors of Provincial Construction Industry in China. China Popul. Resour. Environ. 2015, 25, 28–34. [Google Scholar]
- Ren, S.; Yin, H.; Chen, X.H. Using LMDI to analyze the decoupling of carbon dioxide emissions by China’s manufacturing industry. Environ. Dev. 2013, 9, 61–75. [Google Scholar] [CrossRef]
- Voigt, S.; Cian, E.D.; Schymura, M.; Verdolini, E. Energy intensity developments in 40 major economies: Structural change or technology improvement? Energy Econ. 2014, 41, 47–62. [Google Scholar] [CrossRef]
- Xu, S.C.; He, Z.X.; Long, R.Y. Factors that influence carbon emissions due to energy consumption in China: Decomposition analysis using LMDI. Appl. Energy 2014, 127, 182–193. [Google Scholar] [CrossRef]
- Ang, B.W. LMDI decomposition approach: A guide for implementation. Energy Policy 2015, 86, 233–238. [Google Scholar] [CrossRef]
- Wang, Q. China’s citizens must act to save their environment. Nature 2013, 497, 159. [Google Scholar] [CrossRef] [PubMed]
- Wang, Q.; Chen, X.; Yi-Chong, X. Accident like the Fukushima unlikely in a country with effective nuclear regulation: Literature review and proposed guidelines. Renew. Sustain. Energy Rev. 2013, 17, 126–146. [Google Scholar] [CrossRef]
- Wang, Q.; Chen, X. Rethinking and reshaping the climate policy: Literature review and proposed guidelines. Renew. Sustain. Energy Rev. 2013, 21, 469–477. [Google Scholar] [CrossRef]
- Raupach, M.R.; Marland, G.; Ciais, P.; Le, Q.C.; Canadell, J.G.; Klepper, G.; Field, C.B. Global and regional drivers of accelerating CO2 emissions. Proc. Natl. Acad. Sci. USA 2007, 104, 10288–10293. [Google Scholar] [CrossRef] [PubMed]
- Wang, Q. Time for commercializing non-food biofuel in China. Renew. Sustain. Energy Rev. 2011, 15, 621–629. [Google Scholar] [CrossRef]
- Wang, Q. China needing a cautious approach to nuclear power strategy. Energy Policy 2009, 37, 2487–2491. [Google Scholar] [CrossRef]
- Wang, Q.; Chen, X. China’s electricity market-oriented reform: From an absolute to a relative monopoly. Energy Policy 2012, 51, 143–148. [Google Scholar] [CrossRef]
- Wang, Q.; Chen, X. Regulatory failures for nuclear safety–the bad example of Japan–implication for the rest of world. Renew. Sustain. Energy Rev. 2012, 16, 2610–2617. [Google Scholar] [CrossRef]
- Wang, Q.; Chen, X. Regulatory transparency—How China can learn from Japan’s nuclear regulatory failures? Renew. Sustain. Energy Rev. 2012, 16, 3574–3578. [Google Scholar] [CrossRef]
- Tapio, P. Disaggregative policy Delphi: Using cluster analysis as a tool for systematic scenario formation. Technol. Forecast. Soc. Chang. 2003, 70, 83–101. [Google Scholar] [CrossRef]
- Tapio, P.; Banister, D.; Luukkanen, J.; Vehmas, J.; Willamo, R.; France, N. Energy and transport in comparison: Immaterialisation, dematerialisation and decarbonisation in the EU15 between 1970 and 2000. Energy Policy 2007, 35, 433–451. [Google Scholar] [CrossRef]
- Rikkonen, P.; Tapio, P. Future prospects of alternative agro-based bioenergy use in Finland—Constructing scenarios with quantitative and qualitative Delphi data. Technol. Forecast. Soc. Chang. 2009, 76, 978–990. [Google Scholar] [CrossRef]
- Wang, Q.; Chen, Y. Barriers and opportunities of using the clean development mechanism to advance renewable energy development in China. Renew. Sustain. Energy Rev. 2010, 14, 1989–1998. [Google Scholar] [CrossRef]
- Qiang, W.; Qiu, H.N.; Kuang, Y. Market-driven energy pricing necessary to ensure China’s power supply. Energy Policy 2009, 37, 2498–2504. [Google Scholar]
- Wang, Q.; Jha, A.N.; Chen, X.; Dong, J.-F.; Wang, X.-M. The future of nuclear safety: Vital role of geoscientists? Renew. Sustain. Energy Rev. 2015, 43, 239–243. [Google Scholar] [CrossRef]
- Andreoni, V.; Galmarini, S. Decoupling economic growth from carbon dioxide emissions: A decomposition analysis of Italian energy consumption. Energy 2012, 44, 682–691. [Google Scholar] [CrossRef]
- Sorrell, S.; Lehtonen, M.; Stapleton, L.; Pujol, J.; Champion, T. Decoupling of road freight energy use from economic growth in the United Kingdom. Energy Policy 2012, 41, 84–97. [Google Scholar] [CrossRef]
- Wang, Q. Nuclear safety lies in greater transparency. Nature 2013, 494, 403. [Google Scholar] [CrossRef] [PubMed]
Figure 1.
Direct carbon emission of China’s building industry 2005–2013.

Figure 2.
Indirect carbon emission of China’s building industry 2005–2013.
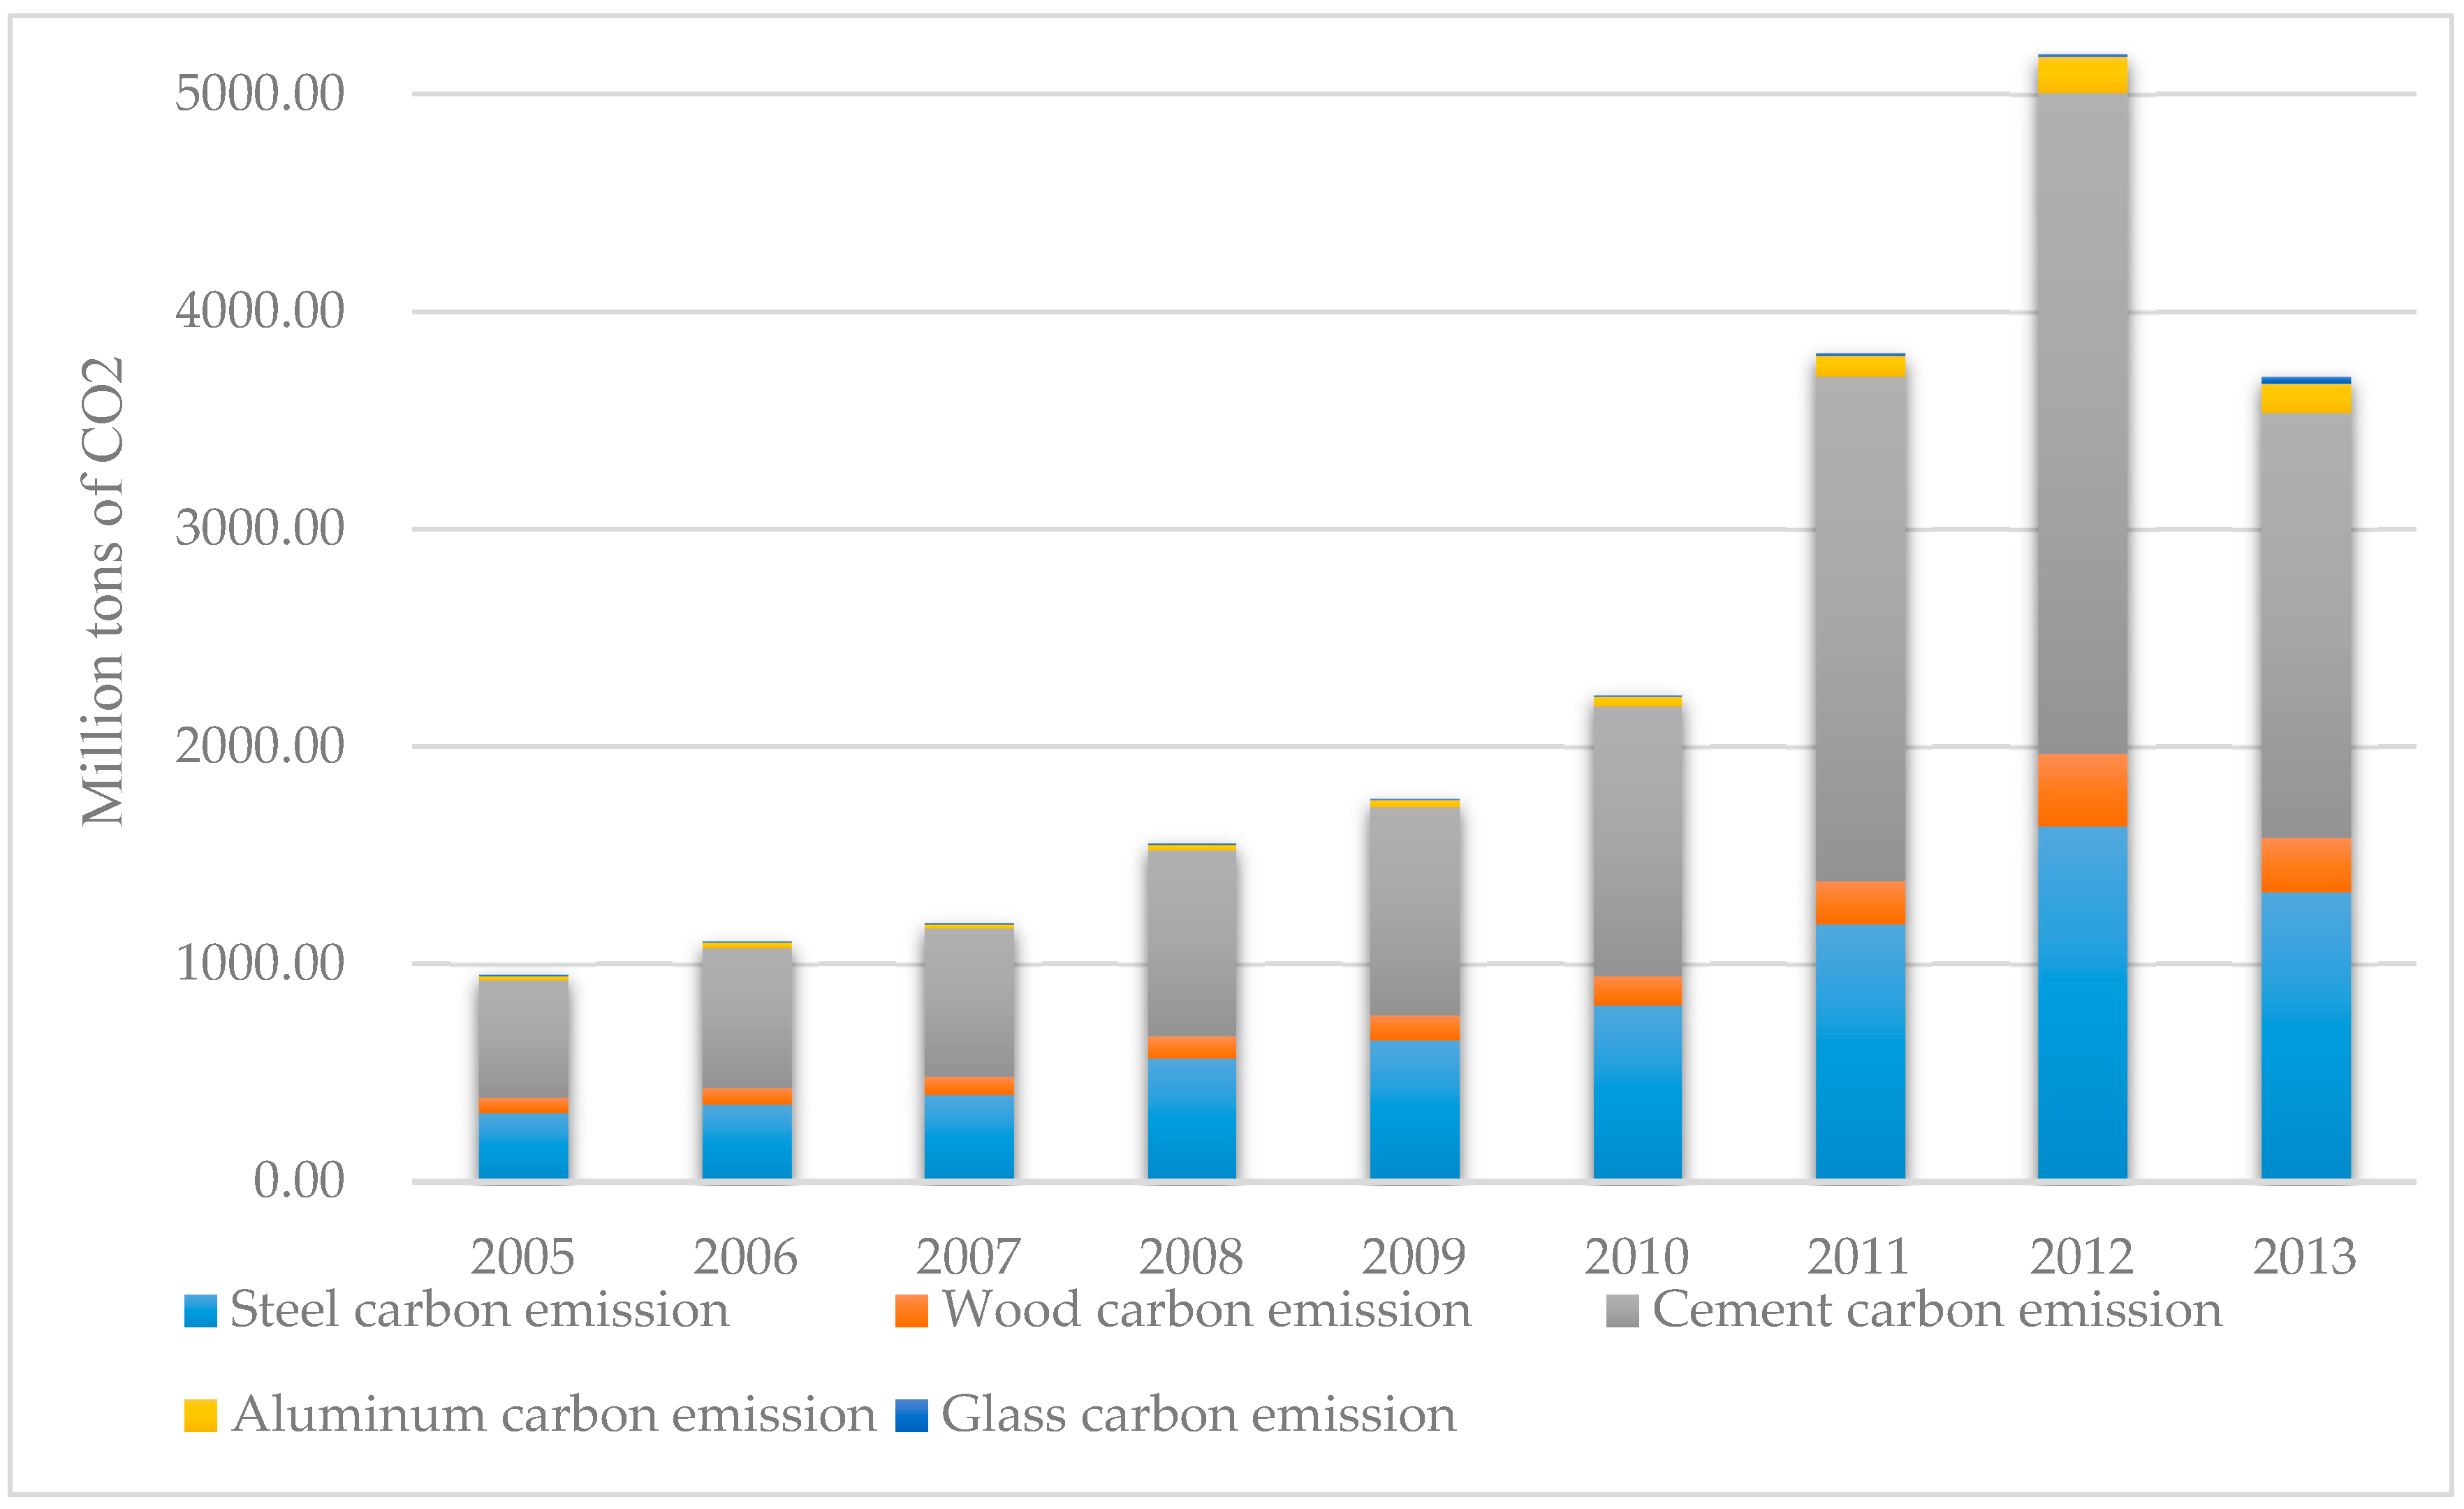
Figure 3.
Direct, indirect and total carbon emission from China’s building industry between 2005 and 2013.
Figure 3.
Direct, indirect and total carbon emission from China’s building industry between 2005 and 2013.

Figure 4.
Decomposition of carbon emission of building industry 2005–2013 unit: (million tons of CO2).
Figure 4.
Decomposition of carbon emission of building industry 2005–2013 unit: (million tons of CO2).

Figure 5.
The change of decoupling elasticity of carbon emissions during 2006–2013.

Figure 6.
The change of decoupling effort indexes during 2006–2013.
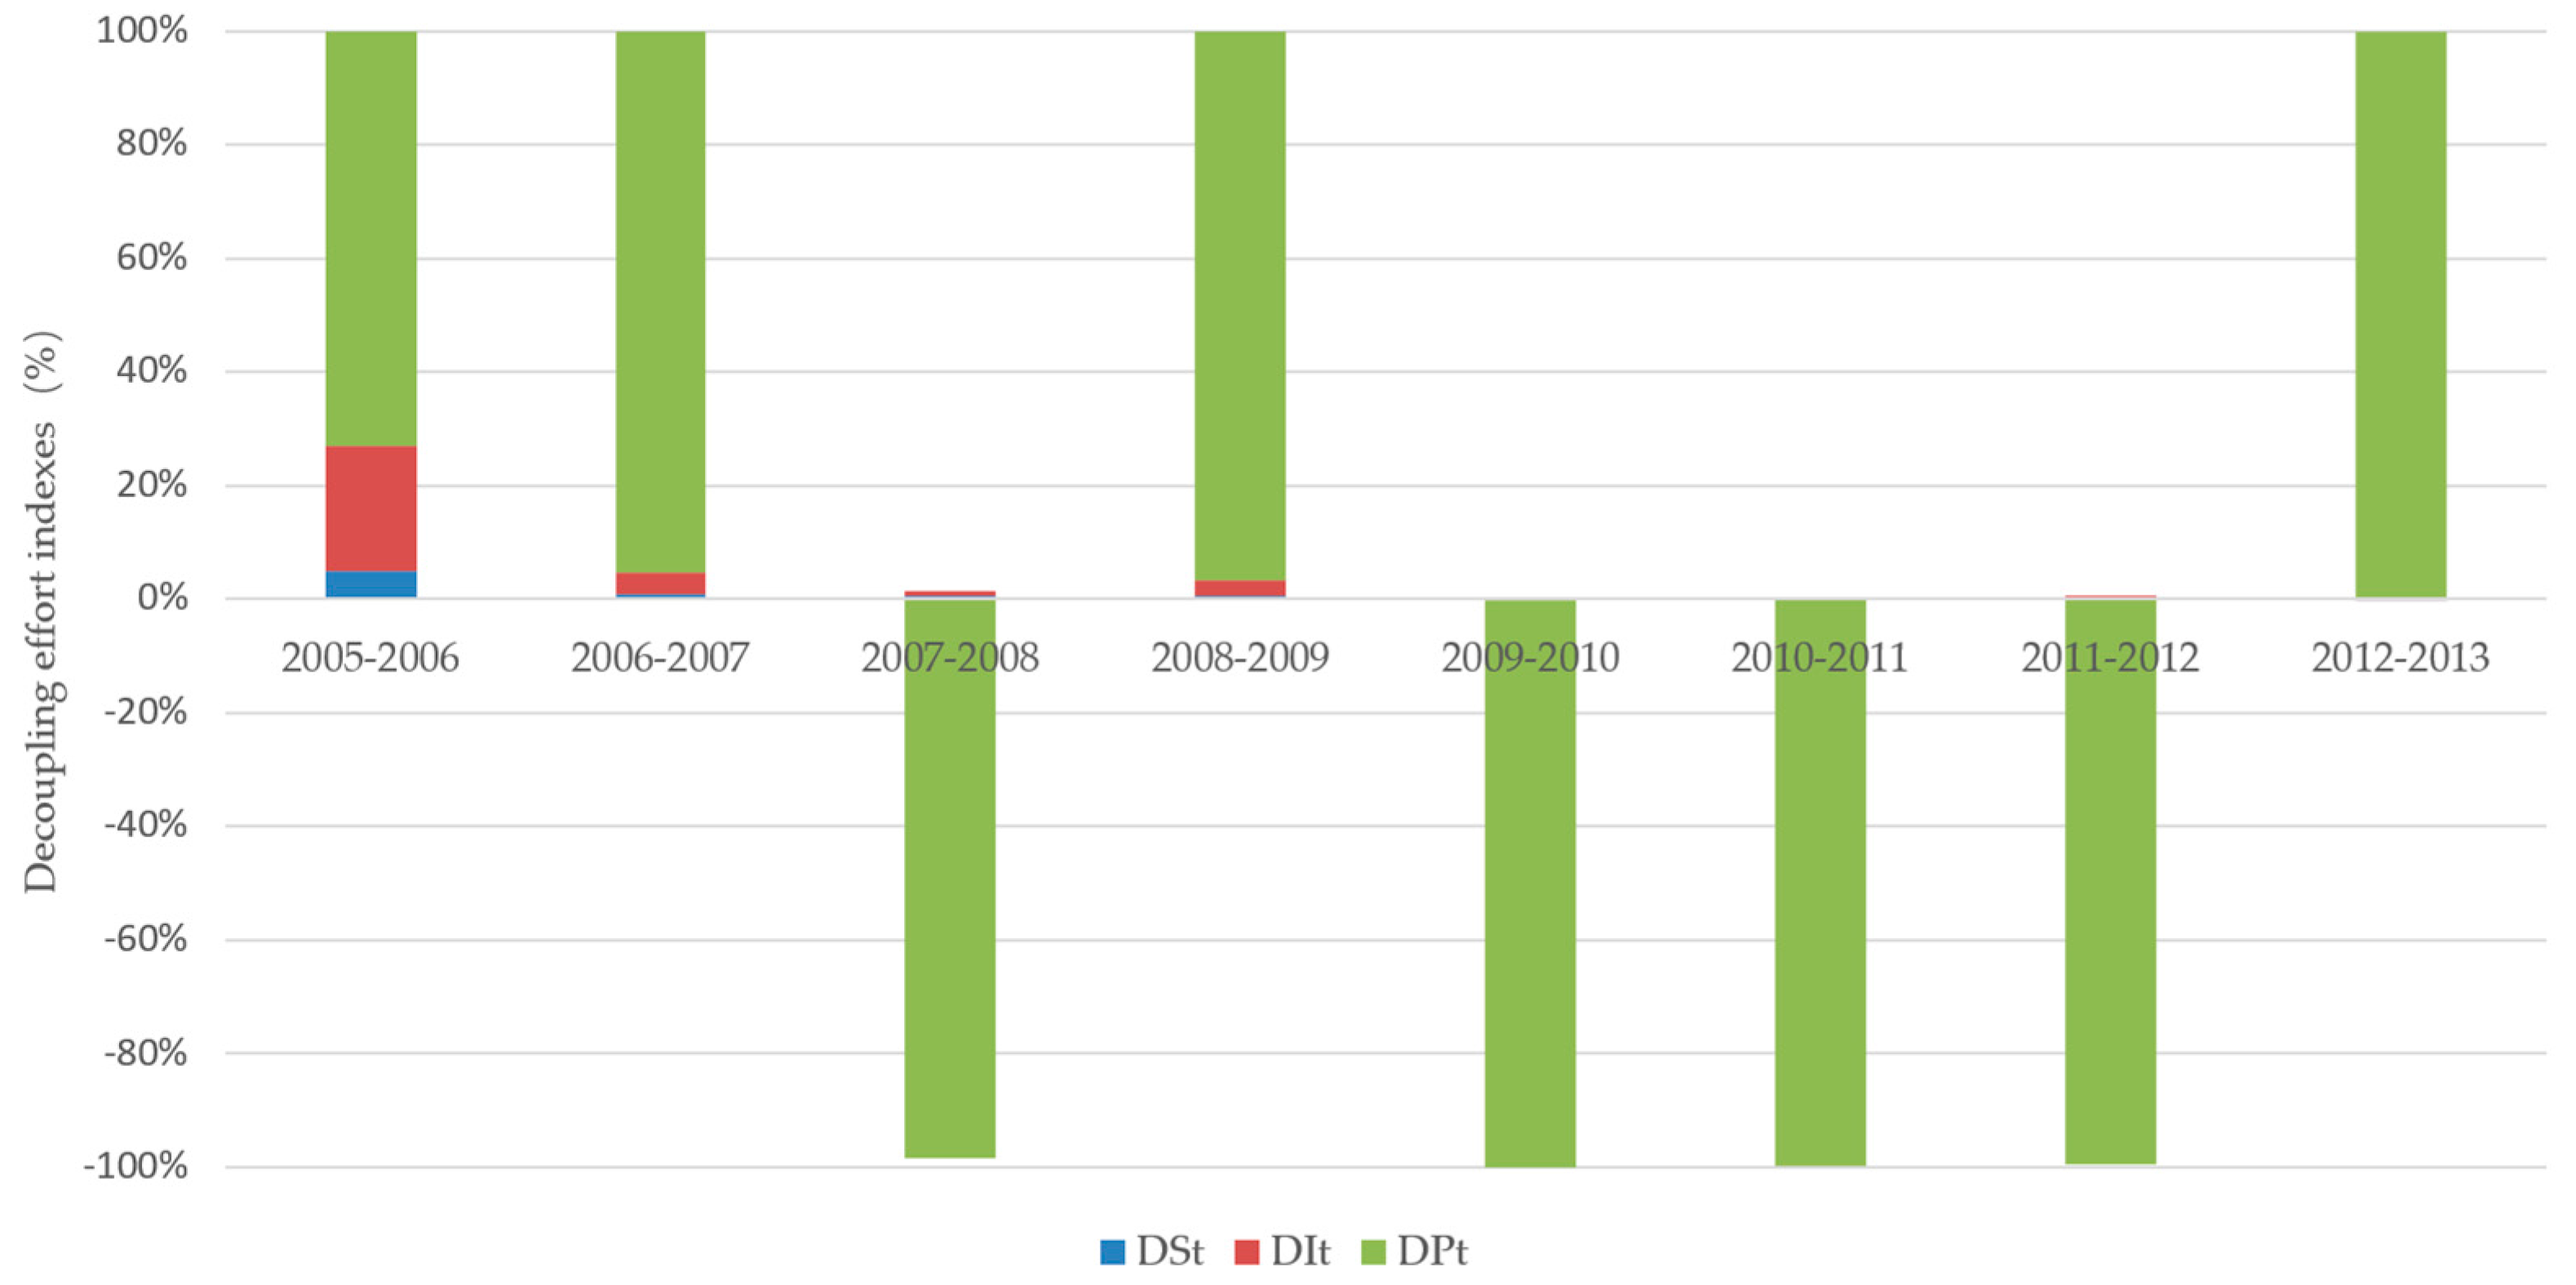
Figure 7.
The suggestions based on the data analysis.

Table 1.
The actions of Chinese government to curb energy consumption in buildings.
| Time | Action | Purpose and Specific Content |
|---|---|---|
| September 2005 | “Circular of the general office of the State Council on further promoting the reform and popularization of wall materials” | Further promote the reform of wall materials and promote energy-efficient construction, effective protection of arable land and energy conservation. |
| November 2005 | Civil building energy conservation management regulations | In order to strengthen the administration of energy conservation, improve the efficiency of energy utilization and improve the quality of indoor thermal environment, the Ministry of construction has formulated the regulations in accordance with the relevant laws and regulations. |
| August 2007 | Measures for the administration of green building evaluation marks | These measures are formulated for the purpose of standardizing the work of green building evaluation and marking and guiding the healthy development of green buildings. |
| September 2007 | Green construction guidelines | Green construction refers to the construction of the project, in ensuring the quality, safety and other basic requirements under the premise of scientific management and technological progress, to maximize the resources and reduce the negative impact on the construction activities of the environment to achieve energy saving, land, water, Materials and environmental protection. |
| August 2008 | Civil building energy conservation regulations | This Ordinance is to strengthen the management of civil building energy conservation, reduce energy consumption in the use of civil buildings, improve energy efficiency. |
| October 2008 | Interim Measures for the administration of financial subsidies for renewable energy efficient building materials | To support the Wenchuan earthquake construction waste treatment and recycling, national finance will arrange special funds to support the production of energy-saving building materials and recycling utilization. |
| December 2010 | “National Green Building Innovation Award” and “National Green Building Innovation Award” | To do a good job in the management and evaluation of the National Green Building Innovation Award, and guide the healthy development of green building in China. |
| January 2011 | On further deepening the northern heating area of existing residential building heating metering and energy conservation work notice | During the Twelfth Five-Year Guideline, the Ministry of finance, and department of housing and urban rural development will further intensify efforts to improve the relevant policies to carry out heating metering and energy conservation work. |
| December 2011 | “Housing Ministry of Urban and Rural Construction on the implementation of the” State Council on the issuance of “the Twelfth Five-Year Guideline” energy-saving emission reduction comprehensive work program notice “implementation plan” | This program requires all levels of housing urban and rural construction departments to fully understand the housing urban and rural areas in the field of energy conservation and emission reduction work of the importance and urgency, establish a high degree of political responsibility and sense of mission, strengthen cooperation with relevant departments, solid work to ensure Complete the task of energy-saving emission reduction. |
| January 2013 | Forward the development and reform of the Ministry of Housing and Urban Construction “Green Building Action Program” notice | In order to thoroughly implement the scientific concept of development, effectively transform the urban and rural construction mode and the development of the construction industry, improve the efficiency of resource utilization, achieve energy conservation and emission reduction targets, and actively respond to global climate change, build a resource-saving and environment-friendly society, Civilized level, improve people’s quality of life. |
Table 2.
The buildings code and regulation for energy efficiency in different countries.
| Time | Country | Action | Specific Content |
|---|---|---|---|
| April 1989 | China | “Standardization law” | It stipulates development and supervision related to standardization laws. It also specifies the penalties on products, which fail to meet compulsory standards for production, sales, and imports. |
| March 2002 | China | “Management Method of National Supervision and Random Inspection of Product Quality” | National supervision and random in section is one method of maintaining product quality by the State. Regular supervision and random inspections are conducted every quarter, and irregular supervision and inspections are conducted according to the status of the product quality. |
| January 1998 | China | “Energy Conservation Law” | It regulates energy conservation management, energy utilization, improvement of energy conservation technologies, and legal liabilities. |
| 2002 | China | “Management Method of Energy Conservation Product Certification” | Product certifications adopt the principal of voluntarism. The method stipulates certification conditions, procedures, usage of energy conservation marks, and treatment after certification. |
| December 2004 | China | “Medium and Long-term Energy Conservation Plan” | It promotes key energy conservation sectors during the “11th Five-Year Plan”: industry, traffic and transportation, commercial and civil applications. The Plan also puts forward the organization and implementation of key energy conservation projects, such as modification of industrial coal-burning boilers, regional combined heat and power generation, utilization of excessive heat and pressure, saving and replacing oil, energy conservation of buildings, a green lighting project, establishment of energy conservation monitoring and a technical service system, etc. |
| 2005 | China | “China Buildings Program Strategy” | Its main goal is to promote building energy efficiency through appliance energy efficiency standards and building codes. It states that it is possible to do so using the following actions. |
| 2005 | China | “Design Standard for Energy Efficiency of Public Buildings” | More attention is paid to this particular Standard, as this is the only standard focusing on the energy efficiency of commercial buildings. |
| 2010 | China | The Chinese energy codes consist of three options for compliance | First, a prescriptive path which contains detailed specifications for individual components, second, an alternative to the prescriptive approach allowing trade-offs between envelope components, and third, a performance path that requires that the energy consumption of the design features of the proposed new building does not exceed energy consumption of a reference building [36]. |
| 2007 | India | Energy Conservation Building Code (ECBC) | This code is designed to control building energy consumption and applies to commercial buildings with a connected load of 100 kW or 120 kVA. |
| 2010 | US | The building energy codes in the U.S. become more stringent | The U.S. building energy program started to focus on compliance and developed a plan to achieve 90% compliance with the model energy code by 2017, which requires active training and enforcement programs as well as annual measurement of the rate of compliance. |
| 2015 | Italy and Europe | The building energy codes in the U.S. become more stringent | Provide an overview on EPBD implementation in Europe and a Geocluster Italian distribution of BERCs in order to show their geographical distribution and their influence on the construction sector practices, focusing in particular on the region of Lombardy, describe the methodology followed for the definition of BERCs in nine municipalities in the same region and present the practical application of one of the nine BERCs to a NZEB residential case study as an example of what the EBPD recast define as NZEB. |
Table 3.
The carbon coefficients of different kinds of energy.
| Energy | Default Value of Carbon Content | Carbon Oxidation Rate | Average Lower Heating Value | Carbon Coefficient |
|---|---|---|---|---|
| tC/TJ | % | kJ/kg or kJ/m3 | kg CO2/kg or kgCO2/m3 | |
| Raw Coal | 26.37 | 98% | 20,908 | 1.981 |
| Washed coal | 25.41 | 98% | 26,344 | 2.405 |
| Other washed coal | 25.41 | 98% | 10,454 | 0.955 |
| Coal products | 33.6 | 98% | 17,793 | 2.148 |
| #: briquette | 33.6 | 90% | 17,584 | 1.950 |
| coal water slurry | 33.6 | 98% | 19,854 | 2.397 |
| Pulverized coal | 33.6 | 98% | 20,933 | 2.527 |
| Coke | 29.5 | 93% | 28,435 | 2.860 |
| Natural Gas | 15.3 | 99% | 389,310 | 2.1622 |
| Liquefied natural gas | 15.3 | 100% | 51,498 | 2.889 |
| Crude Oil | 20.1 | 98% | 41,816 | 3.020 |
| Gasoline | 18.9 | 98% | 43,070 | 2.925 |
| Kerosene | 19.6 | 98% | 43,070 | 3.033 |
| Diesel Oil | 20.2 | 98% | 42,652 | 3.096 |
| Fuel Oil | 21.1 | 98% | 41,816 | 3.170 |
| Liquefied petroleum gas | 17.2 | 98% | 50,179 | 3.101 |
| Refinery Gas | 18.2 | 98% | 46,055 | 3.012 |
| Other petroleum products | 20.0 | 98% | 35,168 | 2.527 |
Table 4.
The carbon coefficients of electricity.
| Year | The Ratio of Thermal Power (%) | The Ratio of Other (Water, Nuclear, Wind) (%) | Consumption Standard of Power (kgce/kW·h) | Carbon Coefficient (tCO2/tce) |
|---|---|---|---|---|
| 2005 | 81.89 | 18.11 | 0.343 | 6.264 |
| 2006 | 82.69 | 17.31 | 0.342 | 6.307 |
| 2007 | 82.98 | 17.02 | 0.332 | 6.144 |
| 2008 | 80.48 | 19.52 | 0.322 | 5.780 |
| 2009 | 80.3 | 19.7 | 0.32 | 5.731 |
| 2010 | 79.2 | 20.8 | 0.312 | 5.511 |
| 2011 | 81.34 | 18.66 | 0.308 | 5.588 |
| 2012 | 78.05 | 21.95 | 0.305 | 5.309 |
| 2013 | 78.19 | 21.81 | 0.302 | 5.262 |
Table 5.
The carbon coefficients of consumption construction materials.
| Building Material | Carbon Coefficient (kgCO2/kg or Kg/m3) |
|---|---|
| Cement | 0.815 |
| Steel | 1.789 |
| Glass | 0.966 |
| Wood | 842.8 |
| Aluminum | 2.6 |
© 2017 by the authors. Licensee MDPI, Basel, Switzerland. This article is an open access article distributed under the terms and conditions of the Creative Commons Attribution (CC BY) license (http://creativecommons.org/licenses/by/4.0/).
Share and Cite
MDPI and ACS Style
Jiang, R.; Li, R. Decomposition and Decoupling Analysis of Life-Cycle Carbon Emission in China’s Building Sector. Sustainability 2017, 9, 793. https://doi.org/10.3390/su9050793
AMA Style
Jiang R, Li R. Decomposition and Decoupling Analysis of Life-Cycle Carbon Emission in China’s Building Sector. Sustainability. 2017; 9(5):793. https://doi.org/10.3390/su9050793
Chicago/Turabian StyleJiang, Rui, and Rongrong Li. 2017. "Decomposition and Decoupling Analysis of Life-Cycle Carbon Emission in China’s Building Sector" Sustainability 9, no. 5: 793. https://doi.org/10.3390/su9050793
Note that from the first issue of 2016, this journal uses article numbers instead of page numbers. See further details here.