
Urban Plan and Water Infrastructures Planning: A Methodology Based on Spatial ANP


1
Department of Civil Engineering, University of Salerno, 84084 Fisciano, Italy
2
Water Management Authority AATO-1, 83100 Campania, Italy
*
Author to whom correspondence should be addressed.
Sustainability 2017, 9(5), 771; https://doi.org/10.3390/su9050771
Submission received: 31 January 2017
/
Revised: 12 April 2017
/
Accepted: 5 May 2017
/
Published: 8 May 2017
(This article belongs to the Special Issue Decipher the Present to Shape the Future- Rethinking the Urban–Rural Nexus)
Abstract
:Cities are exploding, occupying rural territory in dispersed and fragmented ways. A consequence of this phenomenon is that the demand for utilities includes more and more extensive territories. Among them, fulfilling the demand for services related to integrated water service presents many difficulties. The economic costs needed to meet service demand and the environmental costs associated with its non-fulfilment are inversely proportional to the population needing service in rural areas, since that population is distributed across a low-density gradient. Infrastructure planning, within the area of competence, generally follows a policy of economic sustainability, fixing a service coverage threshold in terms of a “sufficient” concentration of population and economic activity (91/271/CEE). This threshold, homogenous within the territorial limits of a water infrastructure plan, creates uncertainty in the planning of investments, which are not sized on the actual, appropriately spatialized, demand for service. Careful prediction of the location of infrastructure investments would guarantee not only economic savings but also reduce the environmental costs generated by the lack of utilities. Therefore, is necessary to create a link between water infrastructure planning and urban planning, which is responsible for the future spatial distribution of service demand. In this study, the relationships between the instruments of regulation and planning are compared by a multi-criteria spatial analysis network (analytic network process (ANP)). This method, tested on a sample of a city in southern Italy, allows us to optimize the design and location of the investment needed to meet the service criteria, looking at the actual efficiency of the networks. The result of this application is a suitability map that allows us to validate the criteria for defining urban transformations.
1. Introduction
Rapid urbanization has become a major concerns on a planetary level, due to its harmful effects on the environment [1], including the consumption of soil to the detriment of natural areas and agricultural soil [2]. This phenomenon has produced a low-density settlement model that produces demand for utility services that has to be fulfilled across increasingly large areas. This demand includes the need for integrated water service. In fact, the demand for water is increasing significantly in all major sectors: agriculture, energy production, industrial uses and human consumption. The latest report of the United Nations [3] estimates that in contrast to this increase in demand, the availability of fresh water in many regions is likely to decrease due to climate change, and that these pressures will exacerbate economic disparities between some nations and between sectors or regions within countries. Only 2.5% of all the water on our planet is fresh water. Of that fresh water, 70% is in the form of ice, 29% is present in the soil, and only 1% (0.007% of the total) is readily accessible for human uses. If we recall that, of this water, on average more than one third is lost even before reaching the final consumer, is not difficult to understand the attention drawn to this issue.
The main source of demand comes from urban communities that need water for daily use. Nevertheless, water is not only the primary source of livelihood for humans, it is also the raw material needed for the production of energy, goods, and services which, in a cyclical logic, result in a pollution load to handle, dispose and treat. The demand for water is also growing at a rate twice that of the population, and therefore the resulting pollution load produced by the use of water grows in the same proportions.
Moreover, considering that population growth will focus, in the coming years, in urban areas and that to this new demand will be added a previous one due to a backlog of people still to be served, there will be considerable difficulties in planning an infrastructure system that is adequate to future forecasts, and expandable as needed. To meet the need, to ensure sustainable expansion, to operate efficiently, and to maintain a high quality of life for residents, cities will have to approach this problem using smart logic. Making cities smart, to support their own growth, is emerging as a key activity for which there will be $108 billion invested in this decade according to Navigant Research. Water infrastructure is among the six key areas that characterize smart cities [4].
The water system should therefore be seen as a complex object made of interconnected parts. The resource has to be considered as a whole, with infrastructure systems needing to be properly planned in order to preserve the water itself and make its use sustainable for the environment. This approach will lead to the simultaneous optimization and reduction of investment costs, which would be otherwise unaffordable due to the high deficiencies that this kind of system usually presents. The management and use of the resource is organized in an integrated infrastructure system that includes the uptake, distribution, disposal and treatment of water. These infrastructures involve a large amount of capital for construction and management, and are designed for long periods of service.
So emerges the need to rationalize the system, starting with the sewer subsector, which if not properly sized and managed, can itself become a contributory cause of pollution for the resource that we are trying to protect.
1.1. Water Service in Italy
Italian water services are suffering a significant infrastructural deficit, in terms of both quality and quantity of supply, and of sewerage systems and water treatments. Even in the fields of management, measurement systems and controlling computer systems require urgent investment to adjust coverage and service levels. Additionally, there is the commitment to the reconstruction of the infrastructure at the end of its useful life, the extraordinary maintenance and technological upgrading needed for the recovery of operational efficiency, and for saving water and energy in systems and networks to combine safety, quality, and continuity of service, environmental protection, and sustainable use of the resource.
Rating agencies in this sector have estimated that water companies (WaCo) in “no growth” scenarios need investments of around €1.6 billion/year as a component of net capital that is estimated will grow to a minimum average of €20 billion/year in the next 30 years [5]. In addition, the new system for regulating water services fares made by the National Authority for the Regulation of Electrical Energy, Gas and Water System (AEEGESI), introduces a model of full cost recovery for the WaCo, making even clearer the need to avoid unnecessary or poorly sized investments [6]. In fact, under this new regulatory environment, all the investments will be refunded to the WaCo in any case and paid by users over time, in both economic and environmental terms. In such a context, the planning needs and implementation of investments are of fundamental importance, considered as the engines to achieve the main goals of quality, affordability, efficiency of service, and the protection of public health and of the environment. Such planning should be the result of the convergence of interests of a network of actors connected by functional relationships, hierarchical and non-hierarchical. The same actors are also affected by cash flows which reinforce the weight of the decision of one actor over another (Figure 1).
The figure above shows that the National Agencies are “on top” of the hierarchy. They are in charge of setting, by law, the minimum requisites and standards for environmental safeguards, coverage of the services, efficiency, and “fair” regulation of the sector. At the lower level, there is the composed actor, regional government, which consists of two different units. The first is in charge of environmental protection; the second holds property and runs strategical and regional assets (i.e., aqueducts, industrial wastewater treatment plans). At the subregional level, the Local Authority for Regulation of the Integrated Water System (AATO) has the property of local infrastructure, plans the expansion and the extraordinary maintenance of the network, and overlooks the WaCo with local regulations.
Locally there are city governments, which must ensure, through the regulation of land use, an appropriate level of services for citizens—who, like the WaCo, are actors that do not participate in governance of the system. Water infrastructure planning is a complex decisional problem that has no solution in the current planning system.
1.2. Spatial and Urban Planning System
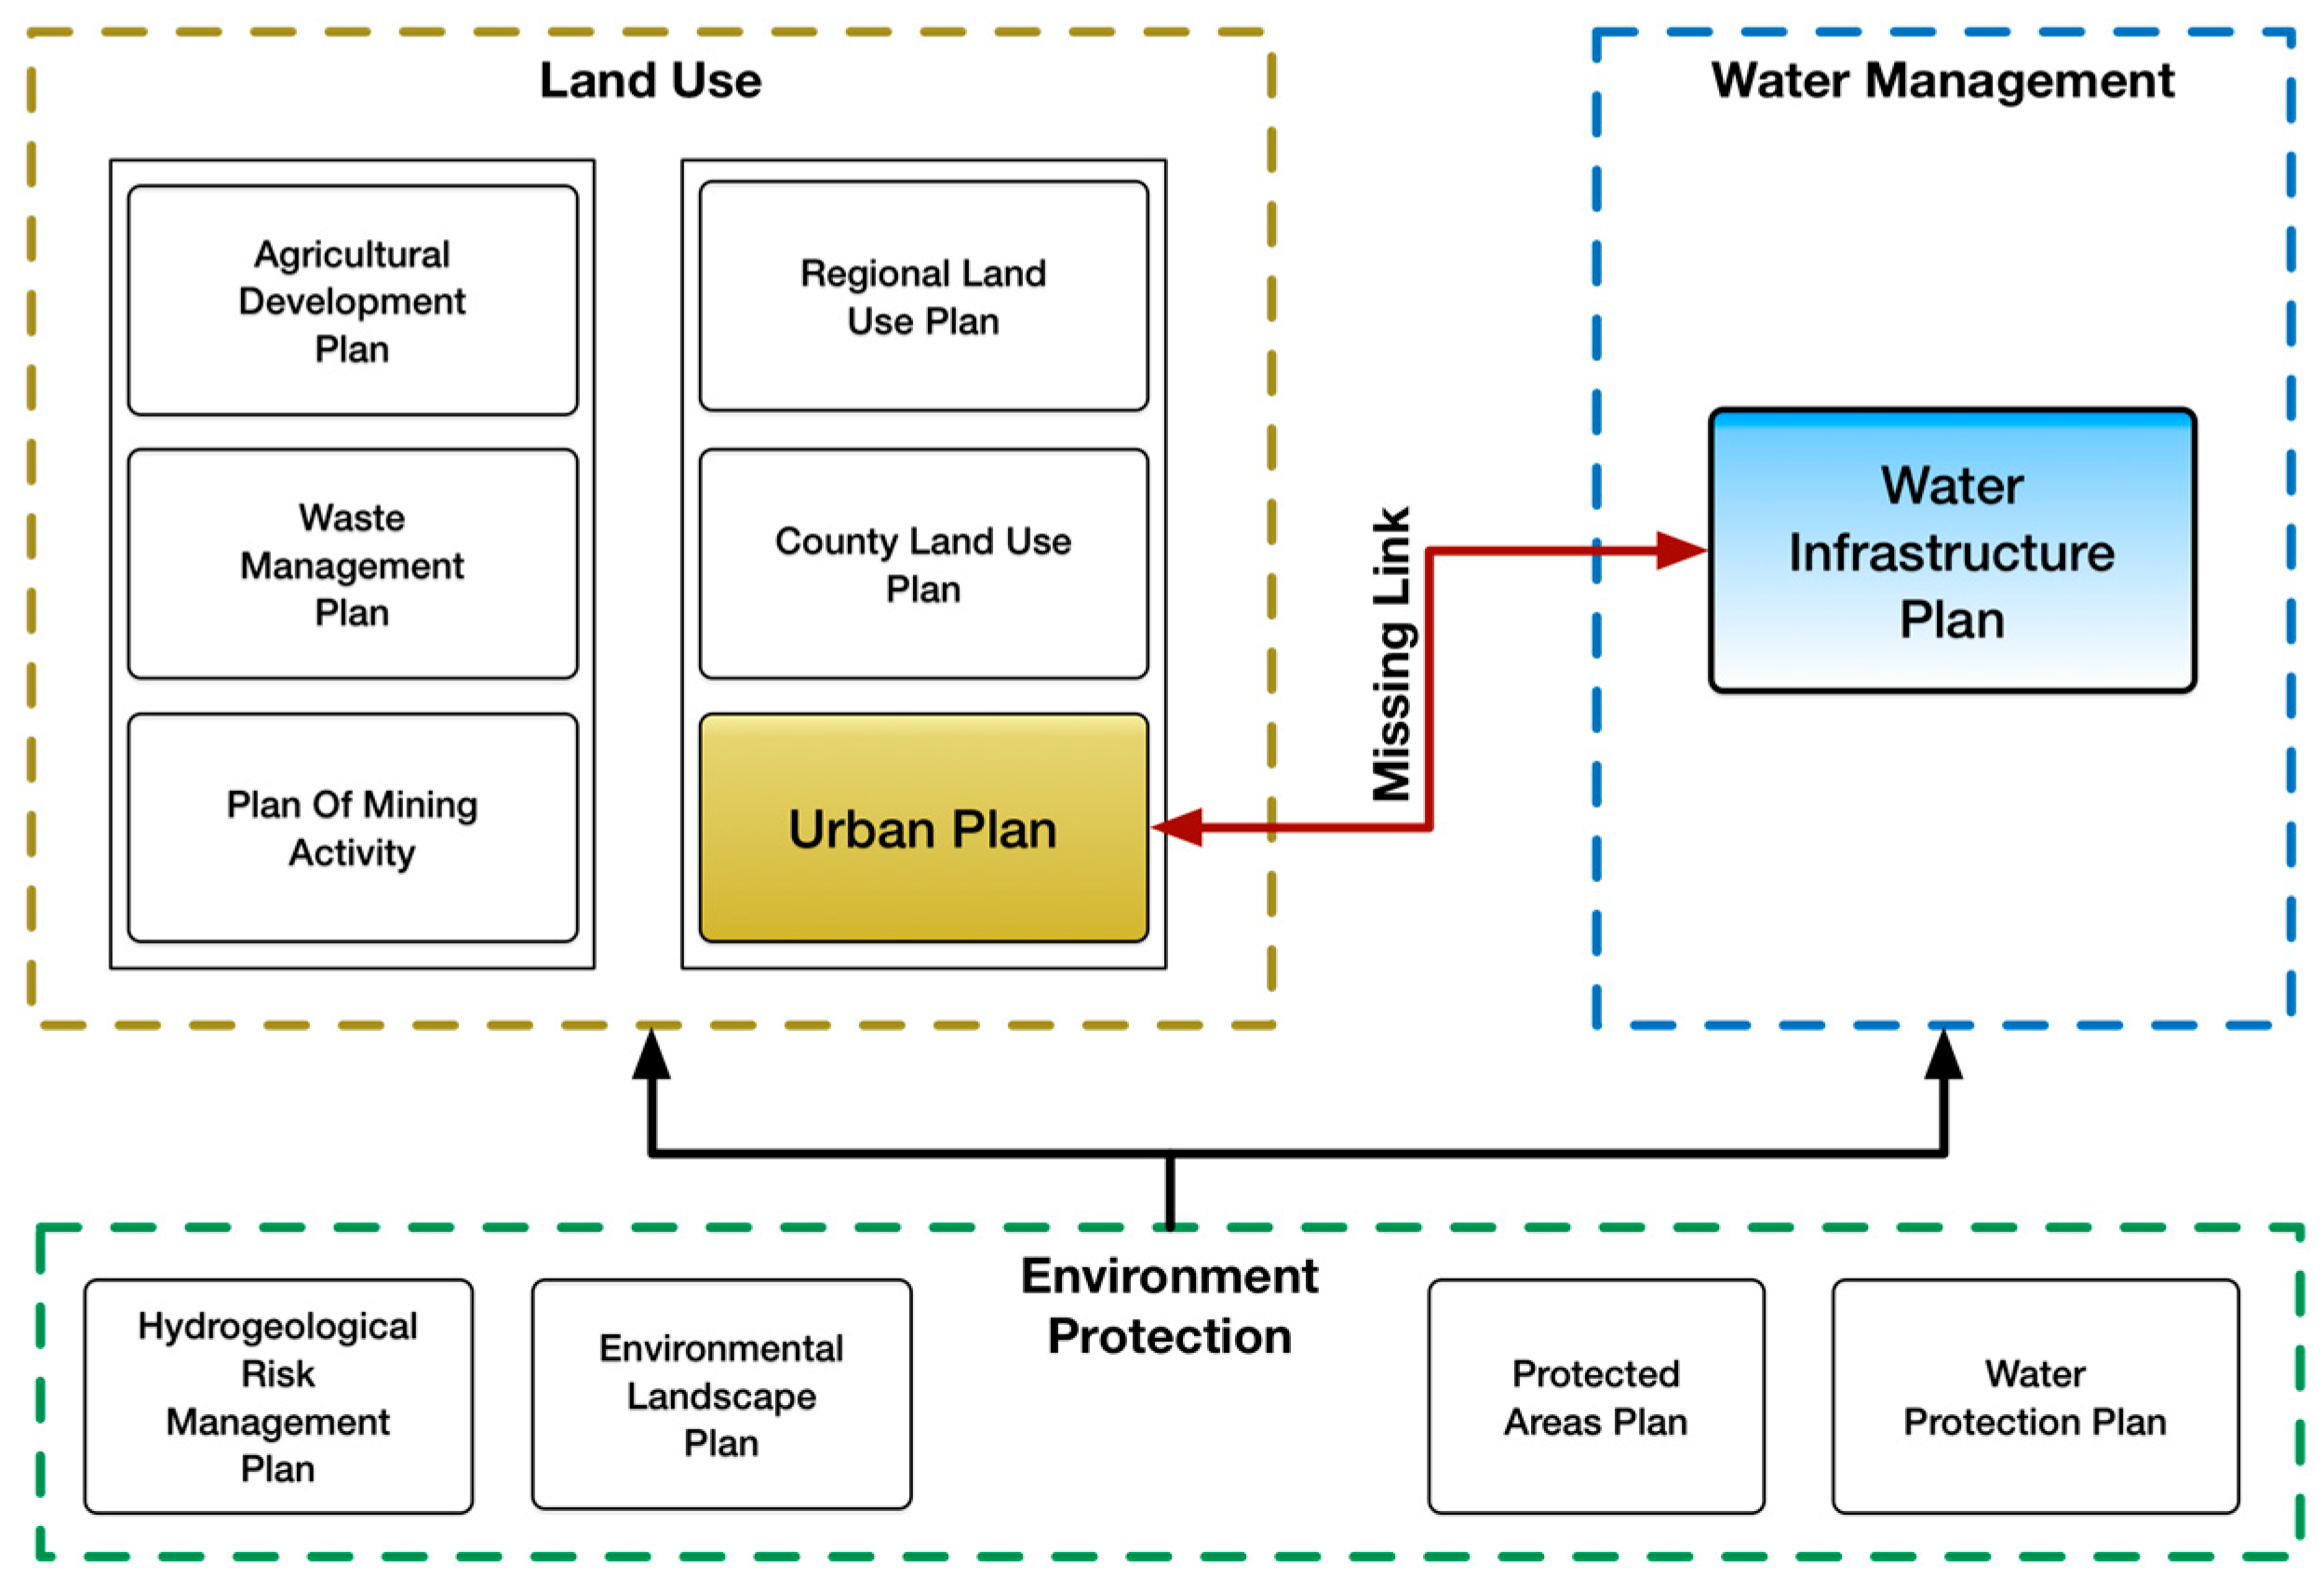
The need to protect water resources, imposed by the European Water Directive (2000/60/CE) consistent with the objective of promoting sustainable development, brings out the need for smart planning of urban infrastructure that has important spatial implications at the regional scale. In fact, the protection and use of water resources are not independent from land use; rather these are reciprocal, consequential, and necessary. The Italian planning system provides a set of plans for land use that are all affected by a second set of plans for environmental protection. The latter, in turn, affect water infrastructure plans. However, analysis of the Italian planning system shows that the spatial and urban planning instruments that deal with land use, population, and the protection of the resource, are not interrelated with the Water Infrastructure Plan (WIP), the instrument that leads the Integrated Water System (IWS) and then the use of the water resource (Figure 2).
This means that the integrated water management system does not take into account how land use is handled, even considering the demographic increase of the area as an input parameter for the WIP. The Water Infrastructure Plan, developed at a subregional scale by the Local Authority AATO, currently sizes the investments for the expansion of the network by looking only at residential service, with the use of a single parameter K, combined with the coverage of the service at city scale. This parameter K represents the supplied services, and is assumed to be constant at the municipal level, and is equal to the ratio between the length of the sewer system and the number of users currently served, as declared by the WaCo. From a different perspective, the city plan instead provides an increase of the load settlement, and so of water services needed, in terms of new inhabitants distributed in residential areas as well as of expansion areas for non-residential functions. Moreover, the forecasts of the WIP are made for a long term period of 20–30 years, while forecasts of the city plan are made for the medium term of 10 years.
This dichotomy in the planning of land use and water use—which are, of course, interconnected in daily life—creates inefficiencies and mismatches between needs and solutions, with the failure of the integrated water system.
Currently, several critical issues are affecting the planning system described:
- Lack of sufficient data to characterize the whole system of the service networks. These data consist of many elements, made at different times and with different states of use and efficiency.
- Estimation of the service demand, currently performed independently by the WIP without considering the estimation made by city plans in charge of the settlement development.
- Lack of a spatial allocation of the service demand.
- The absence of a spatial location for the investments eventually needed.
- Lack of feedback towards city plans.
Hence emerges the need for integration between responsible planning of the investments of the water infrastructure system and urban planning at the local scale.
1.3. Objectives and Proposal
In this sector of studies, we need a reorganization of the planning system to introduce an input–feedback mechanism between the Water Infrastructure Plan and city plans, from the perspective of smart integrated planning (Figure 2). Only synergy between these two levels of planning will allow the IWS to reach the coveted objectives of effectiveness, efficiency, economy, and environmental sustainability. To make explicit this functional link between planning tools, this study proposes a methodology that involves the creation of a suitability map of investments in the system. This map, built according to the current city plan’s forecast, allows both to plan the extension of the service in the territory and to review the same base forecasts for the WIP. These forecasts, in fact, are seldom built with consideration of this functional relationship. Specifically, given the nature of the spatial planning of urban infrastructure, this paper uses a multi-criteria spatial decision support system (MC-SDSS) that integrates the methodologies of three research areas: geographic information systems (GIS), database management systems (DBMS), and multi-criteria decision analysis (MCDA) [7,8]. Much progress has been made over the last 20 years in developing methods of multi-criteria land suitability evaluation, especially in integrating GIS with S-MCE [9,10,11,12,13,14,15,16]. Multi-criteria land suitability evaluation (LSE) is one of the best known application domains of spatial multi-criteria evaluation [12,17,18,19,20,21]. In particular, because of the relationships between the instruments of regulation and planning, these are compared by a multi-criteria spatial analysis of network type, analytic network process (ANP) [22,23]. The methodology was tested with reference to the sewerage component of the integrated water system, because the availability of data connected to the water components is strongly influenced by operating parameters that are not always available, such as operating pressure.
2. Materials and Methods
2.1. Case Study
Our methodology was applied to the sewage system of Capriglia Irpina (AV), a town included in the water management area of AATO Calore Irpino (Figure 3). The aim of the Water Infrastructures Plan is to increase the coverage of service from the current ratio 82.49% up to values above 90%, providing investment for the expansion of the network. In this case is needed an additional length of 2.8 km, estimated at a cost of €1,208,500.00 [24].
2.2. Spatial Decision Support System
Decision-support systems are used to assist governments and communities, helping planners organize, analyze, edit, and reevaluate information under the control activities of urbanization. Regarding the DSS the expression “multi-criteria analysis” embraces a set of tools for decision support that are able to compare different alternatives on the basis of multiple criteria, often in conflict with each other, in order to identify the preferred action, improve the awareness of decision makers, and provide rational support to problems of a complex nature [25,26,27]. But if we consider that 80% of the data on which decision making is based has a spatial nature, in some cases multi-criteria analysis alone is not enough to deal with complex issues such as the one presented here. To overcome this difficulty, we need to use GIS [28,29,30,31,32,33]. A GIS is system hardware/software that allows you to collect, process, manipulate, analyze, model, and represent geo-referenced data with the aim of solving problems of management and planning. In this case, it allows processing of reference data, of information on the state of the environment, natural resources, land, and infrastructure, and of the positive and negative interactions between contexts and the main areas of development. The analytic functionalities found in most GISs are oriented toward the management of data but not towards an effective analysis of them [34,35]. GIS in the role of spatial decision support systems (SDSS) helps to take in consideration also the solution proposed by the decision maker. In fact, current GIS also accepts qualitative criteria for evaluation, but those are available only for some methods (like AHP and ELECTRE), not for the ANP method. Therefore, from the integration of GIS systems, MCDA, and DBMS—which are concerned instead with the management of data—are born a multi-criteria spatial decision support system (MC-SDSS).
2.3. ANP—Analytic Network Process
Given the interdisciplinary nature of this type of study, the various topics, variables, and criteria, as well as the need to spatially analyze service demands and in particular, interactions between service and territory, we have chosen, between multi-criteria spatial decision support system (MC-SDSS), to use the analytic network process [36].
The multi-criteria nature of the problem has to be managed with specific techniques. In particular, the most consolidated method is the AHP, which has shown a certain reliability compared to many other methods (TOPSIS, ELECTRE, MACBETH) [37]. However, AHP requires a hierarchical structure for the decision problem and does not provide for the possibility to consider connections between criteria. Conversely, the ANP exceeds this limit because it allows the relations of interdependence between the various elements of the system to be made explicit [36,38].
The ANP incorporates both qualitative and quantitative aspects of human thought: the first in the expression of value judgments and preferences, the second in the structuring of the problem. Precisely because of the nature of the links between the criteria and the environments analyzed, the ANP is the methodology that allows the best benchmarking and that provides more than acceptable results compared to other techniques such as MCDA. The ANP is a generalization of the Analytic Hierarchy Process (AHP), which is certainly more widespread; but many decision problems, as in this case, cannot be structured hierarchically because they involve interaction and dependence of the elements of the upper level in a hierarchy with elements of lower level [39]. While the AHP is a framework with unidirectional hierarchical relationships, ANP allows complex interrelationships between decision-making levels and attributes, which correspond to clusters and nodes of the decisional network.
The ANP includes four phases [40]:
- -
- Step 1, Modelling and structuring of the problem: the problem should be stated clearly and decomposed into a rational system of network type.
- -
- Step 2, Comparison between pairs and vector of priorities: In ANP, as AHP, pairs of decision-elements for each cluster are compared to their control policies with respect to their importance [41]. Moreover, interdependencies between the criteria of a cluster must also be examined in these couples; the influence of each element on other elements can be represented by an eigenvector. The relative importance values are determined by the scale of Saaty [42].
- -
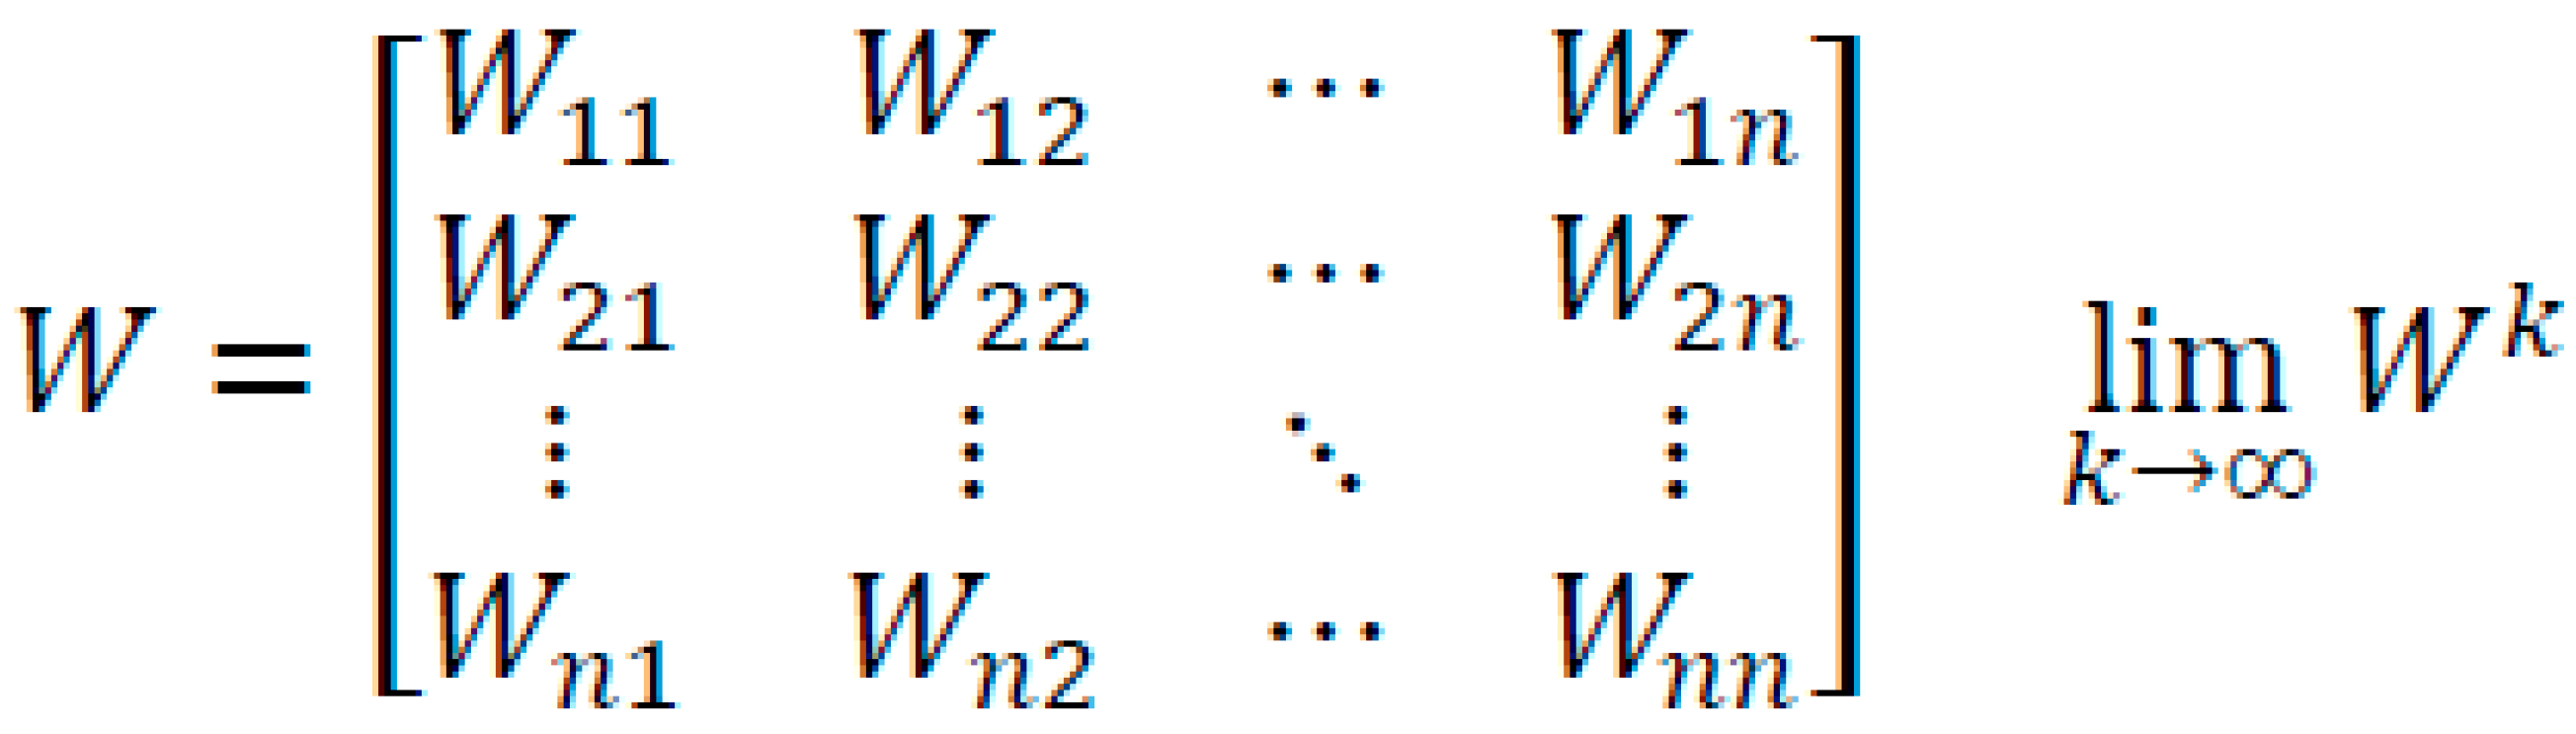
- Step 3, Making Supermatrix: The supermatrix concept is similar to the process of a Markov chain [22]. To achieve global priorities in a system with interdependent influences, vectors of local priorities are incorporated in the corresponding columns of a matrix. This supermatrix is actually a partitioned matrix in which each segment represents a relationship between two clusters in a system.
- -
- Step 4, Summary of criteria and priorities alternatives and selecting the best alternative: The weights of the priority criteria and alternatives can be found in the supermatrix normalized (Figure 4).
2.4. Methodology
The methodology to achieve the posed objective includes the construction of a framework MC-SDSS with ANP that allows the construction of a suitability map (GOAL) that represents the suitability of the territory to the settlements of new users, on existing networks, and the suitability to the expansion of the sewage system itself. The process of study is developed according to four steps [44], detailed below, where is highlighted the analysis of the system with evaluation maps that describe the processes and variables (Figure 5).
The evaluation maps are the result of spatial processing of data relating to the territory served and relevant infrastructure from the study. The design phase creates a relational model between the elements and variables that describe the system, divided into decisional clusters, also a function of the subsequent ANP analysis. In the phase of choice, the various decision makers express their assessments and subsequently compare their opinions to carry out comparative assessments between clusters. In the decision phase, the resulting set of weights is used to appropriately aggregate the evaluation maps that describe the system, creating a base suitability map and variants used for sensitivity analysis (SA). This suitability map allows the review of choices made in the city plan and directs the review of land policies as well as the revision of the assumptions at the base of the Water Infrastructure Plan, for a more effective local response towards the actual services demanded.
2.4.1. Intelligence
The intelligence phase consists of examining the environment to identify problems or opportunity situations. In order to identify clusters and criteria that influence the searched suitability map, we have investigated the system of actors (Figure 1) through the aggregation of the same and depending on the way they want to achieve the main objectives of quality, affordability, efficiency of service, and the protection of public health and of the environment. Specifically, have been identified four groups of decision makers (DM) representative of the priorities that each individual DM assigns according to their interests as their main objective. The first group are the actors pursuing service efficiency and cost reduction. Second are the set of actors that, through the territorial government policies, want to ensure access to the service. The third group pursues the maximization of access to the service at minimal cost. The fourth is the set of individuals who pursue the water resource and environmental protection.
Having identified the groups, they were associated with the corresponding decision-making cluster, for which the DM are able to provide basic information and make judgments on subsequent assessments. The first cluster, “Infrastructures”, contains information provided from AATO and Waco. The second cluster “Land Use”, contains information on land use provided by the city government. The third cluster “Position”, contains information relating to the accessibility of the service assigned to the representatives of users (customers associations), and the last cluster “Environment”, contains information about the constraints imposed by environmental protection agencies, in particular, hydrogeological risk. In order to take into account the mapping of geological risk, since the choice of the appropriate most zoning method to adopt at a given scale for a given purpose also depends on other factors (such as the characteristics of the phenomena) [45], we have used the proposed map of the existing Hydrogeological Risk Management Plan that identifies areas with different degrees of risk which are prescriptive for all planning levels (Figure 2). Specific evaluation maps that represent these criteria obtained by spatial analysis are summarized in Table 1.
2.4.2. Design
The design phase consists in structuring the decision problem using a spatial ANP approach that, with thematic layers, allows us to analyze and support decisions in which coexist multiple objectives, some competing, with multiple alternative solutions. Specifically, the decisional network (Figure 6), according to the principle of decomposition of the problem, identifies four homogeneous clusters, representatives of the selected thematic areas: infrastructure components, land use components, positional components and environmental components. Each cluster is divided into specific elements (nodes), constituted by the results of spatial analysis developed in GIS environment (evaluation maps) as detailed in Appendix A—Table A1.
In the ANP network, each node represents the solution to the problem posed (goal), according to a specific point of view Table 2.
In the design phase a thematic area is introduced that takes account of the exclusion criteria applied to specified parts of the territory not considered in the suitability map (Table 3).
2.4.3. Choice
The choice phase, in spatial ANP, consists of evaluating the network with its clusters and nodes and calculating the weight vector used to combine the standardized evaluation maps. These are firstly reclassified linearly, on a scale of values variable in the range (0:1) aligned with the increasing or decreasing impact, that these maps have on the general suitability map (Table 4). The maximum value corresponds to the judgment that maximizes the achievement of the goal.
Standardized the maps in GIS environment, the calculation of the weights is made using the software Superdecision 2.8.0 [46]. The “decisional network”, seen previously, is reconstructed in the software, which allows paired comparisons between clusters and between nodes, and identifies both the preferences between nodes and between clusters according to the goal posed (Figure 7).
In particular, the comparisons between nodes, with respect to specific clusters, are assigned to the respective DM, this also in the case of comparisons between the same cluster nodes. Instead the comparisons to determine the weights of each cluster, compared to GOAL, have been assigned to the entire DM’s group, that mediating their interests, have provided the feedback requested for the evaluation. Made all comparisons, the software builds as first a super matrix (Table A2), which later is weighed (Table A3) with the preferences expressed between clusters, contained instead in a second matrix, Table 5.
The super weighted matrix is then multiplied by itself an infinite number of times until it converges in a matrix whose columns, all the same (Table A4), represent the vector of the priority between nodes (Table 6).
Once the weights from the elaboration of the ANP Model are calculated , it is possible to weigh and aggregate the maps, standardized earlier, for each cluster of the network using map algebra operations in a GIS environment.
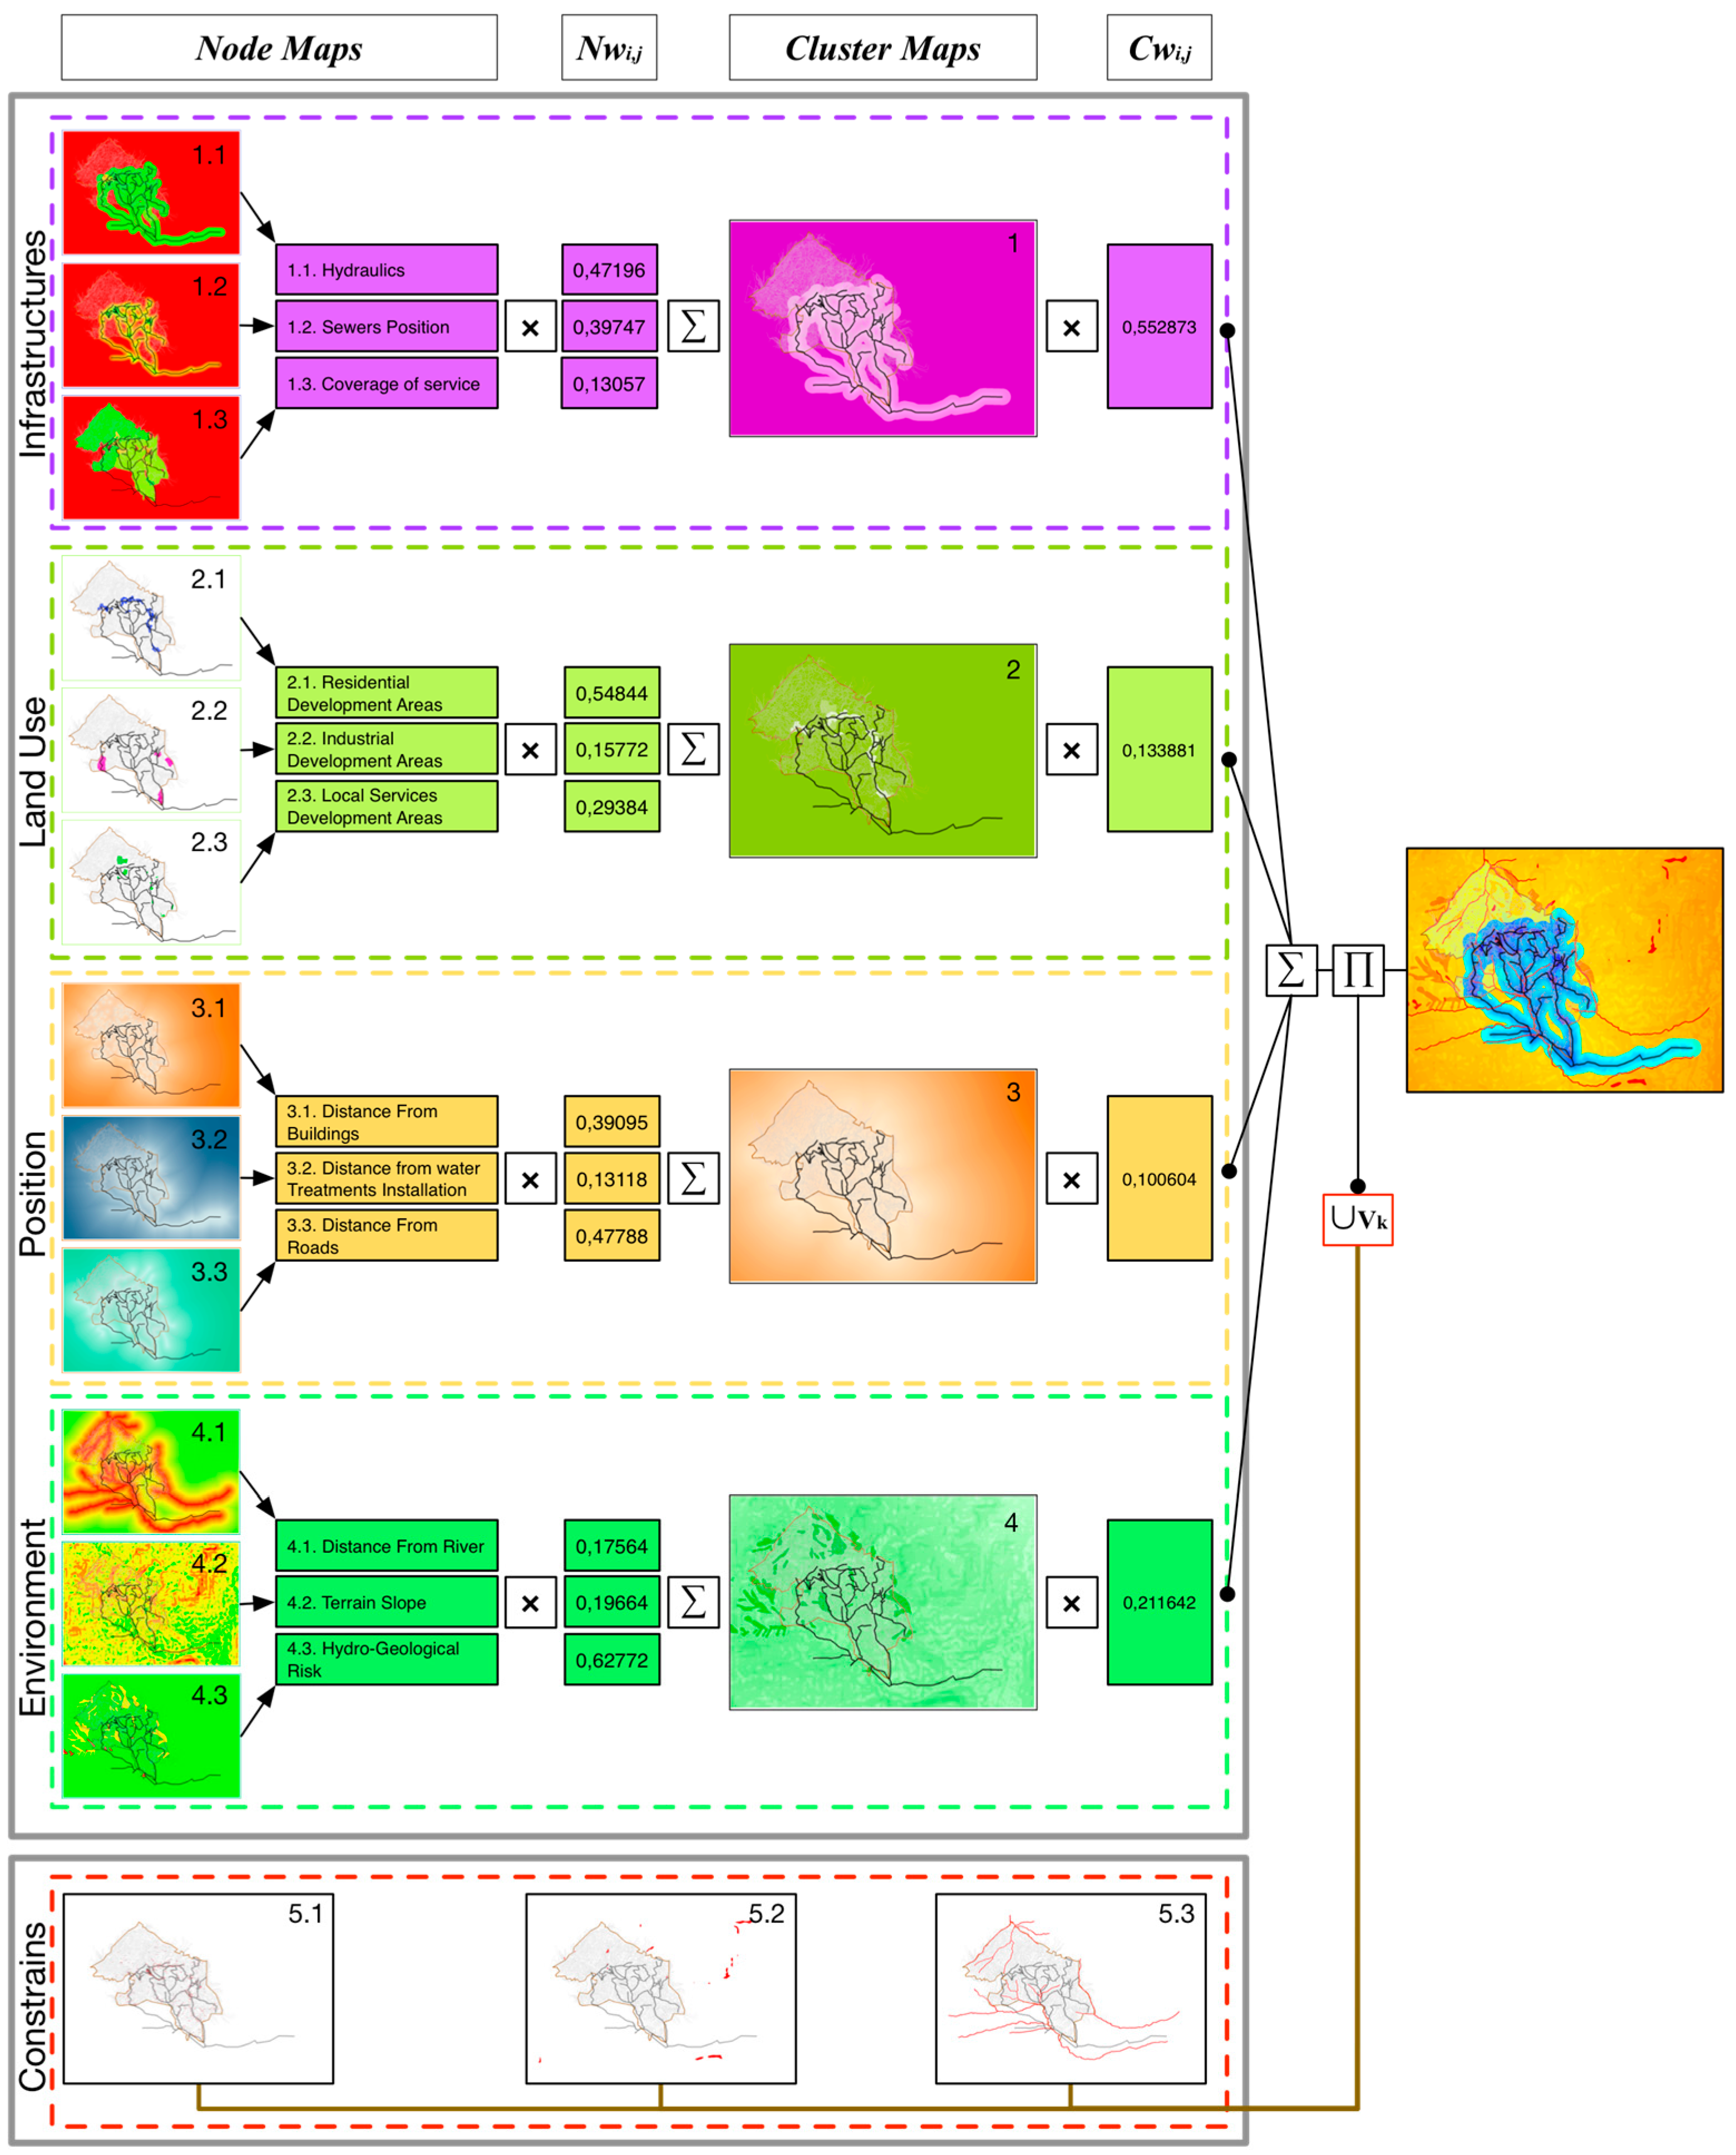
From the composition of the maps representing nodes and clusters, summed and weighed with the results of the ANP and with the map–algebra overlay of the areas under constraint, we obtain the suitability map searched (Equation (1)), indicating the most suitable areas to host new users or extensions of the network (Figure 8).
where
- Smap: Suitability Map
- Mi,j: Evaluation Map—Cluster i—Node j
- Nwi,j: Node weight—Cluster i—Node j
- Cwi: Cluster weight—Cluster i
- Vk: Constrains Map—Constrain k
2.4.4. Decision
Generally, the construction of suitability maps depends on the importance attributed to each element of the decisional network. In fact, one of the most critical points of multi-criteria analysis is the time of the subjective evaluation, which, even if balanced by complex comparison procedures between the opinions expressed, affects the evaluation’s result. Therefore, is necessary to perform a sensitivity analysis, which in our case is based on the creation of different scenarios that simulate different points of view by varying the weights of the clusters used in the process (Table 7) in order to check the stability of the results obtained in terms of maps of suitability [21,47,48,49].
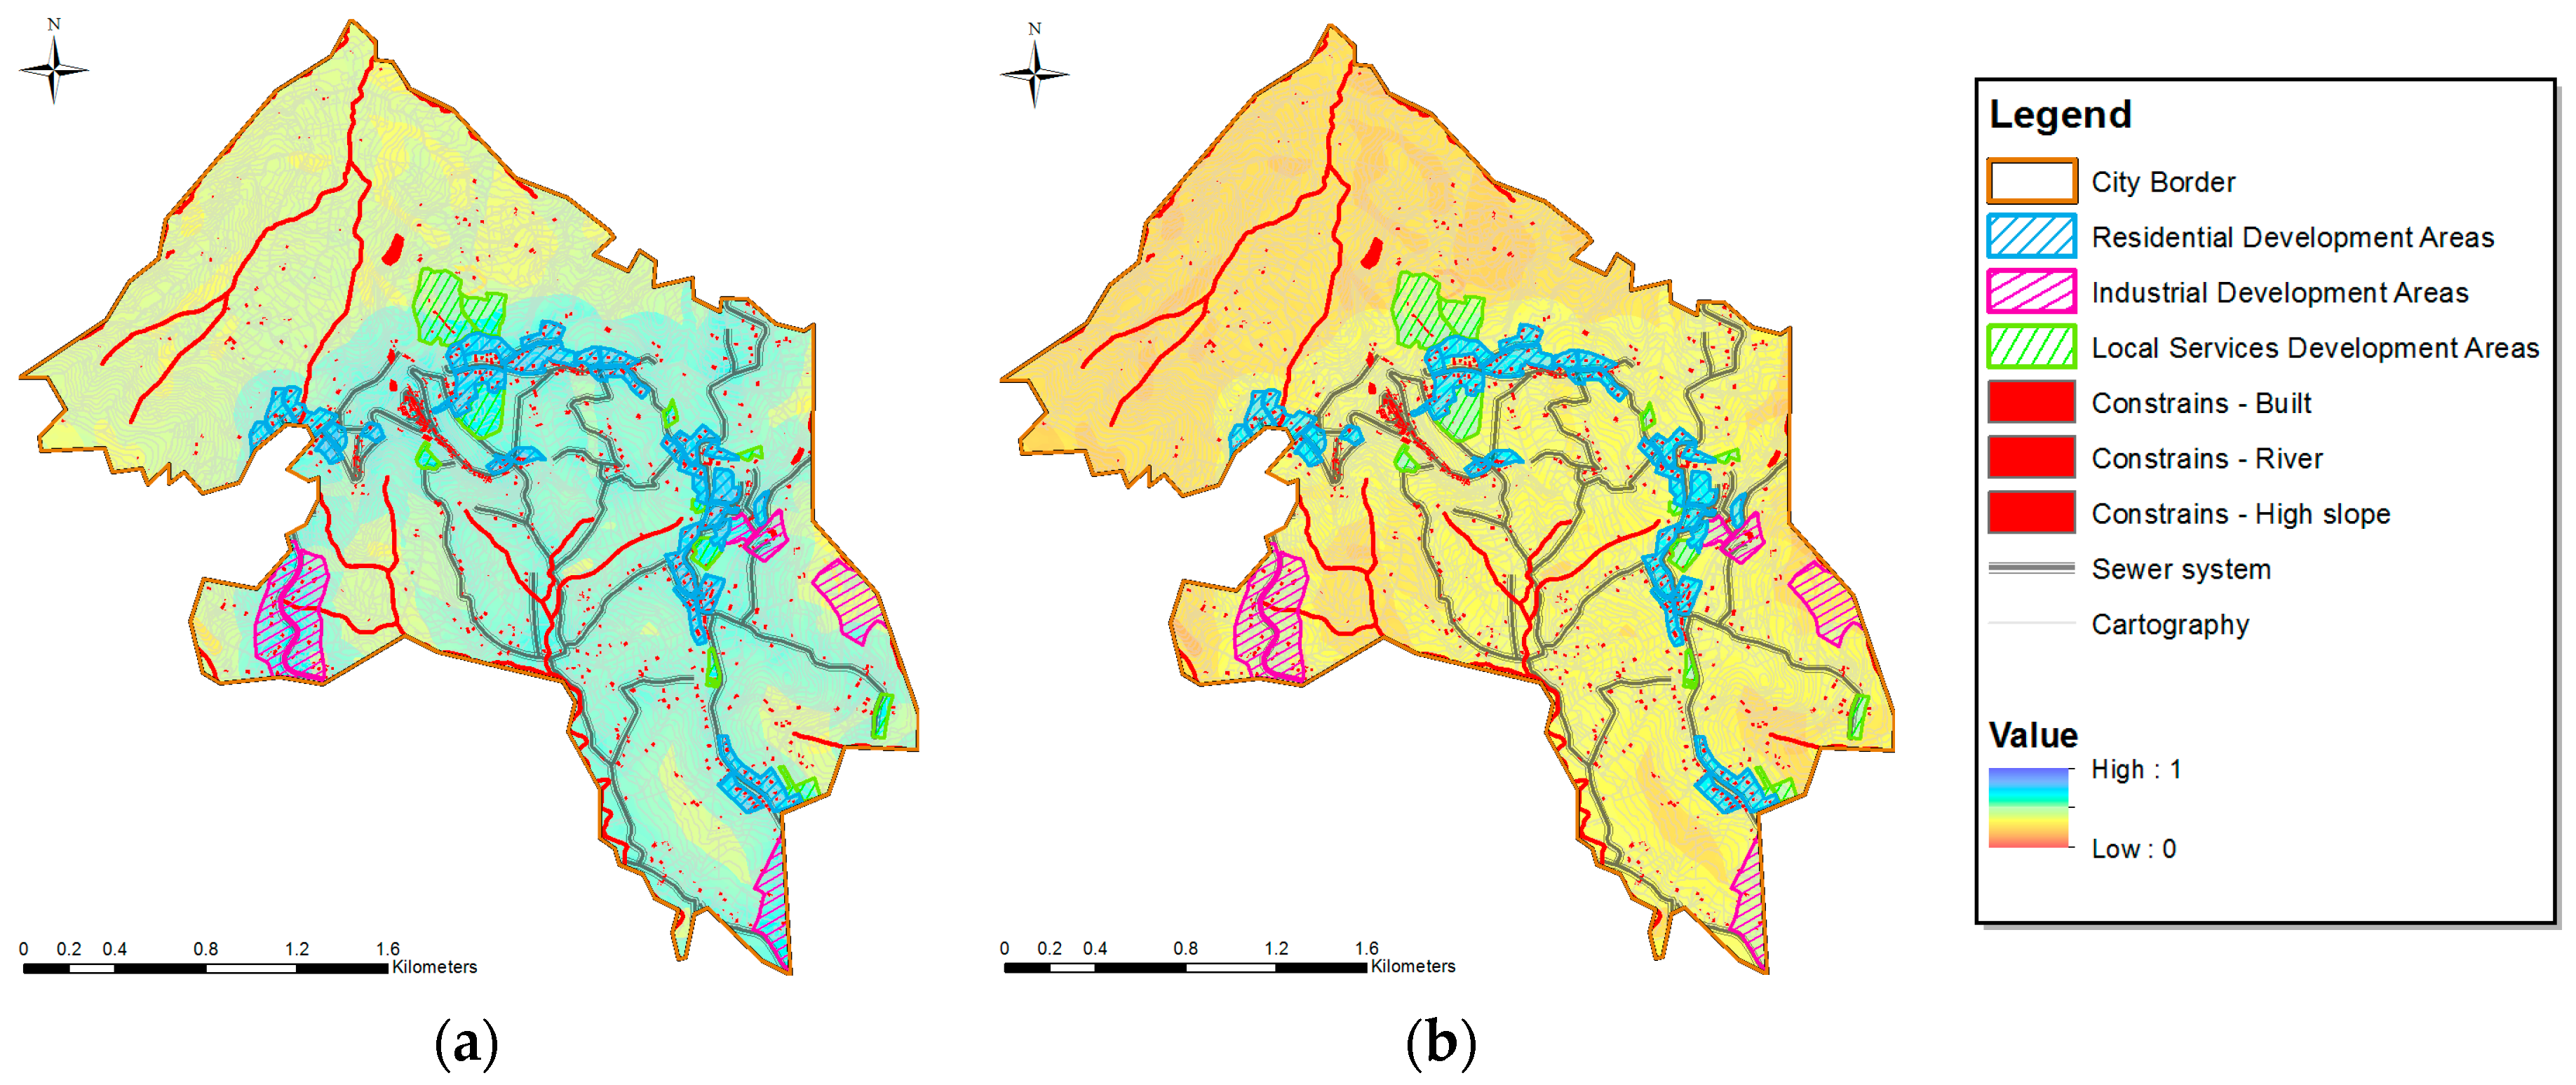
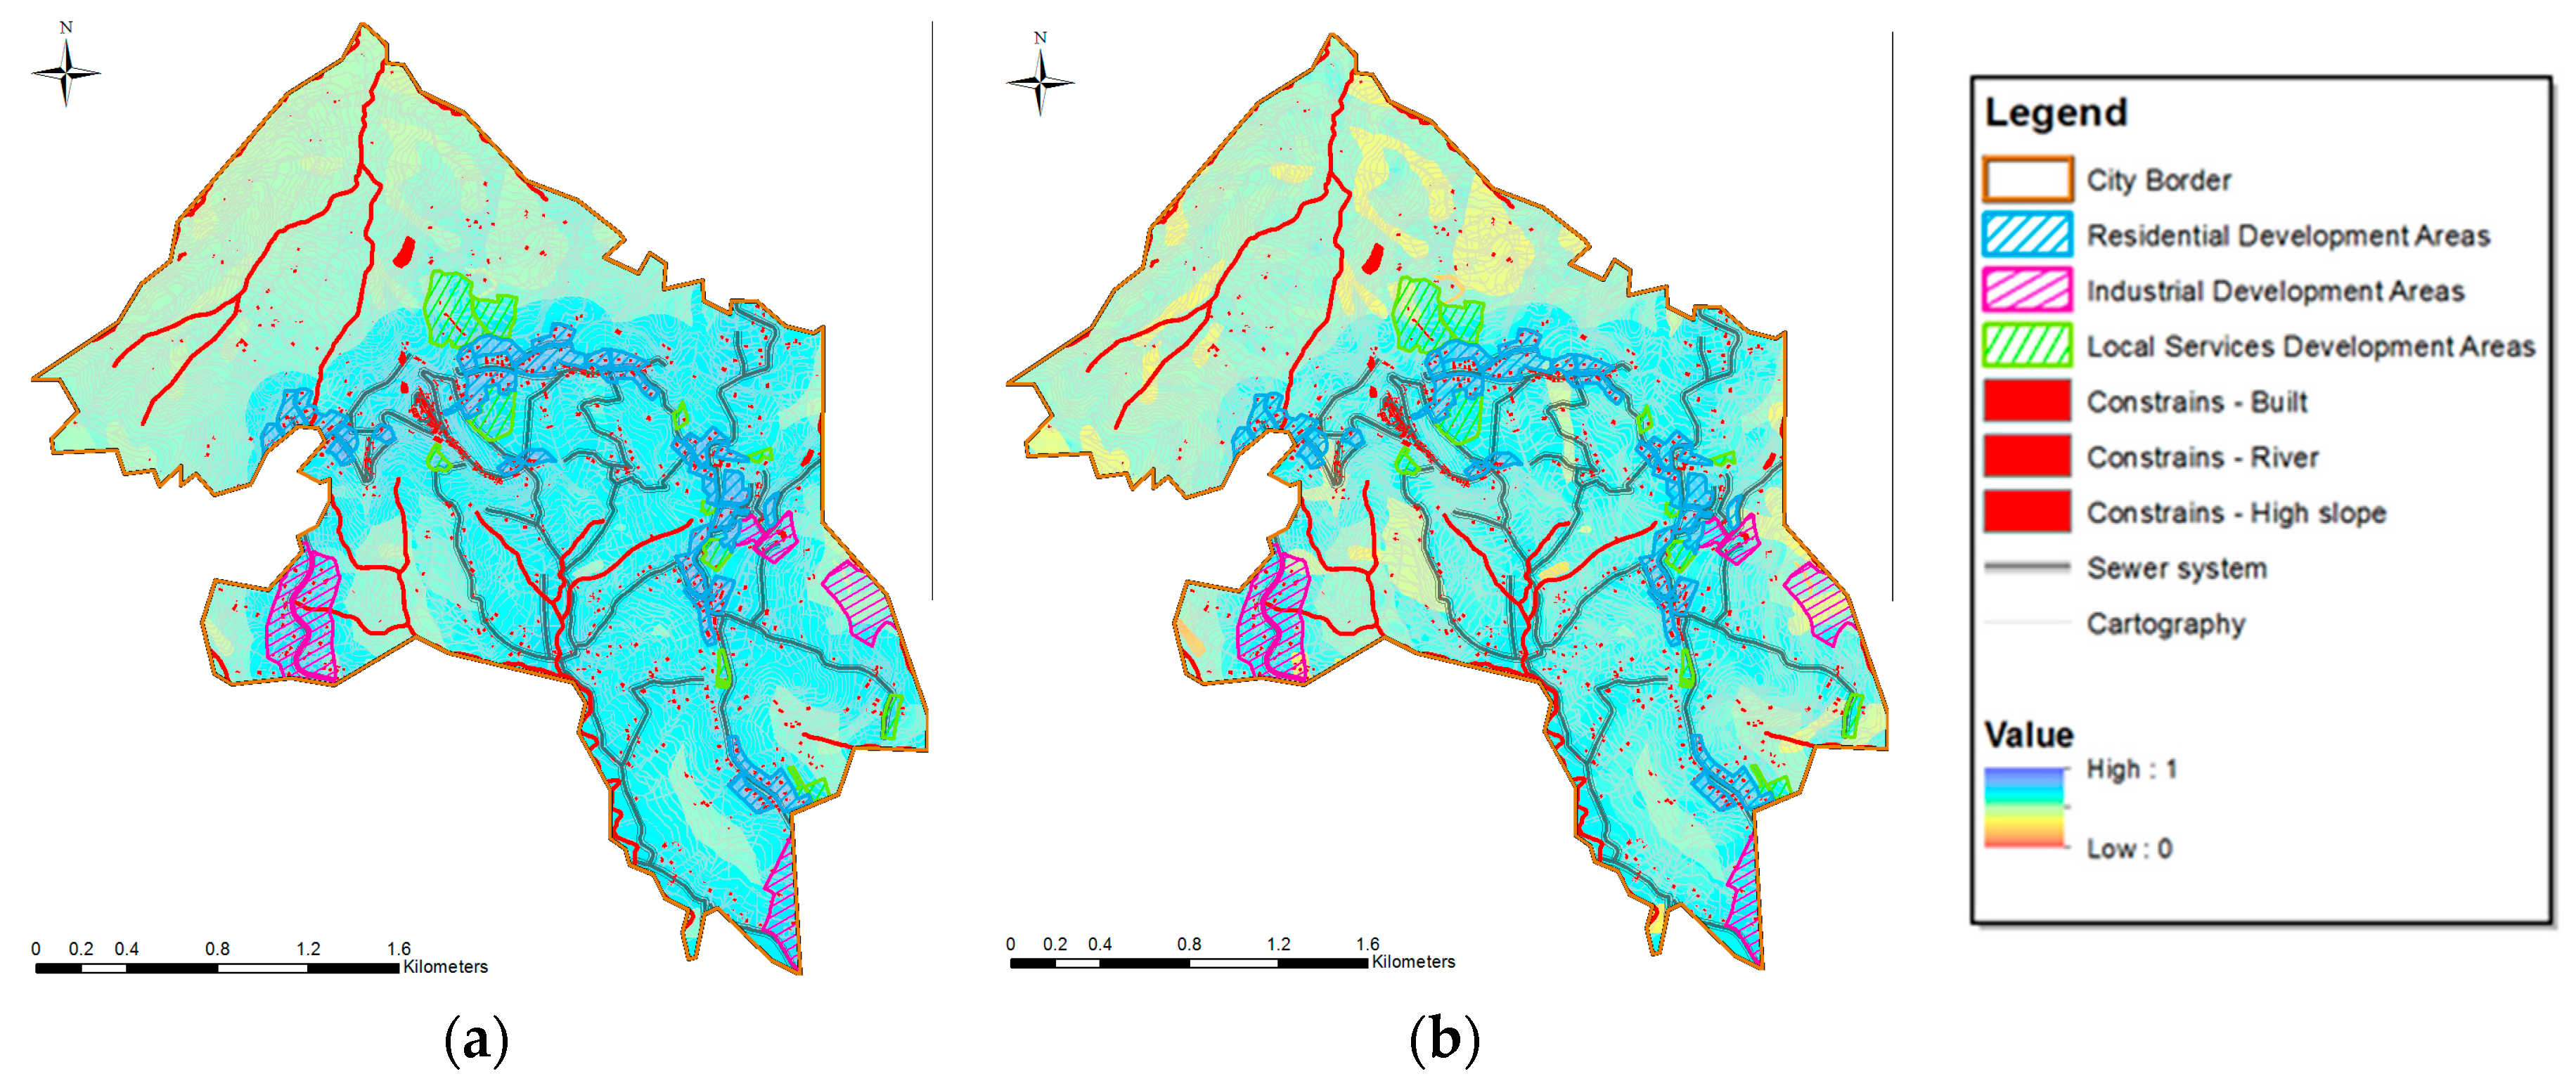
In particular, four additional scenarios are defined and refer to different set of weights. The first we call “balanced” because is based on equal weights of the clusters. The others are obtained by varying, on rotation to greater weight, one cluster with respect to the others. (Figure 9 and Figure 10).
The weight used in the rotation was set to 0.55 (equal to that of the cluster infrastructure, the privileged result in the base scenario) for each of the criteria, in order to identify scenarios where one criterion prevails with respect to the others. This allows us to define the robustness of areas with greater suitability using the overlay map. In fact, the maps obtained show a different distribution of the degree of suitability with respect to the investigated region. The first map, the balanced scenario, shows that the levels of suitability vary, descending from urban areas to the southeast rural area. In the second map, the land use scenario, the suitability of existing urban areas and residential development areas clearly prevails compared to the totality of the territory. The third scenario shows a high degree of suitability close to the built and the existing infrastructure, both for urban and rural areas. The last scenario presents suitability that increases moving away from constrained areas of environmental interest, showing a strong similarity with the third scenario.
3. Results and Discussion
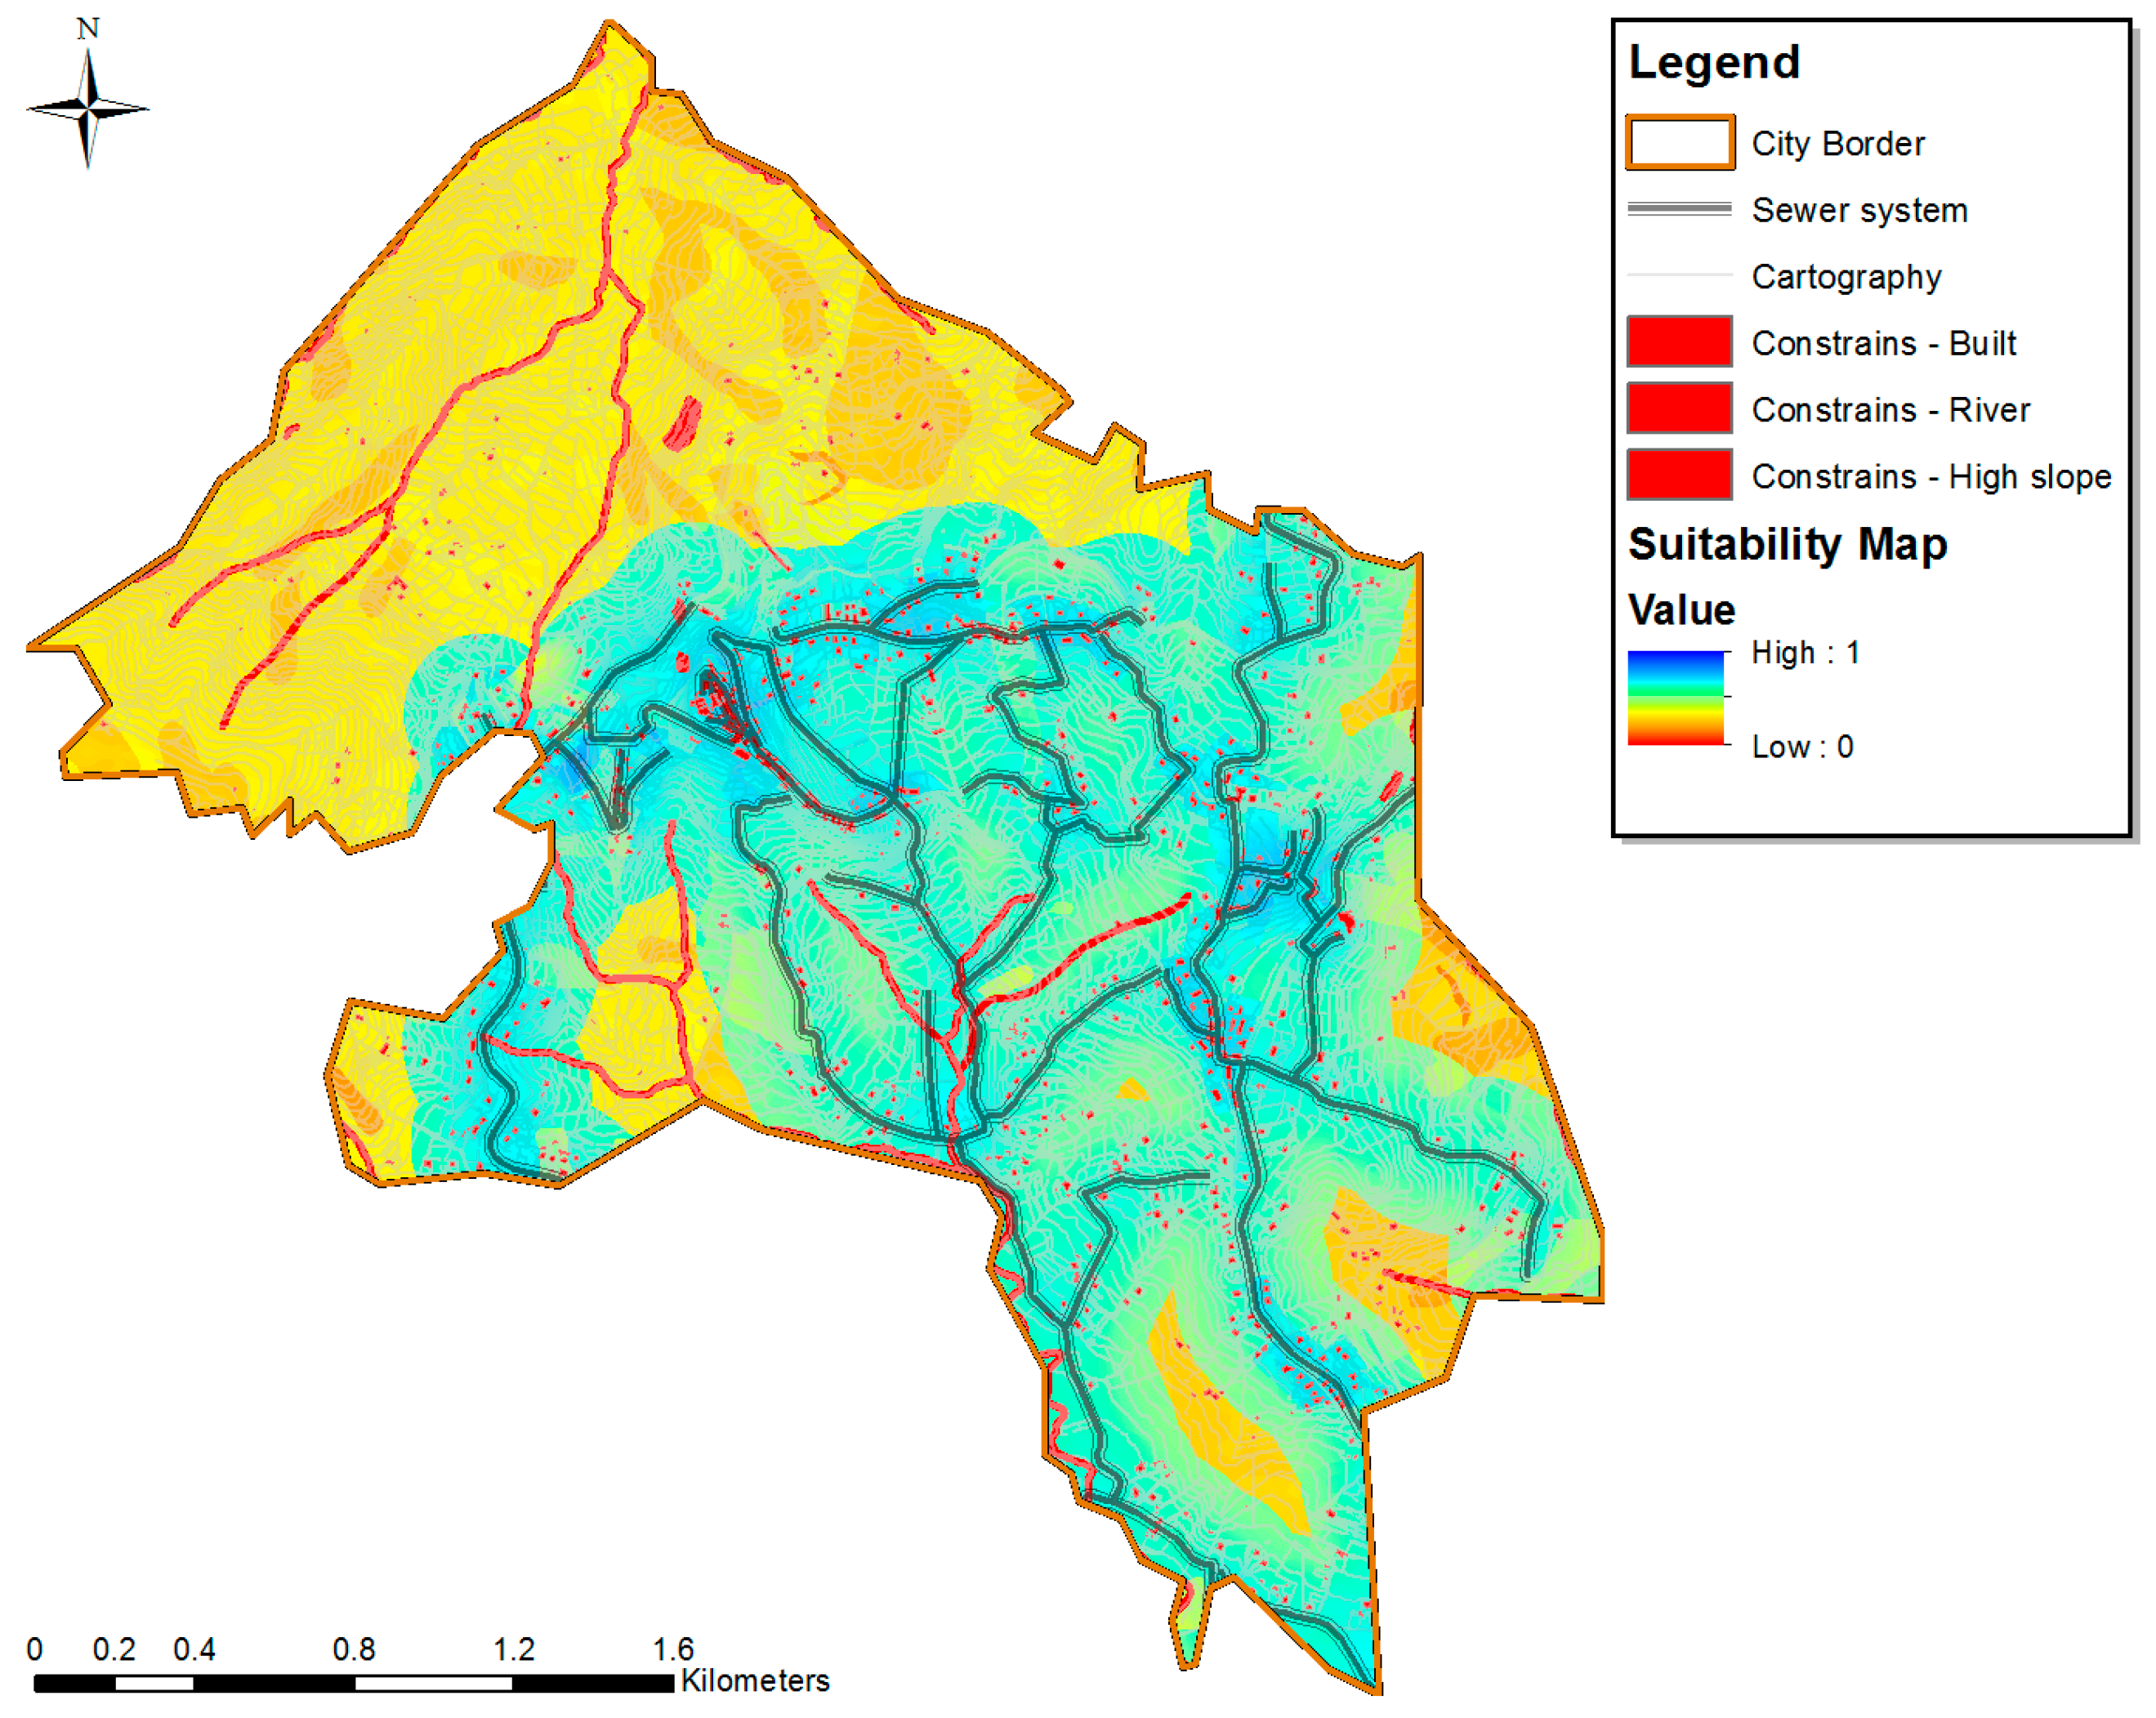
The evaluation process, by weighing the various factors that affect the localization of new users or network extension positively or negatively, leads to the realization of the final suitability map, illustrated in Figure 11. Comparisons between different scenarios and the base suitability map through the sensitivity analysis allow further methodological considerations on the procedure adopted.
In fact, by examining the differences between the maps of the scenarios, it is possible to find convergence of the areas with greater suitability with the base result.
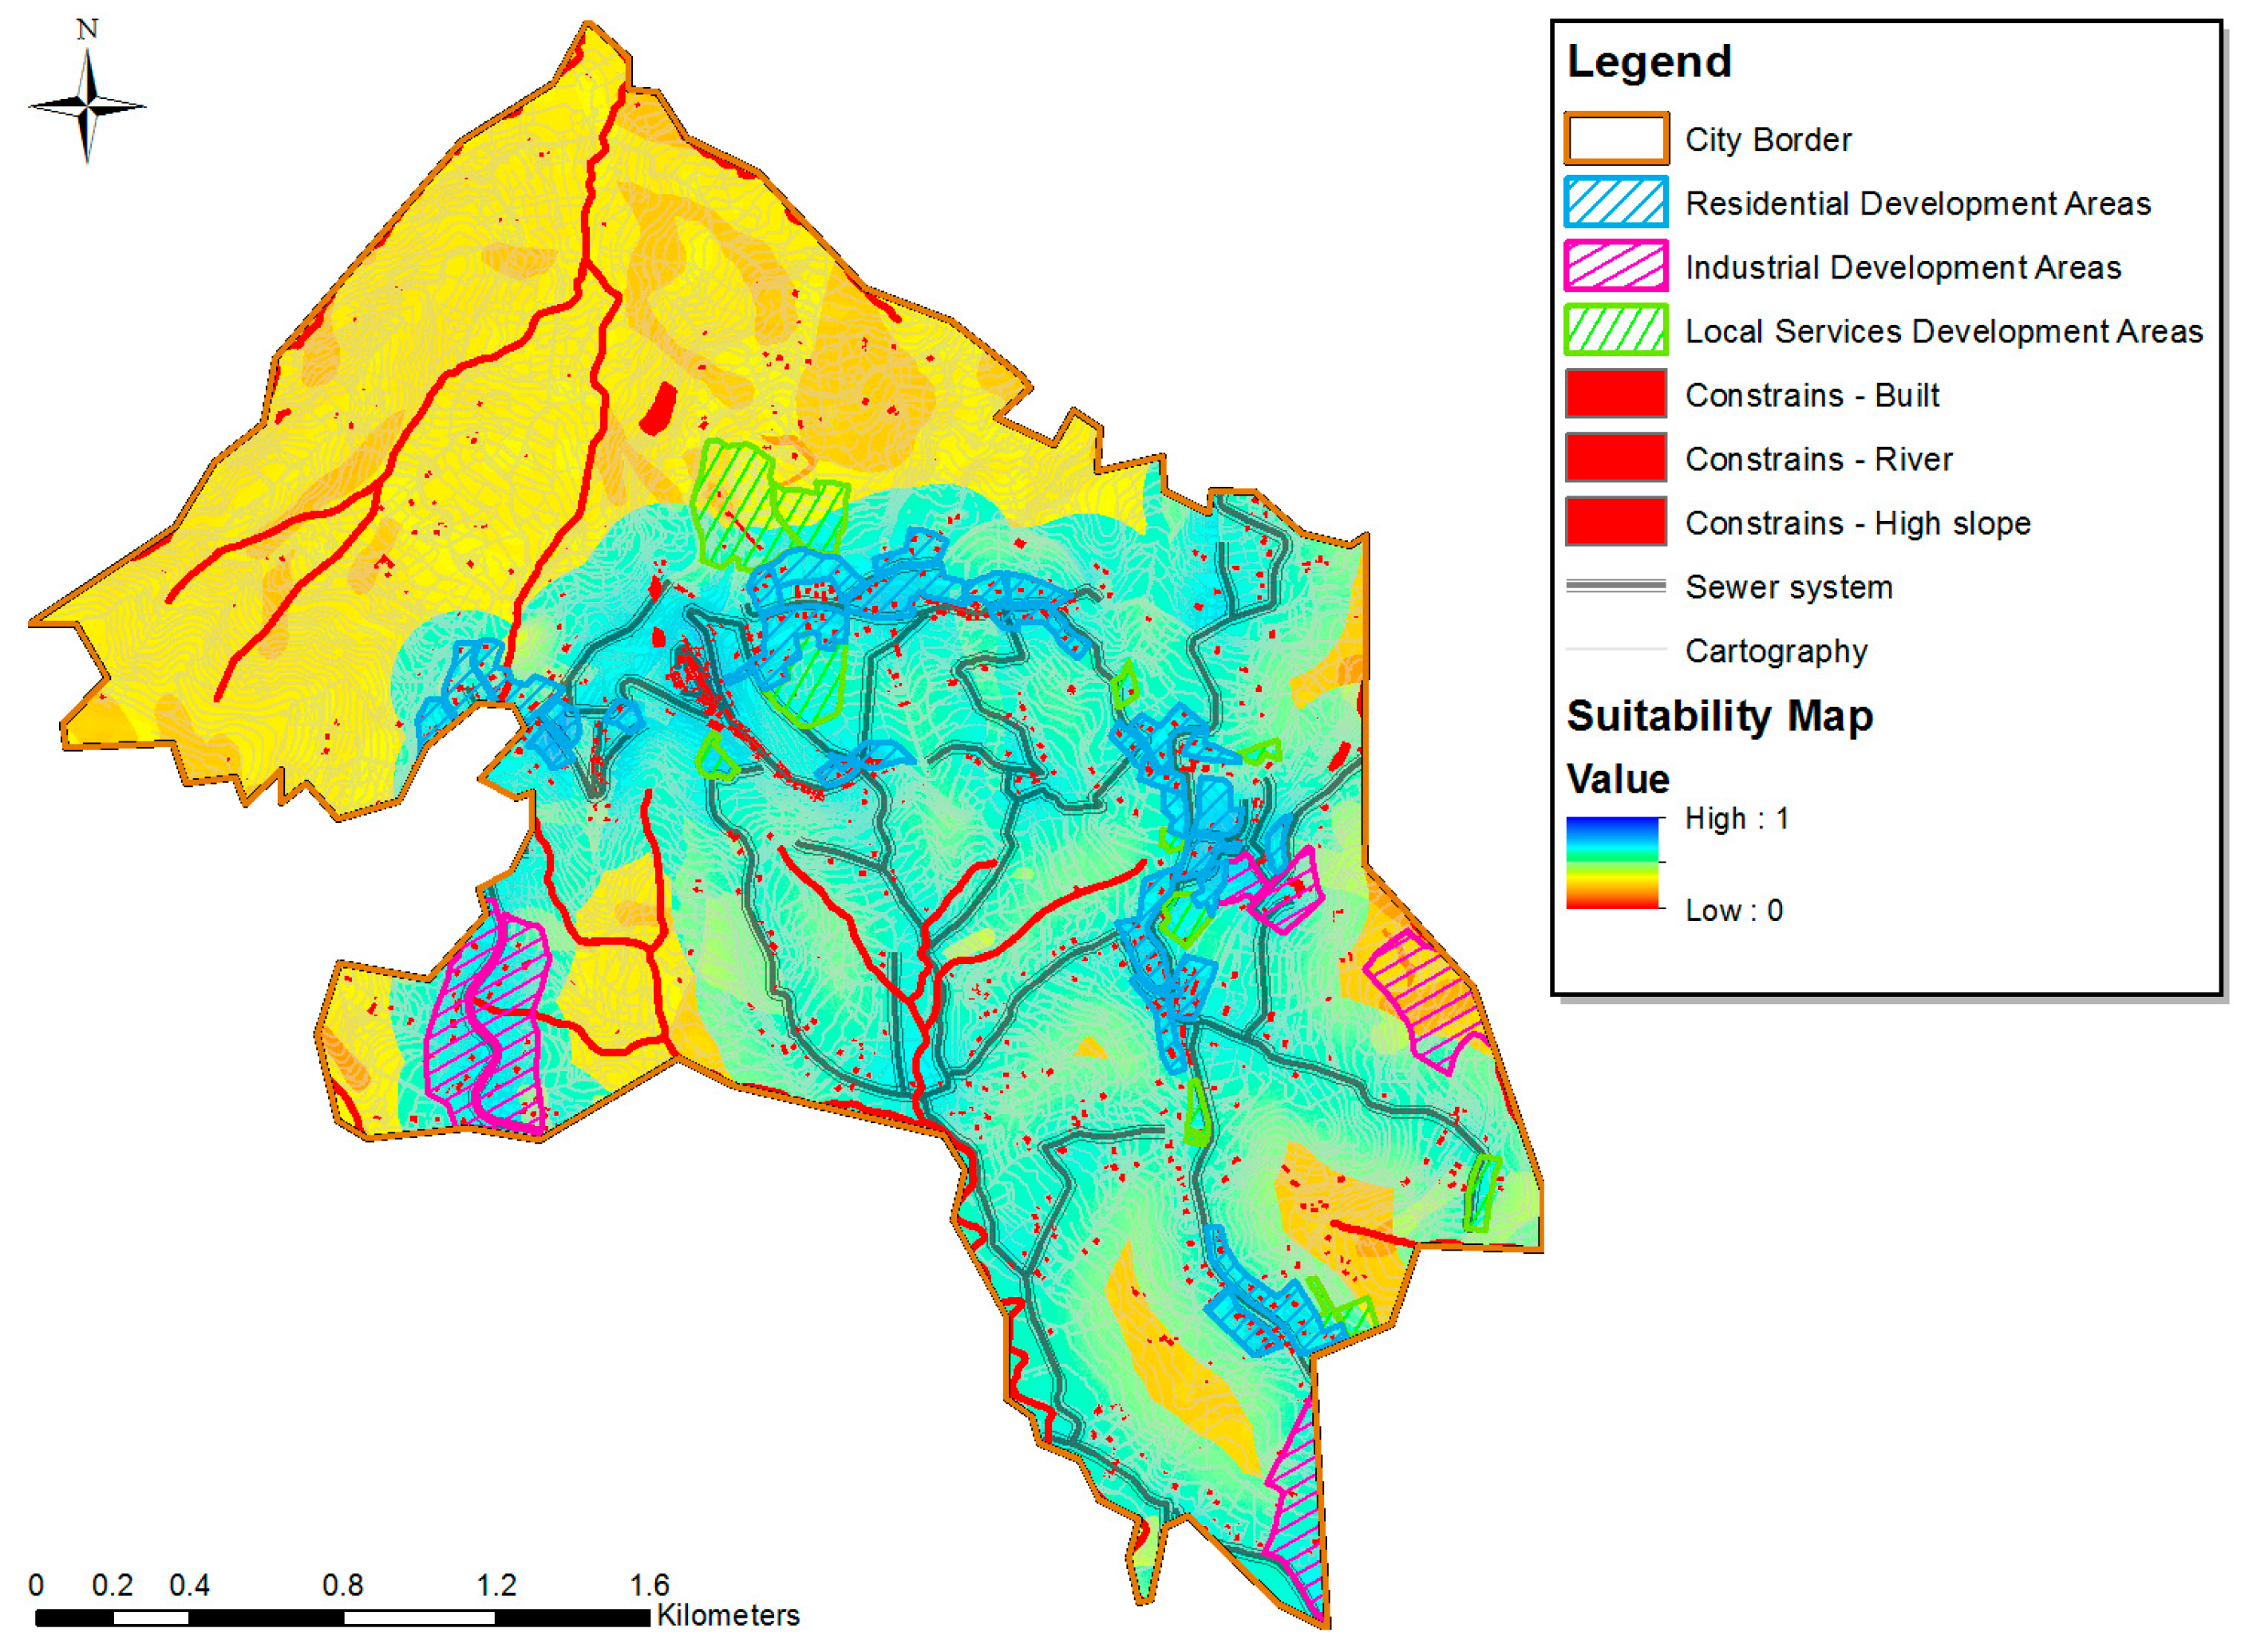
The application tested on the sample town has, in fact, made it possible to evaluate the choices of the current city plan from the overlay with the suitability map following major feedback considerations on the expansion areas planned by the city plan itself (Figure 12).
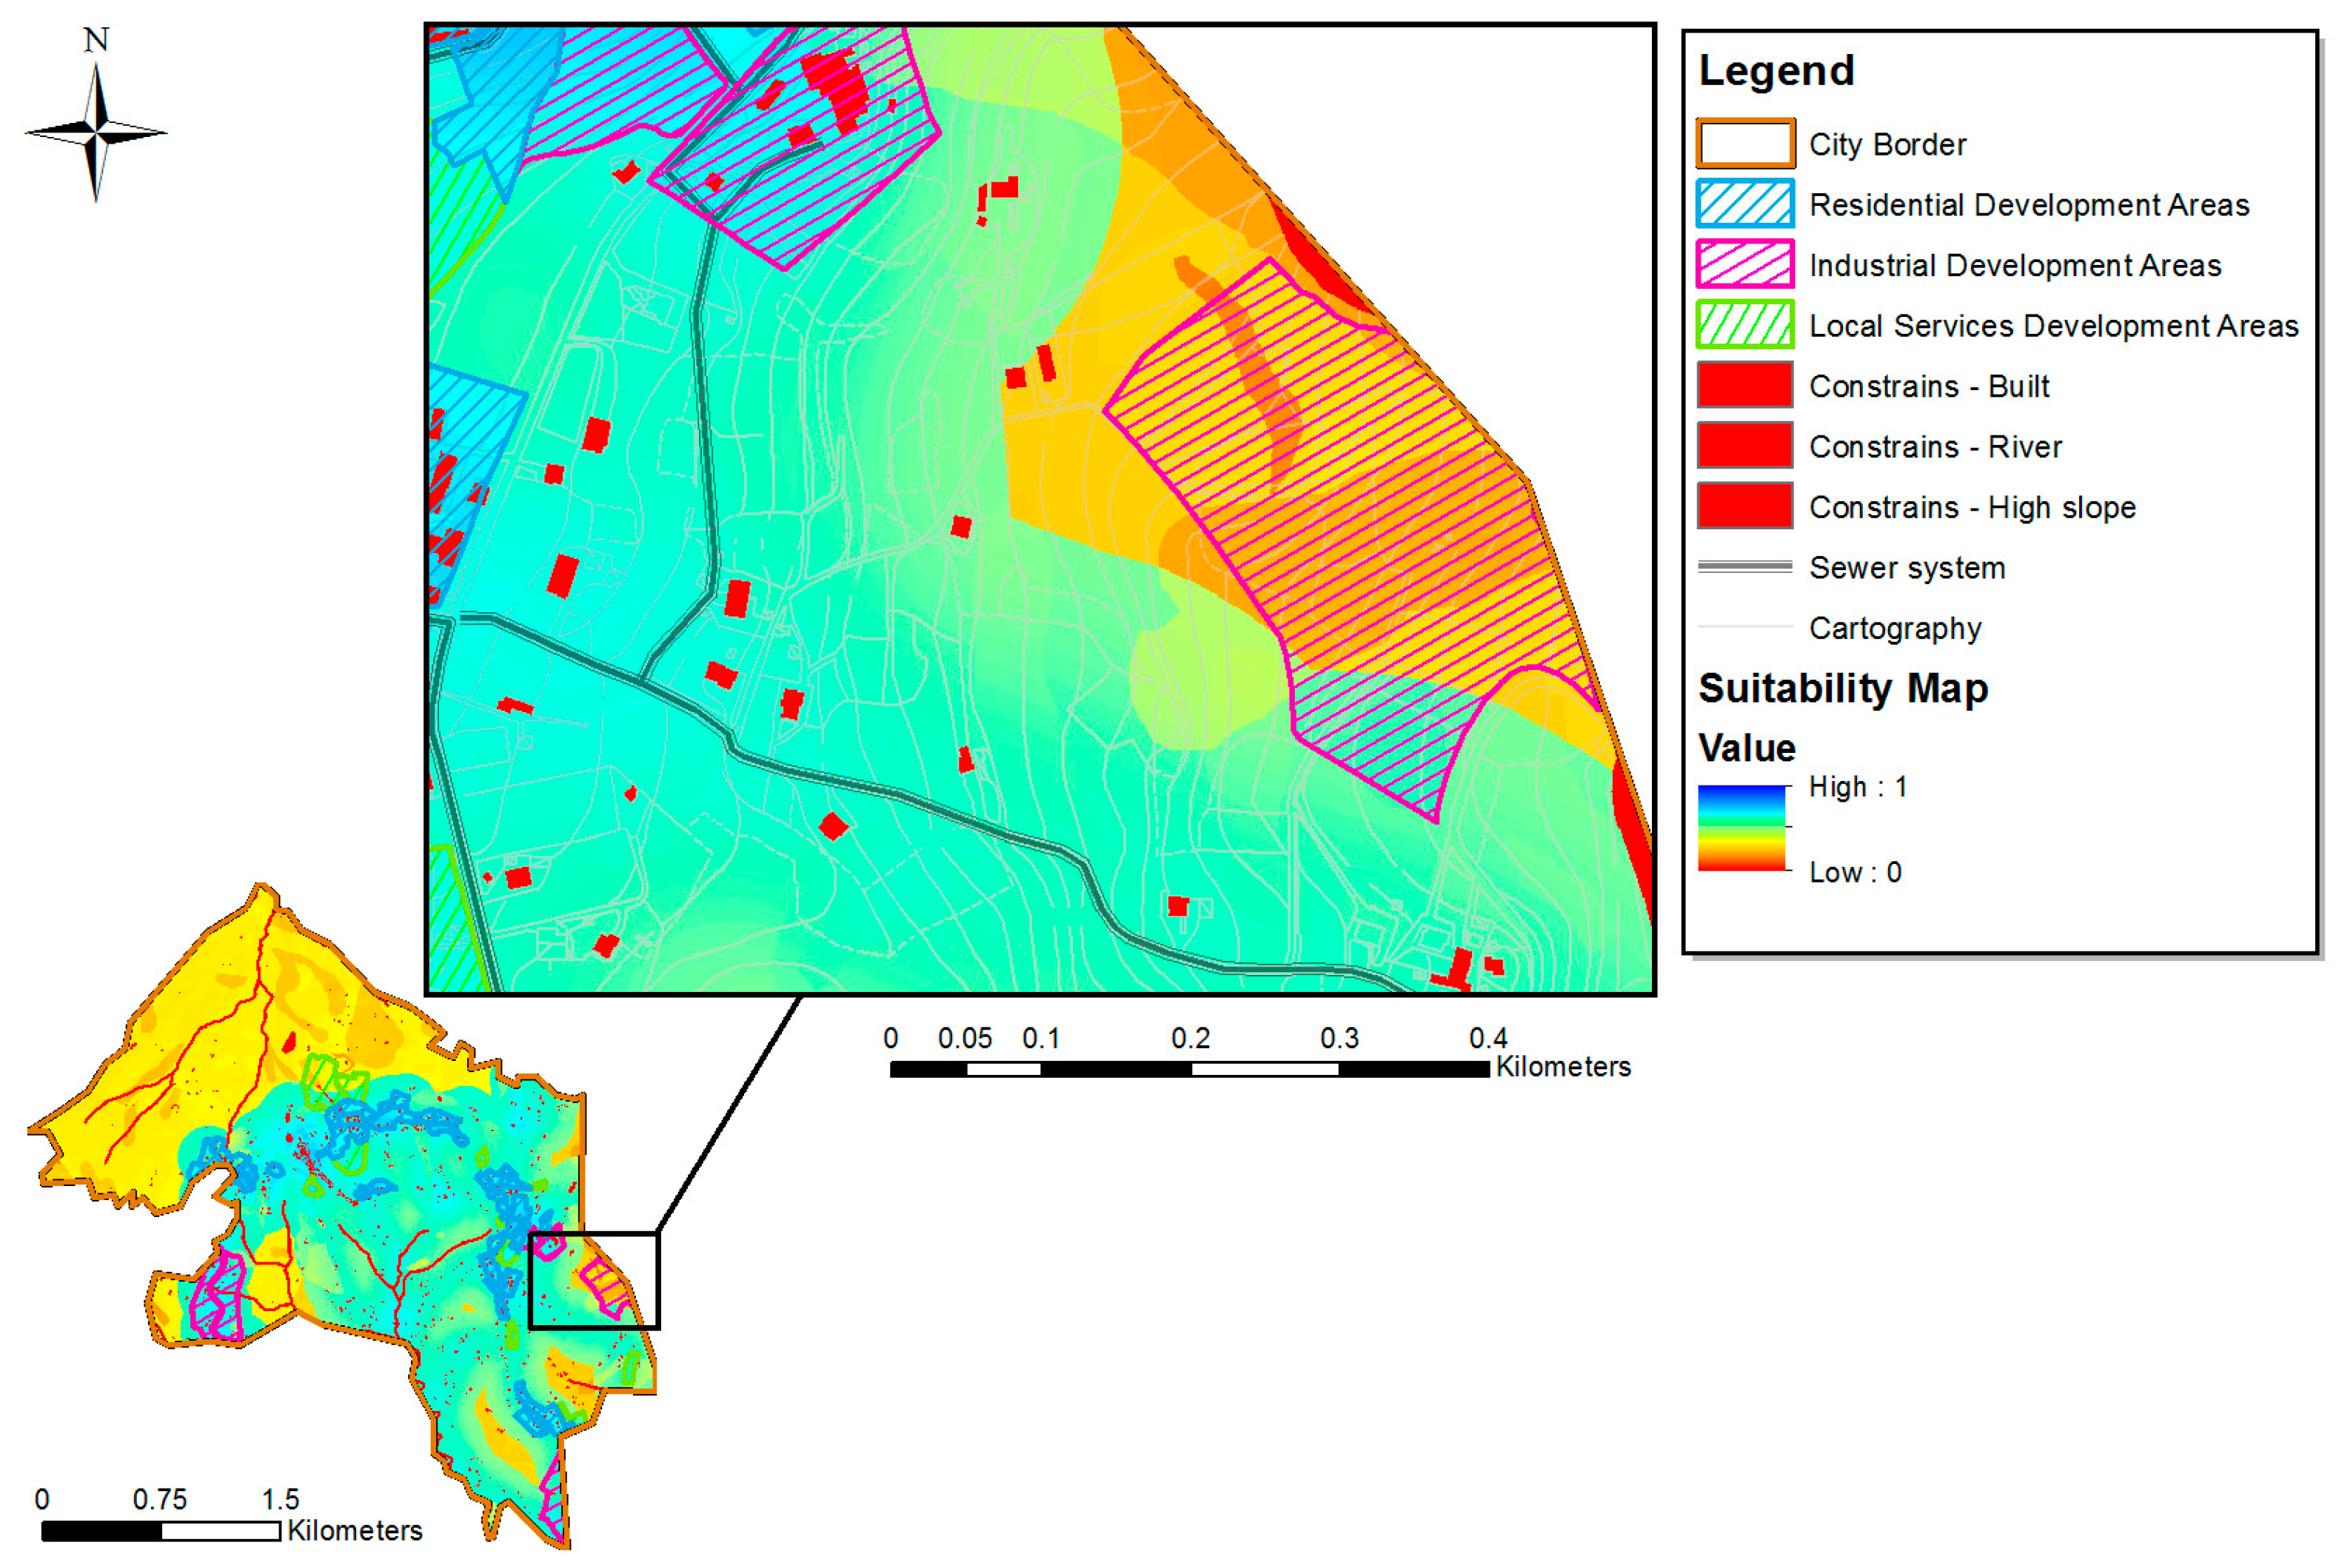
Based on our results we can see that a significant portion of the territory is unsuitable to host new users or extensions of the network, while the territories with higher suitability values are concentrated mainly in areas already urbanized and served. The areas of residential expansion planned by the city plan are well merged into the existing urban fabric, presenting high levels of suitability for which it is possible to suggest the exclusion of investments for expansion of the network initially planned by the WIP and needed to cover of this additional demand. All scenarios share the result that some planned areas for expanding productive activities and service areas are located in places with low suitability (Figure 13 and Figure 14).
In these areas, in fact, sewerage is not present. Therefore, these areas will be served by realizing specific works, for which their costs will increase in inverse proportion to the suitability of the area itself. This case constitutes a constructive criticism of the city plan, because locating these areas in such contexts has indirectly increased the costs of their transformation, as the costs of the urbanization infrastructure related-costs will be high. Data analysis, then, allows us to evaluate the choices made in the city plan regarding the placement of additional demand of services. On one hand, it has allowed us to eliminate part of the work for extending the network, because part of the demand has been placed in areas already efficiently served. On the other hand, our analysis shows us how a demand that is spatially undefined, or in the wrong area, will result in increasing investment costs if we get away from the concept of densification of services and building. In highly urbanized and dense areas, with high service coverage, the ratio representing the infrastructure endowment per capita served (K), generally has low values. This means that in these areas with a few meters of a network, it is possible to serve more users with lower implementation and management costs. Conversely, in slightly urbanized and scattered areas with low service coverage, it takes many meters of network to serve a few users, which results in very high costs of implementation and management. In this context, the logic of densification is the one that allows us to combine all the different aspects examined, especially those of economy and efficiency. This application shows that the method allows us to optimize the size and localization of investments necessary to meet service criteria by looking at the actual efficiency of the networks. In fact, comparing the results with the information provided by the WIP in relation to the sample area, it is possible to reduce the investments in the network originally planned by the same WIP. Interesting reflections of the results arise also from the sensitivity analysis (SA) developed for the application in question; the SA allows us to highlight the problematic aspects of the evaluation process and, at least in principle, to investigate them more thoroughly and to improve them. The spatial sensitivity analysis is, in fact, a process through which the decision maker reaches deeper knowledge about the structure of the problem and a greater awareness regarding the performance of the alternatives, in light of uncertainty and acceptable risk thresholds [50]. This SA makes explicit how the various decisional elements interact to choose the most valuable solution which is also born from disagreement between decision makers expressed within the process.
4. Conclusions
The application opens a series of reflections on the investigated techniques regarding the use of our methodology to achieve our goals of rearranging methodical planning in this field, using the input–feedback mechanisms between the WIP and the city plan, in pursuit of smart integrated planning. The methodological approach adopted provides substantial support for further assessment. This first step represents a useful knowledge base for the next, more detailed, phase of analysis, which involves the micro-location of investments and the review of city plan policies. In fact, the study case shows that MC-SDSS models are able to offer significant support in the phase of macro-localizing the most suitable areas to host new users, or extend existing networks, and to better integrate them with the existing infrastructure. The service’s targets are redefined with respect to the space component of demand, until now neglected, and with regard to the sections, or urban areas, functionally linked to the directives of the city plan. It is clear that the presence of constraints and decision factors limits the number and geographic extent of alternative spaces. The results show a dutiful disincentive policy for investments placed outside urbanized areas which already suffer of structural weaknesses.
Furthermore, the suitability map allows us to validate the address criteria for urban transformations which have to be followed by the city plan in view of densification rather than expansion of the urban structure in the rural areas. It will be possible to select and compare alternatives, choices, and drivers of the city plan with regard to the infrastructure subsystem that represents the carrier network on which all activities of land use should be developed. Our discussion has highlighted the potential integration of GIS techniques and multi-criteria analysis and explained this approach is very useful in systematically providing transparent and repeatable decision support, thanks to a clear and rational presentation of the results facilitated by the creation of thematic maps. One of the most significant strengths of MC-SDSS models is the support that they provide both for the planning phase, where they can help to generate alternate options, and the evaluation phase, where they allow the comparison of alternatives based on various criteria to make explicit the impacts, levels of tradeoff, and overall attractiveness of the options. Our application shows that multi-criteria spatial analysis can provide effective support to the strategic planning phase of investments in territorial transformation, providing a useful knowledge base for more detailed subsequent analysis (micro-localization). In fact, according to our results, the potential benefits of the spatial ANP approach for defining the investments of territorial transformation appear to be plentiful. First, the analysis highlights what factors are most significant for the decision through a transparent evaluation process. Future research will refer to the extension of the methodology to the other component of water infrastructure, the water distribution network. We also intend to develop a sensitivity analysis based on generating multiple combinations of weights, to be associated with several criteria, in order to take due account of various uncertainties [51,52], and the integration of ANP with Fuzzy TOPSIS methods [53,54]. Indeed, this case study has showed that the limits of a multi-criteria spatial analysis essentially rely on the availability and accessibility of spatial data, which are rarely public and are scattered among various agencies, as well as the need for preliminary data processing before data can be used in MC-SDSS software. The widespread implementation, on the national level, of this methodology needs a legal obligation to address and regulate the participation of different actors in the decision-making process, while at the same time formalizing the link between city plans and the Water Infrastructure Plan. However, since there are no technical difficulties in the implementation (it is simply necessary to expand the database of WIP with the data on the land use and environmental constraints), we hope in application trials to boost sector governance to provide for the regulatory address that is needed.
Author Contributions
Authors contributed equally to this work.
Conflicts of Interest
The authors declare no conflict of interest.
Appendix A

Table A1.
Spatial Analysis of the Evaluation Maps.
| Decisional Cluster | Criteria | Input | Processing |
|---|---|---|---|
| Infrastructures | Hydraulics | Lidar Elevation Map, Sewer Network Plan, Sewer Network’s Diameters & Materials | Slope, Buffer, Distance, Raster Calculator, Field Calculator |
| Sewers position | Sewer Network Plan | Kernel Density Function | |
| Coverage of service | City Plan, Sewer Network Plan, Built Plan, Population’s data for city district | Buffer, Intersect, Union, Voronoi’s Poligons, Field Calculator | |
| Land Use | Residential development areas | City Plan—Residential Development Areas | Reclassification |
| Industrial development areas | City Plan—Industrial Development Area | Reclassification | |
| Local services development areas | City Plan—Local Services Development Areas | Reclassification | |
| Position | Distance from building | Built Plan | Euclidean Distance |
| Distance from water treatments installation | Sewer Network Plan, Waste Water Treatment installation position | Raster calculator, Classification, Cost Map, Cost Distance Map | |
| Distance from roads | Road Network Plan | Euclidean Distance | |
| Environment | Distance from rivers | River Network Plan | Euclidean Distance |
| Terrain slope | Lidar Elevation Map | Slope, Reclassification | |
| Hydro-Geological Risk | Hydro-Geological Risk Plan | Classification |
Table A2.
Super Matrix.
| Cluster | Cluster | 0—Goal | 1—Infrastructure | 2—Land Use | 3—Position | 4—Environment | ||||||||
|---|---|---|---|---|---|---|---|---|---|---|---|---|---|---|
| Node | 0.0—Goal | 1.1 | 1.2 | 1.3 | 2.1 | 2.2 | 2.3 | 3.1 | 3.2 | 3.3 | 4..1 | 4.2 | 4.3 | |
| 0—Goal | 0.0—Goal | 0.000 | 1.000 | 1.000 | 1.000 | 1.000 | 1.000 | 1.000 | 1.000 | 1.000 | 1.000 | 1.000 | 1.000 | 1.000 |
| 1—Infrastructures | 1.1—Hydraulics | 0.796 | 0.000 | 0.889 | 0.889 | 0.345 | 0.715 | 0.571 | 0.333 | 0.683 | 0.588 | 0.600 | 0.769 | 0.342 |
| 1.2—Sewers Position | 0.125 | 0.750 | 0.000 | 0.111 | 0.547 | 0.187 | 0.143 | 0.528 | 0.200 | 0.323 | 0.300 | 0.147 | 0.577 | |
| 1.3—Coverage of service | 0.079 | 0.250 | 0.111 | 0.000 | 0.109 | 0.098 | 0.286 | 0.140 | 0.117 | 0.089 | 0.100 | 0.084 | 0.081 | |
| 2—Land Use | 2.1—Residential Development Areas | 0.571 | 0.540 | 0.540 | 0.571 | 0.000 | 0.000 | 0.000 | 0.540 | 0.540 | 0.540 | 0.540 | 0.540 | 0.571 |
| 2.2—Industrial Development Area | 0.143 | 0.163 | 0.163 | 0.143 | 0.000 | 0.000 | 0.000 | 0.163 | 0.163 | 0.163 | 0.163 | 0.163 | 0.143 | |
| 2.3—Local Services Development Areas | 0.286 | 0.297 | 0.297 | 0.286 | 0.000 | 0.000 | 0.000 | 0.297 | 0.297 | 0.297 | 0.297 | 0.297 | 0.286 | |
| 3—Position | 3.1—Distance From Building | 0.582 | 0.333 | 0.528 | 0.540 | 0.333 | 0.320 | 0.637 | 0.000 | 0.000 | 0.000 | 0.320 | 0.258 | 0.320 |
| 3.2—Distance from water Treat. Inst. | 0.109 | 0.140 | 0.140 | 0.163 | 0.140 | 0.122 | 0.105 | 0.000 | 0.000 | 0.000 | 0.122 | 0.105 | 0.122 | |
| 3.3—Distance From Roads | 0.309 | 0.528 | 0.333 | 0.297 | 0.528 | 0.558 | 0.258 | 0.000 | 0.000 | 0.000 | 0.558 | 0.637 | 0.558 | |
| 4—Environment | 4.1—Distance From River | 0.345 | 0.122 | 0.122 | 0.105 | 0.333 | 0.345 | 0.258 | 0.122 | 0.105 | 0.105 | 0.000 | 0.000 | 0.000 |
| 4.2—Terrain Slope | 0.109 | 0.230 | 0.230 | 0.258 | 0.097 | 0.109 | 0.105 | 0.230 | 0.258 | 0.258 | 0.000 | 0.000 | 0.000 | |
| 4.3—Hydro-Geological Risk | 0.547 | 0.648 | 0.648 | 0.637 | 0.570 | 0.547 | 0.637 | 0.648 | 0.637 | 0.637 | 0.000 | 0.000 | 0.000 | |
Table A3.
Weighted Super Matrix.
| Cluster | Cluster | 0—Goal | 1—Infrastructure | 2—Land Use | 3—Position | 4—Environment | ||||||||
|---|---|---|---|---|---|---|---|---|---|---|---|---|---|---|
| Node | 0.0—Goal | 1.1 | 1.2 | 1.3 | 2.1 | 2.2 | 2.3 | 3.1 | 3.2 | 3.3 | 4.1 | 4.2 | 4.3 | |
| 0—Goal | 0.0—Goal | 0.000 | 0.000 | 0.000 | 0.000 | 0.000 | 0.000 | 0.000 | 0.000 | 0.000 | 0.000 | 0.000 | 0.000 | 0.000 |
| 1—Infrastructures | 1.1—Hydraulics | 0.440 | 0.000 | 0.424 | 0.424 | 0.115 | 0.238 | 0.190 | 0.111 | 0.227 | 0.195 | 0.425 | 0.545 | 0.242 |
| 1.2—Sewers Position | 0.069 | 0.358 | 0.000 | 0.053 | 0.182 | 0.062 | 0.048 | 0.176 | 0.066 | 0.108 | 0.213 | 0.104 | 0.409 | |
| 1.3—Coverage of service | 0.044 | 0.119 | 0.053 | 0.000 | 0.036 | 0.032 | 0.095 | 0.046 | 0.039 | 0.030 | 0.071 | 0.060 | 0.057 | |
| 2—Land Use | 2.1—Residential Development Areas | 0.077 | 0.094 | 0.094 | 0.099 | 0.000 | 0.000 | 0.000 | 0.075 | 0.075 | 0.075 | 0.096 | 0.096 | 0.102 |
| 2.2—Industrial Development Area | 0.019 | 0.028 | 0.028 | 0.025 | 0.000 | 0.000 | 0.000 | 0.023 | 0.023 | 0.023 | 0.029 | 0.029 | 0.026 | |
| 2.3—Local Services Development Areas | 0.039 | 0.052 | 0.052 | 0.050 | 0.000 | 0.000 | 0.000 | 0.041 | 0.041 | 0.041 | 0.053 | 0.053 | 0.051 | |
| 3—Position | 3.1—Distance From Building | 0.059 | 0.026 | 0.042 | 0.043 | 0.046 | 0.045 | 0.089 | 0.000 | 0.000 | 0.000 | 0.036 | 0.029 | 0.036 |
| 3.2—Distance from water Treat. Inst. | 0.011 | 0.011 | 0.011 | 0.013 | 0.020 | 0.017 | 0.015 | 0.000 | 0.000 | 0.000 | 0.014 | 0.012 | 0.014 | |
| 3.3—Distance From Roads | 0.031 | 0.042 | 0.026 | 0.024 | 0.074 | 0.078 | 0.036 | 0.000 | 0.000 | 0.000 | 0.063 | 0.072 | 0.063 | |
| 4—Environment | 4.1—Distance From River | 0.073 | 0.033 | 0.033 | 0.028 | 0.176 | 0.182 | 0.136 | 0.064 | 0.055 | 0.055 | 0.000 | 0.000 | 0.000 |
| 4.2—Terrain Slope | 0.023 | 0.062 | 0.062 | 0.070 | 0.051 | 0.057 | 0.055 | 0.121 | 0.136 | 0.136 | 0.000 | 0.000 | 0.000 | |
| 4.3—Hydro-Geological Risk | 0.116 | 0.175 | 0.175 | 0.172 | 0.301 | 0.289 | 0.336 | 0.342 | 0.336 | 0.336 | 0.000 | 0.000 | 0.000 | |
Table A4.
Limited—Weighted Super Matrix.
| Cluster | Cluster | 0—Goal | 1—Infrastructure | 2—Land Use | 3—Position | 4—Environment | ||||||||
|---|---|---|---|---|---|---|---|---|---|---|---|---|---|---|
| Node | 0.0—Goal | 1.1 | 1.2 | 1.3 | 2.1 | 2.2 | 2.3 | 3.1 | 3.2 | 3.3 | 4..1 | 4.2 | 4.3 | |
| 0—Goal | 0.0—Goal | 0.000 | 0.000 | 0.000 | 0.000 | 0.000 | 0.000 | 0.000 | 0.000 | 0.000 | 0.000 | 0.000 | 0.000 | 0.000 |
| 1—Infrastructures | 1.1—Hydraulics | 0.237 | 0.237 | 0.237 | 0.237 | 0.237 | 0.237 | 0.237 | 0.237 | 0.237 | 0.237 | 0.237 | 0.237 | 0.237 |
| 1.2—Sewers Position | 0.200 | 0.200 | 0.200 | 0.200 | 0.200 | 0.200 | 0.200 | 0.200 | 0.200 | 0.200 | 0.200 | 0.200 | 0.200 | |
| 1.3—Coverage of service | 0.066 | 0.066 | 0.066 | 0.066 | 0.066 | 0.066 | 0.066 | 0.066 | 0.066 | 0.066 | 0.066 | 0.066 | 0.066 | |
| 2—Land Use | 2.1—Residential Development Areas | 0.080 | 0.080 | 0.080 | 0.080 | 0.080 | 0.080 | 0.080 | 0.080 | 0.080 | 0.080 | 0.080 | 0.080 | 0.080 |
| 2.2—Industrial Development Area | 0.023 | 0.023 | 0.023 | 0.023 | 0.023 | 0.023 | 0.023 | 0.023 | 0.023 | 0.023 | 0.023 | 0.023 | 0.023 | |
| 2.3—Local Services Development Areas | 0.043 | 0.043 | 0.043 | 0.043 | 0.043 | 0.043 | 0.043 | 0.043 | 0.043 | 0.043 | 0.043 | 0.043 | 0.043 | |
| 3—Position | 3.1—Distance From Building | 0.035 | 0.035 | 0.035 | 0.035 | 0.035 | 0.035 | 0.035 | 0.035 | 0.035 | 0.035 | 0.035 | 0.035 | 0.035 |
| 3.2—Distance from water Treat. Inst. | 0.012 | 0.012 | 0.012 | 0.012 | 0.012 | 0.012 | 0.012 | 0.012 | 0.012 | 0.012 | 0.012 | 0.012 | 0.012 | |
| 3.3—Distance From Roads | 0.043 | 0.043 | 0.043 | 0.043 | 0.043 | 0.043 | 0.043 | 0.043 | 0.043 | 0.043 | 0.043 | 0.043 | 0.043 | |
| 4—Environment | 4.1—Distance From River | 0.046 | 0.046 | 0.046 | 0.046 | 0.046 | 0.046 | 0.046 | 0.046 | 0.046 | 0.046 | 0.046 | 0.046 | 0.046 |
| 4.2—Terrain Slope Suitability | 0.051 | 0.051 | 0.051 | 0.051 | 0.051 | 0.051 | 0.051 | 0.051 | 0.051 | 0.051 | 0.051 | 0.051 | 0.051 | |
| 4.3—Hydro-Geological Risk | 0.163 | 0.163 | 0.163 | 0.163 | 0.163 | 0.163 | 0.163 | 0.163 | 0.163 | 0.163 | 0.163 | 0.163 | 0.163 | |
References
- Jaeger, J.A.G.; Bertiller, R.; Schwick, C.; Kienast, F. Suitability criteria for measures of urban sprawl. Ecol. Indic. 2010, 10, 397–406. [Google Scholar] [CrossRef]
- Gerundo, R.; Grimaldi, M. The measure of land consumption caused by urban planning. Procedia Eng. 2011, 21, 1152–1160. [Google Scholar] [CrossRef]
- United Nations World Water Assessment Programme (UN-WWAP). The United Nations World Water Development Report 2015: Water for a Sustainable World; United Nations Educational, Scientific and Cultural Organization (UNESCO), Ed.; UNESCO: Paris, France, 2015. [Google Scholar]
- Navigant Research. Global Investment in Smart City Technology Infrastructure to Total $108 Billion by 2020. Available online: https://www.navigantresearch.com/newsroom/global-investment-in-smart-city-technology-infrastructure-to-total-108-billion-by-2020 (accessed on 27 December 2016).
- E-blue, U. Blue e-Book. I dati del Servizio Idrico Integrato in Italia; Noè Edizioni Multimedia: Firenze, Italy, 2014. [Google Scholar]
- Guerrini, A.; Romano, G. Water Management in Italy. In SpringerBriefs in Water Science and Technology; Springer: Cham, Switzerland, 2014. [Google Scholar]
- Coutinho-Rodrigues, J.; Simão, A.; Antunes, C.H. A GIS-based multicriteria spatial decision support system for planning urban infrastructures. Decis. Support Syst. 2011, 51, 720–726. [Google Scholar] [CrossRef]
- Malczewski, J. GIS-based multicriteria decision analysis: A survey of the literature. Int. J. Geogr. Inf. Sci. 2006, 20, 703–726. [Google Scholar] [CrossRef]
- Pereira, J.M.C.; Duckstein, L. A Multiple Criteria Decision-Making Approach To Gis-Based Land Suitability Evaluation. Int. J. Geogr. Inf. Syst. 1993, 7, 407–424. [Google Scholar] [CrossRef]
- Joerin, F.; Thériault, M.; Musy, A. Using GIS and outranking multicriteria analysis for land-use suitability assessment. Int. J. Geogr. Inf. Sci. 2001. [Google Scholar] [CrossRef]
- Chakhar, S.; Mousseau, V. GIS-based multicriteria spatial modeling generic framework. Int. J. Geogr. Inf. Sci. 2008, 22, 1159–1196. [Google Scholar] [CrossRef]
- Malczewski, J. GIS-based land-use suitability analysis: A critical overview. Prog. Plan. 2004, 62, 3–65. [Google Scholar] [CrossRef]
- Jankowski, P. Integrating geographical information systems and multiple criteria decision-making methods. Int. J. Geogr. Inf. Syst. 1995, 9, 251–273. [Google Scholar] [CrossRef]
- Dragan, M.; Feoli, E.; Fernetti, M.; Zerihun, W. Application of a spatial decision support system (SDSS) to reduce soil erosion in northern Ethiopia. Environ. Model. Softw. 2003, 18, 861–868. [Google Scholar] [CrossRef]
- Larson, B.; Sengupta, R. A spatial decision support system to identify species-specific critical habitats based on size and accessibility using US GAP data. Environ. Model. Softw. 2004, 19, 7–18. [Google Scholar] [CrossRef]
- Chen, K.; Blong, R.; Jacobson, C. MCE-RISK: Integrating multicriteria evaluation and GIS for risk decision-making in natural hazards. Environ. Model. Softw. 2001, 16, 387–397. [Google Scholar] [CrossRef]
- Carver, S.J. Integrating multi-criteria evaluation with geographical information systems. Int. J. Geogr. Inf. Sci. 1991, 5, 321–339. [Google Scholar] [CrossRef]
- Eastman, J.R.; Jin, W.G.; Kyem, P.A.K.; Toledano, J. Raster Procedures for Multicriteria Multiobjective Decisions. Photogramm. Eng. Remote Sens. 1995, 61, 539–547. [Google Scholar]
- Chen, Y.; Paydar, Z. Evaluation of potential irrigation expansion using a spatial fuzzy multi-criteria decision framework. Environ. Model. Softw. 2012, 38, 147–157. [Google Scholar] [CrossRef]
- Yu, J.; Chen, Y.; Wu, J.; Khan, S. Cellular automata-based spatial multi-criteria land suitability simulation for irrigated agriculture. Int. J. Geogr. Inf. Sci. 2011, 25, 131–148. [Google Scholar] [CrossRef]
- Chen, Y.; Yu, J.; Khan, S. Spatial sensitivity analysis of multi-criteria weights in GIS-based land suitability evaluation. Environ. Model. Softw. 2010, 25, 1582–1591. [Google Scholar] [CrossRef]
- Saaty, R.W. Decision Making in Complex Enviroments: The Analytic Hierarchy Process (AHP) for Decision Making and the Analytic Network Process (ANP) for Decision Making with Dependence and Feedback; RWS Publications: Pittsburgh, PA, USA, 2003. [Google Scholar]
- Saaty, T.L.; Vargas, L.G. Decision Making with The Analytic Network Process: Economic, Political, Social and Technological Applications with Benefits, Opportunities, Costs and Risks; Springer: New York, NY, USA, 2006. [Google Scholar]
- ATO Calore Irpino. Water Infrastructure Plan ATO1 “Calore Irpino”. Available online: http://www.atocaloreirpino.it/area-tecnica/piano-d-ambito/documenti-pda-2012.html (accessed on 30 September 2016).
- Greco, S.; Ehrgott, M.; Figueira, J.R. Multiple Criteria Decision Analysis: State of the Art Surveys; Springer: New York, NY, USA, 2016; Volume 1, p. e2. [Google Scholar]
- Roscelli, R. Misurare nell’incertezza; Celid: Torino, Italy, 2005. [Google Scholar]
- Cerreta, M.; De Toro, P. Integrated spatial assessment for a creative decision-making process: A combined methodological approach to strategic environmental assessment. Int. J. Sustain. Dev. 2010, 13, 17–30. [Google Scholar] [CrossRef]
- Garson, G.D.; Robert, S.B. Analytic Mapping and Geographic Databases; Sage: Newbury Park, CA, USA, 1992. [Google Scholar]
- Worall, L. Spatial Analysis and Spatial Policy using Geographic Information System; Belhaven Press: London, UK, 1991; p. 236. [Google Scholar]
- Nijkamp, P.; Rietveld, P.; Voogd, H. Multicriteria Evaluation in Physical Planning; Elsevier: Amsterdam, The Netherland, 1990. [Google Scholar]
- Rietveld, P. Infrastructure and regional development. Ann. Reg. Sci. 1989, 23, 255–274. [Google Scholar] [CrossRef]
- Voogd, H. Qualitative multicriteria evaluation methods for development planning. Can. J. Reg. Sci. 1981, IV, 73–87. [Google Scholar]
- Voogd, H. Multicriteria evaluation: Measures, manipulation, and meaning—A reply. Environ. Plan. B Plan. Des. 1988, 15, 65–72. [Google Scholar] [CrossRef]
- Burrough, P.A. Principles of Geographical Information Systems for Land Resources Assessment; Clarendon Press: Oxford, UK, 1986; Volume 1. [Google Scholar]
- Goodchild, M.F.; Parks, B.O.; Steyaert, L.T. Environmental Modeling with GIS; Oxford University Press Inc.: New York, NY, USA, 1993. [Google Scholar]
- Bottero, M.F.V. An Analytic Network Process (ANP) based approach for location problems: The case of a waste incinerator plant in the Province of Torino (Italy). J. Multicriteria Decis. Anal. 2011, 17, 63–84. [Google Scholar] [CrossRef]
- Salomon, V.; Montevechi, J. A compilation of comparisons on the analytic hierarchy process and others multiple criteria decision making methods: Some cases developed in Brazil. Anal. Hierarchy Process. Bern 2001, 413–420. [Google Scholar]
- Görener, A. Comparing AHP and ANP: An Application of Strategic Decisions Making in a Manufacturing Company. Int. J. Bus. Soc. Sci. 2012, 3, 194–208. [Google Scholar]
- Saaty, T.L.; Özdemir, M. The Encyclicon; a Dictionary of Applications of Decision Making with Dependence and Feedback based on the Analytic Network Process; RWS Publications, Ed.; RWS Publications: Pittsburgh, PA, USA, 2005. [Google Scholar]
- Yüksel, İ.; Dagˇdeviren, M. Using the analytic network process (ANP) in a SWOT analysis—A case study for a textile firm. Inf. Sci. 2007, 177, 3364–3382. [Google Scholar] [CrossRef]
- Meade, L.M.; Sarkis, J. Analyzing organizational project alternatives for agile manufacturing processes: An analytical network approach. Int. J. Prod. Res. 1999, 37, 241–261. [Google Scholar] [CrossRef]
- Saaty, T.L. A note on the AHP and expected value theory. Socioecon. Plan. Sci. 1986, 20, 397–398. [Google Scholar] [CrossRef]
- Ferretti, V. Verso la Valutazione Integrata di Scenari Strategici in Ambito Spaziale. I modelli MC-SDSS; CELID: Torino, Italy, 2012. [Google Scholar]
- Sharifi, M.A.; Rodriguez, E. Design and development of a planning support system for policy formulation in water resources rehabilitation: The case of Alcazar De San Juan District in Aquifer 23, La Mancha, Spain. J. Hydroinform. 2002, 4, 157–176. [Google Scholar]
- Ciurleo, M.; Calvello, M.; Cascini, L. Susceptibility zoning of shallow landslides in fine grained soils by statistical methods. Catena 2016, 139, 250–264. [Google Scholar] [CrossRef]
- Creative Decision Foundation, Superdecision. Available online: http://www.superdecisions.com/ (accessed on 2 October 2016).
- Zucca, A.; Sharifi, A.M.; Fabbri, A.G. Application of spatial multi-criteria analysis to site selection for a local park: A case study in the Bergamo Province, Italy. J. Environ. Manag. 2008, 88, 752–769. [Google Scholar] [CrossRef] [PubMed]
- Nekhay, O.; Arriaza, M.; Boerboom, L. Evaluation of soil erosion risk using Analytic Network Process and GIS: A case study from Spanish mountain olive plantations. J. Environ. Manag. 2009, 90, 3091–3104. [Google Scholar] [CrossRef] [PubMed]
- Geneletti, D. Impact assessment of proposed ski areas: A GIS approach integrating biological, physical and landscape indicators. Environ. Impact Assess. Rev. 2008, 28, 116–130. [Google Scholar] [CrossRef]
- Geneletti, D.; Abdullah, A. Spatial Decision Suppor t for Urban and Environmental Planning. A Collection of Case Studies; Arah Pendidikan SDN BHD: Balakong, Malaysia, 2009. [Google Scholar]
- Geneletti, D.; van Duren, I. Protected area zoning for conservation and use: A combination of spatial multicriteria and multiobjective evaluation. Landsc. Urban Plan. 2008, 85, 97–110. [Google Scholar] [CrossRef]
- Aragonés-Beltrán, P.; Pastor-Ferrando, J.P.; García-García, F.; Pascual-Agulló, A. An Analytic Network Process approach for siting a municipal solid waste plant in the Metropolitan Area of Valencia (Spain). J. Environ. Manag. 2010, 91, 1071–1086. [Google Scholar] [CrossRef] [PubMed]
- Zadeh, L.A. Fuzzy sets. Inf. Control 1965, 8, 338–353. [Google Scholar] [CrossRef]
- Shemshadi, A.; Toreihi, M.; Shirazi, H.; Tarokh, M. Supplier selection based on supplier risk: An ANP and fuzzy TOPSIS approach. J. Math. Comput. Sci. 2011, 2, 111–121. [Google Scholar]
Figure 1.
The system of the actors involved in the Italian water infrastructure system.
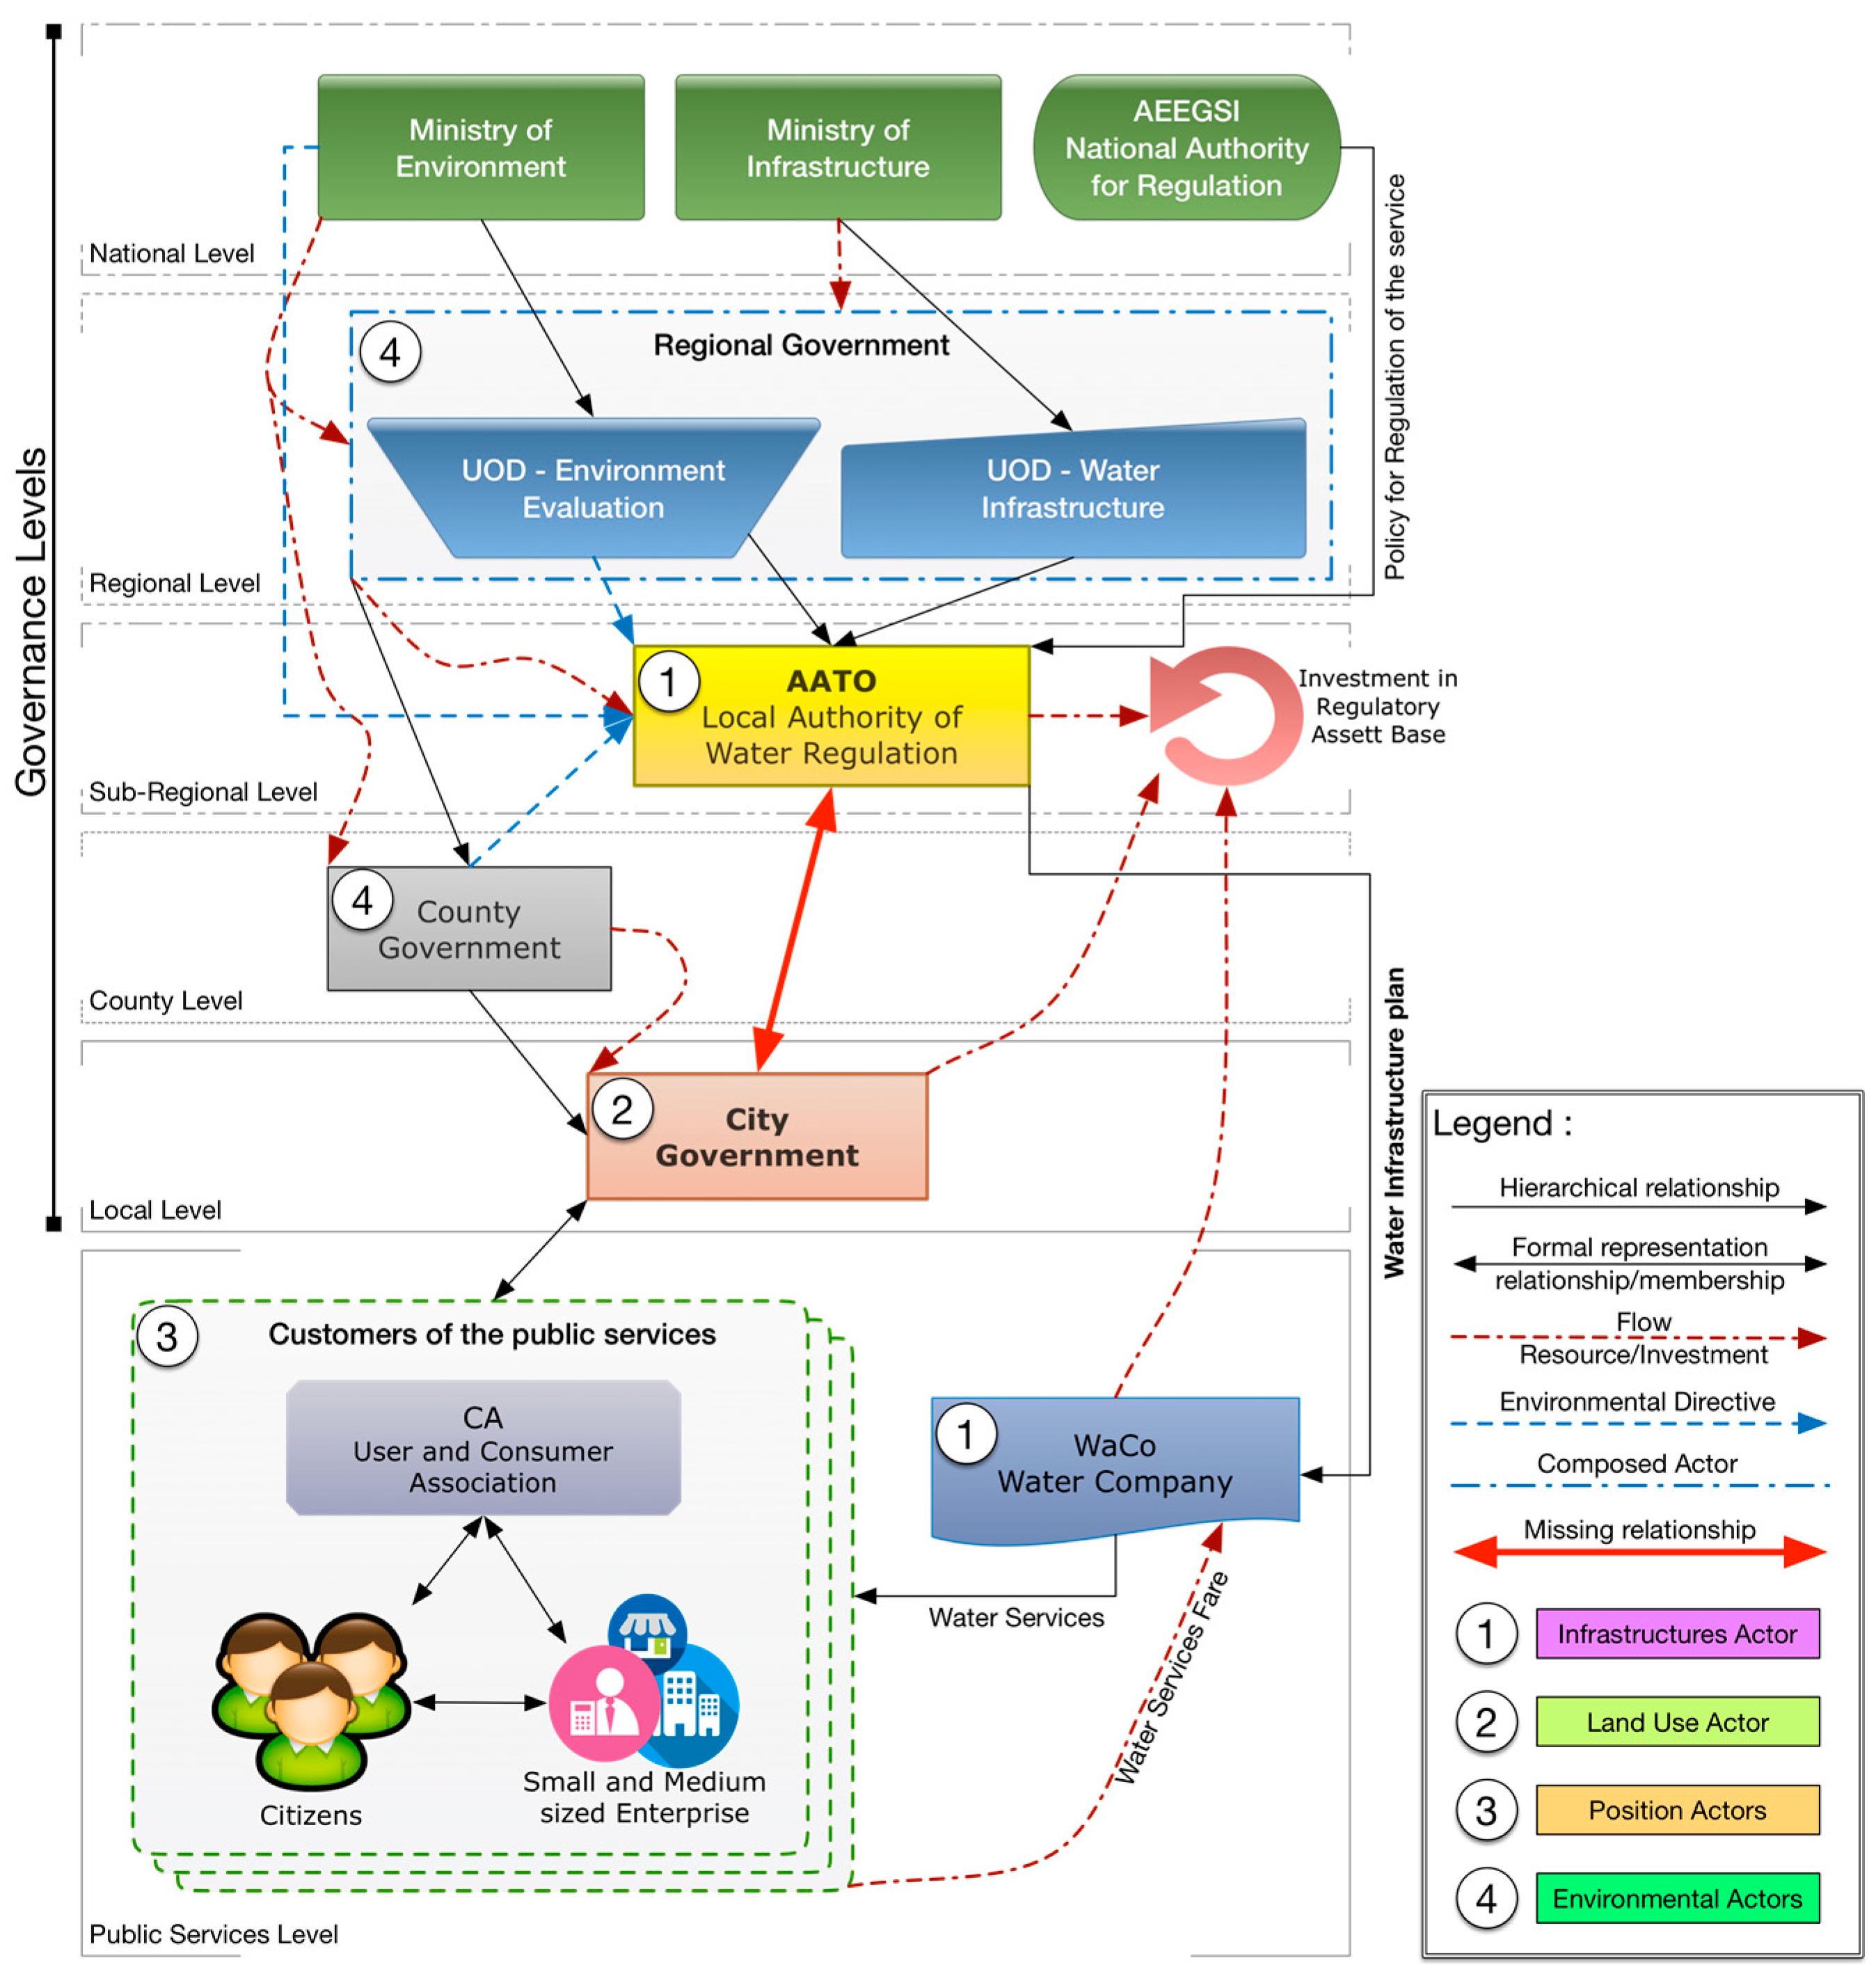
Figure 2.
The Italian planning system. In red are visible the missing links proposed with this study.
Figure 2.
The Italian planning system. In red are visible the missing links proposed with this study.

Figure 3.
Area of studies: (a) District of jurisdiction of Local Authority for Regulation of the Integrated Water System (AATO) (southern Italy); (b) City plan of Capriglia Irpina. Expansions area in overlay with sewer network.
Figure 3.
Area of studies: (a) District of jurisdiction of Local Authority for Regulation of the Integrated Water System (AATO) (southern Italy); (b) City plan of Capriglia Irpina. Expansions area in overlay with sewer network.
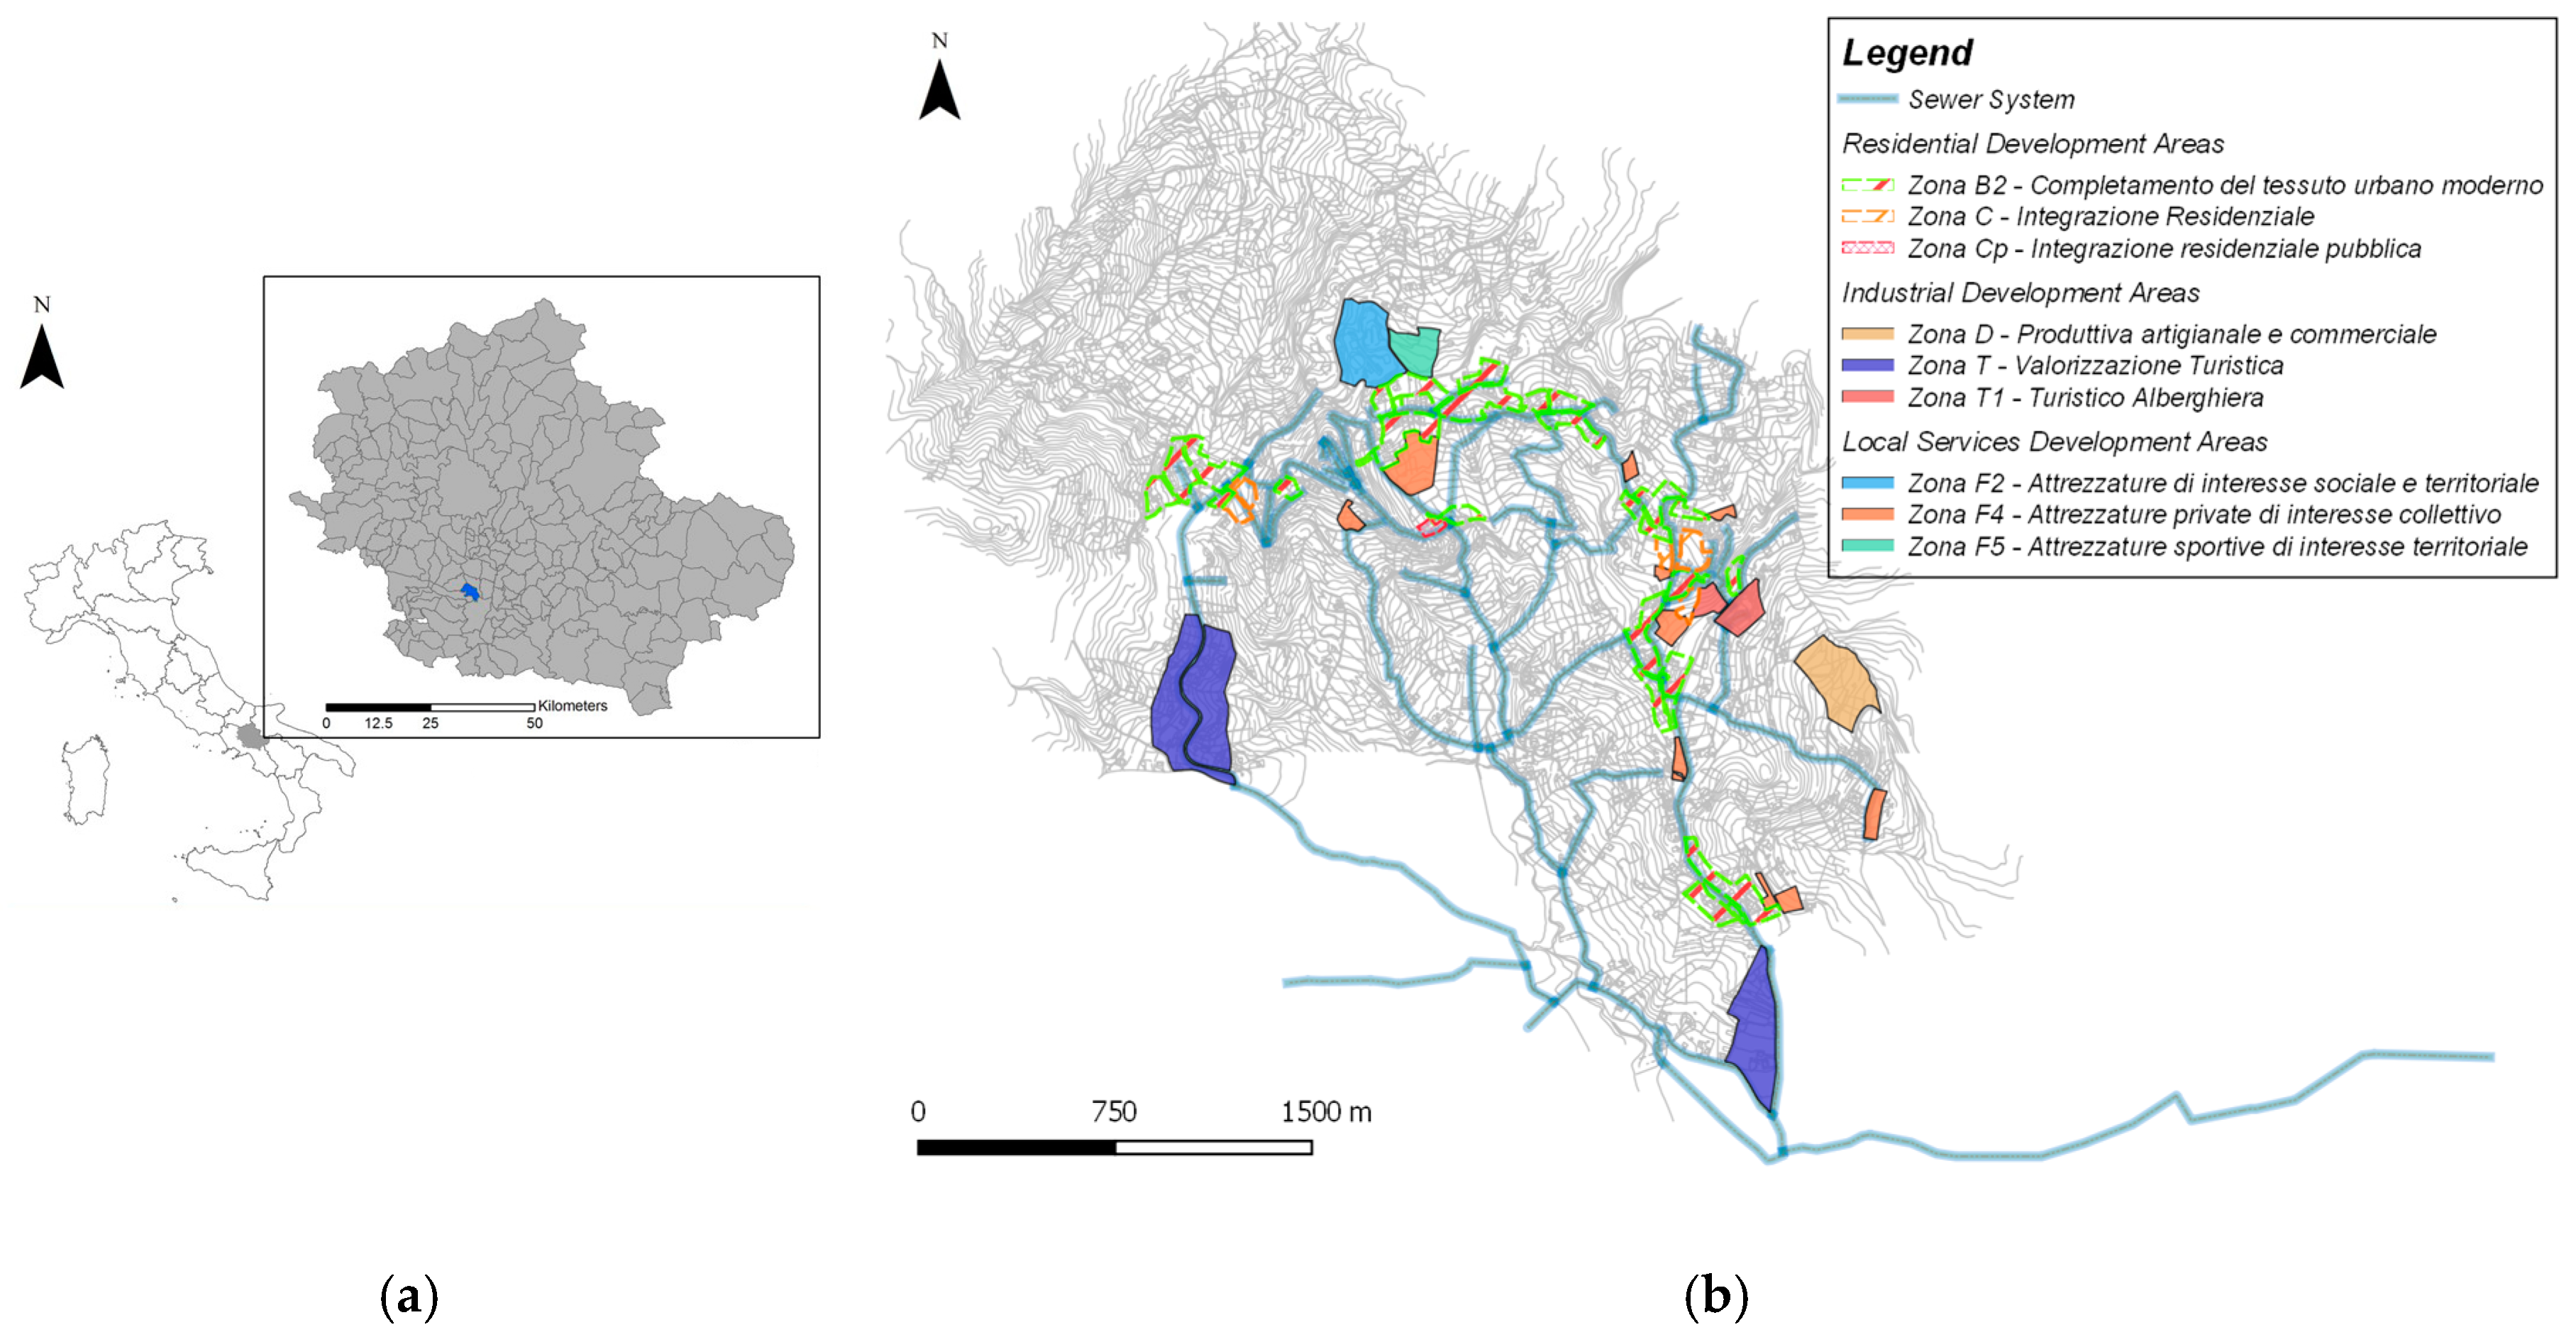
Figure 4.
Super weighted matrix and its convergence to a matrix whose columns, all the same, represent the vector of the priority between nodes [43].
Figure 4.
Super weighted matrix and its convergence to a matrix whose columns, all the same, represent the vector of the priority between nodes [43].

Figure 5.
Framework for spatial planning and decision-making process with analytic network process (ANP).
Figure 5.
Framework for spatial planning and decision-making process with analytic network process (ANP).
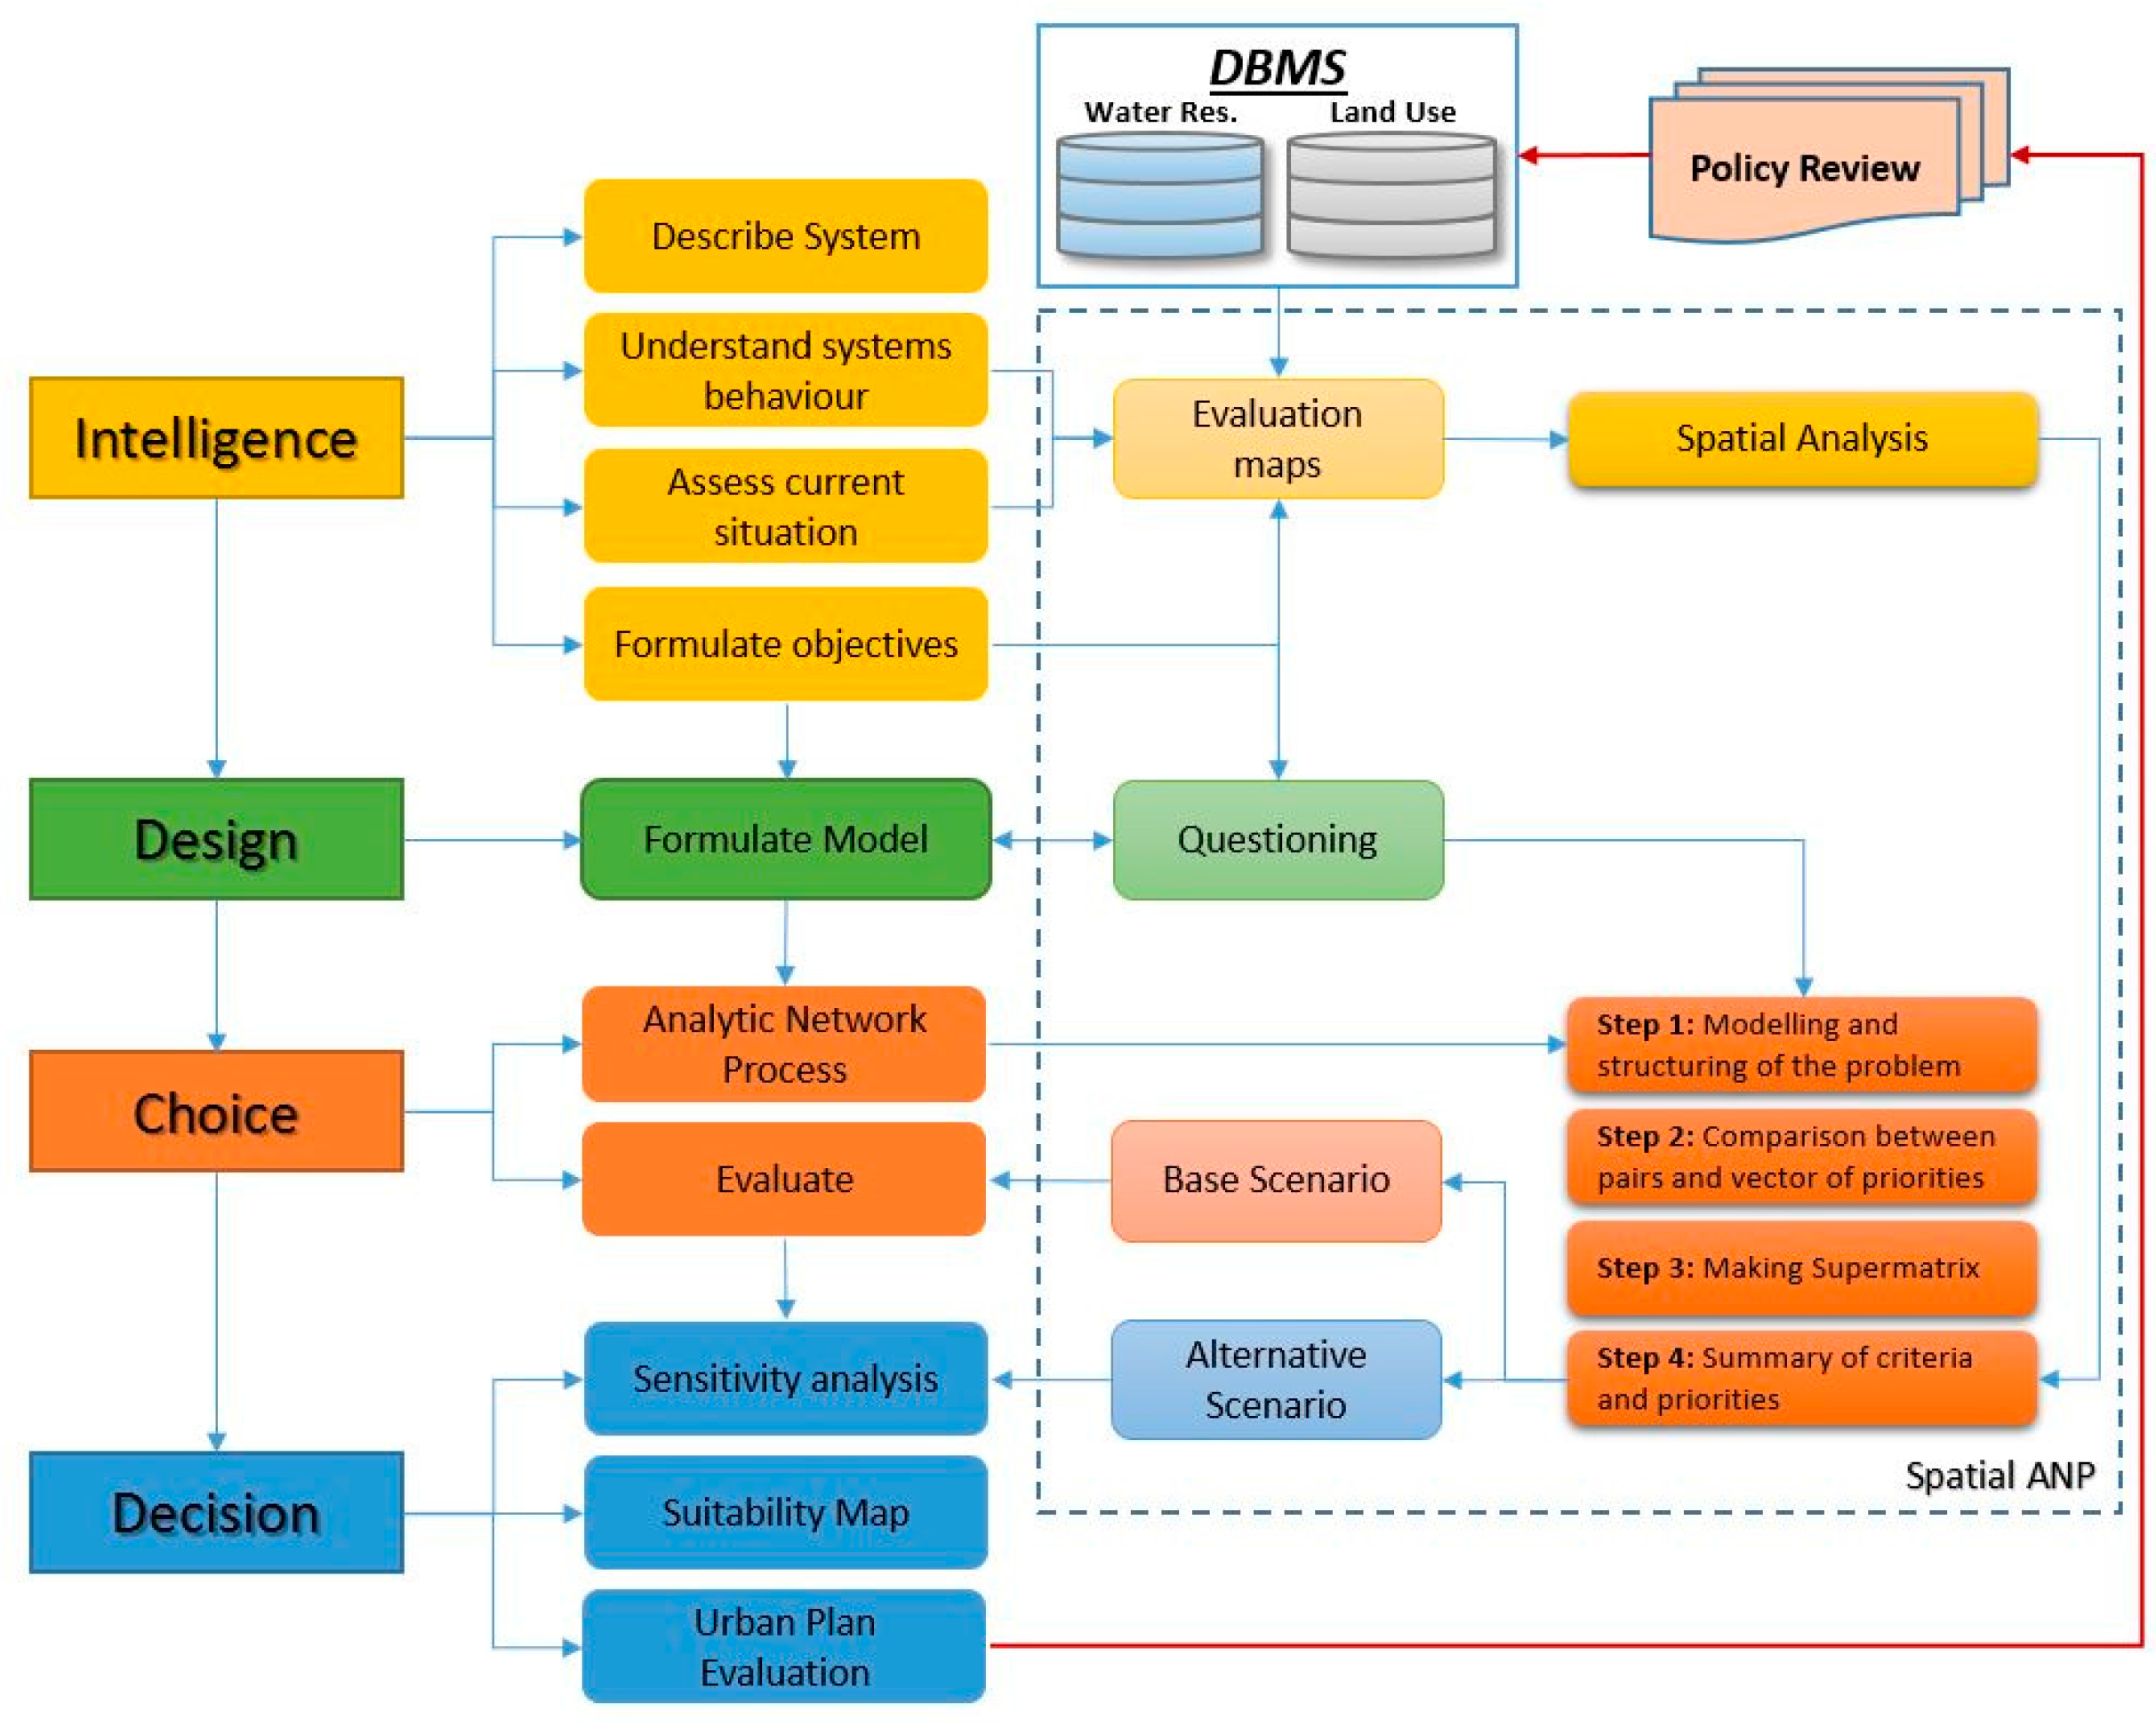
Figure 6.
The decisional network.
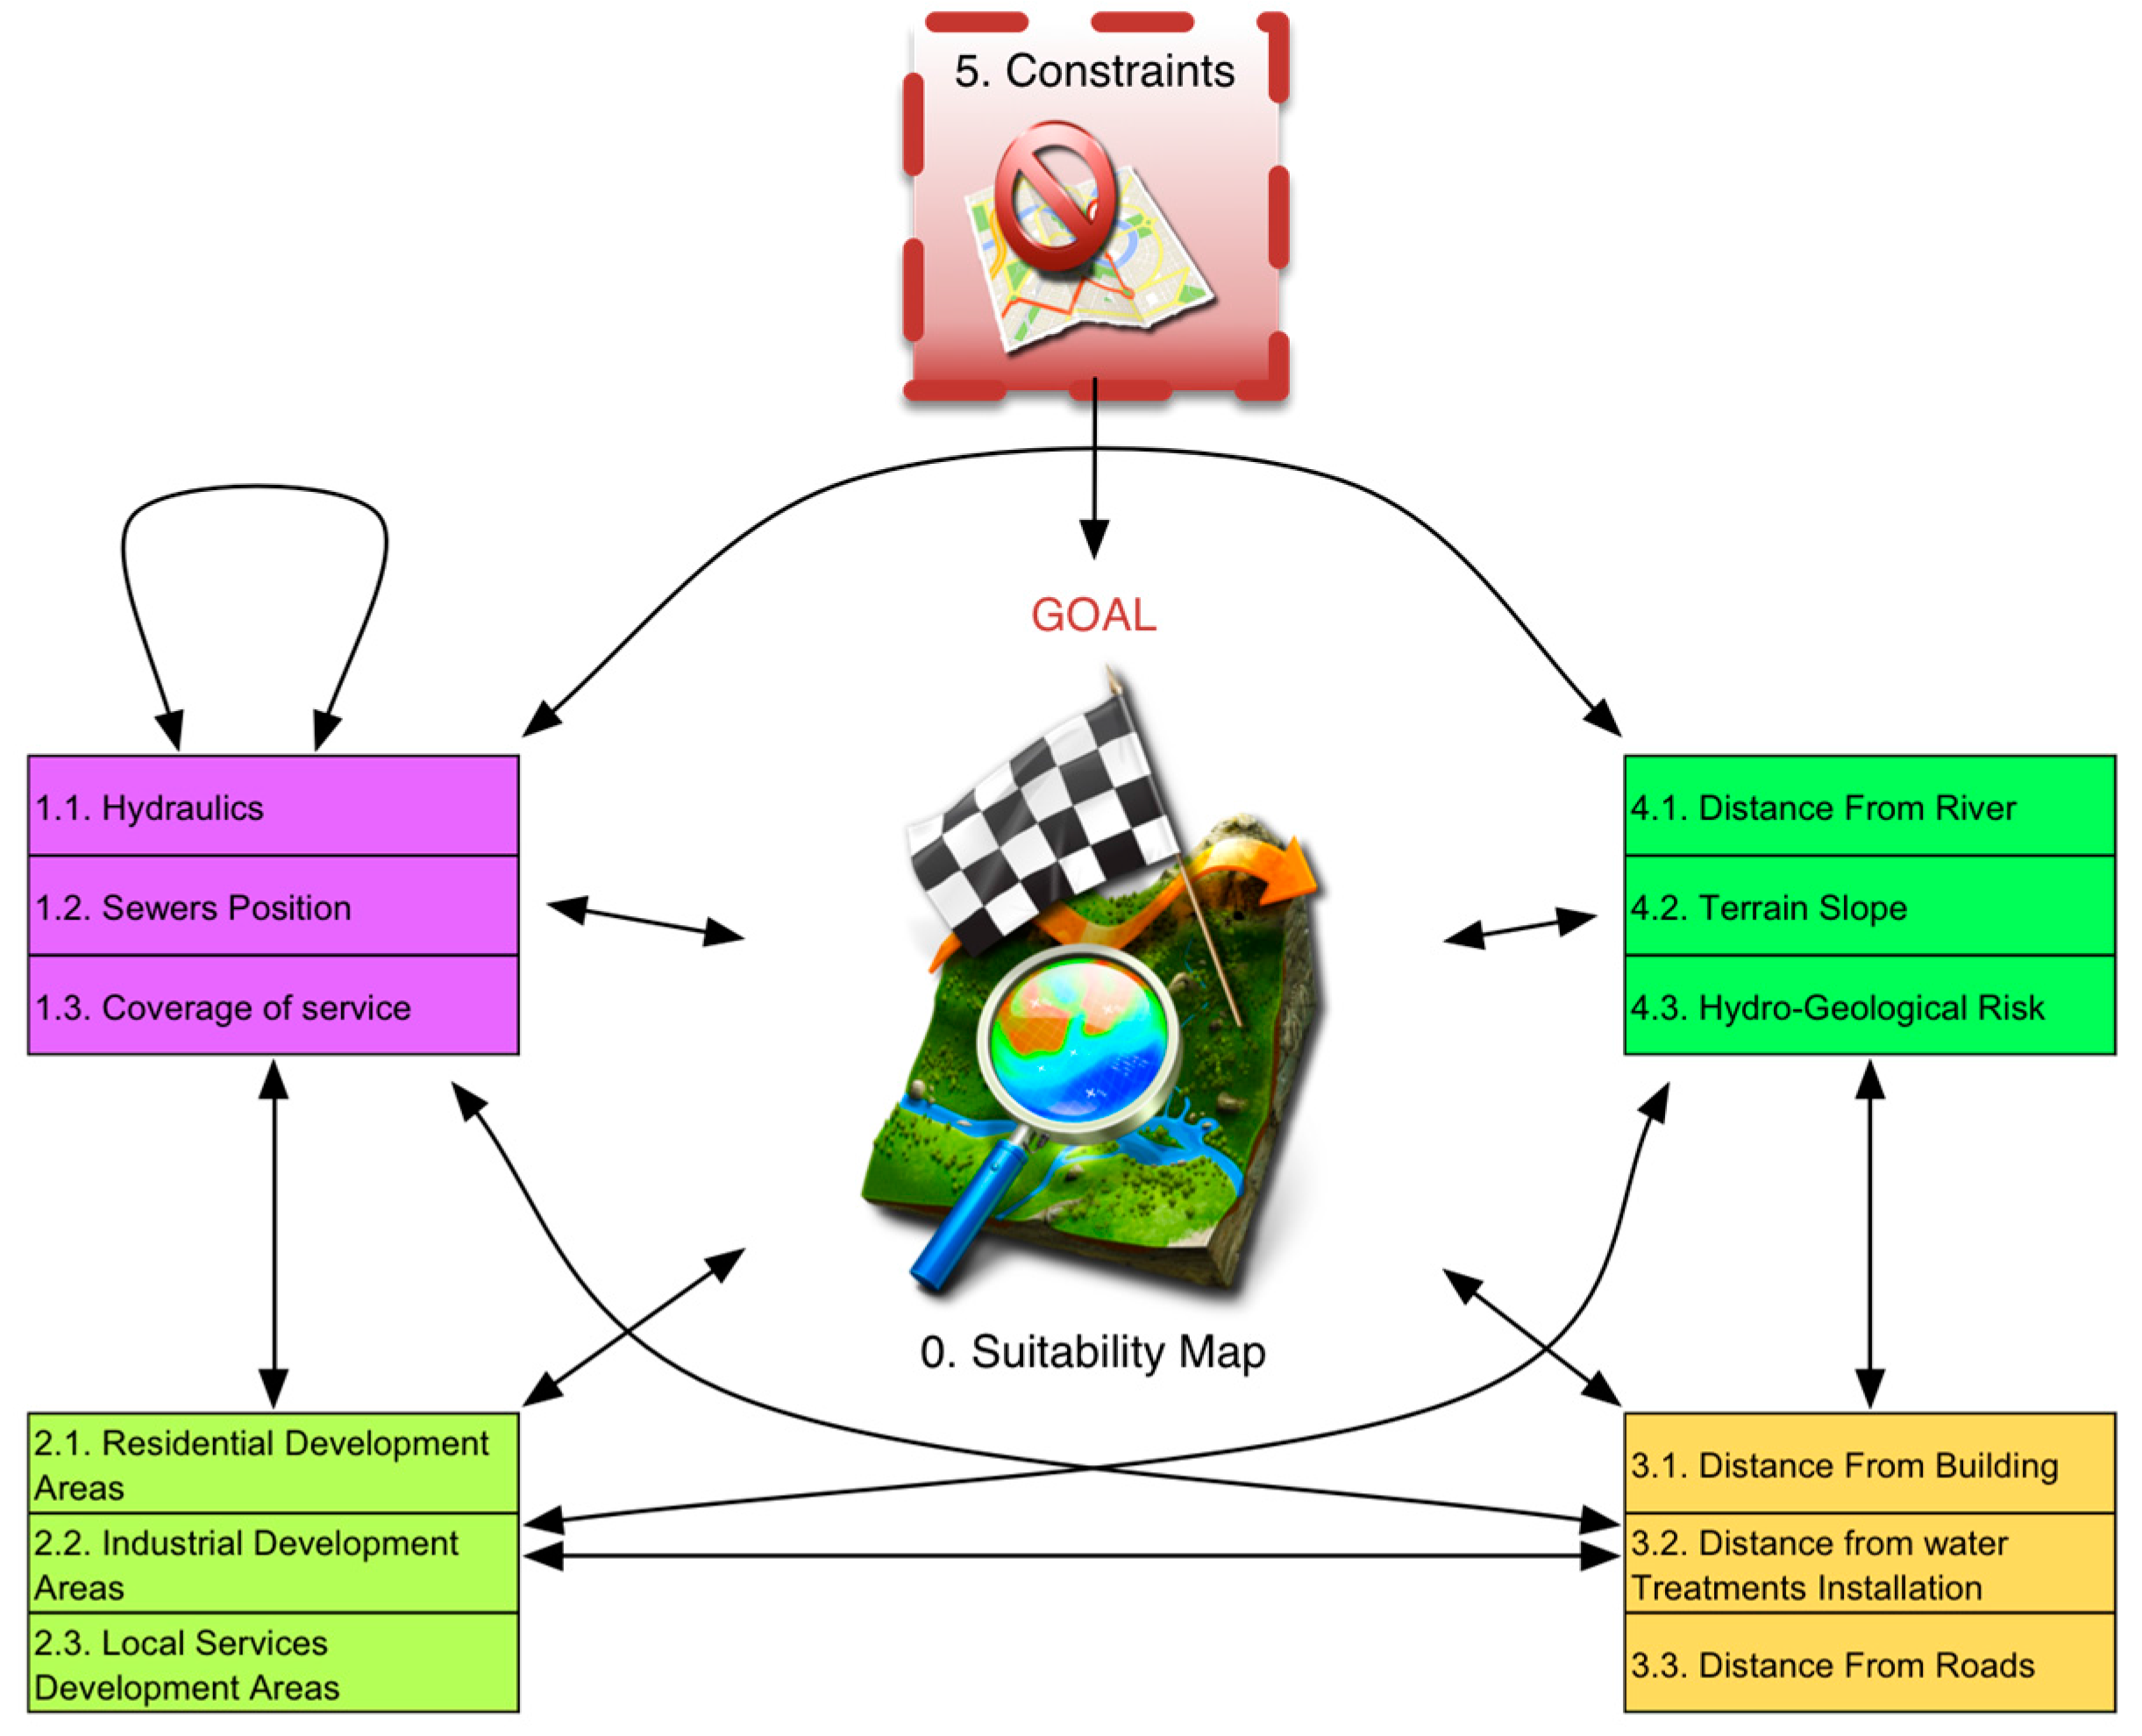
Figure 7.
The phase of comparison in pairs and the Saaty’s scale in the software Superdecision. (a) Comparison between related nodes; (b) Comparison between related clusters.
Figure 7.
The phase of comparison in pairs and the Saaty’s scale in the software Superdecision. (a) Comparison between related nodes; (b) Comparison between related clusters.
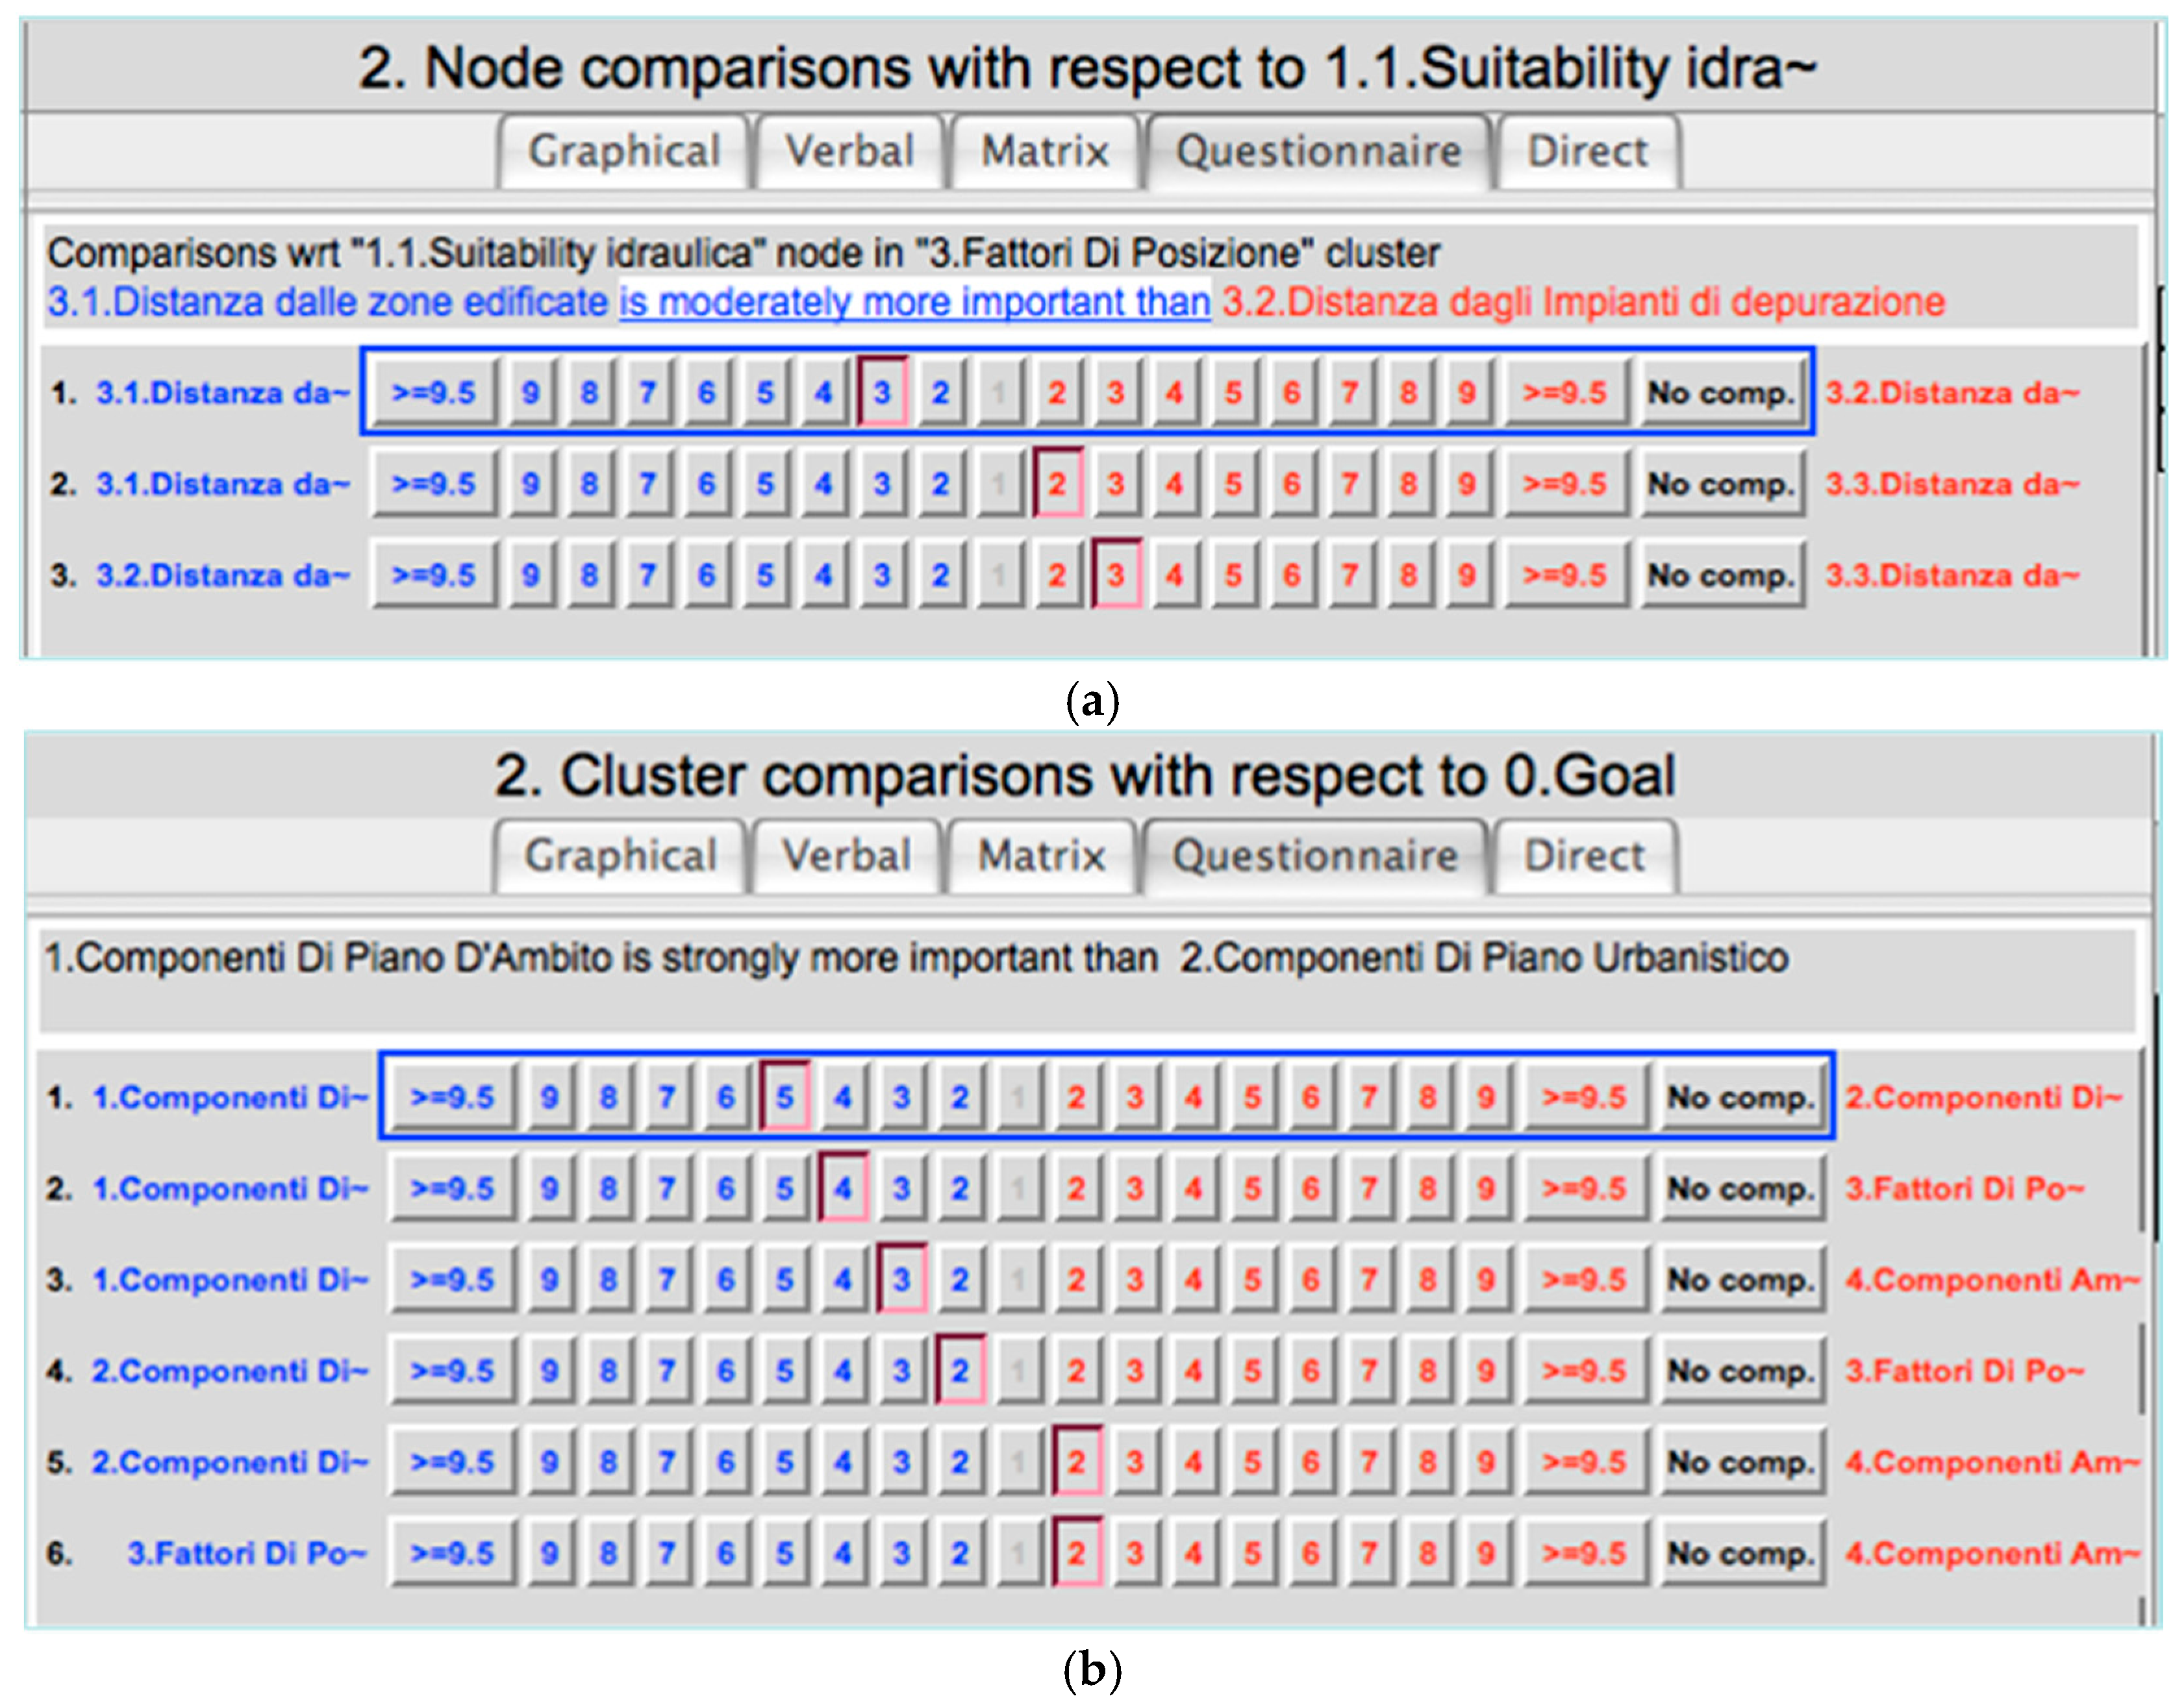
Figure 8.
Assembling spatial ANP results.

Figure 9.
Results of sensitivity analysis: (a) balanced scenario; (b) land use scenario.

Figure 10.
Results of sensitivity analysis: (a) positional scenario; (b) environmental scenario.

Figure 11.
Suitability map. High value means lower costs.

Figure 12.
City plan and suitability map overlay.

Figure 13.
Comparison of suitability map and city plan–industrial development area located in a low suitability area.
Figure 13.
Comparison of suitability map and city plan–industrial development area located in a low suitability area.
Figure 14.
Comparison of suitability map and city plan–area activities and services located in a low-suitability area.
Figure 14.
Comparison of suitability map and city plan–area activities and services located in a low-suitability area.
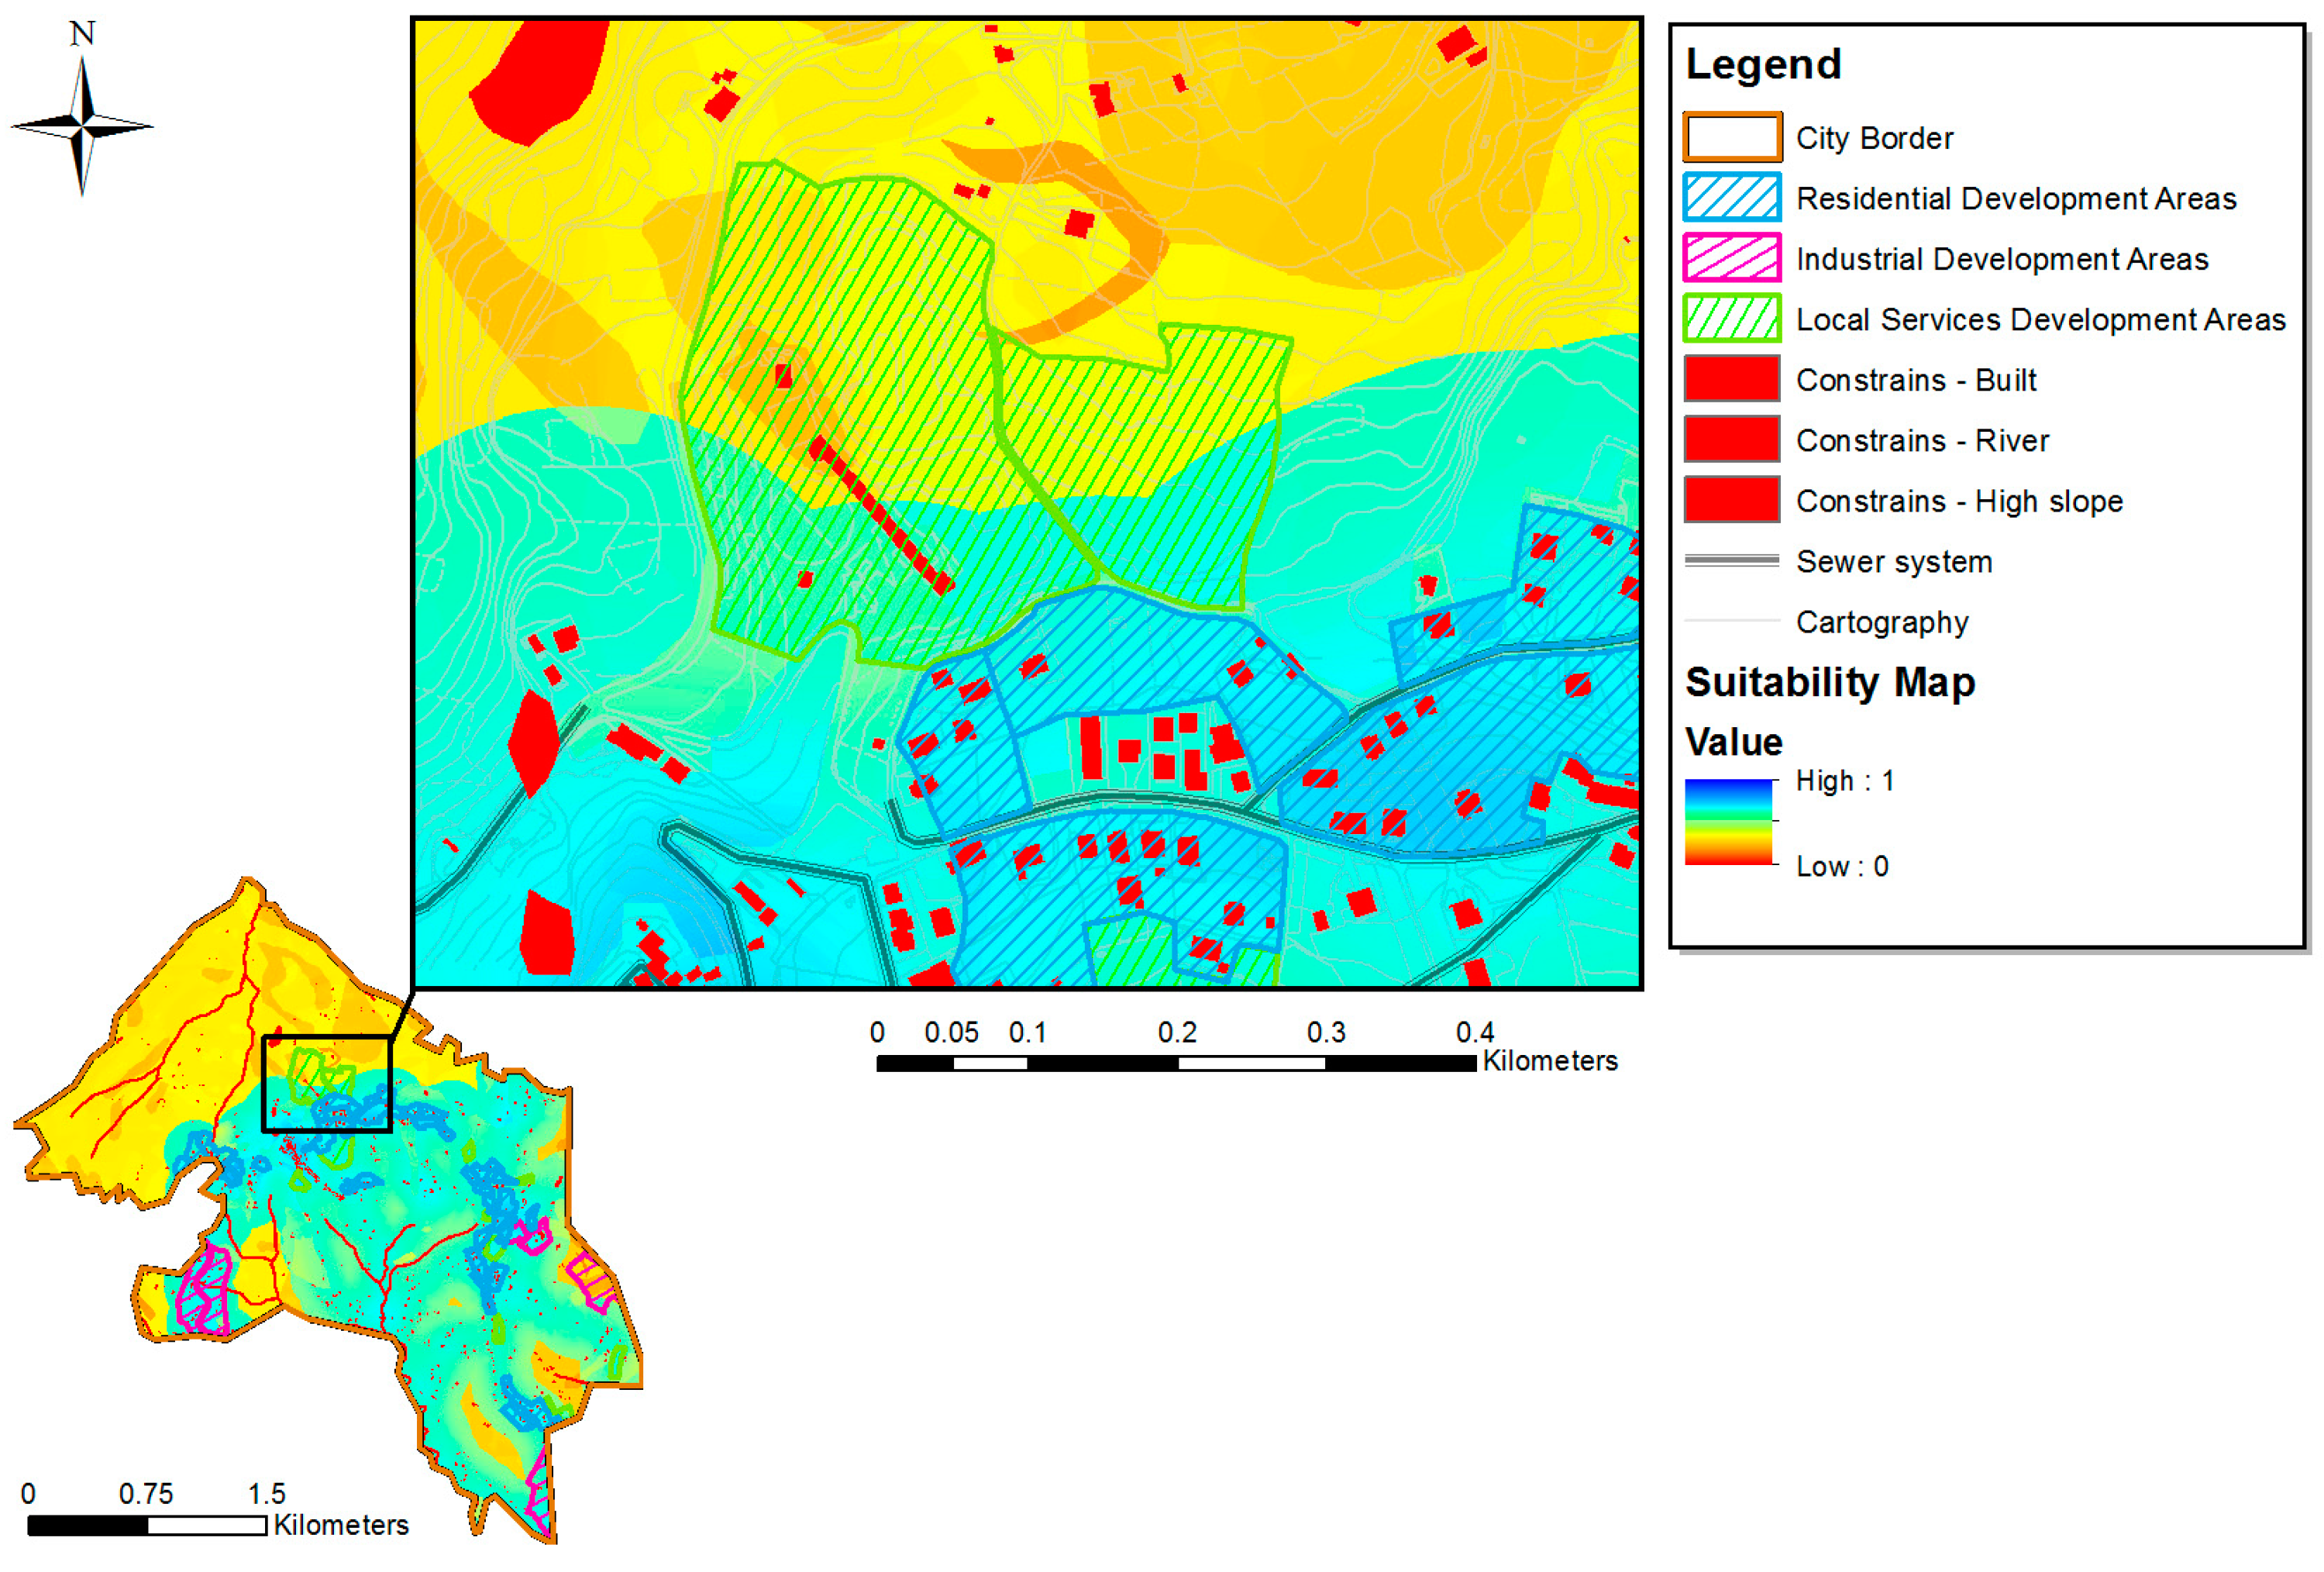
Table 1.
Evaluation Maps and system behavior.
| Decisional Cluster | Criteria | Description |
|---|---|---|
| Infrastructures | Hydraulics | This is a hydraulic suitability map that is based on the parameter “maximum distance of connection”, set at 200 m, and the actual hydraulic load on the network. The lower the value of the coefficient and suitability, the more the location is eligible to host new users or new network extensions. |
| In this map, for the values that tend to 1 there will be values that tend to 0 in the map of the general suitability, and vice versa; for values tending to 0 you will have suitability tending to infinity in the general map. | ||
| For values of distance greater than 200 m, we set the values map equal to null, which will subsequently be reclassified to 0 before grouping maps as to general suitability. | ||
| Sewers position | This is a suitability map of location, which provides the “network density factor” of the whole territory. The higher the value of the coefficient of suitability, the more the location is suitable to host new users and new network extensions. For values tending to 0, the general suitability tends to 0. | |
| Coverage of service | This is a suitability map for service coverage, which provides spatial analysis of the network and of the population at the census level. The lower the value of the coefficient of suitability, the more the location is suitable to host new users and new network extensions. For values equal to 1 the general suitability is 0, and for values tending to 0, general suitability tends to infinity. | |
| Land use | Residential development areas | This map that represents the service demand associated with each residential Development area planned by the City Plan. |
| Industrial development area | This map represents the service demand associated with each Industrial Development area planned by the City Plan. | |
| Local services development areas | This map represents the service demand associated with each Local Services Development area planned by the City Plan. | |
| Position | Distance from building | This map contains values of distance from the buildings associated to each cell. The settlement of a new user or a new network is more likely the closer it is to the existing buildings. The shorter the distance, the more the location is suitable to host new users and new network extensions. |
| Distance from water Treatments Installation | This map contains the value of the minimum “cost distance” from the cell to the nearest treatment plant, calculated along the existing network. The settlement of a new user or a new network is much more likely the closer the user is to existing wastewater treatment plants. The shorter the “cost distance,” the more the location is suitable to host new users and new network extensions. | |
| Distance from roads | This map contains the values of distance from roads associated with each cell. The settlement of a new user or a new network is more likely the closer the road is. The shorter the distance, the greater the suitability of the point to hosting a new user or network extension. | |
| Environment | Distance from rivers | This map contains values of distance from surface water bodies associated with each cell. The settlement of a new user or a new network is evaluated positively farther to superficial hydrography. The longer the distance the greater the suitability of the point to hosting a new user or network extensions. |
| Terrain slope | This map that contains maximum gradient values in the neighborhood of the considered cell. The settlement of a new user or a new network is evaluated positively as compatible with a reasonable range of slopes, both from the hydraulic point of view and from the point of view of urban settlement. Generally, the lower a slope the greater the suitability of the point is to hosting a new user or network extension. There is a specific classification table for the values of slope vs. suitability. | |
| Hydro-geological risk | This map contains values for hydrogeological risk in each area as identified by the master plan. The settlement of a new user or a new network is evaluated positively with low hydrogeological risk values. Generally, the lower the hydrogeological risk, the greater the suitability of the point in hosting a new user or network extensions. There is a specific classification table for the values of hydrogeological risk vs. suitability. |
Table 2.
Questioning the model goal according each criteria’s solution.
| Cluster | Node | Where to Host New Users or Expand the Sewer’s Network? |
|---|---|---|
| 1—Infrastructures | 1.1—Hydraulics | Where it is already present a sewer system but the same is under-utilized. |
| 1.2—Sewers Position | Where it already has a sewer system or where the network of services is more concentrated. | |
| 1.3—Coverage of service | Where required by the City Plan, with greater regard to the presence of the existing sewer system even in the condition that the value of the current service coverage is already high, or higher than the target of the Water Infrastructure Plan | |
| 2—Land Use | 2.1—Residential Development Areas | In areas of completion and expansion planned by the City Plan. |
| 2.2—Industrial Development Area | In areas of completion and expansion of production provided by the City Plan. | |
| 2.3—Local Services Development Areas | In areas of completion and expansion of equipment and services provided by the City Plan. | |
| 3—Position | 3.1—Distance From Building | Closer to the buildings in the area, both within and among the non-served and served (new users in the same building). |
| 3.2—Distance from water Treatments Installation | Much closer to the existing wastewater treatment plants in terms of distance on network (cost function). | |
| 3.3—Distance From Roads | Closer to the roads in the area. | |
| 4—Environment | 4.1—Distance From River | More distant from the rivers present in the territory. |
| 4.2—Terrain Slope | In areas where the slope of the terrain can be compatible both with the development of new urban fabric, both with gradients necessary, from the hydraulic point of view, to the sewers network. | |
| 4.3—Hydro-Geological Risk | In areas where the risk hydrogeological can be compatible both with the development of new urban fabric and for receiving new user or network expansion. |
Table 3.
Questioning the model goal according to constrains.
| Cluster | Node | Where Is Not Possible to Host New Users or Expand the Sewer’s Network? |
|---|---|---|
| 5—Constrains | 5.1—Map of Buildings | The area occupied by old buildings is excluded for the expansion of the sewer’s network; Suitability is equal 0 on these areas otherwise 1. |
| 5.2—Map of maximum slope | The area with very-high slope is excluded for the expansion of the sewer’s network; Suitability is equal 0 on these areas otherwise 1. | |
| 5.3—Map of hydraulics constrains | The buffer area of 10m from river is excluded for the expansion of the sewer’s network; Suitability is equal 0 on these areas otherwise 1. |
Table 4.
Base Domains of Evaluation Maps, Impact on suitability and Reclassified Domains.
| Evaluating Map | Base Domain | Impact on Suitability Map | Reclassified Domain | |||
|---|---|---|---|---|---|---|
| Min | Max | Negative | Positive | Min | Max | |
| 1.1—Hydraulics | 0 | 1 | High | Low | 1 | 0 |
| 1.2—Sewers position | 0 | ∞ | Low | High | 0 | 1 |
| 1.3—Coverage of service | 0 | 1 | High | Low | 1 | 0 |
| 2.1—Residential development areas | 0 | 1 | Low | High | 0 | 1 |
| 2.2—Industrial development areas | 0 | 1 | Low | High | 0 | 1 |
| 2.3—Local services development areas | 0 | 1 | Low | High | 0 | 1 |
| 3.1—Distance from building | 0 | ∞ | High | Low | 1 | 0 |
| 3.2—Distance from water treatment Installation | 0 | ∞ | High | Low | 1 | 0 |
| 3.3—Distance from roads | 0 | ∞ | High | Low | 1 | 0 |
| 4.1—Distance from river | 0 | ∞ | High | Low | 0 | 1 |
| 4.2—Terrain slope | 0 | 5 | Low | High | 0 | 1 |
| 4.3—Hydro-Geological Risk | 0 | 4 | High | Low | 1 | 0 |
| Suitability Map | Low | High | 0 | 1 | ||
Table 5.
Clusters matrix.
| Cluster | 0—Goal | 1—Infrastructure | 2—Land Use | 3—Position | 4—Environment |
|---|---|---|---|---|---|
| 0—Goal | 0.000 | 0.000 | 0.000 | 0.000 | 0.000 |
| 1—Infrastructures | 0.553 | 0.477 | 0.333 | 0.333 | 0.709 |
| 2—Land Use | 0.135 | 0.174 | 0.000 | 0.140 | 0.179 |
| 3—Position | 0.101 | 0.080 | 0.140 | 0.000 | 0.113 |
| 4—Environment | 0.212 | 0.270 | 0.528 | 0.528 | 0.000 |
Table 6.
The vector of priority/weight between clusters and nodes.
| Cluster | Cluster’s Weight | Node | Nodes’ Weight | |
|---|---|---|---|---|
| Normalized by Cluster | Normalized by the Whole Model | |||
| 1—Infrastructures | 0.552873 | 1.1—Hydraulics | 0.47196 | 0.237470 |
| 1.2—Sewers Position | 0.39747 | 0.199987 | ||
| 1.3—Coverage of service | 0.13057 | 0.065699 | ||
| 2—Land Use | 0.134881 | 2.1—Residential Development Areas | 0.54844 | 0.080404 |
| 2.2—Industrial Development Area | 0.15772 | 0.023123 | ||
| 2.3—Local Services Development Areas | 0.29384 | 0.043079 | ||
| 3—Position | 0.100604 | 3.1—Distance From Building | 0.39095 | 0.035102 |
| 3.2—Distance from water treatment installation. | 0.13118 | 0.011778 | ||
| 3.3—Distance From Roads | 0.47788 | 0.042907 | ||
| 4—Environment | 0.211642 | 4.1—Distance From River | 0.17564 | 0.045746 |
| 4.2—Terrain Slope | 0.19664 | 0.051215 | ||
| 4.3—Hydro-Geological Risk | 0.62772 | 0.163491 | ||
Table 7.
Sensitivity analysis. Weight of the Clusters in different scenarios.
| Scenarios | Weights of Clusters | |||
|---|---|---|---|---|
| 1—Infrastructures | 2—Land Use | 3—Position | 4—Environment | |
| Balanced | 0.25 | 0.25 | 0.25 | 0.25 |
| Land Use | 0.15 | 0.55 | 0.15 | 0.15 |
| Positional | 0.15 | 0.15 | 0.55 | 0.15 |
| Environmental | 0.15 | 0.15 | 0.15 | 0.55 |
© 2017 by the authors. Licensee MDPI, Basel, Switzerland. This article is an open access article distributed under the terms and conditions of the Creative Commons Attribution (CC BY) license (http://creativecommons.org/licenses/by/4.0/).
Share and Cite
MDPI and ACS Style
Grimaldi, M.; Pellecchia, V.; Fasolino, I. Urban Plan and Water Infrastructures Planning: A Methodology Based on Spatial ANP. Sustainability 2017, 9, 771. https://doi.org/10.3390/su9050771
AMA Style
Grimaldi M, Pellecchia V, Fasolino I. Urban Plan and Water Infrastructures Planning: A Methodology Based on Spatial ANP. Sustainability. 2017; 9(5):771. https://doi.org/10.3390/su9050771
Chicago/Turabian StyleGrimaldi, Michele, Vincenzo Pellecchia, and Isidoro Fasolino. 2017. "Urban Plan and Water Infrastructures Planning: A Methodology Based on Spatial ANP" Sustainability 9, no. 5: 771. https://doi.org/10.3390/su9050771
Note that from the first issue of 2016, this journal uses article numbers instead of page numbers. See further details here.