
Evaluating the Significance of Criteria Contributing to Decision-Making on Brownfield Land Redevelopment Strategies in Urban Areas

 ,
,
Abstract
:1. Introduction
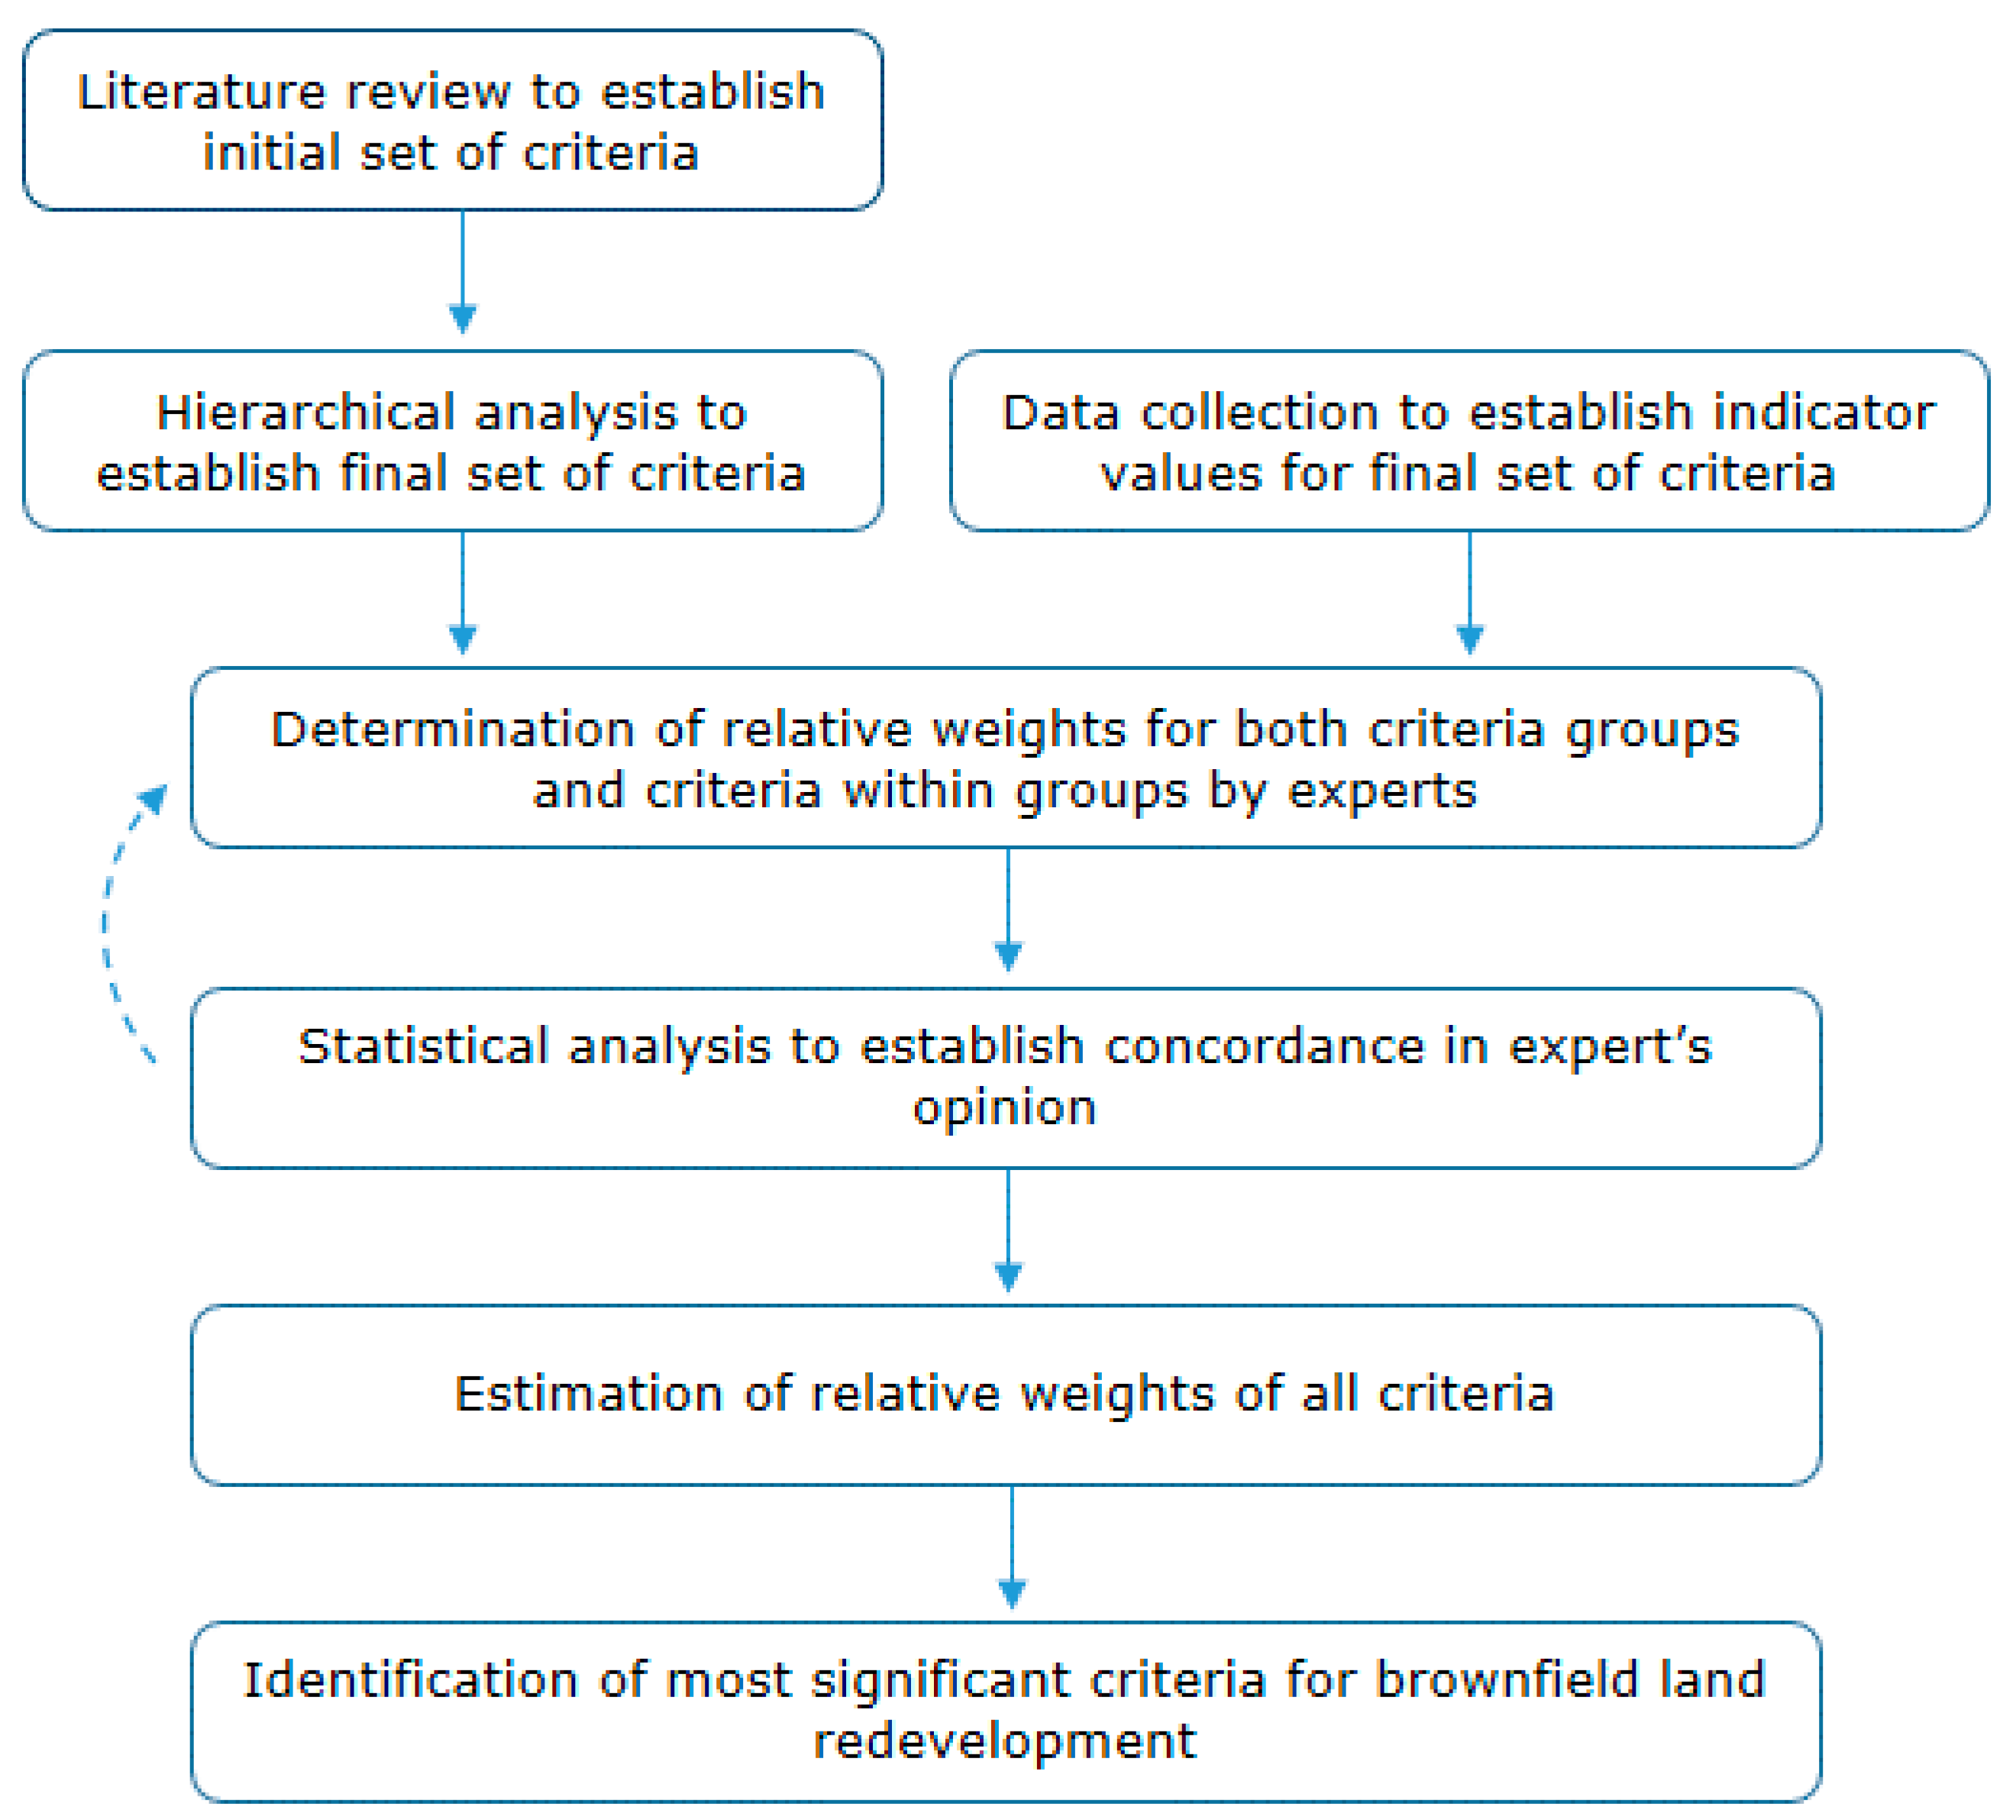
2. Methodology
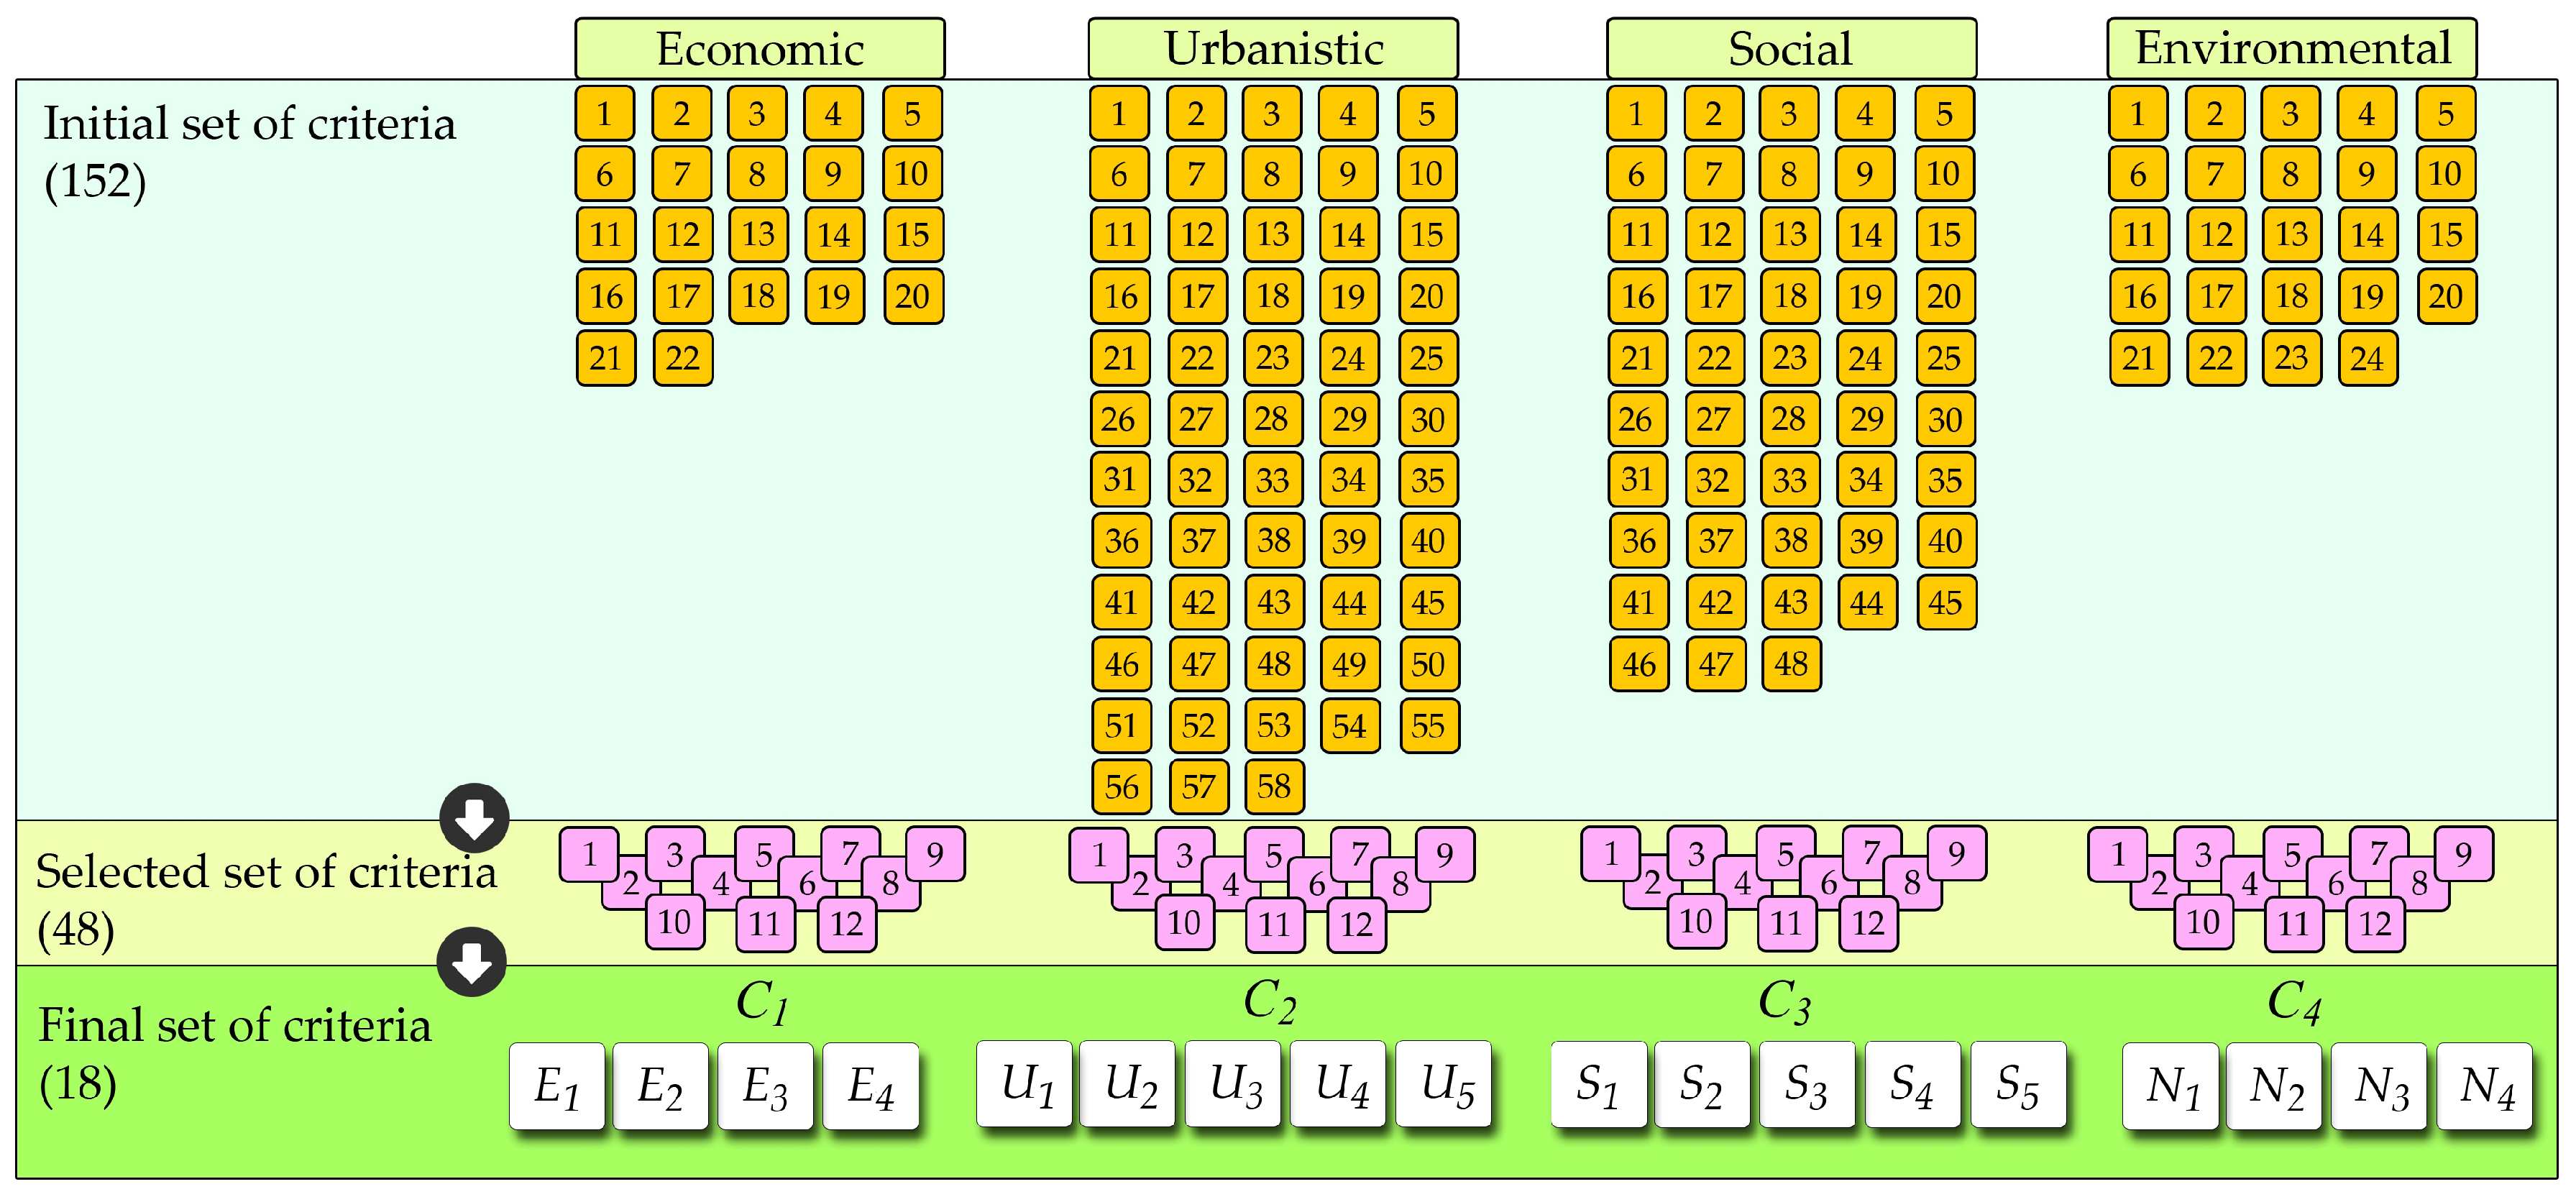
2.1. Hierarchical System of Criteria
2.2. Data Collection
2.3. Relative Weights of Criteria
2.4. Non-Parametric Statistical Analysis
3. Results
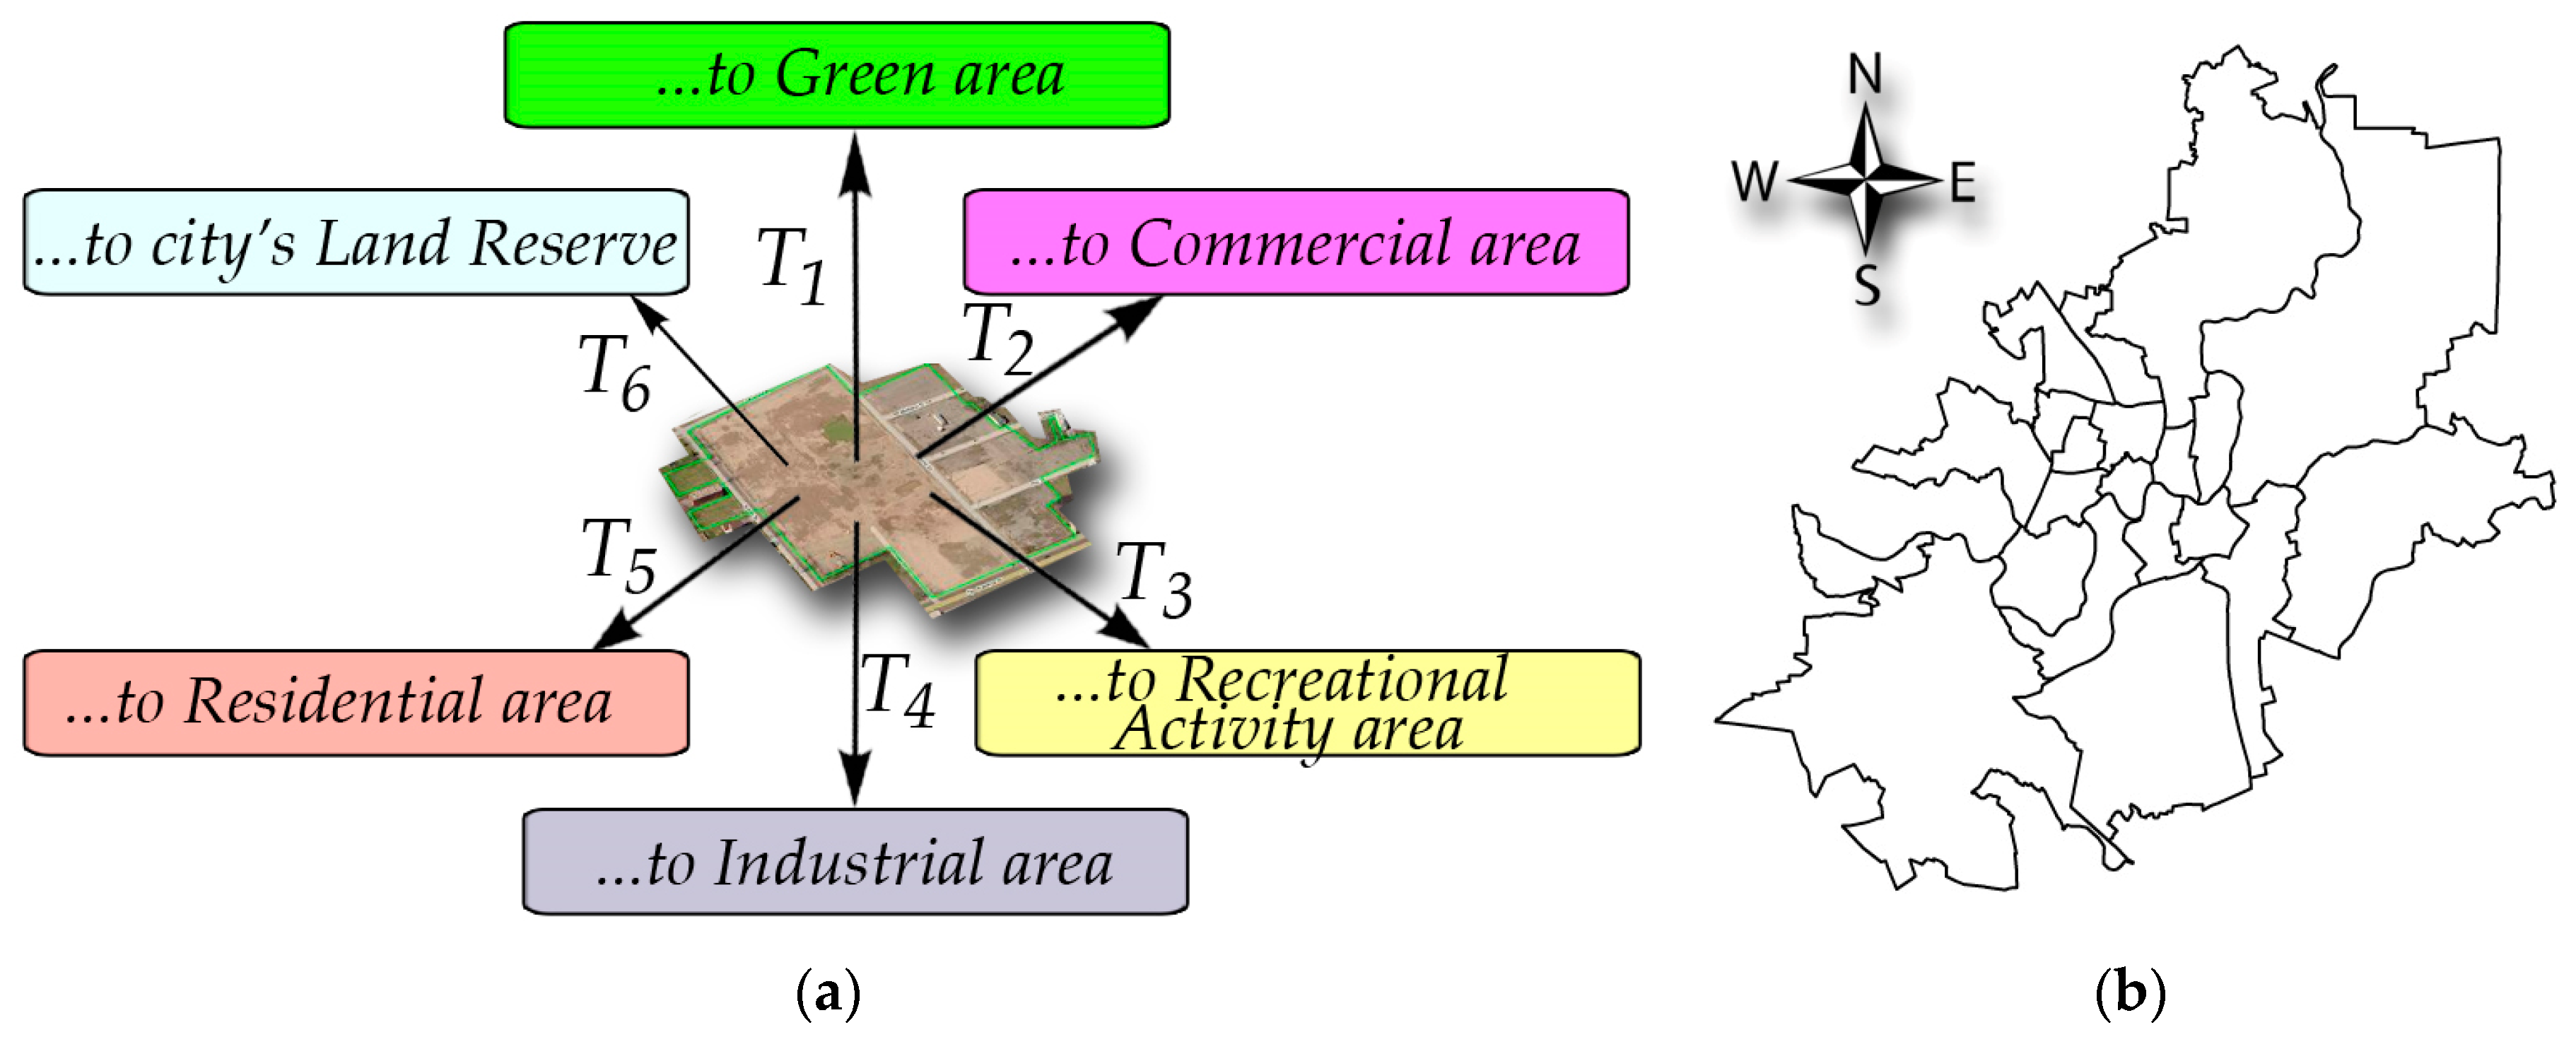
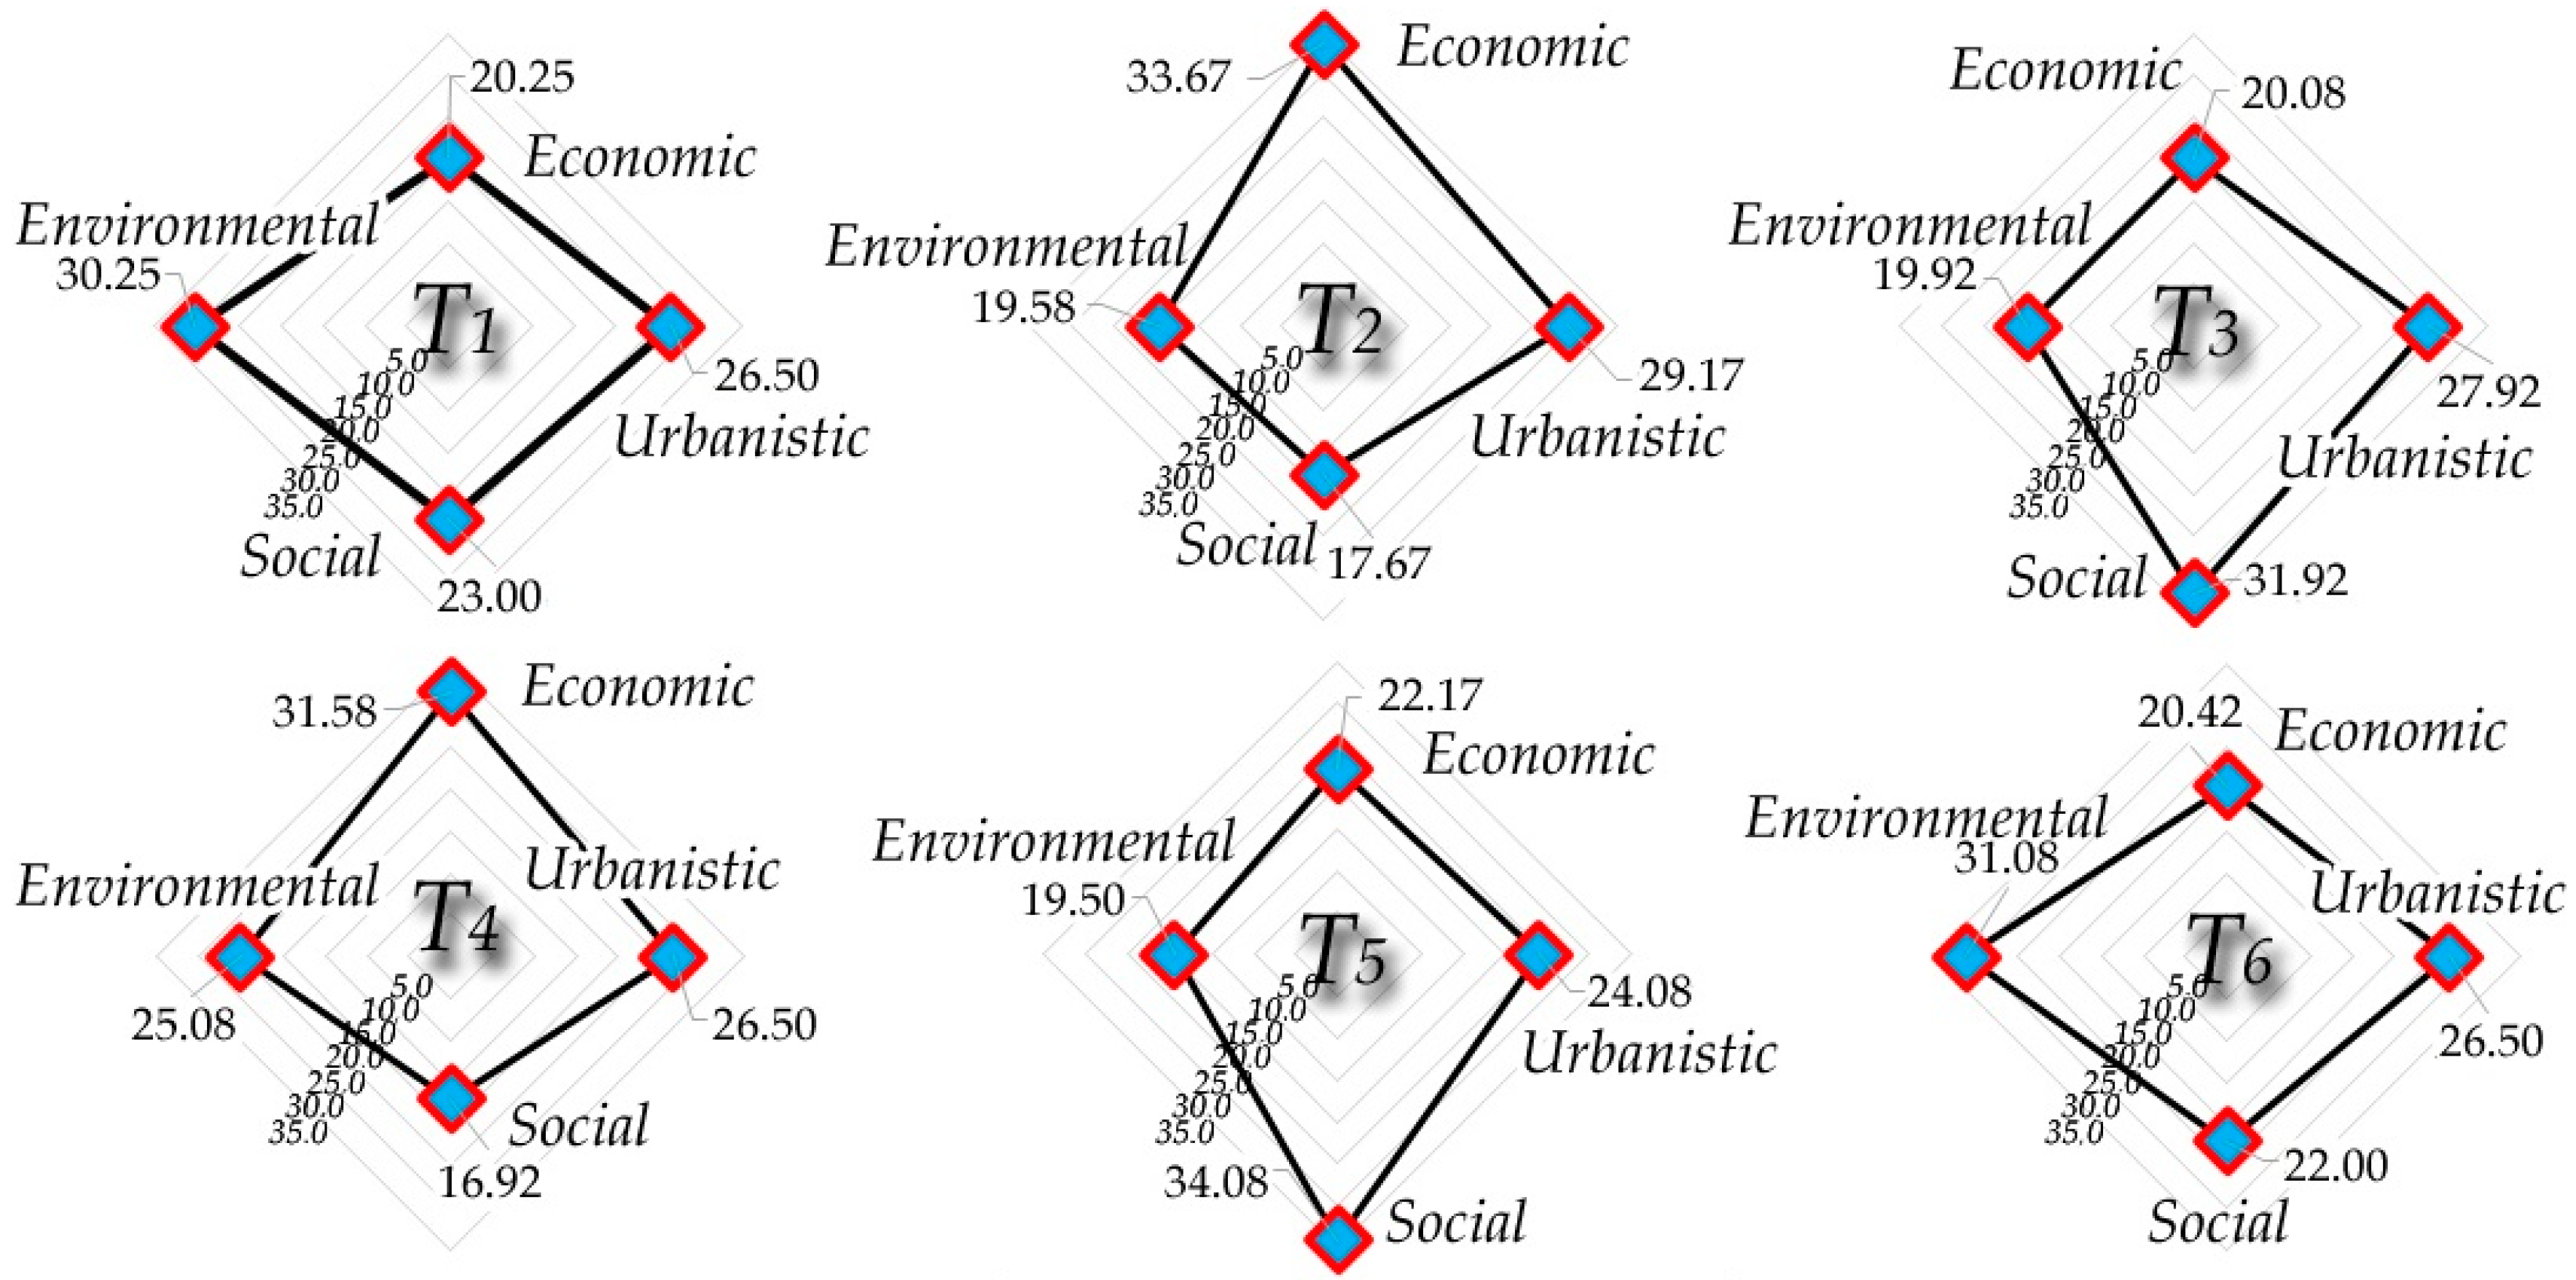
3.1. Brownfield Land Redevelopment Scenarios
- redevelopment to a green area (T1);
- redevelopment to a commercial area (T2);
- redevelopment to a recreational area (T3);
- redevelopment to an industrial area (T4);
- redevelopment to a residential area (T5); and
- leaving land as a city reserve (T6).
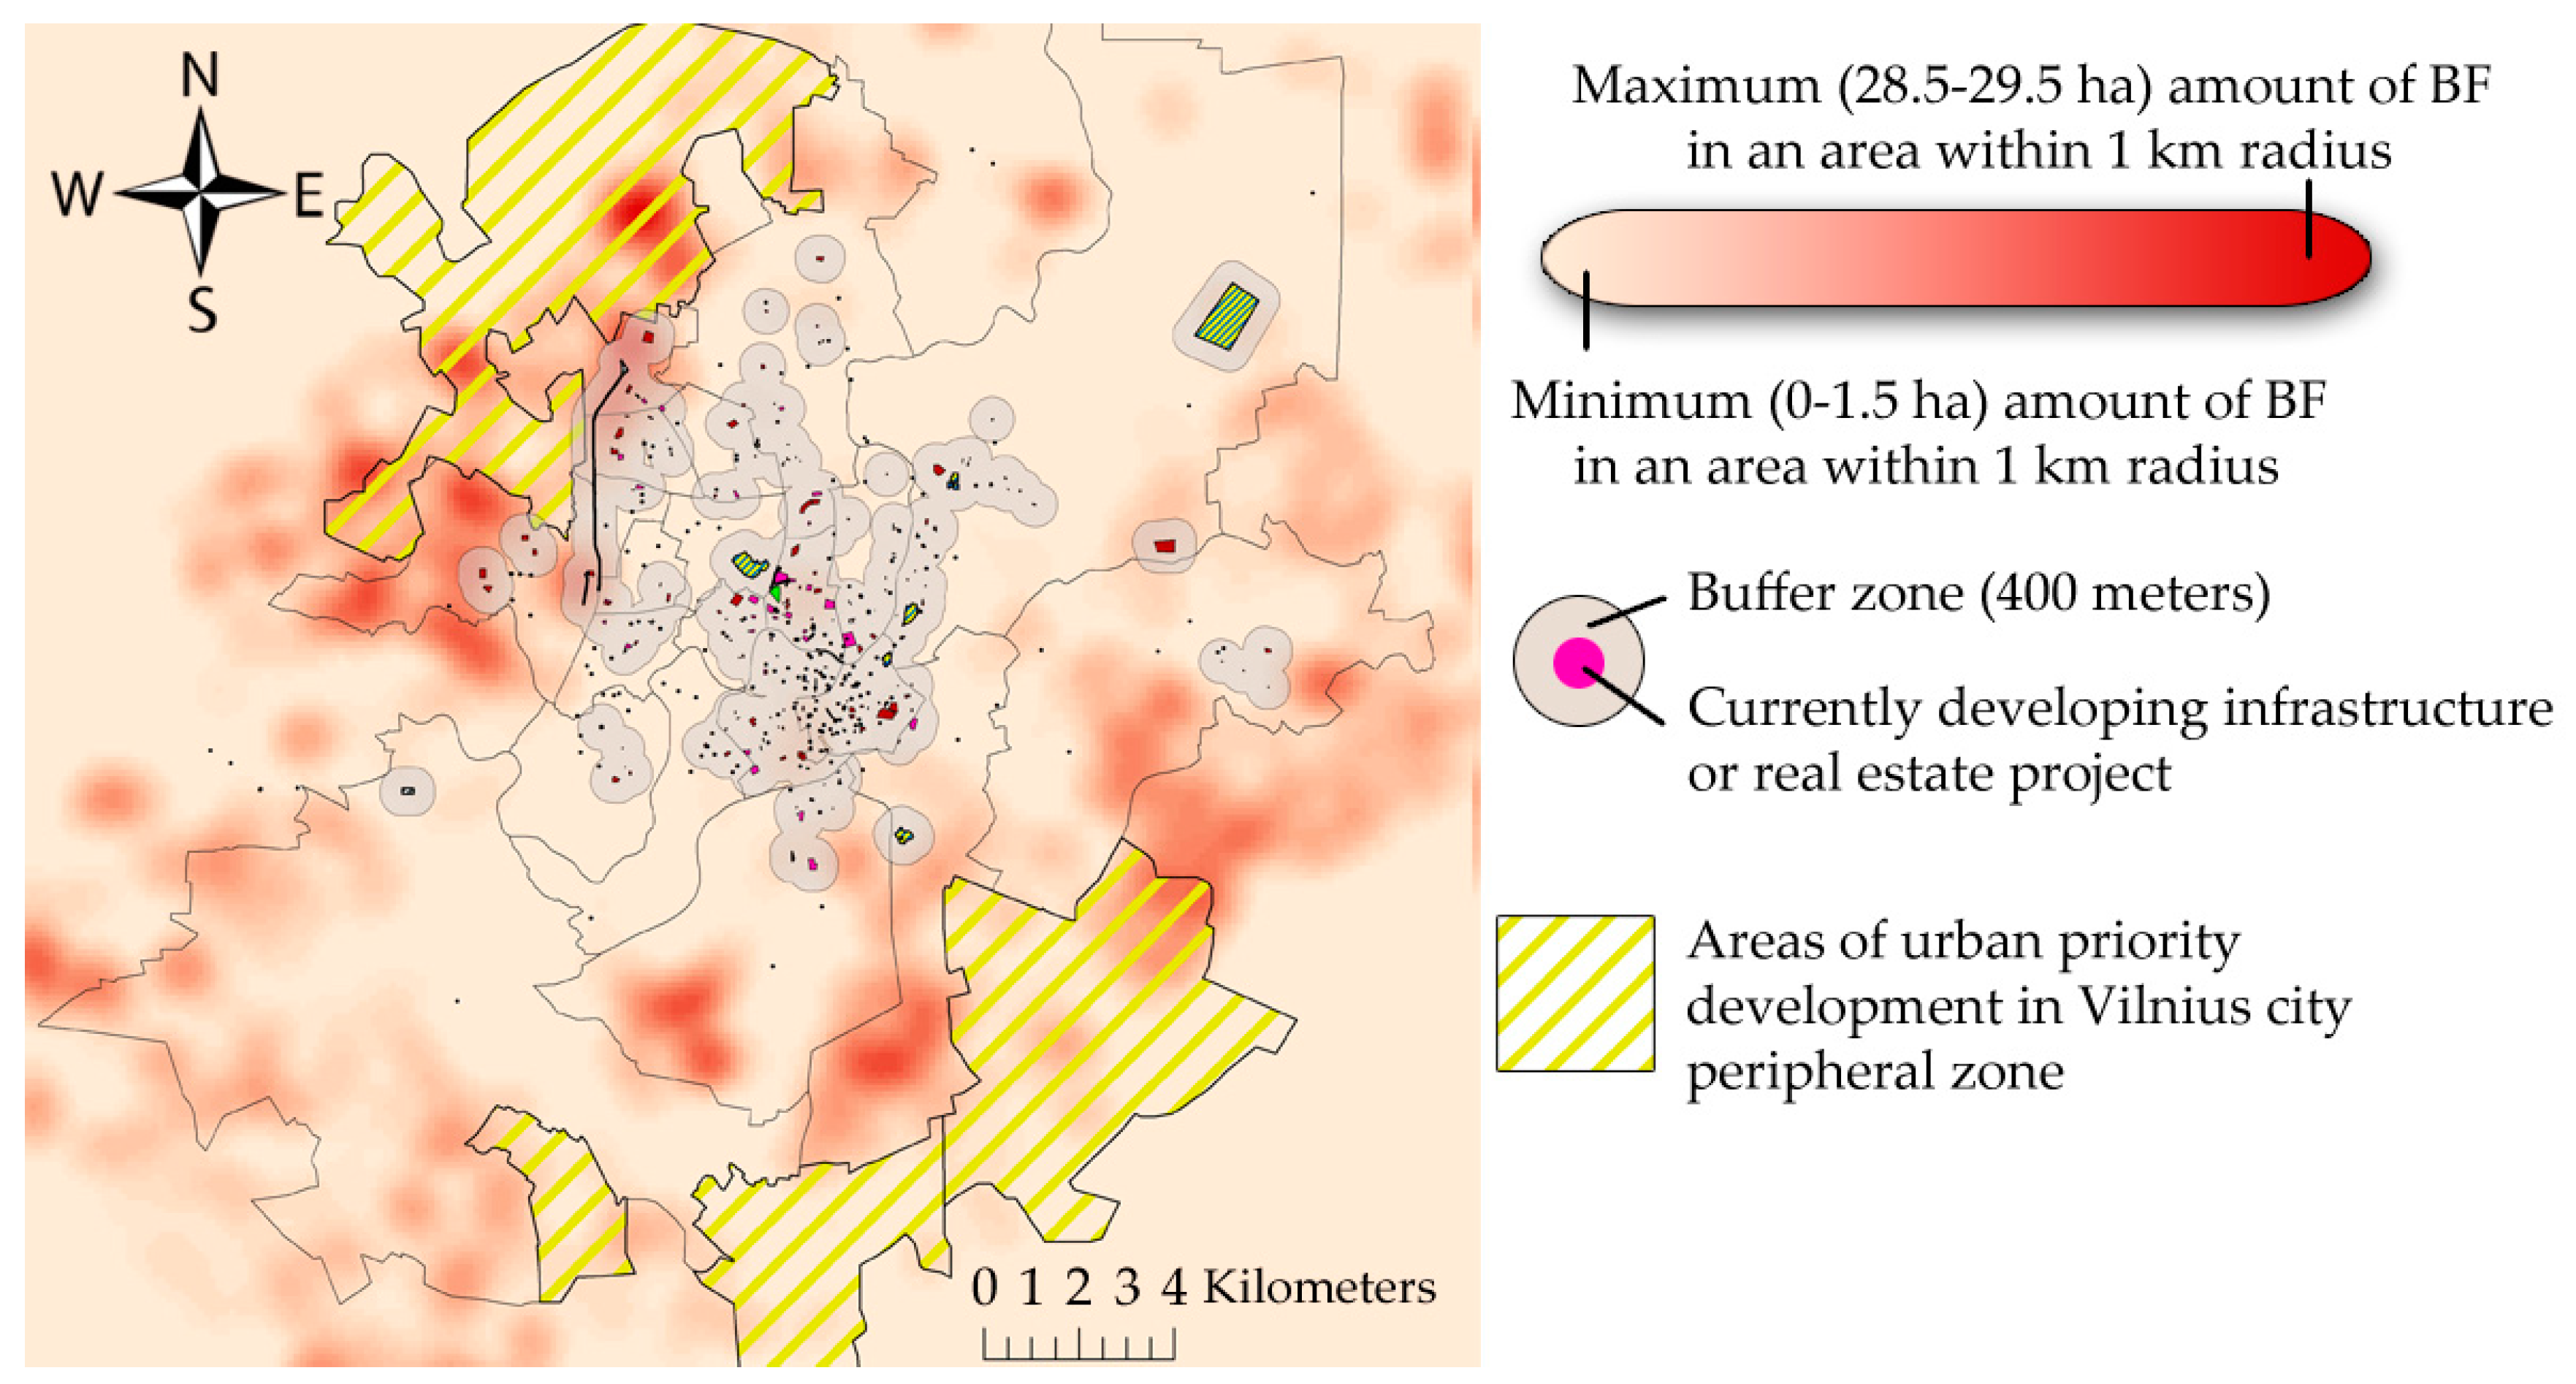
3.2. Development of the Hierarchical System of Criteria: Case Study of Vilnius City
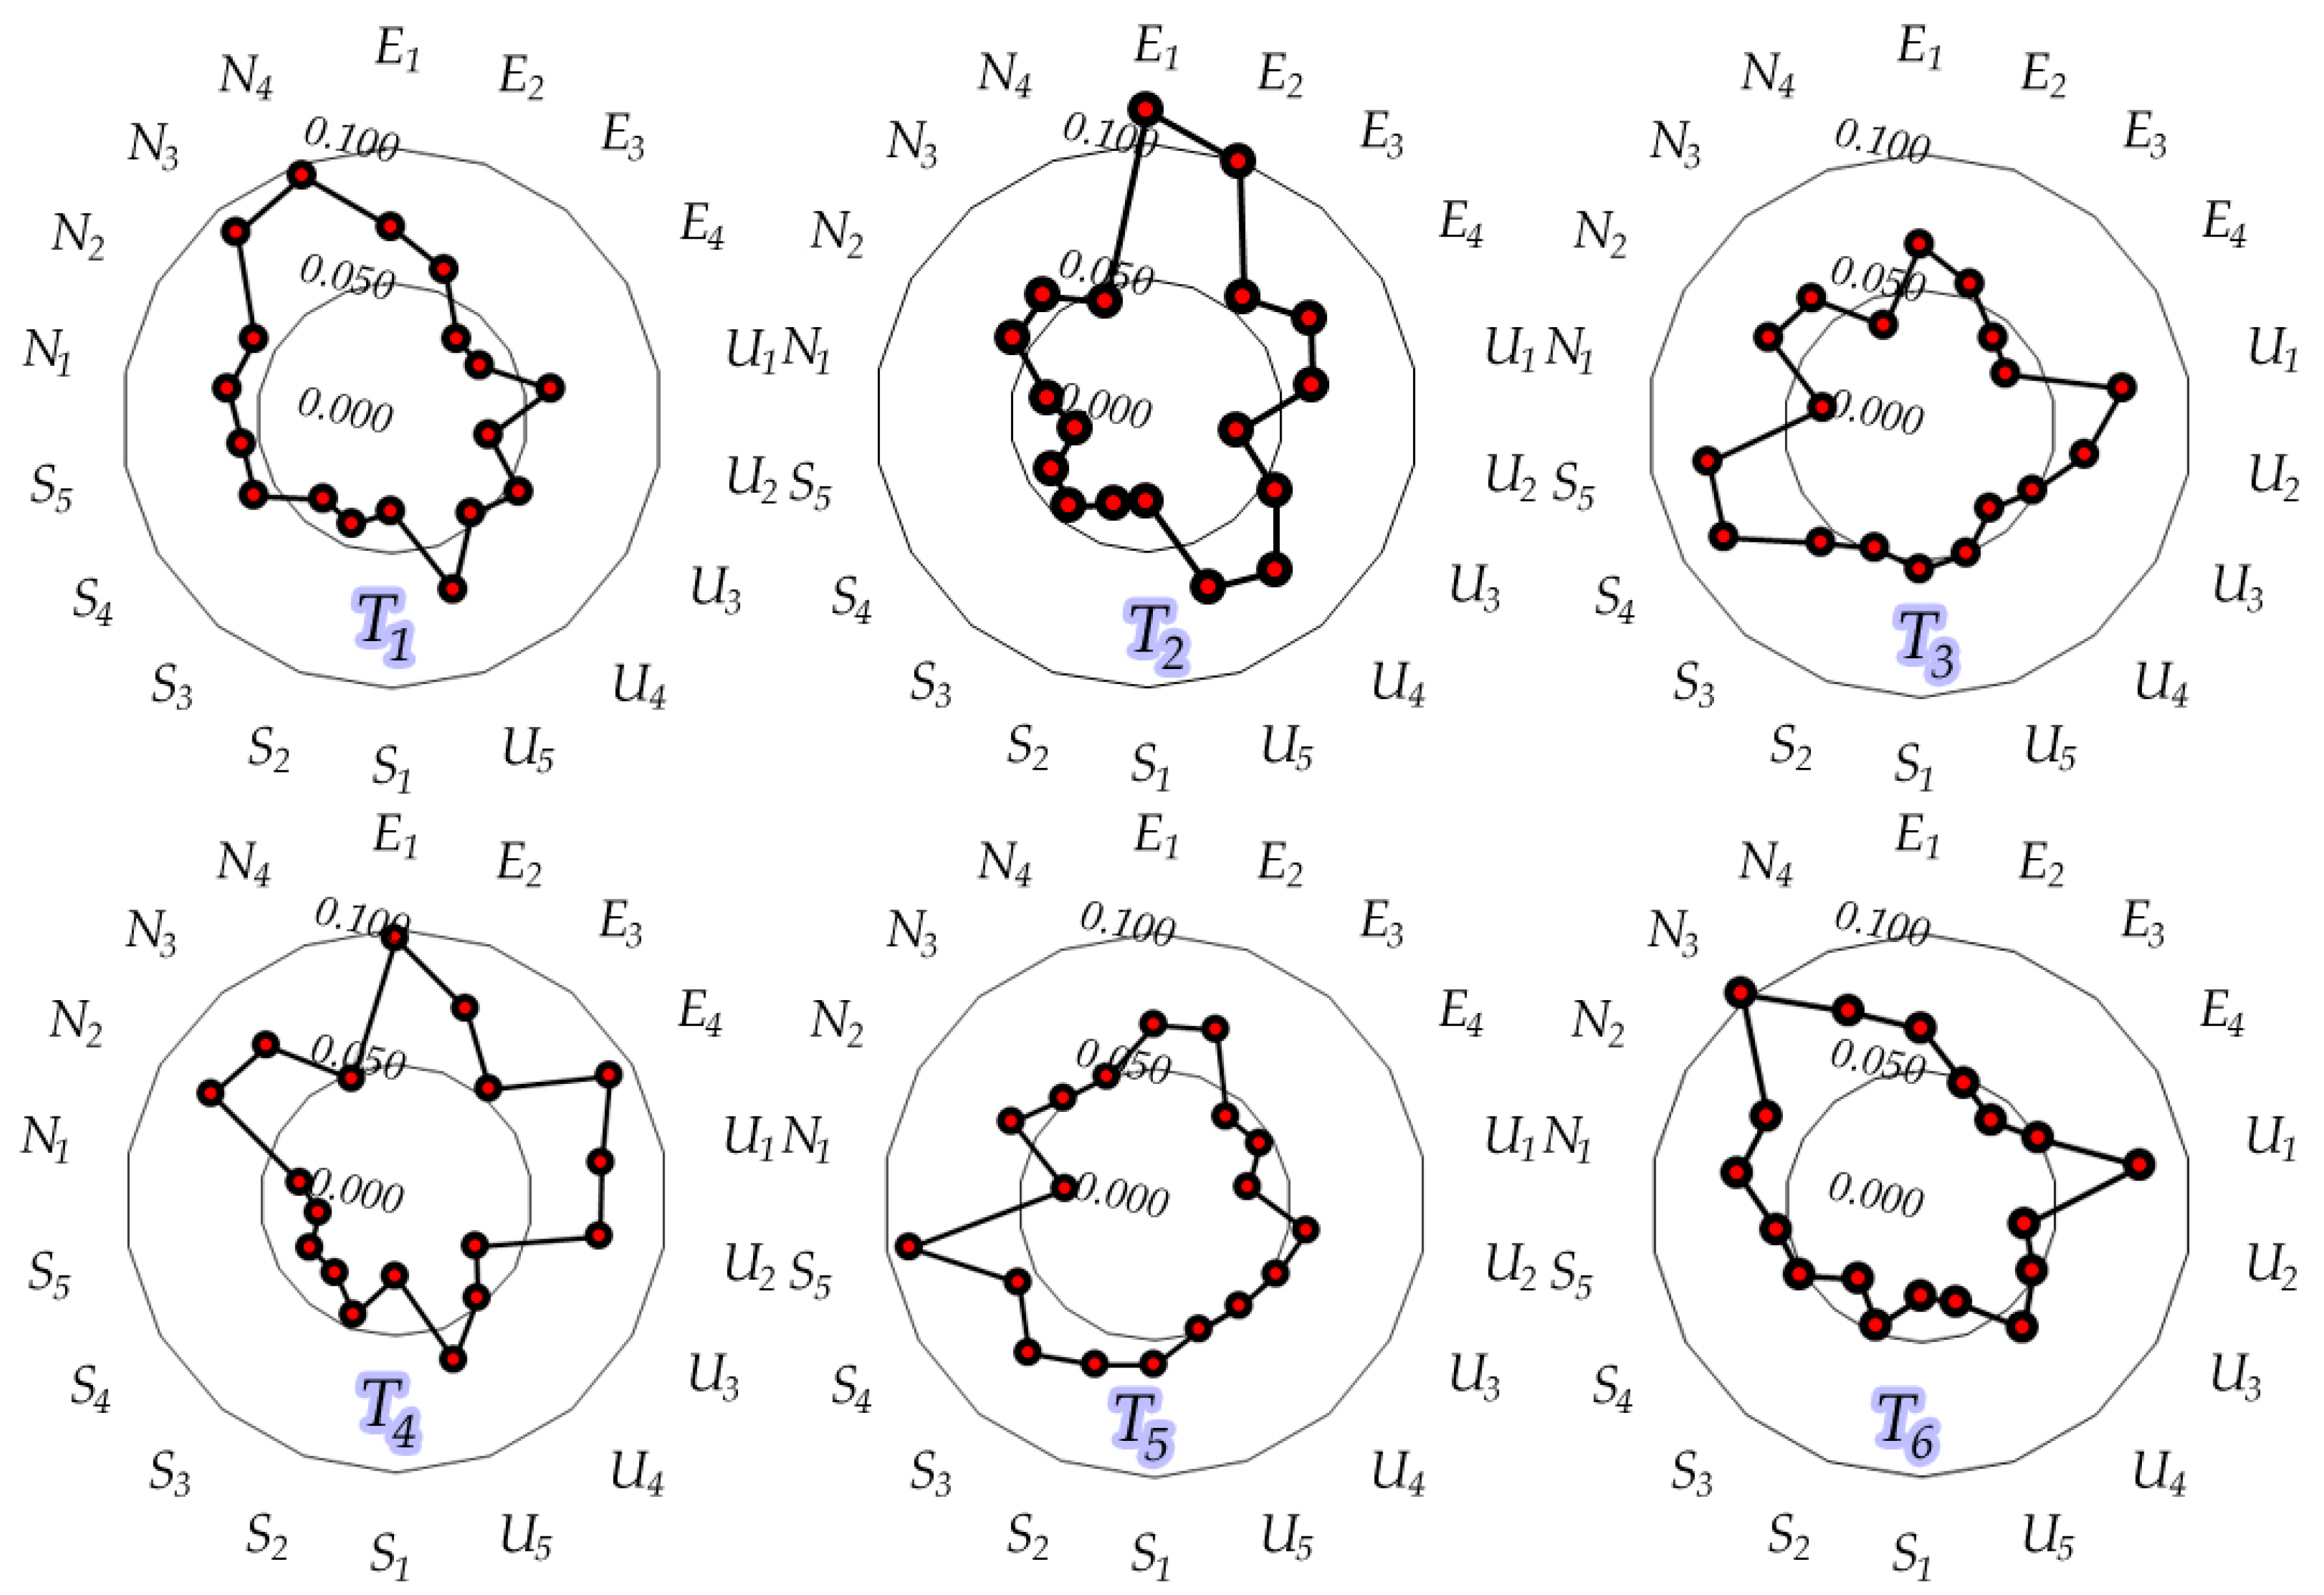
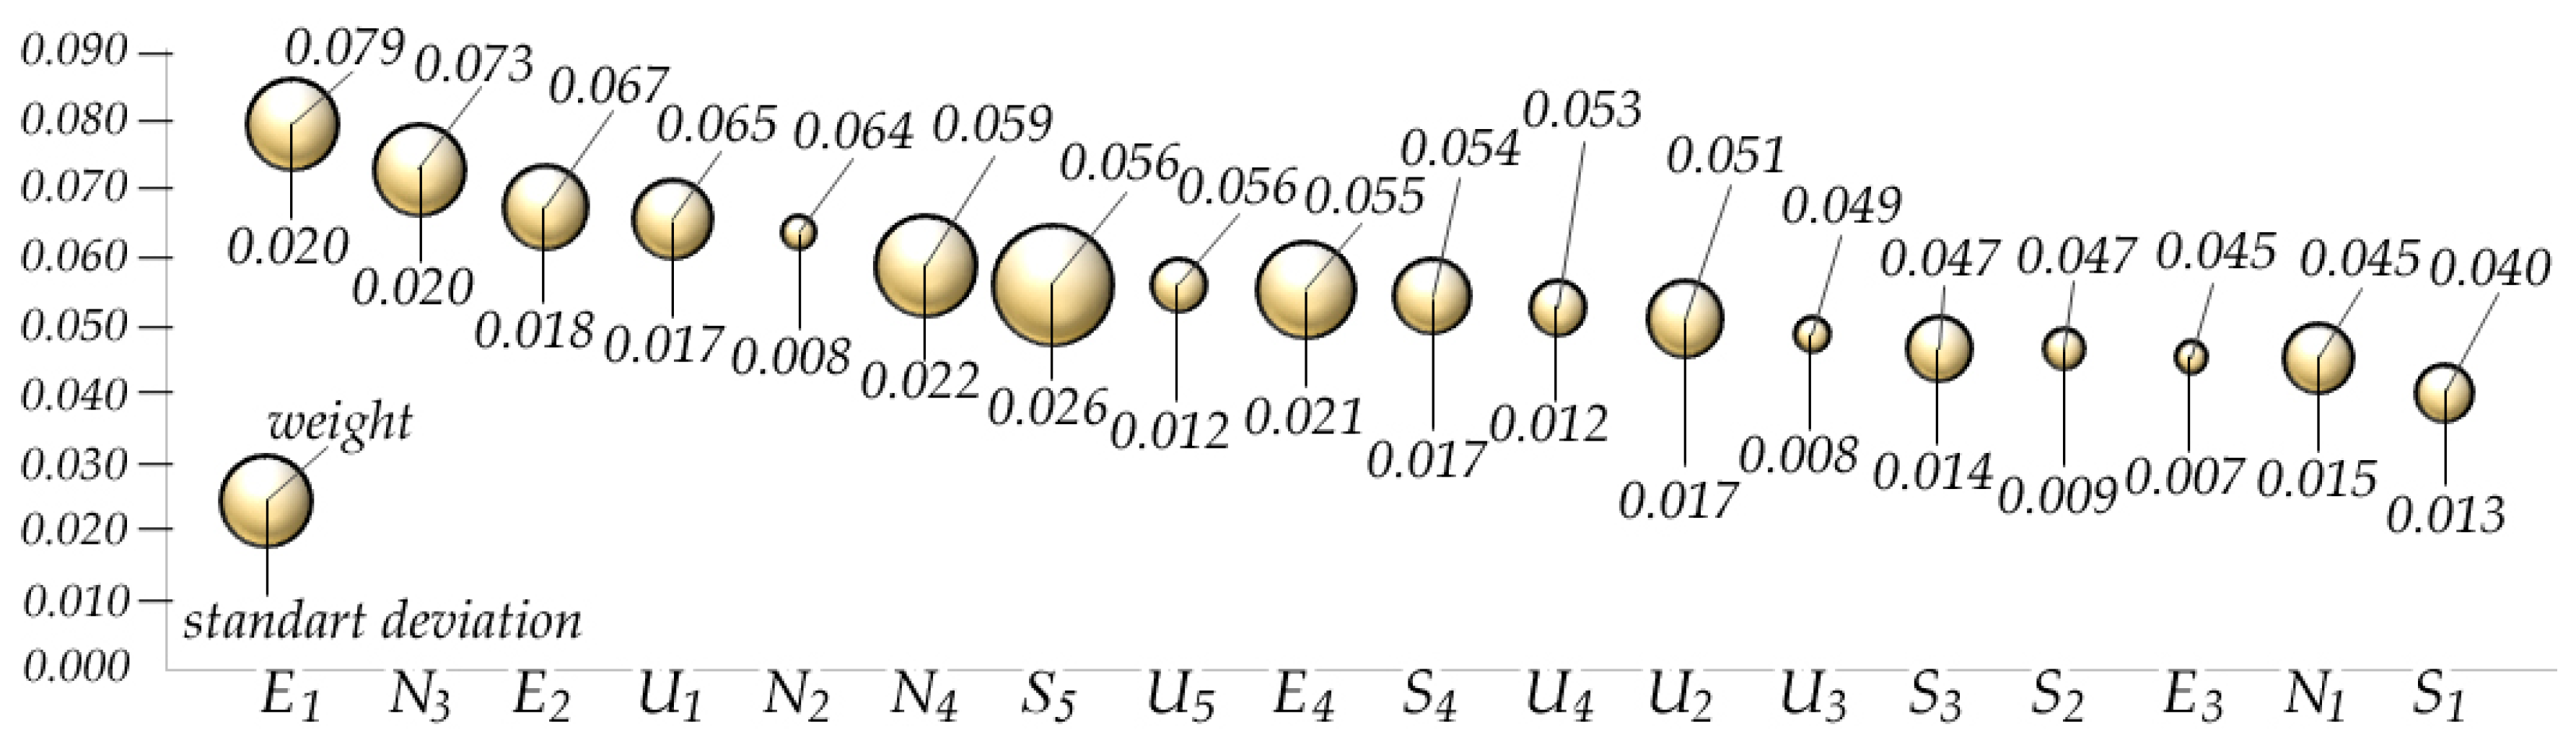
3.3. Establishing the Weights of Criteria
3.4. Establishing the Most Significant Criteria Contributing to Brownfield Land Redevelopment Strategies
4. Discussion and Conclusions
Acknowledgments
Author Contributions
Conflicts of Interest
References
- Alker, S.; Joy, V.; Roberts, P.; Smith, N. The definition of brownfield. J. Environ. Plan. Manag. 2000, 43, 49–69. [Google Scholar] [CrossRef]
- Tang, Y.-T.; Nathanail, C.P. Sticks and Stones: The Impact of the Definitions of Brownfield in Policies on Socio-Economic Sustainability. Sustainability 2012, 4, 840–862. [Google Scholar] [CrossRef]
- CABERNET. Sustainable brownfield Regeneration: CABERNET Network Report; Ferber, U., Grimski, D., Millar, K., Nathanail, P., Eds.; University of Nottingham: Nottingham, UK, 2016. [Google Scholar]
- Bardos, R.P.; Jones, S.; Stephenson, I.; Menger, P.; Beumer, V.; Neonato, F.; Maring, L.; Ferber, U.; Track, T.; Wendler, K. Optimising value from the soft re-use of brownfield sites. Sci. Total Environ. 2016, 563–564, 769–782. [Google Scholar] [CrossRef] [PubMed]
- Dixon, T.; Otsuka, N.; Abe, H. Critical success factors in urban brownfield regeneration: An analysis of ‘hardcore’ sites in Manchester and Osaka during the economic recession (2009-10). Environ. Plan. A 2011, 43, 961–980. [Google Scholar] [CrossRef]
- Heberle, L.; Wernstedt, K. Understanding brownfields regeneration in the US. Local Environ. 2006, 11, 479–497. [Google Scholar] [CrossRef]
- Franz, M.; Güles, O.; Prey, G. Place-making and 'green' reuses of brownfields in the Ruhr. Tijdschrift voor Economische en Sociale Geografie 2008, 99, 316–328. [Google Scholar] [CrossRef]
- Raco, M.; Henderson, S. Sustainable urban planning and the brownfield development process in the United Kingdom: Lessons from the Thames Gateway. Local Environ. 2006, 11, 499–513. [Google Scholar] [CrossRef]
- Maliene, V.; Wignall, L.; Malys, N. Brownfield Regeneration: Waterfront Site Developments in Liverpool and Cologne. J. Env. Eng. Landsc. Manag. 2012, 20, 5–16. [Google Scholar] [CrossRef]
- Frantál, B.; Kunc, J.; Klusáček, P.; Martinát, S. Assessing success factors of brownfields regeneration: International and inter-stakeholder perspective. Transylvanian Rev. Admin. Sci. 2015, 44, 91–107. [Google Scholar]
- Chen, I.-C.; Tsai, Y.-C.; Ma, H.-W. Toward sustainable brownfield redevelopment using life-cycle thinking. Sustainability 2016, 8, 994. [Google Scholar] [CrossRef]
- Rădulescu, C.M.; Ştefan, O.; Rădulescu, G.M.T.; Rădulescu, A.T.G.M.; Rădulescu, M.V.G.M. Management of stakeholders in urban regeneration projects. Case study: Baia-Mare, Transylvania. Sustainability 2016, 8, 238. [Google Scholar] [CrossRef]
- Regeneration of European Sites in Cities and Urban Environments. Development of an Analytical Sustainability Framework for the Context of Brownfield Regeneration in France, Germany, Poland and the United Kingdom. 2005. Available online: http://www.rescueeurope.com/download/reports/1_Analytical%20sustainability%20framework.pdf (accessed on 8 December 2016).
- Pahlen, G.; Glockner, S. Sustainable regeneration of European brownfield sites. In Brownfield Sites II: Assessment, Rehabilitation and Development; Donati, A., Rossi, C., Brebbia, C.A., Eds.; WIT Press: Southampton, UK, 2004; pp. 221–232. [Google Scholar]
- CABERNET. Concerted Action on Brownfield and Economic Regeneration Network. 2009. Available online: http://www.cabernet.org.uk (accessed on 20 December 2016).
- Thornton, G.; Franz, M.; Edwards, D.; Pahlen, G.; Nathanail, P. The challenge of sustainability: Incentives for brownfield regeneration in Europe. Environ. Sci. Policy 2007, 10, 116–134. [Google Scholar] [CrossRef]
- Tolle, A. Report about Concepts and Tools for Brown € field Redevelopment Activities (Output No. 3.1.1 of the COBRAMAN Project). Bydgoszcz, Poland, 2009. Available online: http://www.central2013.eu/fileadmin/user_upload/Downloads/outputlib/cobraman_tools_brownfield_regeneration.pdf (accessed on 5 December 2016).
- Meyer, P.B.; Lyons, T.S. Lessons from private sector brownfield redevelopers. J. Am. Plan. Assoc. 2000, 66, 46–57. [Google Scholar] [CrossRef]
- European Commission. Thematic Issue: Brownfield Regeneration, Issue 39. 2013. Available online: http://ec.europa.eu/environment/integration/research/newsalert/pdf/39si_en.pdf (accessed on 10 January 2017).
- Nogués, S.; Arroyo, N. Alternative approach to prioritization of brownfield reclamation attending to urban development potentialities: Case study in a depressed industrial district in northern Spain. J. Urban Plan. Dev. 2016, 142, 05015002. [Google Scholar] [CrossRef]
- Critto, A.; Cantarella, L.; Carlon, C.; Giove, S.; Petruzzelli, G.; Marcomini, A. Decision support-oriented selection of remediation technologies to rehabilitate contaminated sites. Integr. Environ. Assess. Manag. 2006, 2, 273–285. [Google Scholar] [PubMed]
- Boggia, A.; Cortina, C. Measuring sustainable development using a multi-criteria model: A case study. J. Environ. Manag. 2010, 91, 2301–2306. [Google Scholar] [CrossRef] [PubMed]
- Rosén, L.; Back, P.E.; Söderqvist, T.; Norrman, J.; Brinkhoff, P.; Norberg, T.; Volchko, Y.; Norin, M.; Bergknut, M.; Döberl, G. SCORE: A novel multi-criteria decision analysis approach to assessing the sustainability of contaminated land remediation. Sci. Total Environ. 2015, 511, 621–638. [Google Scholar]
- Frantál, B.; Greer-Wootten, B.; Klusaček, P.; Krejči, T.; Kunc, J.; Martinat, S. Exploring spatial pattern of urban brownfields regeneration: The case of Brno, Czech Republic. Cities 2015, 44, 9–18. [Google Scholar] [CrossRef]
- Martinat, S.; Dvorak, P.; Frantal, B.; Klusacek, P.; Kunc, J.; Navratil, J.; Osman, R.; Tureckova, K.; Reed, M. Sustainable urban development in a city affected by heavy industry and mining? Case study of brownfields in Karvina, Czech Republic. J. Clean. Prod. 2016, 118, 78–87. [Google Scholar] [CrossRef]
- Rizzo, E.; Pesce, M.; Pizzol, L.; Alexandrescu, F.; Giubilato, E.; Critto, A.; Marcomini, A.; Bartke, S. Brownfield Regeneration in Europe: Identifying Stakeholder Perceptions, Concerns, Attitudes and Information Needs. Land Use Policy 2015, 43, 437–453. [Google Scholar] [CrossRef]
- Dorsey, J.W. Brownfields and greenfields: The intersection of sustainable development and environmental stewardship. Environ. Pract. 2003, 5, 69–76. [Google Scholar] [CrossRef]
- Osman, R.; Frantál, B.; Klusáček, P.; Kunc, J.; Martinát, S. Factors affecting brownfield regeneration in post-socialist space: The case of the Czech Republic. Land Use Policy 2015, 48, 309–316. [Google Scholar] [CrossRef]
- Cooper, J.; Donegan, K.; Ryley, T.; Smyth, A. Densification and urban compaction: Reinforcing the drive for sustainability. Transport. Res. Rec. 2002, 1817, 102–109. [Google Scholar] [CrossRef]
- Adams, D.; Watkins, C. Greenfields, Brownfields and Housing Development; Blackwell Publishing: Oxford, UK, 2002. [Google Scholar]
- Bagaeen, S. Brownfield sites as building blocks for sustainable urban environments: A view on international experience in redeveloping former military sites. Urban Des. Int. 2006, 11, 117–128. [Google Scholar] [CrossRef]
- Paiders, J. Status of environmental protection as a source of finance for regional economic development: Measurement of environmental and regional policy with the fisher function. J. Env. Eng. Landsc. Manag. 2008, 16, 45–55. [Google Scholar] [CrossRef]
- Pizzol, L.; Zabeo, A.; Klusacek, P.; Giubilato, E.; Critto, A.; Frantal, B.; Martinat, S.; Kunc, J.; Osman, R.; Bartke, S. Timbre Brownfield Prioritization Tool to support effective brownfield regeneration. J. Environ. Manag. 2016, 166, 178–192. [Google Scholar] [CrossRef] [PubMed]
- Brownfield Definition. Available online: http://www.cabernet.org.uk/index.asp?c=1134 (accessed on 25 May 2015).
- CEEP. Brownfields: From Redevelopment to Revitalization. Available online: http://ceep.udel.edu/?s=Brownfields%3A+From+Redevelopment+to+Revitalization (accessed on 25 May 2015).
- CTLS. Reversing Urban Sprawl: A Reclaimability Index Approach for Reviving Downtown Brownfields. 2011. Available online: http://www.ctls.uconn.edu/research/completed-projects (accessed on 25 May 2015).
- EPA’s Smart Growth Index in 20 Pilot Communities: Using GIS Sketch Modelling to Advance Smart Growth. Available online: http://www2.epa.gov/smart-growth/smart-growthindex (accessed on 25 May 2015).
- Holistic Management of Brownfield Regeneration (HOMBRE). Early Indicators for Brownfield Origination. 7th EC Framework Programme. 2013. Available online: http://www.zerobrownfields.eu/ (accessed on 25 May 2015).
- Mulliner, E.; Maliene, V. An Analysis of Professional Perceptions of Criteria Contributing to Sustainable Housing Affordability. Sustainability 2015, 7, 248–270. [Google Scholar] [CrossRef]
- Prochorskaite, A.; Couch, C.; Malys, N.; Maliene, V. Housing Stakeholder Preferences for the “Soft” Features of Sustainable and Healthy Housing Design in the UK. Int. J. Environ. Res. Public Health 2016, 13, 111. [Google Scholar] [CrossRef] [PubMed]
- Burinskienė, M.; Lazauskaitė, D.; Bielinskas, V. Preventive Indicators for Creating Brownfields. Sustainability 2015, 7, 6706–6720. [Google Scholar] [CrossRef]
- Morio, M.; Schädler, S.; Finkel, M. Applying a multi-criteria genetic algorithm framework for brownfield reuse optimization: Improving redevelopment options based on stakeholder preferences. J. Environ. Manag. 2013, 130, 331–346. [Google Scholar] [CrossRef] [PubMed]
- Chrysochoou, M.; Brown, K.; Dahal, G.; Granda-Carvajal, C.; Segerson, K.; Garrick, N.; Bagtzoglou, A. A GIS and indexing scheme to screen brownfield for area-wide redevelopment planning. Landsc. Urban Plan. 2012, 105, 187–198. [Google Scholar] [CrossRef]
- Wedding, G.; Crawford-Brown, D. Measuring site-level success in brownfield redevelopment: A focus on sustainability and green building. J. Environ. Manag. 2007, 85, 483–495. [Google Scholar] [CrossRef] [PubMed]
- Garcia-Palomares, J.C.; Gutiérrez, J.; Mínguez, C. Identification of tourist hot spots based on social networks: A comparative analysis of European metropolises using photosharing services and GIS. Appl. Geogr. 2016, 63, 408–417. [Google Scholar] [CrossRef]
- Erener, A.; Mutlu, A.; Düzgün, S. A comparative study for landslide susceptibility mapping using GIS-based multi-criteria decision making analysis (MCDA), logistic regression (LR) and association rule mining (ARM). Eng. Geol. 2016, 203, 45–55. [Google Scholar] [CrossRef]
- Podviezko, A.; Podvezko, V. Influence of Data Transformation on Multicriteria Evaluation Result. Procedia Eng. 2015, 122, 151–157. [Google Scholar] [CrossRef]
- Palevicius, V.; Grigonis, V.; Podviezko, A.; Barauskaite, G. Developmental analysis of park-and-ride facilities in Vilnius. PROMET Traffic Transp. 2016, 28, 165–178. [Google Scholar] [CrossRef]
- Parfenova, L.; Pugachev, A.; Podviezko, A. Comparative analysis of tax capacity in regions of Russia. Technol. Econ. Dev. Econ. 2016, 22, 905–925. [Google Scholar] [CrossRef]
- Podviezko, A.; Podvezko, V. Absolute and Relative Evaluation of Socio-Economic Objects Based on Multiple Criteria Decision Making Methods. Eng. Econ. 2014, 25, 522–529. [Google Scholar] [CrossRef]
- Ginevicius, R.; Podvezko, V.; Podviezko, A. Evaluation of Isolated Socio-Economical Processes by a Multi-Criteria Decision Aid Method ESP. In Proceedings of the 7th International Scientific Conference Business and Management, Vilnius, Lithuania, 10–11 May 2012. [Google Scholar]
- Markevicius, N.; Podviezko, A. Trademarks, Trade Names and Brands as A Measure of Local, Regional and Global Competition. In Proceedings of the 8th International Days of Statistics and Economics, Prague, Czech Republic, 11–13 September 2014. [Google Scholar]
- Saaty, T.L. Decision Making for Leaders: The Analytical Hierarchy Process for Decisions in a Complex World; University of Pittsburgh: Pittsburgh, PA, USA, 1988. [Google Scholar]
- Podviezko, A. Use of multiple criteria decision aid methods in case of large amounts of data. Int. J. Bus. Emerg. Mark. 2015, 7, 155. [Google Scholar] [CrossRef]
- Burinskienė, M.; Rudzkienė, V. Future insights, scenarios and expert method application in sustainable territorial planning. Technol. Econ. Dev. Econ. 2009, 15, 10–25. [Google Scholar] [CrossRef]
- Nishisato, S. The SAGE Handbook of Quantitative Methodology for the Social Sciences; Kaplan, D., Ed.; SAGE Publications Inc.: Thousand Oaks, CA, USA, 2004; pp. 3–25. [Google Scholar]
- Turrof, M.; Helmer, O. The Delphi Method Techniques and Applications; Addison-Wesley Educational Publishers Inc.: Boston, MA, USA, 2002. [Google Scholar]
- Podvezko, V. Application of AHP technique. J. Bus. Econ. Manag. 2009, 10, 181–189. [Google Scholar] [CrossRef]
- Jacquet-Lagreze, E.; Siskos, J. Assessing a set of additive utility functions for multicriteria decision-making, the UTA method. Eur. J. Oper. Res. 1982, 10, 151–164. [Google Scholar] [CrossRef]
- Kilgour, D.M.; Chen, Y.; Hipel, K.W. Multiple Criteria Approaches to Group Decision and Negotiation. In Trends in Multiple Criteria Decision Analysis; Ehrgott, M., Figueira, J.R., Greco, S., Eds.; Springer: Boston, MA, USA, 2010; pp. 317–338. [Google Scholar]
- Kendall, M.G.; Gibbons, J.D. Rank Correlation Methods; Oxford University Press: New York, NY, USA, 1990. [Google Scholar]
- Theobald, D.M. Development and Applications of a Comprehensive Land Use Classification and Map for the US. PLoS ONE 2014, 9, e94628. [Google Scholar] [CrossRef] [PubMed]
- Stillwell, J.; Scholten, H.J. Land Use Simulation for Europe; Springer: Dordrecht, The Netherlands, 2001. [Google Scholar]
- Vilniaus Miesto Savivaldybės Teritorijos Bendrasis Planas iki 2015 Metų. S. Motieka. Municipality Embassy “Vilniaus planas“. Vilnius, 2007. Available online: http://www.vilnius.lt (accessed on 29 October 2016).
- United Nations ESCAP. A Guidebook on Public-Private Partnership in Infrastructure; United Nations, Economic and Social Commission for Asia and the Pacific: Bangkok, Thailand, 2011; pp. 10–11. [Google Scholar]
- Habibi, A.; Jahantigh, F.F.; Sarafrazi, A. Fuzzy Delphi Technique for Forecasting and Screening Items. Asian J. Res. Bus. Econ. Manag. 2015, 5, 130–143. [Google Scholar] [CrossRef]
- Hwang, C.-L.; Lin, M.-J. Group Decision Making under Multiple Criteria; Springer: Berlin, Germany, 1987. [Google Scholar]
- Chen, Y.; Hipel, K.W.; Kilgour, D.M.; Zhu, Y. A strategic classification support system for brownfield redevelopment. Environ. Model. Softw. 2009, 24, 647–654. [Google Scholar] [CrossRef]
- Maliene, V.; Durney-Knight, N.; Sertyesilisik, B.; Malys, N. Challenges and Opportunities in Developing Sustainable Communities in the North West of England. Challenges 2012, 3, 133–152. [Google Scholar] [CrossRef]
- Zavadskas, E.K.; Cavallaro, F.; Podvezko, V.; Ubarte, I.; Kaklauskas, A. MCDM Assessment of a Healthy and Safe Built Environment According to Sustainable Development Principles: A Practical Neighborhood Approach in Vilnius. Sustainability 2017, 9, 702. [Google Scholar] [CrossRef]


| Group of Economic Criteria | Group of Urbanistic Criteria |
|
|
| Group of Social Criteria | Group of Environmental Criteria |
|
|
| W | χ2 | No. of Objects | χ2cr | χ2 − χ2cr | |
|---|---|---|---|---|---|
| T1 | |||||
| Groups | 0.330 | 11.87 | 4 | 7.81 | 4.06 |
| Economic | 0.821 * | 29.56 * | 4 | 7.81 | 21.75 |
| Urbanistic | 0.361 | 17.33 | 5 | 9.49 | 7.84 |
| Social | 0.314 | 15.08 | 5 | 9.49 | 5.59 |
| Environmental | 0.337 | 12.13 | 4 | 7.81 | 4.32 |
| T2 | |||||
| Groups | 0.815 | 29.33 | 4 | 7.81 | 21.52 |
| Economic | 0.767 | 27.60 | 4 | 7.81 | 19.79 |
| Urbanistic | 0.301 * | 14.43 * | 5 | 9.49 | 4.94 |
| Social | 0.174 | 8.33 | 5 | 9.49 | −1.16 |
| Environmental | 0.185 | 6.67 | 4 | 7.81 | −1.14 |
| T3 | |||||
| Groups | 0.550 * | 19.79 * | 4 | 7.81 | 11.98 |
| Economic | 0.633 | 22.80 | 4 | 7.81 | 14.99 |
| Urbanistic | 0.443 | 21.25 | 5 | 9.49 | 11.76 |
| Social | 0.417 * | 20.00 * | 5 | 9.49 | 10.51 |
| Environmental | 0.715 | 25.73 | 4 | 7.81 | 17.92 |
| T4 | |||||
| Groups | 0.456 | 16.40 | 4 | 7.81 | 8.59 |
| Economic | 0.744 | 26.80 | 4 | 7.81 | 18.99 |
| Urbanistic | 0.663 * | 31.81 * | 5 | 9.49 | 22.32 |
| Social | 0.328 | 15.75 | 5 | 9.49 | 6.26 |
| Environmental | 0.604 | 21.73 | 4 | 7.81 | 13.92 |
| T5 | |||||
| Groups | 0.626 | 22.53 | 4 | 7.81 | 14.72 |
| Economic | 0.685 | 24.67 | 4 | 7.81 | 16.86 |
| Urbanistic | 0.191 * | 9.15 * | 5 | 9.49 | −0.34 |
| Social | 0.344 | 16.50 | 5 | 9.49 | 7.01 |
| Environmental | 0.078 | 2.80 | 4 | 7.81 | −5.01 |
| T6 | |||||
| Groups | 0.278 | 10.00 | 4 | 7.81 | 2.19 |
| Economic | 0.167 | 6.00 | 4 | 7.81 | −1.81 |
| Urbanistic | 0.587 | 28.17 | 5 | 9.49 | 18.68 |
| Social | 0.198 | 9.50 | 5 | 9.49 | 0.01 |
| Environmental | 0.104 | 3.73 | 4 | 7.81 | −4.08 |
| Criterion | Unemployment Rate | Poverty Rate | Total Household Income | Crime Index | Access to Schools and Pre-Schools | |
|---|---|---|---|---|---|---|
| Before | 27% | 12% | 8% | 19% | 35% | |
| After | 22% | 17% | 27% | 19% | 15% | |
| Criterion | Soil Pollution | Pollution from Factories, etc. | Spread of Forests and Green Areas | Pollution from Transport | |
|---|---|---|---|---|---|
| Before | 30% | 10% | 35% | 25% | |
| After | 10% | 30% | 35% | 25% | |
| Criterion | Empty Sites | Number of Schools | State and Average Age of New Constructions | Magnitude of New Constructions | Distance to the City Centre | |
|---|---|---|---|---|---|---|
| Before | 25% | 30% | 10% | 15% | 20% | |
| After | 10% | 30% | 25% | 15% | 20% | |
| Criterion | Soil Pollution | Pollution from Factories, etc. | Spread of Forests and Green Areas | Pollution from Transport | |
|---|---|---|---|---|---|
| Before | 35% | 10% | 25% | 30% | |
| After | 10% | 35% | 25% | 30% | |
| Criterion | Soil Pollution | Pollution from Factories, etc. | Spread of Forests and Green Areas | Pollution from Transport | |
|---|---|---|---|---|---|
| Before | 30% | 11% | 33% | 26% | |
| After | 11% | 30% | 33% | 26% | |
| Criterion | Investments in Infrastructure | New Construction Cost | Number of Undertaken EU Projects | Number of Work-Places | |
|---|---|---|---|---|---|
| Before | 15% | 23% | 27% | 35% | |
| After | 35% | 23% | 15% | 27% | |
| W | χ2 | No. of Objects | χ2cr | χ2 − χ2cr | |
|---|---|---|---|---|---|
| T1 | |||||
| Groups | 0.330 | 11.87 | 4 | 7.81 | 4.06 |
| Economic | 0.821 * | 29.56 * | 4 | 7.81 | 21.75 |
| Urbanistic | 0.361 | 17.33 | 5 | 9.49 | 7.84 |
| Social | 0.314 | 15.08 | 5 | 9.49 | 5.59 |
| Environmental | 0.337 | 12.13 | 4 | 7.81 | 4.32 |
| T2 | |||||
| Groups | 0.815 | 29.33 | 4 | 7.81 | 21.52 |
| Economic | 0.767 | 27.60 | 4 | 7.81 | 19.79 |
| Urbanistic | 0.301 * | 14.43 * | 5 | 9.49 | 4.94 |
| Social | 0.326 | 15.67 | 5 | 9.49 | 6.18 |
| Environmental | 0.274 | 9.87 | 4 | 7.81 | 2.06 |
| T3 | |||||
| Groups | 0.550 * | 19.79 * | 4 | 7.81 | 11.98 |
| Economic | 0.633 | 22.80 | 4 | 7.81 | 14.99 |
| Urbanistic | 0.443 | 21.25 | 5 | 9.49 | 11.76 |
| Social | 0.417 * | 20.00 * | 5 | 9.49 | 10.51 |
| Environmental | 0.715 | 25.73 | 4 | 7.81 | 17.92 |
| T4 | |||||
| Groups | 0.456 | 16.40 | 4 | 7.81 | 8.59 |
| Economic | 0.744 | 26.80 | 4 | 7.81 | 18.99 |
| Urbanistic | 0.663 * | 31.81 * | 5 | 9.49 | 22.32 |
| Social | 0.328 | 15.75 | 5 | 9.49 | 6.26 |
| Environmental | 0.604 | 21.73 | 4 | 7.81 | 13.92 |
| T5 | |||||
| Groups | 0.626 | 22.53 | 4 | 7.81 | 14.72 |
| Economic | 0.685 | 24.67 | 4 | 7.81 | 16.86 |
| Urbanistic | 0.263 * | 12.67 * | 5 | 9.49 | 3.18 |
| Social | 0.344 | 16.50 | 5 | 9.49 | 7.01 |
| Environmental | 0.337 | 12.13 | 4 | 7.81 | 4.32 |
| T6 | |||||
| Groups | 0.278 | 10.00 | 4 | 7.81 | 2.19 |
| Economic | 0.315 | 11.33 | 4 | 7.81 | 3.52 |
| Urbanistic | 0.587 | 28.17 | 5 | 9.49 | 18.68 |
| Social | 0.198 | 9.50 | 5 | 9.49 | 0.01 |
| Environmental | 0.332 | 11.97 | 4 | 7.81 | 4.16 |
| T1 | T2 | T3 | T4 | T5 | T6 | |
|---|---|---|---|---|---|---|
| E1 | 34.33 | 33.25 | 33.08 | 30.50 | 29.83 | 31.92 |
| E2 | 28.42 | 29.42 | 27.25 | 23.75 | 30.67 | 23.50 |
| E3 | 18.58 | 16.50 | 21.08 | 16.67 | 18.92 | 20.08 |
| E4 | 18.67 | 20.67 | 18.67 | 28.92 | 20.42 | 24.50 |
| Σ = 100% | Σ = 100% | Σ = 100% | Σ = 100% | Σ = 100% | Σ = 100% | |
| U1 | 22.75 | 21.25 | 27.58 | 28.83 | 14.50 | 30.92 |
| U2 | 13.92 | 11.75 | 22.33 | 12.67 | 23.67 | 14.75 |
| U3 | 20.58 | 18.92 | 17.33 | 17.92 | 21.58 | 18.00 |
| U4 | 17.25 | 25.42 | 14.50 | 23.75 | 20.33 | 22.17 |
| U5 | 27.75 | 23.00 | 18.25 | 16.83 | 20.17 | 14.17 |
| Σ = 100% | Σ = 100% | Σ = 100% | Σ = 100% | Σ = 100% | Σ = 100% | |
| S1 | 15.00 | 18.17 | 16.50 | 26.42 | 17.42 | 15.25 |
| S2 | 18.42 | 19.83 | 15.08 | 20.92 | 18.42 | 21.42 |
| S3 | 17.17 | 24.83 | 17.67 | 21.08 | 20.92 | 16.00 |
| S4 | 25.17 | 22.67 | 25.92 | 17.00 | 16.58 | 23.17 |
| S5 | 24.42 | 14.58 | 24.75 | 14.42 | 26.58 | 24.33 |
| Σ = 100% | Σ = 100% | Σ = 100% | Σ = 100% | Σ = 100% | Σ = 100% | |
| N1 | 20.00 | 18.92 | 18.00 | 30.92 | 17.17 | 22.00 |
| N2 | 19.33 | 28.75 | 31.92 | 29.33 | 30.83 | 20.83 |
| N3 | 29.50 | 29.67 | 30.67 | 18.92 | 26.08 | 32.92 |
| N4 | 31.25 | 22.67 | 19.42 | 20.83 | 25.75 | 24.33 |
| Σ = 100% | Σ = 100% | Σ = 100% | Σ = 100% | Σ = 100% | Σ = 100% |
© 2017 by the authors. Licensee MDPI, Basel, Switzerland. This article is an open access article distributed under the terms and conditions of the Creative Commons Attribution (CC BY) license (http://creativecommons.org/licenses/by/4.0/).
Share and Cite
Burinskienė, M.; Bielinskas, V.; Podviezko, A.; Gurskienė, V.; Maliene, V. Evaluating the Significance of Criteria Contributing to Decision-Making on Brownfield Land Redevelopment Strategies in Urban Areas. Sustainability 2017, 9, 759. https://doi.org/10.3390/su9050759
Burinskienė M, Bielinskas V, Podviezko A, Gurskienė V, Maliene V. Evaluating the Significance of Criteria Contributing to Decision-Making on Brownfield Land Redevelopment Strategies in Urban Areas. Sustainability. 2017; 9(5):759. https://doi.org/10.3390/su9050759
Chicago/Turabian StyleBurinskienė, Marija, Vytautas Bielinskas, Askoldas Podviezko, Virginija Gurskienė, and Vida Maliene. 2017. "Evaluating the Significance of Criteria Contributing to Decision-Making on Brownfield Land Redevelopment Strategies in Urban Areas" Sustainability 9, no. 5: 759. https://doi.org/10.3390/su9050759