
An Optimal Operation Model and Ordered Charging/Discharging Strategy for Battery Swapping Stations


1
School of Economics and Management, North China Electric Power University, Beijing 102206, China
2
Research Center for Beijing Energy Development, Beijing 102206, China
3
Guangzhou Power Supply Bureau, China Southern Power Grid, Guangzhou 510620, China
*
Author to whom correspondence should be addressed.
Sustainability 2017, 9(5), 700; https://doi.org/10.3390/su9050700
Submission received: 2 February 2017
/
Revised: 18 April 2017
/
Accepted: 26 April 2017
/
Published: 28 April 2017
(This article belongs to the Section Economic and Business Aspects of Sustainability)
Abstract
:The economic operation of battery swapping stations (BSSs) is significant for the promotion of large-scale electric vehicles. This paper develops a linear programming model to maximize the daily operation profits of a BSS by considering constraints of the battery swapping demand of users and the charging/discharging balance of batteries in the BSS. Based on the BSS configuration and data from electric taxis in Beijing, we simulate the operation situation and charging/discharging load of the BSS in nine scenarios with two ordered charging and discharging strategies. The simulation results demonstrate that the model can achieve the maximum daily profits of the BSS. According to the sensitivity analysis, the battery swapping price for batteries is the most sensitive, followed by the number of batteries in the BSS, while the operation-maintenance costs and battery depreciation costs are least sensitive. In addition, the charging and discharging of batteries in the BSS can be coordinated by increasing the battery quantity of the BSS and formulating the ladder-type battery swapping price.
1. Introduction
According to statistics from the International Energy Agency, the transportation sector accounted for 28.37% of carbon dioxide (CO2) emissions from fuel combustion in China [1]. Along with the urbanization development in China, the growth of traditional vehicles is rapid, which will increase the proportion of CO2 emissions from the transportation sector and lead to the serious air pollution and oil shortage. Electric vehicles (EVs) have prominent advantages of emission reduction and oil conservation in transportation sector. Therefore, many policy measures have been employed to support and encourage the development of EVs in China. Since 2009, China has established 25 pilot cities in batches and popularized EVs in the public domain such as the area of public buses, taxis, sanitation trucks and mail trucks [2]. According to the Global EV Outlook of 2016 [3], by the end of 2015, China had the second largest stock of EVs at 312,290. The large-scale development of EVs depends on the stable and continuous energy supply. The research of Sierzchula [4] shows that constructing one charging station for every 100,000 residents can double the effect on EVs’ market promotion compared with providing 1000 dollars directly to every consumer. This demonstrates that the stable energy supply is significant to encourage the market penetration of EVs.
At present, the energy supply mode of EVs mainly includes direct charging mode and battery swapping mode [5]. Direct charging mode refers to the fact that the energy of EVs comes from the direct charging by charge piles and other charging equipment. Battery swapping mode is a way that the batteries of EVs are swapped by full-charged power batteries from centralized charging and swapping stations (CSSs). The swapping mode is applied in many pilot cities of China, such as Hangzhou, Beijing and Haikou. CSSs have the advantage of unified deployment and management for EV battery swapping service. Moreover, it can achieve the economic operation of CSSs and smooth the load of the power grid by unified charging and swapping strategy of batteries and the technology of vehicle to grid (V2G) [6]. Therefore, China had completed construction on 3600 CSSs at the end of 2015 [7]. Moreover, it plans to construct 12,000 centralized CSSs through 2020 [8]. To promote the marketization of charging infrastructure, research on the economical operation of CSSs and the factors influencing operation, as well as the impact on the power grid load, is needed. When the operation of CSSs becomes profitable, more investment will be attracted to the construction of charging infrastructure. The increased number of CSSs can make consumer charging more convenient, which is conducive to the large-scale development of EVs. Thus, many scholars have noted research on the promotion of EV charging infrastructure. Those studies can be divided into two areas: the ordered charging/discharging of EVs and economic operation of CSSs.
The research on the ordered charging and discharging of EVs is concerned with the load forecasting and shifting of EVs. Based on the historical load data of electric bus charging stations, Zhang et al. [9] considered the factors influencing the load of charging stations and forecasted the daily load of charging stations using fuzzy clustering and back propagation neural networks. According to the operating mechanism and charging power curve characteristics of electric bus charging stations, Wang et al. [10] established a general mathematical model to determine the distribution capacity of electric bus charging stations. Shi [11] took the power-demand-side management and electricity price theory into account, and designed a charge and discharge pricing scheme for EVs. To achieve the load-shifting effect of EVs, Li [12] developed an optimization model of demand-side response strategies for EVs using the genetic algorithm. Yao et al. [13] proposed layering and zoning EVs, optimizing the dispatch of regional agents and controlling users’ charging and discharging time to realize the objective of peak load shifting. Zhang [14] established an ordered charging and discharging model to maximize the profits of EVs’ third-party agents and applied the particle swarm optimization algorithm to attain optimal scheduling results.
The second research area is mainly focused on the analysis of CSSs’ economic operation. Zhang et al. [15] shrank the adjustment frequency of thermal power and enhanced the security and economy of the power grid by optimizing the charging and discharging process of battery swapping stations (BSSs). Luo et al. [5] established a two-phase optimization model for battery swapping modes: The first phase is based on the objective of minimizing the charging fee, and the second phase is aimed at minimizing the fluctuation of daily load curves by using the objective of the first phase as the constraint. Deng [16] proposed a bi-level programing approach to coordinate EVs’ charging with the network load and electricity price. Soares [17] designed a coordination optimization model to minimize the total costs by considering the new energy generation costs, EV charging costs and discharging incomes. Based on the driving mode of large-scale EVs, Du et al. [18] developed a dynamic economic dispatch model to minimize the generating costs using the traditional mathematical programming method. Sun et al. [19] analyzed the operation mode of BBSs and developed a profit model based on the objective of maximizing the operating profits of BBSs. Additionally, many studies have proposed profitable business modes for CSSs. To achieve a win–win situation for the public sector and market departments, Yang et al. [20] developed a public–private partnership mode based on their long-term cooperation. Robinson et al. [21] designed several models of solar powered charging stations for major entities including industry, the federal and state government, utilities, universities, and public parking. Zhang and Rao [22] developed five commercial modes for a battery swapping and leasing service and analyzed their profits. Other researchers concern on the energy source of EVs. To increase the participation of renewable energy, Diaz [23] explored the option of coupling EVs as a distributed energy storage system in Tenerife Island and used a model simulator to evaluate the introduction of renewable energy and EVs. Zhang et al. [24] used the linear programming to maximize the sustainability performance of ecology zones.
In summary, previous studies on the ordered charging and discharging of EVs mainly consider the perspective of the power grid’s stable operation. The battery swapping mode is an important energy-supply method for EVs [25] by which users can replenish EV batteries in a short time and achieve the load-shifting effect by energy storage. Previous studies on the economic operation of BSSs have focused more on regarding BSSs as a part of the power grid and intended to realize the economical operation of the power grid through the ordered charging of batteries in the BSS, while focusing less on the economical operation of the BSS itself. In China, in particular, the market of constructing and managing BSSs is monopolized by the State Grid and the Southern Power Grid. With the large-scale development of EVs, however, China will gradually open the market to stakeholders [26], and BBS investors will not only be the power grid but also cover private capitalists, battery manufacturers and gasoline enterprises [24].
Therefore, this paper regards the maximization of the BSS’s daily profits as the objective value from the perspective of the economic benefits of BSS investors. In addition, it considers the main factors that impact the operational management of BSSs and designs an ordered charging and discharging strategy to make BSSs more profitable. Furthermore, this paper analyzes the load of the BSS and the charging arrangement of the BSS’s batteries in different scenarios with ordered charging and discharging strategies based on the electricity price of the peak-valley time-of-use tariff (TOU) and the demand response (DR). There are several major contributions of this study: (1) from the perspective of BSS investors, the operation mode should aim to maximize the daily profits of the BSS; (2) considering the profitable operation of BSSs, we propose the ordered charging and discharging strategies for batteries in BSSs; (3) the optimal operation scheme for BSSs is carried out based on the scenario analysis; and (4) the sensitive factors affecting the operation of BSSs are determined by the sensitivity analysis.
The purpose of this study is to analyze the operation profits of BSSs and proposes an appropriate charging and discharging strategy for BSSs. The work is organized as follows. The operation mode of BSSs is analyzed in Section 2. The optimal operation model is introduced in Section 3. In Section 4, the results of the scenario simulation and sensitivity analysis are discussed, and the effects of two ordered charging and discharging strategies are tested. Section 5 concludes the paper.
2. Operation Mode of the BSS
2.1. Battery Swapping Mode of BSS
In China, BSSs utilize special facilities to charge and swap batteries and to achieve the centralized management and maintenance of batteries. The battery swapping mode is suitable for public buses, taxis, and sanitation trucks, which must be charged immediately. Figure 1 shows the operation mode of a BSS. EVs exchange their batteries in the BSS, and the empty batteries are sent to the empty battery depot. After the empty batteries are fully charged, they will be delivered to the fully charged battery depot. The power grid is the single energy source of batteries in the BSS.
2.2. Operation Incomes of BSS
Currently, the main incomes of the BSS come from the business of battery swapping. The two types of battery swap pricing methods are charging by the driving mileage or battery electricity consumption. Thus, battery swapping incomes of the BSS (Is, yuan) are expressed as:
where Ps is the battery swapping price per driving mileage unit or per electricity unit, yuan/km or yuan/kWh; Mi(t) is the driving mileage or battery electricity consumption of EV i at t, km or kWh; and N(t) is the number of EVs for swapping batteries at t.
If the vehicle-to-grid (V2G) technology is mature and the number of EVs is large, BSSs can benefit not only from the battery swapping price but also from the business of feeding electricity into the power grid. This means that BSSs can sell electricity to the power grid by discharging batteries. It supposes that there are J devices to discharge the batteries and the value of the discharging time interval (∆t, h) is one hour. Discharging incomes of the BSS (Id, yuan) can be described as:
where Pg(t) is the feed-in tariff of BSSs at t, yuan/kWh; and pj(t) is the transmission power of discharging device j, kW; J is the number of discharging devices.
2.3. Operation Costs of BSS
The paper focuses on analyzing BSS’s operation status. Therefore, investment and construction costs are not considered here. BSS’s operation costs consist of three parts: charging costs, depreciation costs and operation and maintenance costs.
- (1)
- Charging costs (Cc, yuan) are the charging fee that the BSS pays to the grid power, which can be expressed as:where Pe(t) is the electricity price that the power grid supplies power to the BSS at t, yuan/kW; pk(t) is the charging power of charger k at t, kW; and K is the number of chargers in the BSS.
- (2)
- Depreciation costs (Cd, yuan) are the depreciation expenses of batteries after charging and discharging. The depreciation costs of a battery (cc, yuan) after charging can be calculated by dividing the purchase or lease costs by the battery’s charging-cycle life. Nc is the number of fully charged batteries in a day. Cd can be defined as:With the application of V2G, depreciation costs should consider discharging depreciation costs:where cd (yuan) is the depreciation cost of a battery after discharging, which is the value of the purchase or lease costs divided by the battery’s discharging-cycle life. Nd is the number of batteries that are fully discharged in a day.
- (3)
- Operation and maintenance costs (Cm, yuan) are related to the equipment configuration of the BSS, including the chargers and batteries, which can be determined by:where Z is the number of batteries in the BSS. A higher K and Z lead to a higher Cm.
3. Operation Model of BSS
3.1. Objective Function
The objective function seeks to maximize the profits of the BSS. Without considering the V2G technology, the function of BSS’s profits in a day is expressed as:
If the BSS can earn from feeding electricity into the power grid with V2G technology, the function of BSS’s profits in a day should be defined as:
3.2. Constraint Conditions
We set the following constraints to achieve the operation of BSS:
(1) Constraint of battery swapping demand:
The BSS should meet the battery swapping demand of users, which means that the number of fully charged batteries in the BSS cannot be less than the number of swapping batteries:
where S(t) is the number of fully charged batteries in the BSS at t, and β is the battery number of one EV. It supposes that EVs are the same model and that they replace all the batteries each time.
(2) Constraint of the number of chargers:
The number of charging batteries at t (F(t)) should not be more than the number of chargers (K) in the BSS:
(3) Constraint of the number of discharging devices:
The number of discharging batteries (W(t)) should not be more than the number of discharging devices (J):
(4) Constraint of the number of batteries:
The number of batteries in the BSS is certain. The number of fully charged, empty (E(t)), charging and discharging batteries on the charger and discharger should not be more than the total number of batteries. Empty batteries means swapped batteries or discharged batteries:
(5) Constraint of the battery charging process:
It takes Tf hours for empty batteries to be fully charged, and Tf is a positive integer that can be divided into Tf charging stages of 1, 2, …, Tf. The number of charging batteries in each stage is F(1)(t), F(2)(t), …, and F(Tf)(t), respectively. The constraint can be expressed as follows:
The number of fully charged batteries in a day can be expressed as:
(6) Constraint of the battery discharging process:
This presumes that the fully charged batteries take Tw hours to fully discharge. Tw is a positive integer that can be divided into Tw discharging stages of 1, 2, …, Tw. The number of discharging batteries in each stage is W(1)(t), W(2)(t), …, and W(Tw)(t), respectively. The constraint can be described as follows:
The total number of discharged batteries in a day is expressed as:
(7) Constraint of the number of fully charged batteries:
The number of fully charged batteries should maintain a dynamic balance in the BSS:
(8) Constraint of the number of empty batteries:
The number of empty batteries should maintain a dynamic balance in the BSS:
(9) Integer constraint of number of batteries:
S(t), F(t), W(t), E(t), F(i)(t), W(j)(t), N(t), β, K, D, Z are all positive integers. i represents 1, 2, …, Tf, and j represents 1, 2, …, Tw.
3.3. Assumptions
The following assumptions simplify the model without affecting the operation of BSS:
- (1)
- Once batteries are put on chargers, the charging power of the chargers is considered as their rated charging power (Pc). Taking account of the charging efficiency of batteries (ηc), the actual charging power can be defined as:where Pd is the rated discharging power of discharging devices, and ηd is the discharging efficiency of batteries. The actual discharging power is expressed as:
- (2)
- A charger can only charge one battery at a time.
- (3)
- The time that a mechanical arm swaps batteries for EVs and puts them on the charger is between four and six minutes, a much shorter period than the charging or discharging period of one hour. It can therefore be ignored here. Based on the previous assumption conditions, Equation (7) can be simplified as follows:Taking account of the discharging of BSS, Equation (8) can be expressed as:
Since there are many parameters in the papers, the nomenclature of the parameters are shown in Table A1 (Appendix A).
4. Empirical Analysis
4.1. Basic Data
A Beijing BSS and BAIC Motor EV200 (BAIC BJEV, Beijing, China) are used as the examples for analysis. The parameters of BSS [27] and BAIC Motor EV200 [28] are shown in Table 1 and Table 2, respectively. The electricity price of BSS in Beijing is the industrial TOU [29] shown in Table 3.
The battery swapping price of BSS is 0.6 yuan/km, which is charged by driving mileage. In addition, the battery depreciation costs of a battery after a single charging session is 9 yuan [19]. Batteries take 2 h to fully charge or discharge (Tf = 2 h, Tw = 2 h). Since there are no dischargers in the BSS, the number of dischargers is assumed as 500 units in the paper. Table 4 shows the number of EVs for swapping batteries and the average driving mileage (), which are obtained by fitting the battery-swapping-demand data of battery electric taxis to a South China BSS.
4.2. Scenario Simulation
The total equipment investment and daily maintenance costs of BSS are related to the number of chargers and batteries. BSS income originates from two main sources: battery swapping service and discharging. Therefore, we design nine scenarios based on the different number of chargers and batteries, charging optimization or not, and discharging or not. The discharging price is also the TOU shown in Table 3. In addition, the increased device investment in the discharge process will not be considered here because it would not affect the overall operation analysis of the model.
Charging optimization means that the BSS applies the charging strategy by considering the electricity price, number of batteries and number of chargers instead of charging the batteries as soon as they are swapped. Scenario 1 (S1) uses the basic data of the Beijing BSS without the charging optimization, which means that the swapped batteries are put on the chargers once they are swapped from EVs. S2–S9 are optimized by the charging optimization model in Section 3. Besides, the corresponding model and the equations of S2–S9 are shown in Table A2. The equipment investment and daily maintenance costs in S2–S9 are obtained by the arithmetic descending of those in S1. It shows the device configuration, investment scheme, and operation mode of BSSs in Table 5.
4.3. Operation Analysis
Based on the data in Table 5, we use the linear programming method to solve the optimized model in Section 3. Table 6 shows BSS income and costs for nine scenarios.
As shown in Table 6, because the number of EVs for swapping batteries is stable over a period, the battery swapping service incomes of BSSs would not change under the particular demand of Table 2. Maintenance costs are related to the equipment configuration of the BSS. Therefore, the increased number of chargers and batteries will directly affect investment, operation, and maintenance costs of the BSS. Compared with S1 and S2, if the BSS does not apply the charging optimization strategy, it will see a loss of 26,806.8 yuan and increase the battery depreciation costs. As shown in Table 6, because of the lack of ordered charge optimization in S1, the charging cost of S1 is 26,134 yuan, which is more than that of S2. The combination of S1 and S3, reducing the number of chargers, will not affect the normal operation of the BSS under the current battery swapping demand and the equipped number of batteries. In contrast, it will reduce the equipment investment and maintenance costs and make the BSS more profitable. When there are not enough chargers, however, if the number of batteries decreases to 800, the BSS will take a loss in S4 and S5. Compared with S3 and S4, when there are 200 chargers, the possibility of valley charging will increase with the increased number of batteries. This results in reducing the charging costs and increasing profits. Unlike in S1–S5, the profits of discharging are considered in S6–S9. As shown in Table 5, the number of chargers and batteries in S6–S9 are equal to that in S2–S5. According to the statistics in Table 3, Table 4, Table 5 and Table 6, in the case of the same device configuration, if discharging is taken into account, it will enhance the profits of the BSS.
4.4. Sensitivity Analysis
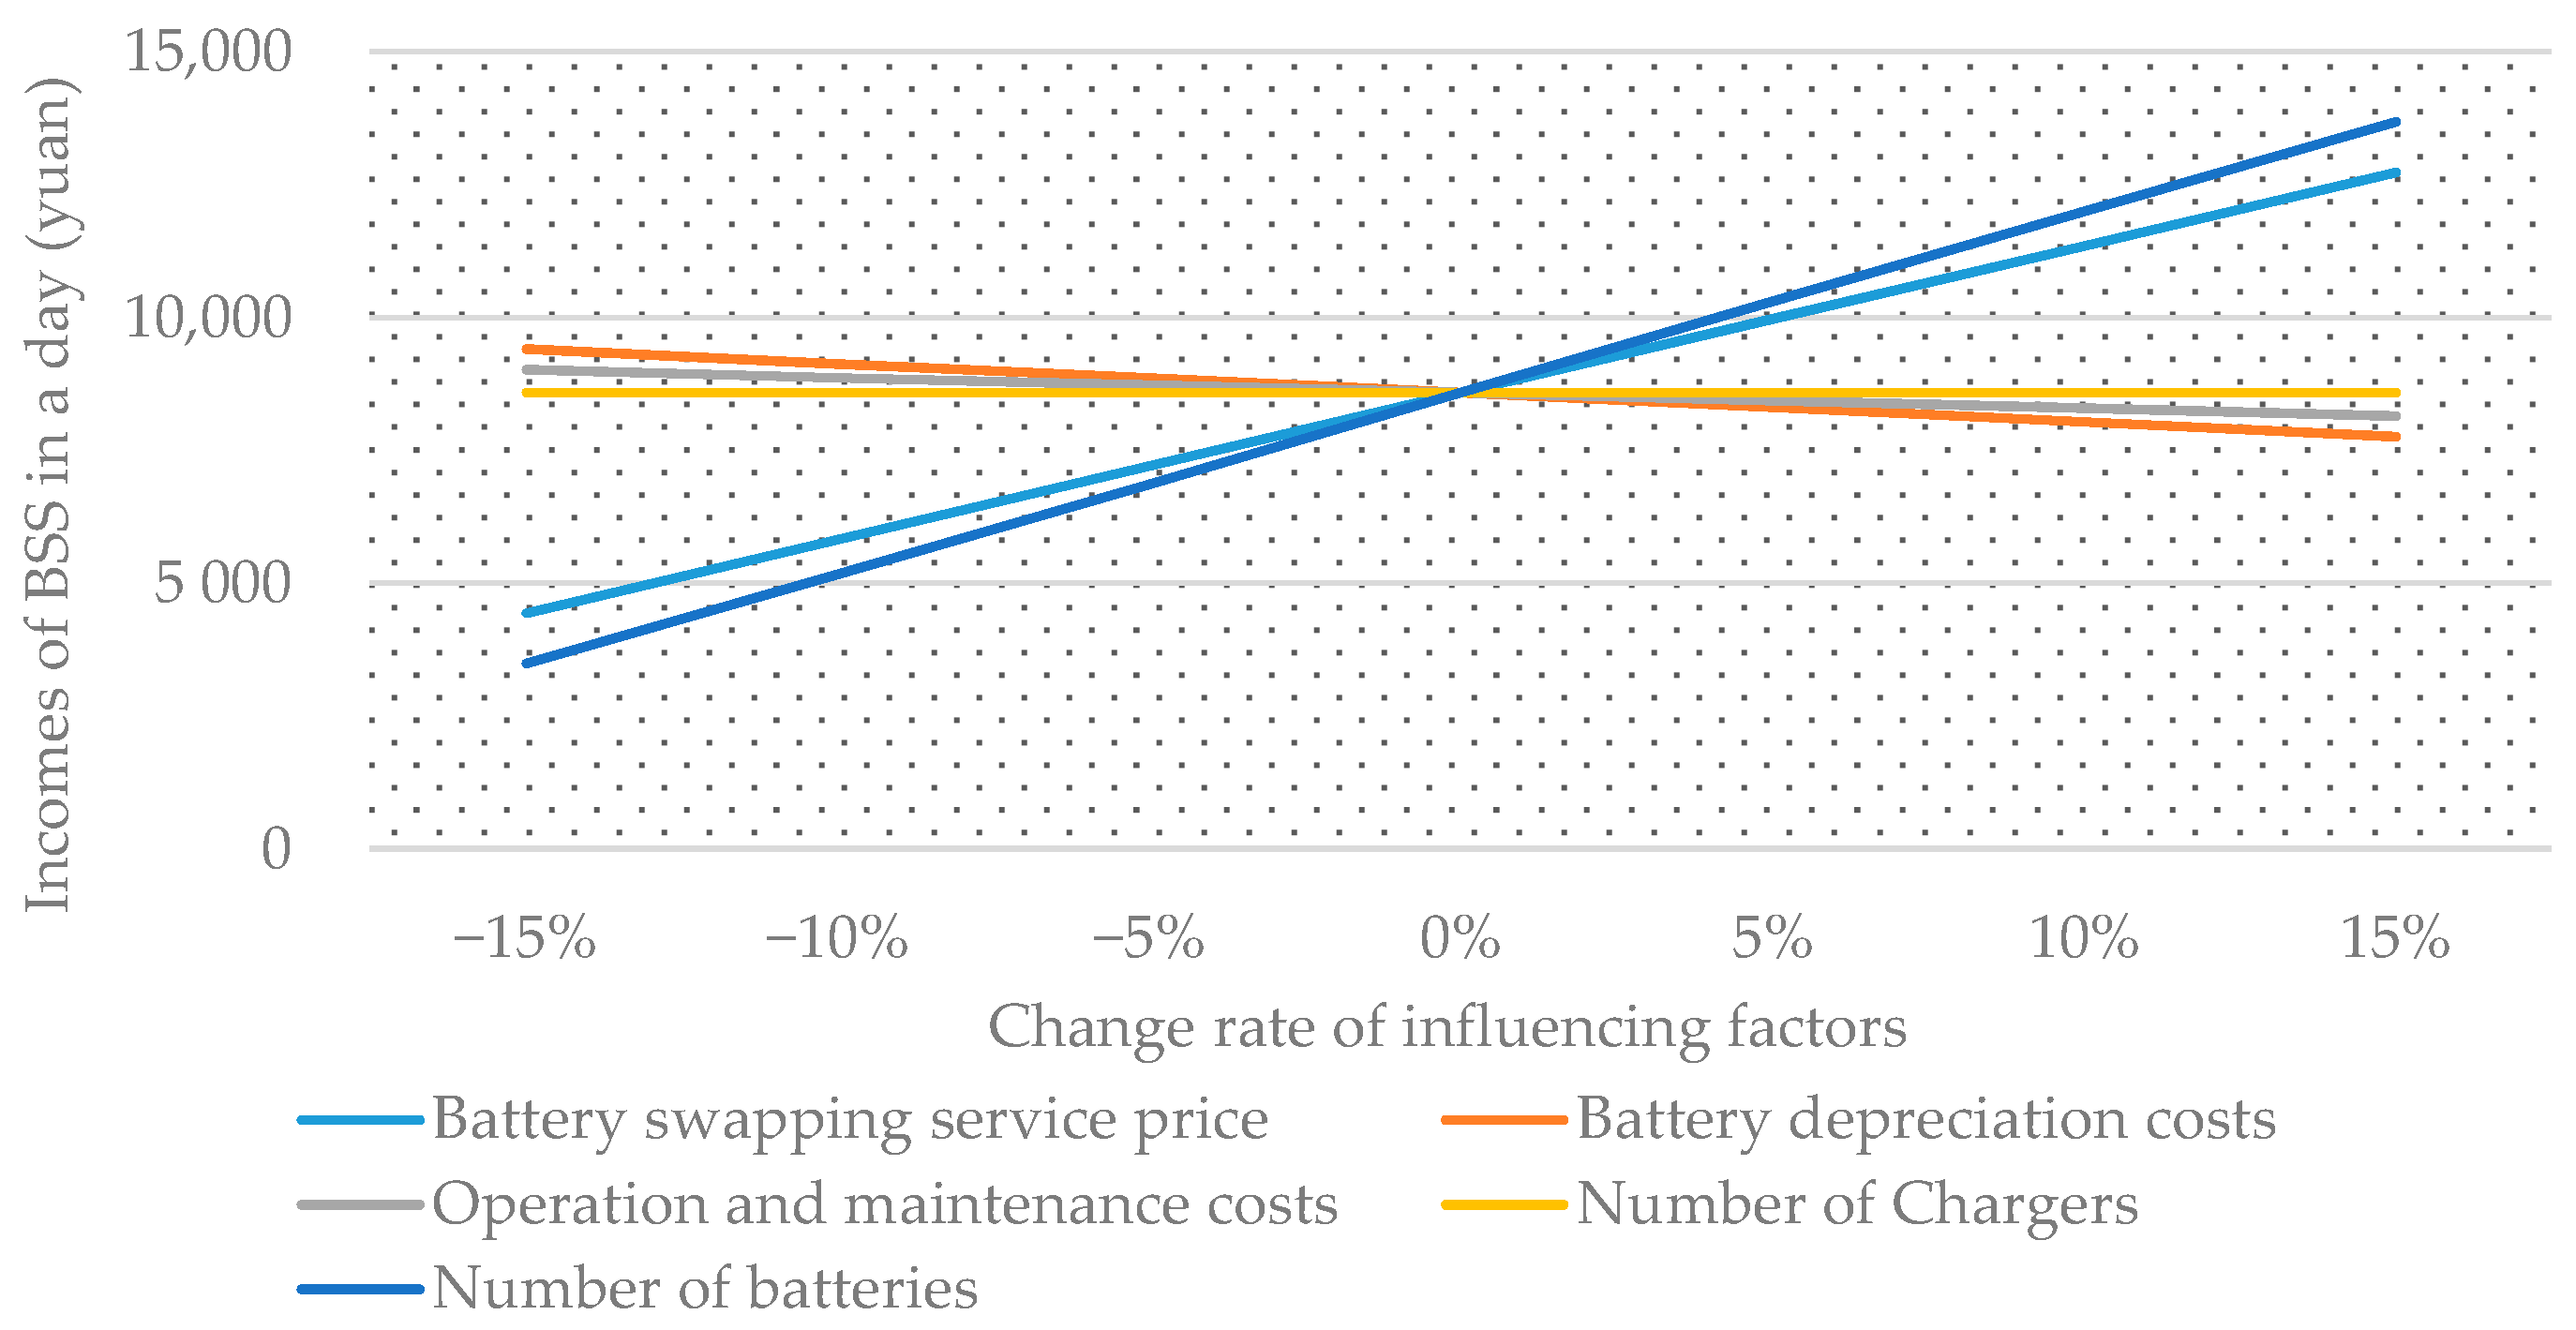
Section 4.3 analyzes the operation status of the BSS in different scenarios and indicates that the number of chargers and the number of batteries greatly influence the operation income of the BSS. To determine the sensitivity factors that impact BSS profits, we change the value of a single factor to test its sensitivity. We use the profits of BSSs as the sensitivity evaluation index and the incomes of a day in S2 as the target value of the technology scheme. According to the optimized functional formula, the main factors that influence the profits of the BSS include the battery swapping price, battery depreciation costs, operation and maintenance costs, and number of chargers and batteries. Because the electricity price is very stable in China, it will not be considered in the sensitivity analysis.
Figure 2 shows the sensitivity of various factors. The sensitivity of the battery swapping price and number of batteries is greater than that of the other factors, while the sensitivity of the operation and maintenance costs and battery depreciation costs is much lower. The gain-loss balance point of the BSS should be 8587.1 yuan. When the battery swapping price is less than 0.4137 yuan/km, the BSS will take a loss. When there are fewer than 828 batteries, the BSS will earn negative income. Therefore, it should formulate a reasonable price for battery swapping service and equip a suitable number of batteries for the BSS.
When the number of chargers varies the amplitude between −15% and 15%, the profits of the BSS are unchanged. This means that the amplitude between −15% and 15% of the number of chargers would not affect the profits of the BSS. If the number of chargers is decreased, however, it can reduce the investment costs and operation and maintenance costs, which results in gaining more profits for the BSS. To further analyze the impact of the number of chargers, we describe the profit trend of the BSS with a decreasing number of chargers. In Figure 3, when the number of chargers is reduced from 1044 to 150, the profits of the BSS begin to diminish. This demonstrates that the relationship between the number of chargers and daily profits of the BSS is not increasing monotonically; rather, there exists a balance point. After the number of chargers reaches a certain threshold, even if it increases, the profits of the BSS will not increase. Therefore, finding the reasonable battery swapping price and suitable number of chargers and batteries are important to maximize the economic benefits of the BSS.
The daily profit of the BSS is 6994 yuan when there are 62 chargers. Chargers can simultaneously charge no more than 62 batteries, as shown in Figure 3. To meet the demand of battery swapping, the BSS should be equipped with 1104 batteries. Doing so, however, would increase the fixed asset investment costs in the initial period when there are 62 charging batteries. Moreover, it is not conducive for the BSS to participate in the load shifting of the power grid. When K < 62, the BSS cannot meet the battery swapping demand and the model has no optimal solution. Thus, it is necessary to determine the appropriate number of chargers to achieve the benefits of the BSS.
4.5. Ordered Charging and Discharging Strategy for BSS
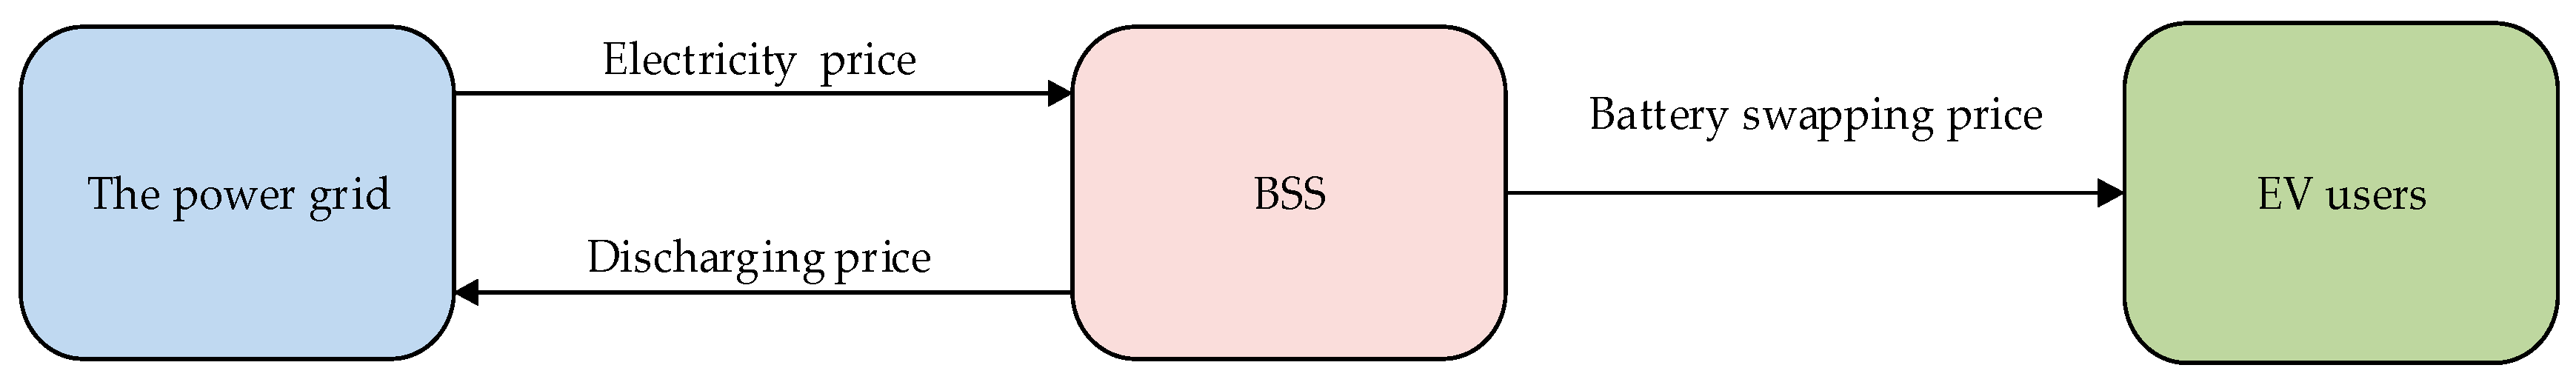
The electricity price, discharging price and battery swapping price are related to the interest of multiple stakeholders, including the power grid, EV users, charging and swapping facility operators and battery manufacturers. Figure 4 shows the definition of the battery swapping price. The power grid uses the general industrial TOU to charge for the electric power that it transmits to the BSS. The discharging price is applied to calculate the electricity fee when the power grid purchases the electricity from the BSS. The BSS utilizes the battery swapping price to determine the battery swapping service fee of EV users.
The example above aims to maximize profits of the BSS, while the impact of the battery charging arrangement on the power grid’s load is not researched. Thus, in Section 4.5.1, we propose two ordered charging and discharging strategies to analyze their effects on the BSS’s profits and load shifting on the power grid.
4.5.1. Ordered Charging and Discharging Strategy Based on the Electricity Price of TOU
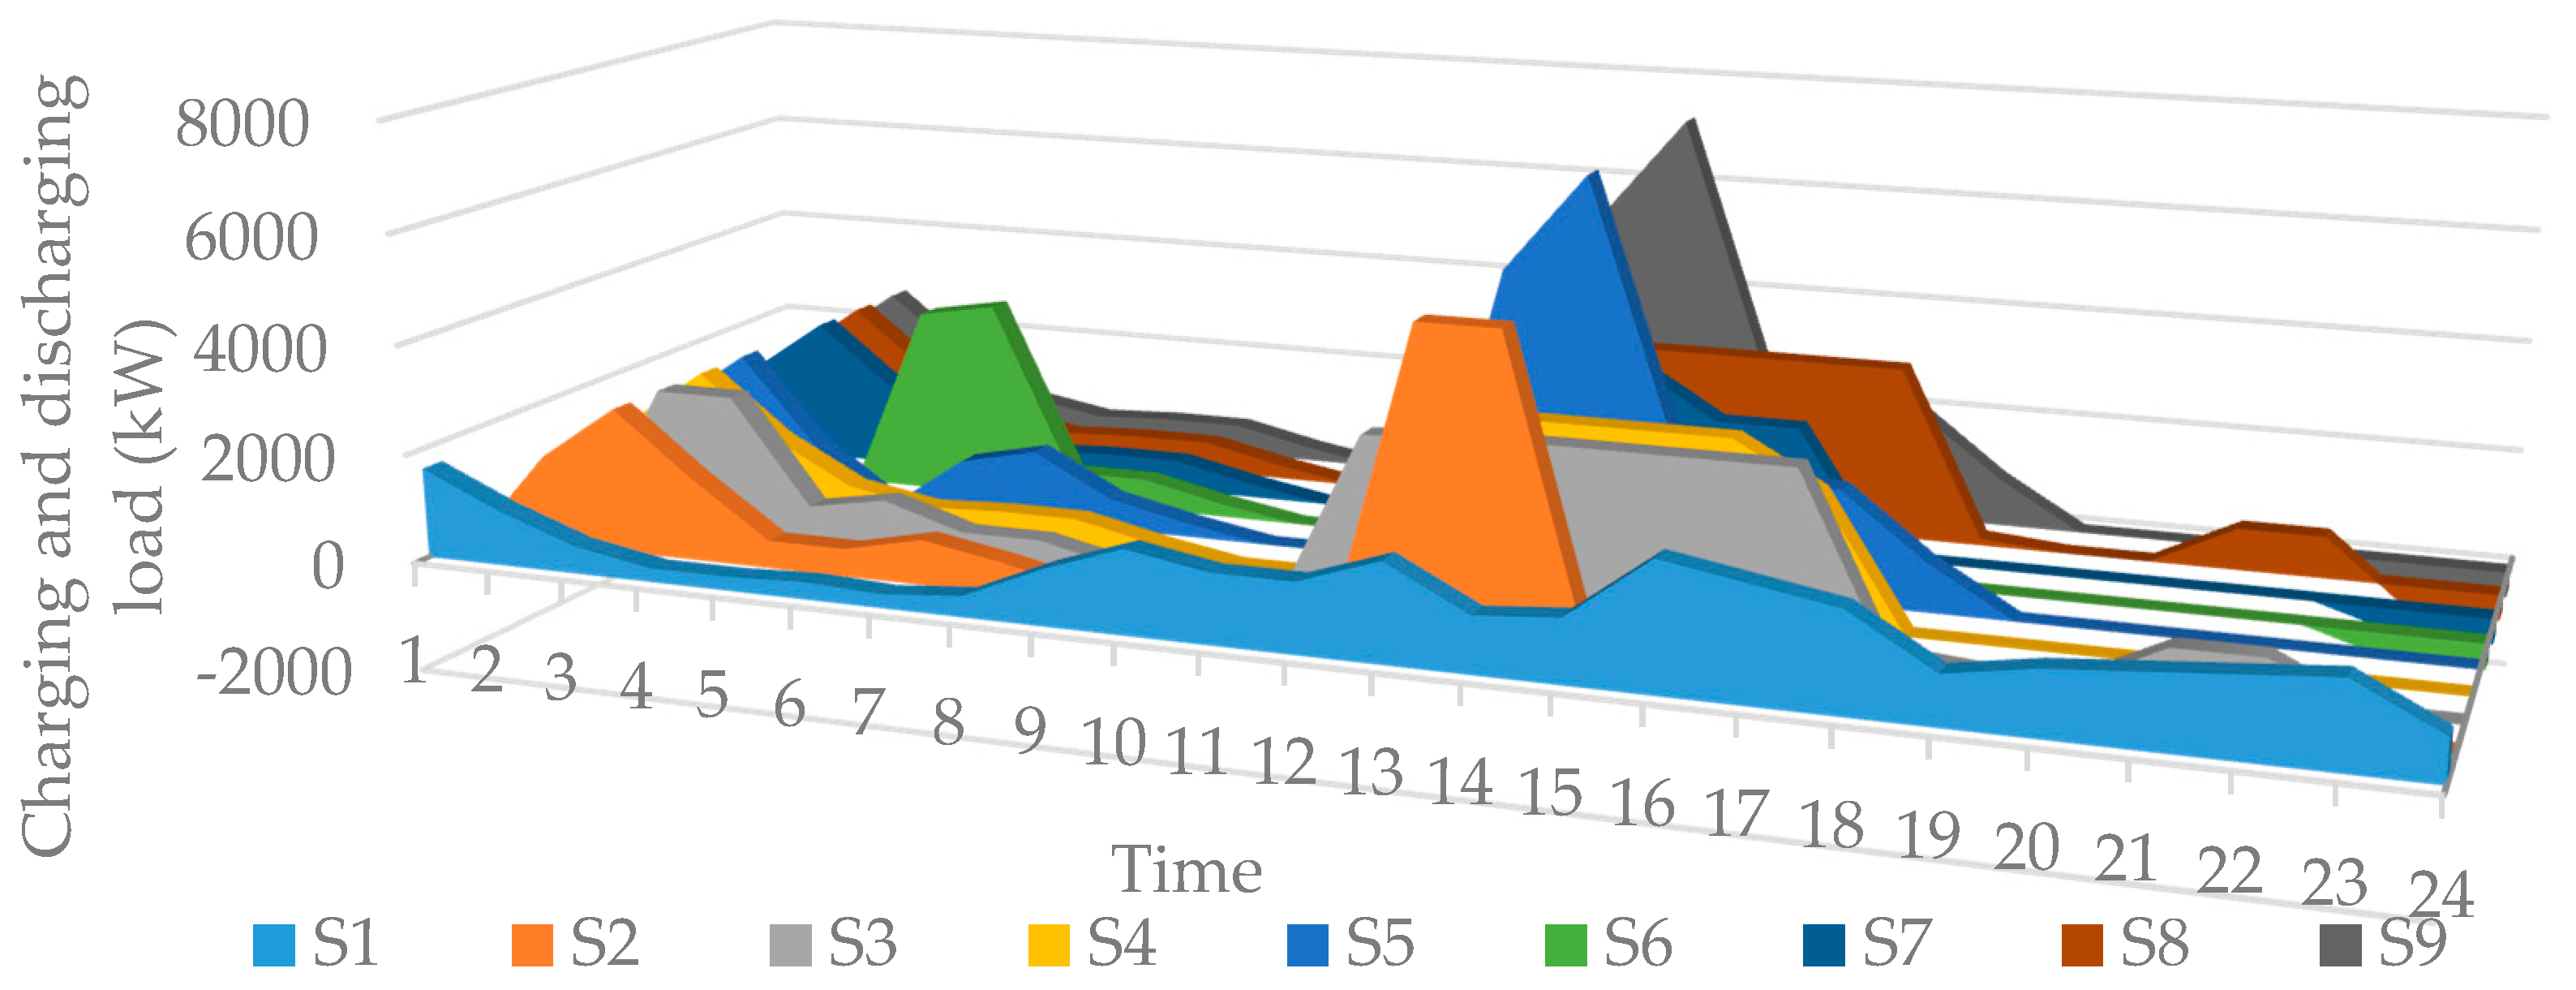
The electricity price and discharging price are the electricity price of TOU, and the battery swapping price is 0.6 yuan/km according to the existing fee standard of the BSS. We analyze the effects of the ordered charging and discharging strategy based on the electricity price of TOU (C1) with data from the BSS of Beijing in the nine scenarios. Equation (21) is the objective function of programming model, and Equations (9)–(18) with the Constraint (9) are the constraint conditions. We use the linear programming method to solve the number of charging batteries and the power and efficiency of charging and discharging. Figure 5 shows the load distribution of the BSS in different scenarios.
The figure shows that the load of the BSS is concentrated in the valley period from 00:00 to 06:00 and the average period from 12:00 to 16:00 in Figure 5. There is a small amount of battery charging in the peak period of 08:00–12:00 and 17:00–21:00, which demonstrates that the proposed model can not only guarantee the economic operation and battery-swapping demand of the BSS but also respond to the load-shifting demand of the power grid according to TOU. The results of the scenario simulation show that it can concentrate more charging load during the valley period when the number of batteries and chargers is sufficient. Because there are more batteries in S6 than in S9, the charging load of S6 is higher than that of S9 in the valley period from 00:00 to 08:00. Because the battery stock of S9 is inadequate, the BSS must charge batteries from 12:00 to 17:00 to meet the battery swapping demand. In fact, the aim of the ordered charging and discharging strategy is to arrange the number and charging/discharging times of BBS batteries in each period. Table 7 shows the charging arrangement of the BSS batteries in S1 and S2. F1(t), F1(1)(t), F1(2)(t) and E1(t) represent the number of charging batteries, the number of batteries in the first charging stage, the number of batteries in the second charging stage, and the number of empty batteries in S1, respectively. F2(t), F2(1)(t), F2(2)(t) and E2(t) represent those in S2.
Table 7 shows that, due to the appropriate arrangement of batteries in the BSS, charging costs decrease after charging optimization. C1 can not only meet the demand of battery swapping but also achieve concentrated charging in the low price phase from 2:00 to 9:00. Therefore, the reasonable arrangement can improve the profitability of the BSS.
4.5.2. Ordered Charging and Discharging Strategy Based on DR
The power grid coordinates the charging and discharging of batteries in the BSS by the electricity price of TOU in Section 4.5.1. The method by which the power grid guides the BSS to charge and discharge in an orderly fashion is called the price-based DR. Similarly, it can be applied to the battery swap pricing between BSS and EV users. The battery swapping price is fixed under C1 in Section 4.5.1. Thus, in Figure 5, it can be seen that the BSS charges the batteries not only in the valley price period but also in the average price period. Unlike Section 4.5.1, the battery swapping price here is based on TOU instead of the fixed price under the ordered charging and discharging strategy based on DR (C2). Combined with Beijing’s electricity price of TOU and the existing driving characteristic of electric taxis, Table 8 shows that the tiered battery swapping price fluctuates between −10% and 10% on the basis of the initial battery swapping price (0.6 yuan/km).
To reduce the battery swapping costs, price-sensitive users will choose to swap batteries in the valley price period. N is the number of EVs whose users would like to respond to the tiered battery swapping price and swap their batteries in the valley price period. N is the number of EVs coming to the BSS to swap batteries. It can determine the degree of DR with the user transfer proportion (σ) [30], which can be described as:
We use the basic data in Table 1 and Table 2 for the parameters of the BSS and EVs. In Table 9, the battery swapping demand and average driving mileage of EVs are based on the data from a BSS in South China, and σ is assumed to be 0.3.
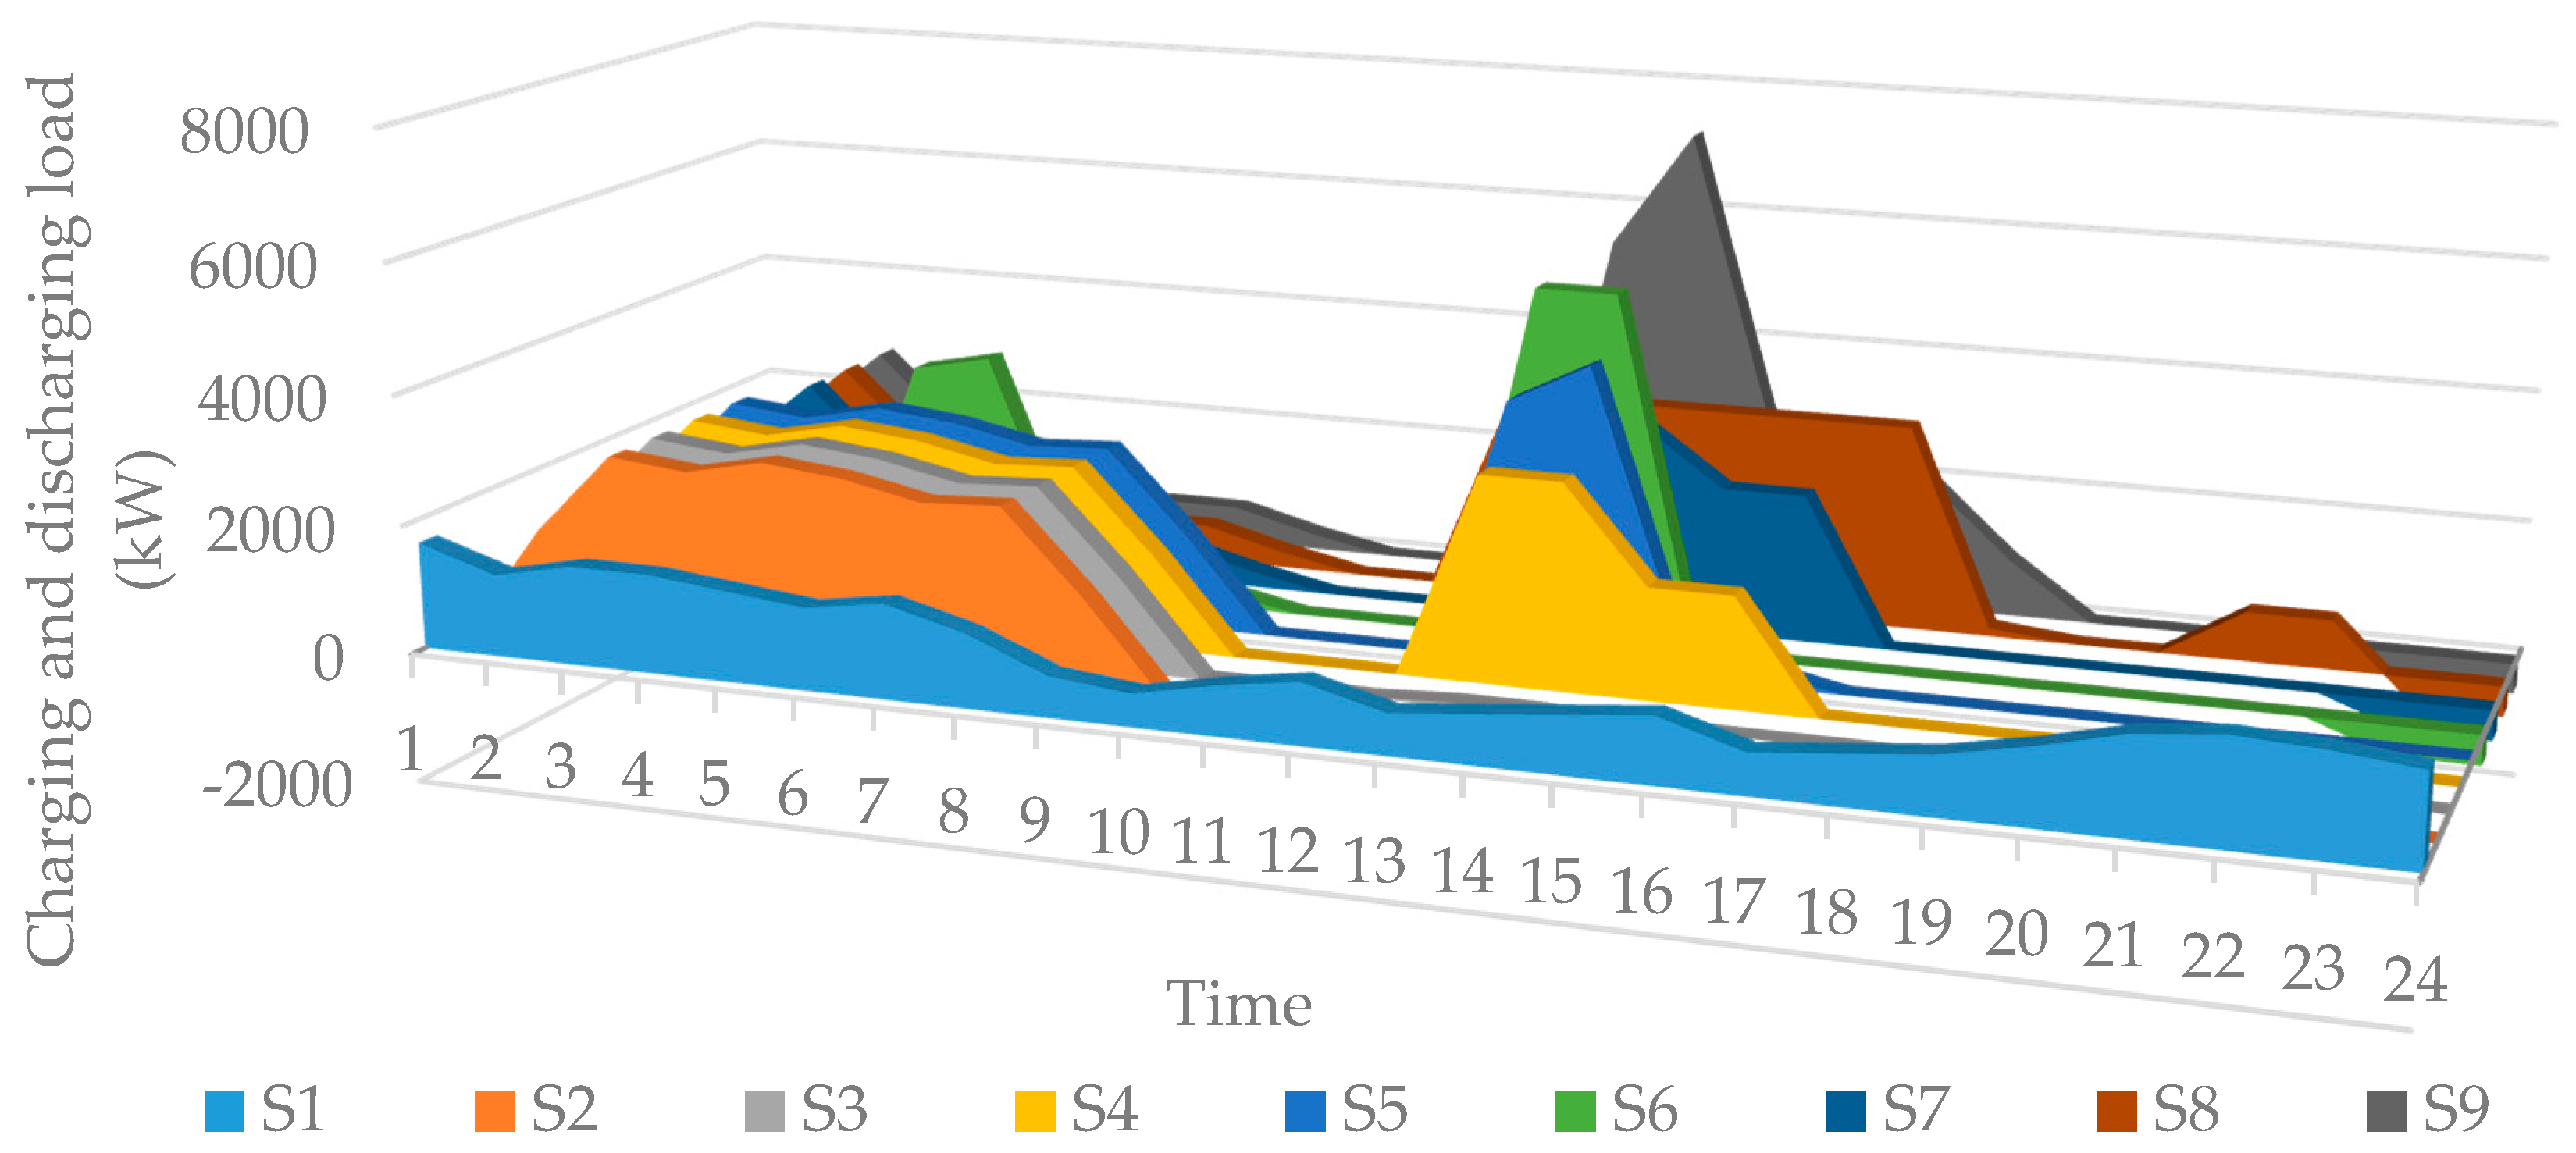
The objective function is Equation (21), and the constraint conditions are Equations (9)–(18). The number of chargers and the power and efficiency of charging and discharging are found using the linear programming method, and the results showing the BSS load under different scenarios appear in Figure 6. The BSS load is mainly concentrated in the 00:00–08:00 and 13:00–16:00 periods, and there is little BSS load from 17:00 to 19:00. Because there is a large number of chargers and batteries in S2 and S3, there are no excess batteries that need to be charged during the stage of high battery swapping demand between 14:00 and 18:00. Due to the lower number of chargers and batteries in S5 and S9, however, the BSS generates the peak charging load in the period between 14:00 and 18:00. Comparing Figure 6 with Figure 5, the BSS can arrange more batteries to be charged in the valley period between 00:00 and 08:00 by stimulating the user responding to the incentive price. Moreover, there are few batteries charging in the peak period of 08:00–12:00 and 17:00–21:00. This demonstrates that the proposed operation model can not only meet the battery swapping demand but also respond to the load-shifting demand of the power grid.
The number arrangement of charging and discharging batteries is shown in Table 10. The positive number represents the number of charging batteries, and the negative number indicates the number of discharging batteries.
5. Conclusions
The large-scale development of EVs requires not only the support of mature battery technology but also the construction of a complete charging infrastructure. Ensuring the benefits of charging infrastructure and encouraging individuals to participate in the safe operation of the power grid can help to achieve the ordered charging and discharging of EVs, which is of great significance to the large-scale development of EVs. Based on the analysis of BSS’s operation modes, this paper develops a linear programming model that aims to maximize the daily profits of the BSS. This paper uses the parameters of BSSs and battery-operated electric taxis of Beijing as the basic data source. Moreover, on the premise of satisfying the battery swapping demand of EVs, this model mainly considers the constraint conditions of the number of batteries, number of chargers, and battery charging power. Based on the multi-scenario simulation and sensitivity analysis, we analyze the economical operation of the BSS. Furthermore, this paper simulates the charging and discharging load of BSSs in different scenarios under two charging and discharging strategies based on the electricity price of TOU and DR, respectively. The research results and conclusions are as follows:
- (1)
- The scenario simulations prove that the proposed model can maximize the profits of BSS operators by effectively deploying batteries and chargers to work. If the BSS applies the method of charging the swapped batteries simultaneously; however, it will cause serious losses because of the greatly increasing charging costs and battery depreciation costs.
- (2)
- The sensitivity analysis determines the factors influencing BSS profits. The sensitivity of the battery swapping price is the greatest, followed by the sensitivity of the number of batteries. The sensitivity of operation and maintenance costs and battery depreciation costs is small. It is worth noting that the relationship between the number of chargers and BSS’s profits is not increasing monotonically. There is a balance point. When the number of chargers reaches a certain threshold, the profits of the BSS will not improve even if the number of chargers is increased. Therefore, it is important for the BSS to formulate a reasonable battery swapping price and be equipped with the appropriate number of chargers and batteries. In addition, reducing the depreciation costs of batteries is beneficial to BSS and EV users.
- (3)
- To achieve greater profits, the BSS should charge the batteries in the valley and average load periods. The battery swapping demand of users is more concentrated in the average period than in the valley period, however, which will cause a loss in revenue. The charging and discharging strategy based on DR can provide the incentive price to both BSSs and users. The empirical example shows that the incentive price is conducive to the economic operation of BSSs and the stability of the power grid load.
Acknowledgments
The authors would like to thank the anonymous referees and the editor of this journal. The authors also gratefully acknowledge the financial support of the National Natural Science Foundation of China (Grant No. 71473083), the Major Program of the National Social Science Fund of China (Grant No. 15ZDB165), and the Fundamental Research Funds for the Central Universities (2016XS86).
Author Contributions
In this paper, Yanni Liang carried out the operation mode, established the operation model for the BSS, and wrote Section 2 and Section 3; Xingping Zhang analyzed the results of the scenario simulation and sensitivity analysis; Jian Xie tested the effect of the charging and discharging strategy for the BSS and wrote Section 4; and Wenfeng Liu collected the related data and basic parameters for the BSS operation model and wrote Section 5.
Conflicts of Interest
The authors declare no conflict of interest.
Appendix A

Table A1.
List of main parameters.
| Parameters | Description of Parameters | Unit |
|---|---|---|
| Is | Battery swapping incomes of the BSS in one day | yuan |
| Ps | Battery swapping price per driving mileage unit or per electricity unit | yuan/kWh |
| t | Time interval of a day | h |
| Mi(t) | Driving mileage or battery electricity consumption of EV i at t, km or kWh | km or kWh |
| N(t) | Number of EVs for swapping batteries at t | - |
| Id | Discharging incomes of the BSS in one day | yuan |
| Pg(t) | Feed-in tariff of BSSs at t | yuan/kWh |
| Pj(t) | Transmission power of discharging device j | kW |
| J | Number of discharging devices | - |
| Cc | Charging costs of BSS in one day | yuan |
| Pe(t) | Electricity price that the power grid supplies power to the BSS at t | yuan/kW |
| Pk(t) | Charging power of charger k at t | kW |
| K | Number of chargers in the BSS | - |
| Cd | Depreciation costs of BSS in a day | yuan |
| cc | Depreciation costs of a battery after charging | yuan |
| Nc | Number of fully charged batteries in a day | - |
| Discharging depreciation costs of BSS with the application of V2G in a day | yuan | |
| cd | Depreciation cost of a battery after discharging | yuan |
| Nd | Number of batteries that are fully discharged in a day | - |
| Cm | Operation and maintenance costs of BSS in a day | yuan |
| Z | Total number of batteries in the BSS | - |
| P | BSS’s profits in a day | yuan |
| P(V2G) | BSS’s profits with V2G technology in a day | yuan |
| S(t) | Number of fully charged batteries in the BSS at t | - |
| β | Battery number of one EV | - |
| F(t) | Number of charging batteries at t | - |
| W(t) | Number of discharging batteries at t | - |
| E(t) | Number of empty batteries at t | - |
| Tf | Hours for empty batteries to be fully charged | h |
| Tw | Hours for fully charged batteries to fully discharge | h |
| Pc | Rated charging power of the chargers | kW |
| Actual charging power when batteries are put on chargers | kW | |
| ηc | Charging efficiency of batteries | - |
| Pd | Rated discharging power of discharging devices | kW |
| Actual discharging power when batteries are put on discharging device | kW | |
| ηd | Discharging efficiency of batteries | - |
| BSS’s profits in a day based on the assumptions | yuan | |
| P′(V2G) | BSS’s profits with V2G technology in a day based on the assumptions | yuan |
Table A2.
S1–S9 and their relevant equations.
| Scenarios | Objective Functions | Constraints | Remarks |
|---|---|---|---|
| S1 | / | / | No optimization. Batteries are put on the chargers once the batteries are swapped from EVs. |
| S2–S5 | Equation (21) | Equations (9), (10), (12), (13), (17), (18) and Constraint (9) | Batteries are arranged by the optimization model but discharging is not considered in these scenarios. |
| S6–S9 | Equation (22) | Equations (9)–(13), (15), (17), (18) and Constraint (9) | Batteries are arranged by the optimization model and discharging is considered in these scenarios. |
References
- CO2 Emissions from Fuel Combustion 2016. Available online: https://www.iea.org/publications/freepublications/publication/CO2EmissionsfromFuelCombustion_Highlights_2016.pdf (accessed on 6 August 2016).
- Zhang, X.; Rao, R.; Xie, J.; Liang, Y. The current dilemma and future path of China’s electric vehicles. Sustainability 2014, 6, 1567–1593. [Google Scholar] [CrossRef]
- Global EV Outlook 2016. Available online: https://www.iea.org/publications/freepublications/publication/Global_EV_Outlook_2016.pdf (accessed on 8 August 2016).
- Sierzchula, W.; Bakker, S.; Maat, K.; van Wee, B. The influence of financial incentives and other socio-economic factors on electric vehicle adoption. Energy Policy 2014, 68, 183–194. [Google Scholar] [CrossRef]
- Luo, Z.; Hu, Z.; Song, Y.; Xu, Z.; Jia, L. Study on charging load modeling and coordinated charging of electric vehicles under battery swapping modes. Proc. Chin. Soc. Electr. Eng. 2012, 32, 1–10. [Google Scholar]
- Battistelli, C.; Baringo, L.; Conejo, A.J. Optimal energy management of small electric energy systems including V2G facilities and renewable energy sources. Electr. Power Syst. Res. 2012, 92, 50–59. [Google Scholar] [CrossRef]
- The Number of China’s Charging and Swapping Stations in 2015: 3600. Available online: http://www.chinabgao.com/k/chonghuandianzhan/22554.html (accessed on 8 August 2016).
- Notice on the Issuing the “Development Guideline of EV Charging Infrastructure (2015–2020)”. Available online: http://www.sdpc.gov.cn/zcfb/zcfbtz/201511/t20151117_758762.html (accessed on 13 August 2015).
- Zhang, W.; Xie, F.; Huang, M.; Li, J.; Li, Y. Research on short-term load forecasting methods of electric buses charging station. Power Syst. Prot. Control 2012, 4, 61–66. [Google Scholar]
- Wang, Z.; Sun, F.; Lin, C. Forecasting and simulation of the distribution capacity of E-bus charge station. Trans. Beijing Inst. Technol. 2006, 26, 1061–1064. [Google Scholar]
- Shi, L. Design for the Electric Vehicle Charging and Discharging Price Strategy from Demand Side Management Perspective; Chongqing University: Chongqing, China, 2012. [Google Scholar]
- Li, H. Electric Vehicle Ordered Charging Based on the Demand Side Response; Tianjin University: Tianjin, China, 2012. [Google Scholar]
- Yao, W.; Zhao, J.; Wen, F.; Xue, Y.; Xin, J. A charging and discharging dispatching strategy for electric vehicles based on bi-level optimization. Autom. Electr. Power Syst. 2012, 36, 30–37. [Google Scholar]
- Zhang, C. Analysis on Electric Vehicle Integration Technology and Social Comprehensive Benefits; Zhejiang University: Hangzhou, China, 2013. [Google Scholar]
- Zhang, S.; Hu, Z.; Song, Y.; Liu, H.; Masoud, B. Research on unit commitment considering interaction between battery swapping station and power grid. Proc. Chin. Soc. Electr. Eng. 2012, 32, 49–55. [Google Scholar]
- Deng, C.; Liang, N.; Tan, J.; Wang, G. Multi-Objective Scheduling of Electric Vehicles in Smart Distribution Network. Sustainability 2016, 8, 1234. [Google Scholar] [CrossRef]
- Soares, J.; Sousa, T.; Morais, H.; Vale, Z.; Canizes, B.; Silva, A. Application-Specific Modified Particle Swarm Optimization for energy resource scheduling considering vehicle-to-grid. Appl. Soft Comput. J. 2013, 13, 4264–4280. [Google Scholar] [CrossRef]
- Du, C.; Zhang, H.; Li, J.; Hu, C. Application of electric vehicle access network technology in intellectual grid. East China Electr. Power 2010, 38, 557–560. [Google Scholar]
- Sun, W.; Wang, C.; Zeng, P.; Zhang, Y. An optimal charging/discharging strategy for electric vehicle battery swapping stations based on linear optimization. Autom. Electr. Power Syst. 2014, 38, 21–27. [Google Scholar]
- Yang, T.; Long, R.; Li, W.; Rehman, S. Innovative Application of the Public–Private Partnership Model to the Electric Vehicle Charging Infrastructure in China. Sustainability 2016, 8, 738. [Google Scholar] [CrossRef]
- Robinson, J.; Brase, G.; Griswold, W.; Jackson, C.; Erickson, L. Business models for solar powered charging stations to develop infrastructure for electric vehicles. Sustainability 2014, 6, 7358–7387. [Google Scholar] [CrossRef]
- Zhang, X.; Rao, R. A benefit analysis of electric vehicle battery swapping and leasing modes in China. Emerg. Mark. Financ. Trade 2016, 52, 1414–1426. [Google Scholar] [CrossRef]
- Díaz, A.R.; Ramos-Real, F.J.; Marrero, G.A.; Perez, Y. Impact of electric vehicles as distributed energy storage in isolated systems: The case of tenerife. Sustainability 2015, 7, 15152–15178. [Google Scholar] [CrossRef]
- Zhang, N.; Chen, Z. Sustainability characteristics of China’s Poyang Lake Eco-Economics Zone in the big data environment. J. Clean. Prod. 2015, 142, 642–653. [Google Scholar] [CrossRef]
- Rao, R.; Zhang, X.; Xie, J.; Ju, L. Optimizing electric vehicle users’ charging behavior in battery swapping mode. Appl. Energy 2015, 155, 547–559. [Google Scholar] [CrossRef]
- Zhang, X.; Xie, J.; Rao, R.; Liang, Y. Policy incentives for the adoption of electric vehicles across countries. Sustainability 2014, 6, 8056–8078. [Google Scholar] [CrossRef]
- Operation Scale of Beijing Gaoantun Battery Swapping Station Is the Largest in China. Available online: http://www.xcar.com.cn/bbs/viewthread.php?tid=16866400 (accessed on 13 July 2016).
- BAIC BJEV Configuration Table of EV200. Available online: http://www.bjev.com.cn/car/ev200 (accessed on 13 July 2016).
- The Peak-Valley Time-of-Use Tariff Table of Beijing. Available online: http://www.docin.com/p-46109455.html (accessed on 23 July 2016).
- Wang, J.; Liu, C.; Ton, D.; Zhou, Y.; Kim, J.; Vyas, A. Impact of plug-in hybrid electric vehicles on power systems with demand response and wind power. Energy Policy 2011, 39, 4016–4021. [Google Scholar] [CrossRef]
Figure 1.
Battery swapping mode of BSS.
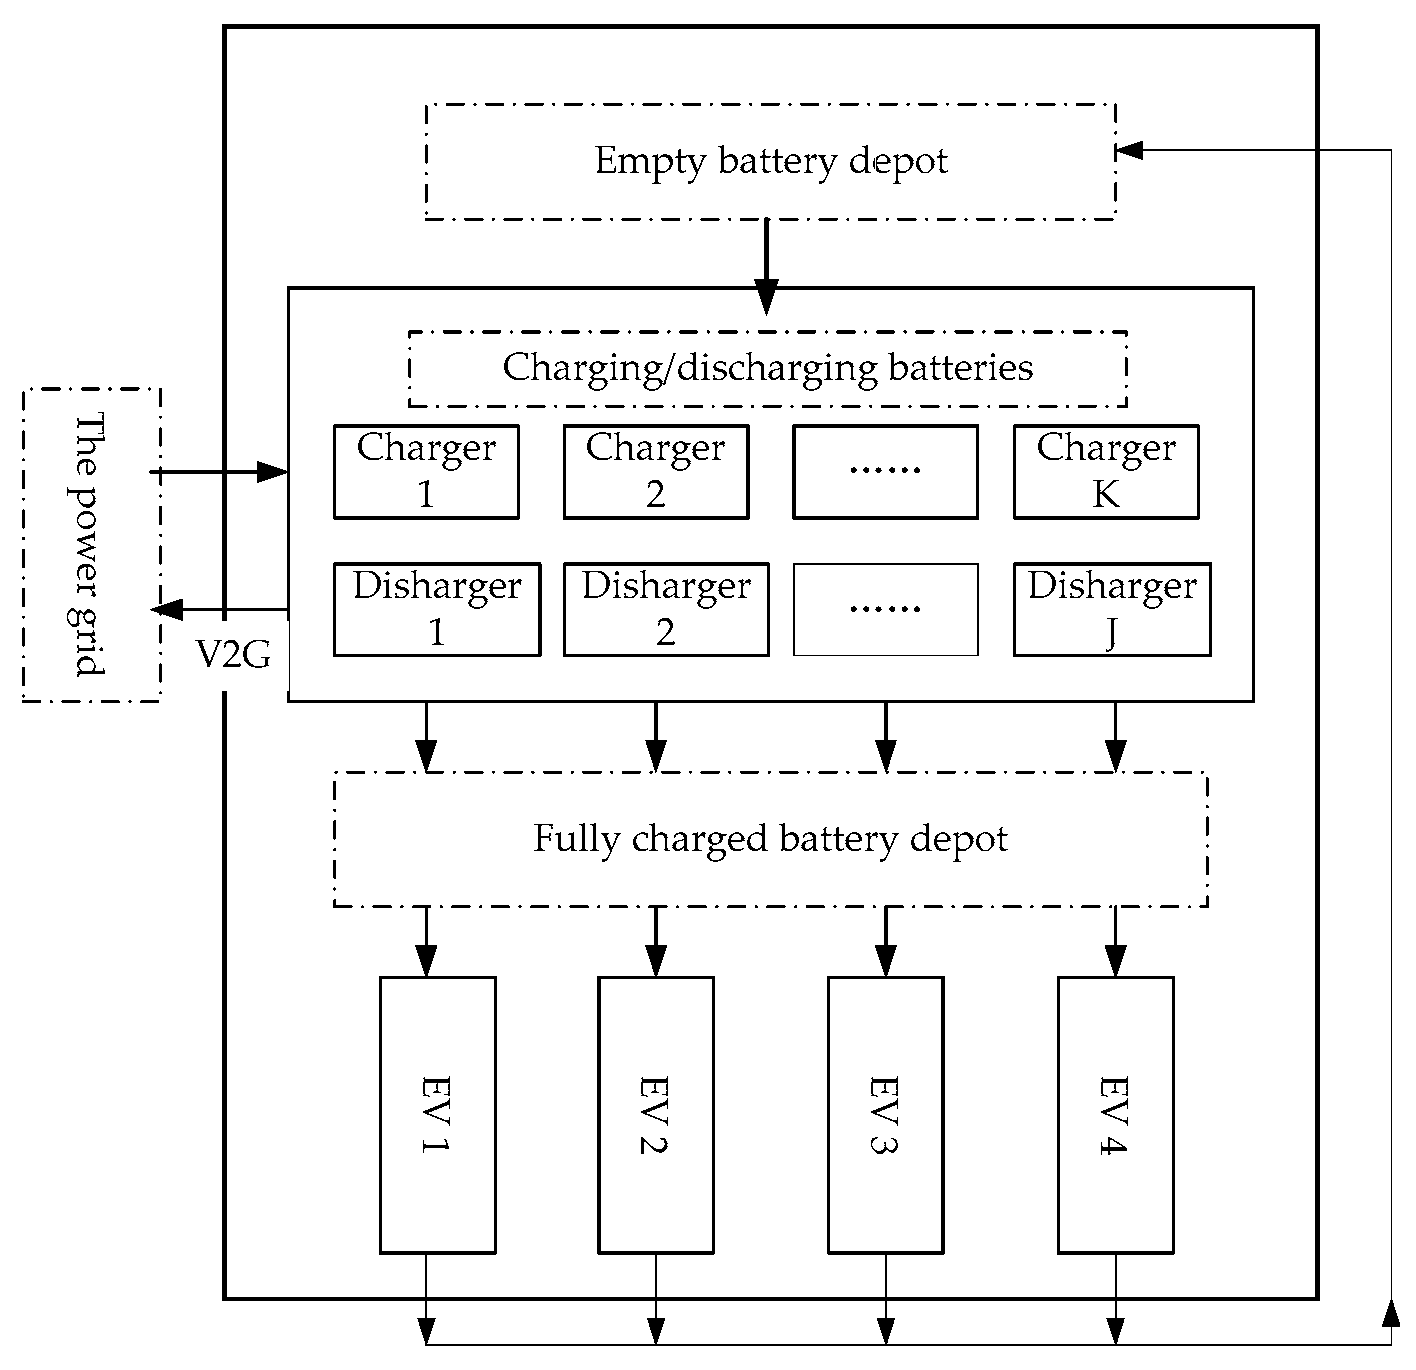
Figure 2.
Single factor sensitivity analysis of various factors.

Figure 3.
Relationship curve of chargers’ number and BSS’s profits.
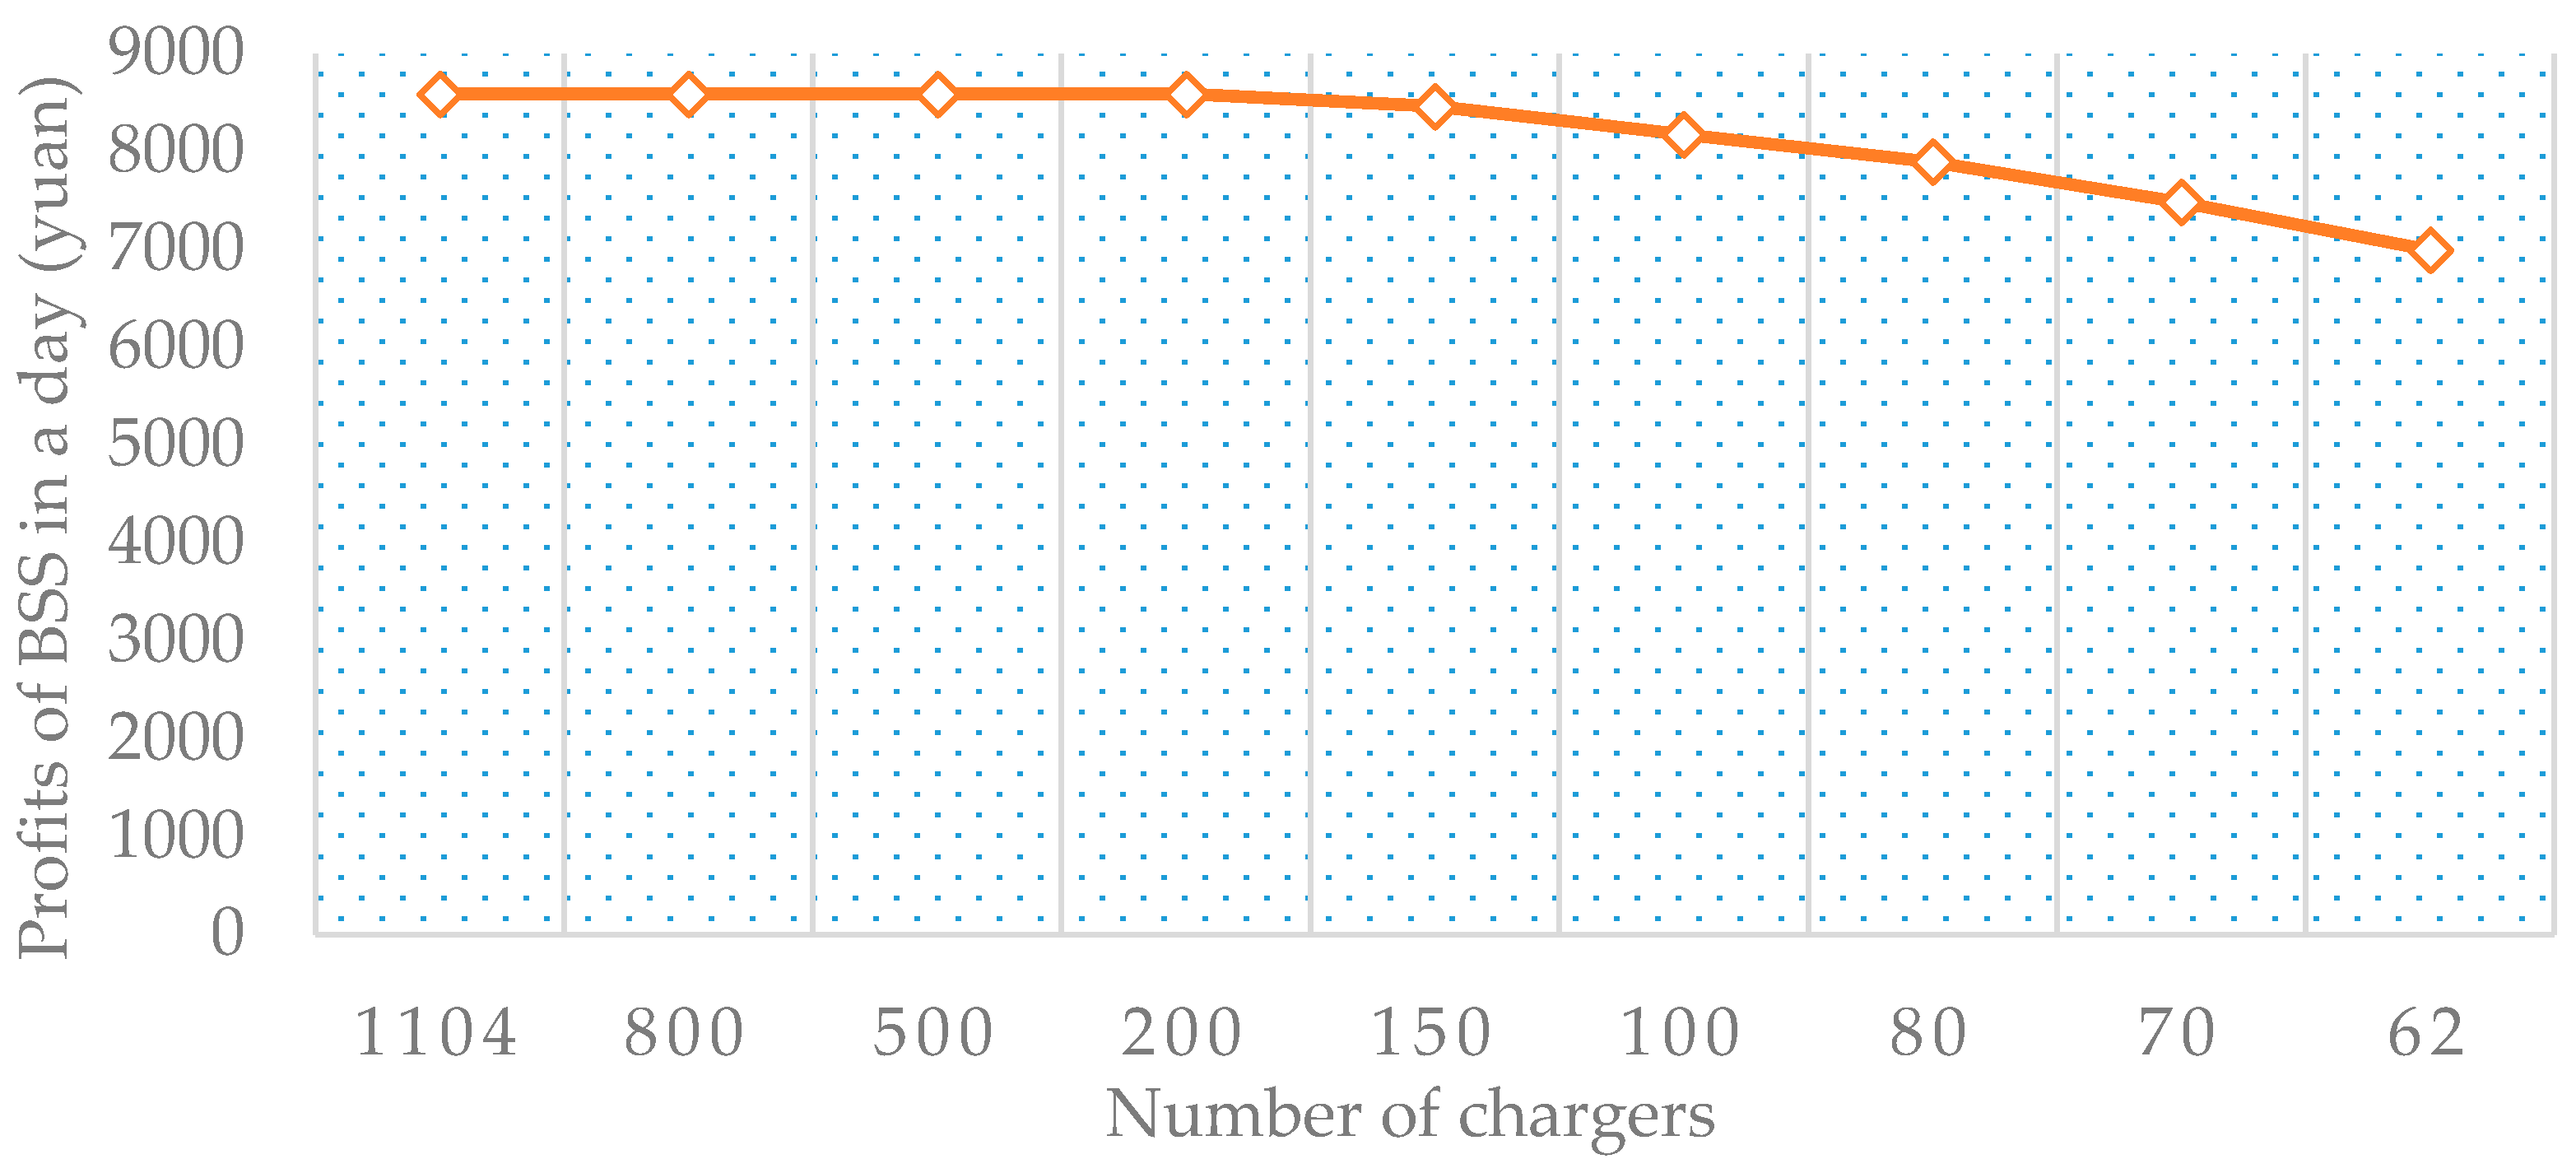
Figure 4.
Definition of battery swapping price for the BSS.

Figure 5.
BSS’ load distribution of different scenarios under C1.

Figure 6.
BSS’s load distribution of different scenarios under C2.

Table 1.
Operation parameters of the BSS.
| Index | Parameter | Unit |
|---|---|---|
| Number of batteries | 1104 | unit |
| Number of chargers | 1044 | unit |
| Charge power of chargers | 15 | kW |
| Charging efficiency of batteries | 95 | % |
| Total investment of BSS | 2100 | Ten thousand yuan |
| Equipment maintenance rate | 5 | % |
| Operation time of equipment | 365 | day |
Table 2.
Technical parameters of BAIC Motor EV200.
| Index | Parameter | Unit |
|---|---|---|
| Battery lifetime (charging cycle frequency) | ≥2000 | / |
| Electric quantity of batteries | 30.4 | kWh |
| Number of batteries in an EV200 | 4 | / |
| Mileage | 200 | km |
Table 3.
Industrial peak-valley time-of-use tariff of Beijing.
| Time | Price (Yuan/kWh) | |
|---|---|---|
| Valley hours | 00:00–08:00 | 0.365 |
| Peak hours | 08:00–12:00 | 0.869 |
| 17:00–21:00 | ||
| Average hours | 12:00–17:00 | 0.687 |
| 21:00–24:00 | ||
Table 4.
Battery swapping demand and average driving mileage.
| T | N(t) | T | N(t) | ||
|---|---|---|---|---|---|
| 1 | 26 | 100 | 13 | 28 | 109 |
| 2 | 16 | 110 | 14 | 16 | 110 |
| 3 | 8 | 120 | 15 | 18 | 111 |
| 4 | 4 | 112 | 16 | 36 | 103 |
| 5 | 4 | 107 | 17 | 32 | 108 |
| 6 | 5 | 108 | 18 | 28 | 109 |
| 7 | 4 | 106 | 19 | 14 | 113 |
| 8 | 6 | 113 | 20 | 18 | 115 |
| 9 | 16 | 115 | 21 | 20 | 105 |
| 10 | 24 | 120 | 22 | 22 | 102 |
| 11 | 20 | 106 | 23 | 24 | 112 |
| 12 | 20 | 117 | 24 | 12 | 114 |
Table 5.
Device configuration, investment scheme and operation mode of the BSS.
| S | Number of Chargers | Number of Batteries | Device Investment (Ten Thousand Yuan) | Daily Maintenance Fee (Yuan) | Optimization | Discharge |
|---|---|---|---|---|---|---|
| S1 | 1044 | 1104 | 2100 | 2487 | No | No |
| S2 | 1044 | 1104 | 2100 | 2487 | Yes | No |
| S3 | 200 | 1104 | 1383 | 1894 | Yes | No |
| S4 | 200 | 800 | 1079 | 1478 | Yes | No |
| S5 | 1044 | 800 | 1796 | 2460 | Yes | No |
| S6 | 1044 | 1104 | 2100 | 2487 | Yes | Yes |
| S7 | 200 | 1104 | 1383 | 1894 | Yes | Yes |
| S8 | 200 | 800 | 1079 | 1478 | Yes | Yes |
| S9 | 1044 | 800 | 1796 | 2460 | Yes | Yes |
Table 6.
Incomes and costs analysis of the BSS (yuan).
| S | Charging Costs | Depreciation Costs | Operation and Maintenance Costs | Battery Swapping Service Incomes | Discharging Incomes | Profits |
|---|---|---|---|---|---|---|
| S1 | 36,821.4 | 15,156 | 2487 | 27,657.6 | 0 | −26,806.8 |
| S2 | 10,686.5 | 5508 | 2487 | 27,657.6 | 0 | 8976.1 |
| S3 | 10,686.5 | 5508 | 1894 | 27,657.6 | 0 | 9569.1 |
| S4 | 17,999.2 | 8244 | 1478 | 27,657.6 | 0 | −63.6 |
| S5 | 17,447.1 | 8244 | 2460 | 27,657.6 | 0 | −493.5 |
| S6 | 10,686.5 | 5796 | 2487 | 27,657.6 | 626.5 | 9314.7 |
| S7 | 10,686.5 | 5796 | 1894 | 27,657.6 | 626.5 | 9907.7 |
| S8 | 17,999.2 | 8532 | 1478 | 27,657.6 | 626.5 | 274.9 |
| S9 | 17,447.1 | 8532 | 2460 | 27,657.6 | 626.5 | −155 |
Table 7.
Comparison of the number of charging batteries in S1 and S2 under C1.
| S | S1 | S2 | ||||||
|---|---|---|---|---|---|---|---|---|
| T | F1(t) | F1(1)(t) | F1(2)(t) | E1(t) | F2(t) | F2(1)(t) | F2(2)(t) | E2(t) |
| 1 | 104 | 104 | 0 | 0 | 0 | 0 | 0 | 0 |
| 2 | 168 | 64 | 104 | 0 | 104 | 104 | 0 | 0 |
| 3 | 96 | 32 | 64 | 0 | 168 | 64 | 104 | 0 |
| 4 | 48 | 16 | 32 | 0 | 96 | 32 | 64 | 0 |
| 5 | 32 | 16 | 16 | 0 | 32 | 0 | 32 | 16 |
| 6 | 36 | 20 | 16 | 0 | 32 | 32 | 0 | 0 |
| 7 | 36 | 16 | 20 | 0 | 52 | 20 | 32 | 0 |
| 8 | 40 | 24 | 16 | 0 | 36 | 16 | 20 | 0 |
| 9 | 88 | 64 | 24 | 0 | 16 | 0 | 16 | 24 |
| 10 | 160 | 96 | 64 | 0 | 0 | 0 | 0 | 88 |
| 11 | 176 | 80 | 96 | 0 | 0 | 0 | 0 | 184 |
| 12 | 160 | 80 | 80 | 0 | 0 | 0 | 0 | 264 |
| 13 | 192 | 112 | 80 | 0 | 344 | 344 | 0 | 0 |
| 14 | 176 | 64 | 112 | 0 | 344 | 0 | 344 | 112 |
| 15 | 136 | 72 | 64 | 0 | 0 | 0 | 0 | 176 |
| 16 | 216 | 144 | 72 | 0 | 0 | 0 | 0 | 248 |
| 17 | 272 | 128 | 144 | 0 | 0 | 0 | 0 | 392 |
| 18 | 240 | 112 | 128 | 0 | 0 | 0 | 0 | 520 |
| 19 | 168 | 56 | 112 | 0 | 0 | 0 | 0 | 632 |
| 20 | 128 | 72 | 56 | 0 | 0 | 0 | 0 | 688 |
| 21 | 152 | 80 | 72 | 0 | 0 | 0 | 0 | 760 |
| 22 | 168 | 88 | 80 | 0 | 0 | 0 | 0 | 840 |
| 23 | 184 | 96 | 88 | 0 | 0 | 0 | 0 | 928 |
| 24 | 144 | 48 | 96 | 0 | 0 | 0 | 0 | 1024 |
Table 8.
Tiered battery swapping price.
| Time | Battery Swapping Price (Yuan/kWh) |
|---|---|
| 00:00–08:00 | 0.54 |
| 08:00–17:00 | 0.66 |
| 17:00–00:00 | 0.60 |
Table 9.
Battery swapping demand and average driving mileage of EVs under C2.
| T | N(t) | T | N(t) | ||
|---|---|---|---|---|---|
| 1 | 26 | 100 | 13 | 10 | 109 |
| 2 | 20 | 110 | 14 | 12 | 110 |
| 3 | 24 | 120 | 15 | 14 | 111 |
| 4 | 24 | 112 | 16 | 16 | 103 |
| 5 | 22 | 107 | 17 | 10 | 108 |
| 6 | 20 | 108 | 18 | 12 | 109 |
| 7 | 23 | 106 | 19 | 14 | 113 |
| 8 | 18 | 113 | 20 | 18 | 115 |
| 9 | 10 | 115 | 21 | 23 | 105 |
| 10 | 8 | 120 | 22 | 25 | 102 |
| 11 | 12 | 106 | 23 | 24 | 112 |
| 12 | 15 | 117 | 24 | 22 | 114 |
Table 10.
Battery charging and discharging arrangement over 24 h in the BSS.
| T | S1 | S2 | S3 | S4 | S5 | S6 | S7 | S8 | S9 |
|---|---|---|---|---|---|---|---|---|---|
| 1 | 104 | 0 | 0 | 0 | 0 | 0 | 0 | 0 | 0 |
| 2 | 80 | 104 | 104 | 104 | 104 | 0 | 104 | 104 | 104 |
| 3 | 96 | 184 | 184 | 184 | 184 | 0 | 168 | 168 | 168 |
| 4 | 96 | 176 | 176 | 176 | 176 | 0 | 96 | 96 | 96 |
| 5 | 88 | 192 | 192 | 192 | 192 | 216 | 48 | 48 | 48 |
| 6 | 80 | 184 | 184 | 184 | 184 | 232 | 32 | 32 | 32 |
| 7 | 92 | 168 | 168 | 168 | 168 | 36 | 36 | 36 | 36 |
| 8 | 72 | 172 | 172 | 172 | 172 | 36 | 36 | 36 | 36 |
| 9 | 40 | 92 | 92 | 92 | 92 | 16 | 16 | 16 | 16 |
| 10 | 32 | 0 | 0 | 0 | 0 | 0 | 0 | 0 | 0 |
| 11 | 48 | 0 | 0 | 0 | 0 | 0 | 0 | 0 | 0 |
| 12 | 60 | 0 | 0 | 0 | 0 | 0 | 0 | 192 | 0 |
| 13 | 40 | 4 | 4 | 200 | 252 | 344 | 200 | 200 | 344 |
| 14 | 48 | 4 | 4 | 200 | 292 | 344 | 200 | 200 | 456 |
| 15 | 56 | 0 | 0 | 108 | 56 | 0 | 144 | 200 | 176 |
| 16 | 64 | 0 | 0 | 108 | 16 | 0 | 144 | 200 | 136 |
| 17 | 40 | 0 | 0 | 0 | 0 | 0 | 0 | 200 | 128 |
| 18 | 48 | 0 | 0 | 0 | 0 | 0 | 0 | 8 | 56 |
| 19 | 56 | 0 | 0 | 0 | 0 | 0 | 0 | 0 | 0 |
| 20 | 72 | 0 | 0 | 0 | 0 | 0 | 0 | 0 | 0 |
| 21 | 92 | 0 | 0 | 0 | 0 | 0 | 0 | 48 | 0 |
| 22 | 100 | 0 | 0 | 0 | 0 | 0 | 0 | 48 | 0 |
| 23 | 96 | 0 | 0 | 0 | 0 | −32 | −32 | −32 | −32 |
| 24 | 88 | 0 | 0 | 0 | 0 | −32 | −32 | −32 | −32 |
© 2017 by the authors. Licensee MDPI, Basel, Switzerland. This article is an open access article distributed under the terms and conditions of the Creative Commons Attribution (CC BY) license (http://creativecommons.org/licenses/by/4.0/).
Share and Cite
MDPI and ACS Style
Liang, Y.; Zhang, X.; Xie, J.; Liu, W. An Optimal Operation Model and Ordered Charging/Discharging Strategy for Battery Swapping Stations. Sustainability 2017, 9, 700. https://doi.org/10.3390/su9050700
AMA Style
Liang Y, Zhang X, Xie J, Liu W. An Optimal Operation Model and Ordered Charging/Discharging Strategy for Battery Swapping Stations. Sustainability. 2017; 9(5):700. https://doi.org/10.3390/su9050700
Chicago/Turabian StyleLiang, Yanni, Xingping Zhang, Jian Xie, and Wenfeng Liu. 2017. "An Optimal Operation Model and Ordered Charging/Discharging Strategy for Battery Swapping Stations" Sustainability 9, no. 5: 700. https://doi.org/10.3390/su9050700
Note that from the first issue of 2016, this journal uses article numbers instead of page numbers. See further details here.